


Abstract
Biotope mapping provides an essential spatial framework for biodiversity conservation, ecosystem management, and sustainable landscape planning. However, a standardized and transferable GIS-based methodological framework for biotope identification and mapping is still lacking in Türkiye, limiting the systematic integration of biodiversity considerations into spatial planning processes. This study develops an integrated GIS-based biotope mapping framework for Çınarcık District, Yalova Province, Türkiye, integrating Digital Elevation Model (DEM), CORINE Land Cover 2018, Forest Management Plans, stand characteristics, vegetation, floristic, and hydrological data through spatial analyses. Additionally, 30 national and 15 international studies were systematically reviewed to identify the common indicators, data sources, and methodological components used in biotope mapping and to establish the proposed GIS-based framework. The proposed approach identified four main biotope groups (forest, aquatic, agricultural, and urban). Based on ecological similarity and growing environment characteristics, 12 sub-biotope types were identified within the forest biotopes. Forest biotopes were the dominant ecological units, mainly characterized by broadleaved communities dominated by Fagus orientalis, Castanea sativa, Tilia tomentosa, and Quercus petraea. A total of 72 forest stand types were identified, with Fagus orientalis-dominated forests in plateau environments representing the largest sub-biotope type (36.40%). The proposed framework provides a repeatable and transferable, inventory-based methodology that can serve as a preliminary decision-support tool for biodiversity assessment, conservation planning, and sustainable landscape management in forested landscapes with similar ecological characteristics, pending future field-based validation.
1. Introduction
Biotopes are homogeneous habitats characterized by specific environmental conditions where plant and animal communities coexist [1]. The identification and mapping of biotopes represent an important planning tool for maintaining ecological processes, conserving biodiversity, and ensuring the effective management of natural resources. Biotope maps provide a scientific basis for determining conservation priorities, guiding land-use decisions, and planning ecological networks by revealing the spatial distribution of habitats [2].
The biotope mapping approach was initially developed and applied in natural areas and urban ecosystems, particularly in Germany, and has subsequently become an important method in landscape planning, nature conservation, and biodiversity monitoring [3,4]. While early studies primarily relied on field observations, habitat characteristics, and vegetation surveys, contemporary biotope mapping approaches increasingly integrate Geographic Information Systems (GIS), remote sensing, Digital Elevation Models (DEMs), land-cover datasets, forest management plans, flora and vegetation analyses, and spatial evaluation techniques for the identification and classification of biotopes.
Despite these methodological developments, biotope mapping approaches differ considerably among regions due to variations in ecological characteristics, data availability, and classification criteria. In Türkiye, although several biotope identification and mapping studies have been conducted in different ecological regions, these studies generally focus on specific case areas and use different indicators, datasets, and classification schemes. Consequently, a common methodological framework that integrates the frequently used indicators and data sources for biotope mapping in Türkiye has not yet been established.
To address this research gap, this study reviewed comprehensive national biotope identification and mapping studies conducted in Türkiye, together with selected international studies representing the methodological development of biotope mapping approaches. The common indicators and methodological components identified through this comparative evaluation were synthesized and used to develop a GIS-based integrated biotope mapping framework.
The Çınarcık district, selected as the study area, represents one of the important biodiversity areas of the Marmara Region and exhibits a heterogeneous landscape structure composed of forest, coastal, aquatic, agricultural, and urban ecosystems. Approximately 60% of the district area consists of forest and agricultural lands, and its location within the transition zone between the Mediterranean and Euro-Siberian phytogeographical regions contributes to its high floristic diversity. The study area’s high habitat heterogeneity, comprising forest, coastal, agricultural, and aquatic ecosystems within a relatively small administrative unit, makes it a representative model for biodiversity-rich coastal-forest landscapes in Türkiye that are increasingly exposed to settlement and tourism-driven land-use pressure.
This study is based on the hypothesis that biotopes can be identified in a more detailed and ecologically meaningful manner by integrating land-cover characteristics with physiographic conditions, forest stand structure, vegetation composition, floristic properties, and hydrological components. Accordingly, the aim of this study is to develop and apply a GIS-based integrated biotope mapping approach for Çınarcık District by combining natural and anthropogenic environmental components, identifying main and sub-biotope types, and producing a spatial biotope inventory.
Building on this approach, two interrelated objectives are pursued: (i) at the theoretical level, to develop a systematic, transferable methodological framework for biotope identification by synthesizing indicators commonly used in national and international literature; and (ii) at the applied level, to identify and map the main and sub-biotope types of Çınarcık District, thereby producing a spatial biotope inventory that can support local conservation priorities and sustainable land-use decision-making. Accordingly, this study addresses the following research question: how can commonly used biotope indicators identified from national and international literature be integrated into a transferable, GIS-based framework for biotope identification in ecologically heterogeneous, Mediterranean-transition landscapes?
2. Materials and Methods
2.1. Study Area
The study area is located within the administrative boundaries of Çınarcık district of Yalova Province, Türkiye, and was evaluated ecologically within the boundaries of the Çınarcık Forest Management Chief Directorate. The area is situated on the Armutlu Peninsula in the southeastern part of the Marmara Region and represents a suitable case study area for biotope mapping due to its high floristic diversity, heterogeneous topographic structure, and the coexistence of forest, coastal, agricultural, aquatic, and settlement ecosystems.
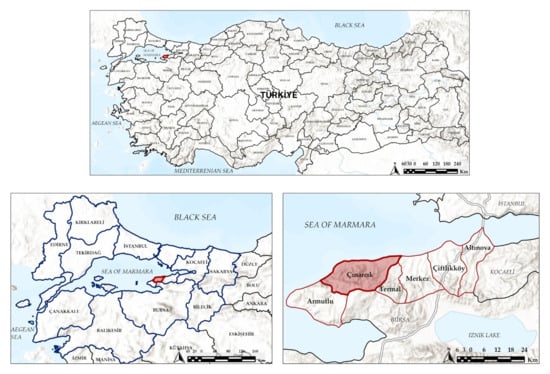
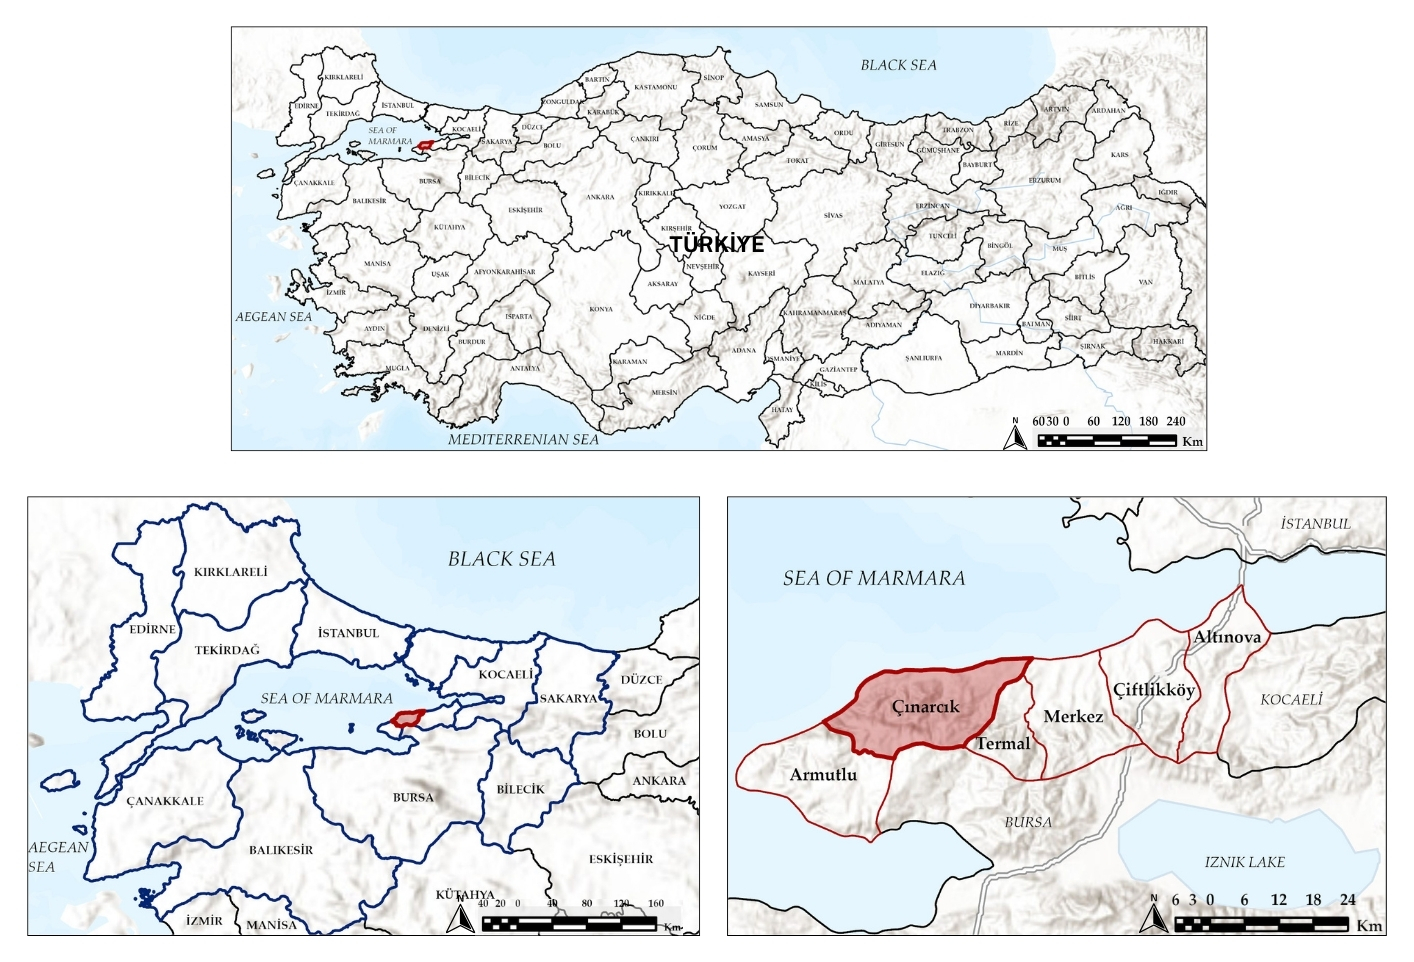
The study area extends between 29°12′40″–29°18′50″ E and 40°37′13″–40°39′55″ N and covers Çınarcık district of Yalova Province, Türkiye. The district is located on the Armutlu Peninsula, which represents the western extension of the North Anatolian Mountains. The area is bordered by the Marmara Sea to the north and has elevations ranging from approximately 30 m near the coastal zone to higher mountainous areas inland [5]. The district covers an area of approximately 174 km2 and has a population of 38,600 [6]. The geographical location of the study area is presented in Figure 1.
Figure 1.
Location of the study area.
The climate of the study area represents a transition between Mediterranean and Black Sea climatic characteristics, with warm and relatively dry summers and long, cool winters. Annual temperatures generally range between 3 °C and 30 °C, with August being the warmest month (mean maximum: 29 °C; mean minimum: 20 °C) and January the coldest month (mean maximum: 9 °C; mean minimum: 4 °C). Annual precipitation reaches its highest level in December (72 mm) and its lowest level in July (15 mm) [7]. These climatic conditions, together with the heterogeneous topography of the region, contribute to the formation of diverse ecological conditions and habitat types.
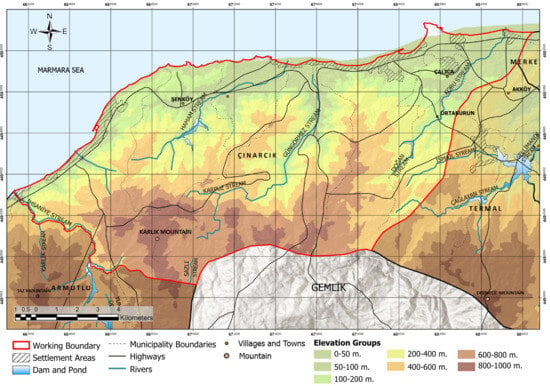
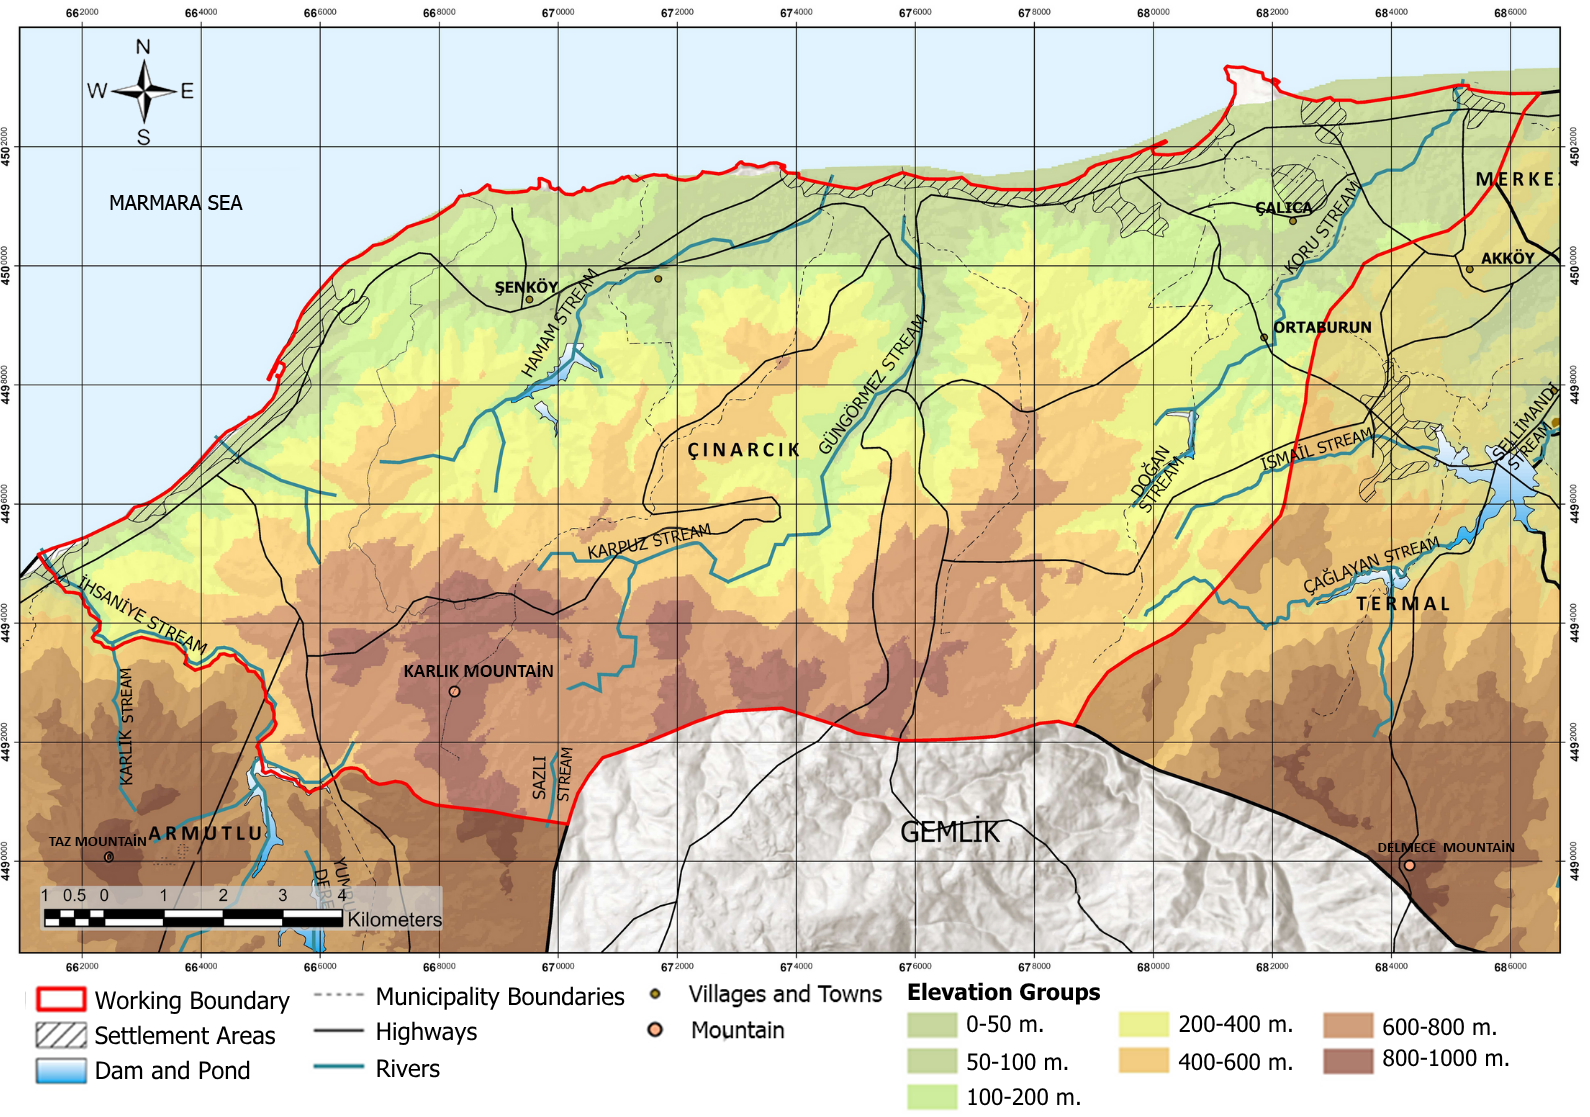
The topography of the district is characterized by a mountainous structure associated with the Armutlu Peninsula. Approximately 70% of the area consists of mountainous terrain, while coastal plains, valleys, and low-elevation areas between 0 and 100 m occupy approximately 58% of the district landscape [8]. The coexistence of different elevation zones, slope conditions, and landforms provides environmental gradients that influence vegetation structure, habitat distribution, and biotope diversity (Figure 2).
Figure 2.
Physiography of Çınarcık District (WGS 1984 UTM Zone 35N).
Çınarcık District was selected as the study area due to its heterogeneous landscape structure encompassing forest, coastal, agricultural, and settlement areas, its location within a floristically rich transitional phytogeographical zone, and the absence of prior systematic biotope mapping studies in the district. The forest inventory data used in this study were derived from 561 sampling plots systematically distributed across a regular 300 × 300 m grid covering the entire forested area of the planning unit, ensuring spatially representative coverage of the district’s forest ecosystems.
2.2. Data Sources
Multiple spatial datasets related to land cover, topography, hydrology, forest structure, flora, vegetation, and settlement areas were used for the identification and spatial mapping of biotopes. These datasets were selected to enable an integrated assessment of the physical environmental characteristics, habitat structure, vegetation composition, and anthropogenic influences defining the study area. The data sources, dataset characteristics, and their specific roles in the biotope identification process are summarized in Table 1. All spatial datasets were accessed between January and October 2025, with the exception of the Forest Management Plan (2017) and the historical floristic survey (1994), which represent the most recent officially available sources for these respective data types.
Table 1.
Data sources used in the study and their roles in biotope identification and mapping.
The integration of these complementary datasets enabled the simultaneous evaluation of land cover, physiographic conditions, floristic and vegetation characteristics, forest stand structure, hydrological conditions, and habitat attributes, thereby providing the spatial foundation for the subsequent biotope classification and mapping procedures.
The datasets employed in this study originate from official governmental and institutional sources, including CORINE Land Cover (Copernicus Land Monitoring Service), the General Directorate of Forestry (Forest Management Plan), the General Directorate of Mapping, and the Turkish Plants Data Service (TÜBİVES). These sources are systematically produced, regularly updated, and subject to institutional quality control procedures, and they are widely employed in peer-reviewed biotope and habitat mapping research, as confirmed by their frequent use across the majority of the 30 national and 15 international studies reviewed in this paper (Table 2 and Table 3). This widespread adoption in the scientific literature supports the scientific validity, reliability, and applicability of the data sources used in the present study.
2.3. Establishment of the GIS Database
All spatial datasets used in the study were integrated within a Geographic Information System (GIS) environment to construct a multi-layered database for biotope identification and mapping analyses. Data layers obtained from various institutions and sources were first harmonized in terms of their coordinate reference systems. All spatial data were projected into the WGS 1984 UTM Zone 35N coordinate system and standardized at a 1:25,000 scale to match the analysis resolution of the study area.
Within the GIS database, layers were created for land cover, topography, geology, hydrology, forest stand structure, flora, settlement areas, and agricultural land uses. The vector and raster datasets were processed using ArcGIS Pro 3.2.2 software (Esri Inc., Redlands, CA, USA), where data cleaning, digitization, reclassification, buffer analysis, and overlay analysis procedures were conducted.
Following the spatial harmonization of the data layers, an integrated GIS database comprising both natural and anthropogenic components for biotope analysis was established. This database provided the spatial foundation for all subsequent biotope identification, classification, and mapping procedures.
2.4. Establishment of the Biotope Mapping Framework
The theoretical development and methodological components of the biotope mapping approach were initially evaluated based on the international literature. The review of international studies indicates that the concept of biotope, particularly in Central European countries, emerged as a tool for nature conservation, landscape ecology, and urban ecological planning. In early biotope mapping studies, field observations, habitat types, and vegetation characteristics were used as the primary determinants; whereas in later periods, Geographic Information Systems (GIS), land cover data, remote sensing, digital elevation models, and spatial analysis techniques were integrated into these approaches [3,4].
Current international approaches emphasize that biotopes should not be defined solely based on biological components, but through the integrated assessment of various environmental variables, including land cover, land use, topographic characteristics, hydrological structure, habitat continuity, and spatial relationships. Ecosystem and habitat mapping approaches developed in Europe demonstrate the combined use of CORINE land cover data, EUNIS habitat classification, and GIS-based spatial analyses [15]. Similarly, recent studies indicate that remote sensing, multi-source spatial datasets, and integrated analytical approaches are increasingly applied in biotope/habitat mapping studies [16]. To reveal how the main methodological components identified in the international literature are applied under different geographical conditions, selected biotope/habitat mapping studies were comparatively evaluated (Table 2).
Table 2.
Comparison of representative international biotope and habitat mapping studies based on the data sources and methodological components used.
Table 3.
Comparison of indicators, data sources, and methods used in 30 biotope mapping studies in Türkiye.
The methodological framework was developed by synthesizing key indicators from 15 international studies and evaluating 30 national biotope mapping studies across diverse ecological regions of Türkiye (Table 3). Selected studies fulfilled the following criteria: (i) conducted within Türkiye; (ii) included biotope, habitat, or ecological unit mapping; (iii) clearly defined data sources and analytical methods; and (iv) employed GIS, remote sensing, or field-based spatial assessment techniques.
The evaluation of Table 3 revealed that although the methods used in biotope mapping studies in Türkiye vary depending on the characteristics of the study areas, certain key data sources and indicators are commonly employed. In particular, vegetation, flora, land cover, Geographic Information Systems (GIS), topographic analyses, hydrological data, and forest management plans were identified as the most frequently used components for biotope identification.
In forest ecosystems, stand types, dominant woody species, and site characteristics are considered important indicators for defining biotopes, whereas in urban and rural studies, land-use patterns, land cover, hydrological structures, and landscape components are more prominent. In addition, physiographic variables such as elevation, slope, aspect, geology, and soil characteristics are widely used to explain the spatial distribution and ecological characteristics of biotopes.
A comparison of studies conducted in Türkiye with the international literature indicates that vegetation, land cover, topographic characteristics, hydrological features, and GIS-based spatial analyses constitute the core components of biotope mapping in both approaches (Table 2 and Table 3). This similarity demonstrates that the methodological framework adopted in this study is consistent with both national and international biotope mapping approaches.
A substantial proportion of the reviewed studies applied GIS-based spatial analyses for biotope mapping, integrating remote sensing data, digital elevation models, and existing planning datasets. In contrast, advanced analytical techniques such as LiDAR, network sensors, K-function analysis, and similar approaches were used only in a limited number of studies. This finding indicates that biotope mapping studies in Türkiye are predominantly based on the integration of conventional ecological inventory approaches with GIS-based spatial analyses.
Based on the comprehensive review of 15 international and 30 national studies, the methodological framework adopted in this study was developed by integrating the most frequently used indicators identified in the literature with the spatial datasets available for the study area. Consequently, the proposed GIS-based biotope mapping framework is not limited to the Çınarcık District but represents a systematic and transferable approach that can be adapted to different ecological regions with similar environmental characteristics (Table 4).
Table 4.
Frequency of indicators used in biotope mapping studies in Türkiye (n = 30) and their application in this study.
The frequency analysis presented in Table 4 was used to identify the most commonly applied indicators in the literature and those compatible with the data structure of this study. Accordingly, vegetation (V), Geographic Information Systems (GIS), forest data (F), hydrology (H), elevation (E), land cover (LC), Forest Management Plan data (FP), CORINE land cover database, and Digital Elevation Model (DEM) were selected as the primary indicators for biotope identification. These indicators were integrated within a GIS environment to establish a biotope mapping framework incorporating land cover and land-use patterns, physiographic characteristics, hydrological structure, flora and vegetation composition, stand types, dominant woody species, and habitat characteristics.
Based on the literature review and comparative evaluation, the methodological approach adopted in this study is not limited to the case study area but is based on the synthesis of key indicators commonly used in national and international biotope mapping approaches. This approach provides a systematic and transferable framework that can be adapted to different ecological regions with similar environmental characteristics.
2.5. Spatial Analyses
All spatial analyses for biotope identification and mapping were performed in the ArcGIS Pro 3.2.2 environment using a GIS-based multi-layered analytical framework.
Initial spatial delineation of main land-cover classes (forest, agricultural, aquatic, and settlement areas) was established using the CORINE Land Cover (2018) database. To determine the physical site conditions, an elevation map was generated from the Digital Elevation Model (DEM). From this raster layer, key physiographic units—including plains, coastal plains, river valleys, plateaus, and mountainous areas—were classified based on elevation ranges. This physiographic taxonomy served as a critical baseline for characterizing the topographic growing environment of the primary biotope types.
For forest ecosystem mapping, the Çınarcık Forest Management Plan (2017) served as the primary field-based ecological dataset [11]. This database is derived from a systematic forest inventory conducted by the General Directorate of Forestry, utilizing 561 sampling plots established at regular 300 × 300 m grid intervals [11]. Stand characteristics, dominant tree species, stand structures (pure vs. mixed), forest functions, degraded forest zones, and site conditions extracted from these plot measurements were processed in the GIS environment to define and map distinct forest biotopes.
To supplement the forest inventory and refine sub-biotope classifications, floristic data were integrated from the Turkish Plants Data Service (TÜBİVES) and the historical flora study of the Armutlu Peninsula by İnan [13,14]. The latter study recorded 69 herbaceous plant taxa using the Braun-Blanquet method across sampling plots measuring 400 m2 for woody layers and 100 m2 for herbaceous layers [14]. Spatial and habitat attributes from these floristic records were updated to reflect current taxonomic classifications, compiled into a unified database, and evaluated to assess species diversity, endemic taxa, and local habitat affinities.
Finally, geological, hydrological, and built-environment layers were synthesized with the land-cover and forest datasets. Spatial relationships and ecological interactions between natural and anthropogenic components were analyzed using Overlay Analysis, Buffering, Reclassification, and Spatial Analyst tools in ArcGIS Pro.
The outputs generated from each thematic layer were subsequently integrated through overlay operations, allowing the simultaneous evaluation of physiographic conditions, vegetation characteristics, forest stand attributes, hydrological features, and land-use patterns during the biotope delineation process.
No additional field-based vegetation survey was carried out during the present study. Instead, forest inventory data, floristic databases, and officially published spatial datasets were integrated within the GIS environment to identify and classify biotopes.
Classification Rules and Overlay Sequence
To improve methodological transparency, the general sequence and logic of the overlay-based classification process are summarized below.
Main biotope boundaries (forest, agricultural, aquatic, and urban) were first delineated using the relevant land-cover classes of the CORINE Land Cover (2018) dataset as the base layer. Within the resulting forest extent, Forest Management Plan (FMP) stand and compartment data were overlaid to refine forest boundaries and to determine sub-biotope types, based on the dominant woody species and stand composition recorded for each compartment: stands with a single recorded dominant species were classified accordingly (e.g., “Fagus orientalis Forest”), while stands with two co-dominant species were classified as mixed sub-biotopes (e.g., “Fagus orientalis–Castanea sativa Forest”). For aquatic, agricultural, and urban biotopes, sub-classification was based directly on the relevant attributes of the source datasets (hydrological network type, agricultural land-use category, and settlement/green-space type, respectively), rather than a multi-criteria overlay, given the absence of species-level field data for these biotope types (see Section 2.6).
All resulting layers were processed in ArcGIS Pro 3.2.2 using standard reclassification, buffering, and overlay analysis operations, consistent with the general GIS workflow described in Section 2.3. The resulting polygons were subjected to topological controls to verify spatial integrity, as described in Section 2.7. No formal minimum mapping unit (MMU) threshold or automated conflict-resolution rule between overlapping layers was applied; boundary refinements were performed manually within the GIS environment based on the finer-resolution FMP compartment data in forest areas.
2.6. Biotope Classification
Within the scope of this study, biotopes were classified into four main biotope groups, namely forest, aquatic, agricultural, and urban biotopes, based on land cover, land use characteristics, and ecological structure.
In this study, the term “biotope” is used in the broader landscape-ecological sense established in the European biotope mapping tradition [3,4,15], in which land cover, physiographic structure, and vegetation/stand composition serve as spatial surrogates for habitat units rather than requiring exhaustive faunal inventories for every biotope type. This approach is consistent with the majority of the national and international studies reviewed in this paper (Table 2 and Table 3), where vegetation, land cover, and physiographic indicators—rather than direct faunal survey data—constitute the primary basis for biotope delineation. Direct floristic evidence was available for forest biotopes through the integration of Forest Management Plan inventory data and historical flora records; however, for aquatic, agricultural, and urban biotopes, boundaries were delineated primarily on the basis of land cover, hydrological structure, and land-use patterns rather than species-level floristic or faunal inventories, as such data were not available within the scope of this study. This distinction should be considered when interpreting the biological specificity of the different biotope types identified.
The identification of the main biotope groups was based on the integrated assessment of land cover, stand structure, flora composition, vegetation characteristics, hydrological structure, and growing environment conditions. Each main biotope was further divided into sub-biotope types according to ecological similarities by considering dominant plant species, woody species composition, habitat characteristics, stand types, and land use properties.
For forest biotopes, stand types, dominant woody species, and vegetation structure were used as primary classification criteria; for aquatic biotopes, hydrological characteristics and water-related habitats were considered; for agricultural biotopes, land use patterns and agricultural production systems were evaluated; and for urban biotopes, settlement patterns and urban green spaces were used as classification criteria.
The resulting hierarchical classification enabled the representation of habitat heterogeneity at both the main biotope and sub-biotope levels while maintaining consistency with the ecological indicators identified from the literature review.
2.7. Generation of the Biotope Map
The biotope map was generated by integrating the GIS database, spatial analyses, and biotope classification criteria established in the previous stages. Data layers related to land cover, topography, hydrology, geology, flora, vegetation, stand structure, and land use were evaluated together within the GIS environment to determine biotope boundaries.
Initially, the main biotope boundaries representing forest, agricultural, aquatic, and urban areas were delineated using CORINE Land Cover data. Subsequently, forest biotopes were divided into sub-biotope types based on stand types, dominant woody species, forest functions, and vegetation characteristics derived from the Forest Management Plan data. Similarly, sub-classifications of aquatic, agricultural, and urban biotopes were defined by considering hydrological characteristics, coastal areas, agricultural land-use patterns, and settlement structures.
All biotope boundaries were processed within the GIS environment, and biotope polygons were generated through overlay analysis, reclassification, buffer analysis, and spatial query operations. The resulting polygons were subjected to topological controls, their spatial integrity was verified, and the area and proportional distribution of each biotope type were calculated.
The completed biotope map constitutes the final spatial product of the proposed GIS-based biotope mapping framework and provides the basis for all subsequent ecological evaluations presented in the Section 3.
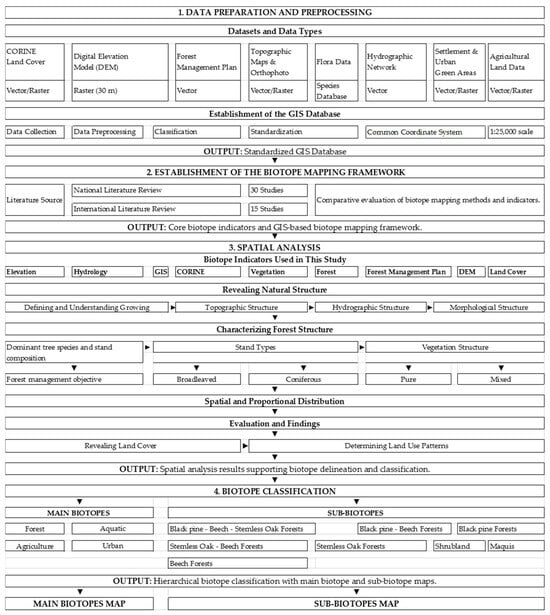
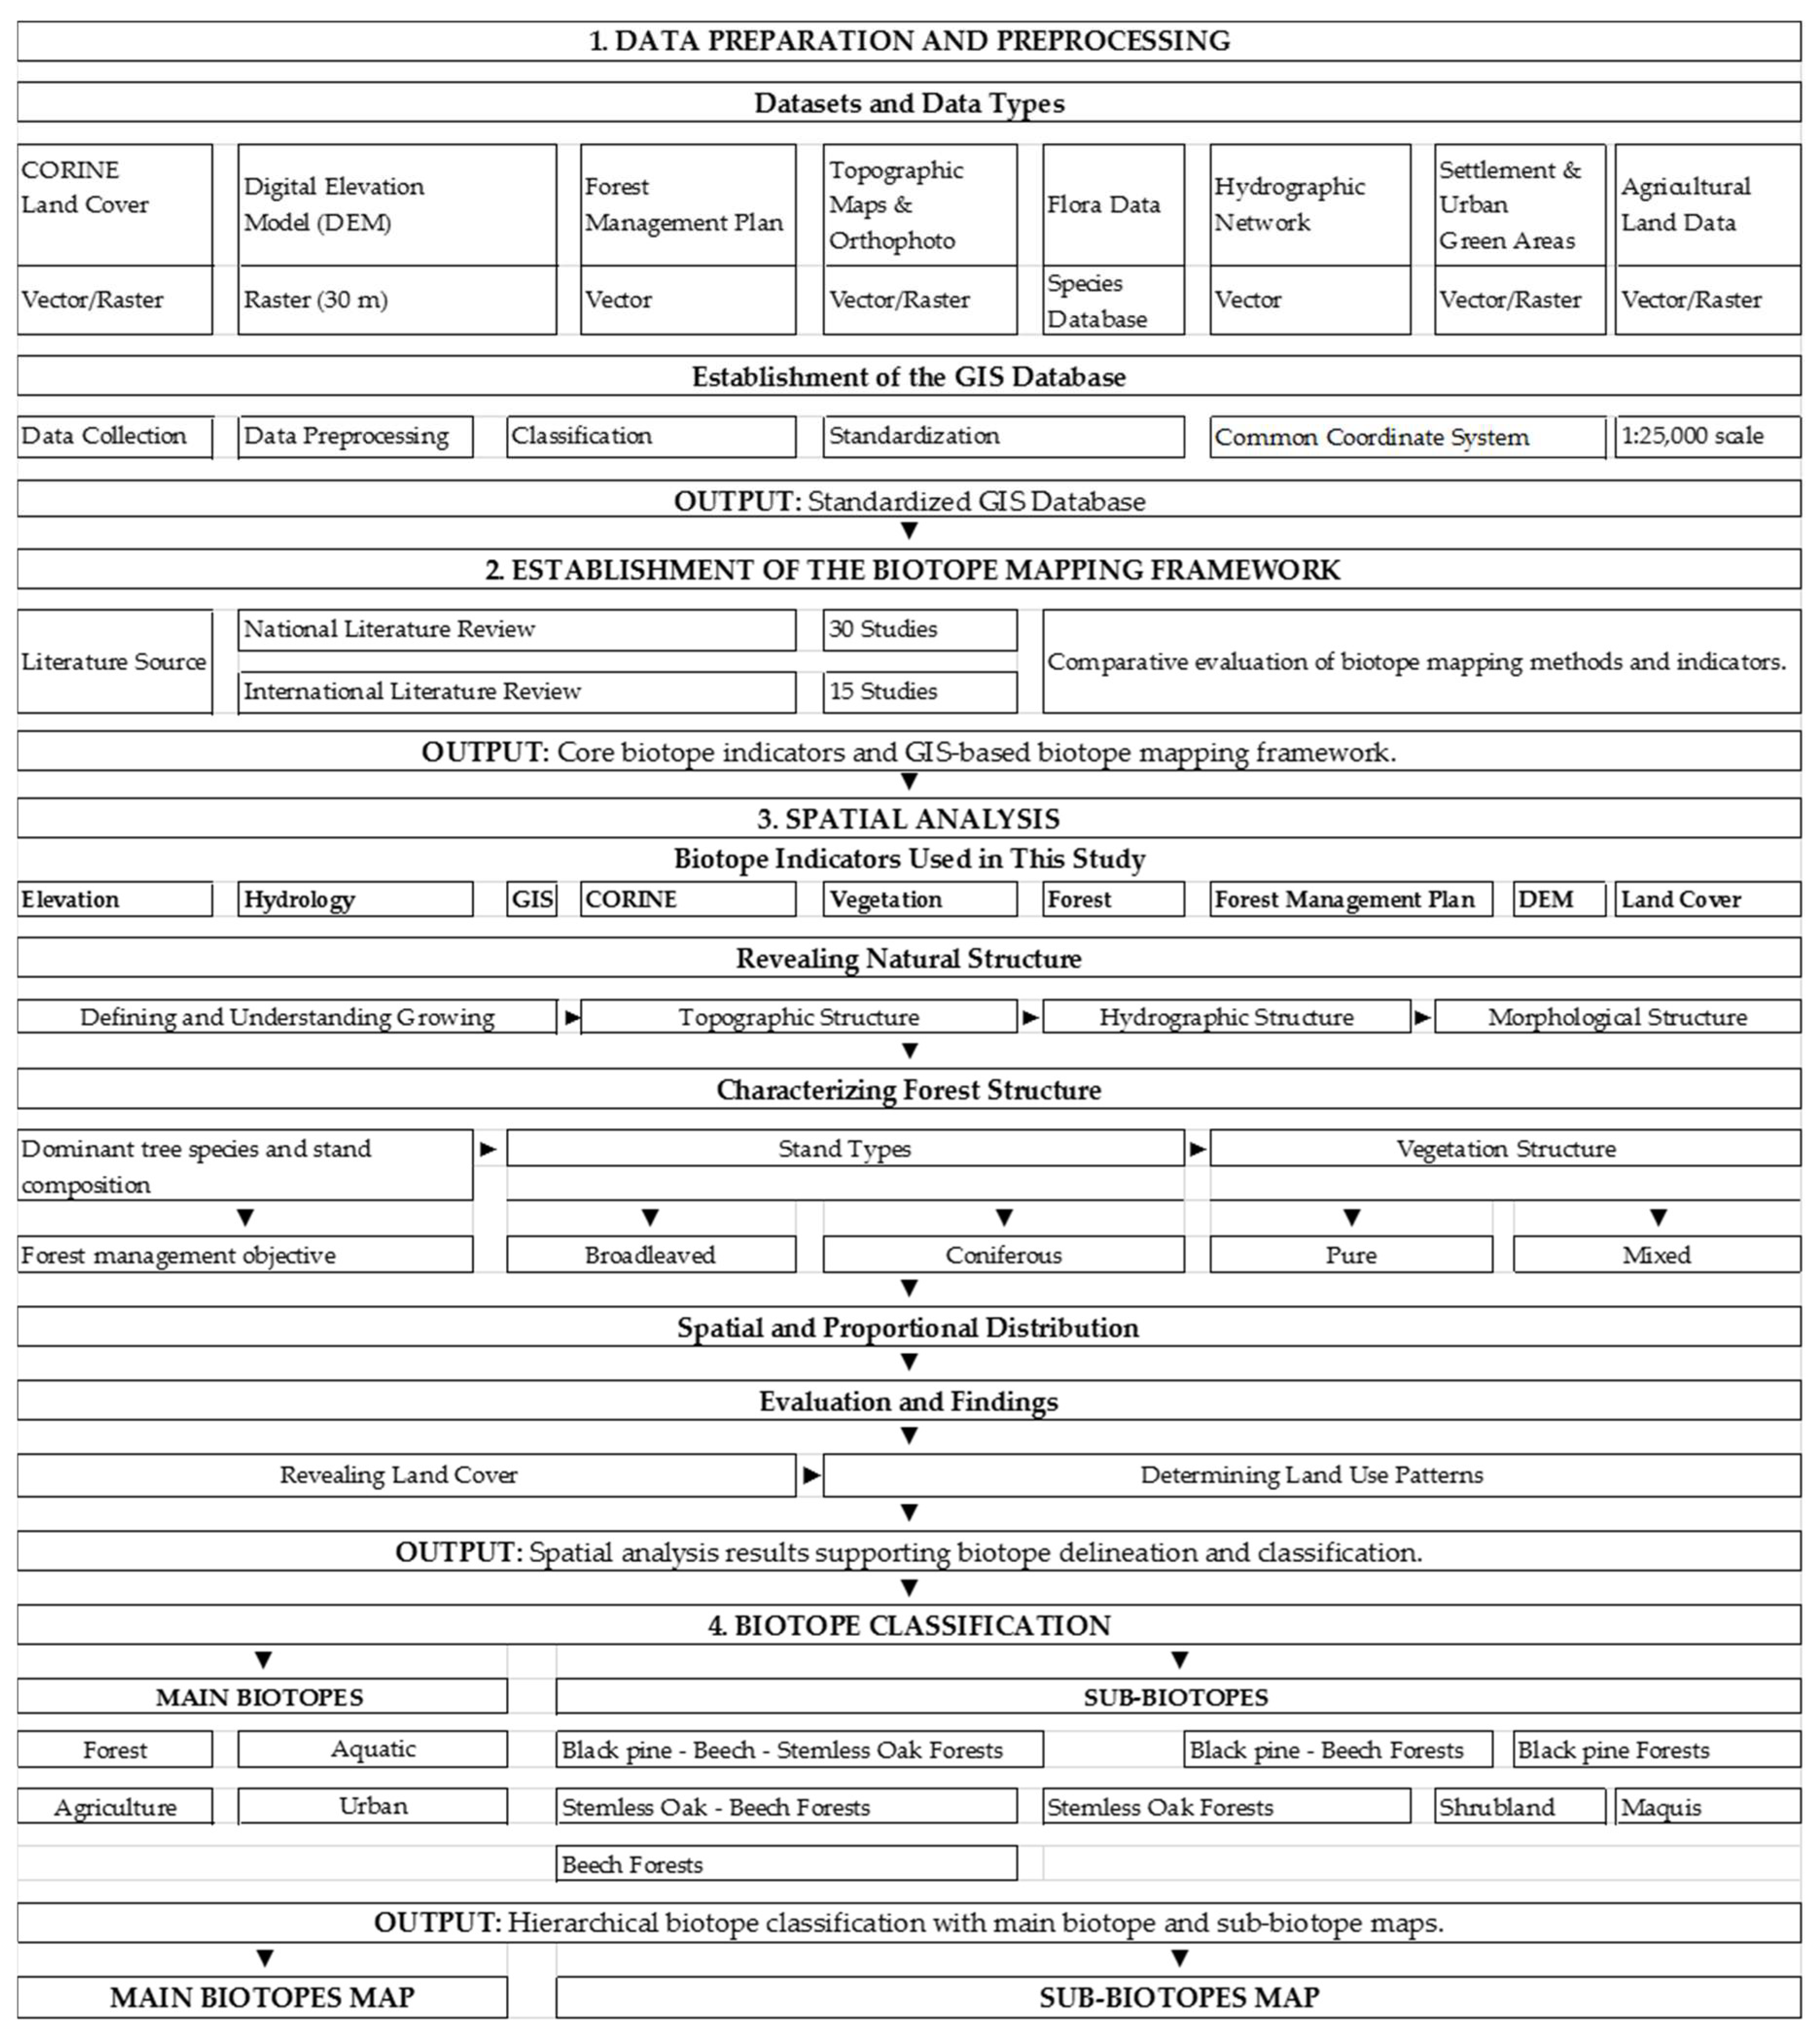
It should be noted that the resulting biotope map represents a preliminary, inventory-based classification derived from the integration of existing institutional datasets, rather than a field-validated product; formal accuracy assessment was beyond the scope of this study and is identified as a priority for future research (Section 4.3). The methodological workflow adopted for biotope identification and mapping is illustrated in Figure 3.
Figure 3.
Methodological workflow for GIS-based biotope identification and mapping.
3. Results
3.1. Forest Resources and Floristic Elements of Çınarcık District
According to the land cover data, Çınarcık District has a heterogeneous landscape structure comprising forest, agricultural, coastal, aquatic, and settlement areas. Based on the CORINE (2018) land cover data, approximately 60% of the study area consists of forest and agricultural areas [9].
In terms of floristic characteristics, the study area is located within the transition zone between the Mediterranean and Euro-Siberian phytogeographical regions and exhibits high plant diversity. According to the floristic study conducted by İnan [14] on the Armutlu Peninsula, numerous woody and herbaceous taxa belonging to both Mediterranean and Euro-Siberian flora regions occur within the study area. The main floristic elements identified in the study area are presented in Table 5.
Table 5.
Main floristic elements identified in Çınarcık District. (a,b) Location and growing environment of herbaceous plant taxa, compiled from İnan [14] and adapted to current classifica-tion.
According to the Çınarcık Forest Management Plan, the study area contains 39 woody tree species and maquis communities. These woody species were evaluated as important indicators for the identification and classification of forest biotopes [11]. The main woody species occurring within the forest ecosystems are presented in Table 6.
Table 6.
Woody tree species of Çınarcık District forest stands.
Although administrative and legally classified as forest land, maquis areas are not composed of typical forest stand species; rather, they are dominated by sessile oak (Quercus petraea), with laurel (Laurus nobilis) occurring as a scattered component alongside numerous accompanying shrub taxa [11].
According to the Çınarcık Forest Management Plan, 72 different stand types occur within the study area [11]. Oriental beech (Fagus orientalis), silver lime (Tilia tomentosa), sweet chestnut (Castanea sativa), and sessile oak (Quercus petraea) constitute the dominant tree species within these stands. Particularly, Fagus orientalis, Tilia tomentosa–Castanea sativa, Quercus petraea–Fagus orientalis, and Tilia tomentosa–Fagus orientalis mixed stands represent the most widely distributed forest communities in the study area.
The forest ecosystems were also evaluated according to their management objectives defined in the Forest Management Plan [11]. These objectives include timber production, biodiversity conservation, hydrological protection, erosion control, recreation, and ecotourism functions. The relationship between dominant tree species, stand composition, and forest management objectives is presented in Table 7.
Table 7.
Forest management objectives and rotation periods according to dominant tree species and stand composition in Çınarcık District.
Rotation periods varied between 30 and 120 years for stands managed primarily for timber production, whereas all ecologically and socioculturally oriented management classes were assigned a uniform rotation period of 200 years, reflecting a substantially longer-term management approach for conservation-oriented forest areas.
The Platanus orientalis gene conservation forest (national registry no. 316) is designated within compartments 38 and 41 of the planning unit, aiming to conserve the genetic diversity of the species in situ. Delmece Plateau, declared a Nature Park by the Ministry’s decision dated 11 July 2011 (No. 903), is managed according to nature park conservation criteria [11].
Beyond the species-based management classification presented above, the areal distribution of forest functions was further examined to quantify their spatial extent within the district. Forest production and public health functions were found to cover the largest areas, accounting for 53.53% and 34.82% of the total forest area, respectively, and together representing approximately 88% of all forest functions in the district (Table 8).
Table 8.
Forest functions and their areal and proportional distribution.
Beyond their ecological and management functions, forest resources also play an important socioeconomic role for local communities. Approximately 60% of the district population is employed in the tourism sector, while the remaining 40% is engaged in forestry-related labor, olive cultivation, greenhouse farming, floriculture, fishing, beekeeping, and small-scale livestock farming. Local communities benefit from forest resources primarily through timber harvesting and afforestation-related activities (planting, hoeing), as well as young stand tending operations. In addition, forests provide subsistence fuelwood and construction timber, local market products such as linden flowers and chestnuts, recreational areas, and spaces for nature-based sports [11].
Collectively, these findings indicate that the forest resources of Çınarcık District are structurally diverse and multifunctional, combining high floristic richness with a management framework that integrates timber production, ecological protection, and community-based socioeconomic uses—characteristics that directly shape the composition and distribution of the biotope types identified in the Section 3.2.
3.2. Main and Sub-Biotopes of Çınarcık District
3.2.1. Main Biotopes and Dominant Characteristics
The identification of the main biotopes in Çınarcık District was based on the integrated evaluation of land cover, topographic and morphological characteristics, hydrological structure, site conditions, and forest stand types. In the classification of forest biotopes, stand types, dominant woody species, and the characteristics of coniferous, broadleaved, and mixed forests were used as the main criteria. As a result of the assessment, four main biotope groups were identified within the study area: forest, aquatic, agricultural, and urban biotopes (Table 9, Figure 4).
Table 9.
Main biotope types, growing environments and dominant stand characteristics.
Figure 4.
Distribution of the main biotope types in Çınarcık District (WGS 1984 UTM Zone 35N).
Forest biotopes constitute the largest biotope group within the study area. Çınarcık District is located within the transition zone between the Mediterranean and Euro-Siberian phytogeographical regions and hosts approximately 620 plant taxa, including endemic species. Within the forest biotopes, broadleaved, coniferous, and mixed stand types were distinguished.
In broadleaved forest biotopes, the dominant species are Oriental beech (Fagus orientalis), narrow-leaved ash (Fraxinus angustifolia), Oriental plane (Platanus orientalis), silver lime (Tilia tomentosa), sweet chestnut (Castanea sativa), and sessile oak (Quercus petraea). These biotopes are mainly distributed across mountainous areas, lower stream valleys, and relatively flat topographic units.
Coniferous forest biotopes consist of black pine (Pinus nigra), Turkish red pine (Pinus brutia), maritime pine (Pinus pinaster), and stone pine (Pinus pinea). These biotopes cover a limited proportion of the study area and are mainly concentrated on high plateaus and steep slopes. Among coniferous forest biotopes, Pinus pinaster has the widest spatial distribution [11,14].
When forest biotopes were evaluated according to pure and mixed stand structures, four dominant woody species were identified in pure coniferous stands and six dominant woody species in pure broadleaved stands. Among pure coniferous stands, Pinus pinaster had the largest spatial distribution, whereas Fagus orientalis was the dominant species among pure broadleaved stands (Table 10). Among pure stands, Fagus orientalis represented the most dominant species, accounting for 61.05% of the total pure stand area, followed by Quercus petraea (14.82%) and Pinus pinaster (10.37%). These three species together accounted for approximately 86% of the total pure stand area.
Table 10.
Distribution of forest main biotopes according to pure stand types.
Mixed forest biotopes consist of Quercus petraea–Fagus orientalis, Quercus petraea–Tilia tomentosa, Tilia tomentosa–Fagus orientalis, Fagus orientalis–Fraxinus angustifolia, and Pinus pinaster–Pinus pinea associations. These biotopes represent the forest ecosystems with the highest biodiversity within the study area due to the co-occurrence of different species within the same habitat.
Among mixed stand types, the association with the largest spatial distribution is Fagus orientalis–Castanea sativa (33.86%), followed by Tilia tomentosa–Castanea sativa (19.38%) and Quercus petraea–Castanea sativa (18.24%). These three associations together account for approximately 71.48% of the total mixed stand area (Table 11).
Table 11.
Distribution of forest main biotopes according to mixed stand types.
Aquatic biotopes consist of various habitats, including lakes, ponds, streams, river systems, wetlands, and coastal aquatic areas. The distribution of hydrophytic plant communities inhabiting these environments is strongly influenced by environmental factors such as water salinity, temperature, light availability, water depth, and hydrological conditions. Therefore, aquatic biotopes are considered fundamental ecological components of landscapes in terms of habitat heterogeneity and biodiversity conservation [59].
In this study, aquatic biotopes were not identified based on species-level aquatic flora inventories; instead, they were delineated through the integrated evaluation of land cover, hydrological structure, site conditions, and Forest Management Plan data [11]. Accordingly, aquatic environments were delineated only at the main biotope level and were not further subdivided into sub-biotope types, as species-level aquatic vegetation inventories were beyond the scope of this study. Within this framework, stream channels, river corridors, ponds, reservoir areas, and moist habitats surrounding these water bodies were classified as aquatic biotopes. The delineation of aquatic biotope boundaries was based on the combined assessment of hydrological structures and the natural and semi-natural vegetation surrounding these areas.
Within the study area, aquatic biotopes consist of streams, valley bottoms, reservoir areas, and moist habitats associated with water resources. These areas form ecological transition zones together with adjacent coniferous, broadleaved, and mixed forest biotopes, providing important habitats for maintaining ecological continuity and biodiversity [31].
Agricultural biotopes comprise rainfed agricultural lands, irrigated agricultural areas, fallow fields, and olive groves located in mountainous areas, river valleys, coastal plains, and plateau surfaces. These areas are not only production landscapes but also agroecosystems interacting with natural and semi-natural habitats. Agricultural biotopes provide important ecological functions in maintaining landscape heterogeneity, sustaining habitat connectivity, and supporting biodiversity [27].
Urban biotopes consist of settlement areas and associated parks, urban green spaces, cemeteries, stream corridors, coastal areas, wetlands, forest patches, shrublands, and maquis communities located within or around urban environments. Urban biotopes contribute to the maintenance of ecological connectivity by supporting the continuity of natural and semi-natural habitats within built environments. Particularly, urban green spaces represent important ecological components for sustaining habitat diversity and supporting urban biodiversity [23]. In the study area, old cemeteries, forest patches, military areas, flood-prone areas, stream corridors, historical structure surroundings, parks, and other open green spaces were evaluated as relatively well-preserved urban biotopes. In this study, species-based floristic inventories were not conducted for agricultural and urban biotopes; instead, the boundaries of these biotopes were determined based on land use, growing environment characteristics, and available spatial datasets.
Overall, these results demonstrate that forest biotopes dominate the landscape mosaic of Çınarcık District, reflecting the strong influence of topography and forest management practices on habitat distribution, while aquatic, agricultural, and urban biotopes occupy comparatively smaller but ecologically complementary portions of the study area, contributing to overall landscape connectivity and habitat heterogeneity.
3.2.2. Sub-Biotope Types and Dominant Species
By distinguishing the main biotope groups according to ecological similarity and growing environment characteristics, 12 characteristic sub-biotope types were identified within the study area (Table 12). Among the identified sub-biotope types, Beech Forests (Fagus orientalis) occurring in plateau environments had the largest spatial distribution, accounting for 36.40% of the total sub-biotope area. This was followed by maquis communities in plateau environments (18.58%) and maquis communities in coastal plain environments (17.90%). Together, these three sub-biotope types represented approximately 73% of the total mapped sub-biotope area.
Table 12.
Sub-biotope types, growing environments and their spatial distribution.
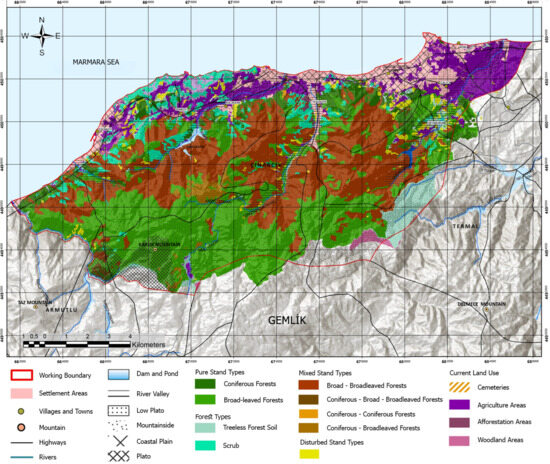
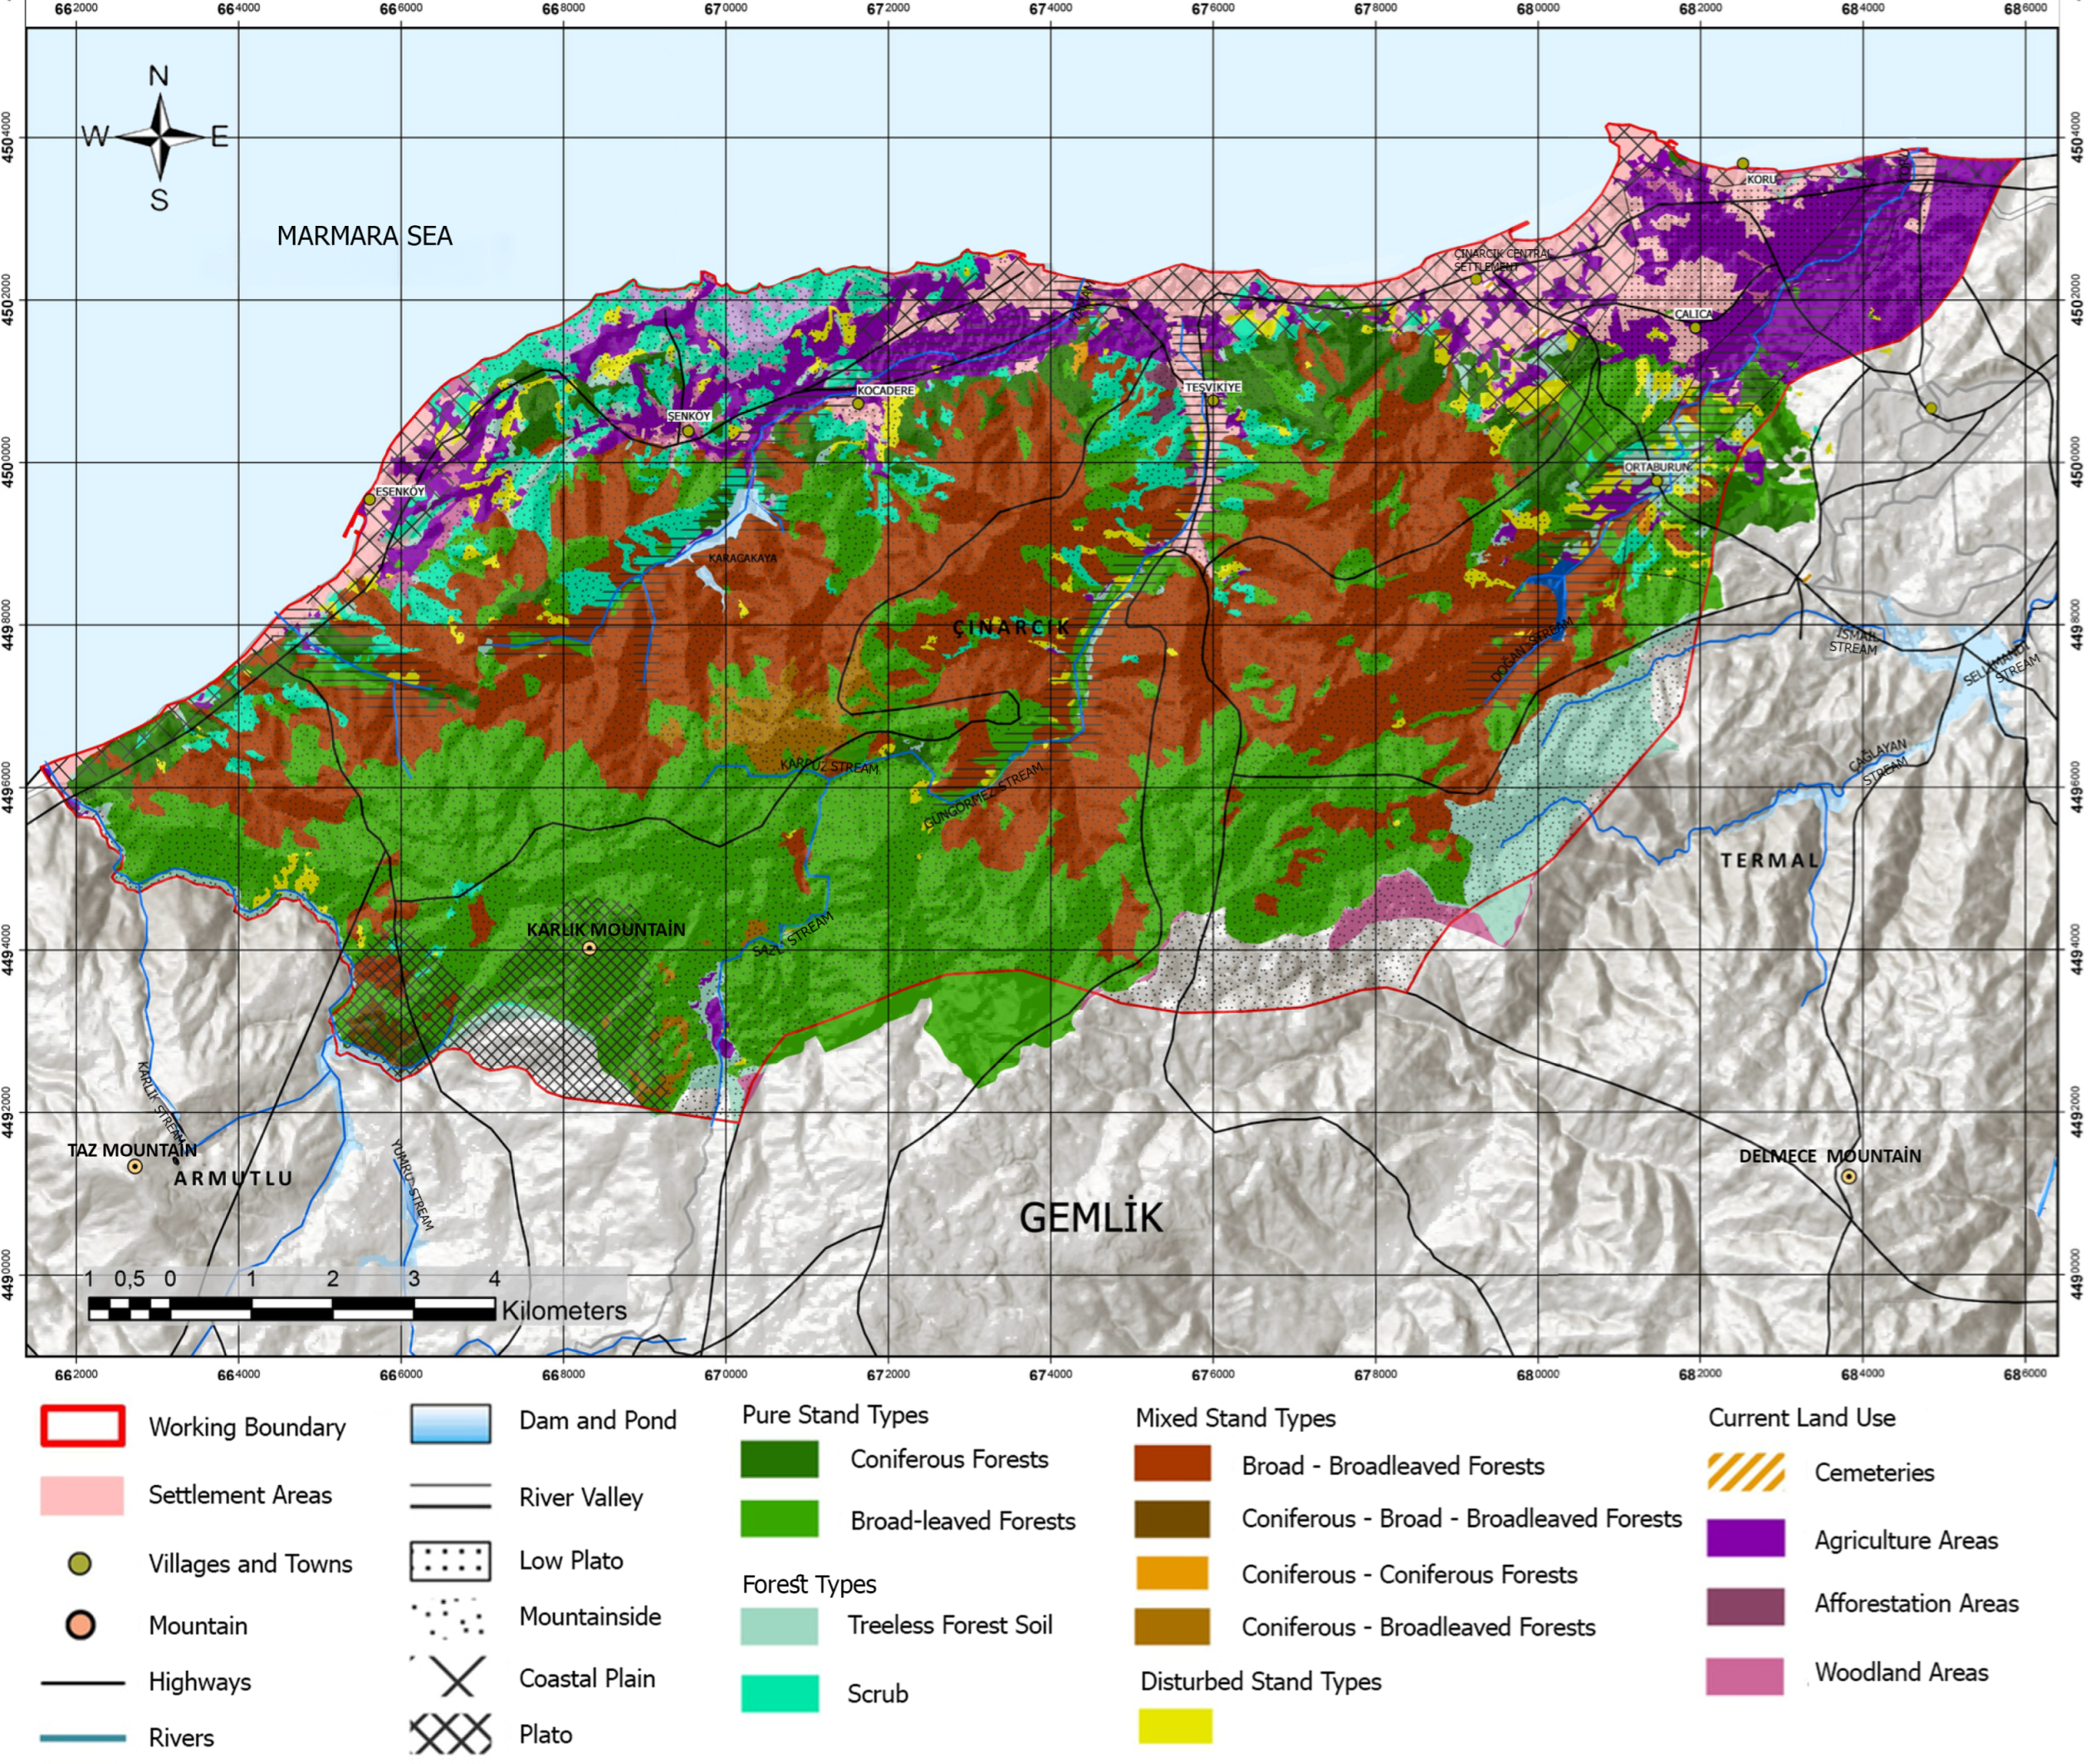
Eight disturbed biotope types resulting from anthropogenic activities and natural processes were identified within the study area. Among these disturbed biotopes, maquis communities (53.13%) and Sessile oak forests (37.02%) represented the largest proportions, together accounting for approximately 90% of the total disturbed biotope area (Table 13, Figure 5).
Table 13.
Disturbed biotope types and their spatial distribution.
Figure 5.
Distribution of the sub-biotope types in Çınarcık District (WGS 1984 UTM Zone 35N).
These findings indicate that beech-dominated plateau formations and maquis communities constitute the principal sub-biotope types of the study area, while the substantial proportion of disturbed biotopes—particularly maquis and sessile oak formations—points to the ongoing influence of anthropogenic pressures on forest structure and highlights priority areas for ecological restoration.
4. Discussion
4.1. Methodological Synthesis and Comparison with National and International Studies
The biotope mapping approach developed in this study is not a site-specific method but is based on a methodological synthesis developed through a comparative evaluation of thirty biotope mapping studies conducted in Türkiye and international biotope/habitat mapping approaches (Table 2, Table 3 and Table 4). International studies indicate that vegetation characteristics and field observations were initially the primary components in biotope identification, whereas contemporary approaches integrate these components with Geographic Information Systems (GIS), remote sensing, land cover datasets, and spatial analysis techniques [3,4,16]. Similarly, studies conducted in Türkiye demonstrate that vegetation, land cover, topographic characteristics, hydrological structure, and GIS-based analyses are the main components used for biotope identification. Therefore, biotopes should not be defined based on a single data group but rather through the integrated assessment of physiographic, biotic, and land-use-related indicators. The methodological framework developed in this research adopts this multi-criteria approach by integrating various data sources within a GIS environment and enabling the simultaneous evaluation of both main and sub-biotope types. Given its methodological basis in both Turkish and international literature, this framework is particularly transferable to other Mediterranean-transition coastal districts characterized by similar forest–agriculture–settlement mosaics, such as other parts of the Armutlu Peninsula or comparable Aegean and Marmara coastal areas exhibiting analogous physiographic and floristic conditions.
Although field observations (73.3%) and soil data (70.0%) were among the most frequently used indicators in the reviewed literature (Table 4), they were not incorporated as primary indicators in this study. Field observations were excluded because the present study relied on existing institutional datasets rather than a newly conducted systematic field survey, consistent with the approach adopted in a comparable proportion of national studies (Section 4.3). Soil data were excluded due to the unavailability of a sufficiently detailed, study-area-specific digital soil dataset at the time of analysis. It should be noted that frequency of use in the literature does not necessarily indicate ecological indispensability for a given study area; rather, indicator selection in this study was guided by the specific data availability, the dominance of forest and land-cover-driven biotope types in Çınarcık District, and the methodological consistency required for a transferable GIS-based framework.
4.2. Ecological Characteristics and Conservation Implications of Identified Biotopes
Consistent with the terminological clarification provided in Section 2.6, the biotope types discussed below are primarily defined through land cover, physiographic, and vegetation-structural indicators, with direct floristic evidence available mainly for forest biotopes.
The environmental characteristics of the study area, including physiographic conditions, microclimatic properties, floristic elements, land cover diversity, and habitat heterogeneity, have contributed to the formation of various biotope types. Approximately 60% of the study area consists of forest and agricultural lands, indicating a significant spatial dominance of semi-natural and managed ecosystems. Forest main biotopes are mainly concentrated in mountainous areas and on steep slopes, representing ecologically valuable natural habitats. In terms of hydrological characteristics, stream networks and areas surrounding water resources were delineated as aquatic main biotopes based on hydrological features, land cover, and site conditions. Unlike forest biotopes, aquatic environments were not further classified into sub-biotope types because species-level aquatic vegetation inventories were beyond the scope of this study. These habitats represent sensitive ecological systems and are particularly vulnerable to anthropogenic pressures and pollution risks in areas close to settlements. Establishing protection zones around forest ecosystems and water resources and limiting land-use changes in these areas are recommended for biodiversity conservation and the maintenance of ecological functions [11].
Agricultural biotopes generally occur in flat and gently sloping areas, particularly in locations close to water resources, and they are important not only for regional agricultural production but also for maintaining landscape heterogeneity and ecological functions. These areas should therefore be considered as components of the landscape mosaic rather than merely as production zones. Grasslands, pastures, and shrublands also represent important habitats in terms of livestock activities and biodiversity conservation. Forest and wetland biotopes, which are more sensitive to environmental changes, should be considered priority areas for ecological protection. The structural complexity and species composition of mixed forest stands contribute to ecosystem resilience and highlight the importance of conserving broadleaved forest communities.
The contrast between short-rotation timber-production stands (30–120 years) and the uniformly long 200-year rotation period applied to ecologically and socioculturally oriented management classes reflects a management philosophy that prioritizes long-term ecological continuity over short-term timber yield in conservation-designated areas. Such extended rotation periods allow for the development of structurally complex, multi-layered stands that typically support greater habitat heterogeneity and species diversity compared to even-aged, short-rotation systems, thereby contributing to the maintenance of forest biodiversity at the landscape scale. Similarly, maquis areas—although administratively classified as forest land rather than forest stands—harbor a distinct assemblage of shrub and understory taxa that complements the tree-dominated biotopes identified in this study, further enhancing the overall structural and floristic diversity of the district.
Recognizing and maintaining such non-timber, biodiversity-relevant land-cover types within forest management frameworks is therefore essential for supporting landscape-scale biodiversity conservation objectives. The dominance of Fagus orientalis in both pure and mixed stands, as identified in Results, may be attributed to the region’s humid microclimate and calcareous brown forest soils, which favor beech regeneration and competitive establishment over co-occurring species such as Quercus petraea and Pinus nigra. This ecological explanation is consistent with the species’ well-documented preference for mesic, nutrient-rich sites across its Euro-Siberian distribution range.
In degraded forest and urban biotopes, silvicultural interventions conducted for fire, pest, and disease management should prioritize the conservation of rare and threatened species. The conversion of long-preserved natural forest areas into intensive recreational zones should be considered a potential threat due to the ecological pressures it may generate. In order to enhance urban biotopes, green infrastructure applications along roads and transportation corridors should prioritize native species adapted to regional ecological conditions and environmental stress factors. In this context, the conservation of fruit-bearing tree and shrub species important for wildlife, including Sorbus domestica, Pyrus elaeagrifolia, Crataegus orientalis, Prunus domestica, Cerasus avium, Cornus mas, Corylus avellana, Rubus fruticosus, Arbutus unedo, and Pistacia terebinthus, is recommended.
The identification and mapping of biotope areas contribute to the conservation of endemic plant species, habitat characteristics, and natural vegetation within the framework of sustainability and nature conservation principles. In this regard, biotope maps represent important planning tools for landscape maintenance, ecological restoration, and conservation strategies. Similar to international practices, integrating biotope maps into urban and regional planning processes is essential for protecting ecological values and developing sustainable land-use decisions. Biotope mapping at urban and peri-urban scales provides guidance for green space planning, roadside vegetation management, and ecological rehabilitation practices, while improving the effectiveness of interventions based on potential natural vegetation. Currently, biotope mapping studies are largely conducted within scientific research projects and postgraduate studies. Despite their significant potential contribution to spatial planning processes, the absence of biotope mapping as a standardized planning instrument within the Turkish planning hierarchy remains an important limitation. Integrating biotope maps into conservation planning, ecological network development, and sustainable land-use strategies would strengthen their role as decision-support tools and contribute to more resilient landscape planning approaches.
4.3. Limitations and Future Research
A major limitation of this study is the absence of a newly conducted species-based field inventory; floristic data were instead obtained from İnan [14], a study conducted in 1994. This temporal gap is associated with the possibility that recent changes in species distributions, including potential shifts in invasive or range-expanding taxa, may not have been fully represented in the current classification. Nevertheless, the literature synthesis presented in Table 4 demonstrates that field observations are not a standardized component across all biotope mapping studies conducted in Türkiye (73.3%), and that approaches based on institutional datasets such as Forest Management Plans, CORINE land cover data, and TÜBİVES are commonly applied in studies conducted at comparable spatial scales [9,11,13].
The historical flora dataset was retained because no more recent systematic floristic survey of the Armutlu Peninsula exists; species records were used at the presence/location level rather than with precise georeferencing, and current land-cover boundaries were cross-checked against the Forest Management Plan rather than against the original 1994 survey extent. Taxonomic nomenclature was updated to current standards, but potential changes in invasive or range-expanding species since 1994 could not be assessed and are acknowledged as a limitation.
A related limitation concerns the absence of a formal accuracy assessment for the resulting biotope map. Although the Forest Management Plan [11] itself derives from a systematic field-based inventory, the boundaries of aquatic, agricultural, and urban biotopes in this study were delineated primarily through the integration of institutional datasets rather than through independent ground-truthing. Consequently, the classification accuracy of these biotope types could not be quantitatively validated. Similarly, the CORINE Land Cover dataset [9], despite its wide use in comparable studies, provides a relatively coarse spatial resolution for macro-scale land-cover classification, which may limit the precision of boundary delineation for smaller or transitional biotope units.
The study also focused primarily on floristic and vegetation-based indicators, without incorporating faunal or bioindicator data. Since biotope definitions conventionally encompass both plant and animal communities [1], the integration of wildlife distribution data in future applications would allow for a more comprehensive ecological characterization of the identified biotope types. Furthermore, the analysis represents a single temporal snapshot; it does not capture seasonal variation or longer-term land-cover and vegetation dynamics that may influence biotope boundaries over time.
Future research should therefore prioritize (i) updated, systematic floristic and faunal field surveys to validate and refine the current classification; (ii) formal accuracy assessment procedures, such as ground-truthing and confusion-matrix-based validation, to quantify the reliability of the biotope map; (iii) the integration of higher-resolution remote sensing data (e.g., Sentinel-2 or UAV-based imagery) to improve boundary precision for heterogeneous habitat types; and (iv) multi-temporal monitoring to assess the effects of land-use change and climate variability on biotope distribution. Applying the proposed methodological framework to additional case areas with differing ecological and administrative characteristics would further test its transferability and robustness as a standardized biotope mapping approach for Türkiye.
5. Conclusions
This study developed a GIS-based, multi-indicator biotope mapping model for Çınarcık District and identified four main biotope groups, namely forest, aquatic, agricultural, and urban biotopes, together with their associated sub-biotope types. The proposed framework integrates land cover, topographic characteristics, hydrological structure, forest stand data, and floristic information within a spatial analysis environment, providing a comprehensive approach for identifying ecological units at the local scale.
The results demonstrate that existing institutional datasets, including forest management plans, CORINE land cover data, TÜBİVES records, digital elevation models, and other GIS-based datasets, can provide an effective basis for a preliminary, inventory-based approach to biotope mapping when combined within a multi-layer spatial analysis framework [9,11,13]. Although the study relies on available floristic information rather than a newly conducted systematic field inventory, and the resulting classification has not undergone formal accuracy assessment, it provides a consistent and transferable methodological basis for landscape-scale ecological assessment.
The developed biotope map contributes to the identification of ecological values, conservation priorities, and sustainable land-use strategies by revealing the spatial distribution and characteristics of different habitat types. The integration of biotope mapping approaches into ecological planning processes in Türkiye can support nature conservation, green infrastructure development, and sustainable landscape planning practices. Future studies incorporating updated field observations and detailed species inventories will further improve the accuracy and applicability of biotope assessments.
Author Contributions
Conceptualization, T.E.A.; methodology, T.E.A., H.B., İ.D. and P.N.K.; software, H.B., İ.D. and P.N.K.; validation, T.E.A., H.B., İ.D. and P.N.K.; formal analysis, H.B., İ.D. and P.N.K.; investigation, H.B., İ.D. and P.N.K.; resources, T.E.A.; data curation, H.B., İ.D. and P.N.K.; writing—original draft preparation, T.E.A., H.B., İ.D. and P.N.K.; writing—review and editing, T.E.A.; visualization, H.B., İ.D. and P.N.K.; supervision, T.E.A.; project administration, T.E.A.; funding acquisition, T.E.A. All authors have read and agreed to the published version of the manuscript.
Funding
This research received no external funding.
Institutional Review Board Statement
Ethical review and approval were waived for this study due to the exclusive use of publicly available datasets, open-access spatial data, and standard secondary literature, which did not involve human participants or animal subjects.
Data Availability Statement
The data presented in this study are available upon request from the corresponding author.
Acknowledgments
This study is derived from the ongoing Master’s thesis research of Hilal Bakırcı, İlayda Delisalihoğlu, and Peri Nur Keleş, supervised by Tülay Erbesler Ayaşlıgil, conducted within the Landscape Planning Master’s Program at the Department of City and Regional Planning, Graduate School of Natural and Applied Sciences, Yıldız Technical University.
Conflicts of Interest
The authors declare no conflicts of interest. The funders had no role in the design of the study; in the collection, analyses, or interpretation of data; in the writing of the manuscript; or in the decision to publish the results.
References
- Odum, E.P.; Barrett, G.W. Fundamentals of Ecology, 5th ed.; Thomson Brooks/Cole: Belmont, CA, USA, 2005. [Google Scholar]
- Farina, A. The cultural landscape as a model for the integration of ecology and economics. BioScience 2000, 50, 313–320. [Google Scholar] [CrossRef] [Scilit]
- Sukopp, H.; Weiler, S. Biotope mapping and nature conservation strategies in urban areas of the Federal Republic of Germany. Landsc. Urban Plan. 1988, 15, 39–58. [Google Scholar] [CrossRef] [Scilit]
- Löfvenhaft, K.; Björn, C.; Ihse, M. Biotope patterns in urban areas: A conceptual model integrating biodiversity issues in spatial planning. Landsc. Urban Plan. 2002, 58, 223–240. [Google Scholar] [CrossRef] [Scilit]
- Çınarcık Kaymakamlığı [Çınarcık District Governorship]. Coğrafi Yapı [Geographical Structure]. 2025. Available online: http://www.cinarcik.gov.tr/ografi-yapi (accessed on 10 April 2025).
- Türkiye İstatistik Kurumu (TÜİK) [Turkish Statistical Institute]. Adrese Dayalı Nüfus Kayıt Sistemi Sonuçları [Address-Based Population Registration System Results]. Nüfus İstatistikleri Portalı [Population Statistics Portal]. 2025. Available online: https://nip.tuik.gov.tr/ (accessed on 22 March 2025).
- WeatherSpark. Çınarcık, Türkiye Ortalama Hava Durumu Yıl Boyunca [Çınarcık, Turkey Average Weather Year Round]. 2025. Available online: https://tr.weatherspark.com/y/96046/Çınarcık-Türkiye-Ortalama-Hava-Durumu-Yıl-Boyunca (accessed on 5 June 2025).
- Ayaslıgil, T.E.; Bakırcı, H.; Delisalihoğlu, İ.; Keleş, P.N. Ecological landscape master plan according to landscape characterization in the case of Yalova Çınarcık District. Megaron 2025, 20, 520–539. [Google Scholar] [CrossRef] [Scilit]
- Copernicus Land Monitoring Service. CORINE Land Cover 2018 (CLC2018), Raster Dataset; European Environment Agency: Copenhagen, Denmark, 2018; Available online: https://sdi.eea.europa.eu/catalogue/copernicus/api/records/960998c1-1870-4e82-8051-6485205ebbac?language=all (accessed on 30 May 2025).
- T.C. Çevre, Şehircilik ve İklim Değişikliği Bakanlığı: Ankara, Türkiye. 2025. Available online: https://cbs.csb.gov.tr/ (accessed on 12 May 2025).
- Orman Genel Müdürlüğü (OGM). Bursa Orman Bölge Müdürlüğü, Yalova Orman İşletme Müdürlüğü, Çınarcık Orman İşletme Şefliği Ekosistem Tabanlı Fonksiyonel Orman Amenajman Planı. [Ecosystem-Based Functional Forest Management Plan of the Çınarcık Forestry Directorate, Yalova Forest Management Directorate, Bursa Regional Forest Directorate]; Unpublished institutional report; T.C. Tarım ve Orman Bakanlığı, Orman Genel Müdürlüğü: Ankara, Türkiye, 2017. [Google Scholar]
- Harita Genel Müdürlüğü (HGM). Topoğrafik Haritalar ve Ortofoto Görüntüler [Topographic Maps and Orthophoto Images]; Millî Savunma Bakanlığı: Ankara, Türkiye, 2025. Available online: https://www.harita.gov.tr/ (accessed on 25 August 2025).
- Türkiye Bitkileri Veri Servisi (TÜBİVES) [Turkish Plants Data Service]. Available online: http://www.tubives.com (accessed on 3 October 2025).
- İnan, M. Armutlu Yarımadası’nın Florası [Flora of the Armutlu Peninsula]. Master’s Thesis, İstanbul Üniversitesi [Istanbul University], İstanbul, Türkiye, 1994. Available online: https://nek.istanbul.edu.tr/ekos/TEZ/22989.pdf (accessed on 8 January 2025).
- European Environment Agency (EEA). Mapping Europe’s Ecosystems; EEA Briefing No. 19/2018; Publications Office of the European Union: Luxembourg, 2019; Available online: https://www.eea.europa.eu/en/analysis/publications/mapping-europes-ecosystems-1 (accessed on 24 May 2025).
- Zhao, J.; Hao, X.; Yang, Y. Research on urban sustainability ındicators based on urban grain: A case study in Jinan, China. Sustainability 2023, 15, 13320. [Google Scholar] [CrossRef] [Scilit]
- Bastian, O. Biotope mapping and evaluation as a base of nature conservation and landscape planning. Ekológia 1996, 15, 5–17. [Google Scholar]
- Wächter, M. Repräsentativ-flächendeckende stadtbiotopkartierung in Deutschland: Das Beispiel Leipzig. Deinsea 1999, 5, 67–76. [Google Scholar]
- Werner, P. Why biotope mapping in populated areas? Deinsea 1999, 5, 9–26. [Google Scholar]
- Zerbe, S.; Maurer, U.; Schmitz, S.; Sukopp, H. Biodiversity in Berlin and its potential for nature conservation. Landsc. Urban Plan. 2003, 62, 139–148. [Google Scholar] [CrossRef] [Scilit]
- Freeman, C.; Buck, O. Development of an ecological mapping methodology for urban areas in New Zealand. Landsc. Urban Plan. 2003, 63, 161–173. [Google Scholar] [CrossRef] [Scilit]
- Stewart, G.H.; Ignatieva, M.E.; Meurk, C.D.; Earl, R.D. The re-emergence of indigenous forest in an urban environment, Christchurch, New Zealand. Urban For. Urban Green. 2004, 2, 149–158. [Google Scholar] [CrossRef] [Scilit]
- Tzoulas, K.; James, P. Making biodiversity measures accessible to non-specialists: An innovative method for rapid assessment of urban biodiversity. Urban Ecosyst. 2010, 13, 113–127. [Google Scholar] [CrossRef] [Scilit]
- Jonsson, A.; Berg, S.; Quttineh, N.-H.; Jonsson, T. A framework to analyze biodiversity capacity at landscape level and identify areas of high ecological importance. Ecol. Appl. 2025, 35, e70165. [Google Scholar] [CrossRef] [Scilit] [PubMed]
- Marcinkowska-Ochtyra, A.; Zagajewski, B.; Ochtyra, A.; Jarocińska, A.; Raczko, E.; Kupková, L.; Štych, P.; Meuleman, K. Mapping vegetation communities of the Karkonosze National Park using APEX hyperspectral data and support vector machines. Misc. Geogr. 2014, 18, 23–29. [Google Scholar] [CrossRef] [Scilit]
- Burkhard, B.; Maes, J.; Potschin-Young, M.B.; Santos-Martín, F.; Geneletti, D.; Stoev, P.; Kopperoinen, L.; Adamescu, C.M.; Adem Esmail, B.; Arany, I.; et al. Mapping and assessing ecosystem services in the EU—Lessons learned from the ESMERALDA approach of integration. One Ecosyst. 2018, 3, e29153. [Google Scholar] [CrossRef] [Scilit]
- Vagge, I.; Sgalippa, N.; Chiaffarelli, G. Agricultural landscapes: A pattern-process-design approach to enhance their ecological quality and ecosystem services through agroforestry. Diversity 2024, 16, 431. [Google Scholar] [CrossRef] [Scilit]
- Zhang, A.; Cheng, J.; Su, X.; Zhu, W.; Sun, G. Multi-level classification of urban green space using multi-source remote sensing and geospatial Data. Remote Sens. 2026, 18, 2192. [Google Scholar] [CrossRef] [Scilit]
- Tanfer, M. Biyotop haritalama ve iklim değişikliği ilişkisi [The relationship between biotope mapping and climate change]. J. Landsc. Res. Pract. (JOLARP) 2023, 5, 1–8. [Google Scholar] [CrossRef] [Scilit]
- Ekici, B. Ganos Dağı (Tekirdağ)’nın çayır biyotopları [Meadow biotopes of Mount Ganos (Tekirdağ)]. Türk. Peyzaj Araşt. Derg. 2020, 3, 89–96. [Google Scholar]
- Ayaşlıgil, Y. Biyotop Haritalama ve Peyzaj Planlama Açısından Önemi [Importance of Biotope Mapping in Landscape Planning]. In Proceedings of the Doğayı Korumada Kent ve Ekoloji Sempozyumu [Symposium on Urban and Ecology in Nature Conservation], Istanbul, Türkiye; İstanbul Technical University Faculty of Architecture: Istanbul, Türkiye; Türkiye Nature Conservation Foundation: Istanbul, Türkiye, 1997; pp. 199–208. [Google Scholar]
- Ortaçeşme, V.; Karagüzel, O.; Mansuroğlu, S. Antalya örneğinde kent planlama çalışmalarında biyotop haritalarının önemi [The importance of biotope maps in urban planning studies: The case of Antalya]. Akdeniz Univ. J. Fac. Archit. 2013, 1, 1–15. [Google Scholar]
- Ekici, B. Kumul biyotoplarının haritalanması, Kurucaşile-Bartın örneği [Mapping of dune biotopes, the case of Kurucaşile-Bartın]. Turk. J. For. 2020, 21, 188–194. [Google Scholar] [CrossRef] [Scilit]
- Yılmaz, H. Bartın Kenti ve Yakın Çevresinde Biyotopların Haritalanması [Mapping of Biotopes in Bartın City and Its Surroundings]. Ph.D. Thesis, Istanbul University, Istanbul, Türkiye, 2001. [Google Scholar]
- Bayraktar, S. Zekeriyaköy Vadisi Biyotopları Üzerine Araştırmalar [Studies on the Biotopes of Zekeriyaköy Valley]. M.Sc. Thesis, İstanbul Üniversitesi [Istanbul University], İstanbul, Türkiye, 2013. Available online: https://nek.istanbul.edu.tr/ekos/TEZ/50971.pdf (accessed on 21 September 2025).
- Sarı Nayim, Y. Amasra-İnkum (Bartın) Arasında Yer Alan Önemli Biyotopların Haritalanması [Mapping of Important Biotopes Between Amasra and İnkum (Bartın)]. Ph.D. Thesis, Istanbul University, Istanbul, Türkiye, 2010. [Google Scholar]
- Gürkan, A. Biotope mapping for sustainable urban development. Appl. Ecol. Environ. Res. 2016, 14, 493–504. [Google Scholar] [CrossRef] [Scilit]
- Artar, M. Çukurova Deltası’nda Tuzla ile Yumurtalık Tabiatı Koruma Alanı Arasındaki Kıyı Şeridinde Önemli Biyotopların Haritalanması [Mapping of Important Biotopes in the Coastal Strip Between Tuzla and Yumurtalık Nature Conservation Area in the Çukurova Delta]. M.Sc. Thesis, Çukurova Üniversitesi [Çukurova University], Adana, Türkiye, 2002. [Google Scholar]
- Mühür, A. İstanbul’un Anadolu Yakasındaki Bazı Biyotop Tiplerinin Edafik Özelliklerinin Karşılaştırılması [Comparison of the Edaphic Characteristics of Some Biotope Types in the Anatolian Side of Istanbul]. M.Sc. Thesis, Marmara Üniversitesi [Marmara University], İstanbul, Türkiye, 2013. [Google Scholar]
- Ünal, B. Maltepe İlçesi’nin (İstanbul) Biyotoplarının Floristik ve Ekolojik Özellikleri [Floristic and Ecological Characteristics of the Biotopes of Maltepe District (İstanbul)]. M.Sc. Thesis, Marmara Üniversitesi [Marmara University], İstanbul, Türkiye, 2016. [Google Scholar]
- Seyidoğlu Akdeniz, N.; Çelik, A.; Ender, E.; Zencirkıran, M. Kentsel ekosistemlerde biyotopların önemi: Bursa kenti örneği [The importance of biotopes in urban ecosystems: The case of Bursa city]. Tarım Bilim. Araşt. Derg. 2015, 8, 40–43. [Google Scholar]
- Şen, İ.M. İstanbul’un Asya Yakasının Peyzaj Ekolojisi Açısından Incelenmesi [An Examination of the Asian Side of İstanbul in terms of Landscape Ecology]. Ph.D. Thesis, İstanbul Üniversitesi [Istanbul University], İstanbul, Türkiye, 2001. [Google Scholar]
- Gönensin, K.S. İstanbul’un Avrupa Yakasının Peyzaj Ekolojisi Açısından Incelenmesi [An examination of the European side of İstanbul in terms of landscape ecology]. Ph.D. Thesis, İstanbul Üniversitesi [Istanbul University], İstanbul, Türkiye, 2001. [Google Scholar]
- Şenik, B.; Uzun, O. Kentsel Açık Yeşil Alanlar Için Ekolojik Bir Gösterge Olarak Biyotop Alan Faktörü [Biotope Area Factor as an Ecological Indicator for Urban Open Green Spaces]. Plant Dergisi. 2021. Available online: https://www.plantdergisi.com/yazi-kentsel-acik-yesil-alanlar-icin-ekolojik-bir-gosterge-olarak--biyotop-alan-faktoru-427.html (accessed on 5 November 2025).
- Altan, T.; Artar, M.; Atik, M.; Çetinkaya, G. Çukurova Deltası Biyosfer Rezervi Yönetim Planı [Çukurova Delta Biosphere Reserve Management Plan]; LIFE-Çukurova Deltası Biyosfer Rezervi Planlama Projesi; Çukurova Üniversitesi [Çukurova University]: Adana, Türkiye, 2004; 372p, Available online: https://www.researchgate.net/publication/272160627_Cukurova_Delta_Biosphere_Reserve_Management_Plan_Cukurova_Deltasi_Biyosfer_Rezervi_Yonetim_Plani (accessed on 18 October 2025).
- Akyol, Y.; Gemici, Y. Kıyı Ege’nin (Gökova ve Edremit Körfezleri arası) vejetasyon ekolojisi ve biyolojik çeşitliliğinin ekolojik yönetimi [Vegetation ecology and ecological management of biodiversity of the coastal Aegean region (Between Gökova and Edremit Gulfs)]. Kastamonu Univ. J. For. Fac. 2017, 17, 116–123. [Google Scholar] [CrossRef] [Scilit]
- Ulus, A. İskenderun kenti ve Yakın Çevresinin Peyzaj Ekolojisi Açısından İncelemeli [Landscape Ecological Analysis of İskenderun City and Its Surroundings]. J. Fac. For. Istanb. Univ. 2008, 58, 53–73. [Google Scholar]
- Karabacak, G. Beylikdüzü İlçesi’nin (İstanbul) Biyotoplarının Floristik ve Ekolojik Özellikleri [Floristic and Ecological Characteristics of the Biotopes of Beylikdüzü District (Istanbul)]. M.Sc. Thesis, Marmara Üniversitesi [Marmara University], İstanbul, Türkiye, 2016. [Google Scholar]
- Kaya, U.E. Saros Körfezi Kıyı Alanında Habitat Sınıflaması [Habitat Classification in the Coastal Area of Saros Gulf]. M.Sc. Thesis, Çukurova Üniversitesi [Çukurova University], Adana, Türkiye, 2010. [Google Scholar]
- Mansuroğlu, S.; Dağ, V. Tunceli Kent Merkezinde Ekolojik Açıdan Önemli Biyotoplar ve Kente Katkıları [Ecologically Important Biotopes in Tunceli City Center and Their Contributions to the City]. In Proceedings of the VI Uluslararası Bölgesel Kalkınma Konferansı Bildiriler Kitabı [Proceedings of the 6th International Regional Development Conference], Diyarbakır, Turkey, 26–27 October 2017; Munzur Üniversitesi ve Fırat Kalkınma Ajansı: Tunceli, Türkiye, 2017; pp. 743–756. [Google Scholar]
- Mansuroğlu, S.; Dağ, V. Kuşadası Kentsel Alanında Biyotop Haritalamanın Önemi [The Importance of Biotope Mapping in Kuşadası Urban Area]. In Kuşadası Peyzaj Değerleri Sempozyumu Bildiriler Kitabı [Kuşadası Landscape Values Symposium]; Birişçi, T., Kalaycı Önaç, A., Eds.; TMMOB Peyzaj Mimarları Odası İzmir Şubesi: İzmir, Türkiye, 2018; pp. 77–96. [Google Scholar]
- Aksu, G.A. İstanbul-Beşiktaş Ilçesi Ekolojik Planlama Yaklaşımlı Kentsel Peyzaj Planı ve Uygulama Stratejisi [Urban Landscape Plan and Implementation Strategy With Ecological Planning Approach for İstanbul-Beşiktaş District]; Project No. 114O341; TÜBİTAK: Ankara, Türkiye, 2017. [Google Scholar]
- Aksu, G.A.; Küçük, N. Evaluation of urban topography–biotope–population density relations for İstanbul–Beşiktaş urban landscape using AHP. Environ. Dev. Sustain. 2020, 22, 733–758. [Google Scholar] [CrossRef] [Scilit]
- Oğurlu, İ.; Aksan, Ş. Bazı yabani memeli türlerinin potansiyel yaşam alanları için gösterge odunsu bitki türlerinin belirlenmesi [Determination of indicator woody plant species for potential habitats of some wild mammal species]. Süleyman Demirel Üniv. Orman Fak. Derg. 2013, 14, 81–87. [Google Scholar]
- Özden, Ö.T. Kentsel Peyzaj Planlama Bağlamında Indikatör Türlerin Sürdürülebilirliğinin Yıldız Korusu Örneğinde Irdelenmesi [Investigation of the Sustainability of Indicator Species in the Context of Urban Landscape Planning: The Case of Yıldız Grove]. Ph.D. Thesis, Yıldız Teknik Üniversitesi [Yıldız Technical University], İstanbul, Türkiye, 2019. [Google Scholar]
- Demir, S.; Demirel, Ö. Peyzaj planlamada peyzaj ekolojisi yaklaşımı [Landscape ecology approach in landscape planning]. Türk. Peyzaj Arş. Derg. 2018, 1, 1–8. [Google Scholar]
- Benliay, A.; Yıldırım, E. Peyzaj planlama çalışmalarında peyzaj metriklerinin kullanımı [The use of landscape metrics in landscape planning studies]. Türk. Bilim. Derl. Derg. 2013, 6, 7–11. [Google Scholar]
- Mansuroğlu, S.; Ortaçeşme, V.; Karagüzel, O. Biotope mapping in an urban environment and its implications for urban management in Turkey. J. Environ. Manag. 2006, 81, 175–187. [Google Scholar] [CrossRef] [Scilit] [PubMed]
- Rodrigo, M.A. Wetland restoration with hydrophytes: A Review. Plants 2021, 10, 1035. [Google Scholar] [CrossRef] [Scilit] [PubMed]

Disclaimer/Publisher’s Note: The statements, opinions and data contained in all publications are solely those of the individual author(s) and contributor(s) and not of MDPI and/or the editor(s). MDPI and/or the editor(s) disclaim responsibility for any injury to people or property resulting from any ideas, methods, instructions or products referred to in the content. |
© 2026 by the authors. Licensee MDPI, Basel, Switzerland. This article is an open access article distributed under the terms and conditions of the Creative Commons Attribution (CC BY) license.