


Abstract
Urbanization and agricultural expansion have led to widespread habitat loss and fragmentation, profoundly altering avian community structure. To understand how different habitat types shape bird diversity and assembly rules, we investigated bird communities across four major habitats (farmland, forest, urban, and wetland) in Henan province. Our results showed that wetland habitats supported the highest species richness, while forest habitats exhibited the highest Shannon–Wiener diversity and evenness. Rarefaction curves indicated that wetland and forest communities harbored the greatest species diversity even with increased sampling effort, while farmland communities showed early saturation. Venn diagram analysis revealed that 30.0% of species were unique to wetlands, 25.0% to forests, 8.3% to urban areas, and only 5.0% to farmland, with limited species overlap across habitats. Rank-abundance distribution (RAD) models varied significantly by habitat: the lognormal distribution best described farmland communities, preemption fit forest and wetland communities, and the Mandelbrot distribution best fit urban communities. Indicator species analysis identified Spilopelia chinensis as a significant indicator for farmland habitats (Indicator Value = 0.938, p < 0.01), reflecting its strong association with open agricultural landscapes. NMDS ordination (Stress = 0.152) showed partial overlap in community composition across habitats, while redundancy analysis (RDA) revealed that longitude (15.3% variance explained), latitude, altitude, and temperature collectively shaped bird community structure. These findings highlight that habitat type is a key driver of avian diversity and community assembly, with forests and wetlands serving as critical refuges for diverse bird communities. Urban and farmland habitats, while supporting lower diversity, host specialized species adapted to human-altered conditions. Our study emphasizes the need for multi-habitat conservation strategies to maintain avian biodiversity in fragmented landscapes.
1. Introduction
Birds are sensitive and widely used indicators of ecosystem health and habitat alteration, as their community structure, species diversity, and functional traits are strongly shaped by land-use change and anthropogenic disturbance [1,2]. Across temperate and subtropical regions, forest, farmland, urban, and wetland habitats form the dominant landscape matrix, each imposing distinct environmental filters that drive differences in avian assemblages [3,4]. Understanding how bird communities diverge across these four major habitat types is essential for biodiversity conservation and landscape management under global change.
Forests provide complex vertical vegetation structures, stable microclimates, and abundant food resources, supporting high species richness and specialized forest-dependent birds [4]. Recent studies show that forest bird communities are primarily structured by vegetation complexity and elevation; however, habitat fragmentation and climate change are driving declines of forest specialists [1].
Farmland, as one of the most extensive human-modified ecosystems, supports a distinct avifauna adapted to open landscapes and agricultural resources [2]. While low-intensity farming can maintain moderate bird diversity [5], intensive agriculture—including monocropping, pesticide application, and frequent disturbance—reduces species richness and filters out sensitive taxa [6]. Farmland bird populations are declining globally, and their responses to combined land-use and climatic drivers require further regional investigation.
Urban ecosystems represent highly modified environments, characterized by built-up areas, fragmented green spaces, and chronic human disturbance [3]. Urbanization acts as a strong ecological filter, eliminating sensitive species and favoring a small set of adaptable generalists, leading to reduced community complexity and functional homogenization [7,8]. Despite growing research on urban bird communities, the mechanisms driving their assembly across urban–rural gradients remain poorly understood, especially in rapidly urbanizing regions.
Wetlands are among the most productive ecosystems, supporting diverse waterbirds and wetland-associated species due to high resource availability and specialized microhabitats [2]. Wetland bird communities are often dominated by a few abundant species and are highly vulnerable to habitat loss, degradation, and surrounding land-use changes [9,10]. Most existing studies focus on single wetlands or waterbird assemblages, with limited comparative analyses across wetlands and other terrestrial habitat types.
Although numerous studies have examined bird communities in individual habitat types, most focus on only one or two ecosystems, lacking systematic comparisons across forest, farmland, urban, and wetland habitats within the same regional landscape [3,4]. Furthermore, few studies integrate community structure, environmental drivers, and protected area effects to explore avian assembly rules across multiple habitats. This gap hinders the development of effective conservation strategies for regional avian diversity.
In this study, we conducted standardized bird surveys across four typical habitat types (forest, farmland, urban, wetland). Our objectives were to (1) compare avian diversity, species composition, and abundance patterns across the four habitat types; and (2) quantify the effects of environmental variables (longitude, latitude and temperature) on bird community structure. This study aimed to provide more scientific insights for avian conservation and landscape planning in heterogeneous landscapes.
2. Materials and Methods
2.1. Study Area and Site Selection
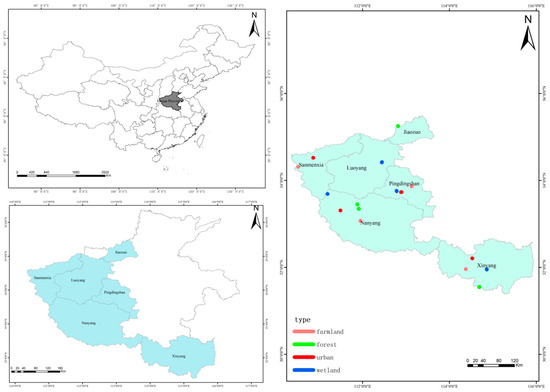
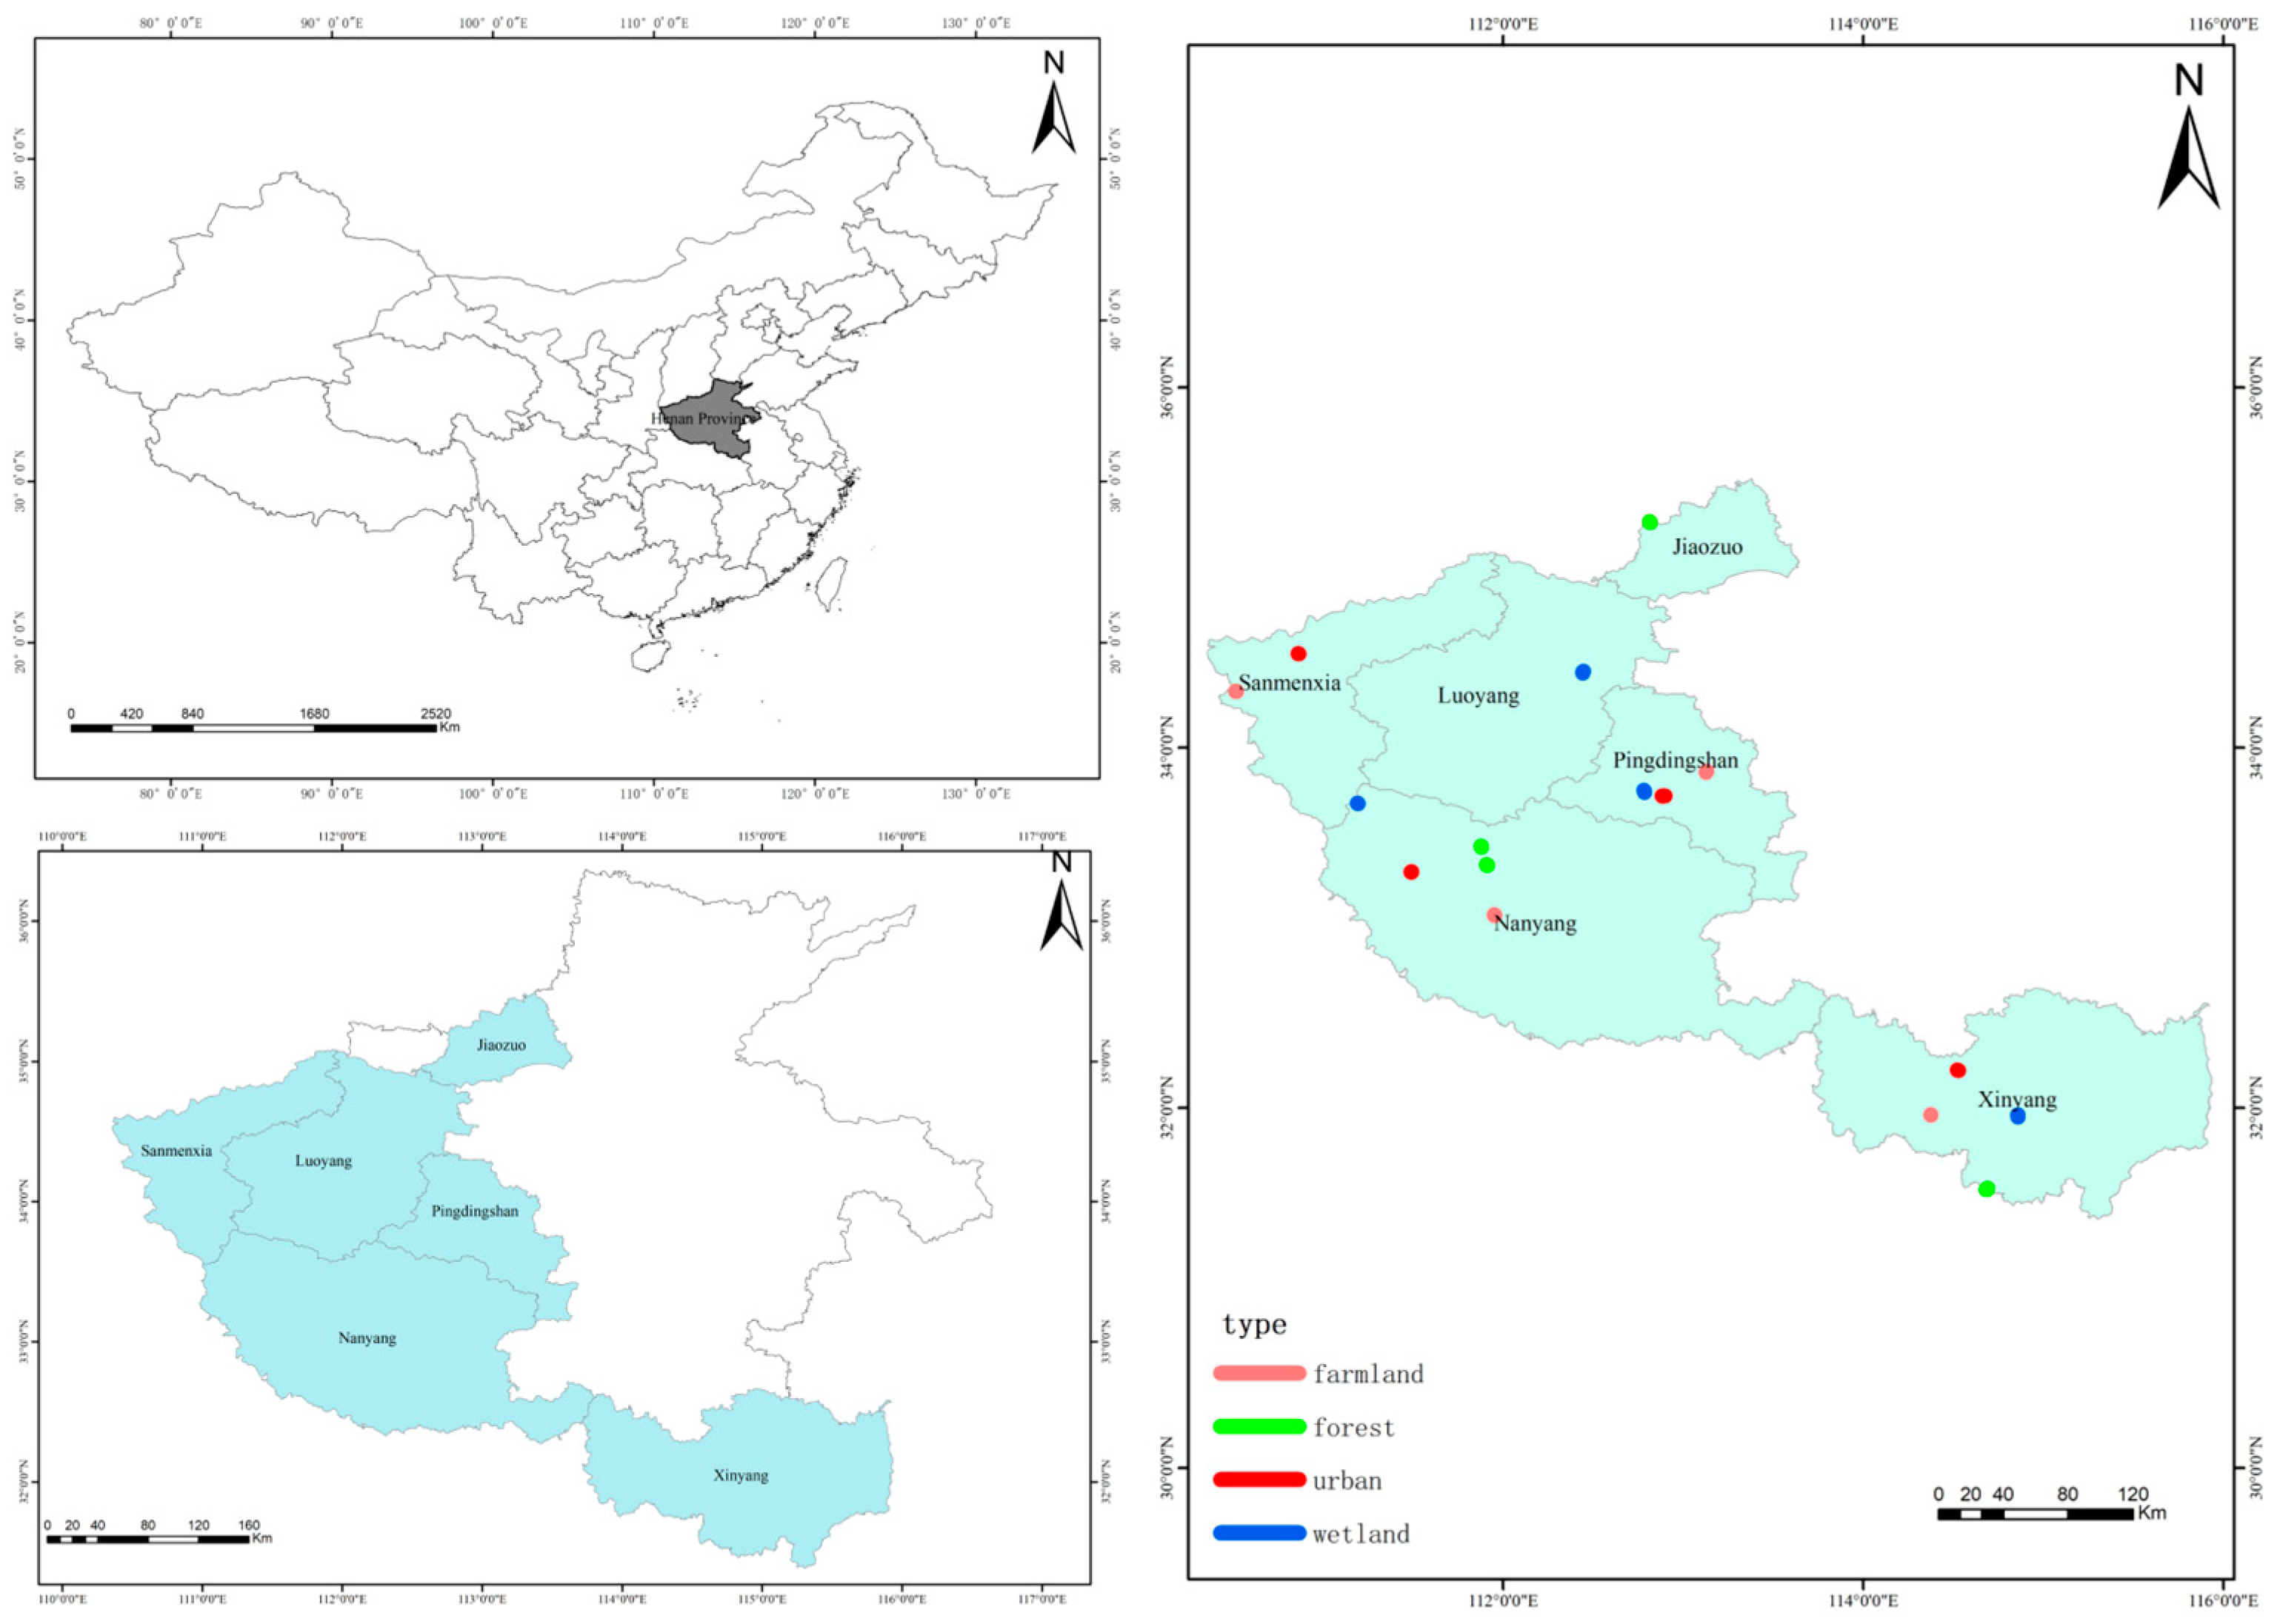
The study area is in Henan province (31°23′–36°22′ N, 110°21′–116°39′ E), the central region of China. It has a continental monsoon climate. The annual average temperature is 15.1–15.9 °C, the annual average precipitation is 512.6–1129.1 mm, the annual average sunshine duration is 1774.5–2024.1 h, and the frost-free period throughout the year is 201–285 days. It is suitable for the growth of various crops. Henan Province has 493 species of birds, accounting for nearly 1/3 of China’s bird species. A total of 4 habitat types (farmland, forest, wetland and urban) were selected, each consisting of 4 transects (16 in total). The sites are mapped in Figure 1. More detailed information of each transect is provided in Table S1. These transects belong to different cities and their information is provided in Table S2.
Figure 1.
Spatial map of four habitat types.
2.2. Bird Field Survey
Bird community surveys were conducted using the variable distance line transect method [11]. Bird field surveys were conducted in August 2025. For study sites containing protected areas, line transects were arranged both inside and outside the protected zones. One transect was established in each sampling site, covering different habitats and altitudes as much as possible. The length of each transect was set 1–3 km. All surveys were performed on foot at a steady speed of 1.5 to 3 km/h by observers on sunny days with clear weather (no heavy rain, fog, or strong winds. Observers recorded bird species, population abundance and habitat characteristics (including longitude, latitude, altitude and temperature) within three distance bands (0–25 m, 25–100 m, and beyond 100 m) on both sides of the transects. All flying birds observed along transects were also recorded in the field. The monitoring periods were selected when birds were most active: 5:00–9:00 in the early morning and 16:00–20:00 in the afternoon. All the detected bird species are provided in Table S3.
2.3. Statistical Analyses
All statistical analyses were performed using R software (version 4.2.3) with the vegan, ggplot2, dplyr, and tidyr packages. Bird community data were organized into a site-by-species abundance matrix based on individual counts recorded across transect surveys. Four alpha diversity metrics, including species richness, Shannon–Wiener diversity index, Simpson diversity index, and Pielou evenness index, were calculated to evaluate bird community diversity across the four habitat types. All indices were presented as mean ± standard deviation, and significance levels were set at α = 0.05. Rank-abundance distribution (RAD) can account for differences in abundances among species, and its shape is greatly altered when the abundance of the strong interactor exceeds a threshold density [12]. RADs were fitted to five theoretical models (Null, Preemption, Lognormal, Zipf, Mandelbrot), with model selection based on AIC. One-way ANOVA was applied to test significant differences in diversity indices among habitats. Indicator species analysis was performed to identify habitat specialists. We also performed redundancy analysis (RDA) using Hellinger-transformed bird count data to examine how environmental variables influenced bird community composition across transects. Environmental variables were standardized prior to analysis. Permutation tests (999 permutations) were used to assess the significance of the overall model and individual environmental factors.
3. Results
Among the four habitat types, species richness was highest in wetlands, followed by forest; whereas, farmland and urban areas showed similarly lower values, with urban and wetland habitats exhibiting large standard deviations indicative of high within-habitat variability. The Shannon index was highest in forest, followed by wetland and farmland, and lowest in urban areas. The Simpson index followed a similar pattern, being greatest in forest, intermediate in wetland and farmland, and lowest in urban areas. Pielou evenness was highest in forest, followed by farmland and urban, and lowest in wetland. No significant differences were detected in these indices among the four habitat types (p > 0.05, Table 1).
Table 1.
Species diversity indices in different habitats.
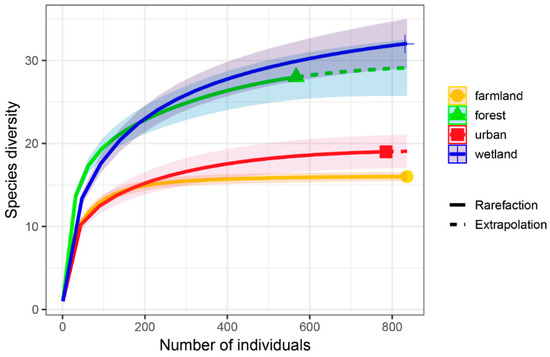
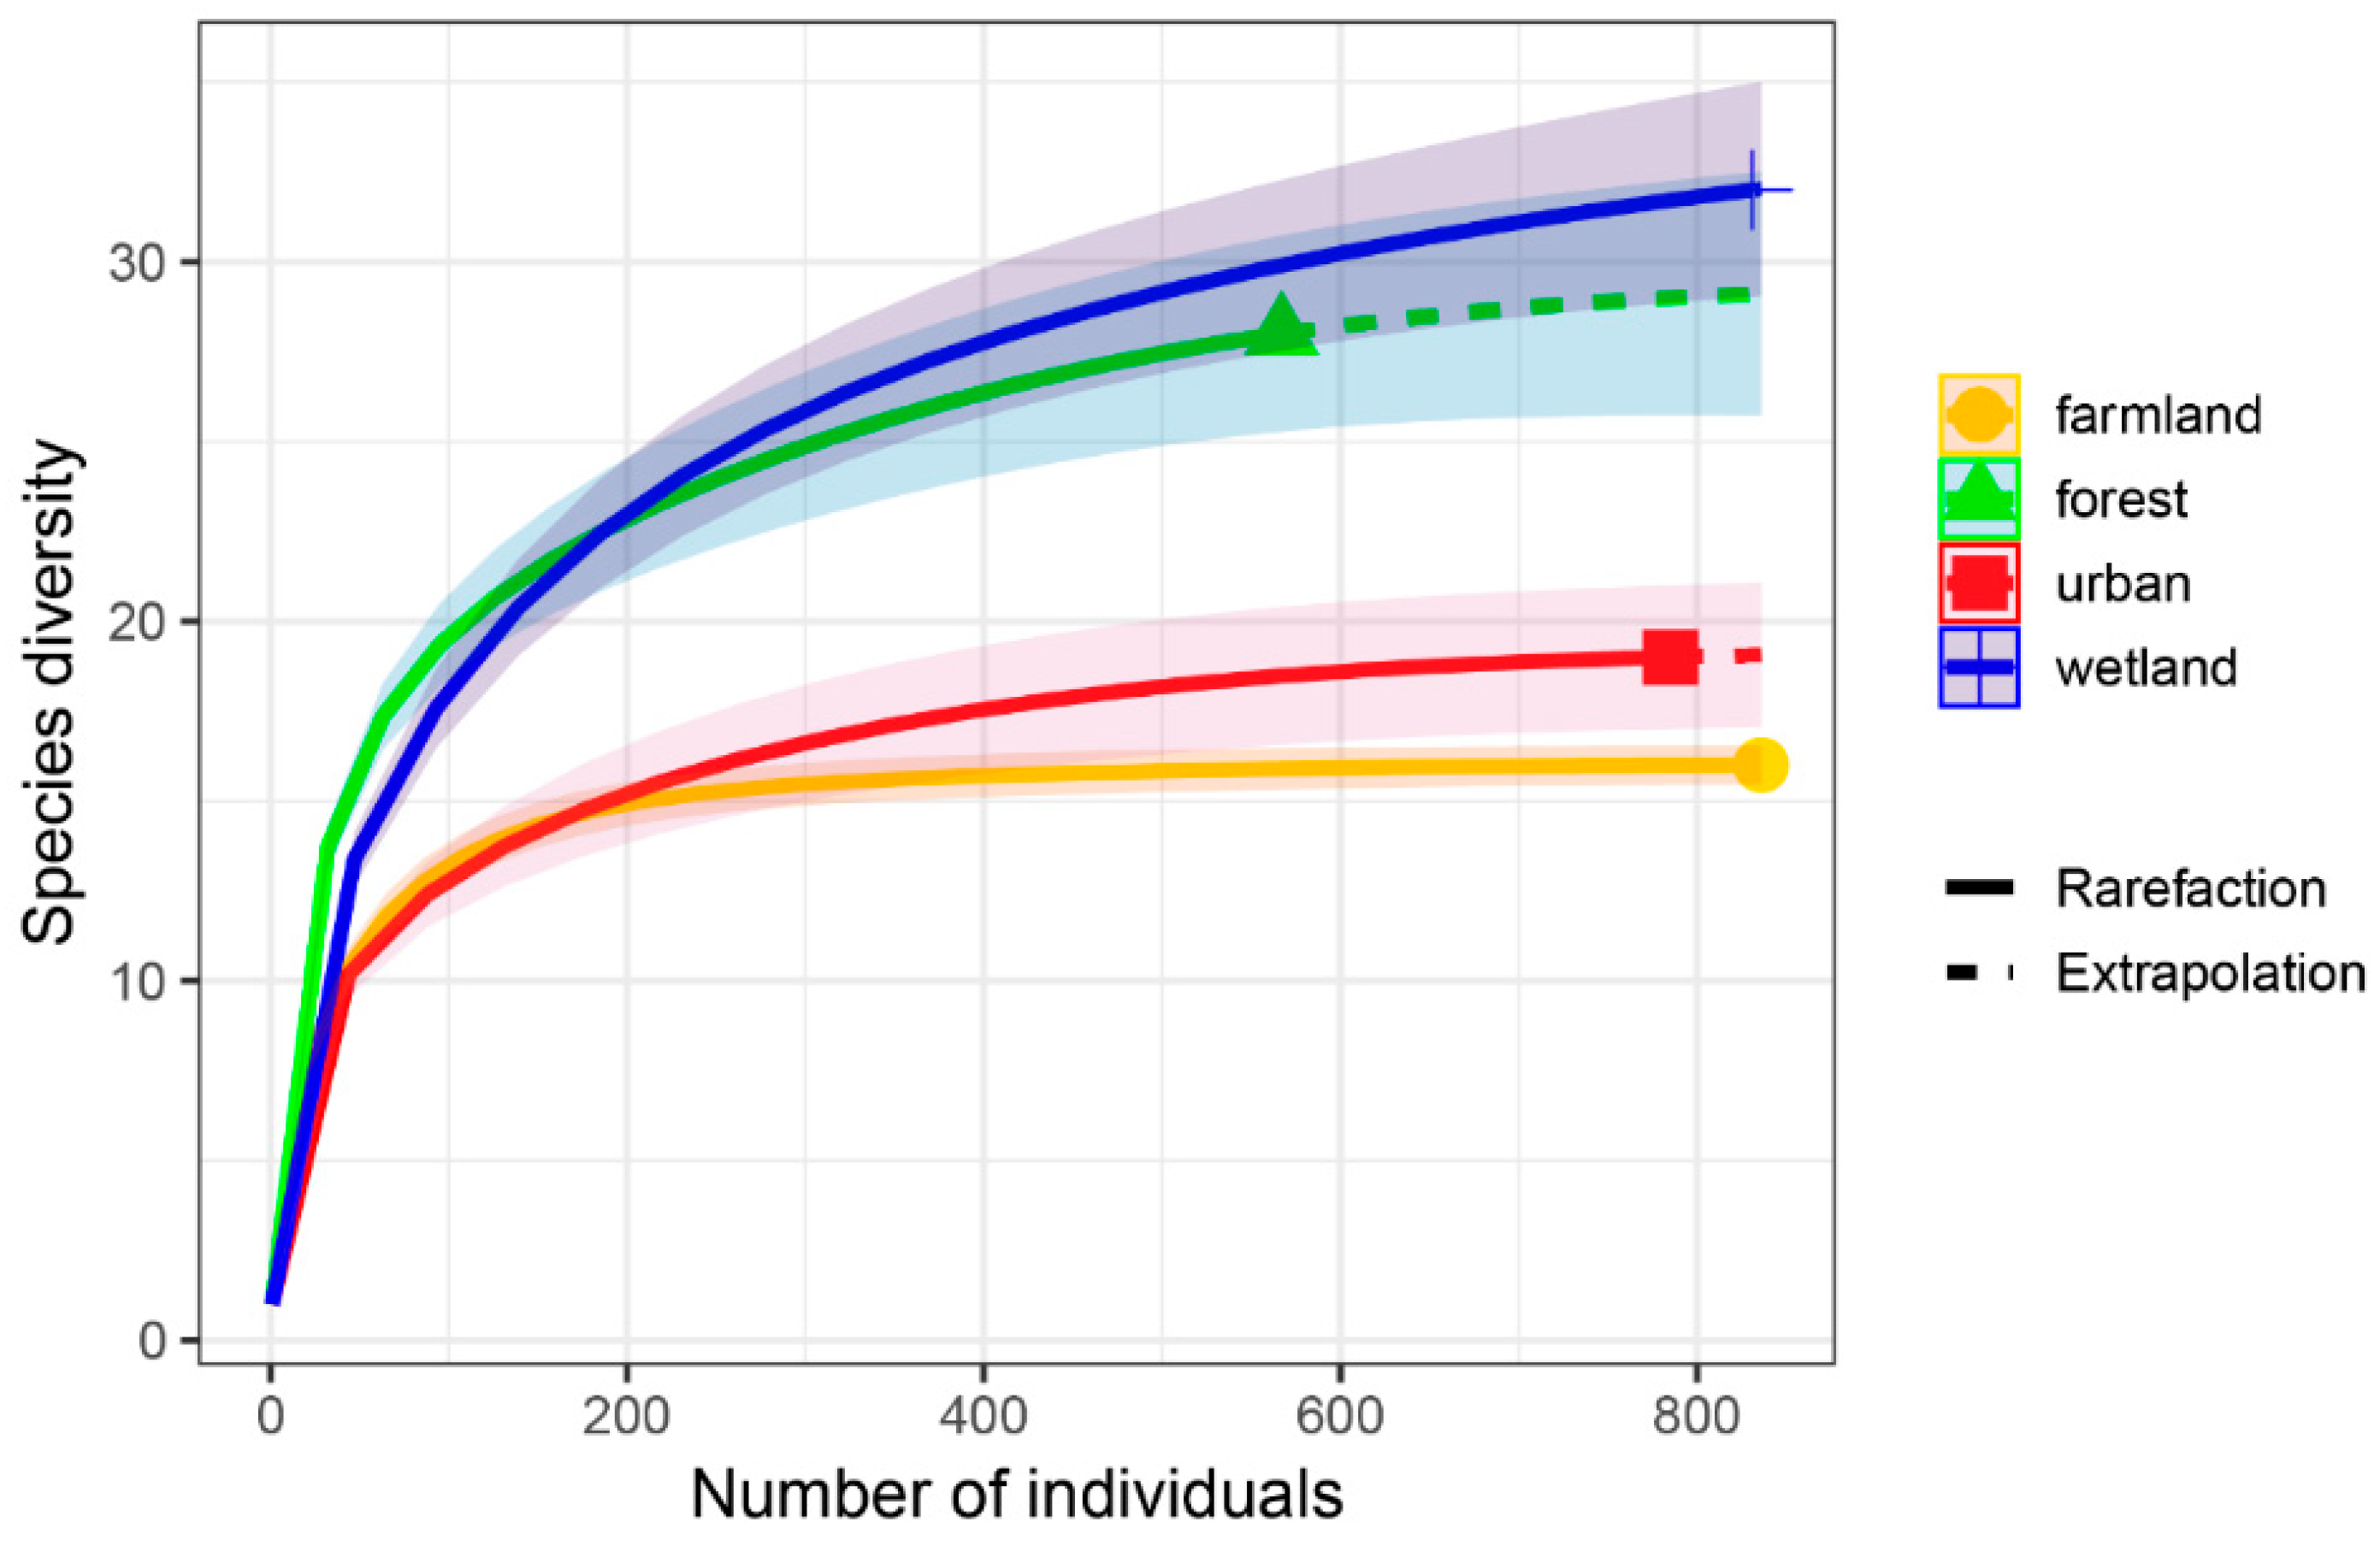
Wetland habitats exhibited the highest species diversity and showed the highest projected richness under extrapolation. Forest habitats followed closely and displayed a high level of diversity. Urban areas had fewer species than natural habitats (wetland and forest), and farmland had the lowest number of species (Figure 2).
Figure 2.
Species accumulation curves across different habitat types.
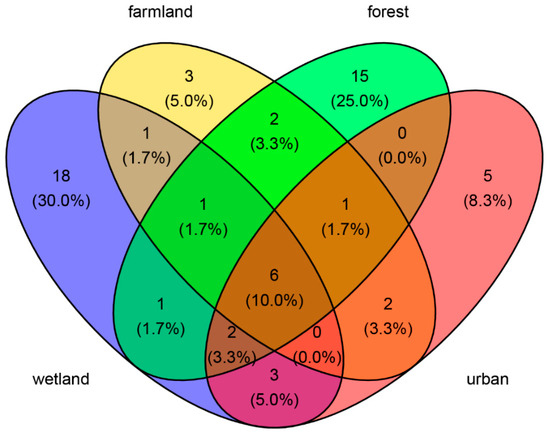
A total of 60 bird species were recorded across all habitats. Only six species were common to all four habitats. Habitat-specific species were most prevalent in wetlands, followed by forest, urban, and farmland.
For species shared by two habitats, farmland and forest shared the highest number of species, followed by farmland and urban (two species, 3.3%). Only one species (1.7%) was shared between wetland and farmland, wetland and forest, and wetland and urban, respectively. No species were shared exclusively between forest and urban habitats.
For species shared by three habitats, two species occurred in wetland, farmland, and urban habitats. One species was shared by farmland, forest, and wetland, and another species was shared by farmland, forest, and urban habitats. No species were shared by wetland, forest, and urban habitats (Figure 3).
Figure 3.
Venn diagram of species overlap among wetland, farmland, forest, and urban habitats. Note: Numbers in each section indicate the count of species, with percentages relative to the total number of recorded species (N = 60) shown in parentheses.
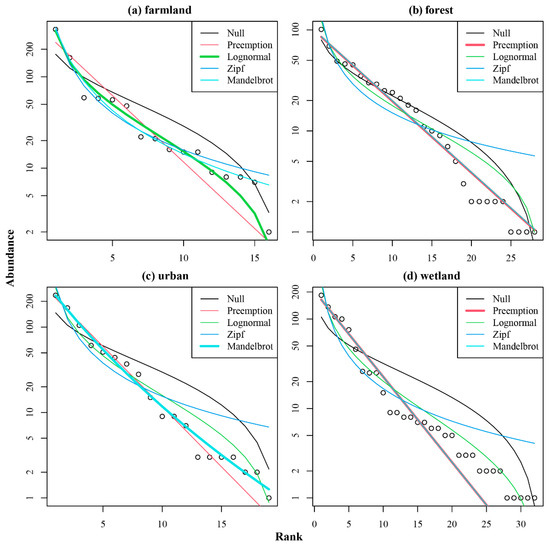
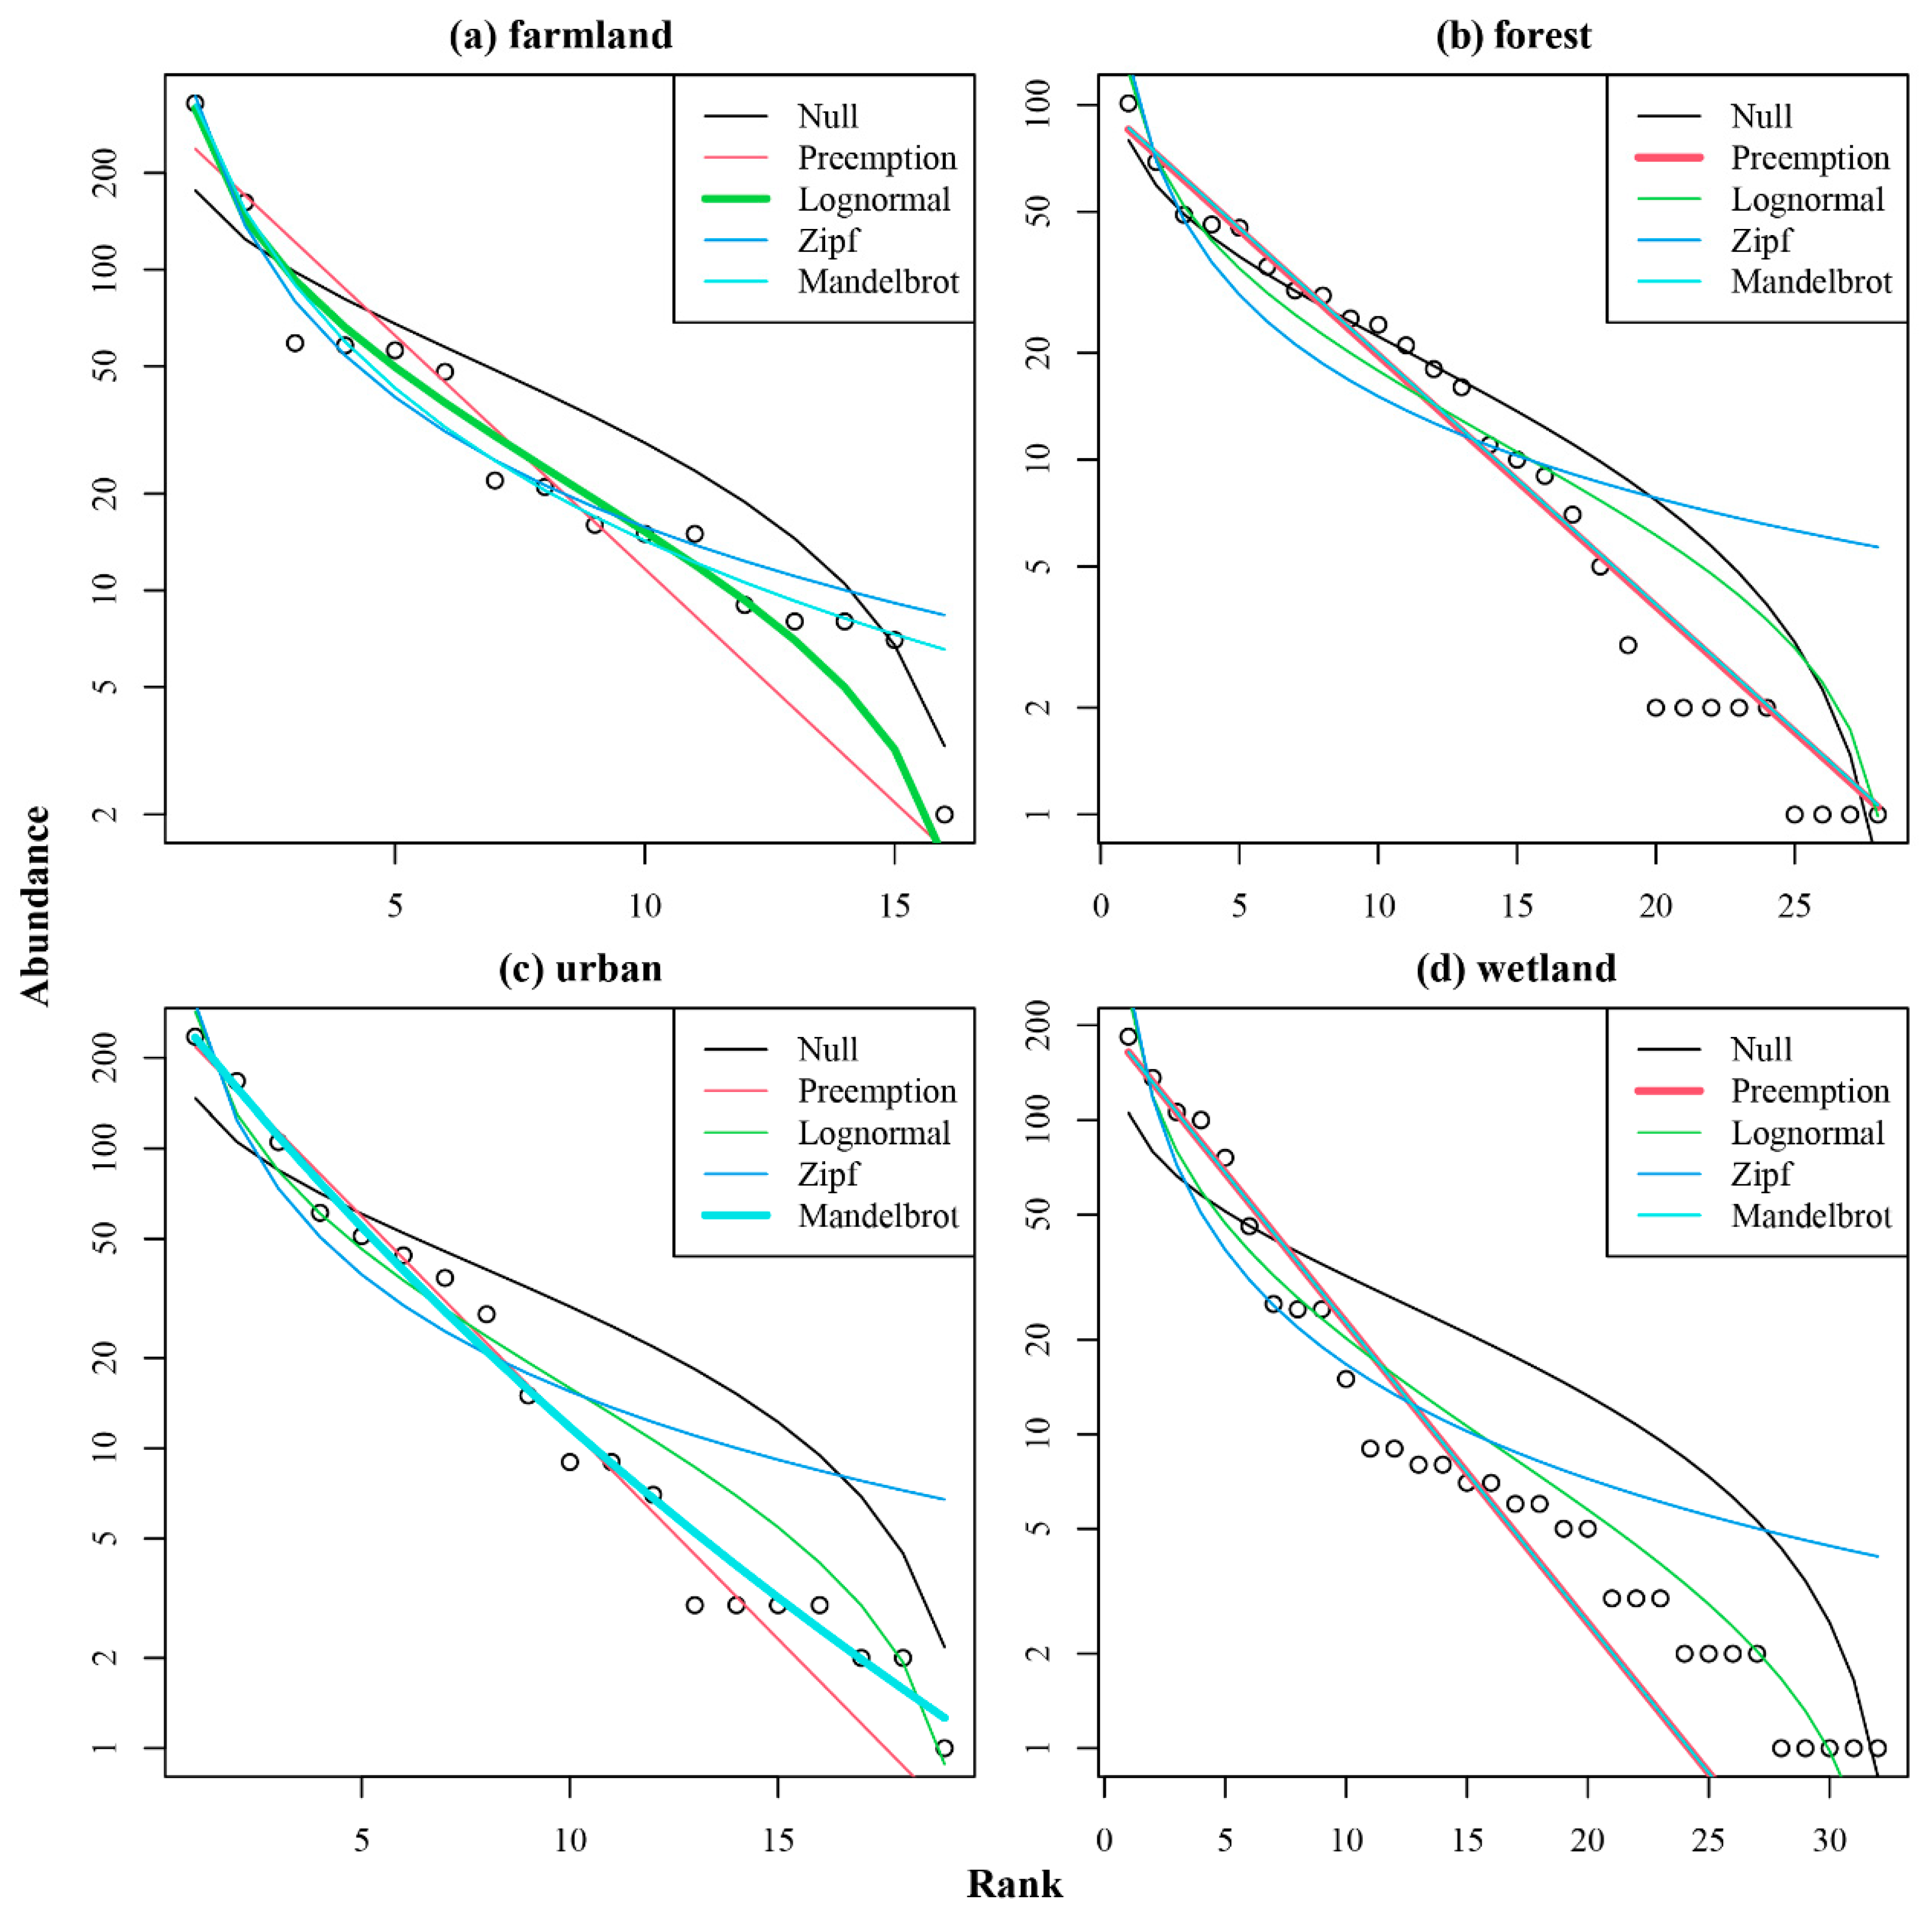
In the forest habitat, the observed species abundance closely followed the lognormal distribution. The farmland community also exhibited a relatively even distribution, with data points fitting the lognormal models, suggesting moderate dominance. In contrast, the urban and wetland habitats showed steeper RAD curves, with better fits to the Mandelbrot and preemption models (Figure 4 and Table 2).
Figure 4.
Rank-abundance distribution (RAD) curves of bird communities in farmland (a), forest (b), urban (c), and wetland (d) habitats, with multiple theoretical model fits. Open circles represent the observed empirical abundance of each bird species ranked from the most to the least abundant, and solid lines represent the fitted results of five theoretical models (Null, Preemption, Lognormal, Zipf, Mandelbrot).
Table 2.
Optimal theoretical models fitted to the Rank-abundance distribution (RAD) curves of bird communities across four habitat types.
Indicator species analysis revealed a single significant indicator species among the 60 recorded bird species across the four habitat types. Specifically, Spilopelia chinensis showed a strong and significant association with the farmland habitat (Table S4). Moreover, PERMANOVA revealed no significant differences in bird community composition among the four habitat types (F = 0.9688, p = 0.548 > 0.05).
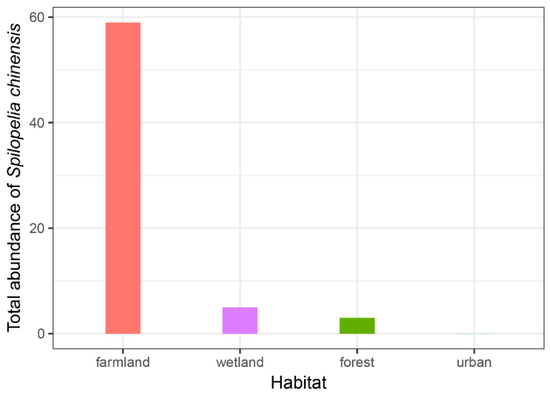
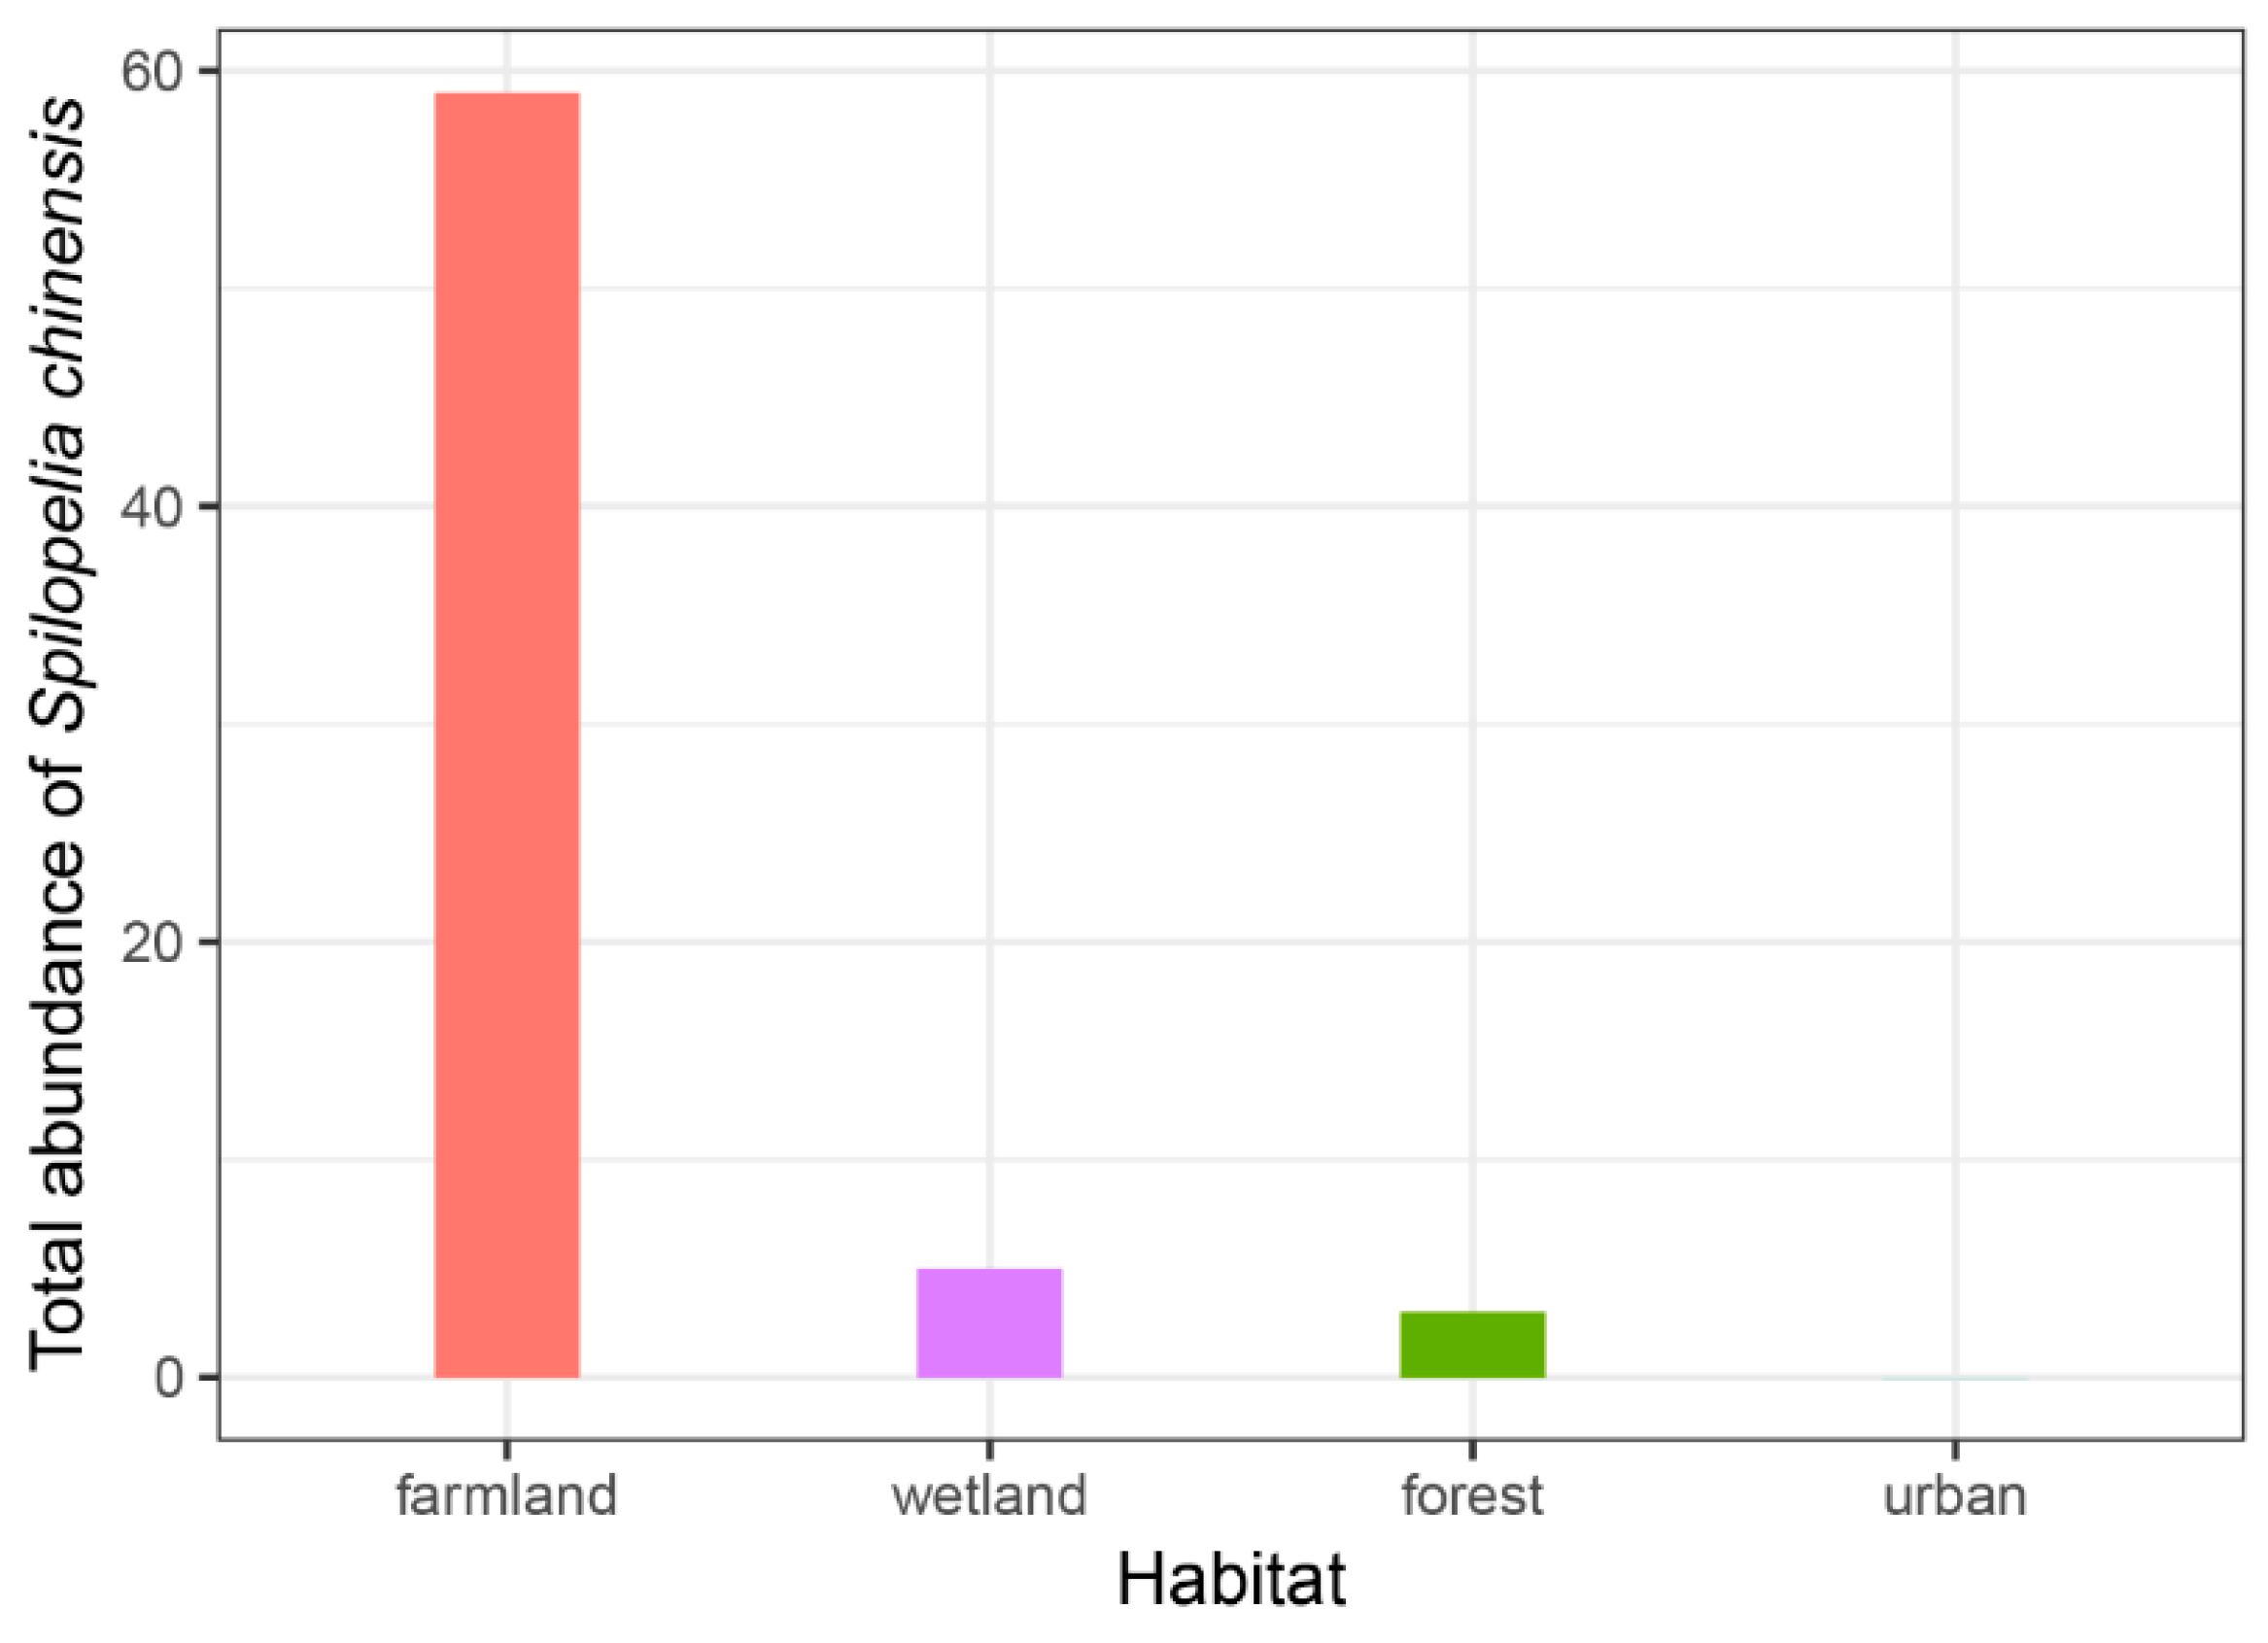
Total abundance of Spilopelia chinensis varied significantly among four habitat types. Farmland exhibited the highest abundance, with 59 individuals, which was markedly higher than that in other habitats. In contrast, the species showed relatively low abundance in wetland (five individuals) and forest (three individuals). Notably, S. chinensis was nearly absent in urban habitats, with a total abundance of zero (Figure 5).
Figure 5.
Abundance of Spilopelia chinensis across habitats.
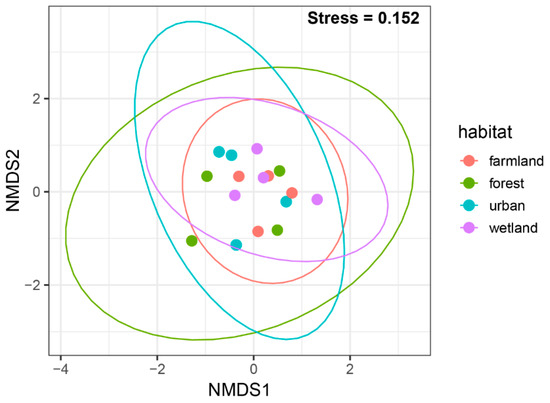
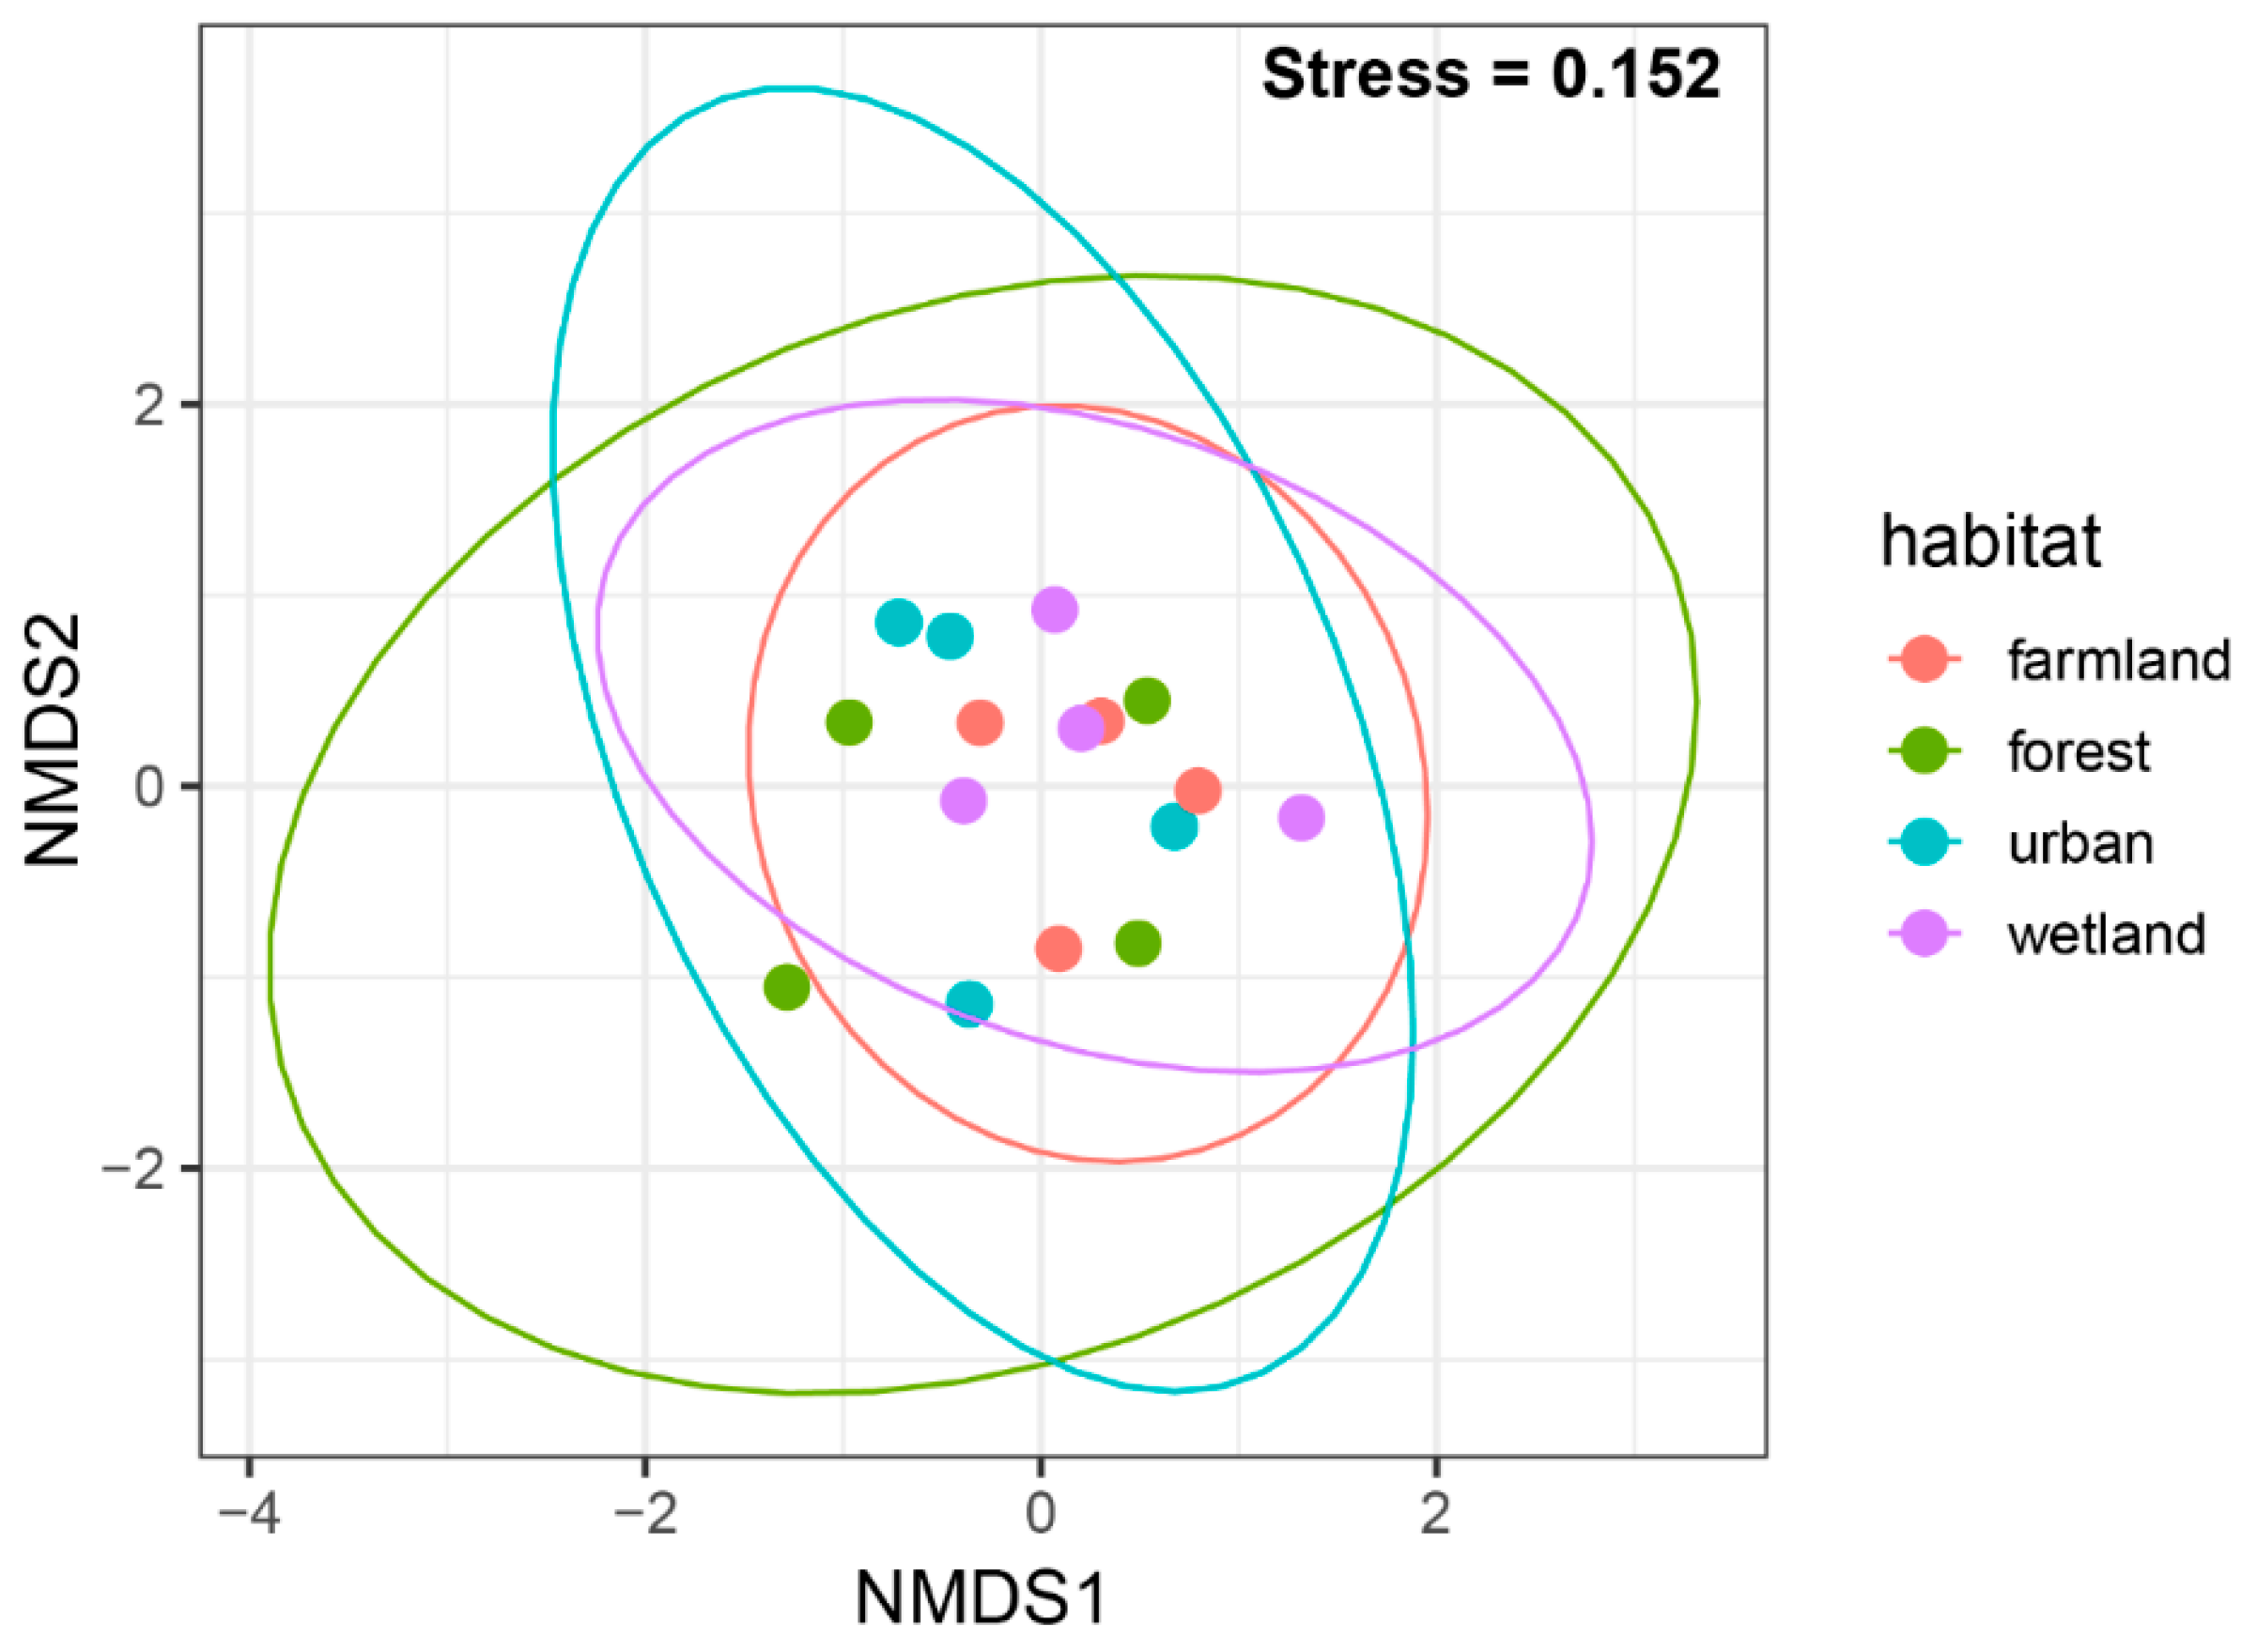
Non-metric multidimensional scaling (NMDS) ordination showed high overlap among bird communities across the four habitats, with no distinct clustering pattern by habitat type. The forest habitat exhibited the largest spread in community composition, indicating higher within-habitat heterogeneity; whereas, the other three habitats showed relatively more concentrated distributions (Figure 6).
Figure 6.
Non-metric multidimensional scaling (NMDS) of bird communities across habitats.
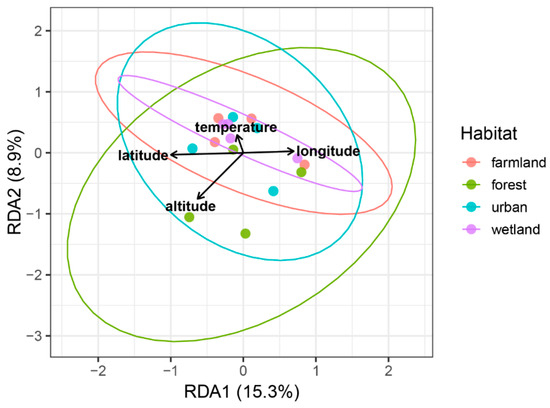
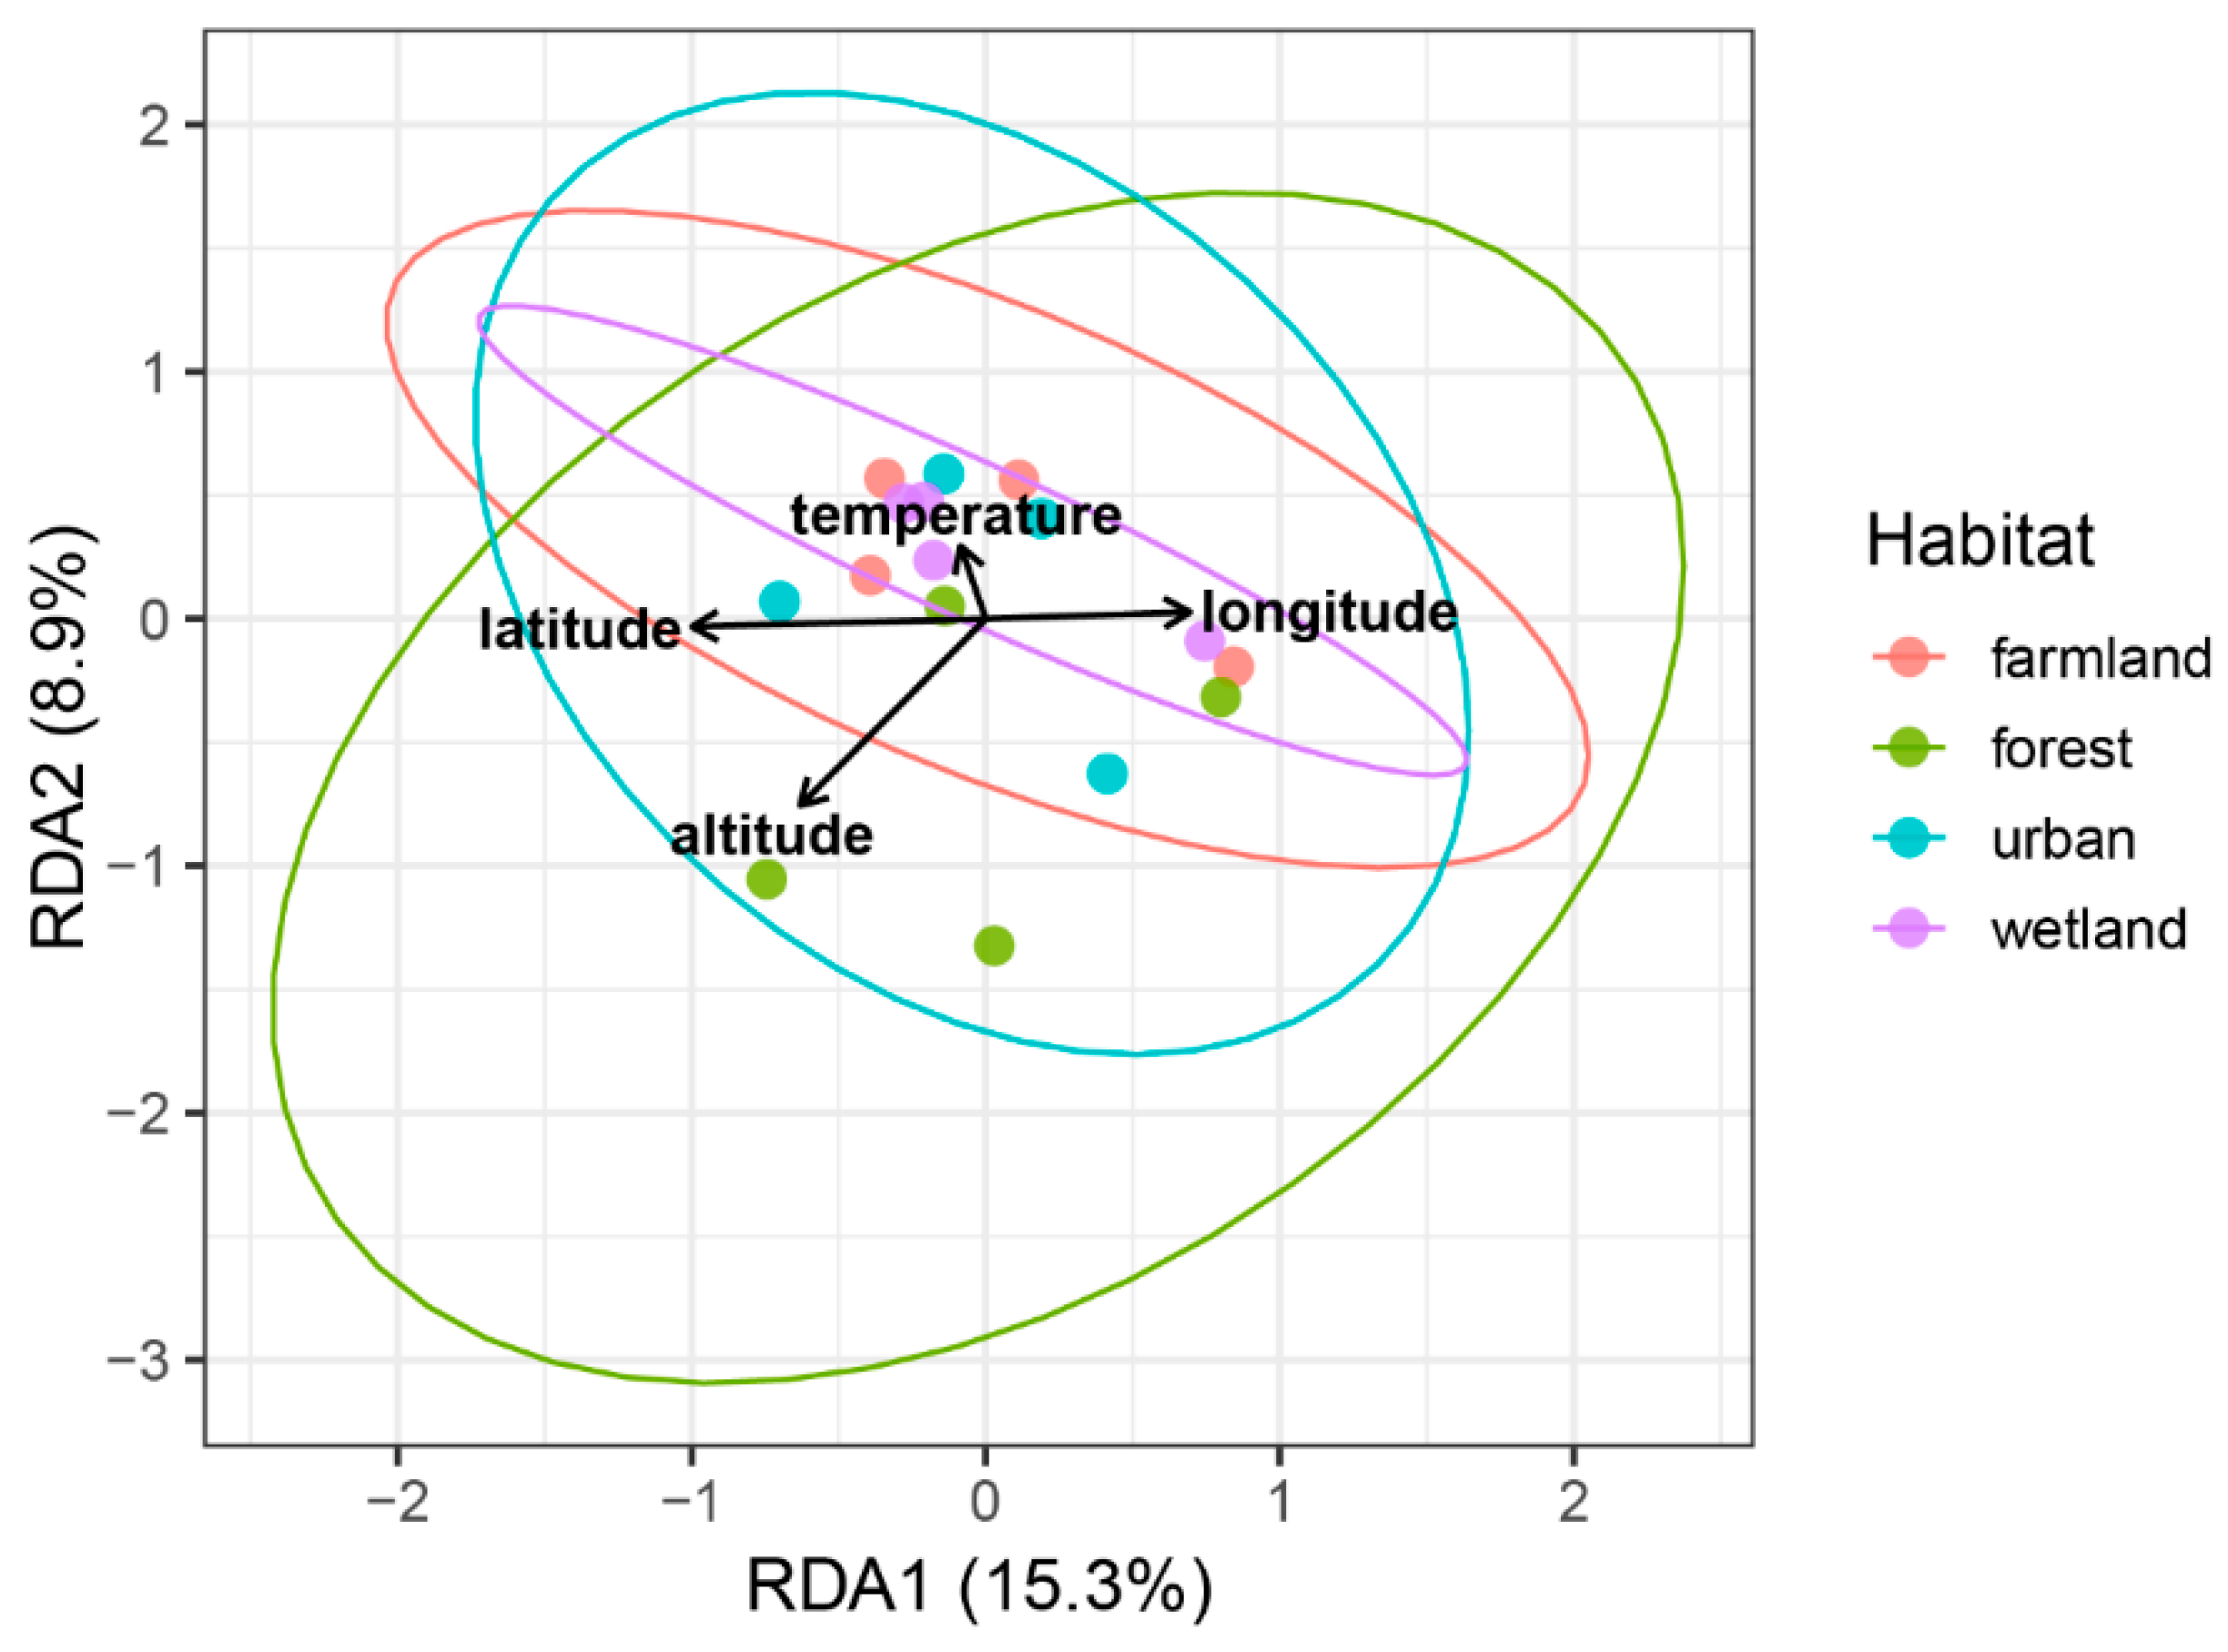
Redundancy analysis (RDA) was applied to quantify the relationships between bird community composition and four environmental variables, namely longitude, latitude, altitude and temperature. Variance partitioning revealed that the explanatory variables together accounted for 32.46% of the total variation in bird assemblages; whereas, the remaining 67.54% was attributed to unconstrained variation. The first two axes explained 15.3% and 8.9% of the total variation in bird community composition, respectively, with a cumulative explanation of 24.2%, suggesting that geographic (longitude, latitude) and topographic (altitude) variables are key drivers shaping bird community distribution. According to the biplot scores of environmental factors, latitude exerted the strongest influence on bird community distribution, followed by longitude and altitude. Temperature showed a relatively weak effect (Figure 7).
Figure 7.
Redundancy analysis (RDA) ordination of bird communities in relation to environmental variables.
4. Discussion
4.1. Habitat-Specific Patterns of Avian Diversity
Our results indicate that natural habitats (forest and wetland) sustained higher avian diversity than habitats subject to intensive anthropogenic disturbance (farmland and urban areas), although none of the pairwise differences in diversity indices reached statistical significance. The rate of new species detection decreased with increasing number of individuals sampled, with all curves approaching an asymptote, indicating that the sampling effort was sufficient to capture the majority of species present in each habitat. The observed differences in diversity among habitats are likely driven by environmental heterogeneity, anthropogenic disturbance, and resource availability [12,13]. Forest habitats exhibited the highest Shannon, Simpson, and Pielou indices, which aligns with the well-documented role of forests as biodiversity hotspots for birds [14]. The Pielou evenness index is a widely used ecological measure that quantifies how evenly individuals are distributed among the species in a community. Higher values suggest a more balanced community, which is often associated with greater stability and resilience [15]. However, in our study these differences were not statistically supported. Another study also showed that natural habitats, especially evergreen and moist forests, support the most diverse and functionally specialized bird communities, while urban and intensively farmed landscapes host more generalist species [16]. This is attributable to their complex vertical stratification, stable microclimate, and abundant food resources [17]. Forests provide diverse niches for species with different ecological requirements, thereby maintaining high species evenness and overall diversity [18]. Recent studies further confirmed that forest structural complexity remains the primary predictor of avian community stability in anthropogenically disturbed landscapes, even under ongoing climate change [19,20].
Wetland habitats had the highest species richness but the lowest Pielou evenness, suggesting a potential richness–evenness trade-off: wetlands support unique water-associated species; yet, abundances among species were highly uneven. Such patterns are consistent with typical wetland bird community structure, where habitat conditions favor a small number of well-adapted species and lead to strong dominance. Wetlands remain ecologically important for supporting waterbirds, especially during migration and wintering periods, and provide distinct resources that contribute to regional bird diversity [21,22].
RAD patterns were obtained by descriptive model fitting using AIC-based selection. It is important to note that this approach does not provide a statistical probability for the goodness-of-fit of any single model; AIC merely compares relative fit among candidate models. Therefore, the observed RAD patterns should be treated as exploratory observations rather than confirmatory evidence. Urban communities showed moderate dominance, likely associated with human-tolerant generalists, while wetland communities exhibited the steepest dominance curve and the lowest evenness, consistent with their low Pielou index. Farmland communities were best fit by a lognormal model, a shape theoretically linked to intermediate disturbance [23,24,25], but this fit does not imply statistical significance. The Mandelbrot (Zipf) fit for urban habitats, dominated by Spilopelia chinensis, aligns with previous reports of steeper RAD curves under disturbance [26]. However, given the descriptive nature of these analyses, the limited sample size (four transects per habitat), and the absence of significant p-values in formal tests, we refrain from attributing these patterns to specific ecological processes with confidence. Our results are preliminary and hypothesis-generating; more extensive replication and formal hypothesis testing are required to validate these trends.
4.2. Indicator Species and Species Overlapping Patterns
Spilopelia chinensis was identified as a highly significant indicator of farmland (Indicator Value = 0.938, p < 0.01), with its total abundance significantly higher in farmland than in other habitats, indicating its high fidelity and specificity to this habitat type. This species can therefore be considered a reliable bioindicator for farmland bird communities in the study area. The observed habitat preference of Spilopelia chinensis highlights the critical role of farmland in supporting its population, while urbanization and closed vegetation habitats appear to limit its distribution. The strikingly high abundance in farmland suggests that this species is highly adapted to agricultural landscapes, likely benefiting from abundant food resources (e.g., crop seeds and grains) and open vegetation structures suitable for ground foraging. This finding aligns with the global pattern that many bird species closely associated with human-modified landscapes thrive in low-intensity agricultural systems, which maintain moderate food availability and low disturbance levels [27]. The low abundance of S. chinensis in wetland and forest habitats indicates that these ecosystems do not provide optimal conditions for the species. Dense vegetation cover in forests may restrict movement and foraging activities, while the specialized environmental conditions of wetlands are inconsistent with their ecological requirements. Similar results were reported by Somveille et al. [28], who found that habitat structure and food resource availability act as key filters shaping bird community composition across land-use intensity gradients. The identification of only one significant indicator species across the four habitat types may be attributed to two main factors. First, PERMANOVA results showed no significant compositional differences between farmland and the other habitats (p > 0.05), indicating that the overall species pools are not statistically different across habitats. This may limit the number of species that exhibit strong habitat fidelity. Second, the limited number of replicate sites (n = 4 per habitat) may have reduced statistical power to detect weaker but ecologically meaningful indicator relationships.
The near absence of S. chinensis in urban areas is particularly noteworthy, reflecting its limited tolerance to high-intensity human disturbance, built-up environments, and fragmented green spaces. This contrasts with urban-adapted bird species and demonstrates that sensitivity to urbanization varies widely among sympatric species. Agricultural intensification and urban sprawl are known to drive declines in bird species richness and to eliminate sensitive taxa, even for species that can utilize farmland habitats [29]. Our results further emphasize that, while farmland serves as a primary habitat for S. chinensis, unregulated urban expansion may pose a persistent threat to its local population by reducing suitable habitat connectivity and availability.
Despite the identification of indicator species in farmland, the ordination space showed a large overlap among farmland, urban, and wetland communities, indicating high similarity in species composition among these habitat types. The limited species overlap among habitats, while ecologically expected, carries important conservation implications. It confirms that each habitat type supports a functionally and compositionally distinct avifauna, meaning that the loss of any single habitat cannot be compensated by the preservation of others. This non-redundancy across habitats underscores the need for a landscape-scale conservation strategy that maintains the full mosaic of habitat types, rather than focusing on a single ‘high-diversity’ site. Furthermore, the fact that only one significant indicator species emerged (as discussed above) suggests that even within distinct habitats, generalists predominate—a warning sign of biotic homogenization that merits further investigation. Across the four examined habitats, only six species were shared, representing a core set of generalist bird taxa that exhibited broad ecological tolerance and high adaptability to diverse landscape conditions. The low proportion of shared species, coupled with the high number of habitat-specific species, indicates that strong habitat filtering operates across different landscape types, leading to significant species turnover. Contemporary research has provided robust evidence for these mechanisms. For instance, Liu et al. [30] demonstrated that species turnover serves as the dominant driver of taxonomic, functional and phylogenetic beta diversity in urban bird communities, with landscape variables outperforming geographic distance in explaining community variation. Deng et al. [31] further revealed that urbanization drives marked biotic homogenization in avian communities across taxonomic, phylogenetic and functional dimensions, showing that multiple-site β-diversity among urban assemblages is substantially lower than that among natural assemblages. Moreover, Parra-Sanchez et al. [32] reported that land-use change causes community turnover through local extinctions and the colonization of disturbance-adapted species, while simultaneously driving biotic homogenization at larger spatial scales.
Taken together, these lines of evidence indicate that the limited overlap in species composition among habitats—together with the high prevalence of habitat specialists and the overall low proportion of generalist species adapted to diverse environments—reflects strong habitat filtering and significant species turnover across different landscape types.
4.3. Community Composition and Environmental Responses
Stress is the core indicator used to evaluate the goodness-of-fit of non-metric multidimensional scaling (NMDS): A stress value < 0.2 indicates reliable ordination performance [33]. Here, Stress = 0.152, meaning the two-dimensional plot adequately reflects the true dissimilarity of bird community composition across habitats, and subsequent interpretation is statistically credible. Extensive overlapping of 95% confidence ellipses across farmland, forest, urban and wetland demonstrates that bird community compositions do not separate distinctly among the four habitat types, with high overall compositional similarity. Such high compositional overlap implies intensive species dispersal and resource cross-utilization among adjacent habitat patches, consistent with previous landscape-scale avian research documenting that frequent inter-habitat bird movement facilitates community convergence within fragmented mixed human-altered landscapes [34].
RDA results revealed that longitude, latitude, altitude, and temperature jointly had a small influence on community differentiation, with 67.54% of variation remaining unexplained. Among these, latitude emerged as the most important environmental factor explaining community variation, while longitude and temperature had limited explanatory power. This suggests that large-scale geographic gradients impose a significant filtering effect on top of local habitat effects. This finding aligns with classic macroecological theory: Hawkins et al. [35] demonstrated that the water–energy dynamics hypothesis provides a powerful framework for explaining latitudinal diversity gradients in birds, primarily through the indirect effects of plant productivity. Altitude and temperature also imposed critical filtering effects on local bird community assembly. Altitude-induced temperature differences directly affect vegetation phenology, resource availability, and species distribution ranges, limiting the colonization of temperature-sensitive bird taxa [36]. From an altitudinal perspective, Körner [37] argued that elevation gradients serve as natural experiment platforms for testing biotic responses to physical factors such as low temperature, and that temperature differences induced by altitude directly affect vegetation phenology, resource availability, and species distribution ranges, thereby limiting the colonization of temperature sensitive bird taxa. In subtropical hilly landscapes, Lin et al. [38] further confirmed that altitudinal climatic filtering and habitat type jointly regulate bird community assembly, with habitat configuration (e.g., mean canopy height and patch sprawl index) significantly influencing bird richness and abundance across elevation gradients. The combined effects of regional geographic climatic background and local habitat characteristics explain the partial community overlap among different habitat types observed in NMDS ordination, indicating that avian community structure is shaped by multi scale environmental filtering.
5. Conclusions
This study demonstrates that habitat type exerts a dominant influence on avian species diversity, community composition, and assembly processes in human-modified landscapes. Wetlands and forests supported the highest species richness and diversity, respectively; whereas, urban and farmland habitats hosted specialized communities with distinct rank-abundance patterns. The significant indicator species Spilopelia chinensis for farmland underscores the role of habitat filtering in shaping species distributions. Environmental factors including geographic location and temperature further structured community variation, reinforcing the importance of both habitat type and landscape context for avian conservation. Collectively, these results advocate for integrated conservation planning that prioritizes wetland and forest habitats while managing human-dominated landscapes to support specialized bird species.
Supplementary Materials
The following supporting information can be downloaded at: https://www.mdpi.com/article/10.3390/d18090502/s1, Table S1: Base information of all the transects; Table S2: Detailed information of different cities; Table S3: All the bird species detected in four habitats; Table S4: Significant indicator species identified for each habitat type based on indicator species analysis.; Table S5: Summary of VIF and permutation test results for RDA; Table S6: Variance partitioning of RDA; Table S7: Biplot scores of environmental variables along RDA axes.
Author Contributions
X.L. and L.P.: conceptualization, methodology, investigation, data curation, and validation. X.L. and B.L.: software, formal analysis, writing, review, and editing. All authors have read and agreed to the published version of the manuscript.
Funding
This research was funded by the Henan Provincial Science and Technology Research and Development Program Joint Fund (Subject Category) Project (252103810092).
Institutional Review Board Statement
Not applicable.
Data Availability Statement
The raw data supporting the conclusions of this article will be made available by the authors on request.
Acknowledgments
During the preparation of this manuscript, the authors used Deepseek (V4) for the purpose of generating text. The authors have reviewed and edited the output and take full responsibility for the content of this publication.
Conflicts of Interest
The authors declare no conflicts of interest.
References
- Callaghan, C.T.; Chase, J.M.; McGlinn, D.J. Anthropogenic Habitat Modification Causes Nonlinear Multiscale Bird Diversity Declines. Ecography 2023, 2024, e06759. [Google Scholar] [CrossRef] [Scilit]
- Arslan, D.; Gaget, E.; Çiçek, K.; Olivier, A.; Galewski, T.; Döndüren, Ö.; Guelmami, A.; Ernoul, L.; Béchet, A. Contrasting Effects of Agriculture and Urbanisation on Bird and Reptile Communities in a Mediterranean Delta (Gediz Delta, Türkiye). BMC Ecol. Evol. 2025, 25, 58. [Google Scholar] [CrossRef] [Scilit] [PubMed]
- Perrin, A.; Schaffner, F.; Christe, P.; Glaizot, O. Relative Effects of Urbanisation, Deforestation, and Agricultural Development on Mosquito Communities. Landsc. Ecol. 2023, 38, 1527–1536. [Google Scholar] [CrossRef] [Scilit] [PubMed]
- Baroni, D.; Hanzelka, J.; Raimondi, T.; Gamba, M.; Brommer, J.E.; Laaksonen, T. Passive Acoustic Survey Reveals the Abundance of a Low-Density Predator and Its Dependency on Mature Forests. Landsc. Ecol. 2023, 38, 1939–1954. [Google Scholar] [CrossRef] [Scilit]
- Mao, R.; Zhang, D.; Zhou, Q.; Wang, Y.; Zhang, L. Effects of Land Use Change on Avian Diversity in the Semi-Arid Area of Longxi Loess Plateau. Diversity 2024, 16, 235. [Google Scholar] [CrossRef] [Scilit]
- Liao, J.; Zhang, T.; He, X.; Zhang, P.; Ran, J. Effects of Agricultural Intensity and Landscape Pattern on Terrestrial Birds in China’s Agroecosystem Differ between Temperature Zones. Biol. Conserv. 2024, 300, 110876. [Google Scholar] [CrossRef] [Scilit]
- Gong, L.; Wang, L.; Yao, Y.; Wu, L.; Wang, S.; Tan, B.; Yuan, H.; Hu, R. Integrity and Size of Green Spaces Are Critical for the Functional Diversity of Birds: Evidence from the Eastern and Northwestern Regions of China. Chin. Geogr. Sci. 2024, 34, 1073–1089. [Google Scholar] [CrossRef] [Scilit]
- Zhang, W.; Zhao, S.; Yang, X.; Tian, J.; Wang, X.; Chen, D.; Yu, Y.; Shi, J.; Cui, P.; Li, C. Effects of Land Cover on the Taxonomic and Functional Diversity of the Bird Communities on an Urban Subtropical Mountain. Diversity 2024, 16, 107. [Google Scholar] [CrossRef] [Scilit]
- Zhang, H.; Xiao, L.; Zhao, Z.; Yin, S.; Zhang, Y. Importance of Surrounding Landscape Features in Explaining Wintering Waterbird Diversity and Community Assembly in Jiangsu’s Inland Lake Wetlands. Avian Res. 2025, 16, 100295. [Google Scholar] [CrossRef] [Scilit]
- Li, L.; Liu, Y.; Wang, H.; Zhu, Y.; Li, Y.; Xu, C.; Teng, S.N. Effects of Surrounding Landscape Context on Threatened Wetland Bird Diversity at the Global Scale. Diversity 2024, 16, 738. [Google Scholar] [CrossRef] [Scilit]
- Wu, Z.; Ding, Z.; Zhou, Z.; Liang, J.; Wang, Z.; Zhang, Y.; Hu, Y.; Hu, H. Development Status and Document Analysis: A Review on Terrestrial Vertebrate Field Surveys in China. Biodivers. Sci. 2023, 31, 22363. [Google Scholar] [CrossRef] [Scilit]
- Tilman, D.; Reich, P.B.; Knops, J.; Wedin, D.; Mielke, T.; Lehman, C. Diversity and Productivity in a Long-Term Grassland Experiment. Science 2001, 294, 843–845. [Google Scholar] [CrossRef] [Scilit] [PubMed]
- Mckinney, M.L. Urbanization, Biodiversity, and Conservation. BioScience 2002, 52, 883–890. [Google Scholar] [CrossRef] [Scilit]
- Newbold, T.; Hudson, L.N.; Hill, S.L.L.; Contu, S.; Lysenko, I.; Senior, R.A.; Börger, L.; Bennett, D.J.; Choimes, A.; Collen, B.; et al. Global Effects of Land Use on Local Terrestrial Biodiversity. Nature 2015, 520, 45–50. [Google Scholar] [CrossRef] [Scilit] [PubMed]
- Pielou, E. The Measurement of Diversity in Different Types of Biological Collections. J. Theor. Biol. 1966, 13, 131–144. [Google Scholar] [CrossRef] [Scilit]
- Lu, X.; Jia, Y.; Wang, Y. The Effect of Landscape Composition, Complexity, and Heterogeneity on Bird Richness: A Systematic Review and Meta-Analysis on a Global Scale. Landsc. Ecol. 2024, 39, 132. [Google Scholar] [CrossRef] [Scilit]
- MacArthur, R.H.; MacArthur, J.W. On Bird Species Diversity. Ecology 1961, 42, 594–598. [Google Scholar] [CrossRef] [Scilit]
- Tews, J.; Brose, U.; Grimm, V.; Tielbörger, K.; Wichmann, M.C.; Schwager, M.; Jeltsch, F. Animal Species Diversity Driven by Habitat Heterogeneity/Diversity: The Importance of Keystone Structures. J. Biogeogr. 2003, 31, 79–92. [Google Scholar] [CrossRef] [Scilit]
- Cooper, W.J.; McShea, W.J.; Songer, M.; Huang, Q.; Luther, D.A. Harmonizing Spatial Scales and Ecological Theories to Predict Avian Richness and Functional Diversity within Forest Ecosystems. Proc. R. Soc. B Biol. Sci. 2023, 290, 20230742. [Google Scholar] [CrossRef] [Scilit] [PubMed]
- Grinde, A.R.; Kovalenko, K.E.; Joyce, M.J.; Slesak, R.A.; Windmuller-Campione, M.A. Forest Structure Drives Avian Diversity in Boreal Peatland Forests. J. For. 2026. [Google Scholar] [CrossRef] [Scilit]
- Li, B.; Zhang, S.; Guo, J.; Ma, S.; Zhang, W. The Taxonomic, Functional and Phylogenetic Diversity of Birds in Xiaohongxiang Wetland, Southwest China. Biodivers. Data J. 2024, 12, e136248. [Google Scholar] [CrossRef] [Scilit] [PubMed]
- Chen, Y.; Awais Rasool, M.; Hussain, S.; Meng, S.; Yao, Y.; Wang, X.; Liu, Y. Bird Community Structure Is Driven by Urbanization Level, Blue-Green Infrastructure Configuration and Precision Farming in Taizhou, China. Sci. Total Environ. 2023, 859, 160096. [Google Scholar] [CrossRef] [Scilit] [PubMed]
- Sugihara, G. Minimal Community Structure: An Explanation of Species Abundance Patterns. Am. Nat. 1980, 116, 770–787. [Google Scholar] [CrossRef] [Scilit] [PubMed]
- Preston, F.W. The Commonness, and Rarity, of Species. Ecology 1948, 29, 254–283. [Google Scholar] [CrossRef] [Scilit]
- Hill, J.K.; Hamer, K.C. Using Species Abundance Models as Indicators of Habitat Disturbance in Tropical Forests. J. Appl. Ecol. 1998, 35, 458–460. [Google Scholar] [CrossRef] [Scilit]
- Mac Nally, R.; McAlpine, C.A.; Possingham, H.P.; Maron, M. The Control of Rank-Abundance Distributions by a Competitive Despotic Species. Oecologia 2014, 176, 849–857. [Google Scholar] [CrossRef] [Scilit] [PubMed]
- Tanentzap, A.J.; Huang, C.; Zhou, K.; Huang, Y.; Fan, P.; Liu, Y.; Lee, T.M. Insights into the Coexistence of Birds and Humans in Cropland through Meta-Analyses of Bird Exclosure Studies, Crop Loss Mitigation Experiments, and Social Surveys. PLoS Biol. 2023, 21, e3002166. [Google Scholar] [CrossRef] [Scilit] [PubMed]
- Somveille, M.; Grainger-Hull, J.; Ferguson, N.; Sethi, S.S.; González-García, F.; Chassagnon, V.; Oktem, C.; Disney, M.; López Bautista, G.; Vandermeer, J.; et al. Consistent and Scalable Monitoring of Birds and Habitats Along a Coffee Production Intensity Gradient. Remote Sens. Ecol. Conserv. 2025, 11, 686–700. [Google Scholar] [CrossRef] [Scilit]
- Gioiosa, M.; Spada, A.; Cammerino, A.R.B.; Ingaramo, M.; Monteleone, M. Can Agriculture Conserve Biodiversity? Structural Biodiversity Analysis in a Case Study of Wild Bird Communities in Southern Europe. Environments 2025, 12, 129. [Google Scholar] [CrossRef] [Scilit]
- Liu, Y.; Zhu, Y.; Wu, S.; Wang, Y.; Xie, J.; Zhang, K.; Xu, Y. Determinants of Taxonomic, Functional, and Phylogenetic Beta Diversity in Breeding Birds within Urban Remnant Woodlots: Implications for Conservation. Ecol. Evol. 2024, 14, e11426. [Google Scholar] [CrossRef] [Scilit] [PubMed]
- Deng, J.; Zhu, Y.; Luo, Y.; Zhong, Y.; Tu, J.; Yu, J.; He, J. Urbanization Drives Biotic Homogenization of the Avian Community in China. Integr. Zool. 2024, 20, 60–72. [Google Scholar] [CrossRef] [Scilit] [PubMed]
- Parra-Sanchez, E.; Latombe, G.; Mills, S.C.; Socolar, J.B.; Edwards, F.A.; Martinez-Revelo, D.; Perez-Escobar, O.A.; Davies, R.W.; Bousfield, C.G.; Cerullo, G.R.; et al. Tropical Land-Use Change Disrupts Zeta-Diversity across Taxa. Glob. Change Biol. 2025, 31, e70245. [Google Scholar] [CrossRef] [Scilit] [PubMed]
- Clarke, K.R. Non-Parametric Multivariate Analyses of Changes in Community Structure. Aust. J. Ecol. 1993, 18, 117–143. [Google Scholar] [CrossRef] [Scilit]
- McKinney, M.L. Urbanization as a Major Cause of Biotic Homogenization. Biol. Conserv. 2006, 127, 247–260. [Google Scholar] [CrossRef] [Scilit]
- Hawkins, B.A.; Field, R.; Cornell, H.V.; Currie, D.J.; Guégan, J.-F.; Kaufman, D.M.; Kerr, J.T.; Mittelbach, G.G.; Oberdorff, T.; O’Brien, E.M.; et al. Energy, Water, and Broad-Scale Geographic Patterns of Species Richness. Ecology 2003, 84, 3105–3117. [Google Scholar] [CrossRef] [Scilit]
- Montaño-Centellas, F.A.; Loiselle, B.A.; Tingley, M.W. Ecological Drivers of Avian Community Assembly Along a Tropical Elevation Gradient. Ecography 2020, 44, 574–588. [Google Scholar] [CrossRef] [Scilit]
- Körner, C. The Use of ‘Altitude’ in Ecological Research. Trends Ecol. Evol. 2007, 22, 569–574. [Google Scholar] [CrossRef] [Scilit] [PubMed]
- Lin, H.; Wang, X.; Zhong, M.; Tang, K.; Du, Y.; Xu, H.; Yi, J.; Liu, W.; Hu, J. Elevational Patterns and Assembly Processes of Multifaceted Bird Diversity in a Subtropical Mountain System. J. Biogeogr. 2024, 51, 1276–1289. [Google Scholar] [CrossRef] [Scilit]

Disclaimer/Publisher’s Note: The statements, opinions and data contained in all publications are solely those of the individual author(s) and contributor(s) and not of MDPI and/or the editor(s). MDPI and/or the editor(s) disclaim responsibility for any injury to people or property resulting from any ideas, methods, instructions or products referred to in the content. |
© 2026 by the authors. Licensee MDPI, Basel, Switzerland. This article is an open access article distributed under the terms and conditions of the Creative Commons Attribution (CC BY) license.