


Abstract
Understory vegetation communities in chestnut (Castanea sativa L.) forests feature unique biodiversity patterns and high conservation value, yet the complex drivers of these communities remain poorly quantified. This study investigates the combined effects of structural, microclimatic, and topographic parameters on understory biodiversity in the mountainous region of Chalkidiki, Northern Greece. Using a nested plot design (n = 30), we integrated analytical in situ microclimatic monitoring with hemispherical photography (HemiView canopy image analysis system) to accurately quantify canopy architecture (canopy cover and solar radiation parameters), while a detailed vegetation inventory of vascular plants was performed to determine plant community structure and composition. Generalized Additive Models (GAMs) were employed to model Shannon Diversity (H’) and a weighted rarity index (RSR) representing complementary aspects of understory biodiversity. Our results reveal that the tree slenderness of the dominant stand serves as a robust proxy for stand competition and compactness. Lower slenderness values, reflecting reduced overstory competition, were significantly associated with enhanced light availability and potentially with microclimatic stability, which in turn supported higher levels of species diversity and rarity. Distinct ecological trends were observed between diversity and rarity. Shannon diversity was highest in closed forest environments characterized by lower temperatures, low stand slenderness values, southern aspects, and lower elevations, with the final model explaining 66.1% of the variance (n = 27). In contrast, species rarity was primarily driven by stand slenderness and low disturbance levels (explaining 54.6% of the variance), with the majority of rare species occurring in undisturbed stands (n = 30). These findings suggest that targeted, low-intensity management for competition promotes structurally stable stands and microclimatic buffering, facilitating the preservation of understory biodiversity.
1. Introduction
Understory vegetation in forest ecosystems supports rich plant diversity, while it provides important ecosystem functions and services, such as soil protection, nutrient cycling, food for fauna species, and ecosystem self-regeneration [1]. At the same time, it reflects forest management impacts. Light availability is often cited as the most important factor for plant growth in the understory and the promotion of forest regeneration. The combination of intensity and quantity of light that varies across sites benefits the occupation of these sites by species with different requirements, ultimately promoting biodiversity in forest ecosystems [2]. The amounts of solar radiation reaching the lower levels of a forest stand are interrelated with the structure and density of the upper canopy. Thus, changes in the characteristics and density of the canopy are the most decisive factors in the differentiation of understory plant communities. The special characteristics and the architecture of the canopy directly determine the amount of sunlight that enters the lower levels of stands, while canopy shading simultaneously affects soil moisture levels, resulting in xerophilic species being replaced by shade-tolerant mesophilic species with the densification of the canopy [3,4]. Also, canopy density and the biodiversity of the understory vegetation affect the decomposition rate of organic matter and nutrient cycling through the modification of the ground microclimate. It is noteworthy that the biodiversity of the understory shows a positive correlation with the rates of cellulose decomposition, while at the same time, the rates of organic matter degradation seem to be more dependent on microclimatic variation than the general microclimate [5].
Microclimate disturbance and light intrusion due to forest ecosystem opening favor common photophilous and disturbance-loving species [6]. The hypothesis regarding the presence of maximum biodiversity in sites of medium disturbance (intermediate disturbance hypothesis) seems to be confirmed in many cases and is thus proposed as a measure of biodiversity conservation [7,8,9]. However, in some ecosystems, the relationship between disturbances and biodiversity does not show a clear trend or correlation [10]. The presence of many vegetation layers and the intermixing of trees with different root types leads to the maintenance of soil moisture, while a dense canopy prevents the entry of direct solar radiation, which can cause water stress, and offers great resilience to extreme weather events. Intensive biomass removal in managed forests alters understory plant community composition, favoring heliophilous and drought-tolerant species while rendering ecosystems more susceptible to alien species invasions. At the same time, the ability to self-regulate against climate change may decrease [11]. Furthermore, the negative impacts of anthropogenic disturbances are amplified in ecosystems suffering from drought and water stress, and they have been linked to increased tree mortality [12]. The composition of plant communities is also influenced by site quality, the soil substrate and the physicochemical properties of the soil [13]. Site quality mainly affects indirectly because it determines the distribution of the dominant silvicultural species, which subsequently determines the type and quantity of humus through the presence of dead leaves and the degradation of organic matter [14]. At the same time, the tree species and the stand structure determine, in combination with other topographic factors, the soil temperature and humidity [15,16]. The mixture of forest species and management intensities leads to varying light availability, temperature and humidity, creating microsites that can function as shelters and be occupied by narrow-leaved species [9,17,18,19]. However, in cases of canopy opening through silvicultural interventions, the opening of the canopy should be performed gradually to maintain the intra-forest microenvironment.
To protect forests from climate change, many studies have demonstrated that microclimatic conditions remain stable as long as the upper layers of the canopy remain intact, maintaining the intra-forest environment under the canopy independently of the macroclimate [20]. Denser canopies significantly inhibit the thermophilization of plant communities through the regulation of the forest microclimate [15,21]. At a global level, biodiversity protection focuses on clarifying climate changes in terms of their intensity, frequency and upper limits, as well as their impact on the distribution of species, the resistance and resilience of ecosystems, the spread of diseases and the remodeling of ecosystems.
Even though remote sensing methods and the available digital databases are broadly used for the creation of models and predictions [22,23,24,25], field data are essential, especially in ecosystems where primary data are lacking, or when digital data cannot be used for the research objective. Microenvironmental variables are hard to estimate since they heavily rely on measuring the forest canopy parameters. Respective methods are limited and lack accuracy. For this purpose, important tools and methodologies have been developed, such as the Hemiview system and software, which capture and analyze the characteristics of the forest canopy through hemispherical photographs [26,27,28]. Field data analysis allows the creation of explanatory and predictive regression models or the creation of machine learning models in order to identify and rank the importance of microenvironmental predictors [19,24,29,30,31].
Chestnut (Castanea sativa L.) forests comprise important forest ecosystems in Europe, hosting unique biodiversity patterns and high conservation value, while the complex drivers of these communities remain poorly quantified. Chestnut populations appear to be separated into two distinct genetic population groups corresponding to the eastern chestnut populations in Turkey and Greece and the western populations in Italy and Spain. In particular, the populations of Northern Greece analyzed with microsatellites show similarities to the populations of Western Turkey [32]. In the Balkan Peninsula, favorable conditions for chestnuts occur at 600 to 900 m altitude, corresponding to the thermophilic evergreen oak zone. In Greece, chestnut forests occur at a wider altitude range, indicating that other factors such as soil acidity and microclimate may play a more important role in their spread. Chestnuts generally prefer moist northern and eastern slopes, avoiding southern and western slopes, especially at low altitudes where water availability is decisive. The chestnut tree is a species that co-evolved with humans, as, being an economically important species, it was used in various ways (technical timber, firewood, food for humans, animal feed, etc.) [33].
Chestnut biodiversity is particularly important because these forests are rare, show high floristic diversity and are biogeographically restricted [34]. Chestnut forests are a habitat for pollinators, as 78% of the plant species in European chestnut forests are important for them. Some of the plant species that grow in chestnut forests are usually dispersed by bird species (Crataegus monogyna, Pyrus cordata, Prunus avium, Hedera hibernica, Vaccinium myrtillus, etc.), while ant-eater species (Helleborus foetidus, Melica uniflora, Viola riviniana, Primula grandiflora, etc.) are also common [35]. Reduced rainfall, soil water scarcity, high summer temperatures and prolonged, recurring heat waves are leading to forest necrosis in the Mediterranean basin, making a large part of the area of Mediterranean forests threatened by climate change [36]. It is estimated that at least 10% of Europe’s broadleaf forests will be affected by rising temperatures, but this figure may be significantly higher in Greece, which is at the epicenter of rising temperatures [37]. In particular, the biodiversity of warm Mediterranean forests is predicted to decrease due to increased summer drought, while the biodiversity of cold forests will increase as more species survive the winter frost, and there will be an influx of species from warmer ecosystems [38]. So far, measurements of microclimate in relation to management intensity indicate that extreme values of microclimatic factors are not due to local effects of management measures but to climate changes on a broader scale. Management for the protection of biodiversity can only mitigate the effects of climate change, but cannot eliminate the potential loss of biodiversity and ecosystem functions due to high temperatures and water scarcity [39]. Climate change causes the displacement of species distribution, a phenomenon that concerns researchers around the world and has been studied for many forest species.
Regarding the sustainability of the chestnut tree, climate models show that Greece appears to be the most suitable country for the existence of chestnut habitats [40]. Despite the ideal current climate, forecast models suggest that chestnut populations are significantly threatened by changing climate conditions. Rising temperatures will shift the chestnut tree zone to higher altitudes, reducing the range in which it can find a suitable climate to grow. The reduction in the range of chestnut forests will also lead to a reduction in genetic diversity and, consequently, the adaptability of forests to the upcoming, rapidly changing, new climate conditions [41]. Greek populations will have difficulty adapting to future climate scenarios as they exhibit low expected heterozygosity (He), low to medium allelic diversity (Rs) and the absence of private alleles (PRs), except for one population in central Macedonia (Castanea sativa—GR-02) [42]. In contrast to studies predicting shifting ecotone boundaries, analyses of age groups of American forest populations and their spatial distribution suggest that the response of forest ecosystems to climate change is initially manifested through accelerated population replacement and less through geographic migration, as, up to the time the measurements were made, no clusters of young individuals were observed at the northernmost edge of the species’ distribution. At the same time, in areas with a warmer and wetter climate, populations are replaced more quickly without changing their overall spatial distribution [43]. Many studies in Europe evidence the thermophilization of forest plant communities, as changes in vegetation due to increasing temperatures have already been observed over the last decade. Thermophilic species show greater abundance, and vegetation shows increased height in response to increasing temperatures and light availability [21,44].
Available research in chestnut ecosystems mainly focuses on the socio-economic aspects of chestnut ecosystems by exploring the effects of abandoning traditional practices or the threats presented by phytopathological challenges such as chestnut blight. In this context, biodiversity conservation is mentioned as a side benefit of chestnut management rather than as a primary objective. Although biodiversity-rich areas have been modeled and identified, the underlying mechanisms behind the presence of high-diversity areas and important species have not been described. Particularly, there is a critical knowledge gap regarding how individual species requirements are facilitated through targeted silvicultural measures. To bridge this gap, the current study tests the hypothesis that specific structural configurations promote habitat and microclimatic heterogeneity, thereby maintaining greater understory biodiversity. Investigating the combined effects of structural, microclimatic, and topographic parameters in the natural chestnut ecosystems of mountainous Chalkidiki (Northern Greece), we aim to untangle the specific driving mechanisms that shape these biodiversity patterns. Based on the available literature, we expect that the structuring of understory biodiversity patterns relies on four main hypotheses. Firstly, we believe site topography can greatly impact species communities, with higher species diversity presenting in southern aspects and lower elevations. High altitudes are correlated with colder temperatures, reducing the survival of many species, while northern aspects are dominated by beech individuals, creating unfavorable conditions in the understory. Secondly, we believe that air temperature and humidity are good indicators of the interior buffering effect created by the forest canopy. Extreme values of microclimatic conditions are responsible for species loss; therefore, stands embedded within undisturbed forest cover are expected to present a stronger mitigating effect on temperature and humidity extremes, which are reflected in the species’ communities. Furthermore, we believe that the establishment of species is strongly connected to the light conditions and amount of radiation permeating through the forest canopy and mediated by the higher forest strata. We expect biodiversity to be the highest in stands with multiple well-distributed gaps in the canopy, which allow multiple species with different requirements to grow without enabling the colonization of ruderal and invasive species. Finally, we assume that for the presence and conservation of rare species, the presence of undisturbed mature stands is essential. The detailed study of the above-suggested mechanisms allows for a thorough comparison across many environmental variables. At the same time, collecting data in a wider area of distribution of the species guarantees a large volume of data due to the different origins of the stands while keeping the research area geographically limited so that the determining mechanisms of biodiversity remain stable. Biodiversity was studied both expressed as abundance and species distribution, based on biodiversity indicators, and as biodiversity with conservation value using weighted rarity indicators. Modeling micro-environmental parameters featured the protective role of the forest canopy as a microclimate regulator. Maintaining canopy integrity and healthy stand structure can mitigate the effects of climate change and play a pivotal role in the survival of sensitive understory species. The failures or successes of management practices in forest ecosystems are therefore reflected in current biodiversity patterns and the structure of understory plant communities. The implementation of the models provides critical information for the formulation of specialized silvicultural measures adapted to the needs of each stand type. In this way, the gap between theoretical ecological knowledge and applied forest management is bridged. Focusing on the most decisive silvicultural factors for the microclimate leads to the creation of feasible silvicultural measures aimed at protecting and preserving plant communities and rare species.
2. Materials and Methods
2.1. Study Area
The data collection was conducted in the mountain region of central Chalkidiki in Central Macedonia, Northern Greece (40°25′–40°38′ N, 23°6′–23°44′ E) (Figure 1). Field sampling was conducted from late May to early June of 2024 and 2025 to coincide with peak understory development and canopy growth in the overstory [45,46]. The study area spans a wide altitudinal range with an average elevation of 600 m (a.s.l.). According to the Köppen-Geiger classification, the study area falls into two climatic types: the Hot-Summer Mediterranean (Csa) and Humid Subtropical climate (Cfa). The vegetation belongs to the Quercetalia pubescentis order (Sub-Mediterranean vegetation zone), where chestnut (Castanea sativa L.) stands often form ecotones with oak (Quercus frainetto) and beech (Fagus sylvatica) forests [47]. Chestnut stands in the region are primarily managed as coppice forests or coppice with standards. The applied coppice system originated as a traditional coppice system in Mount Athos. It is characterized by an initial negative thinning at the age of 4 years, where approximately 1/3 of stems per stool are removed, followed by a secondary negative thinning at the age of 7, leaving behind only the highest-quality 4–8 stems per stool. A few years later, a third thinning is conducted at age 12–13, and the final harvest (rotation period) occurs at 20–22 years. While younger stands are generally even-aged due to the above-mentioned silvicultural practices, older stands occasionally exhibit a more complex, mixed-age structure [48] (Figure 2).
Figure 1.
(a) Study area; (b) map of Greece.
Figure 2.
Structural diversity of the studied Castanea sativa stands: (a) Young coppice stand; (b) cultivated chestnut stand featuring a middlestory layer of Abies borisii-regis; (c) mature stand originating from coppice management; (d) chestnut stand neighboring a Fagus sylvatica forest.
2.2. Sampling Design and Vegetation Survey
A total of 30 sampling plots were established in chestnut stands using a targeted sampling design, necessitated by the fragmented and limited distribution of chestnut forests in some parts of the study area. To maximize the ecological variation captured within these limited stands, sampling was stratified across microenvironmental gradients. Plots in close spatial proximity were only selected if they represented distinctly different micro-environments (e.g., contrasting topographic aspects or growth stages), thereby ensuring data independence while capturing local habitat heterogeneity. Each plot covered a minimum area of 400 m2 (20 m × 20 m). To achieve high spatial precision and align vegetation data with the hemispherical photography (described in Section 2.4), a nested plot design was employed. Overstory vegetation was recorded within the entire 20 m × 20 m plot, including all woody species with a height above 5 m. Middlestory was sampled in a 10 m × 10 m sub-plot including all species below the height of 5 m. Similarly, the understory was sampled in a 5 m × 5 m sub-plot including all species below 1 m [49]. Non-vascular plant species were not recorded.
All sub-plots were centered at the main plot’s midpoint. Plant species cover was estimated using the Domin scale in order to be used for the calculation of the Shannon Index [50]. To minimize potential observer bias and maintain strict data consistency and reproducibility across the environmental gradient, all visual estimations were performed exclusively by a single experienced author. Species identification was conducted in the field, while unidentified specimens were collected for further taxonomical evaluation using regional botanical keys and catalogues [51]. When necessary, additional field visits were made for specimen collection and identification purposes. To estimate the quantity of biodiversity per plot, we applied the Shannon diversity index (H’), measuring species entropy. All taxa were aggregated at the species level for diversity analyses. For all species, we created a presence–absence matrix table (0–1) to calculate a specific weight for every species presence i according to Equation (1):
where fi represents the number of plots in which species i occurs. Based on this weighting scheme, a weighted rarity index (hereafter RSR) was computed to quantify the contribution of locally infrequent species to plot-level diversity. The index calculation is shown in Equation (2):
where S is the total number of species recorded within a plot, wi is the weight assigned to species i, based on its frequency (wi = 1/fi), and pij is the presence or absence of species i in plot j.
2.3. Environmental and Microclimatic Variables
Topographic variables such as aspect and inclination were measured in the field in the middle of the plots. For elevation and geographical coordinates, we used a GPS in the field (Garmin Oregon 650).
To capture the biometric characteristics of every stand, we measured the diameter of trees at breast height and the mean height of trees in the overstory. Slenderness and the Gini coefficient of diameters were calculated to assess tree competition and structural heterogeneity. Management forms and practices were recorded as observations.
For the estimation of the microclimate, we recorded three measurements for air and soil temperature and relative humidity in every plot using instruments with sensors (Extech Instruments Type K/J TM100 & Extech Instruments CO2 Meter CO24O, Nashua, NH, USA). Soil temperature was measured under shade in the first 10 cm of soil under the leaf litter [52]. Air temperature and relative humidity were measured at a height of 1–1.5 m after the sensors stabilized [53]. The recorded values were used to calculate temperature and humidity offset by correlating the values of the nearest meteorological stations at the same time and date of measurement. Wind intensity was measured using the Beaufort scale. Measurements were conducted under stable weather conditions and within similar daytime periods to minimize temporal variability.
To assess the stand silvicultural structure, we measured the mean height of overstory trees, the diameter at breast height (DBH) and the Gini coefficient of tree diameters. Furthermore, we calculated the Slenderness Index for every stand according to Equation (3):
Finally, we estimated forest disturbance based on the European Union’s Mapping and Assessment of Ecosystems and their Services (MAES) framework for evaluating ecosystem condition [54], adapting the specific localized pressure indicators as performed by other researchers [55]. Each plot was assigned a score from 1 to 5 based on a holistic evaluation of observed pressures. No mathematical weights were applied to individual parameters. To eliminate inter-observer bias and maintain strict consistency, all ratings were assessed exclusively by a single experienced author. The scoring scale was implemented as follows:
- (Negligible/No Disturbance): Optimally structured stand conditions, no visible signs of anthropogenic pressures or pathogens.
- (Low Disturbance): Minor or localized human presence (e.g., occasional littering) with intact canopy and healthy trees. Minor management interventions needed.
- (Moderate Disturbance): Noticeable structural impacts, such as isolated canopy gaps from past logging or initial signs of tree dieback.
- (High Disturbance): Widespread pressures, including active soil disturbance, visible canopy fragmentation, and prominent localized tree diseases.
- (Severe/Critical Disturbance): Extensive structural degradation across the plot, either characterized by heavy canopy fragmentation, severe dieback, and significant anthropogenic impacts or by overstocked, unmanaged stand conditions leading to intense tree competition, widespread disease, and structural deformities.
2.4. Hemispherical Photographs and Canopy Variables
To accurately capture the canopy structure, we relied on hemispherical photographs. In the middle of the plot, we captured several photographs using a fisheye lens. Photographs with minimal glare and highest clarity were analyzed using HemiView Canopy Analysis Software Version 2.1 SR5 (Delta-T Devices, Cambridge, UK) [56], a common method for studying canopy structure and understory light conditions [57]. Pictures were captured with a digital camera (EOS 1200D, Tokyo, Japan) and an attached circular fisheye lens (Sigma 4.5 mm f/2.8 EX DC HSM Circular Fisheye Lens, Kawasaki, Japan). We set the camera at a height of 1 m above the ground [58]. The camera was leveled and oriented toward magnetic north using a self-leveling base (SLM9). Shutter speed and aperture were set automatically. ISO was set to 100 to minimize image noise and exposure variability. Hemispherical photographs were captured when the sun was low on the horizon with manual exposure adjustments [46]. However, due to intense solar radiation conditions in Greece, image pre-processing was performed using GIMP v.2.10.28 to mitigate sun-induced overexposure and associated classification errors. Blue-channel thresholding was additionally applied where necessary to support the correction of overexposed pixels prior to canopy classification [59]. To ensure these corrections did not introduce classification bias, a manual localized thresholding protocol was followed. Each binarized image was visually cross-verified against its raw RGB channels to accurately isolate sunlit leaf surfaces from actual open sky. The mathematical validity of these corrected metrics was confirmed post hoc by their strong, consistent correlations with independent, field-measured forest attributes. Through HemiView analysis, six canopy variables were extracted: Indirect Site Factor (ISF), Direct Site Factor (DSF), Global Site Factor (GSF), Canopy Cover (GndCover), Sky Visibility (VisSky), and Mean Leaf Angle (MLA). These site factors were selected over absolute radiation values, as they provide a normalized representation of the light environment, capturing the structural properties of the canopy while reducing sensitivity to short-term atmospheric variability during sampling.
2.5. Data Analysis and Modeling
To identify the main drivers of understory biodiversity, we employed Generalized Additive Models (GAMs) for both the Understory Shannon Index (H’) and the Range-Size Rarity (RSR) Index. GAMs were selected due to their flexibility in modeling nonlinear ecological relationships. To prevent overfitting and ensure a reproducible workflow given the high dimensionality of our data, the 30 initial variables were first grouped into five structural/ecological categories: canopy, microclimate, stand structure, topography, and disturbance. To select the final predictors from these categories, we applied a strict two-step filter. First, we used Spearman rank correlation matrices to identify variables exhibiting high collinearity [60,61,62]. To avoid statistical redundancy, only the single variable with the highest ecological responsiveness and lowest cross-category correlation was retained as a proxy for that category. For instance, tree slenderness was selected to represent both canopy and stand constraints due to its strong correlation with hemispherical radiation metrics (DSF, ρ = −0.616) and stand parameters (DBH, ρ = −0.779), while redundant metrics were removed.
Topographic Aspect was transformed into two linear components, Northness and Eastness, using the cosine and sine functions to facilitate its inclusion in the regression models, as performed by other researchers [63].
Prior to modeling, exploratory data screening and diagnostic evaluation were conducted to ensure data homogeneity. Three plots located at high altitude ecotones exhibited exceptionally high diversity values due to strong edge effects. Since these plots did not reflect interior forest dynamics, they were excluded from the Shannon diversity model to avoid skewing the ecological signals of interior stands. Conversely, they were retained in the RSR model to capture ecotonal rarity patterns. The final sample size for the Shannon GAM was adjusted accordingly (n = 27). To ensure that this data screening did not introduce predictive bias, a formal sensitivity analysis was integrated into our workflow to systematically compare the estimated smooth functions and model performance metrics between the full (n = 30) and trimmed (n = 27) datasets (Supplementary Table S1).
Models and graphs were made with R (v. 4.3.1.) [64] using mgcv [65] and gratia libraries [66]. In the second step of selection, and to avoid subjective manual step-wise data-dredging, the final pre-screened predictors were evaluated simultaneously within the GAM structure. For smooth terms, the basis dimension was restricted to k = 4 to prevent overfitting, given the sample size [67]. We used Restricted Maximum Likelihood (REML) as the smoothing parameter estimation method, which is recommended for smaller datasets [68]. Automatic smooth selection was implemented using penalized smooth shrinkage (select = TRUE) to reduce overfitting and remove unsupported smooth terms. This highly constrained configuration (k = 4 and penalized shrinkage) deliberately limits the effective degrees of freedom per smooth term (≤3), ensuring that the residual degrees of freedom suffice to achieve robust statistical power and prevent overparameterization despite the limited sample size. Final model predictors were evaluated based on statistical significance, contribution to explained deviance, and improvement in AIC, while multicollinearity in the final architectures was formally verified post-estimation using Variance Inflation Factors (VIFs).
2.6. Overview of Measured Explanatory Predictors
The studied forests of Castanea sativa exhibited a wide range of topographic and microclimatic conditions (Table 1). The plots were distributed across an elevational gradient ranging from 325 m to 925 m a.s.l., with a mean elevation of 600 m (median = 568 m). Chestnut ecosystems were predominantly situated in Northern and Northeastern aspects (mean circular direction ± SD: 18.68° ± 1.05). The slopes’ inclinations were moderate to steep, with the highest inclination reaching almost 94% (mean ± SD: 39.74 ± 22.10%).
Table 1.
Descriptive statistics of environmental and microclimatic predictors in Castanea sativa L. stands (n = 30).
Temperature offset was slightly negative (−1.1 °C), with the highest offset equal to −6.9 °C and a mean soil temperature of 19.1 °C during the studied period. Mean humidity offset was positive, indicating that the relative humidity under the forest canopy was higher than the humidity recorded in nearby weather stations (mean ± SD: 10.527 ± 8.443 p.p.). Winds had, on average, a low intensity (mean of ± SD: 1.3 ± 1 on the Beaufort scale).
The sampled stands exhibited considerable structure variation, with mean tree height ranging from 6 to 21 m (mean ± SD: 13 ± 4 m) and diameter at breast height (DBH) from 5 to 43 cm (mean ± SD: 18 ± 10 cm). The Gini coefficient of DBH was low (mean ± SD: 0.14 ± 0.09), reflecting even-aged stands. Tree slenderness was relatively high, showing that some plots present with structural instability (mean ± SD: 0.81 ± 0.24). On average, we recorded middle levels of disturbances (mean ± SD: 2.9 ± 1).
Canopy parameters reveal an overall closed forest canopy (mean ± SD: 76.5 ± 20.5%) with low sky visibility (mean ± SD: 8.1 ± 3.6%). Small percentages of direct (mean ± SD: 6.5 ± 4.2%) and indirect (mean ± SD: 11.3 ± 4.8%) site factors indicate that the light availability is low, with most of the light reaching the understory indirectly. The Mean Leaf Angle varied heavily between plots, showing that some plots had a predominantly vertical leaf orientation around 89.99°, and others were nearly horizontal, 7.5° (mean ± SD: 44.49 ± 23.07°), reflecting the diversified light conditions and intraspecific competition.
Diversity indices also reflected a gradient from floristically poor plots to plots characterized by high diversity. The Shannon Index for the understory varied from 1.609 to 3.651 (mean ± SD: 3.029 ± 0.467), and the RSR Index ranged from 0.076 to 0.416 (mean ± SD: 0.235 ± 0.082). Detailed descriptive statistics for all recorded variables are presented (Table 2).
Table 2.
Descriptive statistics of structural and canopy predictors and the biodiversity indices in Castanea sativa L. stands (n = 30).
3. Results
3.1. Forest Identity: Species Composition, Dominance and Rarity
A total of 196 plant species were recorded across the study plots, out of which 188 were herbaceous species. No alien species were observed. The herbaceous layer was characterized by many forest indicator species (Ruscus hypoglossum, Sanicula europaea, Viola spp., Campanula persicifolia, Galium spp. and Veronica spp.). Other common species belonged in the genera of Hieracium, Symphytum, Trifolium, and Vicia, with common presence of certain ferns such as Pteridium aquilinum and Asplenium spp. Finally, we also recorded protected orchid species (Cephalanthera longifolia, C. rubra, Neottia nidus-avis, Platanthera bifolia, P. chlorantha). The overstory in mature stands was comprised, except for the dominant chestnut trees, of many broadleaved species, with Fagus sylvatica, Quercus frainetto and Tilia platyphyllos being the most prevalent. Other species included other typical sub-Mediterranean species (Ostrya carpinifolia, Carpinus orientalis, Quercus petraea), fruit trees (Sorbus torminalis, S. aucuparia, Malus sylvestris) and species found in humid environments or in the riparian zone (Platanus orientalis, Acer platanoides, Ilex aquifolium). In the middle story, tree shrubs were abundant (Juniperus oxycedrus, Arbutus unedo, Cornus mas), mixed with scrambling shrubs (Rubus canescens, Rosa arvensis) and other typical nemoral species (Chamaecytisus spp., Cytisus villosus).
3.2. Predictors of Vegetation Diversity
Spearman’s rank correlation analysis was performed to evaluate the relationships between the environmental and forest structural variables and their effect on vegetation diversity (Table 3). All pairwise correlations among the predictors selected for the final GAMs remained below the |ρ| = 0.7 threshold, indicating no significant multicollinearity issues. Elevation was negatively correlated with soil temperature (ρ = −0.528, p < 0.01) and the presence of other species in the overstory (ρ = −0.509, p < 0.01), justifying its role as a key environmental driver. Slenderness also showed high correlation with radiation parameters, in particular with DSF (ρ = −0.616, p < 0.001) and GSF (ρ = −0.589, p < 0.001), therefore acting as a reliable proxy for light availability. Furthermore, slenderness was prioritized over DBH in the final models, as it exhibited a lower correlation with other significant predictors and provided higher interpretive value regarding forest structure and light penetration.
Table 3.
Correlation matrix between final model predictors of vegetation diversity.
3.3. Model Validation and Diagnostic Checks
Prior to the final GAM selection, multicollinearity concerns were additionally addressed using the performance package in R to ensure the validity of our statistical inferences. Variance Inflation Factors (VIF), Adjusted VIF and Tolerance for every predictor were calculated per model (Table 4 and Table 5).
Table 4.
Collinearity diagnostics for the final model predictors of understory diversity (Shannon Index).
Table 5.
Collinearity diagnostics for the final model predictors of understory range size rarity (RSR Index).
All predictor variables exhibited VIF values (Table 4) well below the conservative threshold of 3.0 (ranging from 1.06 to 1.68). The Adjusted VIF values, which account for the degrees of freedom of the smooth terms (k = 4), remained close to 1.0, with Elevation presenting the highest value (1.29). The high tolerance values (ranging from 0.60 to 0.94) confirm that most of the variance for each predictor is independent. The above numbers ensure that the model does not suffer from multicollinearity issues.
Both predictors exhibit very low VIF values (Table 5), safely below the conservative threshold of 3.0 (ranging from 1 to 1.09). Similarly, the Adjusted VIF value for Disturbance is equal to 1, and for slenderness, it is slightly above 1 (1.04). The high tolerance values (ranging from 0.92 to 1) reveal strong independence between predictors. Therefore, the produced model shows no multicollinearity.
In addition to multicollinearity checks, the mathematical and structural assumptions of the model were comprehensively validated with the residual diagnostic plots (Figure 2 and Figure 3).
Figure 3.
Model verification and diagnostic residual plots for the understory diversity (Shannon Index) GAM model. Panels represent (a) normal Q-Q plot of deviance residuals against theoretical quantiles; (b) histogram of deviance residuals showing the distribution error frequency; (c) deviance residuals plotted against the linear predictor values to assess homoscedasticity; (d) observed response values plotted against the model’s fitted values to evaluate goodness-of-fit.
The normal Q-Q plot (Figure 3a) reveals a good alignment of the deviance residuals along the 1:1 reference baseline across the entire distribution spectrum. This observation is supported by the corresponding Histogram of Residuals (Figure 3b), which forms a symmetric, bell-shaped Gaussian curve centered at zero, demonstrating that the assumption of error normality is met. The plot of deviance residuals against linear predictors (Figure 3c) displays a uniform and random dispersion of data points around the zero mark, validating the assumption of homoscedasticity. Furthermore, the Response vs. Fitted Values plot (Figure 3d) shows a robust linear alignment, demonstrating a high goodness-of-fit of the model without systematic bias.
The normal Q-Q plot (Figure 4a) shows that the deviance residuals align along the 1:1 reference baseline across the entire distribution spectrum, showing only minor typical fluctuations at the tails. The Histogram of Residuals (Figure 4b) reveals a symmetric, bell-shaped Gaussian curve centered at zero, validating the normality of errors assumption. The plot of deviance residuals against linear predictors (Figure 4c) shows that the data points are uniformly and randomly dispersed around the zero mark, consistent with the assumption of homoscedasticity. Additionally, the Response vs. Fitted Values plot (Figure 4d) presents a well-distributed linear alignment, confirming that the model possesses a high goodness-of-fit without systematic bias, without introducing artificial smoothing constraints.
Figure 4.
Model verification and diagnostic residual plots for the range size rarity (RSR Index) GAM model. Panels represent (a) normal Q-Q plot of deviance residuals against theoretical quantiles; (b) histogram of deviance residuals showing the distribution error frequency; (c) deviance residuals plotted against the linear predictor values to assess homoscedasticity; (d) observed response values plotted against the model’s fitted values to evaluate goodness-of-fit.
Finally, using the gam.check() function in R, the k-index simulation tests mathematically confirmed that the chosen basis size (k = 4) was perfectly adequate to resolve the underlying nonlinear relationships without underfitting, as all smooth terms in both models yielded non-significant results. The p-values for the Shannon Index model were p = 0.79 for Thermal Offset, p = 0.97 for slenderness, p = 0.23 for Northness, and p = 0.54 for Elevation. For the RSR Index model, the p-values were p = 0.56 for slenderness and p = 0.30 for Disturbance.
3.4. GAM Analysis of Understory Species Diversity
The final GAM for understory Shannon diversity demonstrated high explanatory power, accounting for 66.1% of the total deviance (Adjusted R2 = 58.1%). The final model was based on 27 plots (n = 27) and 4 predictors, allowing for the lowest Akaike Information Criterion (AIC = 19.89) (Table 6). Elevation was found to be the most important predictor (F = 6.564, p < 0.001), followed by slenderness (F = 5.049, p < 0.001). Parameters related to the microclimate appeared to play a secondary but also significantly important role. Northness was found to be the third most important predictor (F = 2.179, p < 0.01), and the final inclusion of the Thermal Offset improved the explanatory power of the model (F = 1.313, p < 0.05). As seen in the partial effect plots (Figure 5), Northness and Thermal Offset exhibited a negative linear relationship with Shannon Index (Figure 5), indicating that higher diversity values were associated with southern aspects and lower stand temperatures. In contrast, Elevation and Slenderness Index showed nonlinear responses (Figure 5). Elevation displayed a monotonic decline, with the sharpest decrease in Shannon Index occurring between 500 and 700 m. Slenderness exhibited a U-shaped response, where the Shannon Index declined sharply until values near 1, followed by a slight positive trend at higher values.
Figure 5.
General Additive Model (GAM) partial response plots showing the effects of significant environmental and structural drivers on understory diversity (Shannon Index). Panels represent the effects of (a) Thermal Offset; (b) Slenderness Index; (c) Northness; (d) Elevation.
Table 6.
Summary of the Generalized Additive Model (GAM) for understory species diversity (Shannon index) in Castanea sativa L. stands.
3.5. GAM Analysis of Understory Species Rarity
The Generalized Additive Model (GAM) for the understory RSR Index explained 54.6% of the total deviance (Adjusted R2 = 49.4%) with the use of 2 predictors. The final model was based on 30 plots (n = 30) and 2 predictors, resulting in a very low Akaike Information Criterion (AIC = −78.67) (Table 7). Rarity patterns appeared to be sensitive to stochastic processes, with the Slenderness Index and Disturbance Index emerging as the only significant drivers. Slenderness provided the most substantial contribution to the model (F = 7.432, p < 0.001). Disturbance was marginally significant (F = 1.347, p = 0.05); however, its inclusion greatly enhanced the explanatory power of the model without introducing collinearity issues. The partial effect plots revealed nonlinear relationships (Figure 6). Similar to the Shannon index, the Slenderness Index revealed a U-shaped relationship with RSR declining sharply till values near 1 and then following an upwards trend (Figure 6). The Disturbance Index also exhibited a negative response, with the most pronounced decline in RSR occurring between disturbance index values of 2 and 4 (Figure 6).
Figure 6.
General Additive Model (GAM) partial response plots showing the effects of significant environmental and structural drivers on understory species rarity (RSR). Panels represent the effects of (a) Slenderness Index; (b) Disturbance Index.
Table 7.
Summary of the Generalized Additive Model (GAM) for understory range size rarity (RSR index) in Castanea sativa L. stands.
4. Discussion
4.1. Definitive Factors of Biodiversity
It is well defined that biodiversity patterns can be traced using environmental parameters. Forest species communities are co-formed by the influence of topography [69], microclimatic conditions [20] and tree species composition [70]. Forest stand structure and human disturbances define light conditions and reflect forest integrity and species appearance [51,71,72]. Elevation generally acts as a microclimatic proxy, being associated with lower temperatures and higher humidity. A negative correlation between elevation and species diversity is observed in many forest types [73,74,75]. However, in our study area, the chestnut forest stands in higher elevations were older, allowing for more light to reach the understory and less disturbed, thus counteracting the cooling effect due to altitudinal gain. Accordingly, species diversity was found to decrease in higher altitudes due to the strong presence of Fagus sylvatica, which suppressed species survival even when light conditions were more favorable. The negative impact of Fagus sylvatica on understory species diversity in mixed forests is well-documented for many cases, primarily attributed to the formation of dense leaf litter and diminished light availability [76]. In our study, the presence of F. sylvatica surrounding C. sativa plots was observed during field measurements to restrict light penetration at the stand margins. Furthermore, potential species enrichment via understory colonization was limited, as dense beech ecosystems typically host poor understory communities [76,77]. This successional shift is further evidenced by the significant negative correlation between elevation and overstory diversity, suggesting a structural simplification of the canopy as beech dominance increases.
According to field data analysis, the stand structure of the studied chestnut forest was found to mostly affect biodiversity through the diameter of trees and slenderness. Although diameter at breast height exhibited a strong correlation with rare species, slenderness was proven to be a stronger predictor of plant diversity, since it reflects competition, microclimatic conditions, soil factors and previous management measures [78]. In dense stands, competition for light results in higher slenderness values [79]. Dense, unthinned coppice stands with high slenderness values had compact canopies, which prevented the light from reaching the understory. The negative correlation between slenderness and light availability is also strongly reflected in the Spearman correlations (DSF, ρ = −0.616, p < 0.001; GSF, ρ = −0.589, p < 0.001; sky visibility, ρ = −0.434, p < 0.05). We propose that this mechanism is the main cause that led to the negative correlation of slenderness with species diversity (ρ = −0.41, p < 0.05) and rarity (ρ = −0.558, p < 0.01) (Table 3). Interestingly, both diversity and rarity exhibited a positive trend after slenderness values surpassed a threshold near 1 (Figure 2 and Figure 3). Plots with the highest slenderness values corresponded to thin coppice chestnut stands in the early development stages. The reason why diversity and rarity were increased is attributed to two separate phenomena. Some of these early-stage stands featured structural canopy gaps due to underdeveloped neighboring trees, allowing the entrance of light from the edges, whereas others were embedded within mixed forest matrices (predominantly oak and beech). When oak species were present, the mixed-stand effect enhanced understory diversity despite the closed canopy conditions [80]. Thus, slenderness had a small correlation with canopy cover but a significant correlation with DSF (ρ = −0.616, p < 0.001) (Table 3). Consequently, slenderness functioned as a statistical proxy for complex, localized light availability patterns rather than uniform canopy variables, thereby overpowering the statistical importance of standard canopy parameters in our models.
In accordance with our findings regarding land topography effects (Figure 2), northern aspects were found to host the least number of species in many deciduous forests [81], while in southern aspects, more species were recorded on the lower forest floors [69]. In northern aspects, we observed that the presence of beech resulted in a loss of sky visibility. Furthermore, northern stands were more difficult to reach or presented with high inclinations, making management more difficult and leading to more disturbed stands. Increased disturbance in northern aspects was also reflected in the Spearman correlations (ρ = 0.437, p < 0.05) (Table 3). Lower temperatures were found to be correlated with higher species diversity (Figure 2). Furthermore, we observed that stands with lower temperatures had high vertical complexity; however, these observations have not been quantified and measured in the present study. Our observations suggest that when middlestory hosted many young tree species such as Abies borisii-regis, Sorbus torminalis, Quercus frainetto, Fagus sylvatica, Ilex aquifolium and other typical overstory species, it resulted in higher spatial heterogeneity, which caused lower temperatures and the appearance of high Shannon values. The same trend was not applied when the middle story was composed of non-tree species. The cooling effect in mixed stands or in ecotones has also been observed for overstory species [82].
Finally, disturbance and lack of management were found to have a negative correlation with the presence of rare species for chestnut ecosystems (Figure 3). Healthy mature stands in low inclinations, which are managed with small-scale interventions, maintain a stable forest environment and allow rare species to establish. This is especially important for nemoral species and specialist species with high conservation values, such as those belonging to the Orchidaceae family, as they can only survive in the extreme values of microenvironmental parameters [83].
4.2. Silvicultural Measures for Biodiversity Conservation
The primary threat to biodiversity in Mediterranean chestnut forests is the widespread abandonment of traditional silvicultural practices. To effectively conserve understory communities, it is essential to implement proactive management plans from the earliest stages of stand development [34,35]. In young stands, early thinning of coppice stools is critical to mitigate intense intraspecific competition. Our results indicate that unmanaged dense young stands present high competition for light. As a result, they develop high slenderness and dense canopies, which suppress the biodiversity of the lower floors, similarly to findings in many Mediterranean forests [84,85,86]. The understory vegetation is comprised only of common shade-tolerant ruderal species, and the overstory trees have higher mortality rates [13]. Promoting stands with lower slenderness through early-stage thinning improves stand structure, optimizes the light regime and allows for the establishment of more diverse understory communities. Thus, the traditional short-rotation coppice system should be applied in all young coppice stands, favoring biodiversity and simultaneously enhancing forest resistance to Cryphonectria parasitica, since it is suggested that blight caused by Cryphonectria parasitica may limit long-rotation timber production, making the short-rotation system a more attractive management option [87]. Stand management also should consider the prevailing topographic conditions. On northern aspects, where beech tends to dominate, selective removal of beech individuals is necessary to prevent the competitive exclusion of chestnut and its associated understory. Thinning is essential to prevent the homogenization of understory communities [88]. On southern aspects, management should remain low-intensity, focusing on creating small canopy gaps to increase indirect radiation in the form of sunflecks. In mature stands, an excessive reduction of canopy cover can disrupt the forest’s thermal buffering, leading to microclimatic instability and potential dieback of sensitive species [16,25].
It is expected that any chestnut populations will suffer from the oncoming effects of climate change [89]. In deciduous Mediterranean forests, building resilience against increased temperatures and drought is critical, especially in the lower altitudes of the chestnut range, with southern aspects more prone to environmental degradation [36]. Our results suggest that the mitigation of high temperatures can be associated with vertical structural heterogeneity. Additionally, heterogeneity in mixed forests has been found to promote the understory species growth and diversity in several forest types [76,90]. We argue that promoting mixed stands and a diverse middle story comprised of overstory species can potentially stabilize the forest microclimate as reported by other researchers [91,92]. Cultivating shade-tolerant tree species in the middle story can provide thermal buffering and increase the overall ecological niche availability, thus enhancing local biodiversity and protecting it from increasing external temperatures. To sum up, our results reveal that the tree slenderness of the dominant stand serves as a potential proxy for stand competition and compactness. Lower slenderness values, reflecting reduced overstory competition, were significantly associated with enhanced light availability and microclimatic stability, which in turn supported higher levels of species diversity and rarity. Distinct ecological trends were observed between diversity and rarity. Shannon diversity was highest in mature, closed-forest environments characterized by lower temperatures, northern aspects, and lower elevations, with the final model explaining 66.1% of the variance. In contrast, species rarity was primarily driven by stand slenderness and low disturbance levels (explaining 54.6% of the variance), with the majority of rare species occurring in undisturbed stands. These findings suggest that targeted, low-intensity management for competition promotes structurally stable stands and may support microclimatic buffering, facilitating the preservation of understory biodiversity.
Finally, for the protection of rare species, we propose the designation of specific over-mature stands as conservation zones where management remains minimal, and the forest environment is left largely intact. Keeping old-growth stands enhances forest heterogeneity and allows species that require undisturbed environments to thrive. In old-growth forests, the reduced sky visibility, the well-established forest canopy and the structural characteristics of trees positively impact chestnut forests’ biodiversity [35]. Furthermore, forest fragmentation leads to important biodiversity loss and affects the naturalness of forest communities [6]. Near forest edges, temperatures are higher due to reduced canopy cover [37]. We recommend the selection of healthy stands that will be allowed to develop old-growth characteristics to serve as long-term reservoirs for species of high conservation value. Limited interventions can be implemented for disease control, as low-intensity management has been shown not to impact forest microclimate [39].
4.3. Limitations of the Study
The proposed models explain 66.1% and 54.6% of deviance, respectively. The remaining variability can be explained by ecological parameters that were not addressed in the present study and stochasticity. Soil parameters define the appearance of many forest ecosystems, and the soil litter and higher soil horizons strongly affect the understory vegetation communities. Nutrient availability and the depth of organic horizons can promote diverse micro-environments, allowing the facilitation of multiple forest species. Furthermore, based on the available literature, we believe that continentality, forest network density, previous management implications and fauna biodiversity are also important factors for predicting plant diversity patterns.
Regarding the sample size, repeated testing across larger datasets would be beneficial to strengthen the proposed relationships between predictors. Expanding the research area to other northern populations can provide valuable information regarding understory biodiversity drivers.
Measuring ecological parameters requires continuous monitoring across multiple sites to ensure accuracy and to capture temporal variability. Thermal and humidity offset under the canopy might fluctuate during different times of the day and months of the year, where canopy cover is reduced. Therefore, to test our findings regarding canopy and stand structure buffering, additional research is required to record microclimatic parameters through permanent sensors. Regarding the calculation of diversity parameters, we acknowledge that treating ordinal Domin scale values directly within a continuous regression framework introduces a degree of methodological uncertainty. However, this configuration does not compromise the validity of our findings. Domin scores and disturbance assessment were recorded systematically by a single observer; therefore, any potential visual calibration bias remains constant across all sampling units. Mathematically, such systematic consistency might shift the baseline intercept of the GAM, but it leaves the geometric trajectories, nonlinear smooth shapes, and statistical significance of the predictors completely unaltered.
Finally, we would like to emphasize that important field observations and hypotheses formulated during data collection and processing need to be explored further for definitive conclusions. Although our results comply with existing research and ecological theory, further testing is required, especially on the role of slenderness as a broad micro-environmental proxy. Furthermore, the proposed silvicultural measures need to be implemented in small pilot areas in order to test their practical effectiveness and long-term conservation implications.
5. Conclusions
Understory biodiversity in Castanea sativa stands is strongly dependent on environmental stability and structural complexity. Spatial heterogeneity achieved through mixed tree species compositions, vertical layering and light variability nurtures the establishment of rich plant communities. Our findings regarding the role of tree slenderness imply that management strategies should prioritize the reduction in intraspecific competition for the overall health of the stand and structural stability. Targeted removal of some coppice trees, such as those of the first and later of the second thinning applied in the traditional coppice system in chestnut forest, can promote biodiversity while still allowing for a high forest canopy percentage when the stand matures. Maintaining small canopy gaps allows indirect light to reach the lower forest floors without the fragmentation of the canopy. For the conservation of rare species, maintaining a well-distributed forest canopy through low-intensity and health-targeted interventions seems to mitigate microclimatic fluctuations, thus promoting the long-term integrity of these vital ecosystems. Finally, these silvicultural interventions that promote structural stand and species diversity may also enhance forest resilience to future climate change [93].
Supplementary Materials
The following supporting information can be downloaded at: https://www.mdpi.com/article/10.3390/d18060376/s1.
Author Contributions
Conceptualization, L.-M.P. and P.G.; methodology, L.-M.P. and P.G.; software, L.-M.P.; validation, L.-M.P. and P.G.; formal analysis, L.-M.P.; investigation, L.-M.P.; resources, L.-M.P. and P.G.; data curation, L.-M.P.; writing—original draft preparation, L.-M.P.; writing—review and editing, P.G.; supervision, P.G.; project administration, P.G. All authors have read and agreed to the published version of the manuscript.
Funding
This research received no external funding.
Data Availability Statement
Data are available from the authors upon request.
Conflicts of Interest
The authors declare no conflicts of interest.
Abbreviations
The following abbreviations are used in this manuscript:
| AIC | Akaike Information Criterion |
| DBH | Diameter at Breast Height |
| DSF | Direct Site Factor |
| GAMs | Generalized Additive Models |
| GSF | Global Site Factor |
| ISF | Indirect Site Factor |
| MLA | Mean Leaf Angle |
| RSR | Range Size Rarity Index |
| REML | Restricted Maximum Likelihood |
| VIFs | Variance Inflation Factors |
References
- Haritika; Negi, A.K. The Underestimated Role of Understory Vegetation Dynamics for Forest Ecosystem Resilience: A Review. Plant Ecol. 2025, 226, 763–787. [Google Scholar] [CrossRef] [Scilit]
- Deng, J.; Fang, S.; Fang, X.; Jin, Y.; Kuang, Y.; Lin, F.; Liu, J.; Ma, J.; Nie, Y.; Ouyang, S.; et al. Forest Understory Vegetation Study: Current Status and Future Trends. For. Res. 2023, 3, 6. [Google Scholar] [CrossRef] [Scilit]
- Ganatsas, P.; Tsitsoni, T.; Zagas, T. Forest plant diversity in the Aspropotamos Site (GR 1440001) of the Natura 2000 network. In Proceedings of the 1st International Conference on Ecological Protection of the Planet Earth, Xanthi, Greece, 5–8 June 2001. [Google Scholar]
- Carli, E.; Perez, M.; Casella, L.; Miraglia, G.; Pretto, F.; Caricato, G.; Cifarelli, R.A.; Palma, A.; Angelini, P. Tracing Vegetation Responses to Human Pressure and Climatic Stress: A Case Study from the Agri Valley (Southern Italy). Land 2026, 15, 48. [Google Scholar] [CrossRef] [Scilit]
- Joly, F.-X.; Milcu, A.; Scherer-Lorenzen, M.; Jean, L.-K.; Bussotti, F.; Dawud, S.M.; Müller, S.; Pollastrini, M.; Raulund-Rasmussen, K.; Vesterdal, L.; et al. Tree Species Diversity Affects Decomposition Through Modified Micro-Environmental Conditions Across European Forests. New Phytol. 2017, 214, 1281–1293. [Google Scholar] [CrossRef] [Scilit]
- Morabito, A.; Spampinato, G. Fragmentation, Ecological Assessment, and Diversity of EU Forest Habitat Types: A Case Study in the Calabria Region Oak Woodlands (Southern Italy). Forests 2025, 16, 1320. [Google Scholar] [CrossRef] [Scilit]
- Ganatsas, P. Conserving Forest Biodiversity; CABI Books; CABI International: Wallingford, UK, 2017. [Google Scholar] [CrossRef] [Scilit]
- Guitián, J.; Guitián, P.; Munilla, I.; Guitián, J.; Garrido, J.; Penín, L.; Domínguez, P.; Guitián, L. Biodiversity in Chestnut Woodlots: Management Regimen vs Woodlot Size. Open J. For. 2012, 2, 200–206. [Google Scholar] [CrossRef]
- Bonari, G.; Těšitel, J.; Migliorini, M.; Angiolini, C.; Protano, G.; Nannoni, F.; Schlaghamerský, J.; Chytrý, M. Conservation of the Mediterranean coastal pine woodlands: How can management support biodiversity? For. Ecol. Manag. 2019, 443, 28–35. [Google Scholar] [CrossRef] [Scilit]
- Tárrega, R.; Calvo, L.; Marcos, E.; Taboada, A. Forest Structure and Understory Diversity in Quercus pyrenaica Communities with Different Human Uses and Disturbances. For. Ecol. Manag. 2006, 227, 50–58. [Google Scholar] [CrossRef] [Scilit]
- Norris, C.; Hobson, P.; Ibisch, P.L. Microclimate and Vegetation Function as Indicators of Forest Thermodynamic Efficiency. J. Appl. Ecol. 2012, 49, 562–570. [Google Scholar] [CrossRef] [Scilit]
- Chaturvedi, R.K.; Raghubanshi, A.S.; Tomlinson, K.W.; Singh, J.S. Impacts of human disturbance in tropical dry forests increase with soil moisture stress. J. Veg. Sci. 2017, 28, 997–1007. [Google Scholar] [CrossRef] [Scilit]
- Gondard, H.; Regina, I.S.; Salazar, S.; Peix, A.; Romane, F. Effect of Forest Management on Plant Species Diversity in Castanea sativa Stands in Salamanca (Spain) and the Cévennes (France). Sci. Res. Essay 2007, 2, 62–70. [Google Scholar]
- Van Oijen, D.; Feijen, M.; Hommel, P.; Den Ouden, J.; De Waal, R. Effects of Tree Species Composition on Within-Forest Distribution of Understorey Species. Appl. Veg. Sci. 2005, 8, 155–166. [Google Scholar] [CrossRef] [Scilit]
- Rita, A.; Bonanomi, G.; Allevato, E.; Borghetti, M.; Cesarano, G.; Mogavero, V.; Rossi, S.; Saulino, L.; Zotti, M.; Saracino, A. Topography Modulates Near-Ground Microclimate in the Mediterranean Fagus sylvatica Treeline. Sci. Rep. 2021, 11, 8122. [Google Scholar] [CrossRef] [Scilit] [PubMed]
- Verdonck, S.; De Win, Y.; Nutter, T.; Van Meerbeek, K.; Thomaes, A.; De Smedt, P.; Dekoninck, W.; Hendrickx, F.; Muys, B. Managing Canopy Cover to Preserve Forest Microclimate and Diverse Macroarthropod Communities in Times of Drought. J. Appl. Ecol. 2025, 62, 2582–2593. [Google Scholar] [CrossRef]
- Atauri, J.A.; de Pablo, C.L.; de Agar, P.M.; Schmitz, M.F.; Pineda, F.D. Effects of Management on Understory Diversity in the Forest Ecosystems of Northern Spain. Environ. Manag. 2005, 34, 819–828. [Google Scholar] [CrossRef] [Scilit]
- González-Moreno, P.; Quero, J.L.; Poorter, L.; Bonet, F.J.; Zamora, R. Is Spatial Structure the Key to Promote Plant Diversity in Mediterranean Forest Plantations? Basic Appl. Ecol. 2011, 12, 251–259. [Google Scholar] [CrossRef] [Scilit]
- Cruz-Salazar, B.; George-Miranda, S. Microenvironmental Conditions as Predictors of Tree Diversity and Structure Patterns in a Mexican Temperate Forest. Bot. Lett. 2025, 172, 440–455. [Google Scholar] [CrossRef]
- De Frenne, P.; Lenoir, J.; Luoto, M.; Scheffers, B.R.; Zellweger, F.; Aalto, J.; Ashcroft, M.B.; Christiansen, D.M.; Decocq, G.; De Pauw, K.; et al. Forest microclimates and climate change: Importance, drivers and future research agenda. Glob. Change Biol. 2021, 27, 2279–2297. [Google Scholar] [CrossRef] [Scilit]
- De Frenne, P.; Rodríguez-Sánchez, F.; Coomes, D.A.; Baeten, L.; Verstraeten, G.; Vellend, M.; Bernhardt-Römermann, M.; Brown, C.D.; Brunet, J.; Cornelis, J.; et al. Microclimate Moderates Plant Responses to Macroclimate Warming. Proc. Natl. Acad. Sci. USA 2013, 110, 18561–18565. [Google Scholar] [CrossRef] [Scilit]
- Mairota, P.; Cafarelli, B.; Didham, R.K.; Lovergine, F.P.; Lucas, R.M.; Nagendra, H.; Rocchini, D.; Tarantino, C. Challenges and Opportunities in Harnessing Satellite Remote-Sensing for Biodiversity Monitoring. Ecol. Inform. 2015, 30, 207–214. [Google Scholar] [CrossRef] [Scilit]
- Kougioumoutzis, K.; Kokkoris, I.P.; Panitsa, M.; Trigas, P.; Strid, A.; Dimopoulos, P. Spatial Phylogenetics, Biogeographical Patterns and Conservation Implications of the Endemic Flora of Crete (Aegean, Greece) Under Climate Change Scenarios. Biology 2020, 9, 199. [Google Scholar] [CrossRef] [Scilit]
- Mallinis, G.; Chrysafis, I.; Korakis, G.; Pana, E.; Kyriazopoulos, P. A Random Forest Modelling Procedure for a Multi-Sensor Assessment of Tree Species Diversity. Remote Sens. 2020, 12, 1210. [Google Scholar] [CrossRef] [Scilit]
- De Lombaerde, E.; Vangansbeke, P.; Lenoir, J.; Van Meerbeek, K.; Lembrechts, J.; Rodríguez-Sánchez, F.; Luoto, M.; Scheffers, B.; Haesen, S.; Aalto, J.; et al. Maintaining forest cover to enhance temperature buffering under future climate change. Sci. Total Environ. 2022, 810, 151338. [Google Scholar] [CrossRef] [Scilit]
- Valladares, F.; Guzmán, B. Canopy Structure and Spatial Heterogeneity of Understory Light in an Abandoned Holm Oak Woodland. Ann. For. Sci. 2006, 63, 749–761. [Google Scholar] [CrossRef] [Scilit]
- Milios, E.; Bountis, D. Analysis of Shade Conditions of Pinus nigra Arnold Stands in the Island of Thasos in Greece. For. Ideas 2010, 16, 75–82. [Google Scholar]
- Bao, Y.; Ni, W.; Wang, D.; Yue, C.; He, H.; Verbeeck, H. Effects of Tree Trunks on Estimation of Clumping Index and LAI from HemiView and Terrestrial LiDAR. Forests 2018, 9, 144. [Google Scholar] [CrossRef] [Scilit]
- Uribe, S.V.; García, N.; Estades, C.F. Effect of Land Use History on Biodiversity of Pine Plantations. Front. Ecol. Evol. 2021, 9, 609627. [Google Scholar] [CrossRef] [Scilit]
- Bončina, A.; Trifković, V.; Ficko, A. Diameter Growth of Silver Fir (Abies alba Mill.), Scots Pine (Pinus sylvestris L.), and Black Pine (Pinus nigra Arnold) in Central European Forests: Findings from Slovenia. Forests 2023, 14, 793. [Google Scholar] [CrossRef] [Scilit]
- Vatitsi, K.; Chrysafis, I.; Bellos, K.; Kokkoris, I.P.; Mallinis, G. National Scale Tree Canopy Cover Modelling Using Google Earth Engine and Stacking Ensemble: A Case Study of the Greek Forests. Sci. Total Environ. 2026, 1023, 181628. [Google Scholar] [CrossRef] [Scilit] [PubMed]
- Mattioni, C.; Martin, M.A.; Pollegioni, P.; Cherubini, M.; Villani, F. Microsatellite Markers Reveal a Strong Geographical Structure in European Populations of Castanea sativa (Fagaceae): Evidence for Multiple Glacial Refugia. Am. J. Bot. 2013, 100, 951–961. [Google Scholar] [CrossRef] [Scilit] [PubMed]
- Mellano, M.G.; Beccaro, G.L.; Donno, D.; Marinoni, D.T.; Boccacci, P.; Canterino, S.; Cerutti, A.K.; Bounous, G. Castanea spp. Biodiversity Conservation: Collection and Characterization of the Genetic Diversity of an Endangered Species. Genet. Resour. Crop Evol. 2012, 59, 1727–1741. [Google Scholar] [CrossRef] [Scilit]
- Konstantinidis, P.; Tsiourlis, G.; Xofis, P.; Buckley, G.P. Taxonomy and ecology of Castanea sativa Mill. forests in Greece. Plant Ecol. 2008, 195, 235–256. [Google Scholar] [CrossRef] [Scilit]
- Guitián, J. Biological Richness in the Chestnut (Castanea sativa) Forests at the Western of the Cantabrian Range. SSRN 2022, 4123258. [Google Scholar] [CrossRef] [Scilit]
- Conte, A.L.; Di Pietro, R.; Di Marzio, P.; Strumia, S.; Cillis, G.; Capuano, A.; Fortini, P. Oak Decline in Southern Italy: Environmental and Climate Parameters for Modelling Purposes. Veg. Ecol. Divers. 2025, 62, e160170. [Google Scholar] [CrossRef] [Scilit]
- Meeussen, C.; Govaert, S.; Vanneste, T.; Bollmann, K.; Brunet, J.; Calders, K.; Cousins, S.A.O.; De Pauw, K.; Diekmann, M.; Gasperini, C.; et al. Microclimatic Edge-to-Interior Gradients of European Deciduous Forests. Agric. For. Meteorol. 2021, 311, 108699. [Google Scholar] [CrossRef] [Scilit]
- Bricca, A.; Zerbe, S.; Sabatini, F.M.; Hiebl, B.; Rutzinger, M.; di Musciano, M.; Calvia, G.; Chiarucci, A.; Poschlod, P.; Rossi, C.; et al. Topography and Soil Moisture Regulate the Temperature-Biodiversity Relationship of Forests. Glob. Ecol. Biogeogr. 2026, 35, e70186. [Google Scholar] [CrossRef] [Scilit]
- Weißing, K.K.; Pierick, K.; Link, R.M.; Köhler, M.; Ehbrecht, M. Impacts of Forest Management on the Inter-Annual Variability of Forest Microclimate. Eur. J. For. Res. 2026, 145, 34. [Google Scholar] [CrossRef] [Scilit]
- Metreveli, V.; Kreft, H.; Akobia, I.; Janiashvili, Z.; Nonashvili, Z.; Dzadzamia, L.; Javakhishvili, Z.; Gavashelishvili, A. Potential Distribution and Suitable Habitat for Chestnut (Castanea sativa). Forests 2023, 14, 2076. [Google Scholar] [CrossRef] [Scilit]
- Beridze, B.; Sękiewicz, K.; Walas, Ł.; Thomas, P.A.; Danelia, I.; Fazaliyev, V.; Kvartskhava, G.; Sós, J.; Dering, M. Biodiversity Protection against Anthropogenic Climate Change: Conservation Prioritization of Castanea sativa in the South Caucasus Based on Genetic and Ecological Metrics. Ecol. Evol. 2023, 13, e10068. [Google Scholar] [CrossRef] [Scilit] [PubMed]
- Chiocchini, F.; Mattioni, C.; Pollegioni, P.; Lusini, I.; Martín, M.A.; Cherubini, M.; Lauteri, M.; Villani, F. Mapping the Genetic Diversity of Castanea sativa: Exploiting Spatial Analysis for Biogeography and Conservation Studies. J. Geogr. Inf. Syst. 2016, 8, 223–239. [Google Scholar] [CrossRef]
- Zhu, K.; Woodall, C.W.; Ghosh, S.; Gelfand, A.E.; Clark, J.S. Dual Impacts of Climate Change: Forest Migration and Turnover through Life History. Glob. Change Biol. 2014, 20, 251–264. [Google Scholar] [CrossRef] [Scilit]
- Govaert, S.; Vangansbeke, P.; Blondeel, H.; Steppe, K.; Verheyen, K.; De Frenne, P. Rapid Thermophilization of Understorey Plant Communities in a 9 Year-Long Temperate Forest Experiment. J. Ecol. 2020, 109, 2434–2447. [Google Scholar] [CrossRef] [Scilit]
- Grimmond, C.S.B.; Robeson, S.M.; Schoof, J.T. Spatial variability of micro-climatic conditions within a mid-latitude deciduous forest. Clim. Res. 2000, 15, 137–149. [Google Scholar] [CrossRef] [Scilit]
- Chianucci, F.; Cutini, A. Digital hemispherical photography for estimating forest canopy properties: Current controversies and opportunities. iForest-Biogeosci. For. 2012, 5, 290–295. [Google Scholar] [CrossRef] [Scilit]
- Athanasiadis, N.H. Forest Phytosociology; Giahoudi Publications: Thessaloniki, Greece, 1985; pp. 91–99. (In Greek) [Google Scholar]
- Avraam, E.; Gitas, I.; Ganatsas, P.; Nanos, N.; Panagiotou, G.; Stergiadou, A. Management Plan of Taxiarchis–Vrastama University Forest 2022–2031; Aristotle University of Thessaloniki: Thessaloniki, Greece, 2022; 166p. (In Greek) [Google Scholar]
- Khan, S.M.; Page, S.; Ahmad, H.; Shaheen, H.; Harper, D. Science, technology and development. Sci. Technol. Dev. 2012, 31, 232–243. [Google Scholar]
- Ganatsas, P.; Tsitsoni, T.; Tsakaldimi, M.; Zagas, T. Reforestation of degraded Kermes oak shrublands with planted pines: Effects on vegetation cover, species diversity and community structure. New For. 2012, 43, 1–11. [Google Scholar] [CrossRef] [Scilit]
- Petaloudi, L.M.; Ganatsas, P.; Tsakaldimi, M. Exploring biodiversity and disturbances in the peri-urban forests of Thessaloniki, Greece. Sustainability 2022, 14, 8497. [Google Scholar] [CrossRef] [Scilit]
- Kang, S.; Kim, S.; Oh, S.; Lee, D. Predicting spatial and temporal patterns of soil temperature based on topography, surface cover and air temperature. For. Ecol. Manag. 2000, 136, 173–184. [Google Scholar] [CrossRef] [Scilit]
- You, G.; Zhang, Y.; Schaefer, D.; Sha, L.; Liu, Y.; Gong, H.; Tan, Z.; Lu, Z.; Wu, C.; Xie, Y. Observed air/soil temperature trends in open land and understory of a subtropical mountain forest, SW China. Int. J. Climatol. 2012, 33, 1308–1316. [Google Scholar] [CrossRef] [Scilit]
- Maes, J.; Teller, A.; Erhard, M.; Grizzetti, B.; Barredo, J.; Paracchini, M.; Condé, S.; Somma, F.; Orgiazzi, A.; Jones, A.; et al. Mapping and Assessment of Ecosystems and Their Services: An Analytical Framework for Ecosystem Condition; Publications Office of the European Union: Luxembourg, 2018. [Google Scholar]
- Kokkoris, I.P.; Dimopoulos, P.; Xystrakis, F.; Tsiripidis, I. National scale ecosystem condition assessment with emphasis on forest types in Greece. One Ecosyst. 2018, 3, e25434. [Google Scholar] [CrossRef] [Scilit]
- Rich, P.M.; Wood, J.; Vieglais, D.A.; Burek, K.; Webb, N. HemiView User Manual: Canopy Image Analysis System; Delta-T Devices Ltd.: Cambridge, UK, 1999. [Google Scholar]
- Sima, L.; Liu, Y.; Shang, X.; Yuan, Q.; Zhang, Y. A Review of the Application of Hemispherical Photography in Urban Outdoor Thermal Comfort Studies. Buildings 2025, 15, 123. [Google Scholar] [CrossRef] [Scilit]
- Sidabras, N.; Augustaitis, A. Application Perspectives of the Leaf Area Index (LAI) Estimated by the Hemiview System in Forestry. Proc. Latv. Univ. Agric. 2015, 33, 26–34. [Google Scholar] [CrossRef] [Scilit]
- Leblanc, S.G.; Chen, J.M.; Fernandes, R.; Deering, D.W.; Conley, A. Methodology comparison for canopy structure parameters extraction from digital hemispherical photography in boreal forests. Agric. For. Meteorol. 2005, 129, 187–207. [Google Scholar] [CrossRef] [Scilit]
- Hastie, T.; Tibshirani, R.; Friedman, J. The Elements of Statistical Learning: Data Mining, Inference, and Prediction, 2nd ed.; Springer: New York, NY, USA, 2009. [Google Scholar]
- Dormann, C.F.; Elith, J.; Bacher, S.; Buchmann, C.; Carl, G.; Carré, G.; Marquéz, J.R.G.; Gruber, B.; Lafourcade, B.; Leitão, P.J.; et al. Collinearity: A review of methods to deal with it and a simulation study evaluating their performance. Ecography 2013, 36, 27–46. [Google Scholar] [CrossRef] [Scilit]
- Brůna, J.; Macek, M.; Man, M.; Hederová, L.; Klinerová, T.; Moudrý, V.; Heurich, M.; Červenka, J.; Wild, J.; Kopecký, M. High-resolution microclimatic grids for the Bohemian Forest Ecosystem based on in situ measurements. Sci. Data 2026, 13, 246. [Google Scholar] [CrossRef] [Scilit]
- Amatulli, G.; Domisch, S.; Tuanmu, M.N.; Parmentier, B.; Ranipeta, A.; Malczyk, J.; Jetz, W. A suite of global, cross-scale topographic variables for environmental and biodiversity modeling. Sci. Data 2018, 5, 180040. [Google Scholar] [CrossRef] [Scilit]
- R Core Team. R: A Language and Environment for Statistical Computing; R Foundation for Statistical Computing: Vienna, Austria, 2023; Available online: https://www.R-project.org/ (accessed on 1 September 2025).
- Wood, S.N. Fast stable restricted maximum likelihood and marginal likelihood estimation of semiparametric generalized linear models. J. R. Stat. Soc. Ser. B Stat. Methodol. 2011, 73, 3–36. [Google Scholar] [CrossRef] [Scilit]
- Simpson, G. gratia: An R package for exploring generalized additive models. J. Open Source Softw. 2024, 9, 6962. [Google Scholar] [CrossRef] [Scilit]
- Pedersen, E.J.; Miller, D.L.; Simpson, G.L.; Ross, N. Hierarchical generalized additive models in ecology: An introduction with mgcv. PeerJ 2019, 7, e6876. [Google Scholar] [CrossRef] [Scilit]
- Wood, S.N. Generalized Additive Models: An Introduction with R, 2nd ed.; CRC Press: New York, NY, USA, 2017; p. 496. [Google Scholar]
- Chapman, J.I.; McEwan, R.W. Spatiotemporal Dynamics of α- and β-diversity across Topographic Gradients in the Herbaceous Layer of an Old-Growth Deciduous Forest. Oikos 2013, 122, 1679–1686. [Google Scholar] [CrossRef] [Scilit]
- Corcket, E.; Alard, D.; van Halder, I.; Jactel, H.; Baumard, H.; Tuilleras, V.; Lagache, L.; Scherer-Lorenzen, M.; Barbaro, L. Canopy Composition and Drought Shape Understorey Plant Assemblages in a Young Tree Diversity Experiment. J. Veg. Sci. 2020, 31, 803–816. [Google Scholar] [CrossRef] [Scilit]
- Su, X.; Wang, M.; Huang, Z.; Fu, S.; Chen, H.Y.H. Forest Understorey Vegetation: Colonization and the Availability and Heterogeneity of Resources. Forests 2019, 10, 944. [Google Scholar] [CrossRef] [Scilit]
- Ottaviani, G.; Götzenberger, L.; Bacaro, G.; Chiarucci, A.; de Bello, F.; Marcantonio, M. A Multifaceted Approach for Beech Forest Conservation: Environmental Drivers of Understory Plant Diversity. Flora 2019, 256, 85–91. [Google Scholar] [CrossRef] [Scilit]
- Allegrezza, M.; Pesaresi, S.; Ballelli, S.; Tesei, G.; Ottaviani, C. Influences of Mature Pinus nigra Plantations on the Floristic-Vegetational Composition along an Altitudinal Gradient in the Central Apennines, Italy. iForest 2020, 13, 279–285. [Google Scholar] [CrossRef] [Scilit]
- Negiz, M.G.; Özdemir, S.; Erfidan, O.; Çıvğa, A.; Şentürk, Ö. Determination of Relations between Plant Species Diversity and Productivity in Brutian Pine Stands. Turk. J. For. 2024, 25, 49–55. [Google Scholar] [CrossRef] [Scilit]
- Mărăcineanu, L.C.; Stamin, F.D. Plant Diversity and Structural Patterns in Stanului Forest, Gemărtălui Valley, Romania. Diversity 2026, 18, 154. [Google Scholar] [CrossRef] [Scilit]
- Dölle, M.; Petritan, A.M.; Biris, I.A.; Petritan, I.C. Relations between Tree Canopy Composition and Understorey Vegetation in a European Beech-Sessile Oak Old Growth Forest in Western Romania. Biologia 2017, 72, 1422–1430. [Google Scholar] [CrossRef] [Scilit]
- Hrivnák, R.; Bošeľa, M.; Slezák, M.; Lukac, M.; Svitková, I.; Gizela, J.; Hegedüšová, K.; Hrivnák, M.; Kliment, J.; Knopp, V.; et al. Competition for Soil Resources Forces a Trade-Off between Enhancing Tree Productivity and Understorey Species Richness in Managed Beech Forests. Sci. Total Environ. 2022, 849, 157825. [Google Scholar] [CrossRef] [Scilit]
- Wang, J.; Wang, Y.; Tian, D.; Wang, W.; Jiang, L. Modeling Response of Tree Slenderness to Climate, Soil, Diversity, and Competition in Natural Secondary Forests. For. Ecol. Manag. 2023, 545, 121253. [Google Scholar] [CrossRef] [Scilit]
- Cysneiros, V.C.; de Souza, E.L.; Pinho, L.C.; Vuolo, A.F.; Pereira, I.R.S. Tree slenderness and stability of Brazilian pine in a secondary forest. Floresta Ambient. 2025, 32, e20240040. [Google Scholar] [CrossRef] [Scilit]
- Ister, S.I.; Gokbulak, F. Effect of Stand Types on Understory Vegetation. J. Environ. Biol. 2009, 30, 595–600. [Google Scholar]
- Simonson, W.D.; Allen, H.D.; Coomes, D.A. Overstorey and Topographic Effects on Understories: Evidence for Linkage from Cork Oak (Quercus suber) Forests in Southern Spain. For. Ecol. Manag. 2014, 328, 35–44. [Google Scholar] [CrossRef] [Scilit]
- Deluigi, J.M.; Grossiord, C.; Poretti, A.; Walthert, L.; Bachofen, C. Species composition shapes canopy microclimate and foliar traits without modifying photosynthetic thermal acclimation in a beech-oak ecotone. Preprints 2026, 202602.0589. [Google Scholar] [CrossRef] [Scilit]
- Djordjević, V.; Tsiftsis, S.; Lakušić, D.; Jovanović, S.; Stevanović, V. Patterns of Distribution, Abundance and Composition of Forest Terrestrial Orchids. Biodivers. Conserv. 2020, 29, 4111–4134. [Google Scholar] [CrossRef] [Scilit]
- Tartarino, P.; Greco, R.; Silva, J.S. Overstory Effects on the Understory of Aleppo Pine Plantations—Implications for Ecosystem Restoration. Forests 2020, 11, 664. [Google Scholar] [CrossRef] [Scilit]
- Bricca, A.; Jiménez-Alfaro, B.; Chytrý, M.; Chytrý, K.; Cubino, J.P.; Fernández-González, F.; Ciaramella, D.; Alessi, N.; Argagnon, O.; Cerabolini, B.; et al. Biodiversity Within and Beyond the Native Distribution of Tree Species: The Case of Pinus nigra Forests in Europe. Glob. Ecol. Biogeogr. 2025, 34, e70036. [Google Scholar] [CrossRef] [Scilit]
- Pierick, K.; Seidel, D.; Bradler, P.; Cesarz, S.; Decker, O.; Delory, B.M.; Dittrich, S.; Ehbrecht, M.; Eisenhauer, N.; Fichtner, A.; et al. Microclimatic Heterogeneity Is Associated with Forest Structural Complexity and Biodiversity. Ecology 2025, 106, e673839. [Google Scholar] [CrossRef] [Scilit]
- Clark, S.L.; Marcolin, E.; Patrício, M.S.; Loewe-Munoz, V. A silvicultural synthesis of sweet (Castanea sativa) and American (C. dentata) chestnuts. For. Ecol. Manag. 2023, 539, 121041. [Google Scholar] [CrossRef] [Scilit]
- Mattioli, W.; Mancini, L.D.; Portoghesi, L.; Corona, P. Biodiversity Conservation and Forest Management: The Case of the Sweet Chestnut Coppice Stands in Central Italy. Plant Biosyst. 2015, 150, 592–600. [Google Scholar] [CrossRef] [Scilit]
- Freitas, T.R.; Santos, J.A.; Silva, A.P.; Fraga, H. Influence of Climate Change on Chestnut Trees: A Review. Plants 2021, 10, 1463. [Google Scholar] [CrossRef] [Scilit] [PubMed]
- López-Marcos, D.; Turrión, M.B.; Bravo, F.; Martínez-Ruiz, C. Can mixed pine forests conserve understory richness by improving the establishment of understory species typical of native oak forests? Ann. For. Sci. 2020, 77, 15. [Google Scholar] [CrossRef] [Scilit]
- Luan, J.; Liu, S.; Wang, J.; Chang, S.X.; Liu, X.; Lu, H.; Wang, Y. Tree Species Diversity Promotes Soil Carbon Stability by Depressing the Temperature Sensitivity of Soil Respiration in Temperate Forests. Sci. Total Environ. 2018, 645, 623–629. [Google Scholar] [CrossRef] [Scilit] [PubMed]
- Schnabel, F.; Beugnon, R.; Yang, B.; Richter, R.; Eisenhauer, N.; Huang, Y.; Liu, X.; Wirth, C.; Cesarz, S.; Fichtner, A.; et al. Tree Diversity Increases Forest Temperature Buffering via Enhancing Canopy Density and Structural Diversity. Ecol. Lett. 2025, 28, e70096. [Google Scholar] [CrossRef] [Scilit]
- Vacek, Z.; Prokůpková, A.; Vacek, S.; Cukor, J.; Bílek, L.; Gallo, J.; Bulušek, D. Silviculture as a tool to support stability and diversity of forests under climate change: Study from Krkonoše Mountains. Cent. Eur. For. J. 2020, 66, 116–129. [Google Scholar] [CrossRef] [Scilit]
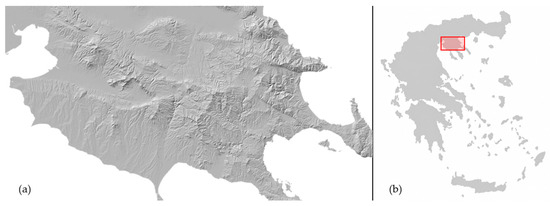
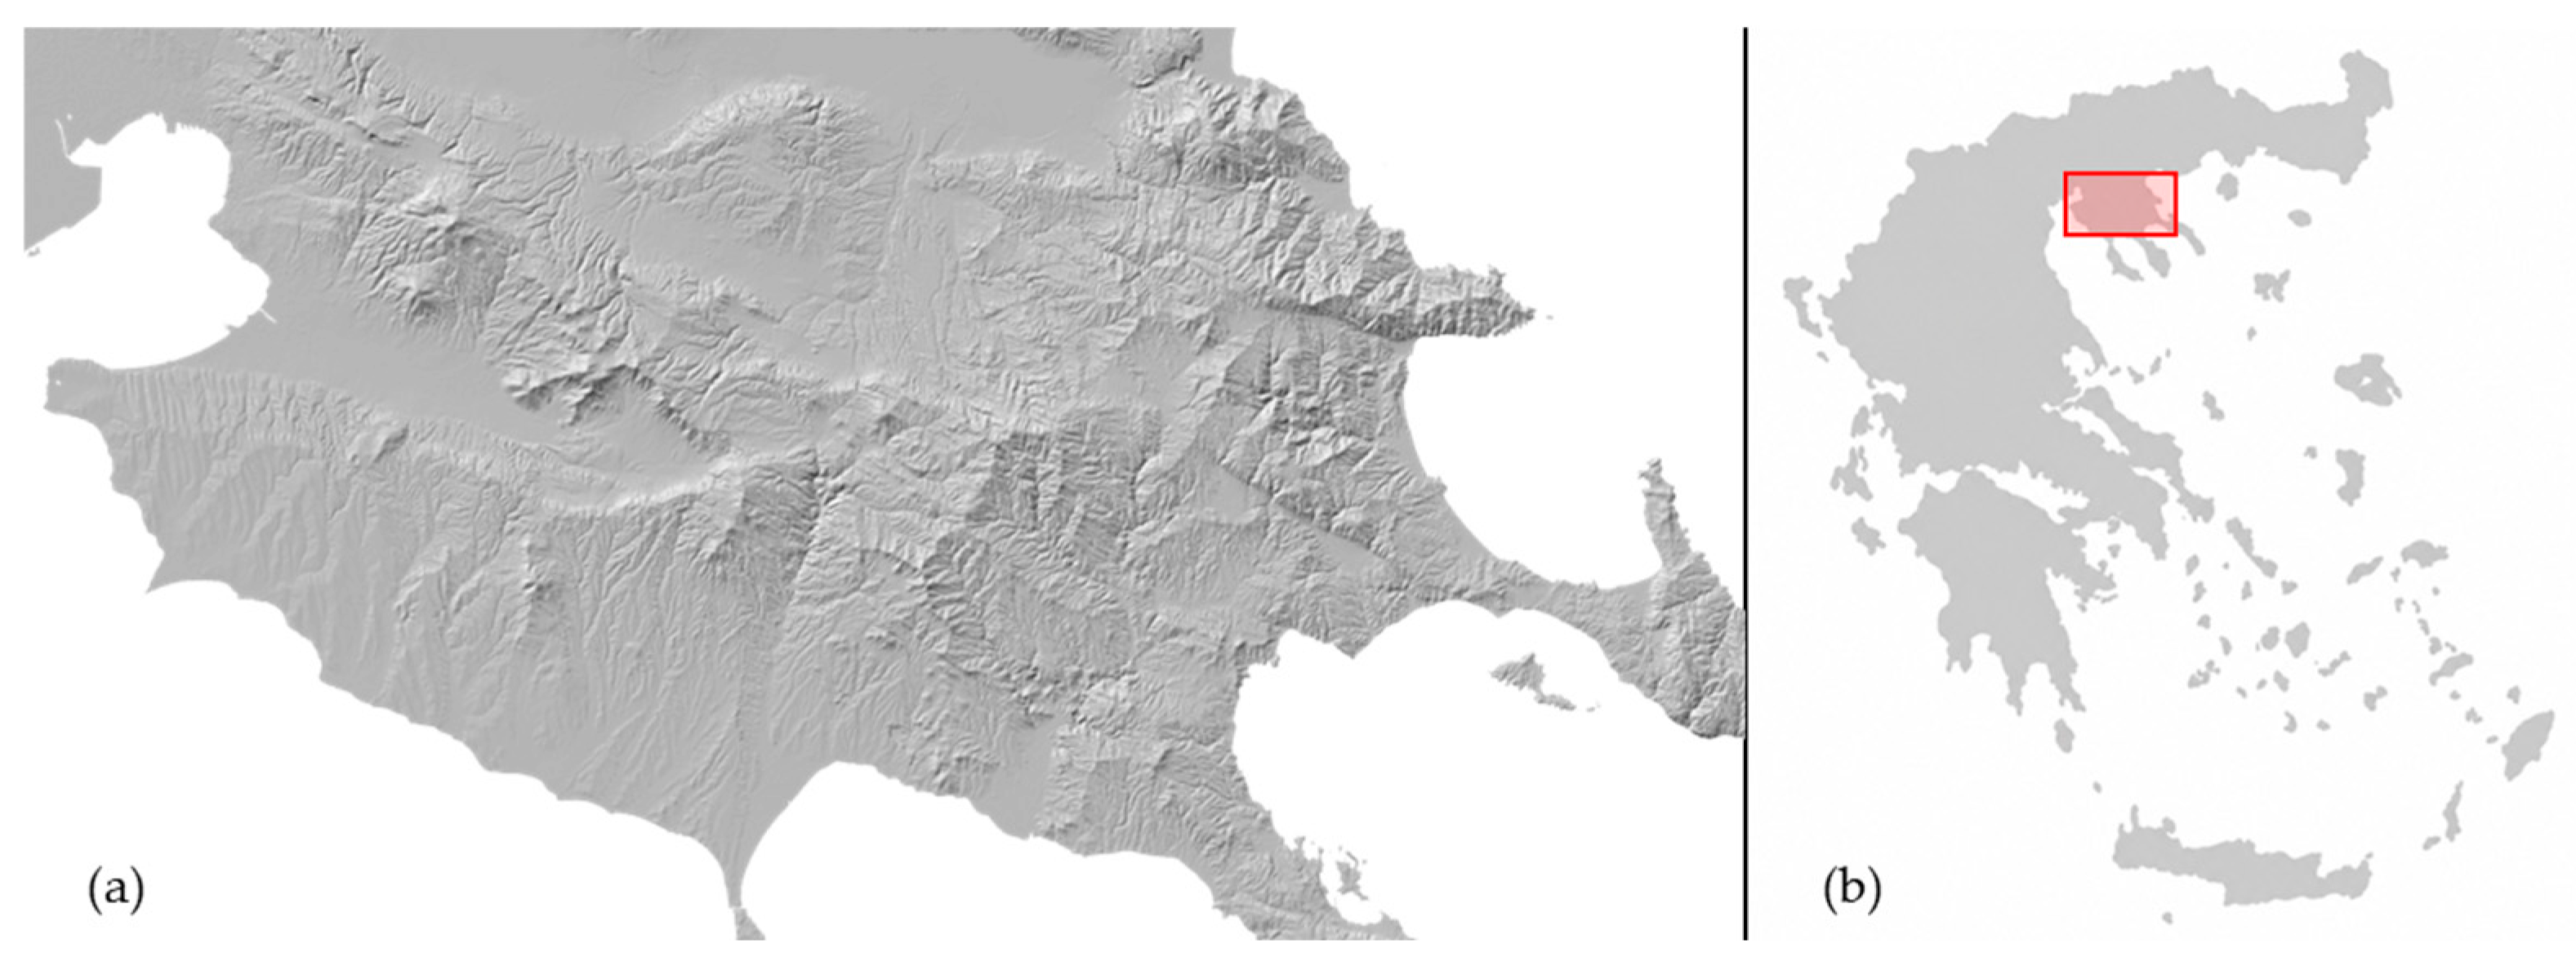
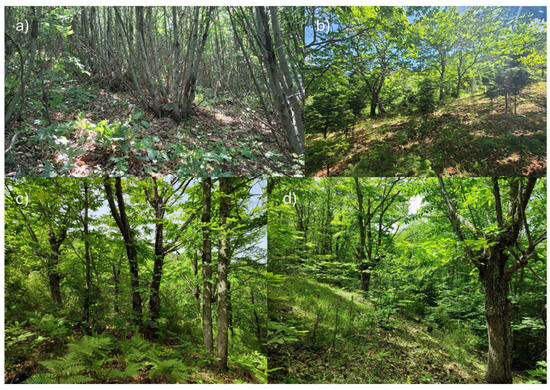
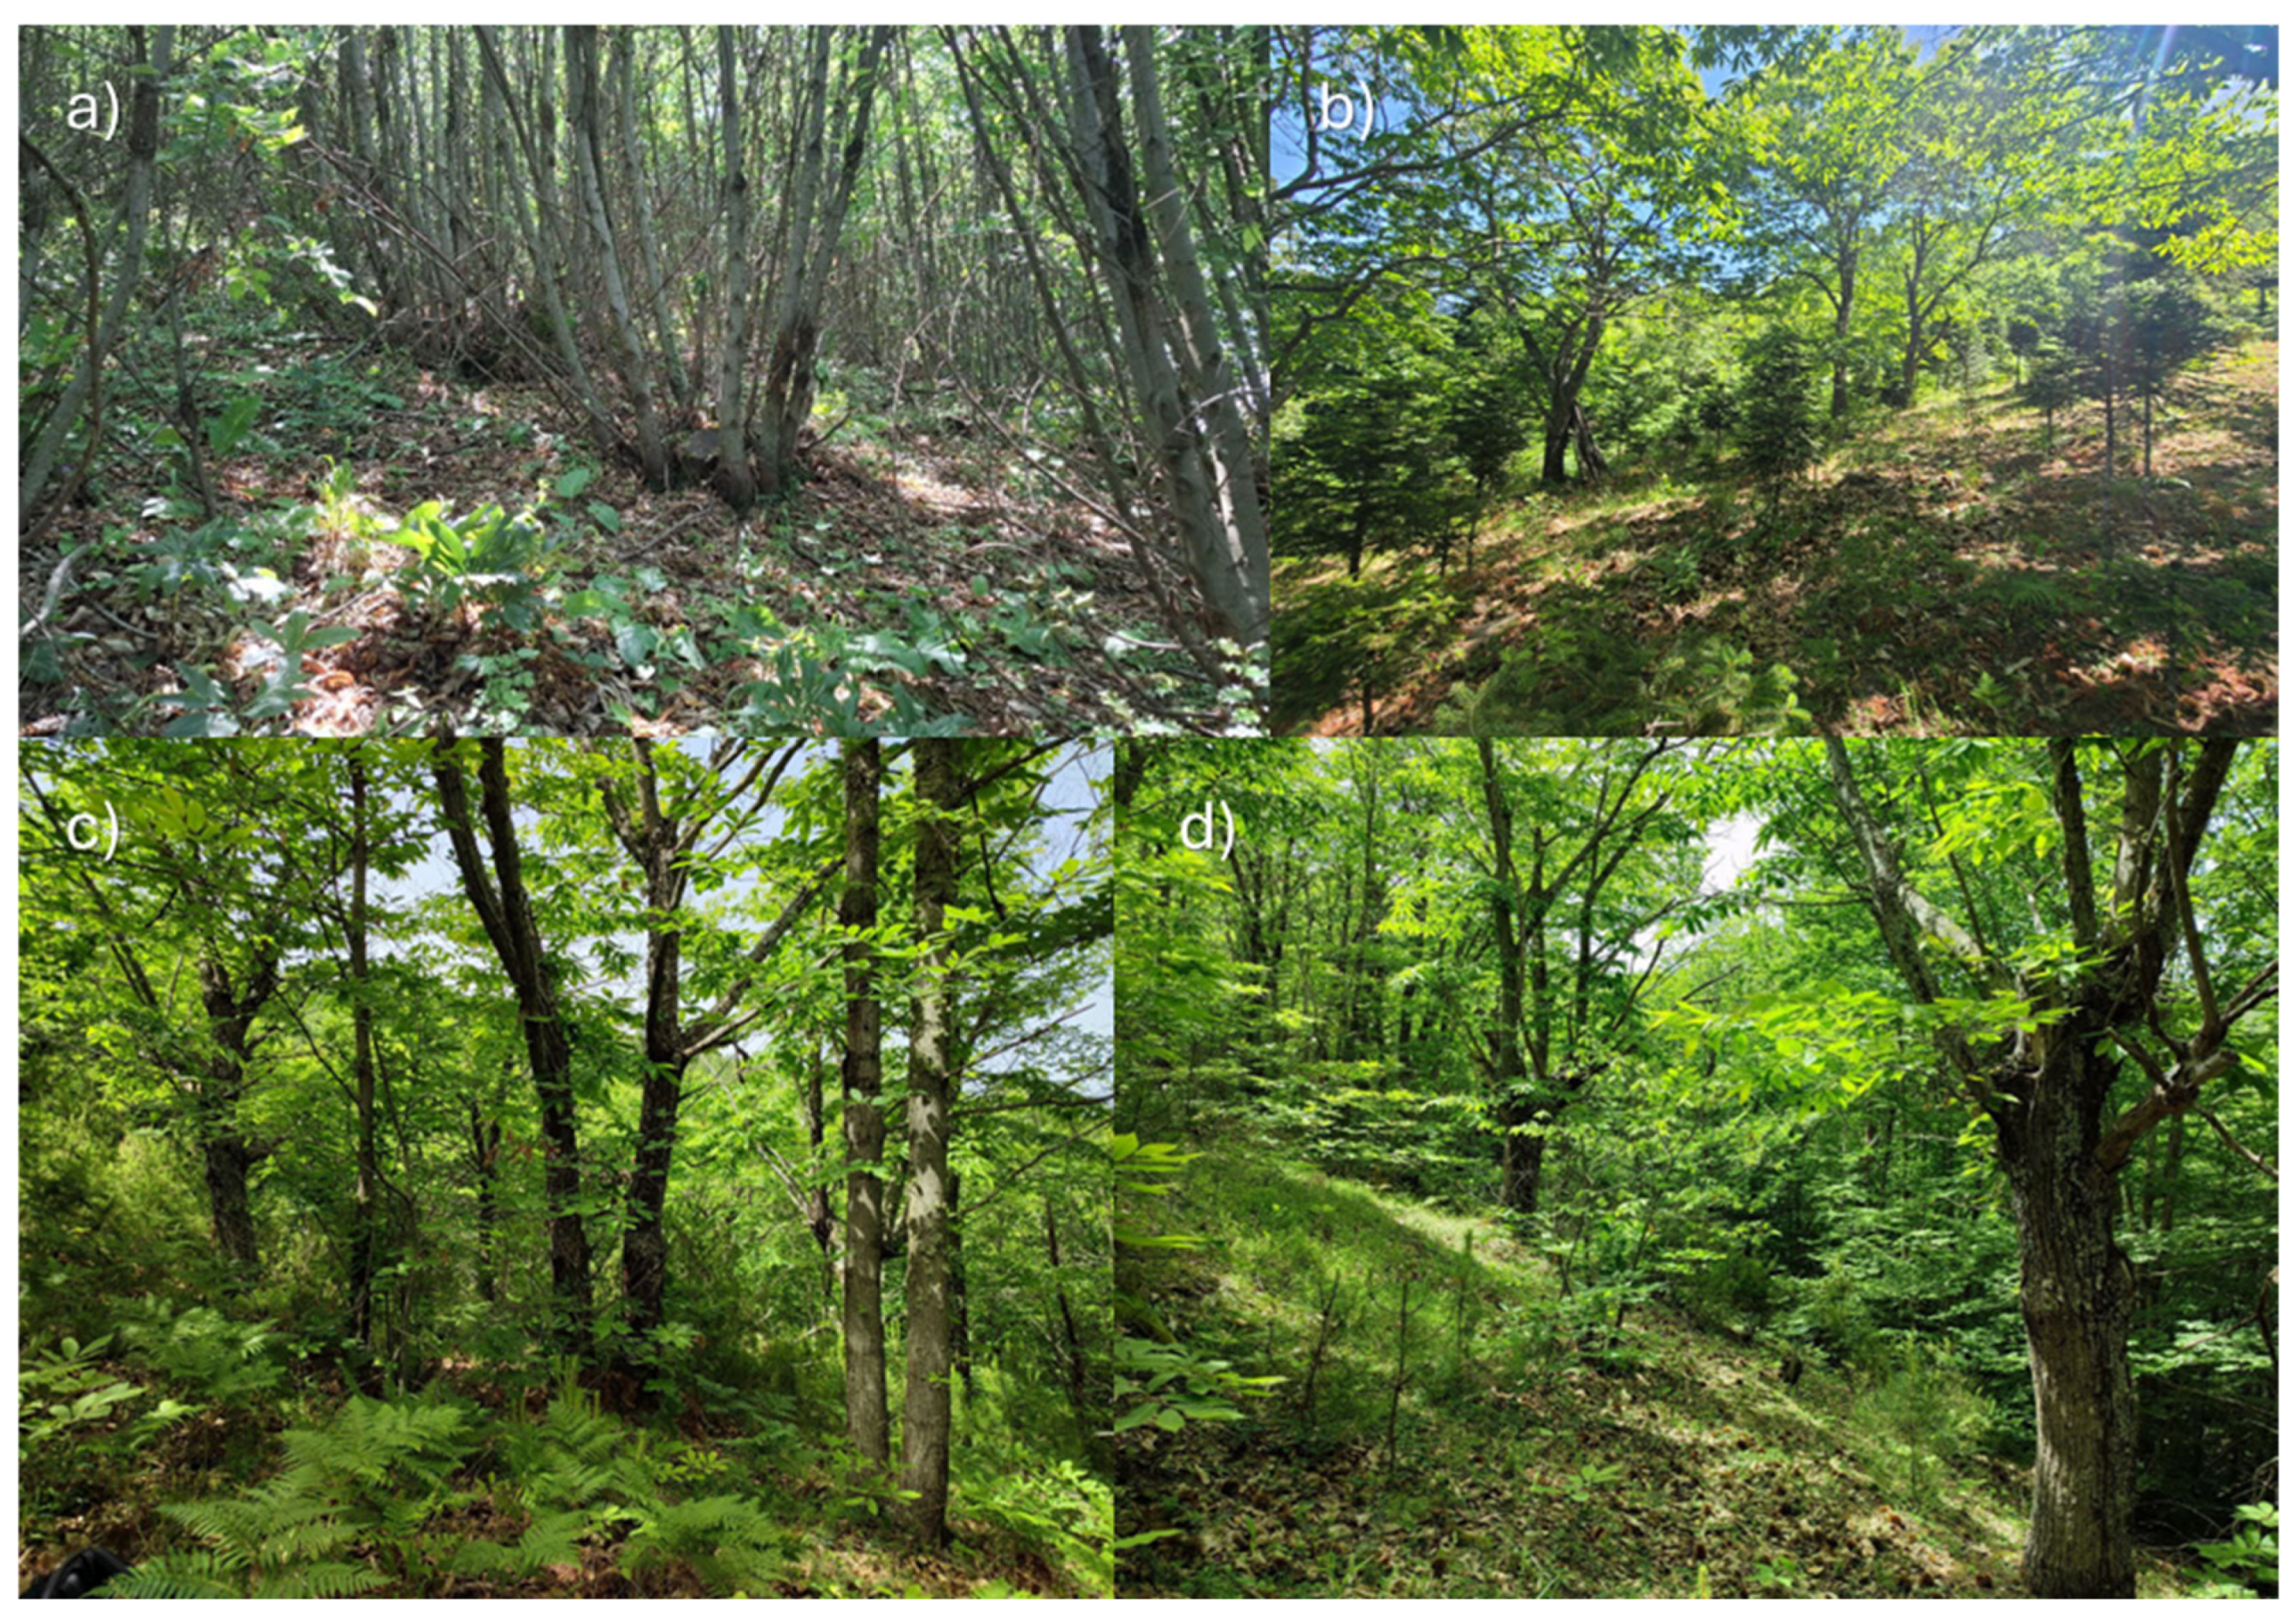
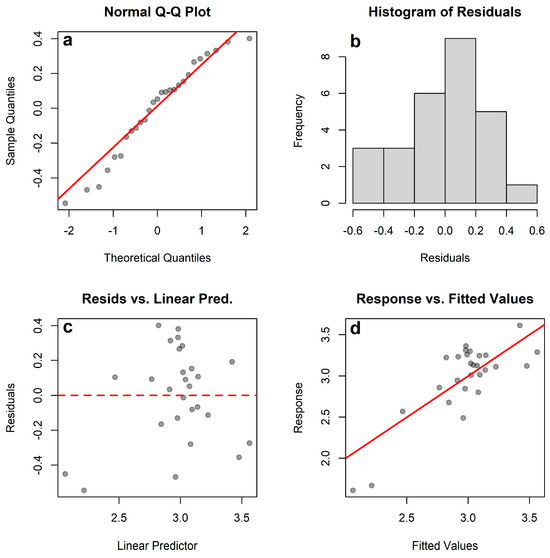
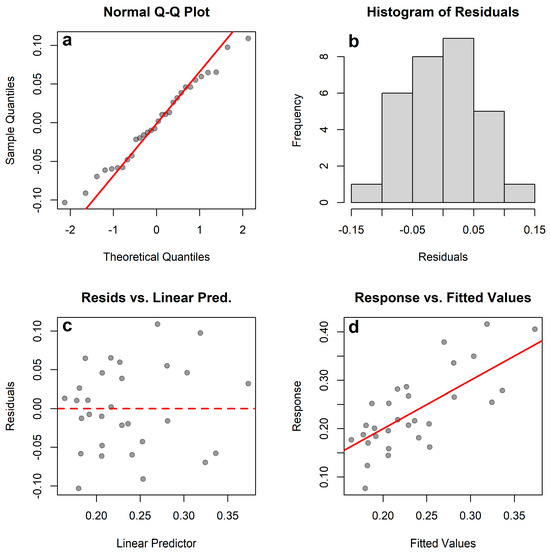
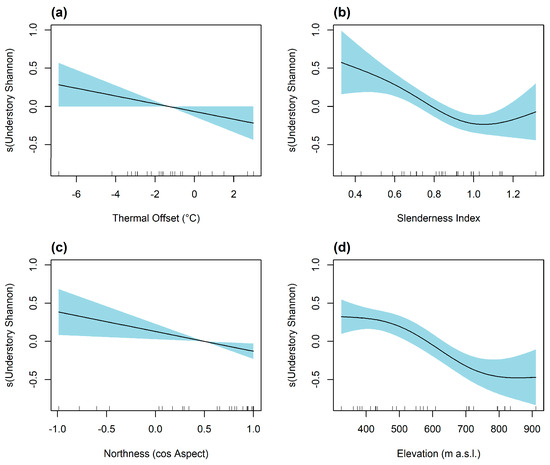
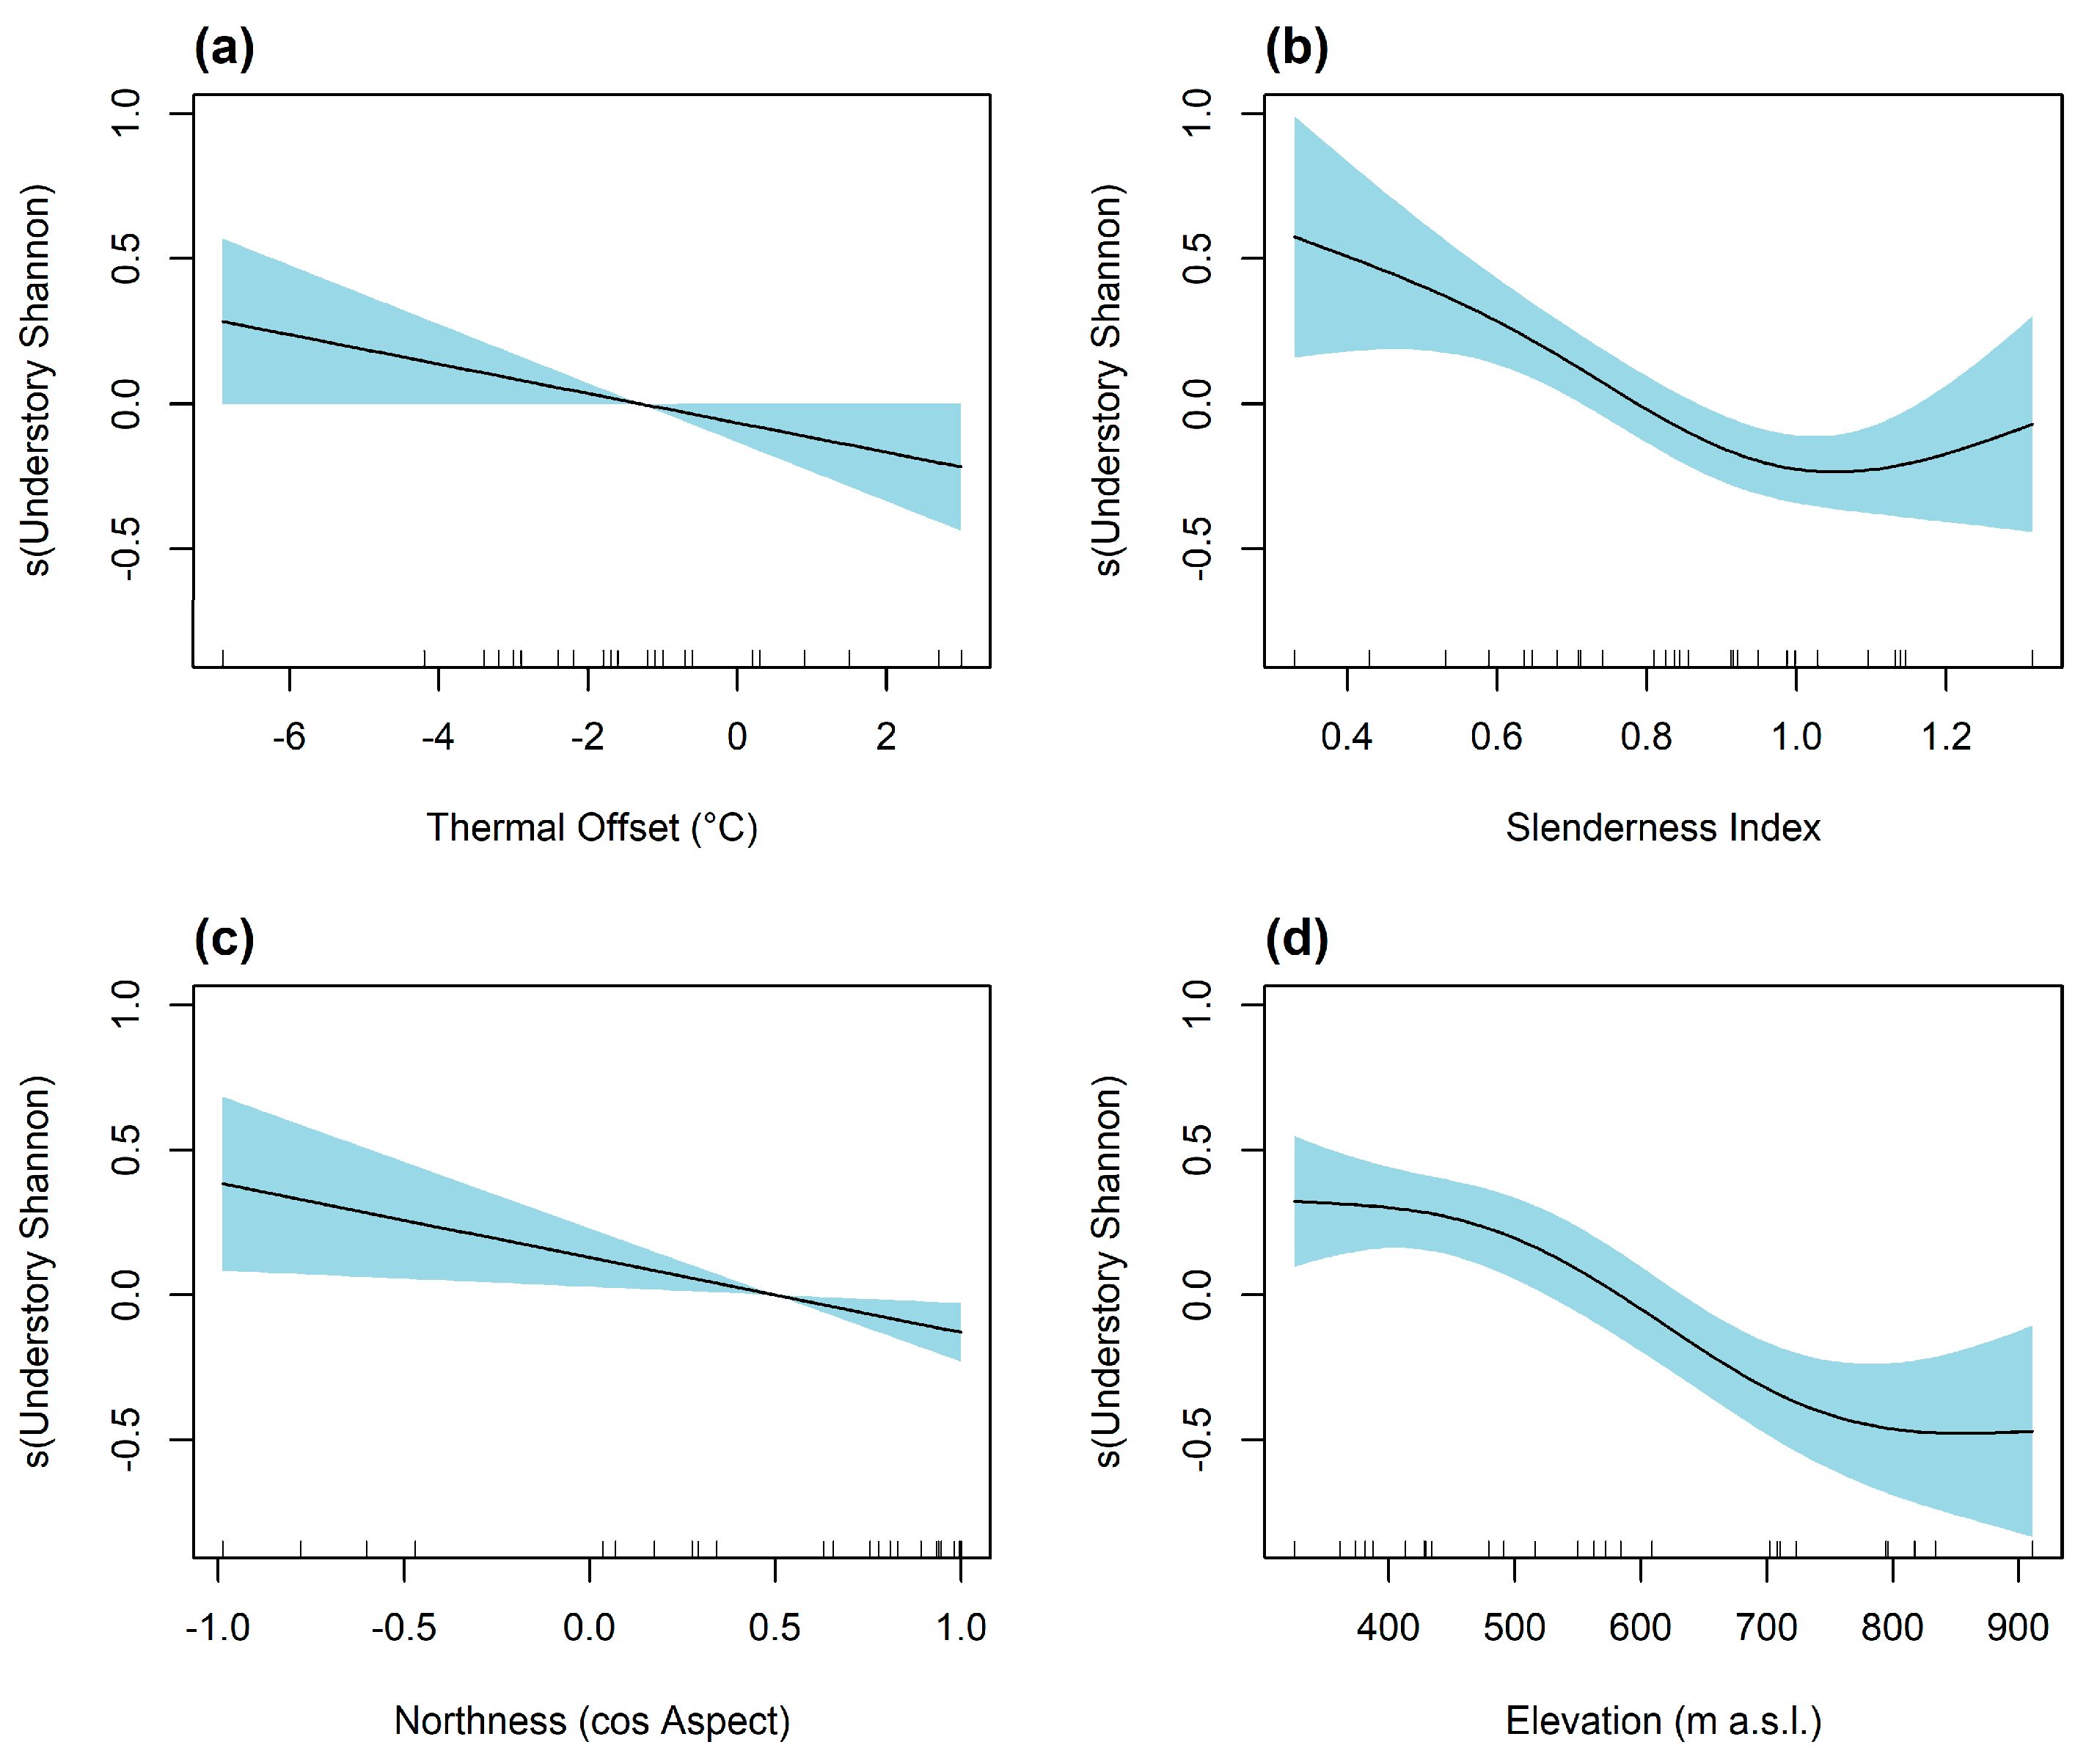
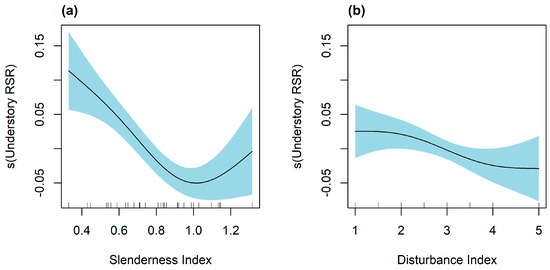
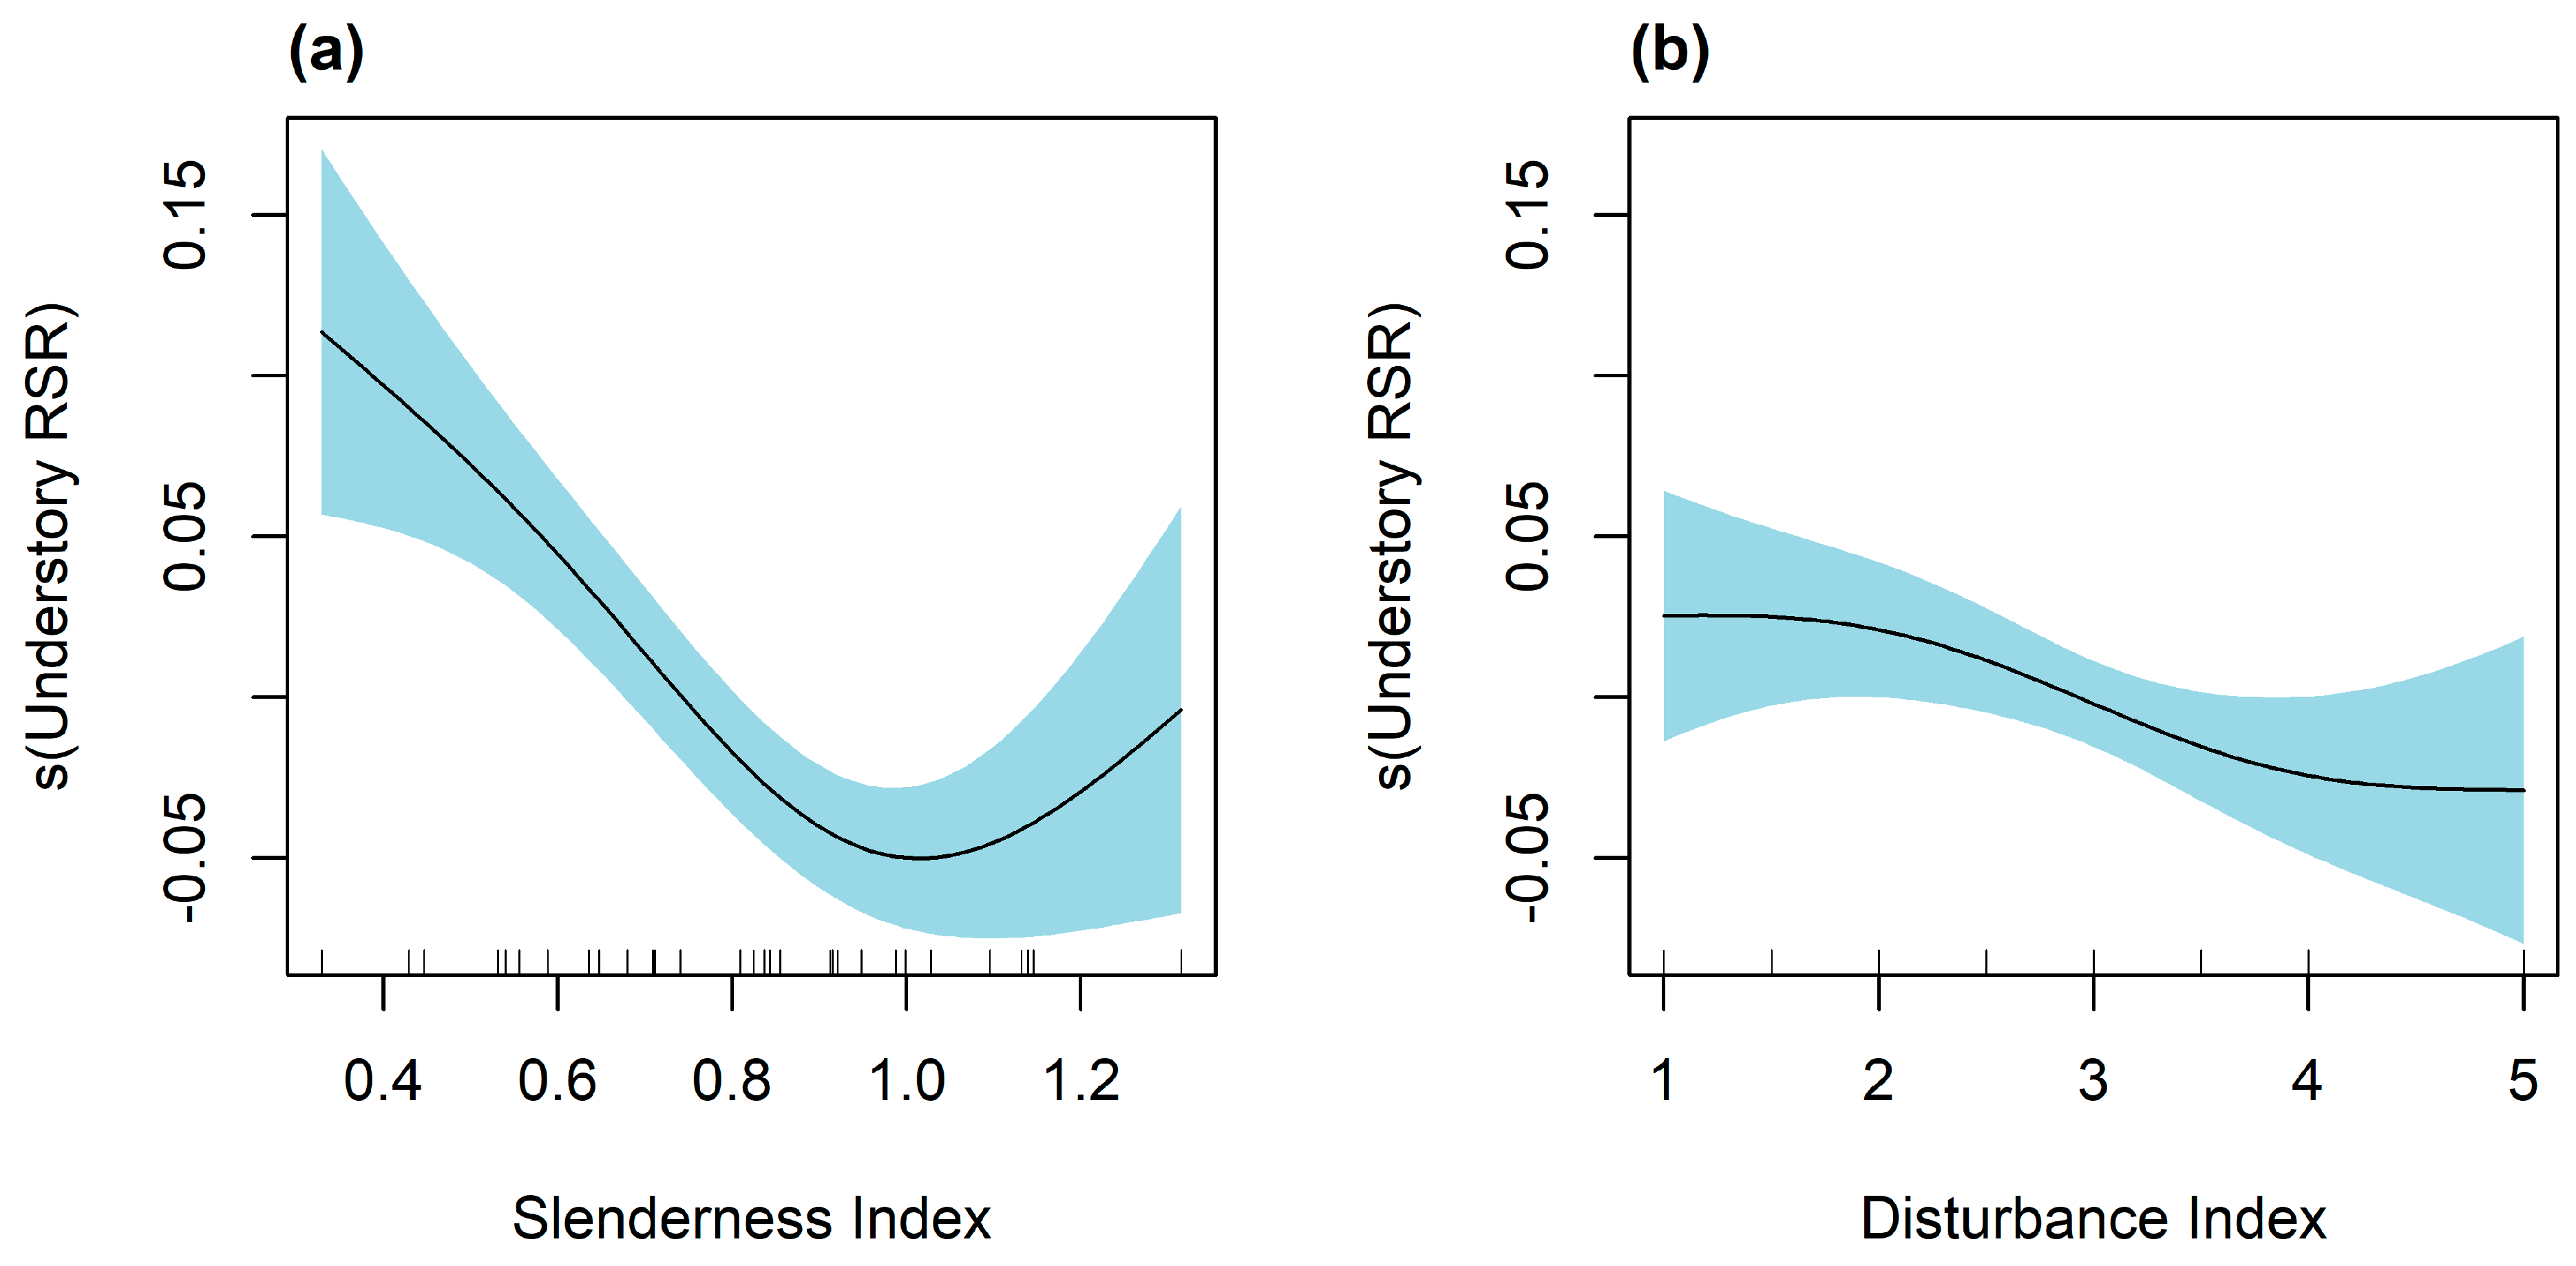

Disclaimer/Publisher’s Note: The statements, opinions and data contained in all publications are solely those of the individual author(s) and contributor(s) and not of MDPI and/or the editor(s). MDPI and/or the editor(s) disclaim responsibility for any injury to people or property resulting from any ideas, methods, instructions or products referred to in the content. |
© 2026 by the authors. Licensee MDPI, Basel, Switzerland. This article is an open access article distributed under the terms and conditions of the Creative Commons Attribution (CC BY) license.