


Abstract
Rivulid killifishes are among the most threatened components of freshwater biodiversity in the Brazilian Atlantic Forest, yet their biogeographic patterns remain poorly documented. This study provides the first comprehensive biogeographic assessment for rivulids across the Southeastern and Eastern Atlantic basins of Brazil. We compiled distribution records for 54 species, analyzing patterns of endemism, similarity between hydrographic regions, and sampling coverage. Our results reveal patterns of hyper-endemism, with 31 species (57.4%) restricted to single basins and a highly aggregated distribution. Faunal similarity between regions was negligible, indicating strong historical isolation, with only 3.7% of species shared between the Eastern and Southeastern Atlantic basins. Seventeen bioregions were delimited across the study area, with minimal faunal overlap. We identified that 50.0% of basins lack any rivulid records, despite the region having been extensively sampled for more than 150 years (including since the Thayer Expedition of 1865–1866). This study area contains the highest concentration of research institutions in Brazil, suggesting that the absence of records reflects genuine absence rather than a sampling artefact. Based on endemism values, we highlight 16 priority basins for urgent conservation management. These findings reveal that small coastal basins harbor a disproportionately high, imperiled, yet overlooked diversity. We argue that effective conservation of this unique evolutionary heritage requires targeted research in unsampled areas, basin-scale management, and expanded protected area mosaics to incorporate these high-endemism micro-basins. Our results provide the biogeographic foundation for evidence-based strategies to prevent the extinction of these fishes.
1. Introduction
Freshwater ecosystems are among the most biodiverse yet imperiled habitats globally, supporting approximately one-third of vertebrate species while facing unprecedented threats from habitat degradation, climate change, and anthropogenic disturbances [1]. Within this context, Neotropical freshwater fishes represent a particularly vulnerable component, with Brazil harboring the world’s highest freshwater fish diversity [2]. Among these, killifishes of the family Rivulidae stand out as remarkable models for evolutionary and conservation studies due to their specialized adaptations to seasonal aquatic environments and frequently restricted distributions [3].
The Brazilian Atlantic Forest and adjacent coastal drainages of the Southeastern and Eastern Atlantic basins constitute a critical biogeographic region characterized by complex geomorphological history and exceptional freshwater endemism [4,5,6]. This region encompasses 102 independent coastal basins stretching from Sergipe to São Paulo states (11° S to 25° S), creating a natural laboratory for investigating patterns of freshwater diversification in isolated drainage systems. These small, directly ocean-outlet basins present ideal conditions for studying taxa with limited dispersal capabilities, such as rivulid killifishes, whose evolutionary trajectories have been shaped by historical isolation and contemporary barriers.
Family Rivulidae comprises both annual and non-annual fish species predominantly inhabiting temporary pools, swamps, and headwater streams—habitats particularly sensitive to environmental changes [7]. Their complex life histories, including drought-resistant eggs in annual species, reflect adaptations to unpredictable aquatic environments but also render them vulnerable to habitat alteration. Despite their ecological significance and conservation concern, comprehensive biogeographic syntheses for rivulids in these coastal basins remain scarce, with most studies limited to taxonomic descriptions or regional inventories [8].
Recent advances in biodiversity informatics, including digitized museum collections (e.g., GBIF, SpeciesLink, museum databases) and georeferenced occurrence data, now enable refined spatial analyses that can identify diversity hotspots, endemism centers, and critical knowledge gaps [9]. However, persistent challenges include taxonomic inconsistencies, spatial inaccuracies in historical records, and uneven sampling effort across basins—issues that must be addressed to generate robust biogeographic patterns.
The present study addresses these gaps by integrating validated occurrence data, updated taxonomy, and hydrographic delineations to provide the first comprehensive biogeographic assessment of rivulid killifishes across the Southeastern and Eastern Atlantic basins of Brazil. Specifically, we aim to: (1) map spatial distributions and quantify species richness patterns across 102 coastal basins; (2) identify endemism hotspots using weighted endemism metrics and single-basin endemicity; (3) evaluate biogeographic affinities among basins and regions through similarity analyses; (4) assess sampling completeness and identify critical knowledge gaps for future research; and (5) discuss conservation implications for restricted-range species and prioritize basins for protection.
By synthesizing museum records, resolving spatial inconsistencies, and applying multiple biogeographic metrics, this work establishes a foundational framework for understanding rivulid diversity patterns in one of Brazil’s most threatened freshwater ecosystems. Our findings contribute not only to rivulid biology but also to broader conservation strategies in the Atlantic Forest biodiversity hotspot, where freshwater habitats face accelerating anthropogenic pressures.
The integration of spatial analysis with conservation prioritization represents a critical step toward evidence-based management of freshwater resources, particularly for taxa with high endemism and vulnerability like rivulid killifishes. As such, this study provides both scientific insights and practical tools for biodiversity conservation in rapidly changing landscapes.
2. Materials and Methods
2.1. Study Area
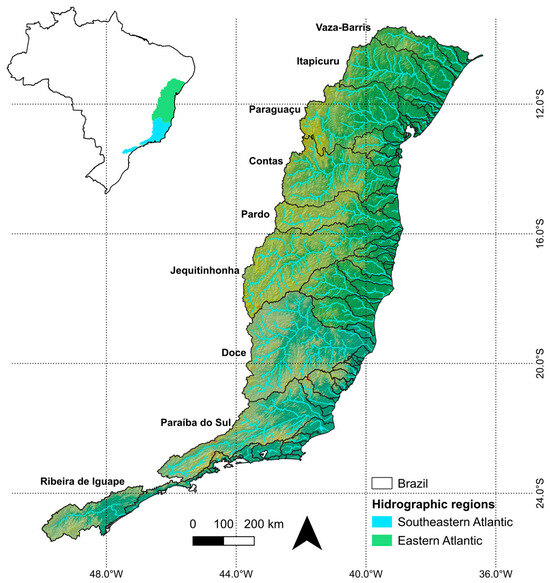
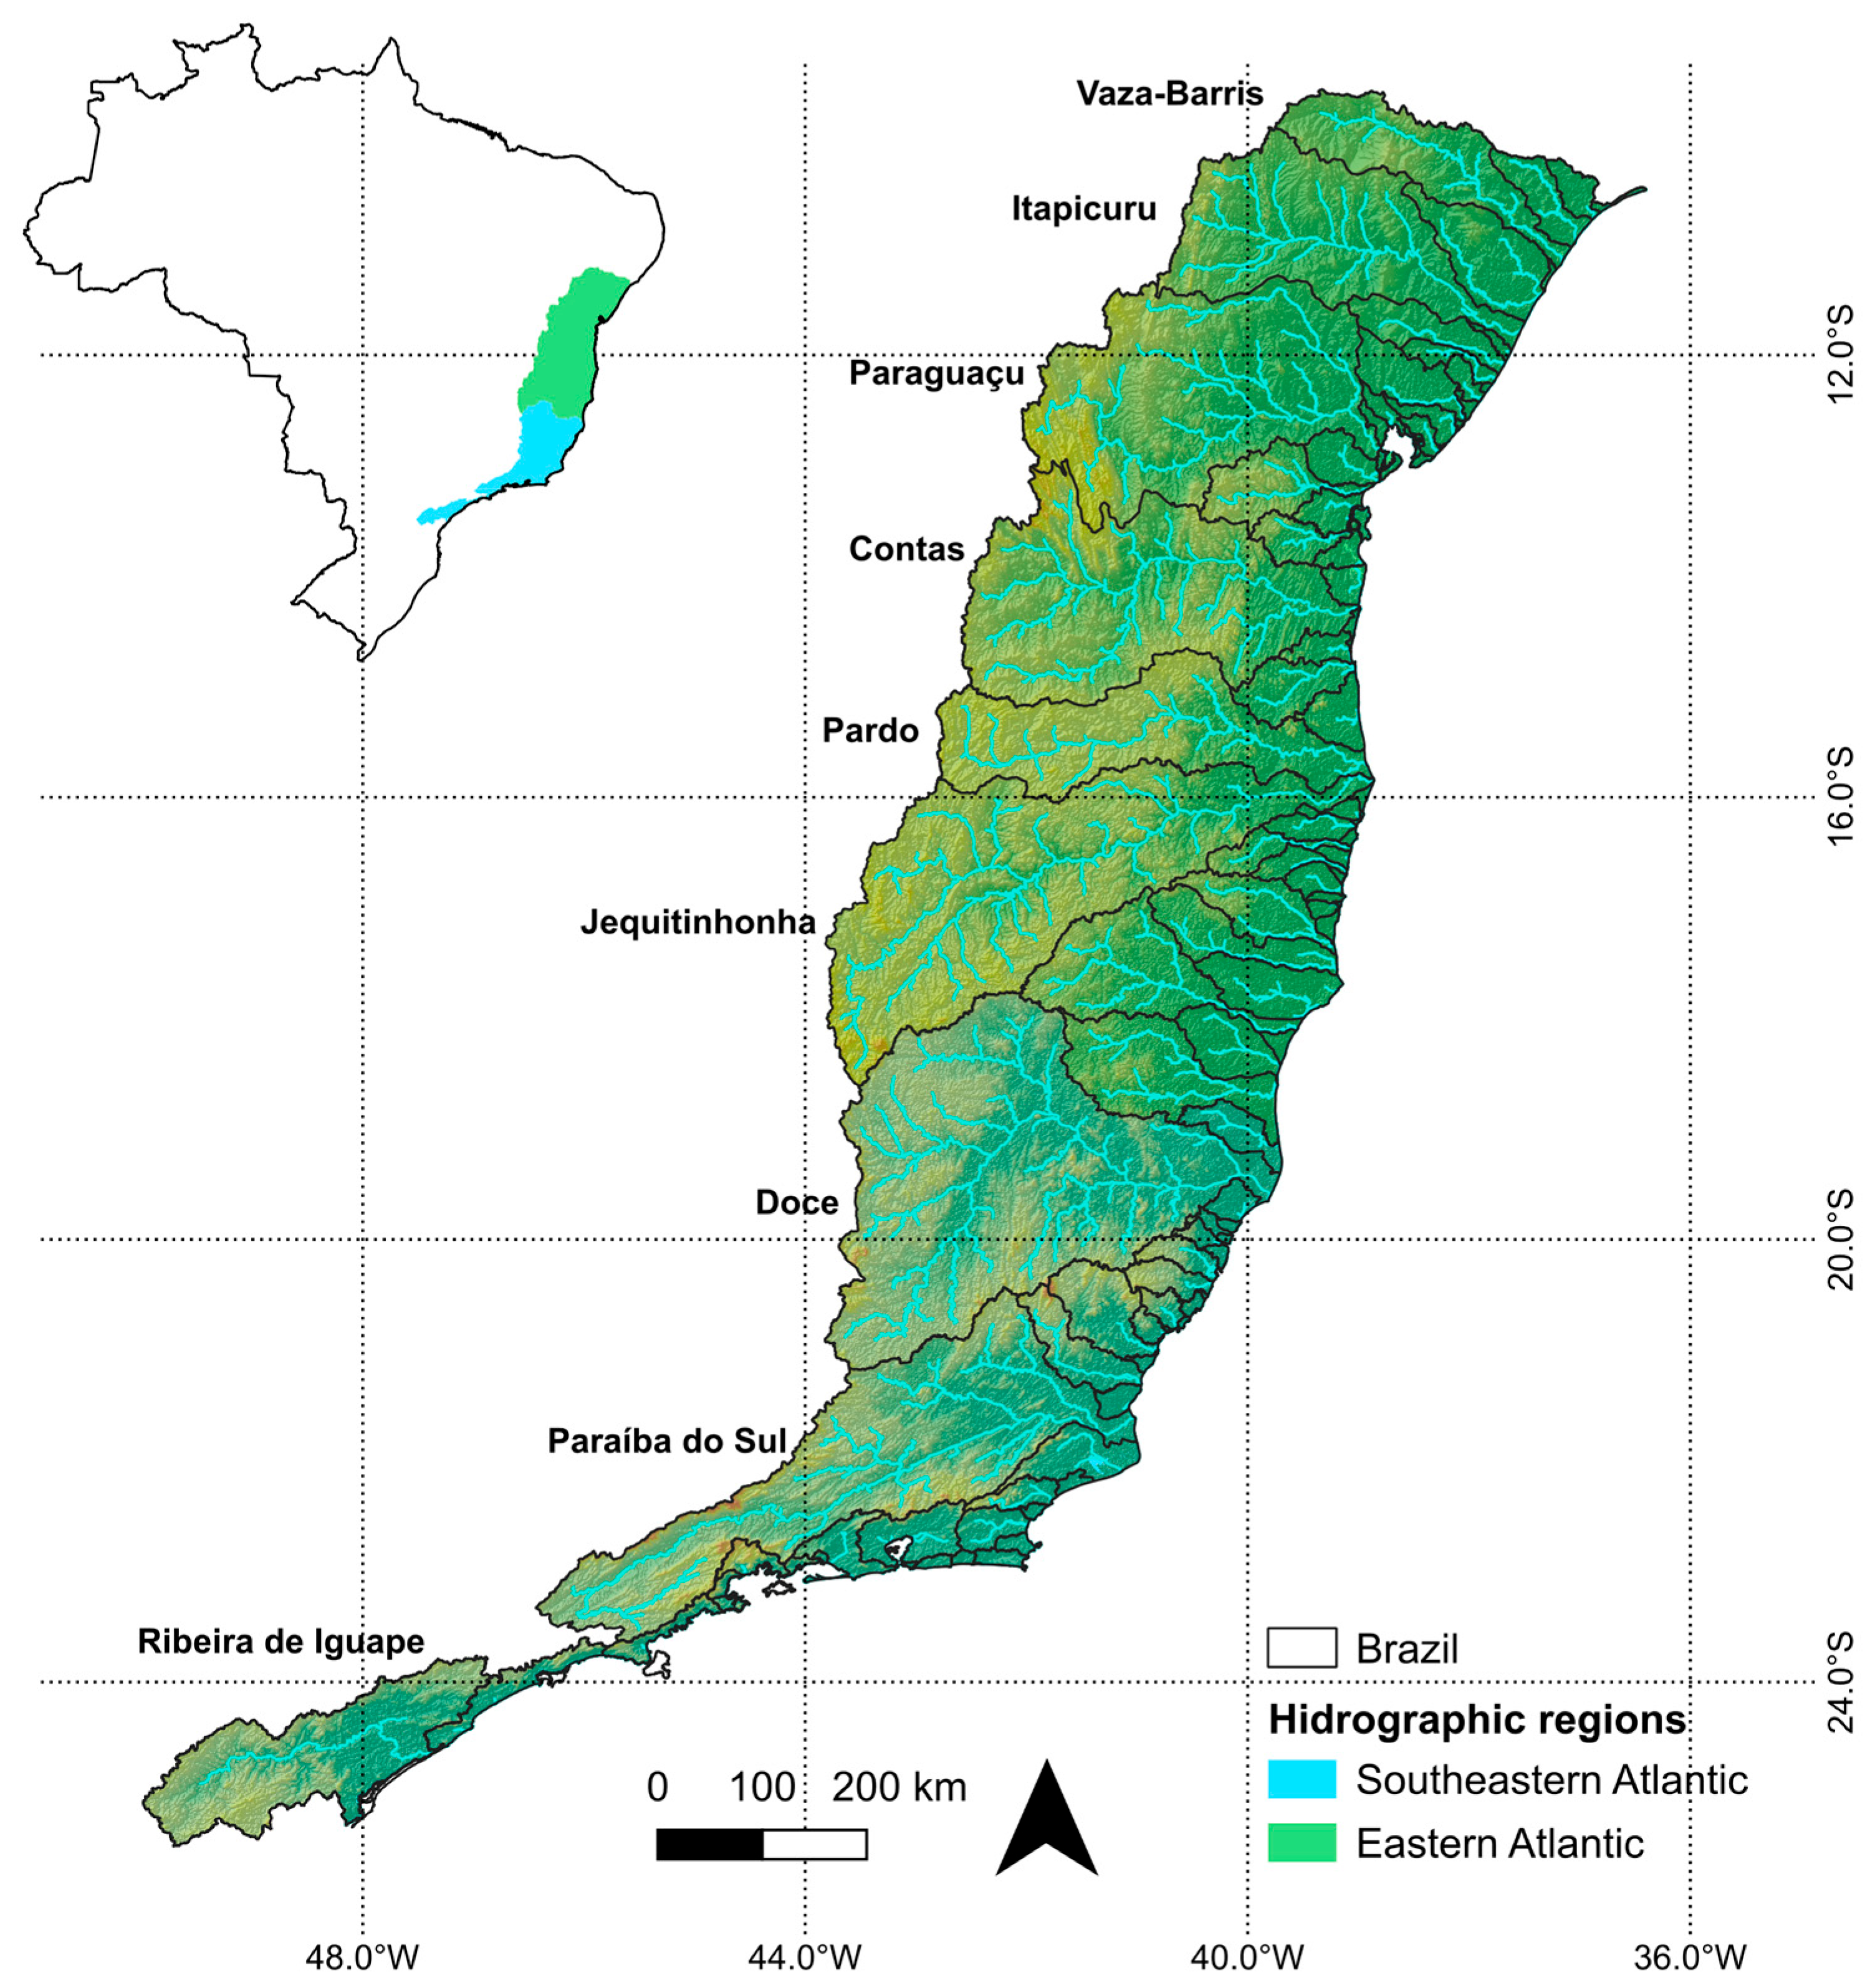
The study area encompasses two major hydrographic regions along the Brazilian coast: Eastern Atlantic (Atlântico Leste, in Portuguese) and Southeastern Atlantic (Atlântico Sudeste, in Portuguese), comprising 102 coastal basins and micro-basins from Sergipe to São Paulo states (approximately 11° S to 25° S). These regions include 60 basins in the Eastern Atlantic and 42 basins in the Southeastern Atlantic, representing independent Atlantic slope drainages with direct outlets to the ocean (Figure 1).
Figure 1.
The coastal basins of the Eastern Atlantic and Southeastern Atlantic hydrographic regions and their location in eastern Brazil. Major basins originating on the eastern margin of the Brazilian Shield are highlighted. Blue lines inside areas refer to main river drainages.
2.2. Occurrence Data Compilation and Validation
We compiled 1824 georeferenced records of Rivulidae from museum collections and scientific databases. After rigorous validation—including taxonomic standardization, geographic verification, temporal filtering (1905–2025), and duplicate removal—the final dataset comprised 1882 validated records (see Supplementary Materials S2 and S3). The increase in record count after validation resulted from the disaggregation of lot records containing multiple specimens into individual occurrence points.
The validation process followed a multi-stage approach combining semi-automated filtering and independent manual verification by two authors (LMS-S and FV-G):
1. Semi-automated filtering: Records were flagged for review if they met any of the following criteria: (i) coordinates falling outside the species’ known geographic range based on published literature [3,7]; (ii) coordinates with zero precision or falling in the ocean; (iii) taxonomic names not matching current valid nomenclature according to Catalog of Fishes [10]; (iv) collection dates prior to species description without voucher confirmation.
2. Manual verification: All flagged records (n = 347, 19% of initial dataset) were independently examined by two authors (LMS-S and FV-G). Disagreements were resolved through discussion with the third author (RFM-P). Voucher specimens were consulted for 124 questionable records (36% of flagged records) through photographs or direct museum examination.
3. Exclusion criteria application: Records were excluded if they met one or more of the following criteria:
Criteria for exclusion of doubtful records: Records were excluded from the final dataset if they met one or more of the following criteria:
Lack of georeferenced coordinates (n = 89): Records without latitude/longitude data or with coordinates that could not be reliably estimated from locality descriptions.
Geographic mismatch (n = 156): Records whose coordinates clearly conflicted with the collection locality description (e.g., coordinates placing the record in a different basin or more than 50 km from the described locality).
Taxonomic misidentification (n = 47): Records where species identification was contradicted by voucher re-examination or where the recorded species does not occur in the basin according to recent taxonomic revisions [3,7].
Duplicate records (n = 55): Multiple records with identical coordinates, collection date, and species, representing repeated entries of the same specimen or collection event.
Questionable temporal provenance (n = 0): No records were excluded solely based on collection date, as all records from 1905–2025 were retained unless other criteria applied.
To account for potential spatial sampling bias inherent in opportunistic collection data, a sampling effort layer was generated by calculating the density of collection records per unit area using kernel density estimation. This layer was used to (i) identify over sampled and under sampled regions and (ii) perform spatial thinning of records to reduce the effects of uneven sampling effort on downstream analyses [11]. The spatial thinning procedure was implemented as follows: a 5 km × 5 km grid was overlaid on the study area, and when multiple records fell within the same grid cell, only one record was retained per species per cell. This approach reduces local sampling bias (e.g., repeated collection at the same locality or temporary pool) while preserving regional distribution patterns. The 5 km cell size was chosen to approximate the typical spatial resolution of collection locality descriptions while avoiding over-thinning that could erase genuine micro-endemism signals. After thinning, the dataset was reduced from 1882 to 1247 unique species-locality combinations. All subsequent analyses were performed on the thinned dataset unless otherwise specified.
2.3. Hydrographic Units
Basin boundaries were obtained from official hydrographic databases and validated using QGIS 3.40. Each occurrence record was assigned to a specific basin through a two-step process: (i) table-based assignment, an initial assignment using basin names from collection records; (ii) spatial validation by a point-in-polygon spatial join in QGIS to verify and correct assignments.
2.4. Data Analysis
2.4.1. Alpha Diversity and Sampling Effort
Species richness was calculated per basin. To assess spatial aggregation of records, we used the Coefficient of Variation (CV = standard deviation/mean × 100), where high values indicate aggregated distributions and low values indicate homogeneous distributions. To evaluate sampling completeness and permit meaningful comparisons across basins with differing collection intensities, we employed sample-based rarefaction and extrapolation curves [12]. This approach standardizes richness estimates to a common number of records, and the asymptotic behavior of the curves indicates sampling sufficiency [13]. Additionally, we computed nonparametric estimators (Chao-2 and Jackknife-1) to estimate total expected richness per basin [14]. Basins where the rarefaction curve approached an asymptote (i.e., adding more records yielded <5% increase in estimated richness) were considered well-sampled. Basins where curves remained linear or showed steep upward trajectories were considered under-sampled, and their observed richness was interpreted as minimum estimates.
2.4.2. Endemism Metrics
We employed multiple endemism metrics for each basin: (i) Single-basin endemics, defined as species occurring in only one basin; (ii) Weighted Endemism (WE): WE = Σ (1/n_i) where n_i = number of basins occupied by species i [15]; (iii) Relative Weighted Endemism (RWE): RWE = WE/total species richness; and (iv) Endemism rate: Percentage of endemic species relative to total species.
2.4.3. Beta Diversity and Biogeographic Structure
We calculated pairwise similarity between basins using the Jaccard index (presence/absence data). To disentangle the processes structuring assemblage composition, we partitioned beta diversity into turnover (species replacement) and nestedness (richness difference) components following Baselga [16,17]. We calculated multiple site dissimilarity measures using the Sørensen family of indices: βsor (total dissimilarity), βsim (turnover component), and βsne (nestedness resultant component) [17,18]. Biogeographic patterns were visualized through UPGMA cluster analysis based on dissimilarity matrices. Significance of differences between regions was tested using PERMANOVA (adonis2, 999 permutations). Non-metric Multidimensional Scaling (NMDS) was initially attempted but resulted in stress = 0 due to data sparsity, therefore only UPGMA cluster analysis is presented.
2.4.4. Species–Area Relationships
We tested the species–area relationship using log-log regression: log(S) = log(c) + z·log(A) where S = species richness, A = basin area, c = constant, z = slope parameter [19].
2.4.5. Hotspot Identification
To identify centers of endemism independent of basin boundaries, we overlaid a standardized grid (0.5° × 0.5° cells) over the study area and calculated species richness, we again employed the Weighted Endemism (WE) and the Relative Weighted Endemism (RWE) indices for each grid cell [20,21]. Randomization tests (999 iterations) were performed to assess whether observed RWE values were significantly higher than expected given the species richness of each cell, thereby identifying statistically significant centers of endemism [21]. Results from this grid-based analysis were visualized as thematic maps and integrated with gap analysis to identify under sampled basins and priority areas for future collection.
2.4.6. Bioregionalization
Delimitation of biogeographical units within the study area was performed through the Infomap Bioregions 2 algorithm [22]. This algorithm handles even inconsistent sampling efforts through an adaptive resolution approach. It constructs a bipartite network of species and grids, followed by network-based clustering to define bioregions characterized by specific taxa. The following parameters were employed: cell size ranging from 1/16° to 1° and cell capacity ranging from 1 to 100 samples, 100 trials. Due to their broad distributions, Kryptolebias hermaphroditus and K. ocellatus were removed from the analysis to avoid noise, as they were considered biogeographically uninformative. The remaining settings followed the program defaults. A cluster analysis was performed to assess faunal similarity among the identified bioregions. This analysis was based on a binary matrix derived from the bioregionalization algorithm and employed UPGMA clustering using Jaccard’s dissimilarity coefficient.
2.4.7. Conservation Assessment
Species were categorized by distribution range: Critically restricted: ≤2 basins; Restricted: 3–5 basins; Widespread: >5 basins. Conservation status was discussed in relation to IUCN criteria and existing protected areas [23].
All analyses were conducted using: Spatial processing: QGIS 3.40 (point-in-polygon joins, thematic mapping); Statistical analysis: Python 3.12 with pandas, geopandas, scipy, and numpy; R 4.5.3 with vegan; Data visualization: Matplotlib and seaborn for graphs, QGIS for maps. Reproducibility: Complete analysis scripts and processed data are available in Supplementary Material S1.
2.4.8. Multivariate Modeling of Richness Drivers (GLM)
To evaluate the simultaneous effects of basin area and sampling intensity on species richness, we constructed a generalized linear model (GLM) with Poisson error distribution, appropriate for count data [19]. Species richness per basin was used as the response variable. Predictor variables were log10-transformed basin area (km2) and log10-transformed sampling intensity (records·km−2). The full model was specified as:
log(Richness) = β0 + β1·log10(Area) + β2·log10(Intensity)
An interaction term (β3·log10(Area) × log10(Intensity)) was tested to assess whether the effect of sampling intensity depends on basin size. Model fit was evaluated using the pseudo-R2 of McFadden [24], and overdispersion was assessed by dividing the Pearson chi-square statistic by the residual degrees of freedom (values > 1.5 indicating overdispersion, in which case a quasipoisson model would be preferred). All analyses were performed in R 4.5.3 using the glm function.
3. Results
3.1. Data Compilation and Spatial Coverage
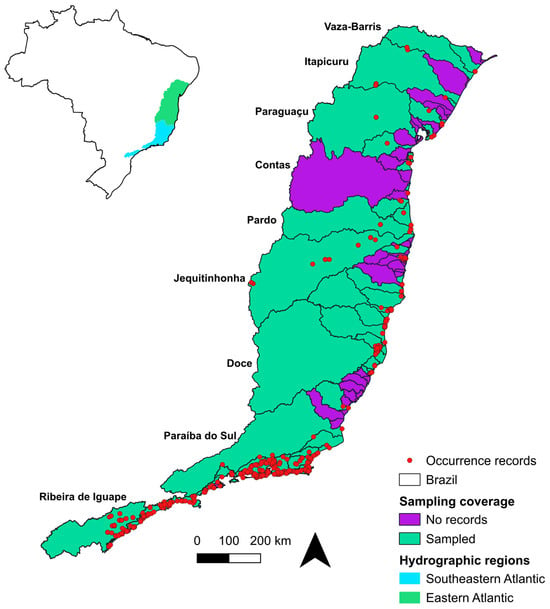
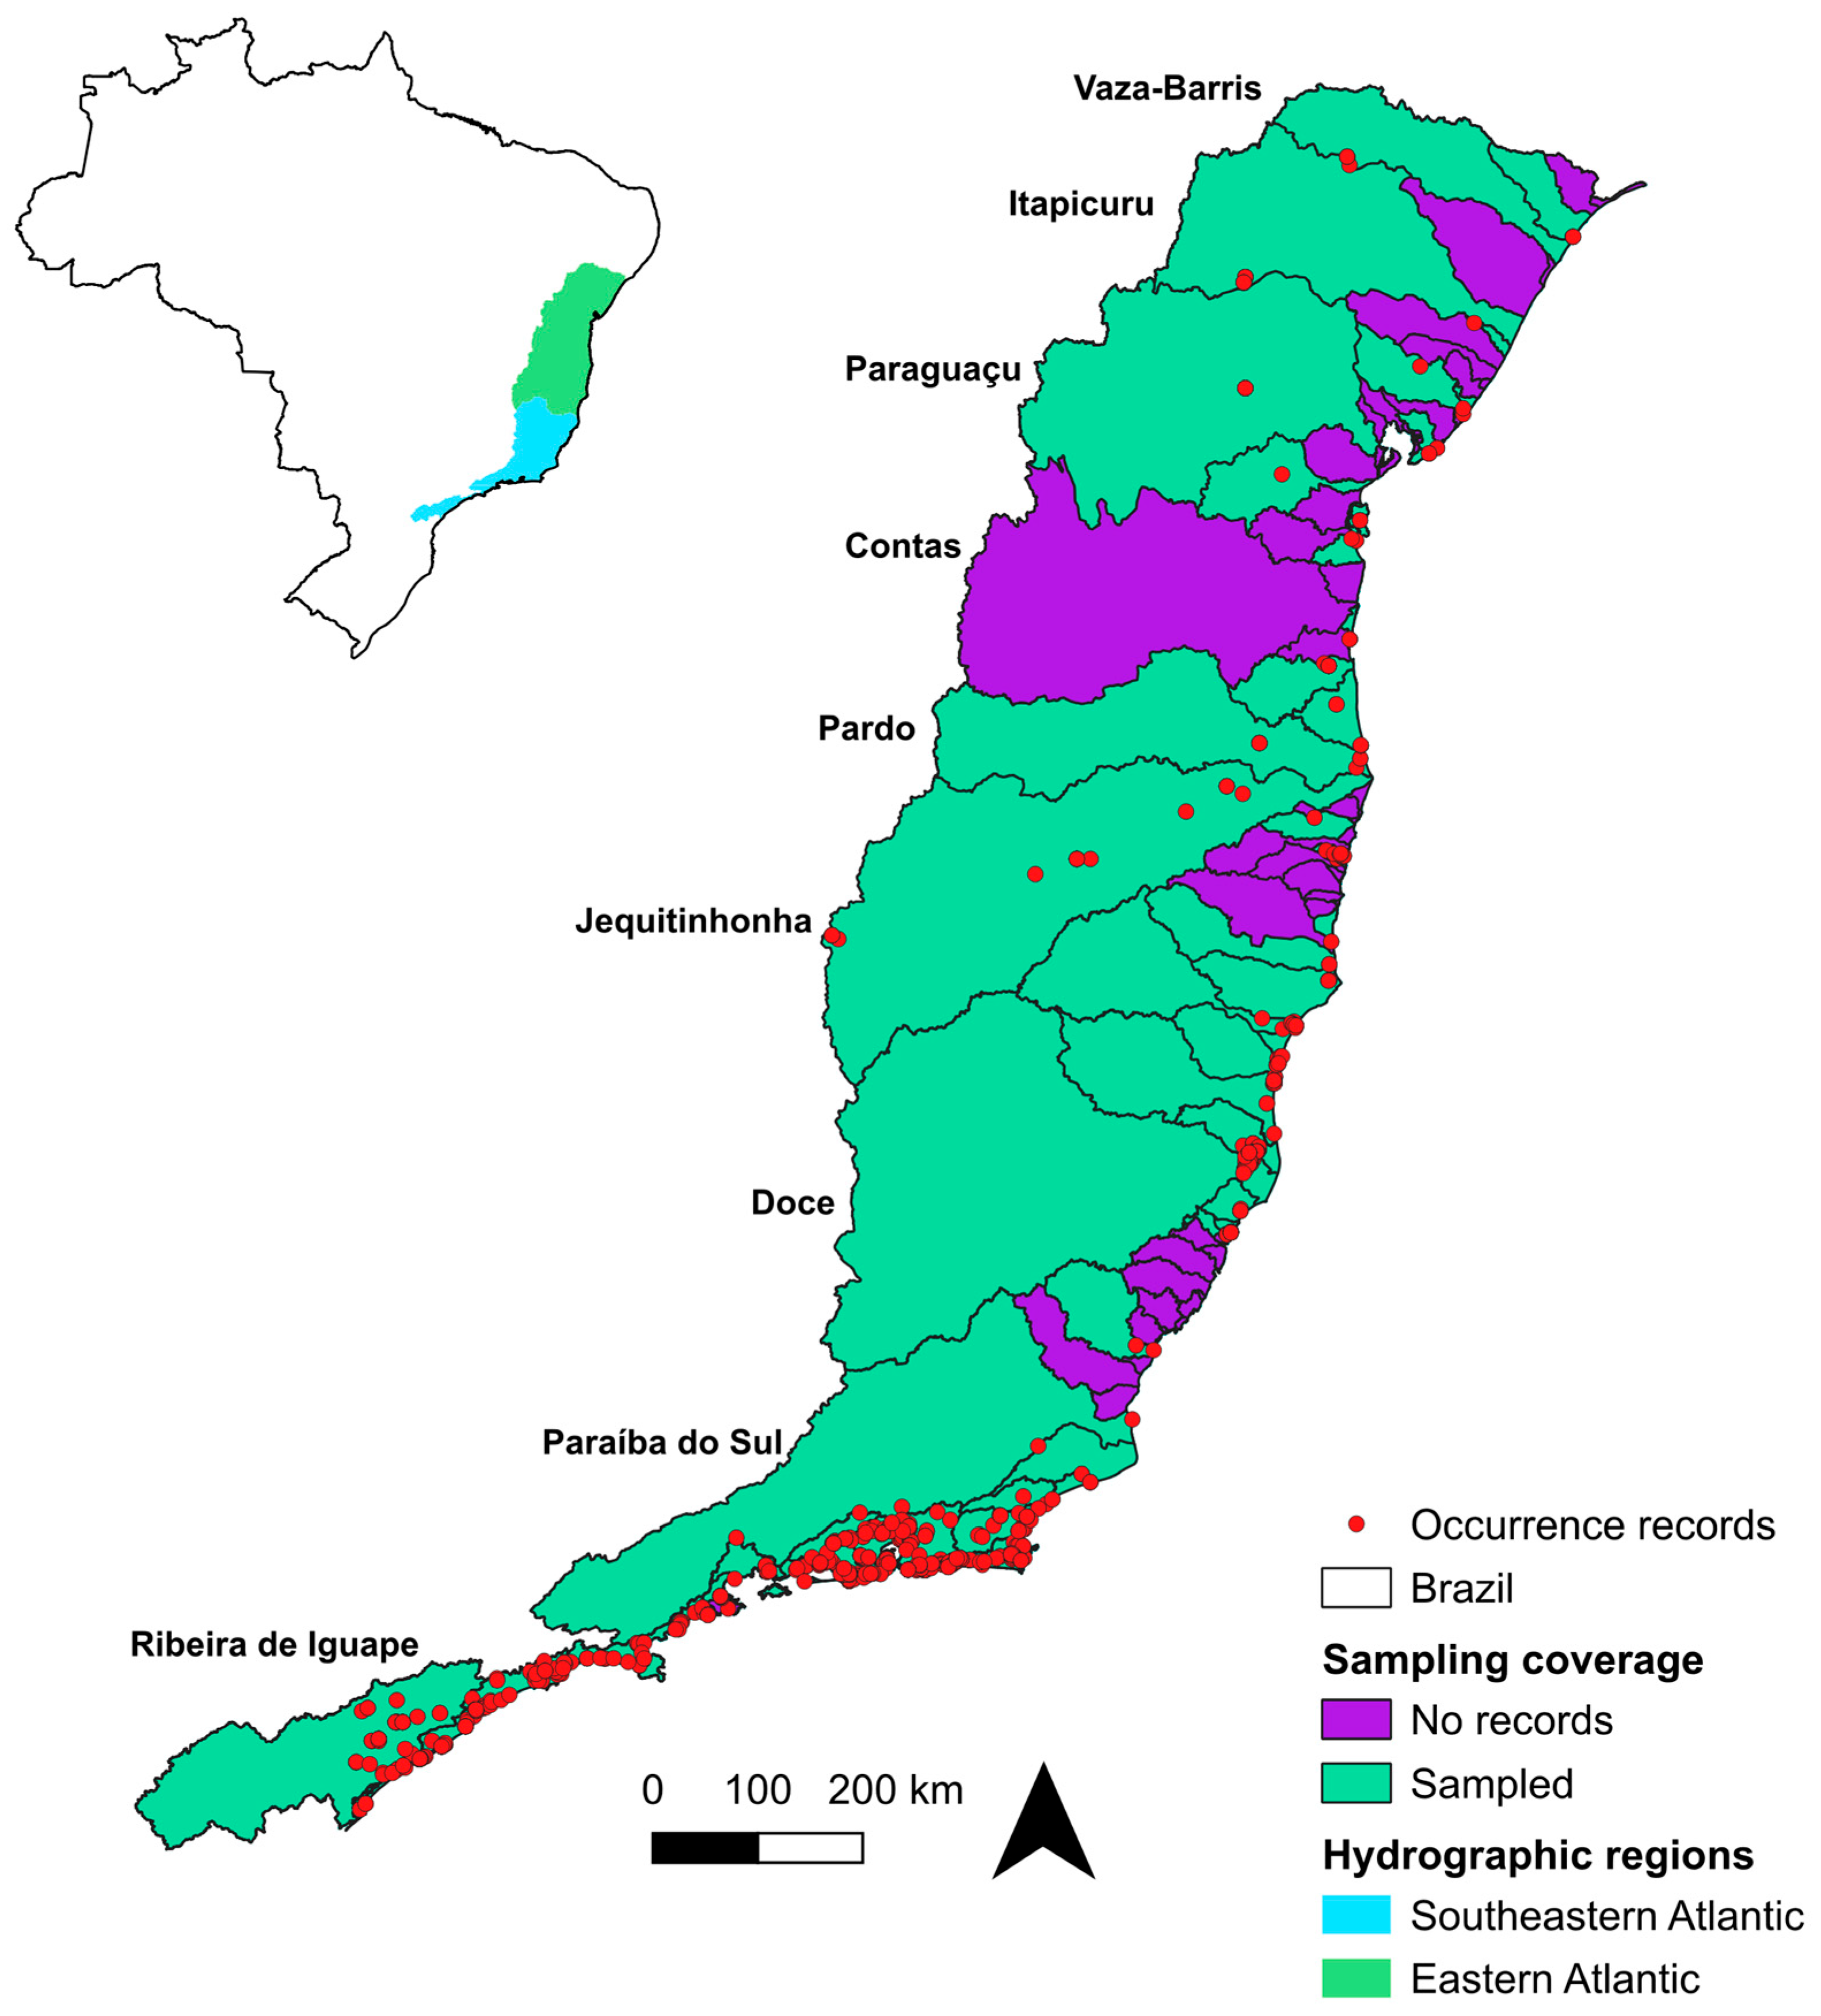
The final dataset comprised 1882 georeferenced records of 54 species of Rivulidae distributed across 51 of the 102 coastal basins (50% spatial coverage). A total of 51 basins (50%) lacked any rivulid records. This study area contains the highest concentration of universities and research institutions in Brazil and has been systematically surveyed since the Thayer Expedition (1865–1866). These 51 basins have been visited by ichthyologists over more than a century but have never yielded rivulid specimens, suggesting that the absence of Rivulidae is genuine rather than an artifact of insufficient sampling. Most of these basins are located in the Eastern Atlantic hydrographic region (Table 1, Figure 2, Supplementary Table S1).
Table 1.
Summary of occurrence data and endemism for Rivulidae in the Eastern and Southeastern Atlantic coastal basins.
Figure 2.
Sampling coverage in coastal basins of the Eastern Atlantic and Southeastern Atlantic hydrographic regions. Red dots represent validated occurrence records of Rivulidae (n = 1882). Basins in purple present no recorded occurrences, while green basins indicate areas with occurrence records.
3.2. Spatial Coverage, Species Richness and Distribution Patterns
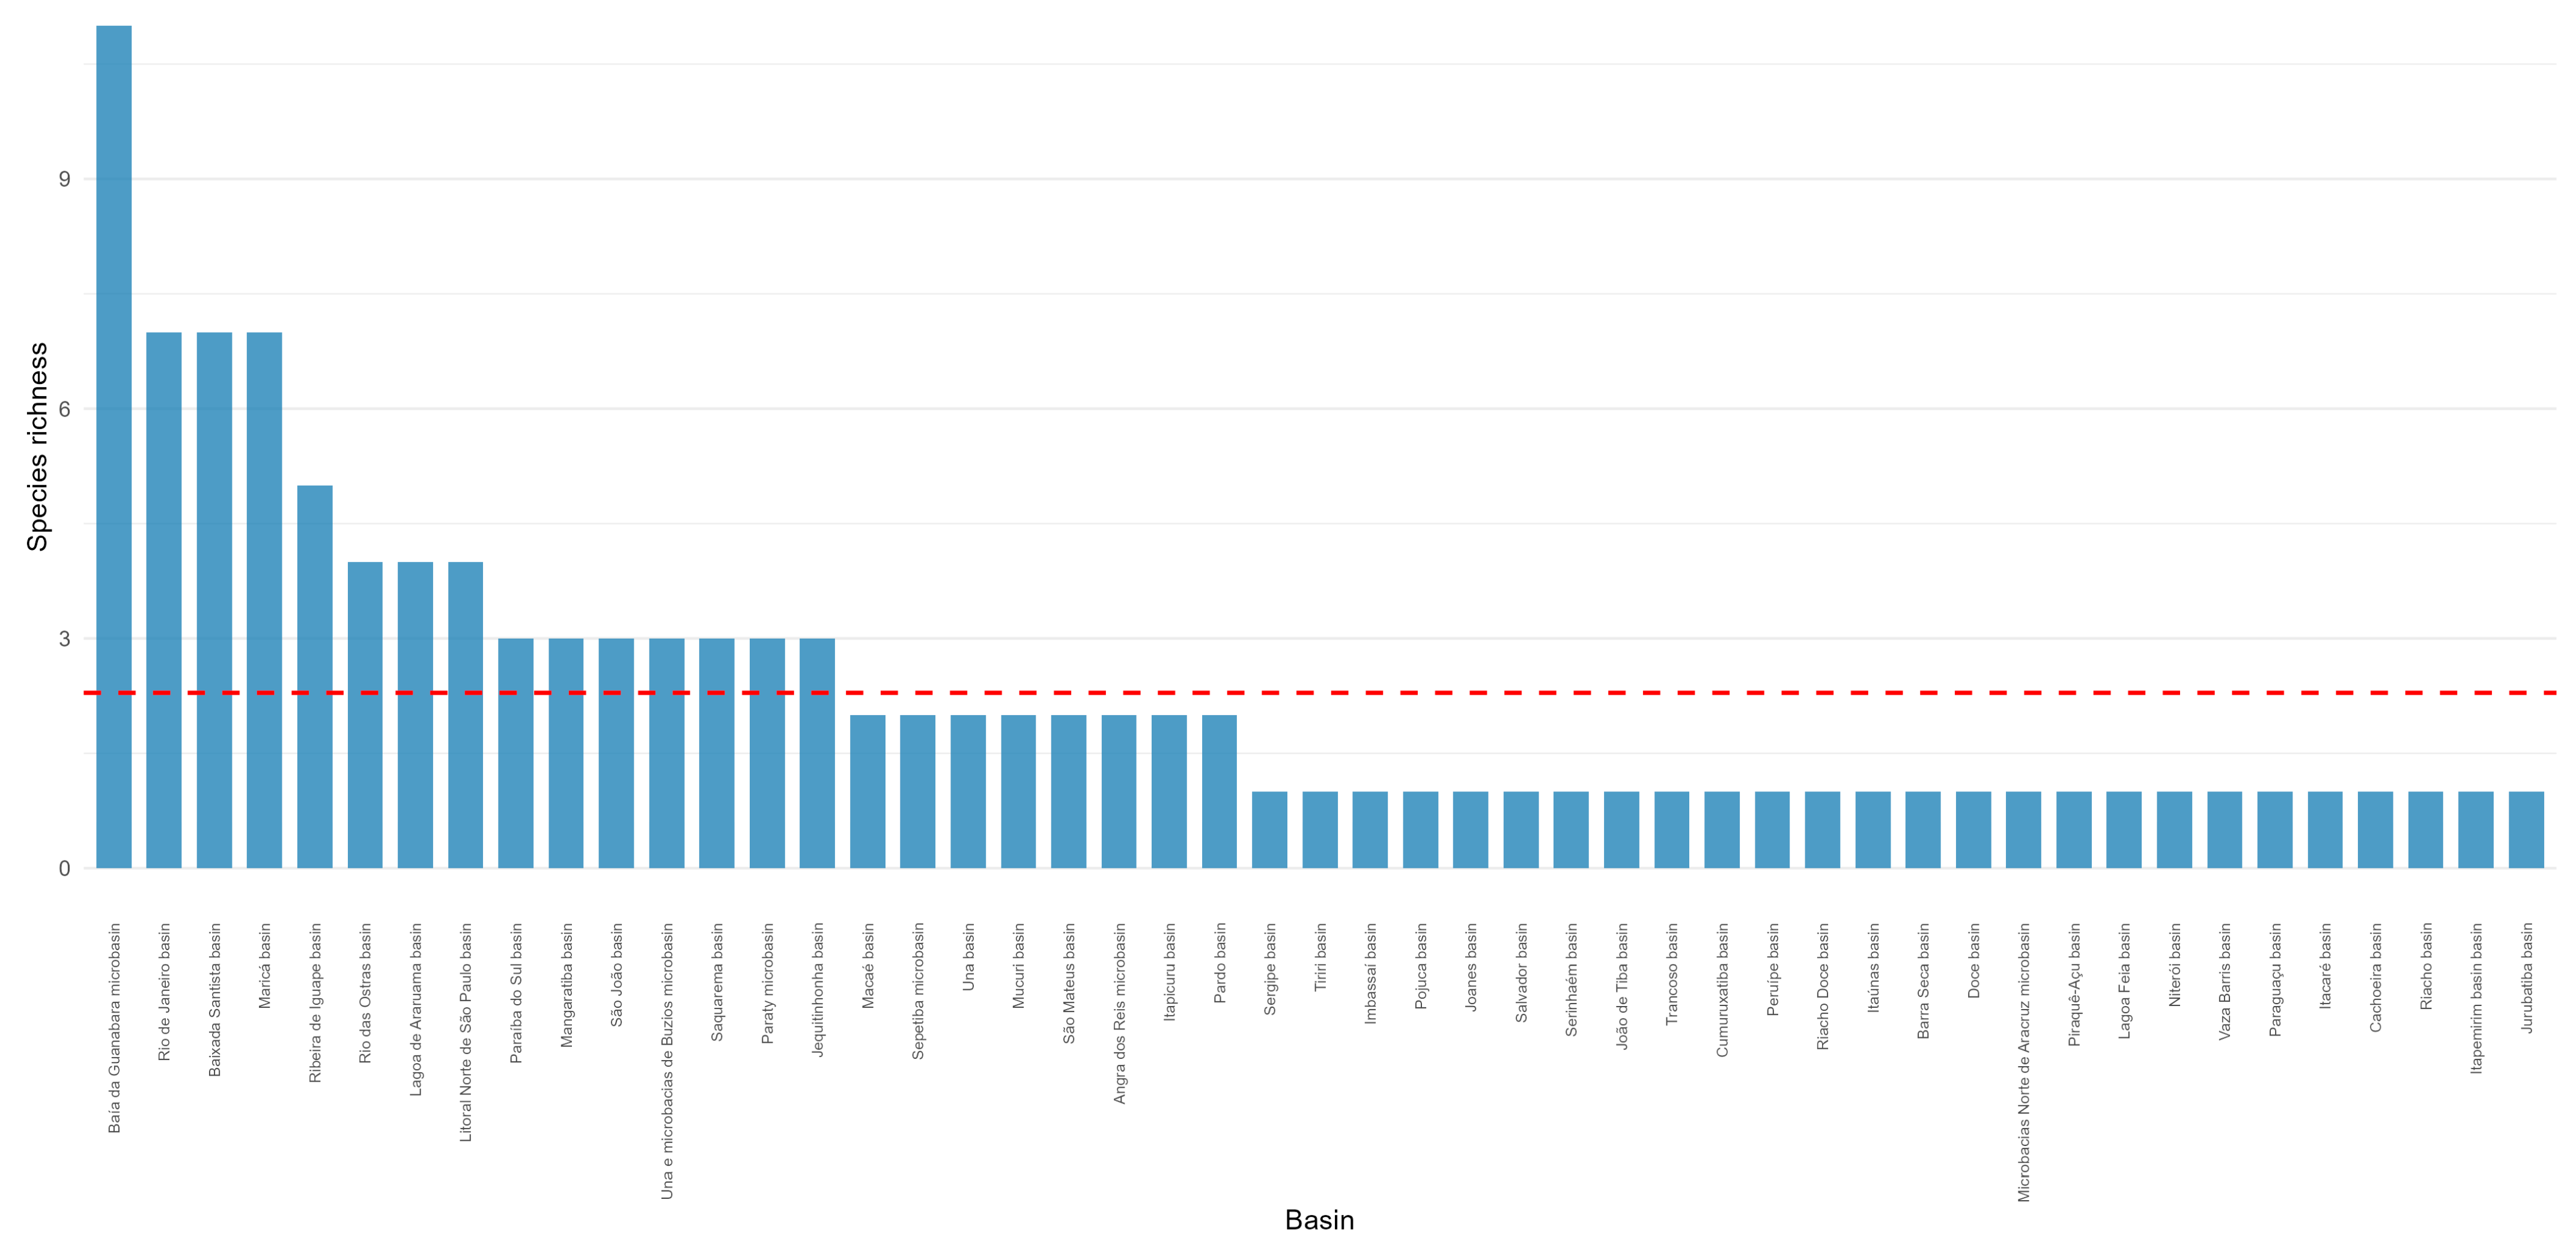
Species distribution showed strong spatial aggregation, with a coefficient of variation of 204.7% in records per basin (mean = 36.9 records/basin, median = 10, range = 1–442). The most intensively sampled basin (Baía da Guanabara micro-basins) presented 442 records (23.5% of total). The highest species richness occurs in the Baía de Guanabara micro-basins, with 11 species, followed by the Maricá, Rio de Janeiro, and Baixada Santista micro-basins, which harbor seven species each. In contrast, 51 basins—despite comparable sampling effort over more than a century—have never yielded any rivulid specimens, reinforcing that the absence is biologically meaningful (Figure 2).
3.3. Patterns of Endemism
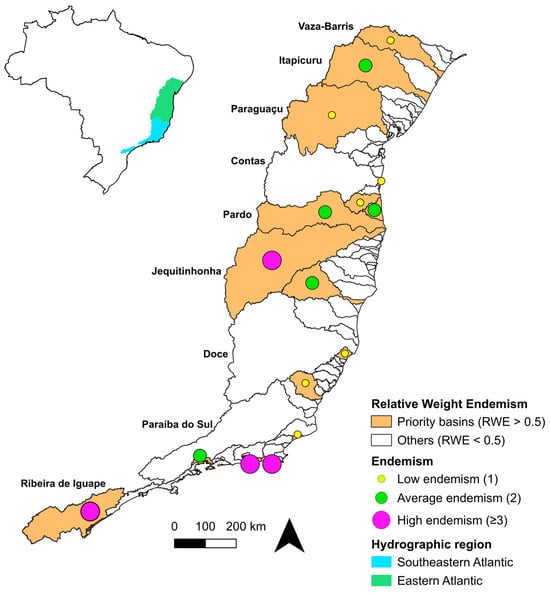
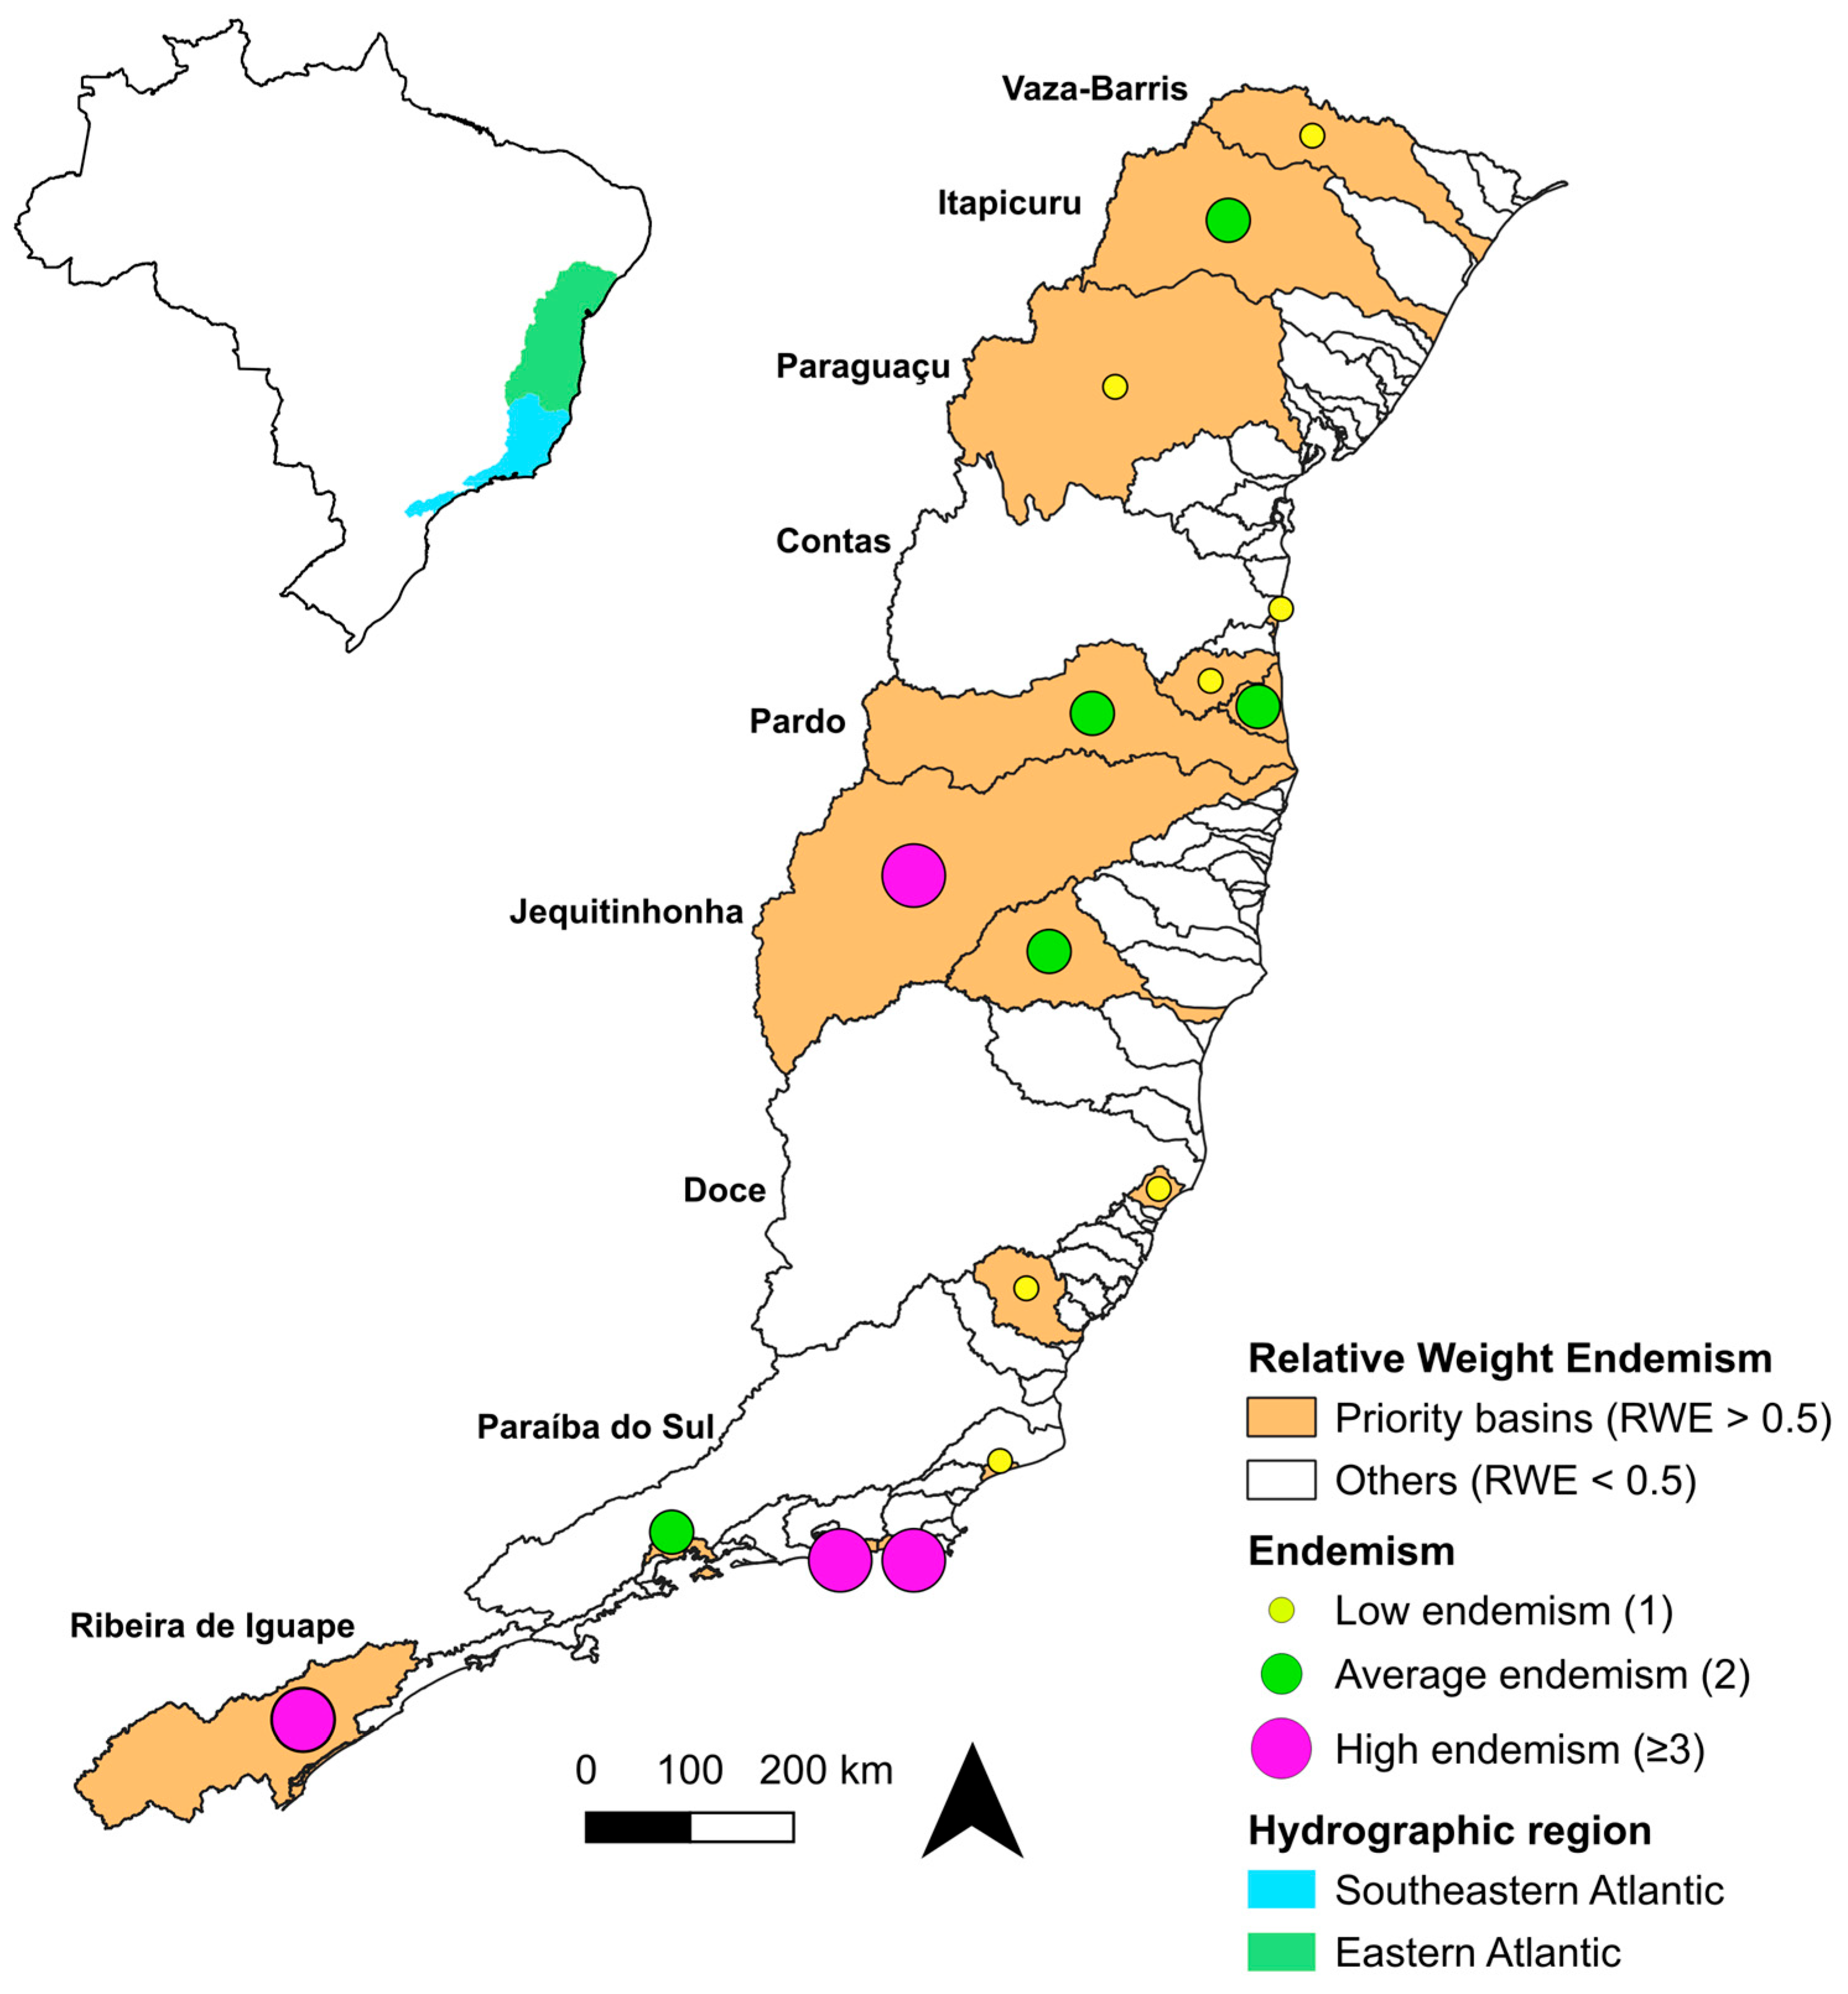
Endemism was notably high, with 31 species (57.4%) restricted to single basins (Table 2). Weighted Endemism (WE) values varied considerably across basins, with the highest values observed in Microbacias de Maricá (WE = 5.167), Ribeira de Iguape e Litoral Sul (WE = 4.000), and Jequitinhonha basin (WE = 3.000) (Figure 3). Using Relative Weighted Endemism (RWE) as a standardized metric, we identified 16 basins with RWE > 0.5, which we consider priority areas for conservation (Table 3 and Figure 2).
Table 2.
Single-basin endemic species.
Figure 3.
Relative weighted endemism (RWE) patterns across coastal basins and number of endemic species per priority basin.
Table 3.
Priority basins for conservation (RWE > 0.5).
3.4. Biogeographic Affinities
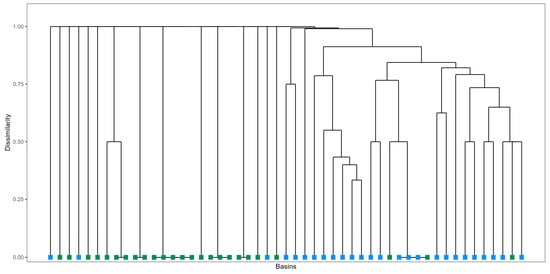
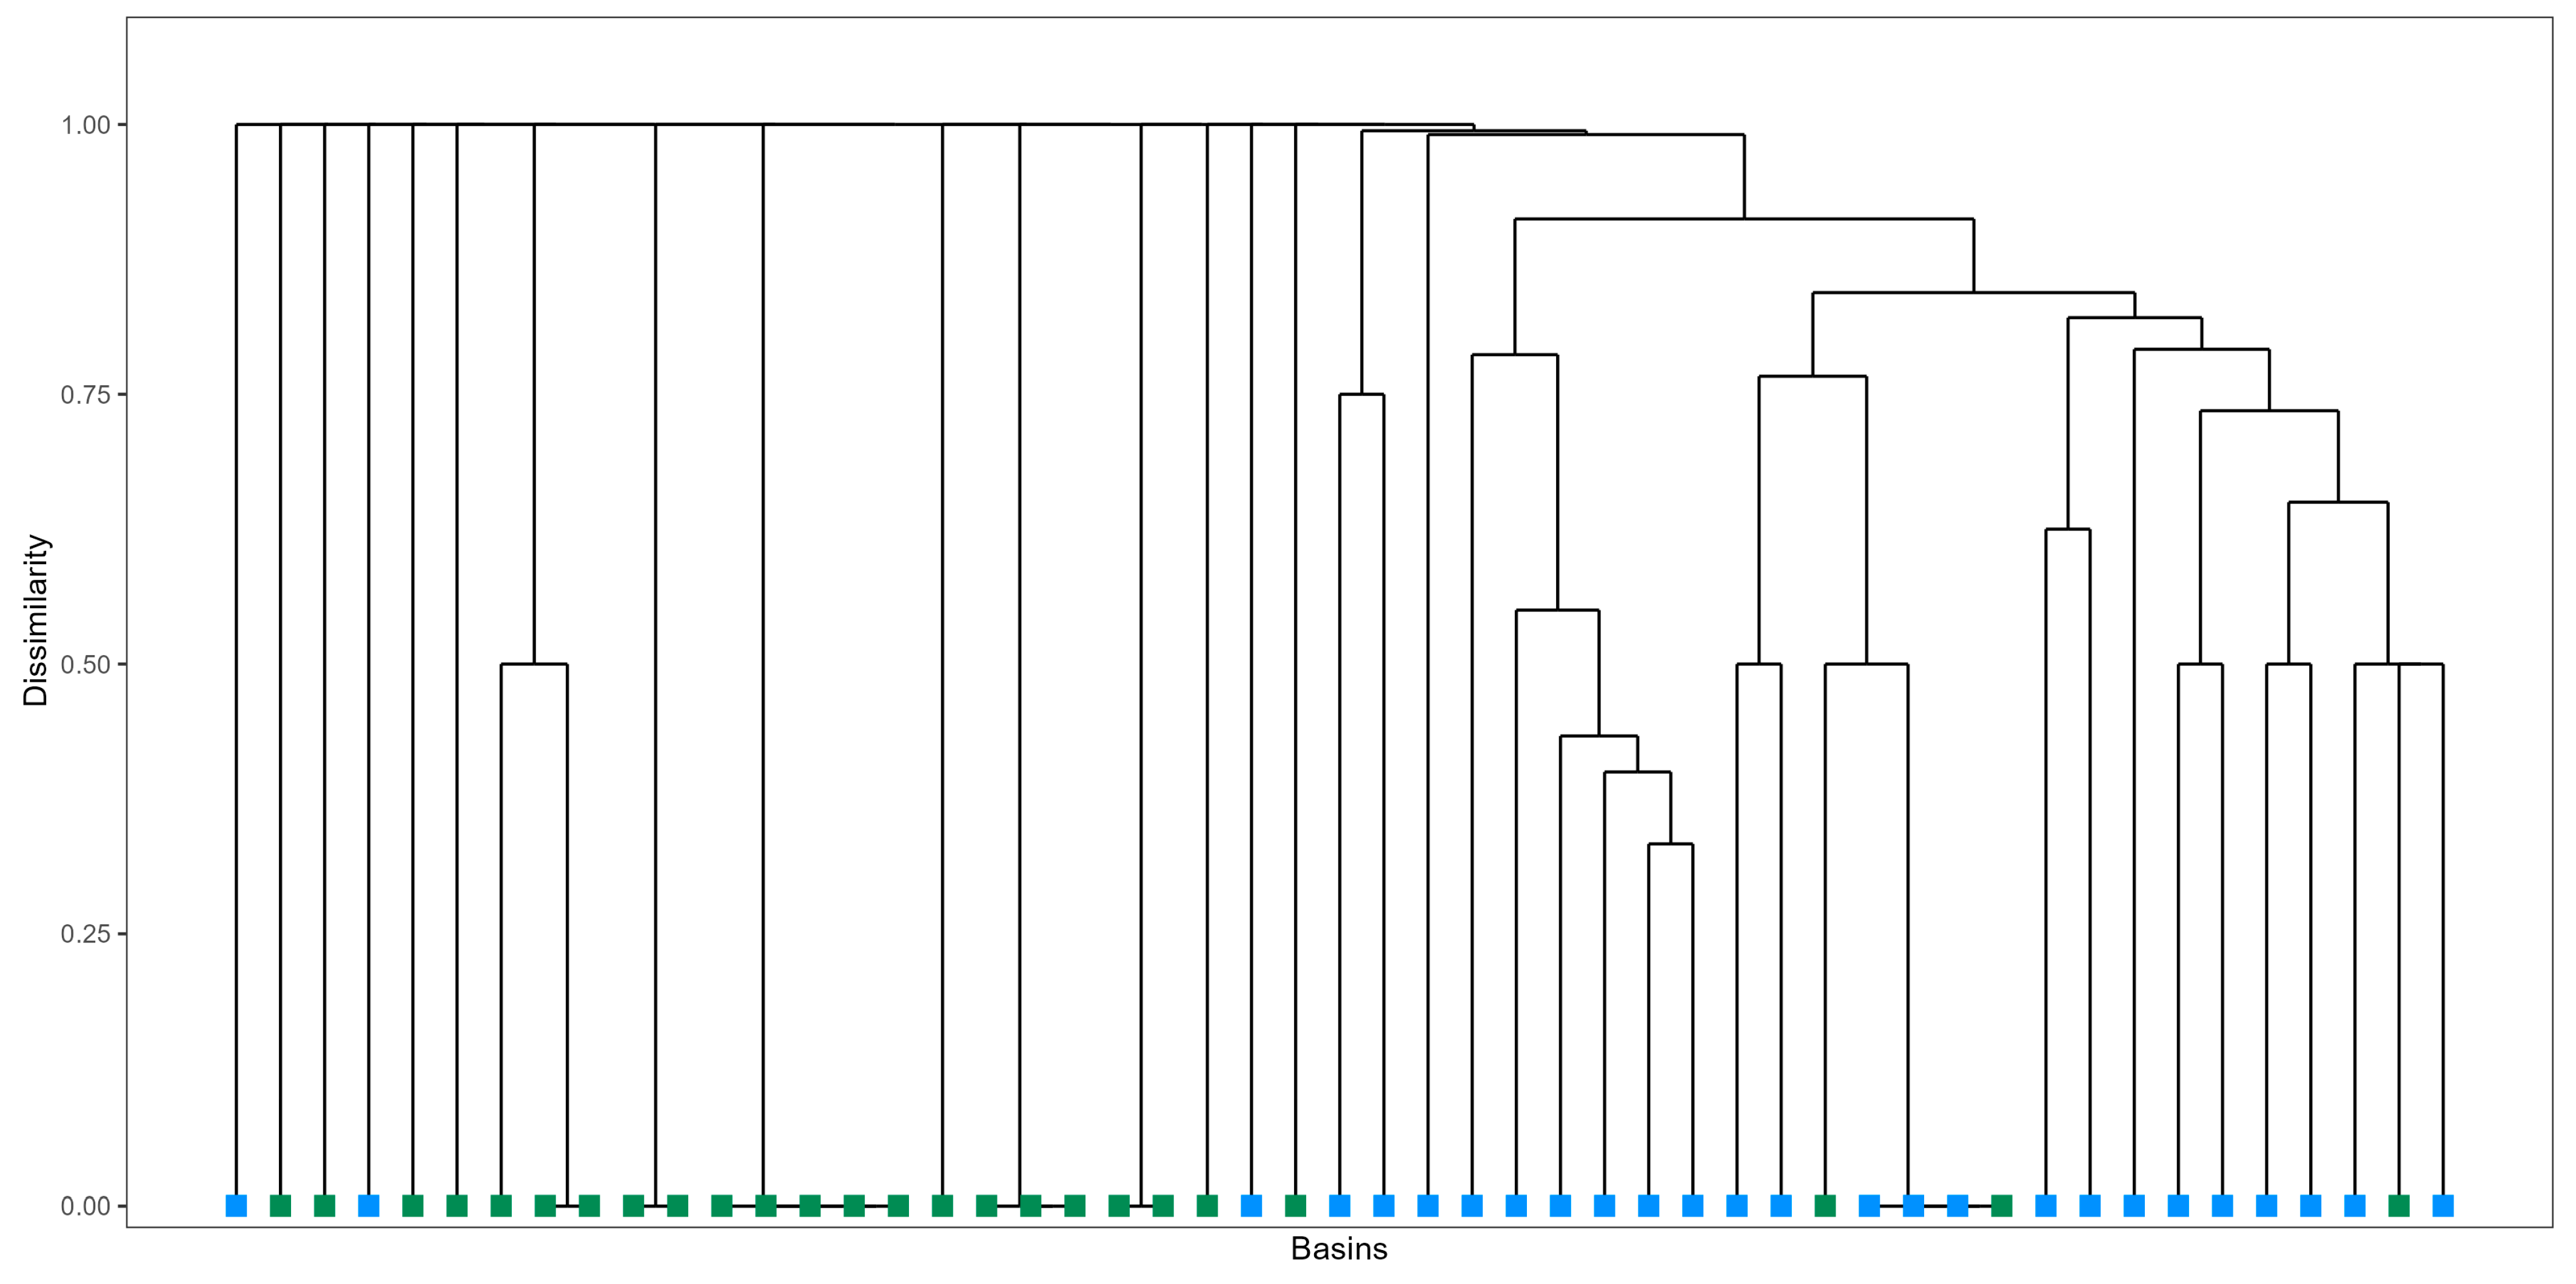
The two hydrographic regions showed very low species similarity, with Jaccard index = 0.037 and Sørensen index = 0.071. Only two species (3.7%) were shared between regions, while 21 species were exclusive to the Eastern Atlantic and 31 species to the Southeastern Atlantic. Beta-diversity turnover was 0.929, indicating substantial species replacement between regions. PERMANOVA confirmed significant compositional differences (p = 0.001, R2 = 0.067) (Figure 4, Supplementary Tables S2 and S3).
Figure 4.
UPGMA Cluster Analysis based on Jaccard dissimilarity. Branch colors indicate hydrographic regions (green = Eastern Atlantic, blue = Southeastern Atlantic). Analysis based on 54 species across 51 sampled basins.
3.5. Bioregions
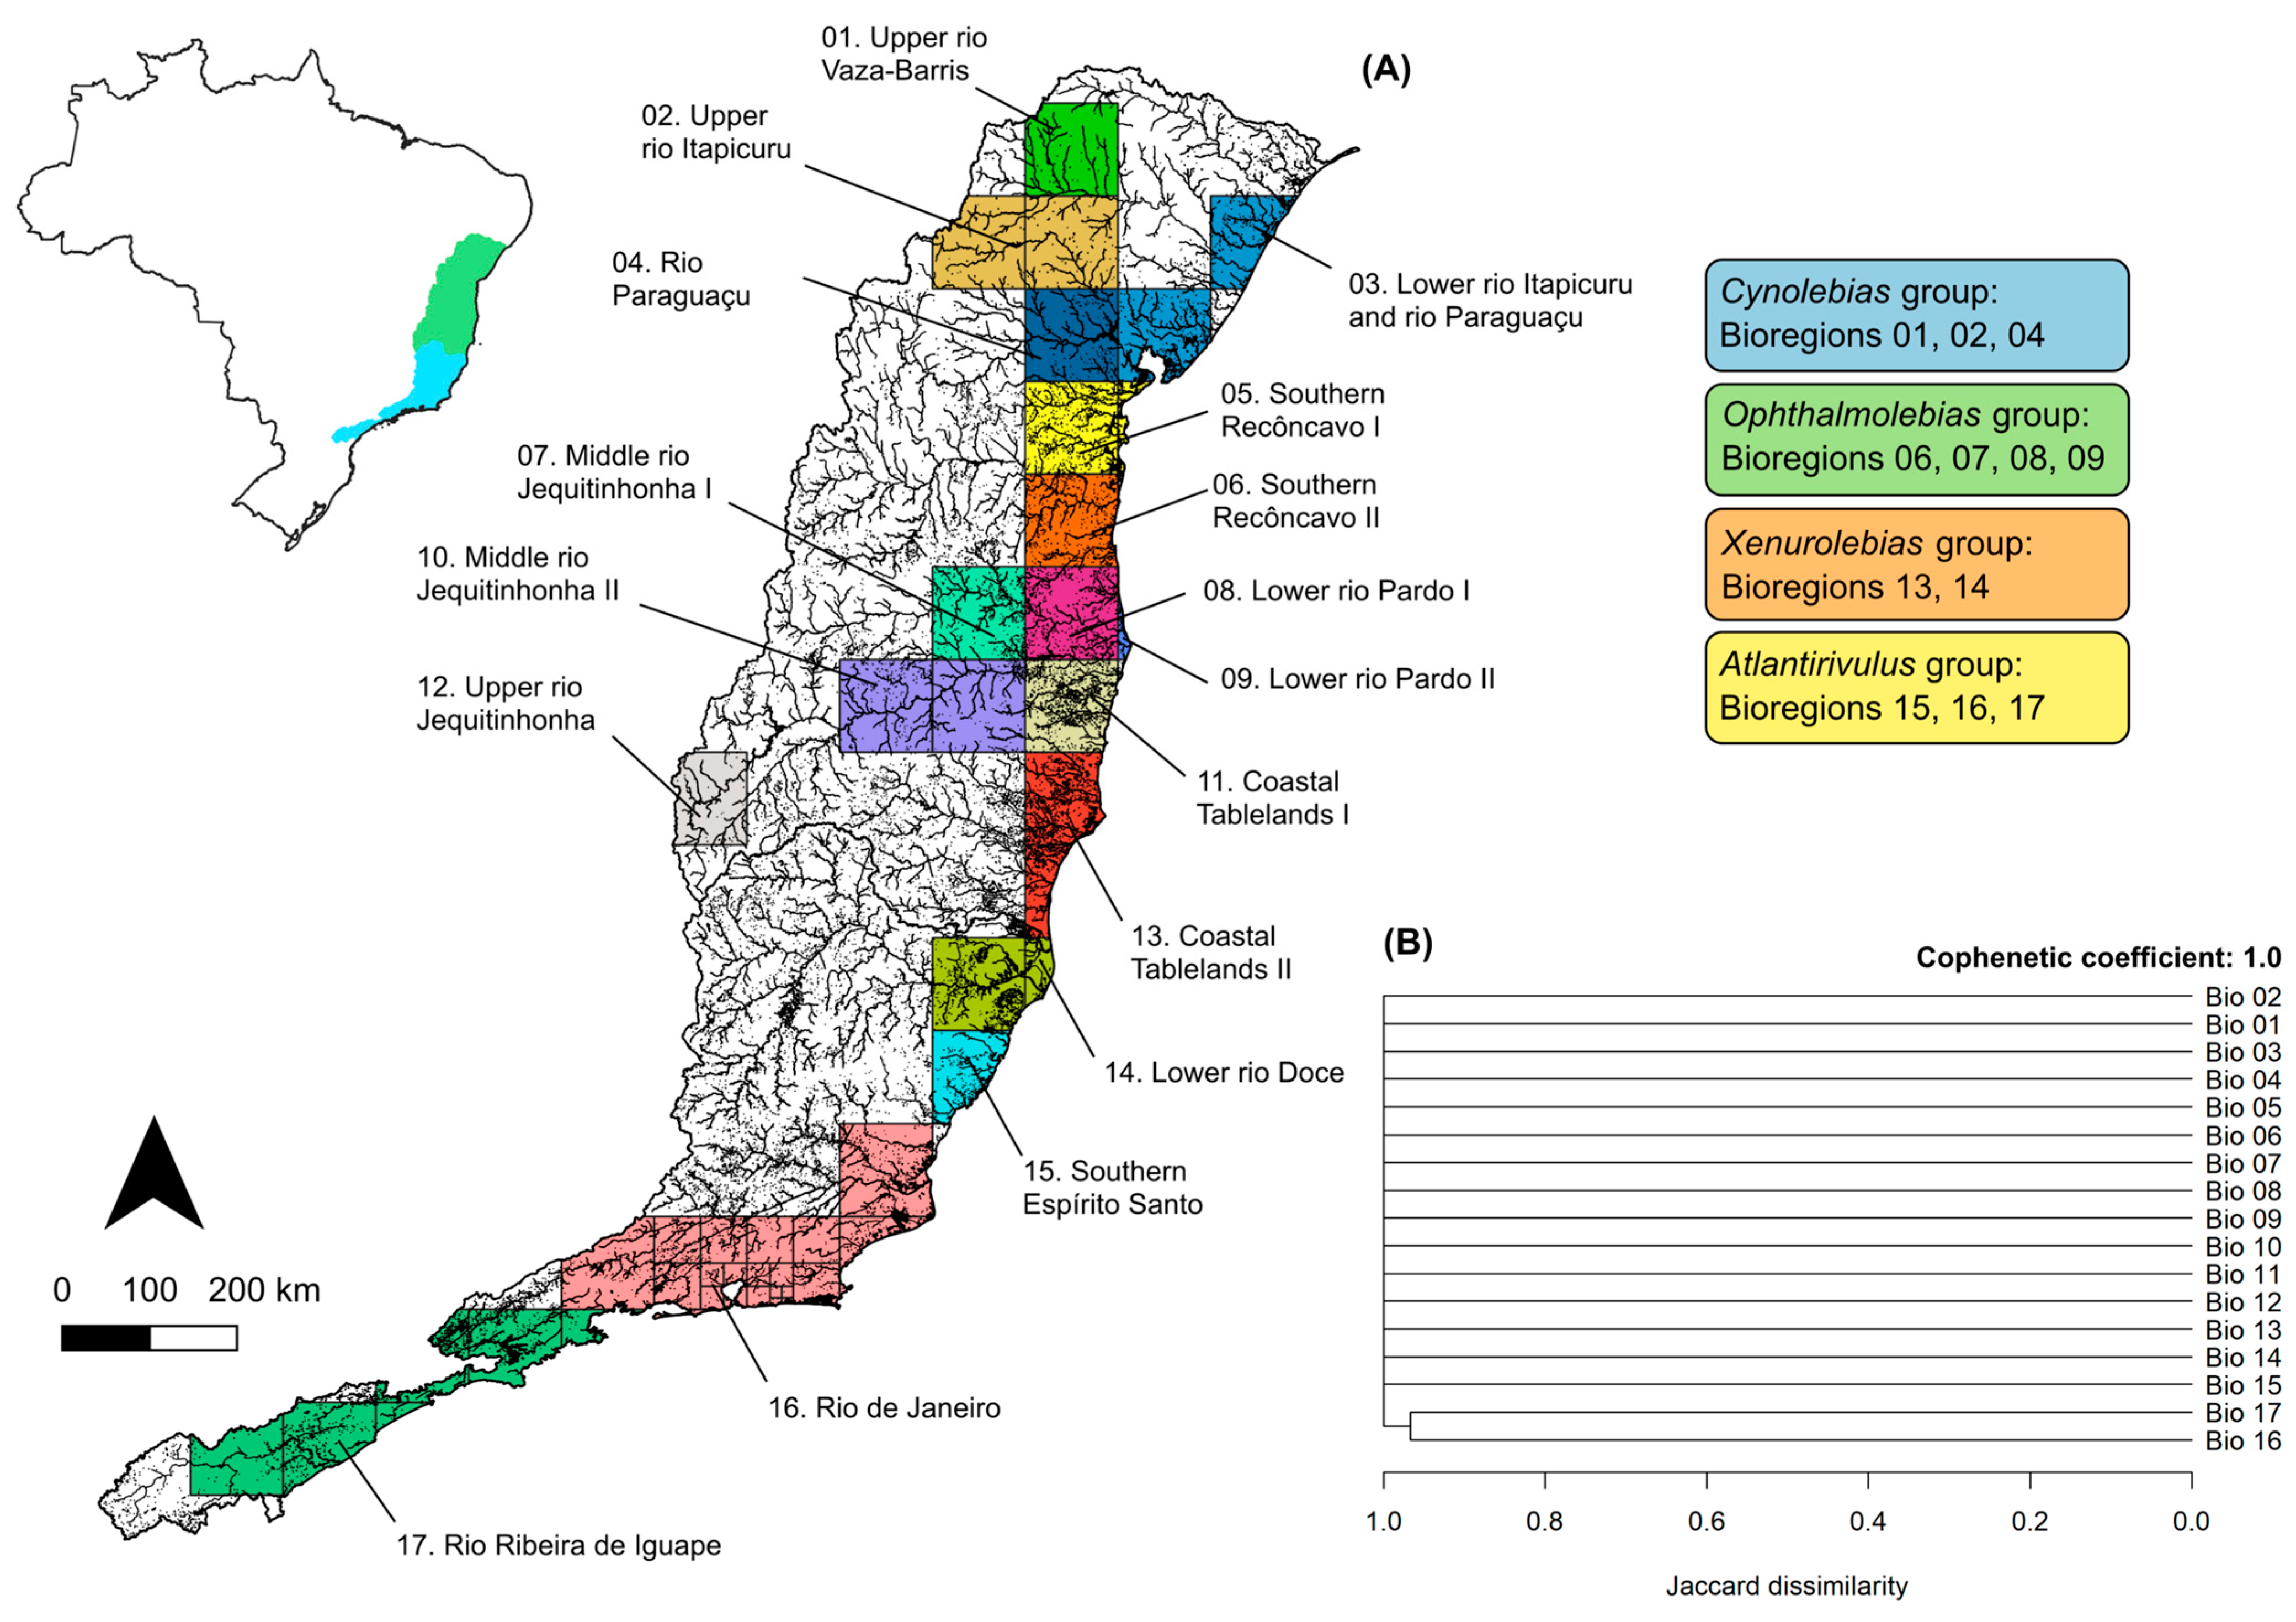
Endemic species distribution patterns delimited seventeen distinct bioregions within the study area, thirteen in the Eastern Atlantic region and four in the Southeastern Atlantic region (Figure 5, Table 4). Approximately 59% (n = 10) of these bioregions were supported by a single species, occurring mostly in basins such as the Rio Jequitinhonha, Rio Paraguaçu, and Rio Itapicuru. Faunistic overlap was minimal, as 15 bioregions exhibited zero similarity to any other unit (cophenetic coefficient = 1; Figure 5). Several neighboring bioregions were qualitatively grouped based on the distribution of their supporting genera: the Cynolebias Group, comprising the upper and middle Rio Vaza-Barris, Rio Itapicuru, and Rio Paraguaçu bioregions (three Cynolebias species); the Ophthalmolebias Group, formed by bioregions between the Rio de Contas and Rio Jequitinhonha basins (five Ophthalmolebias species); the Xenurolebias Group, encompassing small independent drainages between the Rio Jequitinhonha and Rio Doce basins (five Xenurolebias species); and the Atlantirivulus Group, from southern Espírito Santo state to the Rio Ribeira de Iguape basin (11 Atlantirivulus species).
Figure 5.
Delimited bioregions and clustering diagram. (A) Seventeen bioregions delimited across the study area. (B) Clustering diagram (Jaccard dissimilarity) among bioregions. Cophenetic coefficient = 1.0. Groups: Cynolebias group (bioregions 01, 02, 04); Ophthalmolebias group (bioregions 06, 07, 08, 09); Xenurolebias group (bioregions 13, 14); Atlantirivulus group (bioregions 15, 16, 17).
Table 4.
Delimited bioregions and their supporting species.
3.6. Influence of Sampling Effort on Richness Patterns
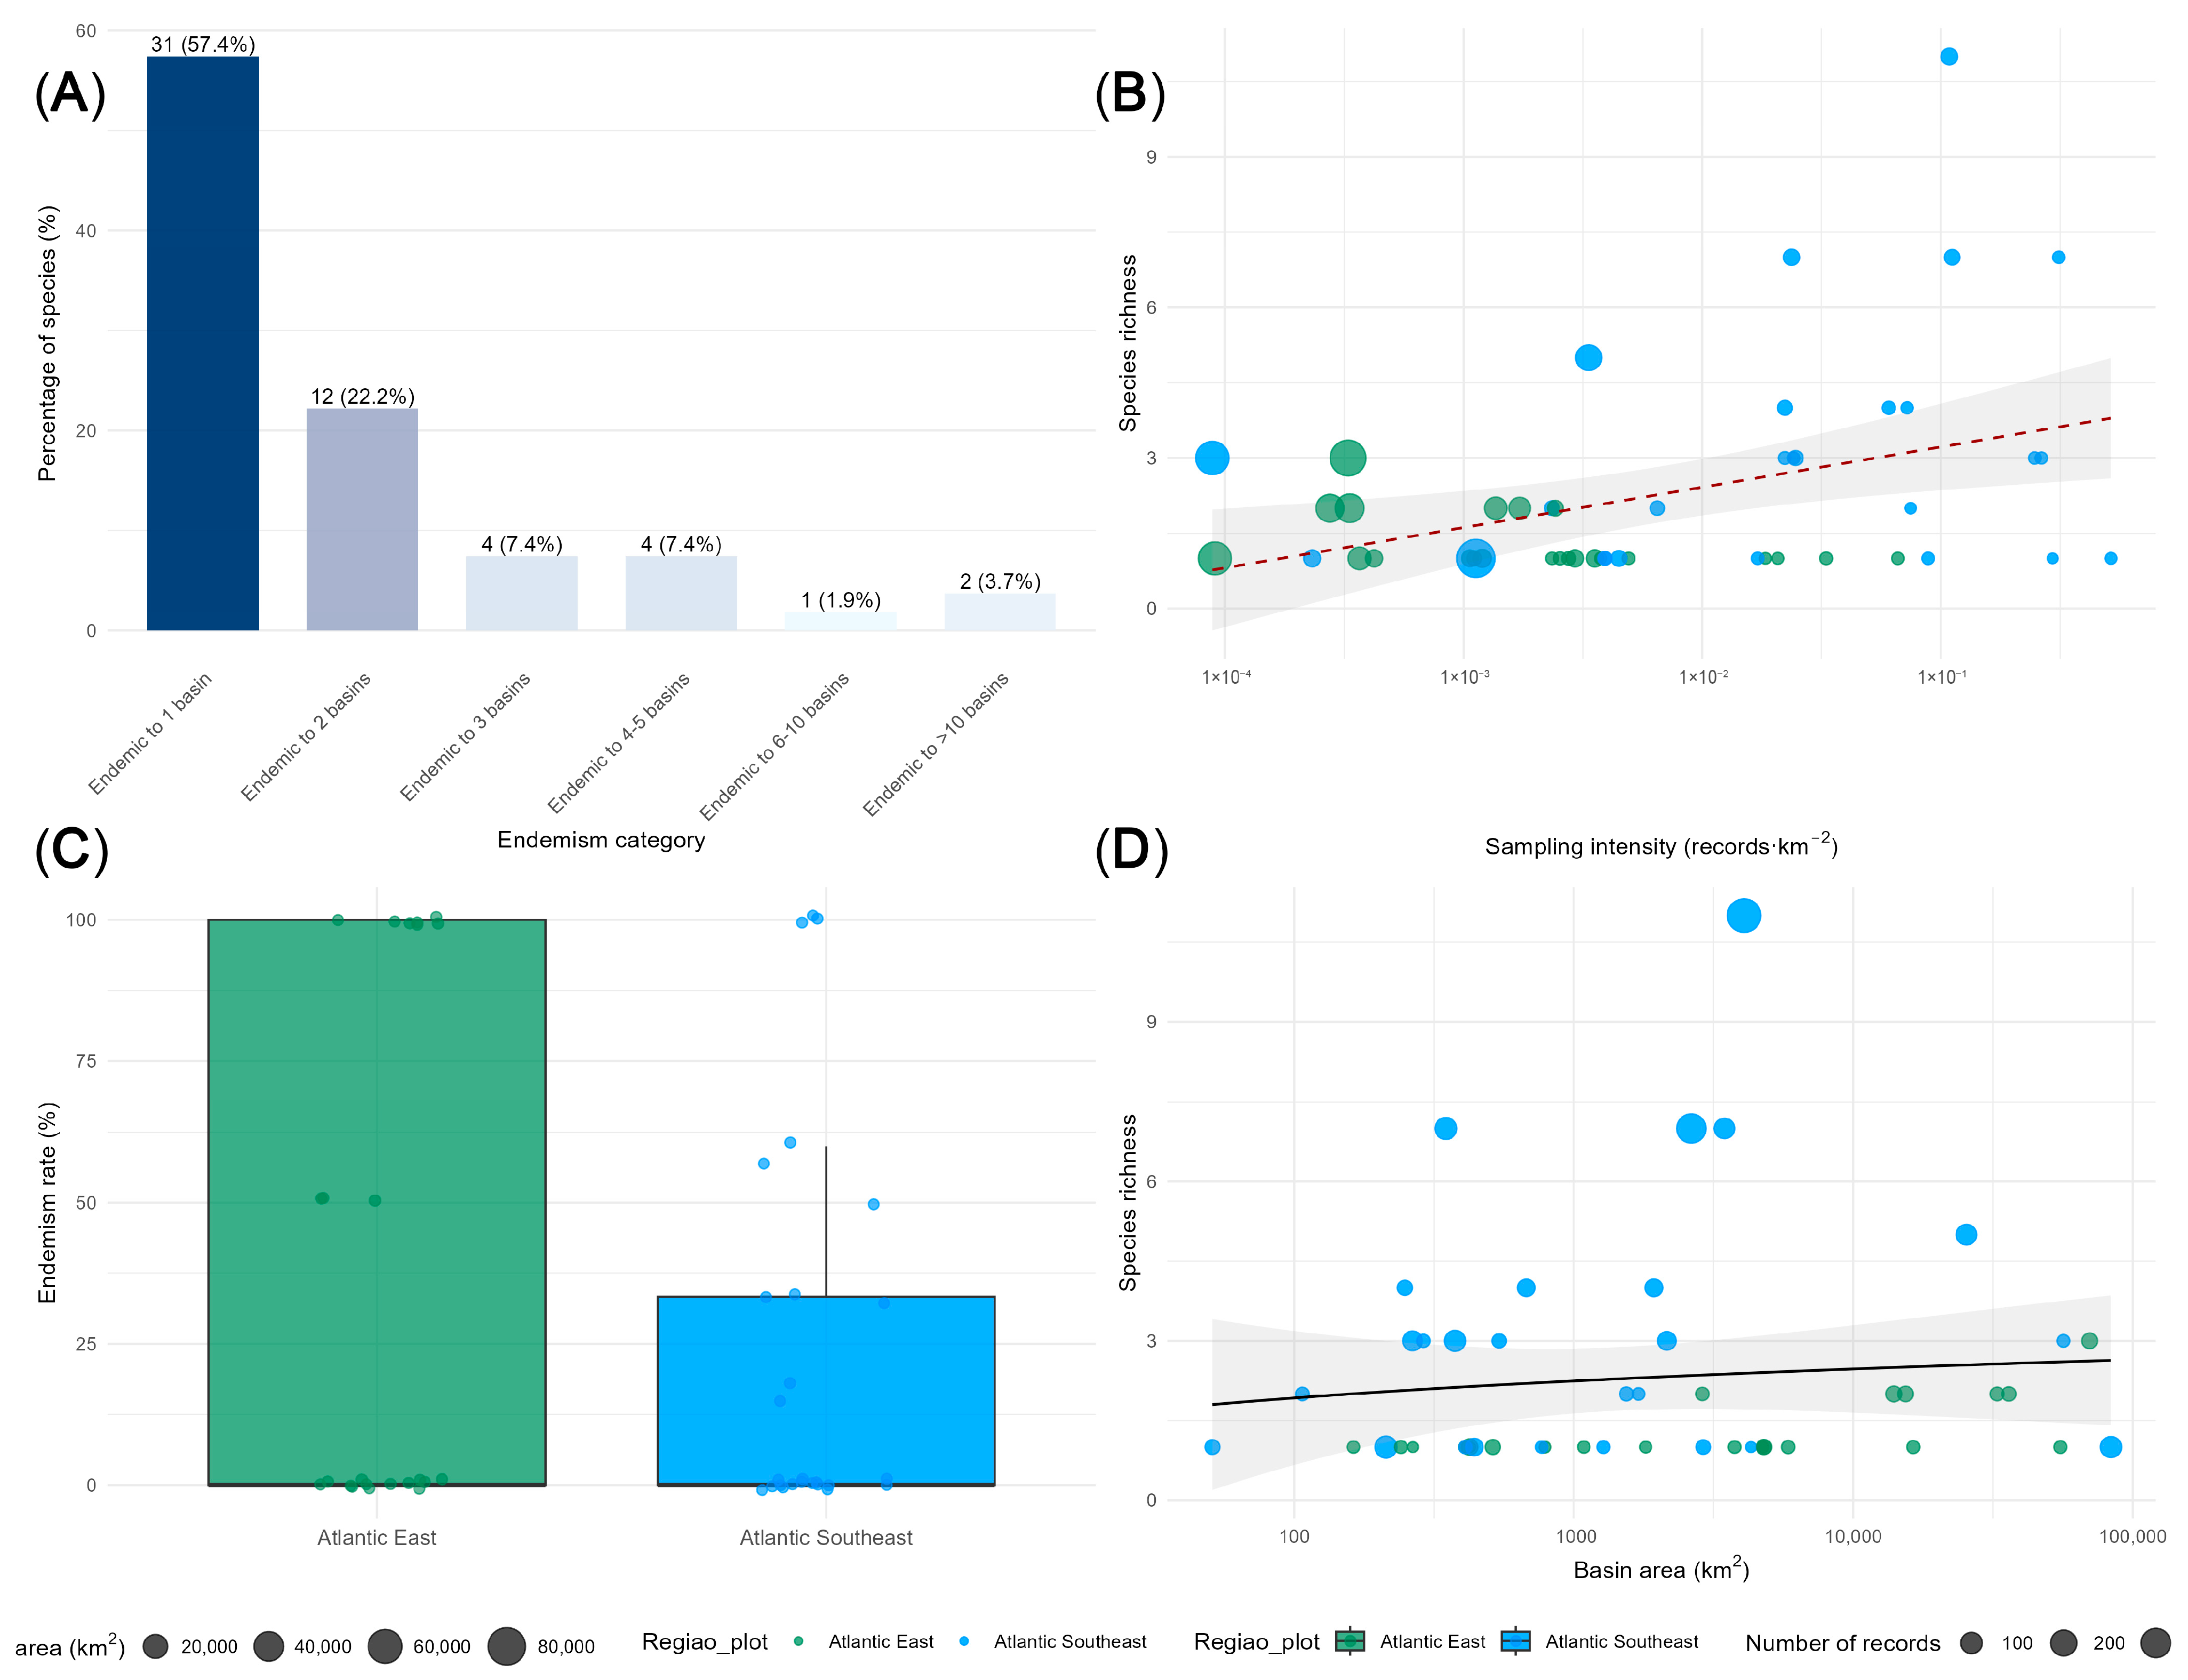
To assess whether sampling effort biased observed richness patterns, we first tested the bivariate correlation between species richness and sampling intensity (records per km2) across the 51 sampled basins. The correlation was weak and non-significant (Spearman’s ρ = −0.13, p = 0.37; Figure 6 and Figure 7), indicating that basins with more intensive sampling do not systematically yield higher species richness when analyzed in isolation.
Figure 6.
Species richness per sampled basin. Mean species richness was 2.29 ± 2.07 (SD), ranging from 1 to 11 species. Basins with highest richness: Baía de Guanabara microbasins (11 species), Maricá basin (seven species), Rio de Janeiro basin (seven species), and Baixada Santista basin (seven species). Bars above the dotted red line indicate basins with richness exceedingly the mean. Only basins with at least one record are shown (n = 51).
Figure 7.
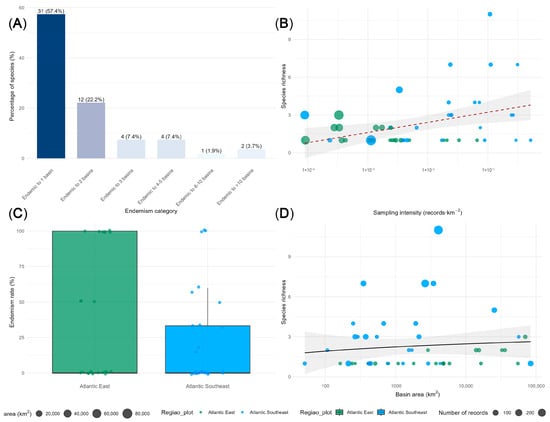
Biogeographic patterns and sampling gaps in killifish assemblages. (A) Species distribution range. Species are categorized by the number of basins they occupy. (B) Richness vs. sampling intensity. Each point represents a basin, with point size proportional to basin area. (C) Endemism rate by region. (D) Species–area relationship.
However, to evaluate the simultaneous effects of basin area and sampling intensity, we constructed a generalized linear model (GLM) with Poisson error distribution. The model included species richness as the response variable and log10-transformed basin area and log10-transformed sampling intensity as predictors. Both predictors were significant: basin area (coefficient = 0.943, p < 0.001) and sampling intensity (coefficient = 0.911, p < 0.001). The interaction term between area and sampling intensity was not significant (p = 0.241). The model explained 61.0% of the deviance in species richness (pseudo-R2 = 0.610).
Rarefaction curves revealed that 38 of 51 sampled basins (74.5%) reached asymptotic richness, suggesting that additional sampling would yield few new species. The remaining 13 basins (25.5%)—including Baía da Guanabara (11 species, 442 records) and Maricá (7 species, 109 records)—showed continued accumulation, indicating that their true richness may be higher than currently observed. However, even in these well-sampled basins, the rate of new species accumulation has slowed considerably in recent decades (post-2010: 0.8 new species per 100 records vs. 3.2 new species per 100 records pre-1990).
These results indicate that both basin area and sampling effort independently contribute to observed species richness patterns. The significant effect of sampling intensity in the multivariate model—contrasting with the non-significant bivariate correlation—highlights the importance of controlling for confounding variables when assessing sampling bias.
3.7. Species Richness
Mean species richness per sampled basin was 2.29 ± 2.07 (SD), ranging from 1 to 11 species (Figure 6). The species–area relationship was not significant (log-log regression: r = −0.033, R2 = 0.001, p = 0.815), indicating that basin area alone is not a primary predictor of rivulid species richness in these coastal systems. The near-zero negative slope suggests that if any relationship exists, it is not positive, which may reflect the confounding effects of uneven sampling effort (small basins like Maricá and Guanabara are oversampled, while many large basins lack any occurrence records) or the overriding influence of historical isolation and habitat heterogeneity over simple geometric constraints.
3.8. Temporal Patterns
Records spanned from 1905 to 2025, with a significant increasing trend in collection effort over time (Spearman’s ρ = 0.228, p = 0.063), with annual collection rates increasing by an average of 0.64 records per year. The peak in collections occurred in the last two decades, reflecting increased research and conservationist interest in the group.
3.9. Conservation Implications
Of the 54 recorded species, 31 (57.4%) have critically restricted distributions (single basin), and an additional 12 species (22.2%) occur in only 2–3 basins. The 16 basins with high endemism values (RWE > 0.5) represent priority areas for conservation, particularly given that 51 basins (50.0%) remain without rivulid records. Single-basin endemics face elevated extinction risk from localized disturbances and merit targeted conservation attention (Supplementary Table S4).
4. Discussion
4.1. Endemism in Coastal Basins
The remarkably high rate of single-basin endemism observed in rivulid killifishes (57.4% of species, n = 31) places this group among the most highly endemic freshwater fish assemblages in the Neotropics [25]. This pattern exceeds rates reported for many other freshwater fish groups in the Atlantic Forest [26] and approaches levels observed in ancient lake systems [7]. Such extreme micro-endemism likely results from the combined effects of hydrological isolation, limited dispersal capacity of rivulids [27], and the complex geological history of coastal drainages along the Brazilian margin [4].
The concentration of endemic species in specific basins, particularly those identified with high Relative Weighted Endemism values (RWE > 0.5, n = 16), suggests that these areas function as evolutionary refugia where allopatric speciation has operated over extended periods. This pattern aligns with the ‘museum model’ of diversity accumulation [28], where stable habitats preserve relict lineages through climatic fluctuations. These single-basin endemics represent particularly vulnerable components of this diversity, as their entire geographic ranges are confined to individual drainage systems [29].
4.2. Biogeographic Structure and Historical Isolation
The pronounced biogeographic differentiation between the Eastern Atlantic and Southeastern Atlantic regions (Jaccard similarity = 0.037, PERMANOVA p = 0.001) indicates substantial historical isolation, with only two species (3.7%) shared between these adjacent systems. This low similarity, coupled with high species turnover (β = 0.929), supports a vicariance-dominated evolutionary history rather than contemporary dispersal [30]. The topographic barriers created by the Serra do Mar and Serra da Mantiqueira Mountain ranges, which separate many of these coastal drainages, likely played crucial roles in generating and maintaining this differentiation during the Neogene and Quaternary periods [4].
The exclusive occurrence of 21 species in the Eastern Atlantic and 31 in the Southeastern Atlantic further reinforces this pattern of regional distinctiveness. These distributional boundaries mirror those observed in other freshwater groups with limited dispersal [31], suggesting that shared geomorphological history, rather than taxon-specific traits, primarily determines contemporary distribution patterns in these coastal systems.
4.3. Bioregionalization, Endemism and Sampling Limitations
The 17 delimited bioregions directly reflect the micro-endemism patterns of rivulids (Figure 7A), congruent with the high species turnover observed. As detailed in Section 4.1, the hyper-endemism pattern is pronounced, with 57.4% of species restricted to single basins (Figure 7A). Coastal basins comprise the continental periphery, a region characterized by high landscape heterogeneity and geomorphological isolation of species [32], consequently marked by high species turnover across basins and ecoregions.
An important distinction must be made between ‘unsampled basins’ (those never visited) and ‘basins without records despite sampling’. In our study area, the 51 basins lacking rivulid records fall into the latter category. The Southeastern and Eastern Atlantic coastal basins contain the highest concentration of research institutions in Brazil and have been the focus of intense ichthyological collection since the 19th century, driven by the presence of major research institutions (e.g., Museu Nacional/UFRJ, Museu de Zoologia da USP, Universidade Federal do Espírito Santo) and centuries of natural history exploration. The Thayer Expedition (1865–1866) extensively sampled many of these drainages, and subsequent generations of ichthyologists have continued this work. Therefore, the absence of Rivulidae from 50% of basins likely reflects genuine ecological or historical constraints—such as unsuitable habitat, absence of temporary pools, or historical barriers to colonization—rather than sampling deficiency. This interpretation is further supported by the high sampling intensity in basins that do harbor rivulids (e.g., 442 records from Baía da Guanabara micro-basins).
The relationship between sampling intensity and apparent endemism requires careful critical examination. As shown in Figure 7B, the bivariate correlation between species richness and sampling intensity was weak and non-significant (Spearman’s ρ = −0.13, p = 0.37). However, when controlling for basin area in a multivariate GLM, sampling intensity emerged as a significant predictor (coefficient = 0.911, p < 0.001), along with basin area (coefficient = 0.943, p < 0.001; pseudo-R2 = 0.610). This discrepancy highlights that simple bivariate correlations can mask the effects of confounding variables. Two opposing biases may operate simultaneously. First, over-sampled basins (e.g., Baía da Guanabara with 442 records) may appear more species-rich partly due to collection effort, potentially inflating apparent endemism if rare species are detected only because of intensive sampling. Second, under-sampled basins may harbor unsuspected populations of species currently classified as single-basin endemics; if discovered, such populations would reduce apparent endemism rates. Without systematic surveys across all basins, the net direction of bias cannot be determined. However, the long sampling history of this region (since 1865) and the asymptotic rarefaction curves observed for 74.5% of sampled basins suggest that the current endemism estimates are more likely to be conservative (i.e., underestimates) than overestimates. That is, the 57.4% single-basin endemism rate may increase rather than decrease with additional sampling, as new species are discovered in unsampled basins rather than range extensions of known species.
Despite the evident species-level isolation within these basins, it is possible to identify groupings at the generic level that reflect a cohesive evolutionary history. The Cynolebias, Ophthalmolebias, Xenurolebias, and Atlantirivulus bioregion groups likely resulted from dispersal followed by isolation and diversification of ancestral populations in coastal basins. Eastern Brazilian basins constitute an area of endemism for genera of the tribe Cynolebiasini (including Cynolebias, Ophthalmolebias, and Xenurolebias), which potentially dispersed northward and westward from Rio de Janeiro drainages [33,34,35]. In contrast, Atlantirivulus is a widely distributed genus, ranging from southern Bahia to northern Rio Grande do Sul [3,36], contributing here to the delimitation of the largest and least refined bioregions (Rio de Janeiro and Ribeira de Iguape). While large-scale dispersal events of Rivulinae ancestors have been proposed, with ancestral connections between the Amazon basin, Brazilian shield basins, and coastal drainages [37,38], the dispersal-vicariance patterns of Atlantirivulus within coastal basins remain to be fully elucidated.
The congruence across various biogeographical analyses points to a generalized pattern of hyper-endemism among the rivulid species considered here. The highly aggregated distribution of records (mean = 36.9 records/basin, median = 10, maximum = 442 in Baía da Guanabara) reflects both biological reality and sampling artifact [39]. While rivulid killifishes do exhibit naturally patchy distributions associated with specific microhabitats [3], the concentration of 23.5% of all records in a single basin suggests substantial sampling bias toward accessible areas and historically well-collected localities [9]. This bias is further evidenced by the complete lack of records in 51 basins, generating significant knowledge gaps that may obscure true diversity patterns. As noted above, this correlation was not significant (Figure 7B), suggesting that the observed richness patterns are not merely a product of sampling effort.
The mean species richness of 2.29 ± 2.07 species per basin, ranging from one to 11 species, indicates generally low local diversity but with notable exceptions. The identification of six basins with richness values exceeding twice the mean highlights potential diversity hotspots that warrant targeted conservation attention. Endemism rates differ significantly between the Eastern Atlantic and Southeastern Atlantic regions (p = 0.009, Figure 7C), reinforcing the distinct biogeographic histories of these two hydrographic regions. The species–area relationship was not significant (log-log regression: r = −0.033, R2 = 0.001, p = 0.815, Figure 7D), a common feature in continental periphery basins for many taxa [31], suggesting that factors other than basin size—such as habitat heterogeneity, water quality, or historical connectivity—may be more important determinants of rivulid species richness in these coastal systems [40].
This suggests that conservation measures for this biota must incorporate the concept of irreplaceability, which refers to the spatial options available for a species and the consequences of losing a specific site [41,42]. For species often restricted to wetlands within a single drainage, the loss of such habitat entails population extirpation or even species extinction [27,43].
4.4. Conservation Implications for Micro Endemic Species
The conservation status of rivulid killifishes in the Southeastern and Eastern Atlantic basins is particularly concerning given their high endemism rates and restricted distributions [44]. These single-basin endemics face elevated extinction risk from multiple threats [1]: (i) habitat loss and fragmentation due to coastal development and agriculture; (ii) water diversion and quality degradation; (iii) climate change impacts on seasonal aquatic habitats; and (iv) invasive species introductions.
Our identification of 16 basins with high endemism values provides specific targets for conservation action [44]. These areas should be prioritized in regional conservation planning, potentially through expansion of protected area networks, implementation of basin-scale management plans, or designation as Key Biodiversity Areas. Particularly urgent is protection of basins supporting multiple endemic species or those with exceptionally high richness values [8]. The 51 unsampled basins represent both critical knowledge gaps and potential refugia for undiscovered or remnant populations, necessitating targeted survey efforts.
An important caveat to these conservation assessments is that species currently classified as single-basin endemics may have undocumented populations in unsampled basins. While some of these basins likely harbor unique species not yet discovered, others may contain populations of species currently thought to be restricted elsewhere. For this reason, our identification of priority basins should be interpreted as a guide for urgent survey efforts, rather than definitive conservation designations. We recommend that any formal conservation action in these basins be preceded by targeted field surveys to confirm species presence and assess population status.
4.5. Methodological Considerations and Future Directions
This study demonstrates both the value and limitations of museum-based biogeographic analyses. While providing comprehensive spatial coverage (51/102 basins sampled) and temporal depth (records spanning 1905 to 2025), such datasets inherently reflect historical collection biases and may underrepresent rare or cryptic species [39].
A specific limitation of our approach is the inability to fully distinguish between genuine rarity and sampling deficiency for species with few records. Museum-based datasets inherently reflect historical collection biases, including preferential sampling near roads, research stations, and urban centers [39]. While spatial thinning reduces local oversampling, it cannot compensate for the complete absence of data from unsampled basins. The direction of sampling bias likely inflates apparent endemism for species with naturally patchy distributions but may also underestimate true endemism if unsampled basins harbor unique species not yet discovered. Without systematic surveys across all basins, the net effect of sampling bias on endemism metrics cannot be precisely quantified.
Future research should integrate complementary approaches: (i) systematic field surveys in under-sampled basins; (ii) molecular phylogenetic analyses to test biogeographic hypotheses and estimate divergence times [45]; (iii) ecological niche modeling to predict responses to climate change; (iv) population genetic studies to assess connectivity and viability of endemic populations; and (v) occupancy modeling or species distribution modeling approaches to estimate detection probabilities and refine range estimates for rare species. However, such methods require more comprehensive environmental data than currently available for many coastal basins.
The integration of traditional taxonomy with spatial analysis, as demonstrated herein, provides a powerful framework for identifying conservation priorities in data-deficient regions. However, effective conservation will require collaborative efforts involving researchers, conservation practitioners, government agencies, and local communities to address the complex challenges facing freshwater biodiversity in the Atlantic Forest hotspot.
4.6. Synthesis and Broader Relevance
This study establishes that rivulid killifishes of the Southeastern and Eastern Atlantic basins exhibit exceptionally high endemism, strong biogeographic structure, and significant vulnerability to anthropogenic threats. These patterns underscore the conservation importance of small coastal basins and wetlands, which have historically received less attention than large river systems in biodiversity assessments and conservation planning [46].
More broadly, our findings contribute to growing recognition that micro-endemism is a predominant pattern in Neotropical freshwater fishes [25], with important implications for conservation strategy. In highly fragmented landscapes like the Atlantic Forest, traditional large-scale conservation approaches may be insufficient to protect taxa with extremely restricted distributions [47]. Instead, targeted, basin-specific strategies are needed.
The persistence of rivulid diversity in these threatened landscapes will ultimately depend on integrated watershed management, science-based conservation prioritization, and sustained commitment to freshwater biodiversity conservation. This study provides the biogeographic foundation for these efforts, while highlighting both the unique diversity and exceptional vulnerability of one of Brazil’s most distinctive freshwater fish groups [7].
5. Conclusions
This study presents the first comprehensive biogeographic assessment of rivulid killifishes in the Southeastern and Eastern Atlantic basins of Brazil, revealing a pattern of exceptional endemism and pronounced biogeographic structure. Our key findings demonstrate the following: (i) high vulnerability, with most species restricted to single basins; (ii) strong historical isolation, evidenced by low faunal similarity (Jaccard index = 0.037) between hydrographic regions and significant compositional differences (PERMANOVA p = 0.001); (iii) critical knowledge gaps persist, with half of the basins lacking any rivulid records despite intensive historical sampling—suggesting genuine absence rather than collection deficiency; and (iv) clear conservation priorities, identifying basins with high endemism values for urgent action.
The aggregated distribution pattern underscores a confluence of genuine biological rarity and significant sampling bias, highlighting the imperative for strategic surveys in underrepresented areas. Particularly alarming is the precarious status of the single-basin endemics, which face elevated extinction risk from localized habitat loss and climate change.
Our results affirm that small coastal basins, frequently neglected in broad-scale conservation planning, are critical reservoirs of unique freshwater diversity. To ensure the persistence of rivulid killifishes, we recommend the following: (i) expanding protected area networks to specifically encompass high-endemism basins; (ii) implementing integrated basin-scale management plans to address threats from land use and water quality degradation; (iii) directing targeted research efforts toward unsampled and under sampled basins; and (iv) fostering the integration of traditional and scientific knowledge in conservation design.
As vital indicators of aquatic ecosystem health and bearers of significant evolutionary distinctiveness, rivulid killifishes warrant elevated conservation priority within the imperiled Atlantic Forest biodiversity hotspot. This study establishes a crucial biogeographic foundation for evidence-based strategies aimed at securing the future of these remarkable fishes and the unique freshwater ecosystems they inhabit.
Beyond rivulid conservation, our findings illuminate how the interplay of historical geology, contemporary barriers, and heterogeneous sampling effort shapes the perceived patterns of freshwater biodiversity in tropical regions. Addressing these factors is a critical step toward effective conservation, as freshwater ecosystems globally face unprecedented anthropogenic pressures.
Supplementary Materials
The following supporting information can be downloaded at: https://www.mdpi.com/article/10.3390/d18060317/s1, Supplementary Material S1. Complete R script for all analyses (analise_rivulideos_completa.R)—generates all figures, tables, and supplementary tables. Supplementary Material S2. Hydrographic basins database (basin_RH.csv)—complete list of 102 coastal basins with codes, areas, regions, species richness, endemics, and record counts. Supplementary Material S3. Occurrence records database (records.csv)—raw dataset of all georeferenced records. Supplementary Material S4. R script for GLM ANALYSIS (GML.R)—generates results. Supplementary Table S1. Complete list of the 102 coastal basins with sampling status, species richness, endemism, and number of records. Supplementary Table S2. Jaccard similarity matrix between all sampled basins. Supplementary Table S3. Results of PERMANOVA analysis comparing Eastern and Southeastern Atlantic regions (Source, Df, SumOfSqs, R2, F, p-value). Supplementary Table S4. IUCN conservation status categories for all recorded species (Species, Num_Basins, IUCN_Category, Criteria, Source).
Author Contributions
Conceptualization, L.M.S.-S. and R.F.M.-P.; methodology, L.M.S.-S. and F.V.-G.; software, F.V.-G.; validation, L.M.S.-S., F.V.-G. and R.F.M.-P.; formal analysis, F.V.-G.; investigation, L.M.S.-S. and R.F.M.-P.; resources, L.M.S.-S. and R.F.M.-P.; data curation, L.M.S.-S. and F.V.-G.; writing—original draft preparation, L.M.S.-S.; writing—review and editing, L.M.S.-S., F.V.-G. and R.F.M.-P.; visualization, F.V.-G.; supervision, L.M.S.-S.; project administration, R.F.M.-P.; funding acquisition, L.M.S.-S. and R.F.M.-P. All authors have read and agreed to the published version of the manuscript.
Funding
F.V.-G. was supported by a post-doctoral fellowship from the Fundação Espírito-Santense de Tecnologia (FEST). Fieldwork was in part funded by GEF Pró Espécies, process no. 02031.000112/2022-42. The activities that led to this publication were funded with resources from the Global Environment Facility (GEF) through Project 029840—National Strategy for the Conservation of Endangered Species—Pro-Species: All against extinction.
Institutional Review Board Statement
The animal study protocol was approved by the Ethics Committee for Animal Use of Federal University of Espírito Santo (CEUA-UFES); permit number: 008/23 for studies involving field methods.
Data Availability Statement
All data and scripts used in this study are available as Supplementary Material to ensure the reproducibility of the methodologies applied.
Acknowledgments
We extend our gratitude to Rodrigo Damásio, Karina Schmidt Furieri, Mateus Nogueira Gama Filho, Bruno Pinheiro Gomes, Vinicio Martins, Juca Damásio, Alexandre Pereira and Felipe Queiroz for their help with field activities. We are grateful to Cristiano Moreira, Marcelo R. Britto, Paulo A. Buckup (MNRJ), and Juliana P. da Silva Novelli (MBML) for providing collection records and for the courtesy extended during the visit to their institutions. We give thanks to the SAPI—Sociedade de Amigos por Itaúnas team—for their partnership; the team of Parque Estadual de Itaúnas (ES), and Parque Estadual da Serra da Tiririca (RJ) for logistic support during fieldwork; Izabel Correa Boock de Garcia for the exchange of ideas within the scope of PAN Rivulídeos; and Carla N. M. Polaz for the discussions on IUCN guidelines. This work received laboratory support from the Instituto Nossos Riachos (INR). We thank ICMBio for the licenses 80891-7 and 86028-5 for field activities. Our gratitude to Insituto Estadual do Ambiente–Rio de Janeiro for the license INEA N°030/2025 and Instituto Estadual de Meio Ambiente e Recursos Hídricos–Espírito Santo-IEMA Nº 011/2023.
Conflicts of Interest
The authors declare no conflicts of interest.
Abbreviations
The following abbreviations are used in this manuscript:
| CV | Coefficient of Variation |
| GBIF | Global Biodiversity Information Facility |
| IUCN | International Union for Conservation of Nature |
| MMA | Ministério do Meio Ambiente e Mudança do Clima (Ministry of Environment and Climate Change, in English) |
| NMDS | Non-metric Multidimensional Scaling |
| PERMANOVA | Permutational Multivariate Analysis of Variance |
| RWE | Relative Weighted Endemism |
| SD | Standard Deviation |
| UPGMA | Unweighted Pair Group Method with Arithmetic Mean |
| WE | Weighted Endemism |
References
- Reid, A.J.; Carlson, A.K.; Creed, I.F.; Eliason, E.J.; Gell, P.A.; Johnson, P.T.J.; Kidd, K.A.; MacCormack, T.J.; Olden, J.D.; Ormerod, S.J.; et al. Emerging threats and persistent conservation challenges for freshwater biodiversity. Biol. Rev. 2019, 94, 849–873. [Google Scholar] [CrossRef] [Scilit]
- Reis, R.E.; Albert, J.S.; Di Dario, F.; Mincarone, M.M.; Petry, P.; Rocha, L.A. Fish biodiversity and conservation in South America. J. Fish Biol. 2016, 89, 12–47. [Google Scholar] [CrossRef] [Scilit]
- Costa, W.J.E.M. Phylogenetic position and taxonomic status of Anablepsoides, Atlantirivulus, Cynodonichthys, Laimosemion and Melanorivulus (Cyprinodontiformes: Rivulidae). Ichthyol. Explor. Freshw. 2011, 22, 233–249. [Google Scholar]
- Ribeiro, A.C. Tectonic history and the biogeography of the freshwater fishes from the coastal drainages of eastern Brazil: An example of faunal evolution associated with a divergent continental margin. Neotrop. Ichthyol. 2006, 4, 225–246. [Google Scholar] [CrossRef] [Scilit]
- Buckup, P.A. The Eastern Brazilian Shield. In Historical Biogeography of Neotropical Freshwater Fishes; Albert, J.S., Reis, R.E., Eds.; University of California Press: Los Angeles, CA, USA, 2011; pp. 203–210. [Google Scholar] [CrossRef] [Scilit]
- Vieira-Guimarães, F.; Martins-Pinheiro, R.F.; Sarmento-Soares, L.M. Freshwater fishes of the Northeastern Mata Atlântica ecoregion, Brazil: An updated checklist with distributional patterns of a highly endemic ichthyofauna. Zootaxa 2024, 5475, 1–72. [Google Scholar] [CrossRef] [Scilit]
- Costa, W.J.E.M. Peixes Aploqueilóides da Mata Atlântica Brasileira: História, Diversidade e Conservação; Museu Nacional, UFRJ: Rio de Janeiro, Brazil, 2009. [Google Scholar]
- Volcan, M.V.; Barbosa, L.; Robe, L.J.; Lanés, L.E.K. Annual fishes (Rivulidae) from Southern Brazil: A broad-scale assessment of their diversity and conservation. J. Fish Biol. 2018, 93, 1043–1059. [Google Scholar] [CrossRef] [Scilit]
- Sousa-Baena, M.S.; Garcia, L.C.; Peterson, A.T. Completeness of digital accessible knowledge of the plants of Brazil and priorities for survey and inventory. Divers. Distrib. 2013, 20, 369–381. [Google Scholar] [CrossRef] [Scilit]
- Fricke, R.; Eschmeyer, W.N.; Van der Laan, R. Eschmeyer’s Catalog of Fishes: Genera, Species, References. Available online: http://researcharchive.calacademy.org/research/ichthyology/catalog/fishcatmain.asp (accessed on 27 April 2026).
- Guilbault, E.; Somervuo, P.; Renner, I. Explorers vs. followers: A behavioural approach to spatial bias correction in species distribution modelling. Ecol. Model. 2025, 510, 111311. [Google Scholar] [CrossRef] [Scilit]
- Colwell, R.K.; Chao, A.; Gotelli, N.J.; Lin, S.Y.; Mao, C.X.; Chazdon, R.L.; Longino, J.T. Models and estimators linking individu-al-based and sample-based rarefaction, extrapolation and comparison of assemblages. J. Plant Ecol. 2012, 5, 3–21. [Google Scholar] [CrossRef] [Scilit]
- Grytnes, J.A.; Romdal, T.S. Using museum collections to estimate diversity patterns along geographical gradients. Folia Geobot. 2008, 43, 357–369. [Google Scholar] [CrossRef] [Scilit]
- Hortal, J.; de Bello, F.; Diniz-Filho, J.A.F.; Lewinsohn, T.M.; Lobo, J.M.; Ladle, R.J. Seven shortfalls that beset large-scale knowledge of biodiversity. Annu. Rev. Ecol. Evol. Syst. 2015, 46, 523–549. [Google Scholar] [CrossRef] [Scilit]
- Williams, P.H.; Humphries, C.J. Biodiversity, Taxonomic Relatedness, and Endemism in Conservation. In Systematics and Con-servation Evaluation; Forey, P.L., Humphries, C.J., Vane-Wright, R.I., Eds.; Oxford University Press: Oxford, UK, 1994; pp. 269–287. [Google Scholar] [CrossRef] [Scilit]
- Baselga, A. Partitioning the turnover and nestedness components of beta diversity. Glob. Ecol. Biogeogr. 2010, 19, 134–143. [Google Scholar] [CrossRef] [Scilit]
- Baselga, A.; Orme, C.D.L. betapart: An R package for the study of beta diversity. Methods Ecol. Evol. 2012, 3, 808–812. [Google Scholar] [CrossRef] [Scilit]
- Cardoso, P.; Rigal, F.; Carvalho, J.C.; Fortelius, M.; Borges, P.A.; Podani, J.; Schmera, D. Partitioning taxon, phylogenetic and functional beta diversity into replacement and richness difference components. J. Biogeogr. 2014, 41, 749–761. [Google Scholar] [CrossRef] [Scilit]
- Coleman, B.D.; Mares, M.A.; Willig, M.R.; Hsieh, Y.-H. Randomness, Area, and Species Richness. Ecology 1982, 63, 1121–1133. [Google Scholar] [CrossRef] [Scilit]
- Mahar, G.; Dhar, U.; Rawal, R.S.; Bhatt, I.D. Implications of location specific data and their usefulness in conservation planning: An example from Indian Himalayan Region. Biodivers. Conserv. 2009, 18, 1273–1286. [Google Scholar] [CrossRef] [Scilit]
- Baldwin, B.G.; Thornhill, A.H.; Freyman, W.A.; Ackerly, D.D.; Kling, M.M.; Morueta-Holme, N.; Mishler, B.D. Species richness and endemism in the native flora of California. Am. J. Bot. 2017, 104, 487–501. [Google Scholar] [CrossRef] [Scilit] [PubMed]
- Edler, D.; Guedes, T.; Zizka, A.; Rosvall, M.; Antonelli, A. Infomap Bioregions: Interactive Mapping of Biogeographical Regions from Species Distributions. Syst. Biol. 2017, 66, 197–204. [Google Scholar] [CrossRef] [Scilit]
- IUCN. The IUCN Red List of Threatened Species; Version 2022-2; IUCN: Gland, Switzerland, 2022. [Google Scholar]
- McFadden, D. Conditional logit analysis of qualitative choice behavior. In Frontiers in Econometrics; Zarembka, P., Ed.; Academic Press: New York, NY, USA, 1974; pp. 105–142. [Google Scholar]
- Albert, J.S.; Reis, R.E. Historical Biogeography of Neotropical Freshwater Fishes; University of California Press: Berkeley, CA, USA, 2011; 406p. [Google Scholar]
- Castro, R.M.C.; Polaz, C.N.M. Small-sized fish: The largest and most threatened portion of the megadiverse neotropical freshwater fish fauna. Biota Neotrop. 2020, 20, e20180683. [Google Scholar] [CrossRef] [Scilit]
- Costa, W.J.E.M. Catalog of Aplocheiloid Killifishes of the World; Universidade Federal do Rio de Janeiro: Rio de Janeiro, Brazil, 2008. [Google Scholar]
- Stebbins, G.L. Flowering Plants: Evolution Above the Species Level; Harvard University Press: Cambridge, MA, USA, 1974. [Google Scholar] [CrossRef] [Scilit]
- Vieira-Guimarães, F.; Martins-Pinheiro, R.F.; Sarmento-Soares, L.M. Conservation Priorities for Threatened and Restrict-ed-Range Freshwater Fishes in the Northeastern Mata Atlântica Freshwater Ecoregion, Brazil. An. Acad. Bras. Cienc. 2026, 98, e20240731. [Google Scholar] [CrossRef] [Scilit]
- Leroy, B.; Dias, M.S.; Giraud, E.; Hugueny, B.; Jézéquel, C.; Leprieur, F.; Oberdorff, T.; Tedesco, P.A. Global biogeo-graphical regions of freshwater fish species. J. Biogeogr. 2019, 46, 2407–2419. [Google Scholar] [CrossRef] [Scilit]
- Dagosta, F.C.; de Pinna, M. The fishes of the Amazon: Distribution and biogeographical patterns, with a comprehensive list of species. Bull. Am. Mus. Nat. Hist. 2019, 431, 1–163. [Google Scholar] [CrossRef] [Scilit]
- Albert, J.S.; Petry, P.; Reis, R.E. Major Biogeographic and Phylogenetic Patterns. In Historical Biogeography of Neotropical Freshwater Fishes; Albert, J.S., Reis, R.E., Eds.; University of California Press: Los Angeles, CA, USA, 2011; pp. 21–57. [Google Scholar] [CrossRef] [Scilit]
- Costa, W.J.E.M. Historical biogeography of cynolebiasine annual killifishes inferred from dispersal-vicariance analysis. J. Biogeogr. 2010, 37, 1995–2004. [Google Scholar] [CrossRef] [Scilit]
- Costa, W.J.E.M. A new genus of miniature cynolebiasine from the Atlantic Forest and alternative biogeographical explanations for seasonal killifish distribution patterns in South America (Cyprinodontiformes: Rivulidae). Vertebr. Zool. 2014, 64, 23–33. [Google Scholar] [CrossRef] [Scilit]
- Costa, W.J.E.M.C.; Amorim, P.F. Integrative taxonomy and conservation of seasonal killifishes, Xenurolebias (Teleostei: Rivuli-dae), and the Brazilian Atlantic Forest. Syst. Biodivers. 2014, 12, 350–365. [Google Scholar] [CrossRef] [Scilit]
- Ywamoto, E.V.; Nielsen, D.T.B.; Oliveira, C. Two new species of Atlantirivulus (Cyprinodontiformes: Rivulidae) from Atlantic Forest biome, São Paulo State, Brazil. Neotrop. Ichthyol. 2025, 23, e240110. [Google Scholar] [CrossRef] [Scilit]
- Costa, W.J.E.M. Historical biogeography of aplocheiloid killifishes (Teleostei: Cyprinodontiformes). Vertebr. Zool. 2013, 63, 139–154. [Google Scholar] [CrossRef] [Scilit]
- Volcan, M.V.; Suárez, Y.R.; Severo-Neto, F.; Amorim, P.F.; Costa, W.J.E.M. A typical coastal plain taxon in central Brazil: Rela-tionships and description of a new species of non-annual killifish (Cyprinodontiformes; Rivulidae) from the Paraná River basin. Zool. Anz. 2024, 312, 92–102. [Google Scholar] [CrossRef] [Scilit]
- Tedesco, P.A.; Beauchard, O.; Bigorne, R.; Blanchet, S.; Buisson, L.; Conti, L.; Cornu, J.F.; Dias, M.S.; Grenouillet, G.; Hugueny, B.; et al. A global database on freshwater fish species occurrence in drainage basins. Sci. Data 2017, 4, 170141. [Google Scholar] [CrossRef] [Scilit]
- Drakare, S.; Lennon, J.J.; Hillebrand, H. The imprint of geographical context on species-area relationships. Ecol. Lett. 2006, 9, 215–227. [Google Scholar] [CrossRef] [Scilit]
- Eken, G.; Bennun, L.; Brooks, T.M.; Darwall, W.; Fishpool, L.D.C.; Foster, M.; Knox, D.; Langhammer, P.; Matiku, P.; Radford, E.; et al. Key Biodiversity Areas as Site Conservation Targets. BioScience 2004, 54, 1110–1118. [Google Scholar] [CrossRef] [Scilit]
- Langhammer, P.F.; Bakarr, M.I.; Bennun, L.A.; Brooks, T.M.; Clay, R.P.; Darwall, W.; De Silva, N.; Edgar, G.J.; Eken, G.; Fishpool, L.D.C.; et al. Identification and Gap Analysis of Key Biodiversity Areas; IUCN: Gland, Switzerland, 2007; 116p. [Google Scholar] [CrossRef] [Scilit]
- Rodrigues, A.S.L.; Pilgrim, J.D.; Lamoreux, J.F.; Hoffmann, M.; Brooks, T.M. The value of the IUCN Red List for conservation. Trends Ecol. Evol. 2006, 21, 71–76. [Google Scholar] [CrossRef] [Scilit]
- MMA. Livro Vermelho da Fauna Brasileira Ameaçada de Extinção; Ministério do Meio Ambiente: Brasília, Brazil, 2018; 492p.
- Roxo, F.F.; Albert, J.S.; Silva, G.S.C.; Zawadzki, C.H.; Foresti, F.; Oliveira, C. Molecular phylogeny and biogeographic history of the armored Neotropical catfish subfamilies Hypoptopomatinae, Neoplecostominae and Otothyrinae (Siluriformes: Loricariidae). PLoS ONE 2014, 9, e105564. [Google Scholar] [CrossRef] [Scilit] [PubMed]
- Parra, G.; Guerrero, F.; Armengol, J.; Brendonck, L.; Brucet, S.; Finlayson, C.M.; Gomes-Barbosa, L.; Grillas, P.; Jeppesen, E.; Ortega, F.; et al. The future of temporary wetlands in drylands under global change. Inland Waters 2021, 11, 445–456. [Google Scholar] [CrossRef] [Scilit]
- Hermoso, V.; Kennard, M.J.; Linke, S. Integrating multidirectional connectivity requirements in systematic conservation planning for freshwater systems. Divers. Distrib. 2012, 18, 448–458. [Google Scholar] [CrossRef] [Scilit]

Disclaimer/Publisher’s Note: The statements, opinions and data contained in all publications are solely those of the individual author(s) and contributor(s) and not of MDPI and/or the editor(s). MDPI and/or the editor(s) disclaim responsibility for any injury to people or property resulting from any ideas, methods, instructions or products referred to in the content. |
© 2026 by the authors. Licensee MDPI, Basel, Switzerland. This article is an open access article distributed under the terms and conditions of the Creative Commons Attribution (CC BY) license.