


Abstract
The marine fish genus Trachinotus (Carangidae: Trachinotinae) comprises species of considerable economic and ecological importance; however, a significant gap in genomic data has limited the understanding of its evolutionary history and systematics. To address this gap, we determined the complete mitochondrial genomes of two key species, Trachinotus goodei (Palometa) and Trachinotus mookalee (Indian Pompano). The mitogenome of T. goodei was sequenced from genomic DNA and assembled de novo, whereas the T. mookalee mitogenome was assembled by mining publicly available RNA-Seq data, demonstrating a cost-effective approach for expanding genomic resources. The resulting mitogenomes were 16,547 bp and 16,545 bp long, respectively, and both presented conserved gene content (13 protein-coding genes, 22 tRNAs, 2 rRNAs) and organization typical of teleost fishes. Phylogenetic analysis incorporating these new genomes with those of four other Trachinotus species was performed via a concatenated dataset of 13 protein-coding genes. Maximum likelihood and Bayesian inference recovered Trachinotus as a strongly supported monophyletic group. The phylogeny revealed a fundamental and deeply divergent split between three major clades, two comprising species from the western Atlantic and the other containing species from the eastern Atlantic/Mediterranean/Indo-Pacific. This robust biogeographic partition provides compelling evidence that allopatric speciation is a primary driver of diversification within the genus.
1. Introduction
According to Eschmeyer’s Catalog of Fishes, accessed in May 2025, the family Carangidae Rafinesque, 1815, is divided into four subfamilies [1]: Caranginae Rafinesque, 1815; Naucratinae Bleeker, 1859; Scomberoidinae Jordan & Gilbert, 1883; and Trachinotinae Gill, 1861. This family comprises more than 30 genera and more than one hundred species inhabiting tropical, subtropical, deep water and temperate regions, as well as brackish water [2].
Within the subfamily Trachinotinae, a total of 14 genera have been described, but only two are currently recognized as valid according to Eschmeyer’s Catalog of Fishes: Trachinotus Lacepède, 1801, and Lichia Cuvier, 1816. Although Lichia has traditionally been included in Trachinotinae, recent genetic studies indicate that there is no support for its classification as an OTU within this subfamily [2]. Furthermore, other studies suggest that this genus is more closely related to Scomberoidinae [3]. Therefore, following the classification proposed by Damerau et al. (2018) [2], we consider Trachinotinae as a group represented solely by the genus Trachinotus.
This genus includes 70 named species, of which 21 are valid and 49 are classified as synonyms or have uncertain taxonomic status. Despite the diversity of this species, genomic knowledge, particularly regarding the mitochondrial genome, remains limited. As of May 2025, only four of the twenty-one valid species had complete mitochondrial genomes sequenced and available in GenBank (see Table 1), representing approximately 19% of the total valid species. Importantly, species within the subfamily Trachinotinae play ecologically significant roles in marine ecosystems [4] and possess considerable economic importance in both wild fisheries and aquaculture [5].
Table 1.
List of Trachinotus species included in this study with corresponding GenBank accession numbers, common names and IUCN Red List statuses. An accession column may contain multiple entries when more than one mitogenome sequence is available. The species shown in bold represent the mitochondrial genomes assembled in the present study.
From an ecological perspective, members of Carangidae play important roles in coastal marine environments, acting as mid-level predators and influencing trophic dynamics [6,7,8]. They are frequently found in channels, sandy bottoms near reefs, and occasionally on muddy substrates, where they feed on various benthic invertebrates and small fish. Species of the genus Trachinotus, for example, are widely distributed in tropical and subtropical coastal waters, inhabiting both estuarine and marine environments where they interact with a variety of other species [9].
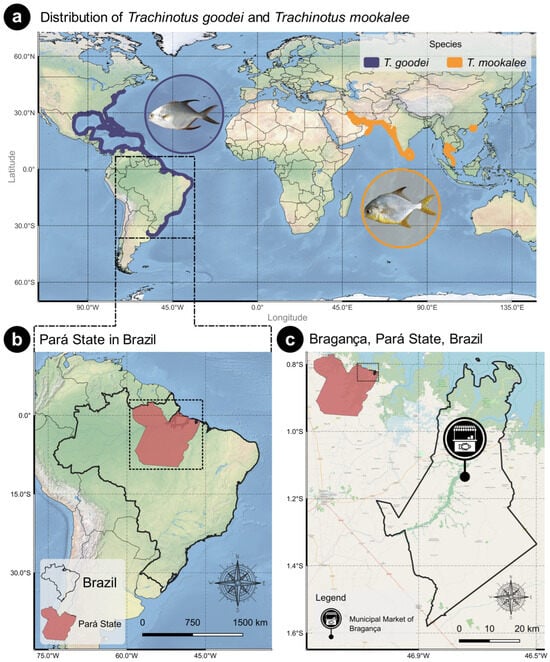
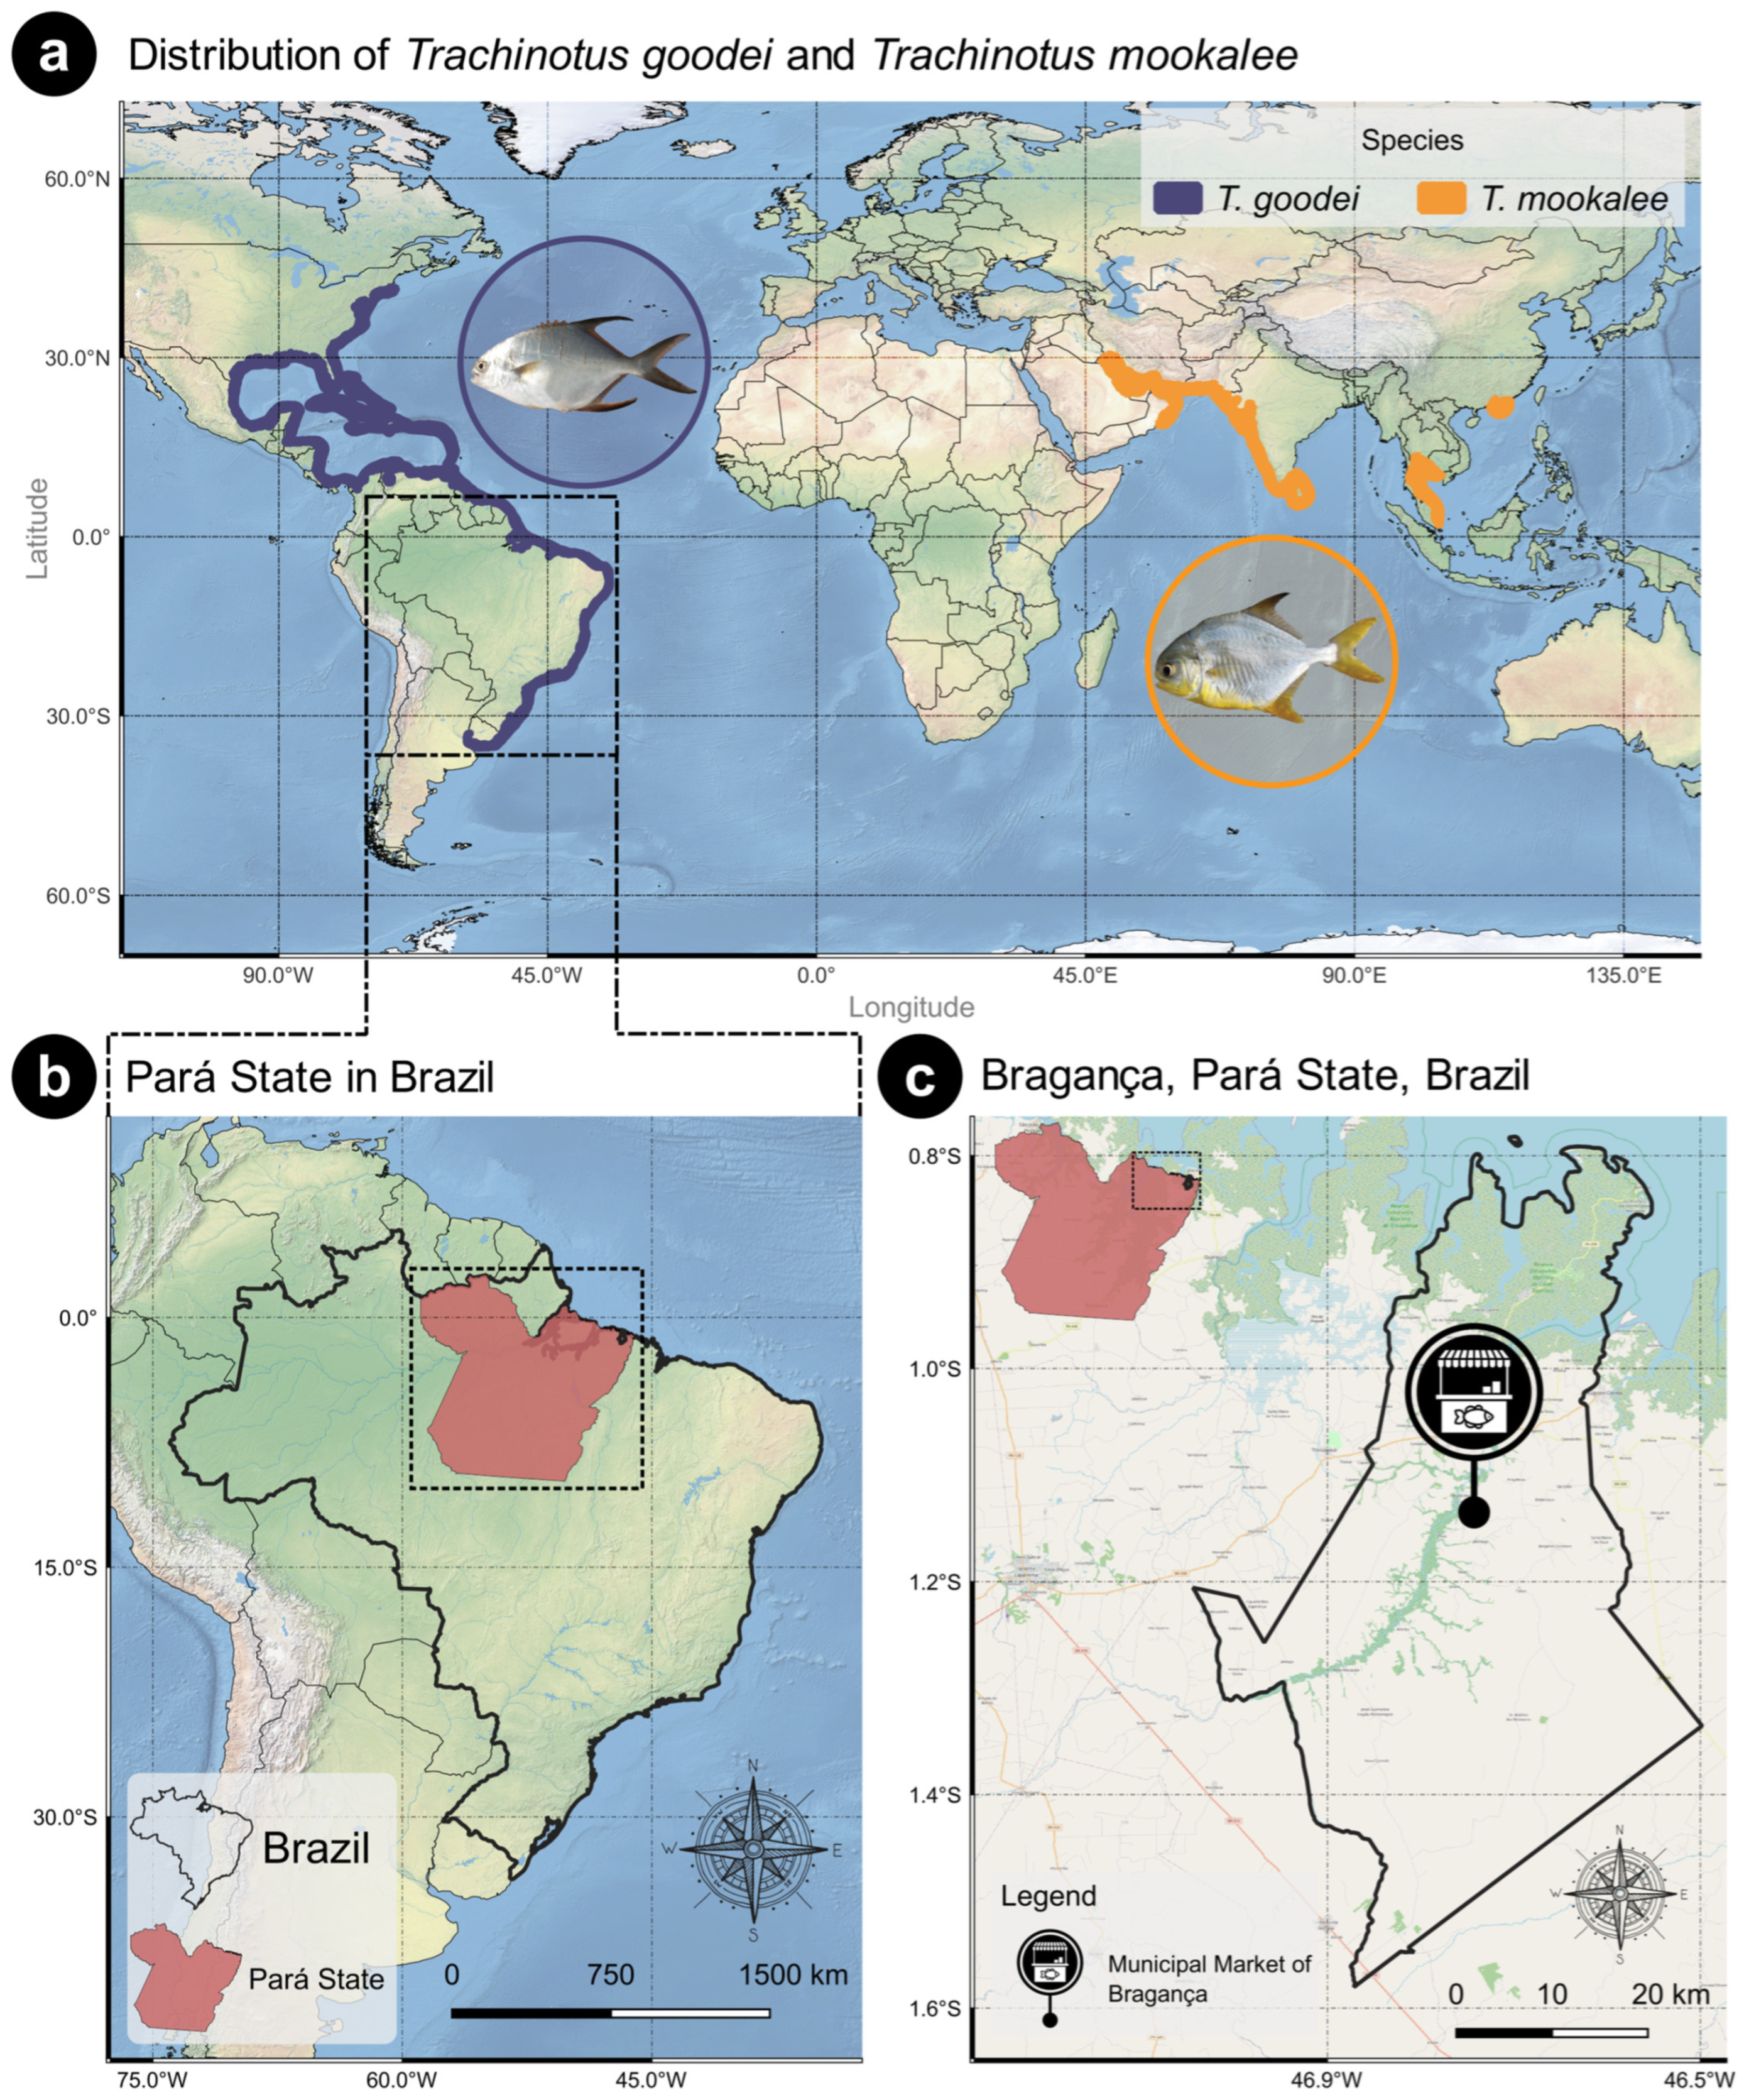
From an economic and fisheries standpoint, where accurate species identification is crucial, several Trachinotinae species are highly valued in commercial and recreational fisheries worldwide [10]. Data compiled from FishBase and the IUCN Red List of Threatened Species (November 2025), via the dataFishing tool [11], indicate that Trachinotus goodei and Trachinotus mookalee, although they possess limited direct commercial value, are significantly threatened by large-scale recreational fishing. Trachinotus goodei occurs in the western Atlantic, from Massachusetts (USA) to Argentina (Figure 1a), where it inhabits clear coastal waters and is often associated with coral formations as adults, with juveniles commonly found on sandy beaches. In contrast, Trachinotus mookalee is distributed across the western Indo-Pacific, including the western and northwestern Pacific and the western and eastern Indian Oceans (Figure 1a), and occupies shallow coastal waters. It is a carnivorous species that feeds on mollusks, fish, and shrimp and has rapidly matured in captivity [12], making it a promising candidate for aquaculture in India because of its meat quality and high market demand.
Figure 1.
(a) Geographic distributions of Trachinotus goodei and Trachinotus mookalee. Trachinotus goodei occurs in clear coastal waters, with adults often associated with coral formations and juveniles on sandy beaches; Trachinotus mookalee occupies shallow coastal waters. The maps were assembled according to the IUCN distribution maps; however, according to the official IUCN distribution, T. mookalee also occurs in the Pacific Ocean. (b) Pará state is located in the northern region of Brazil. (c) A sample of Trachinotus goodei was acquired at the Municipal Market of Bragança, located in the city of Bragança, Pará State, Brazil.
The growing demand for these fish, whether for consumption or sport fishing, underscores the urgent need for comprehensive genetic studies. These investigations are essential for assessing population connectivity, understanding genetic structure, and evaluating the impacts of fishing pressure on genetic diversity [13].
Mitochondrial genome analysis is essential for deepening our understanding of the evolutionary history, biogeography, phylogenetic relationships, and genetic diversity of these species.
Additionally, such data are crucial for the development of effective conservation strategies and the sustainable management of natural populations [14,15]. The use of mitogenomic data has proven indispensable in the management of economically and ecologically relevant species [16,17], providing accurate tools for fish stock delineation [18], product traceability [19], and ongoing genetic monitoring [20]. In the fisheries sector, for example, mitochondrial gene sequencing enables the identification of genetically distinct population units [21,22], which are essential for preventing overfishing [23], while its sensitivity to population variation facilitates seafood traceability, combating fraud and ensuring compliance with environmental regulations.
Furthermore, the lack of mitochondrial sequences for most valid species of the Trachinotinae subfamily may directly compromise taxonomy, phylogeny, and species identification within the group. This gap hinders the resolution of complex evolutionary relationships and the identification of potential new undescribed species or cryptic lineages [24,25]. Although individual mitochondrial gene fragments, such as COI, are often employed for species identification, they may present limitations when resolving phylogenetic relationships between closely related species [26,27]. The COI gene itself, despite being a well-established barcode marker, may lack sufficient variation to distinguish phylogenetically proximate fish because of its potentially slow evolutionary rate in these groups [28,29].
Obtaining complete mitogenomes is important for conservation advances. Traditionally, this involves direct extraction of mitochondrial DNA followed by Sanger or next-generation sequencing (NGS). These methods may require high-quality biological material and can be costly, often facing challenges with degraded samples. Therefore, researchers continue to seek alternative, cost-effective approaches to improve taxonomic coverage and optimize sequencing resources. RNA-Seq data, which are traditionally used for transcriptomic analyses, have emerged as an efficient alternative for assembling complete mitogenomes. High-energy-demand tissues such as muscle, brain, and liver contain abundant mitochondria, ensuring the presence of mitochondrial transcripts and facilitating mitogenome reconstruction [30].
The use of specialized bioinformatics tools such as MITGARD [30] has greatly simplified mitogenome recovery from RNA-Seq data, making mitochondrial DNA acquisition more accessible and efficient.
Therefore, the objective of this study was to sequence and assemble the complete mitochondrial genome of Trachinotus goodei. For Trachinotus mookalee, however, the assembly was based on publicly available RNA-Seq data from the NCBI Sequence Read Archive (SRA) via the MITGARD tool. Subsequently, phylogenetic and comparative analyses were performed, incorporating other Trachinotinae genomes available in GenBank, with the goal of expanding the knowledge of this important group of marine fishes.
2. Materials and Methods
2.1. Sampling
A sample of Trachinotus goodei was acquired at the Municipal Market of Bragança, located in the city of Bragança, Pará State, Brazil (Figure 1b,c), in January 2025. A sample of muscle tissue from the sample was then collected and immediately preserved in absolute ethanol at −20 °C until laboratory processing. Preliminary identification of the species at the site of acquisition was based on morphological characteristics and was later confirmed through molecular analysis of the COI gene sequence obtained from the complete mitochondrial genome sequenced in this study.
The samples were collected under authorization from the Instituto Chico Mendes de Conservação da Biodiversidade (ICMBio), SISBIO license no. 92817-1.
2.2. Sequencing
The genomic DNA from the samples was quantified and normalized to 20 ng/µL. Libraries were prepared via the standard Illumina protocol with tagmentation for 25–30 min, fragment sizes were assessed on a TapeStation 4200 (Agilent, Santa Clara, CA, USA), and the final libraries were quantified. Sequencing was performed on a NextSeq 2000 (Illumina, San Diego, CA, USA) with NextSeq 1000/2000 P2 reagents (300 cycles) to produce 300 bp paired-end reads, with insert sizes of 459–526 bp.
2.3. RNA-Seq Data Acquisition for Trachinotus mookalee
To obtain the RNA-Seq data for T. mookalee, searches were conducted in the Sequence Read Archive (SRA) repository of the National Center for Biotechnology Information (NCBI) via the species name to retrieve available RNA-Seq datasets. The resulting paired-end data (accession numbers SRR19789929, SRR19789930, and SRR19789931) were retrieved via the fasterq-dump tool (part of the SRA Toolkit) with the --split-files option to generate separate FASTQ files for forward and reverse reads.
After individual FASTQ files were obtained for each sample, an additional preprocessing step was performed. In this step, the files corresponding to the forward reads from all samples were concatenated into a single FASTQ file, and the same procedure was carried out for the reverse read files. Although MITGARD can handle multiple libraries, the reads were concatenated to simplify the data management and preprocessing steps within our specific computational pipeline.
2.4. Quality Control and Read Processing
Following the sequencing of T. goodei and the retrieval of SRA data for T. mookalee, the raw reads from both datasets were assessed via FastQC v0.12.1. The sequencing of T. goodei yielded 36,481,291 paired-end reads, whereas the concatenated RNA-Seq data for T. mookalee yielded 119,523,204 paired-end reads. Next, the reads were processed via fastp v0.24.0 [31,32] to remove adapters, low-quality bases, reads with Phred scores below Q20, short reads (<75 bp), and ambiguous sequences. After this filtering step, FastQC was used for independent visual inspection of quality metrics postfiltering, yielding 28,148,015 reads for T. goodei and 116,361,865 reads for T. mookalee.
2.5. Genome Assembly
After low-quality sequences were filtered, the reads were subjected to genome assembly via two methods. For the DNA data, the assembly was performed via NOVOPlasty v4.3.5 [33], with a k-mer size of 22 and the COI gene sequence (JQ841417.1) as the seed. For the RNA-Seq data, assembly was conducted via MITGARD, with the genome of Trachinotus blochii (Lacepède, 1801) (NC_024026.1) as a reference, alongside the concatenated RNA-Seq reads. MITGARD was selected for the RNA-Seq assembly because of its specific optimization for recovering mitochondrial sequences from transcriptomic data, whereas NOVOPlasty was retained for the genomic DNA dataset. Both the COI gene sequence and the reference genome were retrieved from GenBank via the SynGenes tool [34].
2.6. Assembly Validation and Coverage
Following assembly, the filtered raw reads from T. goodei and T. mookalee were mapped back to their respective assembled mitogenomes to assess assembly quality and coverage depth. Mapping was performed via Bowtie2 v2.5.2 [35], with local alignment mode (--local) and high-sensitivity parameters (--very-sensitive-local), allowing for alignment of reads with terminal mismatches or insertions/deletions, which are common in mitochondrial data [36]. All other parameters were left as defaults.
The resulting SAM (sequence alignment map) files were converted to BAM (binary alignment map) format and then sorted and indexed via samtools v1.19.2 [37]. Coverage statistics, including the mean depth and per-base coverage, were calculated with samtools depth. Mapping metrics such as the percentage of mapped reads, mapping error rate, and average mapping quality were evaluated via samtools flagstat [38] to ensure detailed alignment and coverage quality assessment. Genome circularity was confirmed by inspecting reads spanning contig junctions (NOVOPlasty) or through direct output from MITGARD.
2.7. Genome Annotation
The annotation of the mitochondrial genomes generated in this study was initially performed via the MitoAnnotator online platform [39] (http://mitofish.aori.u-tokyo.ac.jp, accessed on 31 May 2025), which applies a comparative approach based on a reference database of fish mitogenomes. Annotations were subsequently confirmed and refined via the standalone version of the MITOS2 tool [40] (https://gitlab.com/Bernt/MITOS/-/tree/mitos2, accessed on 31 May 2025). Transfer RNA (tRNA) genes were further analyzed, and their secondary structures were predicted via tRNAscan-SE v2.0 [41], which is configured with default settings for the vertebrate mitochondrial genetic code. The predicted secondary structures were visualized via the Forna web server [42].
Nucleotide composition (A, T, C, G%) and base asymmetries (AT-skew = [A − T]/[A + T] and GC-skew = [G − C]/[G + C]) were calculated via MEGA X software [43]. Codon usage and Relative Synonymous Codon Usage (RSCU) values for each protein-coding gene (PCG) were estimated on the basis of the vertebrate mitochondrial genetic code via PhyloSuite v1.2.2 [44]. The circular assembled mitochondrial genome was visualized via Proksee [45]. The assembled and annotated mitogenomes of T. goodei and T. mookalee were deposited in GenBank under the accession numbers PV818392.1 and PX528615.1, respectively.
2.8. Phylogenetic Analysis, Gene Order and Analysis of Genetic Distances
For phylogenetic tree construction, complete mitochondrial genomes of species within the subfamily Trachinotinae available in GenBank (see Table 1) were selected, along with the newly assembled genomes of T. goodei and T. mookalee. The genomes of Caranx crysos (NC_057648.1), Caranx latus (NC_082556.1), and Selar crumenophthalmus (NC_023954.1) were used as outgroup taxa. Retrieval of GenBank sequences was facilitated via the SynGenes tool [34]. Additional information, such as conservation status from the IUCN Red List of Threatened Species and common names, was obtained via the dataFishing tool [11]. All the mitochondrial sequences were uniformly reannotated with MitoAnnotator to ensure consistency in the identification of the 13 PCGs, which were used in the phylogenetic analysis.
Nucleotide sequences of each of the 13 PCGs were aligned individually via MAFFT v7 [46]. A trimming step was subsequently applied with trimAl [47] to remove poorly aligned or highly divergent positions that could negatively impact the accuracy of phylogenetic inference [48,49]. Finally, the cleaned individual alignments were concatenated into a combined data matrix via the CamlTree pipeline [50], which integrates and automates these alignment and trimming steps. Phylogenetic inference via maximum likelihood (ML) was performed with IQ-TREE v2.4 [51] on the basis of the concatenated dataset of the 13 PCGs. The best partitioning scheme and substitution model for each partition were determined simultaneously via ModelFinder and integrated into IQ-TREE.
To evaluate the robustness of the phylogenetic inference, a Bayesian inference (BI) analysis was also performed via MrBayes v3.2.7 [52]. The best-fit substitution model (GTR + I + G) was applied. The analysis consisted of two independent runs with four Markov Chain Monte Carlo (MCMC) chains each, run for 10 million generations, with trees sampled every 1000 generations. The first 25% of the sampled trees were discarded as burn-in. To identify tandem repeats throughout the genome, Tandem Repeats Finder [53] was employed with default parameters.
The gene organization of the mitogenomes of T. goodei and T. mookalee was compared with that of other Trachinotinae species available in GenBank. Circular genome maps were generated via Proksee, and the order of the 37 genes (13 PCGs, 22 tRNAs, and 2 rRNAs) and the control region were manually inspected to detect potential rearrangements, such as transpositions or inversions, relative to gene order patterns common in other teleosts [54].
Pairwise genetic distances among Trachinotinae species were calculated on the basis of the concatenated alignment of the 13 protein-coding genes (PCGs) separately and subsequently based on the concatenated alignment of all PCGs. The analysis was performed in MEGA X via the Kimura 2-parameter (K2P) substitution model.
3. Results
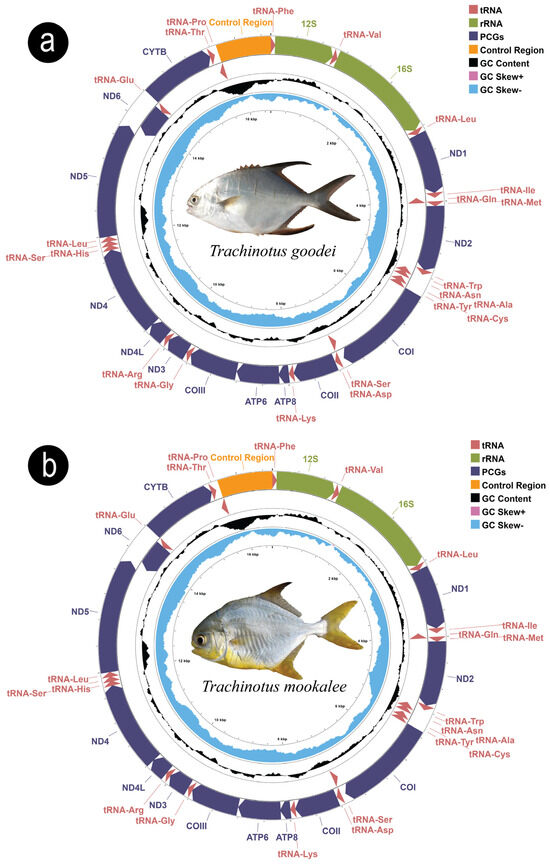
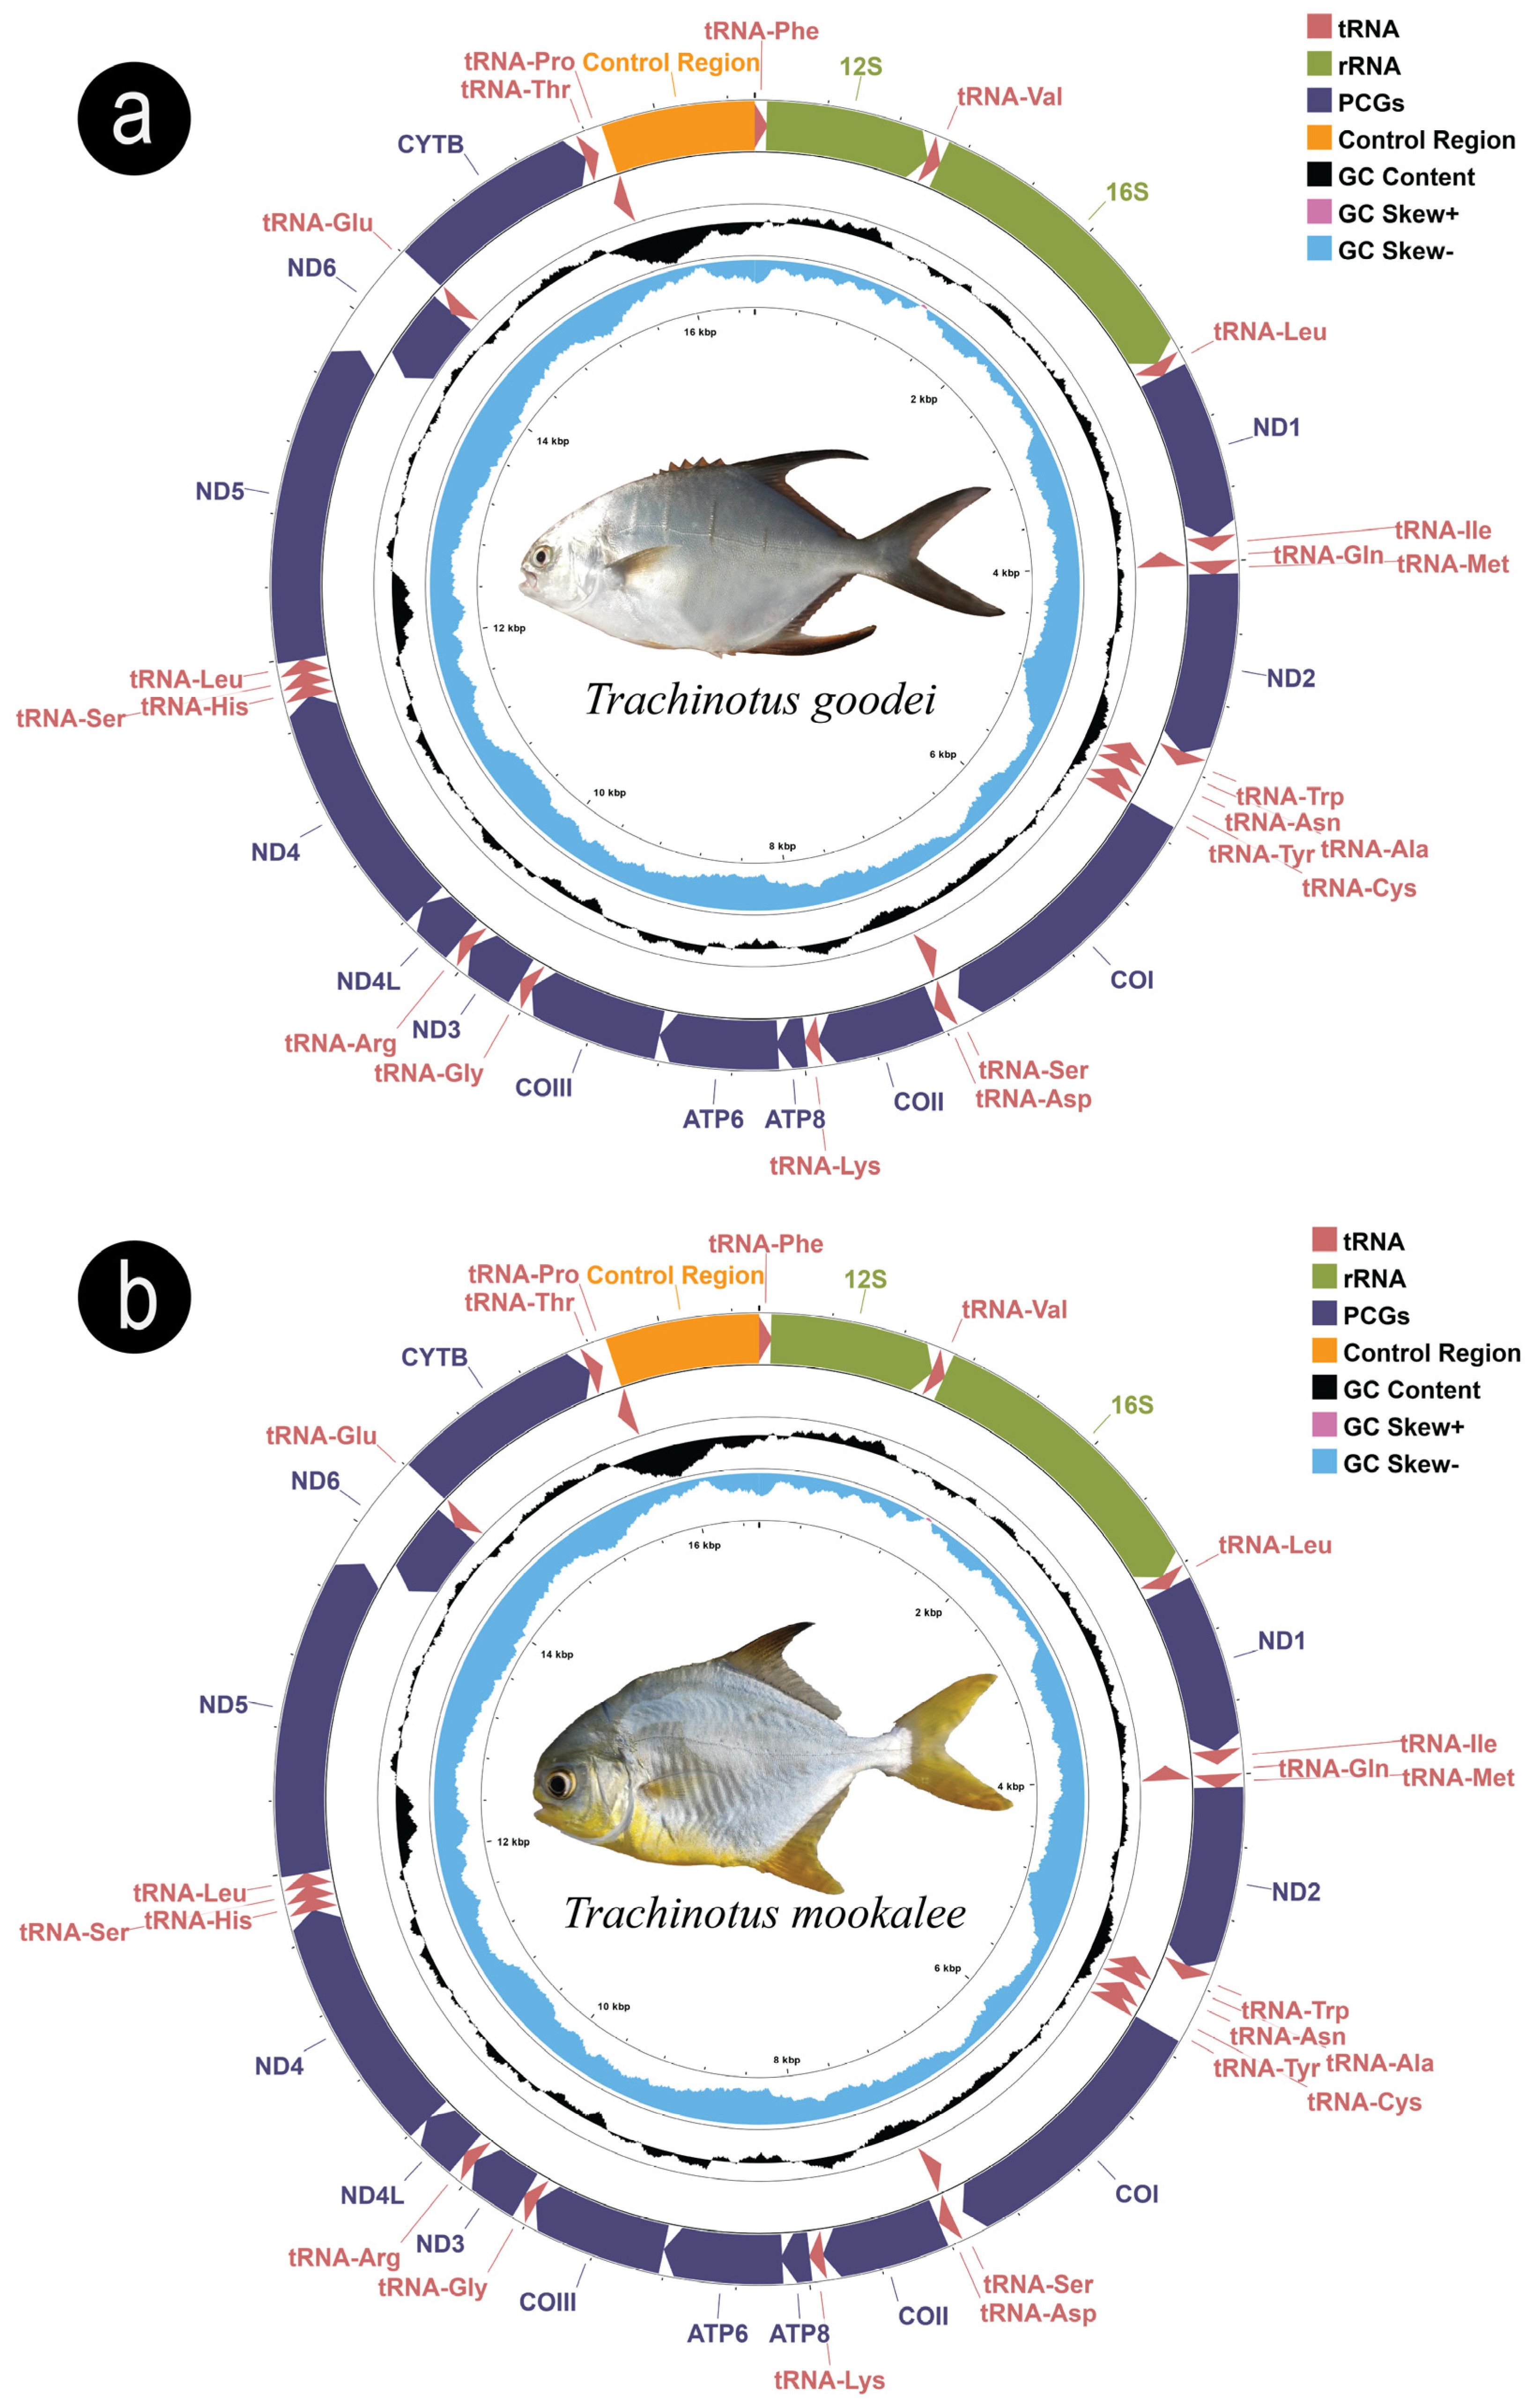
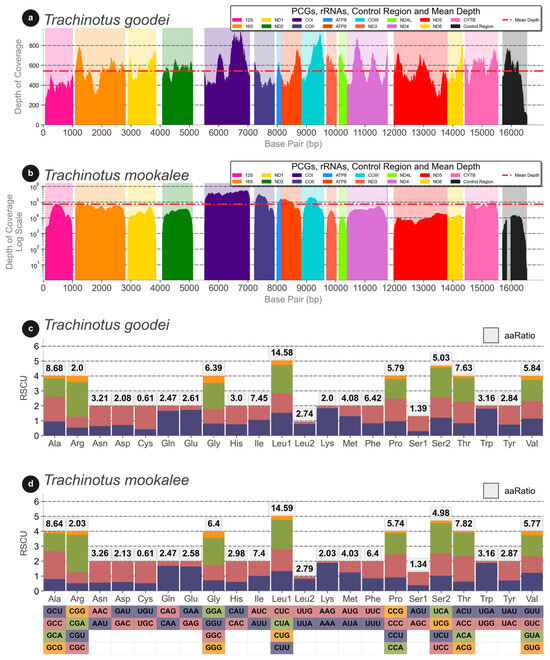
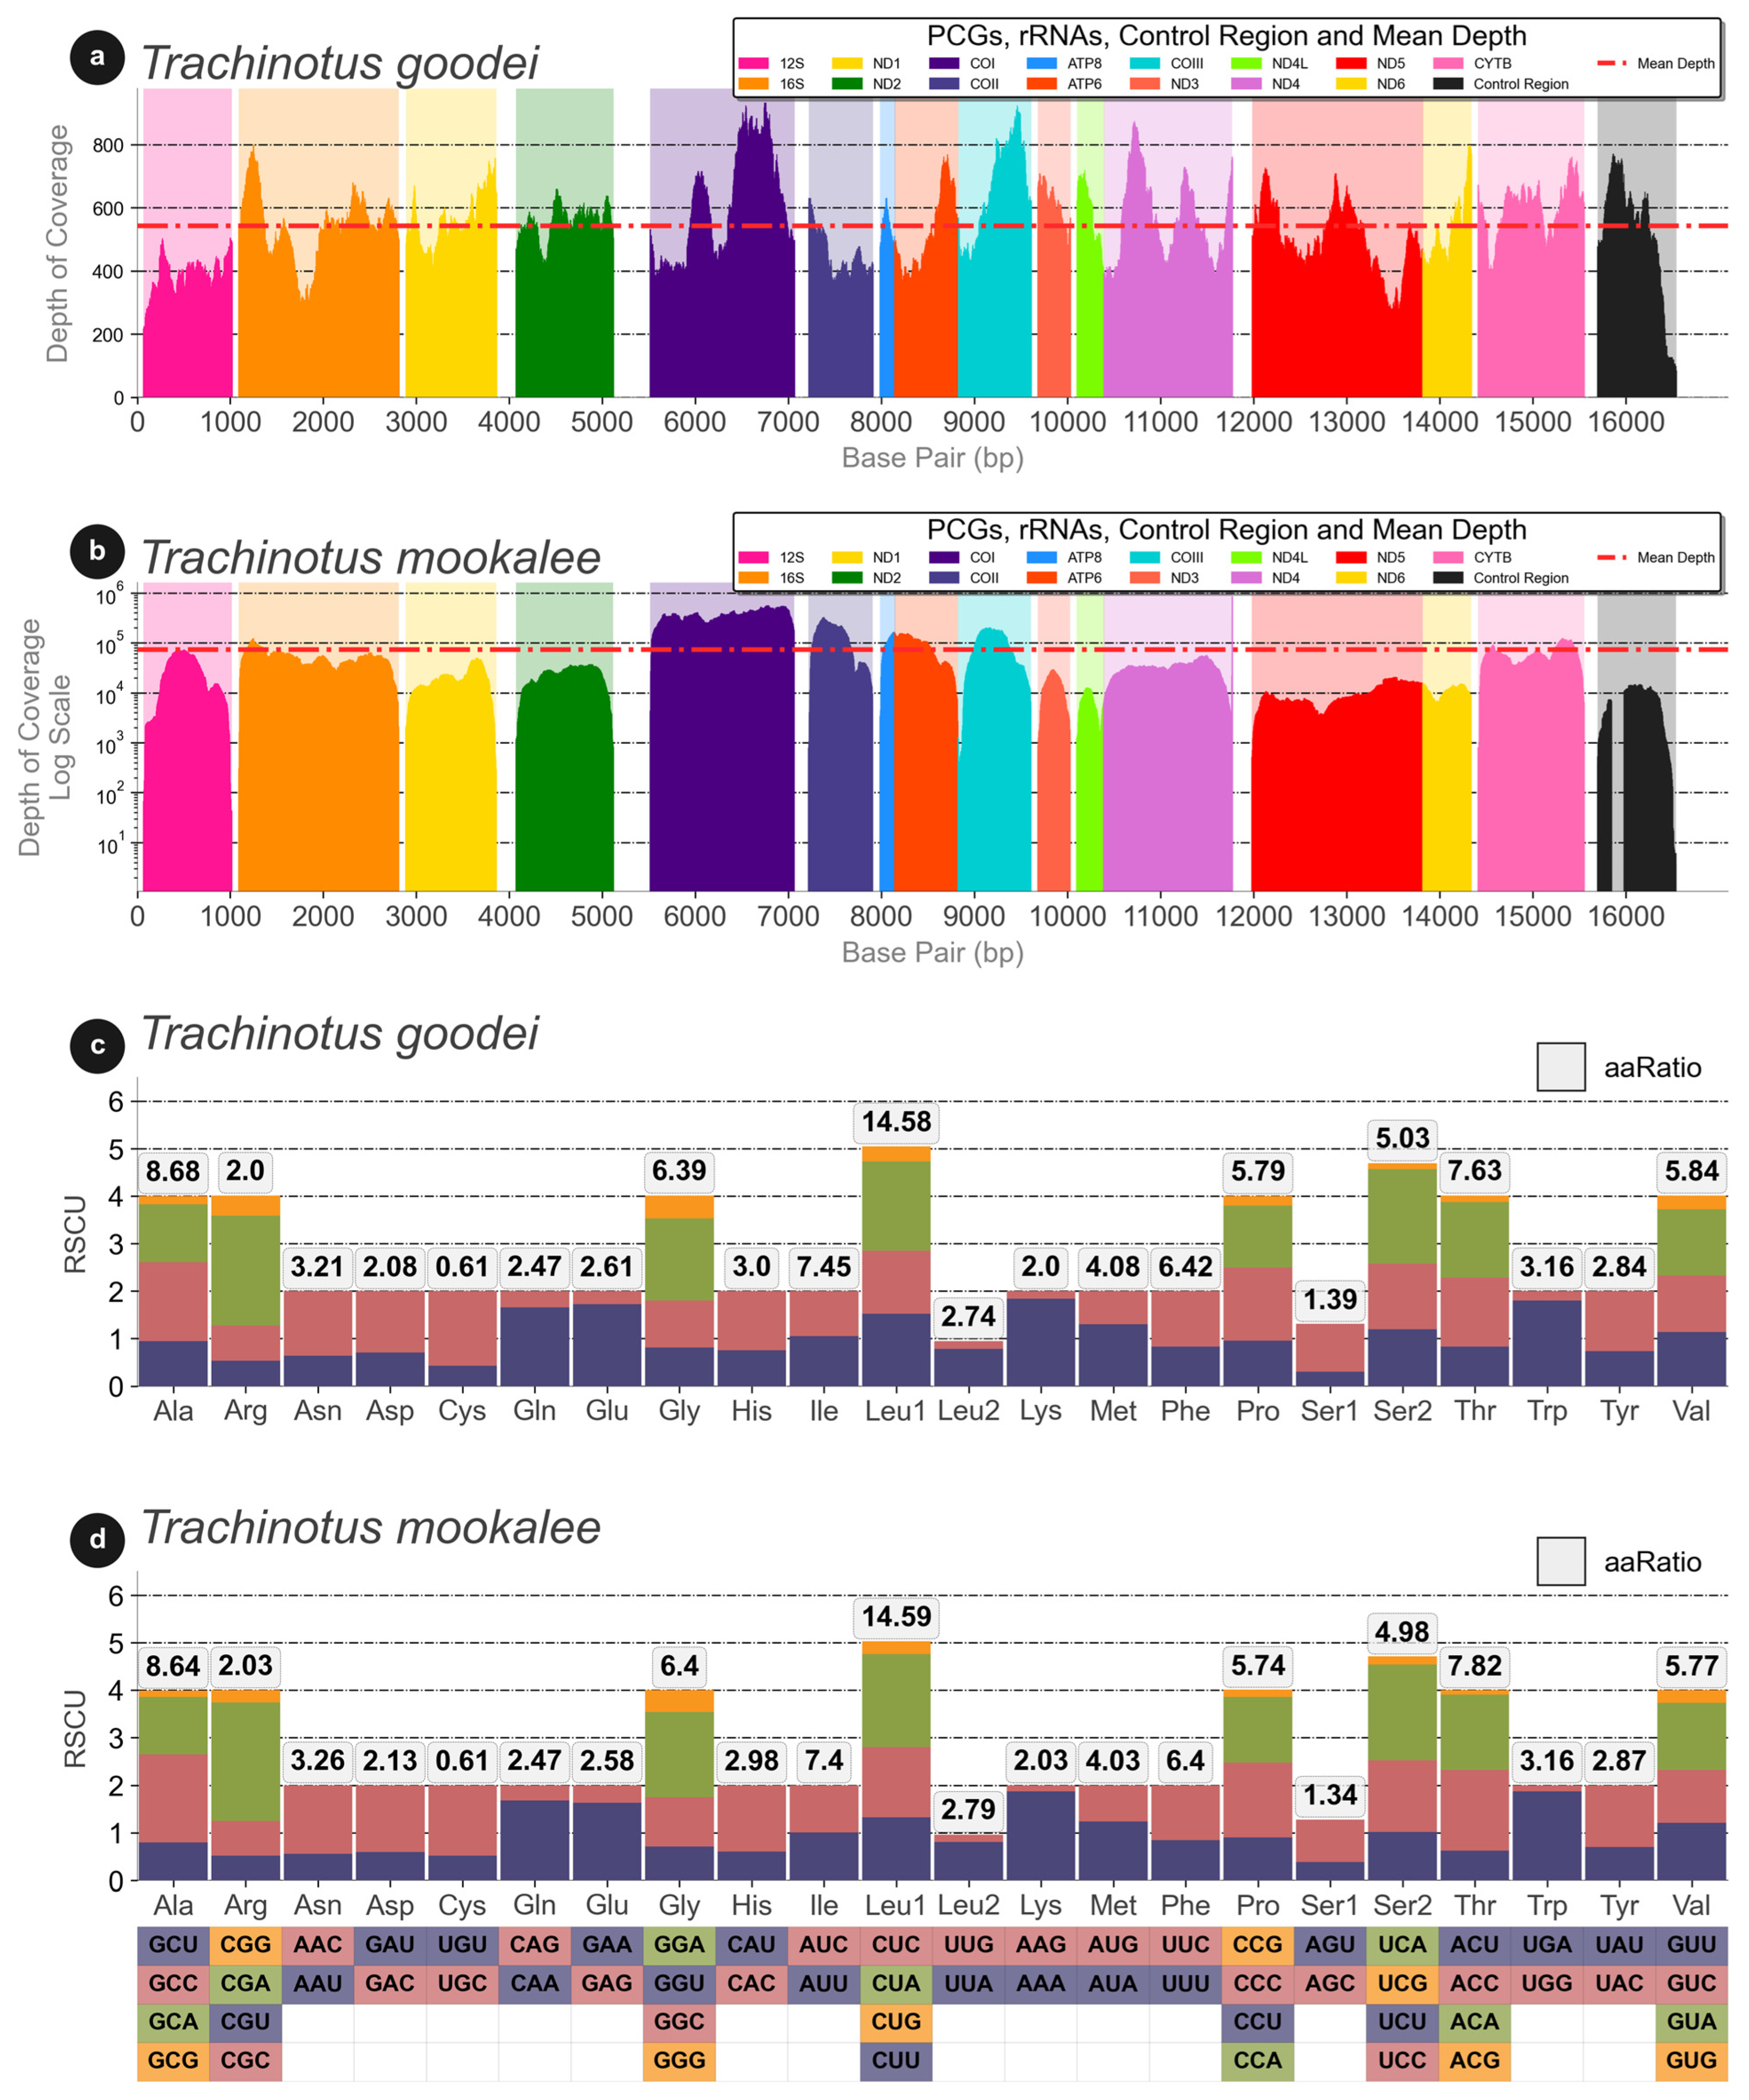
The assembly of T. goodei (Figure 2a) was successfully circularized via NOVOPlasty, with an average coverage depth of 542.14× (Figure 3a) and a total genome length of 16,547 bp. In contrast, T. mookalee (Figure 2b), assembled and circularized via MITGARD, achieved an average coverage of 72,314.32× (Figure 3b) and a genome size of 16,545 bp. The results of the analysis of Relative Synonymous Codon Usage (RSCU) in the mitochondrial genomes of T. goodei and T. mookalee are presented in Figure 3c,d. The predicted secondary structures of the tRNA genes are shown in Figures S1 and S2. No tandem repeats were detected in any of the assembled genomes.
Figure 2.
Mitochondrial genome maps of T. goodei (a) and T. mookalee (b). Gene groups are color-coded and labeled in the genome maps.
Figure 3.
Sequencing coverage across the mitogenomes is shown for T. goodei (a) and T. mookalee (b) on a log scale. Relative Synonymous Codon Usage (RSCU) plots are presented for T. goodei (c) and T. mookalee (d).
The mitochondrial genome structure is consistent with that observed in other teleost fishes, presenting the standard complement of 13 protein-coding genes (PCGs), 22 tRNA genes, 2 rRNA genes, and a control region. All the genes are located on the heavy strand (H), except for the ND6 gene and eight tRNA genes, which are located on the light strand (L) (Table S1). A similar gene organization was identified in other Trachinotinae species included in the study (Figure S3a). Table S2 presents a detailed comparison of the mitochondrial protein-coding genes (PCGs), transfer RNAs (tRNAs), and ribosomal RNAs (rRNAs) for the analyzed Trachinotinae species. The table also provides nucleotide composition details of the mitochondrial genomes, including the GC and AT contents as well as the calculated GC-skew and AT-skew values. The control region (D-loop) was not comparatively evaluated, as its size may be unreliable due to the MITGARD assembly methods, a limitation that has been previously reported in the literature [30,55,56].
The observed mitogenome sizes are consistent with those reported for other species in the Trachinotinae subfamily. Among the analyzed taxa, T. ovatus presented the largest complete mitochondrial genome (16,564 bp), whereas T. carolinus presented the smallest (16,544 bp). The average mitogenome size across the species is approximately 16,552 bp. Importantly, the T. mookalee genome contains unresolved regions, particularly in the control region, resulting in stretches of ambiguous bases (Ns). This may have led to a slight underestimation of its total genome size and base composition values.
In terms of protein-coding genes (PCGs), T. mookalee had the largest set (11,430 bp), which was slightly above the group average of 11,429 bp. With respect to tRNAs, all the species except T. goodei and T. falcatus had a total length of 1552 bp, with T. falcatus having a length of 1553 bp and T. goodei having a length of 1552 bp. The average tRNA length across species is 1552 bp.
For the rRNAs, the largest sets (2676 bp) were identified in T. blochii and T. ovatus, whereas T. carolinus had the smallest (2671 bp). The average rRNA length among the species is approximately 2674 bp, indicating a high level of conservation in this region.An analysis of the 13 protein-coding genes (PCGs) across the mitochondrial genomes of the six Trachinotus species revealed a highly conserved pattern for initiation (start) codons but notable variability in the usage of termination (stop) codons (Figure S3b).
Eleven of the thirteen PCGs (ATP6, ATP8, COII, COIII, CYTB, ND1, ND2, ND3, ND4L, ND4, and ND5) consistently initiate with the canonical ATG codon in all analyzed species. The remaining two genes, COI and ND6, invariably use the alternative initiation codon GTG. This pattern of start codon usage was identical and conserved across all studied genomes.
In contrast, the stop codons exhibit greater complexity, including the frequent use of noncanonical codons that likely function as incomplete stop codons. The canonical stop codons TAA and TAG were identified at the end of the ATP8, COI, ND1, ND4L, ND5, and ND6 genes. However, for other genes, a consistent use of atypical codons was observed across all species, namely, CTA as the stop codon for ATP6 and COIII, CCT for COII and CYTB, and AAT for ND3. However, notable interspecific variation was identified. For the ND2 gene, T. blochii utilizes the codon CTA, whereas the other five species use TTA.
The amino acid composition of the combined 13 PCGs was analyzed to reveal their general content and compositional features (Figure S3c). The overall amino acid profile was highly conserved across the six Trachinotus species.
The analysis also revealed a strong prevalence of leucine (L), which is the most abundant amino acid, accounting for approximately 12.6% of the total composition on average. This is followed by serine (S) (10.9%), proline (P) (10.6%), and threonine (T) (8.2%). Conversely, the least frequent amino acids were cysteine (C) (2.0%), aspartic acid (D) (2.3%), and tryptophan (W) (2.6%).
The pairwise genetic distances among the Trachinotinae species revealed varying levels of both intraspecific and interspecific divergence. The intraspecific variation (within the same species) was notably low. The genetic distances among different specimens of T. blochii, as well as among T. carolinus, were 0.0% across all analyzed genes (Figure S4). For T. ovatus, minimal variation was observed, with distances ranging from 0.0% to a maximum of 0.59% in the ATP8 gene.
Interspecific genetic distances (between different species) spanned a wide range, indicating varying degrees of relatedness. The lowest observed interspecific distance was 0.19% between T. blochii and T. ovatus for the ND6 gene, whereas the greatest divergence reached 15.24% between T. carolinus and T. goodei for the ND3 gene.
Gene-by-gene analysis revealed that the genes encoding the NADH dehydrogenase subunits, such as ND1, ND2, ND3, and ND4, presented the greatest variability, consistently revealing the greatest genetic distances among species. For example, in addition to the maximum value for the ND3 gene, the distance between T. goodei and T. carolinus was also high for the ND1 (15.13%) and ND4 (14.92%) genes. In contrast, genes such as COII and ATP8 were more conserved, with lower maximum divergences of 6.9% and 9.1%, respectively.
The distance of the whole sequences and genome (Figure S4) analyzed showed that the divergence varied between 0.00% and 11.06%. The maximum genetic divergence (11.06%) was observed between T. carolinus (KJ556976.1) and T. goodei (PV818392.1) (Table S3). In contrast, the lowest interspecific divergence was found between T. mookalee and T. ovatus, with values ranging from 5.11% to 5.13%. In terms of intraspecific variation, the sequences of T. blochii and T. carolinus were not different (0.00%), whereas T. ovatus presented a minor internal variation of 0.13%. Other notable comparisons included T. blochii, which presented distances ranging from 7.81% (with T. ovatus) to 10.59% (with T. carolinus). Overall, the data suggest that T. carolinus and T. goodei are the most divergent species within the analyzed group. On the other hand, T. mookalee and T. ovatus consistently presented relatively low distances across most genes, such as 2.2% in the COII gene, indicating a relatively close phylogenetic relationship.
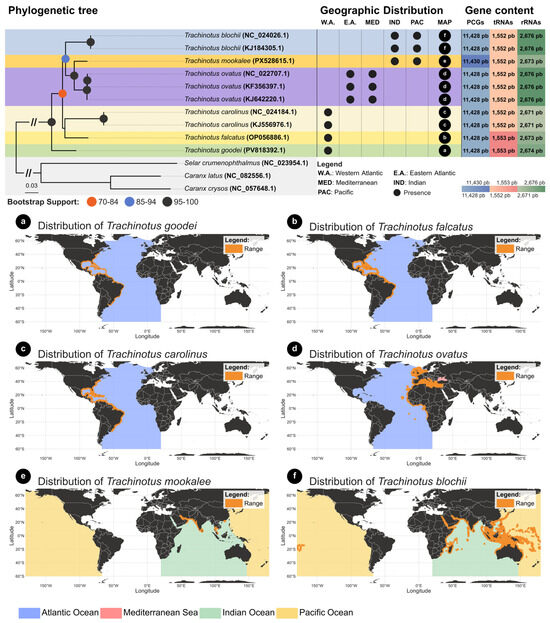
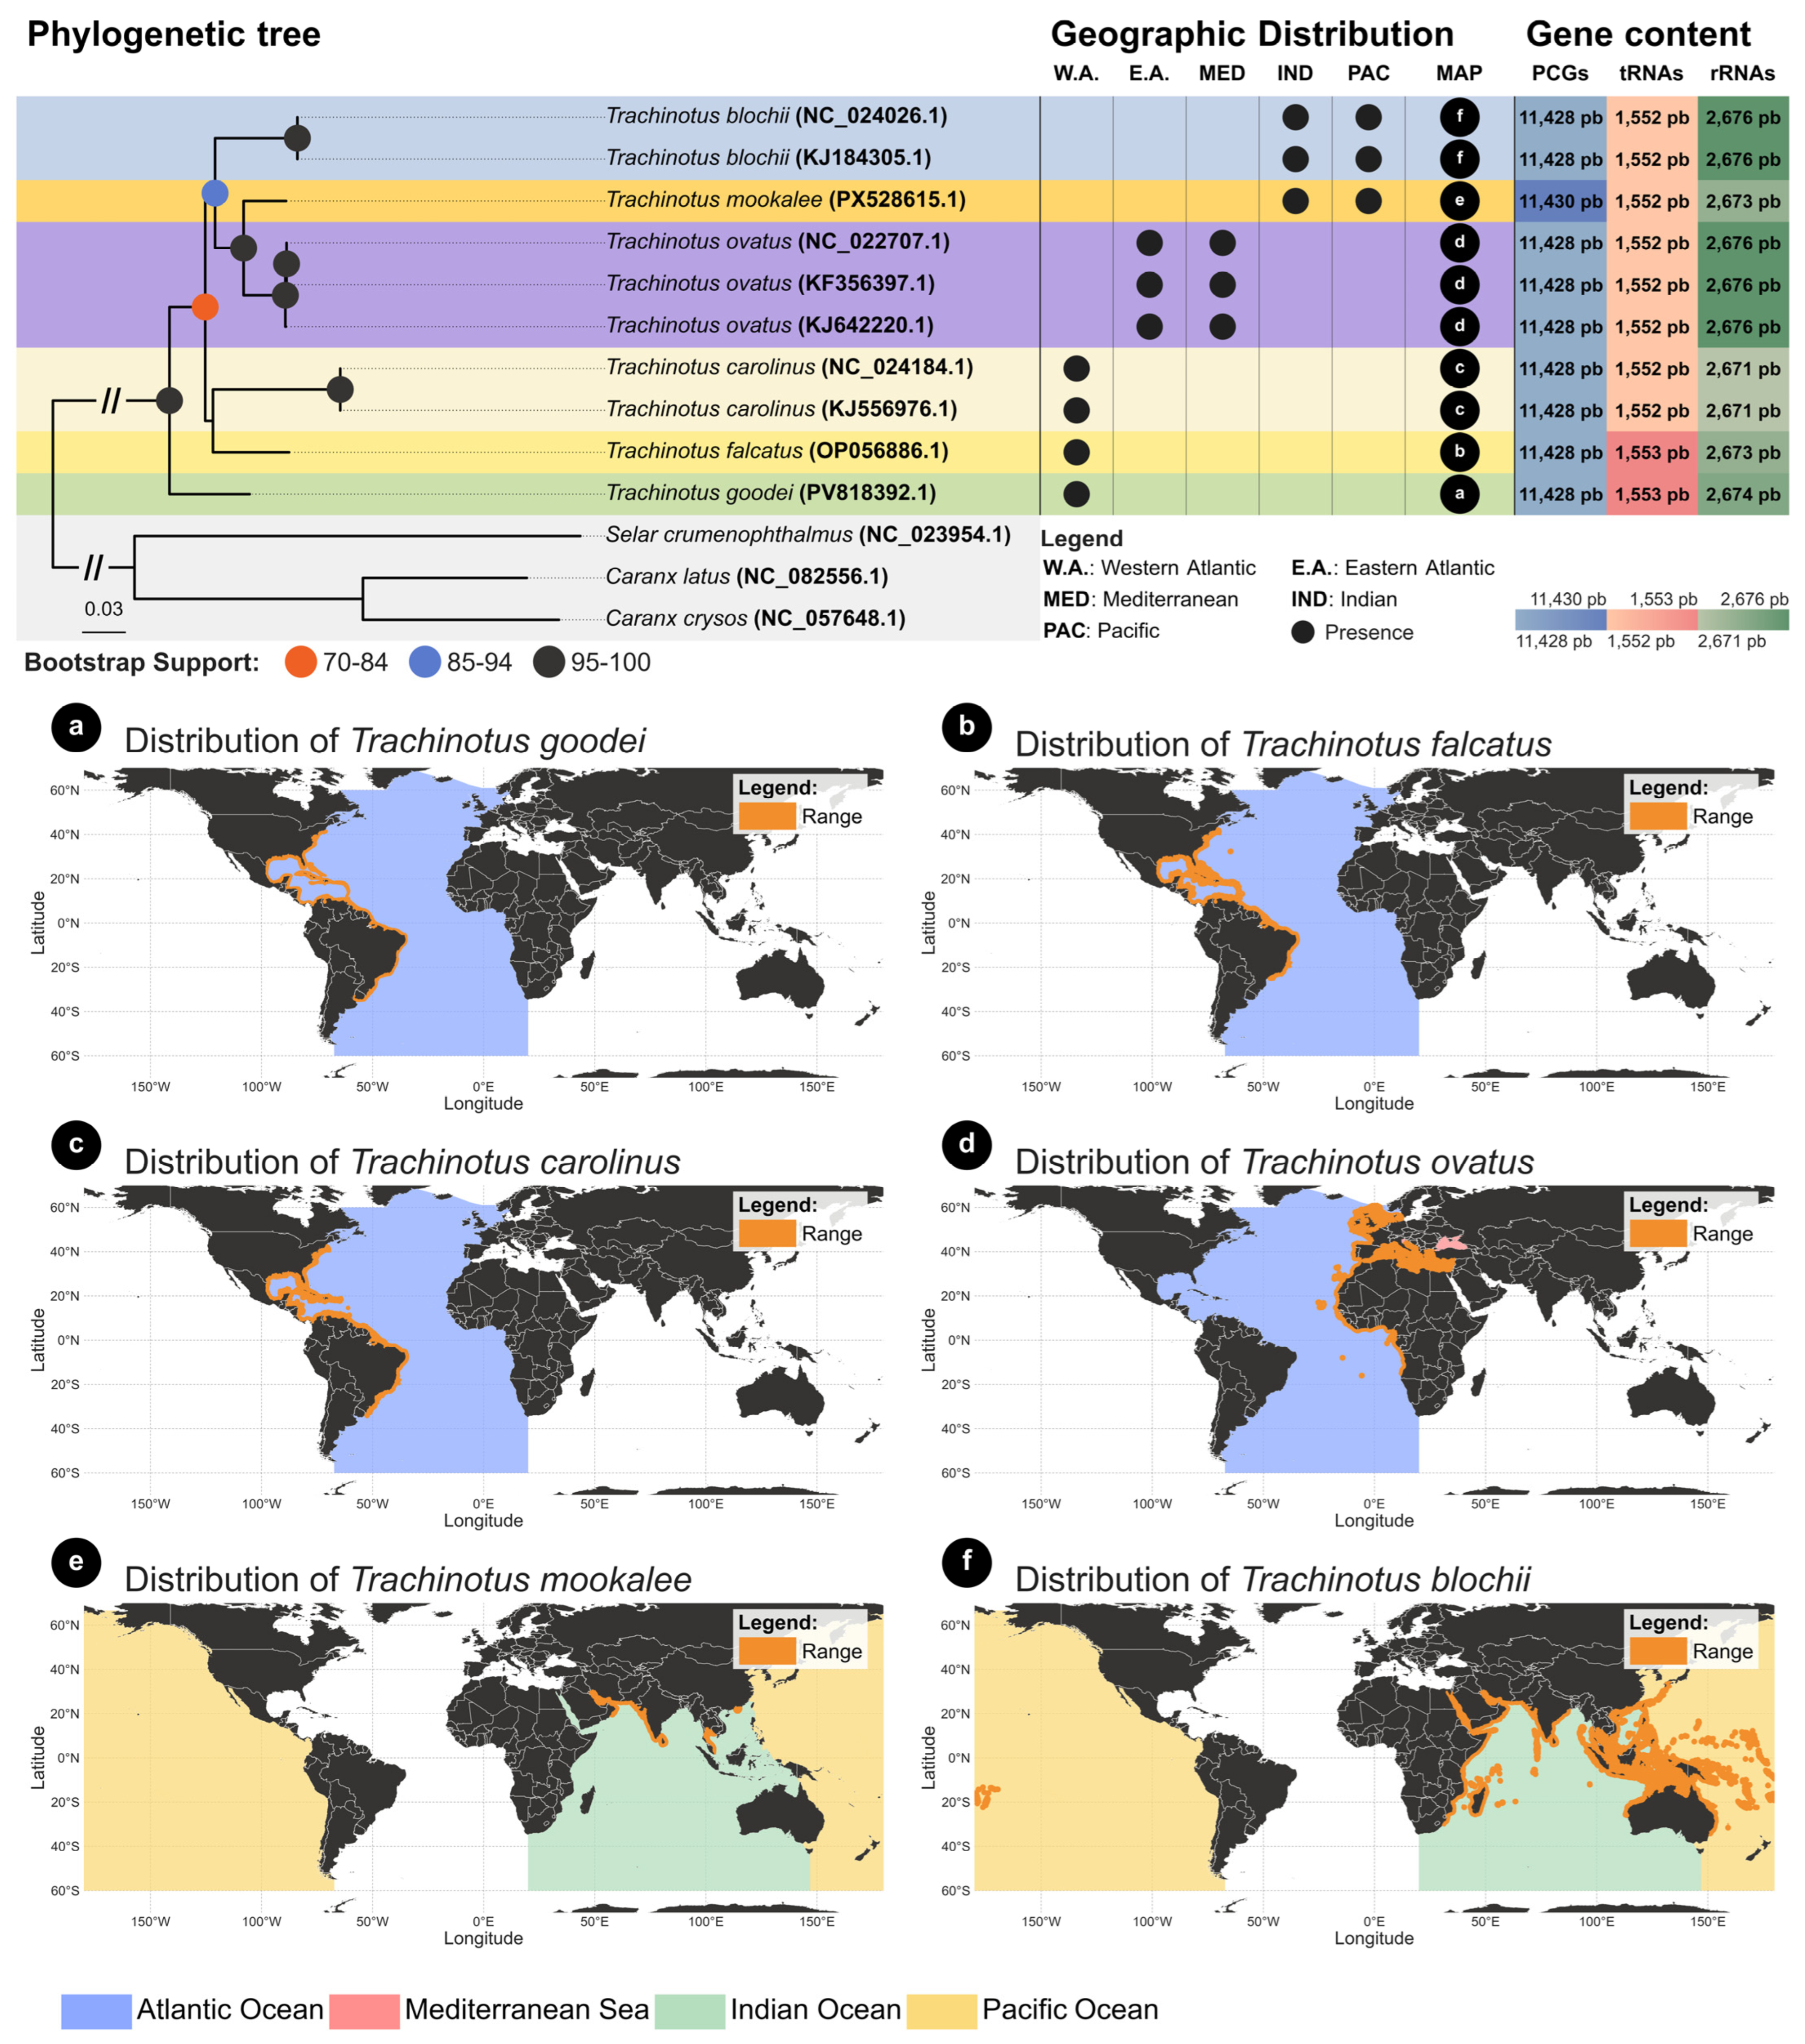
Phylogenetic inference analysis was conducted to elucidate the evolutionary relationships among Trachinotus species, using Caranx crysos, Caranx latus, and Selar crumenophthalmus as the outgroup. The topology of the resulting tree (Figure 4) shows that the genus Trachinotus forms a strongly supported monophyletic clade (100% bootstrap; 1.0 posterior probability).
Figure 4.
Maximum likelihood (ML) phylogenetic tree and geographic distribution of Trachinotus species. The tree is based on 13 protein-coding genes, with bootstrap support shown by colored circles. The matrix summarizes gene sizes and each species’ oceanic occurrence. Maps (a–f) illustrate the geographic distribution of the six species included in the analysis (for T. mokokalee (e), please see Figure 1 legend).
The maximum likelihood and Bayesian (Figure 4 and Supplementary Figure S5) trees present the same basic topology, with a clear division into three major clades (western Atlantic species; Eastern Atlantic/Mediterranean/Indo-Pacific; and T. godei from western Atlantic). The first clade groups the species from the western Atlantic, T. carolinus and T. falcatus; however, this is not supported by effective bootstrap values or posterior probabilities. The second group is composed of the species T. mookalee and T. ovatus, which were recovered as sister species, with maximum statistical support, and is a sister group of two specimens of T. blochii. Finally, T. goodei is the sister species from those two clades with maximum statistical support.
The analysis also confirmed that different genomes within the same species (e.g., different T. blochii or T. ovatus samples) cluster together with the support of 100% and very short branch lengths, validating their taxonomic identification.
4. Discussion
4.1. Comparative Structure of Mitogenomes from Carangidae
The mitochondrial genome structure of the Trachinotus species from the Carangidae family is consistent with that observed in other teleost fishes. The genomic organization observed in T. goodei and T. mookalee reflects the high structural conservation characteristic of the Carangidae family and other teleosts. Both genomes were successfully circularized, with total lengths of 16,547 bp and 16,545 bp, respectively. These values are in close agreement with the ranges observed in other members of the subfamily Trachinotinae, such as T. carolinus (16,544 bp) and T. ovatus (16,564 bp), as well as in species from other Carangidae subfamilies, whose sizes typically range between 16.5 kb and 16.7 kb [57,58,59].
Importantly, the present study compared only 6 of the 22 valid species within the genus, representing approximately 28% of its diversity. Therefore, the identification of the species with the largest and smallest genomes may be an underestimation, as there is insufficient information to definitively determine which species possesses the largest genome within the entire genus.
The standard mitochondrial architecture of 37 genes (comprising 13 protein-coding genes (PCGs), 22 tRNA genes, and 2 rRNA genes) was maintained across all analyzed Trachinotus species. The strand distribution, with the majority of genes located on the heavy (H) strand and the ND6 gene along with eight tRNA genes on the light (L) strand, is a ubiquitous feature in Carangidae [57,59]. Unlike those in the genus Scomberoides, where an extra tRNA-Met gene duplication was detected [59], the Trachinotinae mitogenomes did not exhibit gene rearrangements or tandem repeats. This structural stability suggests that the subfamily Trachinotinae preserves the ancestral mitochondrial organization of the family, without random duplications occurring in more derived lineages such as Scomberoidinae [59].
The analysis of base composition revealed a clear A + T bias, with average values consistent across the species. This bias is common in vertebrate mitogenomes and directly influences Relative Synonymous Codon Usage (RSCU). In Trachinotinae, the profile of the most abundant amino acids observed is mirrored in other Carangidae species, such as Alectis indicus and Decapterus tabl [57]. The predominance of codons ending in A or C in the third position in Carangidae appears to be a driving force in the conservation of these amino acid profiles [57,59].
A notable point of structural conservation in Trachinotus mitogenomes is the use of initiation codons. While 11 of the 13 PCGs consistently initiate with the ATG codon, the COI and ND6 genes invariably use the alternative initiation codon GTG. This use of GTG for COI is a conserved trait throughout the Carangidae family [57,58,59].
In contrast, variation in termination codons reveals greater complexity. In addition to the canonical TAA and TAG stop codons, the recurrent use of atypical codons such as CTA, CCT, and AAT was observed across the species. In the literature, such variation is often attributed to incomplete stop codons (T or TA), which are subsequently completed by posttranscriptional polyadenylation to form functional TAA signals [58,59].
The identification of specific interspecific variations, such as the use of CTA in T. blochii versus TTA in the other five Trachinotus species for the ND2 gene, demonstrated that despite high structural conservation, small polymorphisms in gene termination occur within the genus. This diversity is further highlighted compared with other Carangidae, as P. dentex [58] utilizes the canonical TAG stop codon for the same gene, suggesting that termination strategies for ND2 may be genus-specific within the family.
4.2. Phylogenetic Analysis
Molecular analyses have revealed a complex phylogenetic structure within this genus, indicating the presence of cryptic species complexes that complicate their taxonomy [60]. A significant finding highlighted in phylogenetic analysis is the role of habitat adaptation in shaping the genetic diversity observed within Trachinotus species [2]. For example, the adaptability of species such as Trachinotus carolinus and Trachinotus anak to varying depths and marine environments contributes to their evolutionary success [61].
Recently, new mitogenomes have been deposited in GenBank, offering new possibilities for a more robust phylogeny [57,58,59]. Our phylogeny, which included only species from the Trachinotus genus (six species), revealed that the genus has diversified recently compared with Caranx species, revealing recent relationships between the species of the genus. This finding is corroborated by other phylogenetic studies, which include Trachinotus species, which use few markers [2] or mitogenomes [59].
The three clades found in the present study, including the clear separation between the western and eastern Atlantic, are also present in the study by Glass et al. (2023) [3] through the use of 1314 ultraconserved elements (UCEs). Similarly, some phylogenetic relationships were not supported, such as T. carolinus vs. T. paitensis, which in fact resembled the nonsupported nodes of T. carolinus vs. T. falcatus. This may be explained, for example, by rapid radiations within the group, making phylogenetic analysis more challenging. In fact, the observed topology suggests deep divergence within the genus, likely dating back to the Miocene origin of the Trachinotinae lineage (~12 Mya), as previously estimated for the subfamily [59].
Regarding the separations and connections among Carangidae species, there are other examples, as these examples indicate that the Atlantic and Mediterranean species of Carangidae often have evolutionary links to Indo-Pacific ancestors, supporting the hypothesis that a common lineage is influenced by oceanic currents and migratory pathways [2,59].
Finally, it is worth mentioning that the structural stability observed in Trachinotus mitogenomes, for example, maintaining gene order and tRNA conservation, is remarkable when contextualized by an independent evolutionary history of at least 12 million years [59]. Although this timeframe was sufficient for the accumulation of polymorphisms in stop codons, it was not enough to alter the subfamily’s ancestral mitochondrial synteny, highlighting exceptional genomic conservation despite deep evolutionary divergence.
Unfortunately, owing to the limited number of Trachinotus species included in the present study, as well as the lack of different samples from species that occupy large distribution areas, such as the Atlantic Ocean and the Mediterranean Sea, further considerations regarding the phylogeny (or phylogeography) of the species are not possible. However, sequencing these samples will allow future phylogenomic studies to be conducted, enabling a more detailed understanding of the phylogeny of Trachinotus.
In summary, the recovered phylogeny robustly demonstrates the separation of the analyzed Trachinotus species into three distinct evolutionary lineages, which correspond to their geographic distributions (two from the western Atlantic vs. one from the eastern Atlantic, including the Mediterranean and Indo-Pacific) (Figure 4a–f).
The availability of the complete mitogenomes of T. goodei and T. mookalee provides essential markers (such as complete COI sequences) to differentiate these species from other carangids in processed products (e.g., filets), thereby combating fraud. Furthermore, these genomic resources enable the design of specific primers for eDNA studies and population structure analyses, which are vital given the significant recreational fishing pressure previously mentioned.
5. Conclusions
This study successfully expands the genomic landscape of the commercially and ecologically important marine fish genus Trachinotus by providing the first complete mitochondrial genomes of Trachinotus goodei and Trachinotus mookalee. Our work demonstrates the utility of contrasting sequencing strategies, successfully leveraging both traditional shotgun sequencing and the mining of public transcriptomic data to achieve our goals. The comparative analysis of these new genomes, along with existing data, confirmed a highly conserved mitogenomic structure across the genus.
Supplementary Materials
The following supporting information can be downloaded at: https://www.mdpi.com/article/10.3390/d18020088/s1, Figure S1: Secondary structures of tRNAs in the mitogenome of T. goodei. The gene names corresponding to each tRNA are indicated above its secondary structure; Figure S2: Secondary structures of tRNAs in the mitogenome of T. mookalee. The gene names corresponding to each tRNA are indicated above its secondary structure; Figure S3: Comparative mitogenomic analysis of Trachinotus species. (a) Gene order and strand orientation (heavy or light) for the 37 mitochondrial genes and the control region. (b) Heatmap of the start and stop codons for the 13 protein-coding genes (PCGs) in the analyzed species. (c) Heatmap showing the amino acid composition and frequency for the combined set of 13 PCGs; Figure S4. Heatmaps of the pairwise genetic distances (K2P model) for each of the 13 protein coding genes (PCGs) and whole genomes among the six Trachinotus species. Each matrix represents a single gene (ATP6, ATP8, COI, COII, COIII, CYTB, ND1, ND2, ND3, ND4, ND4L, ND5, ND6, whole genome). The color scale (blue to green) indicates the percentage of K2P distance. Intraspecific comparisons (e.g., between different samples of T. blochii or T. ovatus) are highlighted in the blocks on the main diagonal; Figure S5: Bayesian inference phylogenetic tree; Table S1: Comparative description of the mitochondrial genomes of Trachinotus goodei and Trachinotus mookalee. The asterisk (*) indicates that the control region was not evaluated because of the methodology used in the genome assembly; Table S2: Nucleotide composition of Trachinotus species. The values marked with an asterisk (*) refer exclusively to T. mookalee, whose genome assembly contains unresolved regions, especially in the control region. These regions include stretches of ambiguous bases (Ns), which may have led to a slight underestimation of genome size and base composition; Table S3: Pairwise genetic distances (%) between Trachinotus species on the basis of whole mitochondrial genome sequences and the 13 individual protein-coding genes (PCGs). The values represent the percentage of divergence for each comparison.
Author Contributions
Conceptualization, O.D.A.B. and L.R.; methodology, L.R., E.J.S.M., T.C.T.B. and J.A.P.B.; software, L.R.; formal analysis, O.D.A.B. and L.R.; writing—original draft preparation, O.D.A.B., G.G., N.E.A.N. and L.R.; writing—review and editing, O.D.A.B., L.R., E.J.S.M., T.C.T.B., J.A.P.B., G.G., A.A. and M.V.; supervision, M.V.; project administration, M.V., I.S. and A.A.; funding acquisition, M.V., I.S., N.E.A.N. and A.A. All authors have read and agreed to the published version of the manuscript.
Funding
This study was financed in part by the Coordenação de Aperfeiçoamento de Pessoal de Nível Superior—Brazil (CAPES)—Finance Code 001 and CNPq (Conselho Nacional de Desenvolvimento Científico e Tecnológico) through a graduate scholarship to OA, research productivity (PQ) fellowships to MV (303889/2022-5), and sequencing support funded by Vale and ITV through the Genômica da Biodiversidade Brasileira (GBB) Project.
Institutional Review Board Statement
Collection was conducted in compliance with all applicable Brazilian regulations under ICMBio and the SISBio authorization system, established by Law No. 11516 of 28 August 2007, under SISBio license No. 92817-1, which authorizes the collection and handling of biological samples. Specimens were obtained postmortem from public fish markets, where they were sold for human consumption, and no capture or euthanasia was performed for this study.
Data Availability Statement
The original data presented in the study are openly available in GenBank (PV818392.1 and PX528615.1).
Acknowledgments
We express our gratitude to PROPESP/UFPA, CAPES (Coordenação de Aperfeiçoamento de Pessoal de Nível Superior) and CNPq (Conselho Nacional de Desenvolvimento Científico e Tecnológico) for their financial contributions.
Conflicts of Interest
The authors declare no conflicts of interest.
References
- Abdel-Baki, A.S.; Aboelhadid, S.M.; Abdel-Tawab, H.; Rocha, S.; Ahmed, M.; Al-Quraishy, S.; Mansour, L. Ultrastructural and Molecular Characterization of Glugea sp. (Microsporidia), a Parasite of the Red Sea Fish Carangoides bajad (Carangidae). J. Eukaryot. Microbiol. 2024, 71, e13058. [Google Scholar] [CrossRef] [Scilit]
- Damerau, M.; Freese, M.; Hanel, R. Multi-gene Phylogeny of Jacks and Pompanos (Carangidae), Including Placement of Monotypic Vadigo Campogramma glaycos. J. Fish Biol. 2018, 92, 190–202. [Google Scholar] [CrossRef] [Scilit]
- Glass, J.R.; Harrington, R.C.; Cowman, P.F.; Faircloth, B.C.; Near, T.J. Widespread Sympatry in a Species-Rich Clade of Marine Fishes (Carangoidei). Proc. R. Soc. B Biol. Sci. 2023, 290, 20230657. [Google Scholar] [CrossRef] [Scilit]
- de Sousa Gomes-Gonçalves, R.; Araújo, F.G. Interdecadal Changes in Ichthyofauna in a Tropical Bay with High Anthropogenic Influences: Functional Stability despite Turnover Predominance. J. Fish Biol. 2024, 104, 536–547. [Google Scholar] [CrossRef] [Scilit] [PubMed]
- Jory, D.E.; Iversen, E.S.; Lewis, R.H. Culture of Fishes of the Genus Trachinotus (Carangidae) in the Western Atlantic: Prospests and Problems. J. World Maric. Soc. 1985, 16, 87–94. [Google Scholar] [CrossRef] [Scilit]
- Wheeler, A. The Nomenclature of the European Fishes of the Subfamily Trachinotinae. Ann. Mag. Nat. Hist. 1962, 5, 529–540. [Google Scholar] [CrossRef] [Scilit]
- Pardee, C.; Wiley, J.; Springer, S. Age, Growth and Maturity for Two Highly Targeted Jack Species: Caranx ignobilis and Caranx melampygus. J. Fish Biol. 2021, 99, 1247–1255. [Google Scholar] [CrossRef] [Scilit] [PubMed]
- Langlois, J.; Guilhaumon, F.; Baletaud, F.; Casajus, N.; De Almeida Braga, C.; Fleuré, V.; Kulbicki, M.; Loiseau, N.; Mouillot, D.; Renoult, J.P.; et al. The Aesthetic Value of Reef Fishes Is Globally Mismatched to Their Conservation Priorities. PLoS Biol. 2022, 20, e3001640. [Google Scholar] [CrossRef] [Scilit] [PubMed]
- Smith-Vaniz, W.F.; Walsh, S.J. Indo-West Pacific Species of Trachinotus with Spots on Their Sides as Adults, with Description of a New Species Endemic to the Marquesas Islands (Teleostei: Carangidae). Zootaxa 2019, 4651, 1–37. [Google Scholar] [CrossRef] [Scilit]
- Crabtree, R.E.; Hood, P.B.; Snodgrass, D. Age, Growth, and Reproduction of Permit (Trachinotus falcatus) in Florida Waters. Fish. Bull. 2002, 100, 26–35. [Google Scholar]
- Rabelo, L.; Sodré, D.; Balcázar, O.D.A.; do Rosário, M.F.; Guimarães-Costa, A.J.; Gomes, G.; Sampaio, I.; Vallinoto, M. DataFishing: An Efficient Python Tool and User-Friendly Web-Form for Mining Mitochondrial and Chloroplast Sequences, Taxonomic, and Biodiversity Data. Ecol. Inform. 2025, 85, 102970. [Google Scholar] [CrossRef] [Scilit]
- Cole, W.M.; Rakocy, J.E.; Shultz, K.A.; Hargreaves, J.A. Effects of Feeding Four Formulated Diets on Growth of Juvenile Palometa, Trachinotus goodei. J. Appl. Aquac. 1997, 7, 51–60. [Google Scholar] [CrossRef] [Scilit]
- Brownscombe, J.W.; Griffin, L.P.; Morley, D.; Acosta, A.; Hunt, J.; Lowerre-Barbieri, S.K.; Crossin, G.T.; Iverson, S.J.; Boucek, R.; Adams, A.J.; et al. Seasonal Occupancy and Connectivity amongst Nearshore Flats and Reef Habitats by Permit Trachinotus falcatus: Considerations for Fisheries Management. J. Fish Biol. 2020, 96, 469–479. [Google Scholar] [CrossRef] [Scilit] [PubMed]
- Johri, S.; Fellows, S.R.; Solanki, J.; Busch, A.; Livingston, I.; Mora, M.F.; Tiwari, A.; Cantu, V.A.; Goodman, A.; Morris, M.M.; et al. Mitochondrial Genome to Aid Species Delimitation and Effective Conservation of the Sharpnose guitarfish (Glaucostegus granulatus). Meta Gene 2020, 24, 100648. [Google Scholar] [CrossRef] [Scilit]
- Xu, C.; Bi, W.; Ma, R.; Li, P.; Liu, F.; Liu, Z. Assembly and Comparative Analysis of the Complete Mitochondrial of Spodiopogon sagittifolius, an Endemic and Protective Species from Yunnan, China. BMC Plant Biol. 2025, 25, 373. [Google Scholar] [CrossRef] [Scilit]
- Wang, L.; Liu, X.; Xu, Y.; Zhang, Z.; Wei, Y.; Hu, Y.; Zheng, C.; Qu, X. Assembly and Comparative Analysis of the First Complete Mitochondrial Genome of a Traditional Chinese Medicine Angelica biserrata (Shan et Yuan) Yuan et Shan. Int. J. Biol. Macromol. 2024, 257, 128571. [Google Scholar] [CrossRef] [Scilit]
- Alvarenga, M.; D’Elia, A.K.P.; Rocha, G.; Arantes, C.A.; Henning, F.; de Vasconcelos, A.T.R.; Solé-Cava, A.M. Mitochondrial Genome Structure and Composition in 70 Fishes: A Key Resource for Fisheries Management in the South Atlantic. BMC Genom. 2024, 25, 215. [Google Scholar] [CrossRef] [Scilit]
- Huang, G.; Cao, J.; Chen, C.; Wang, M.; Liu, Z.; Gao, F.; Yi, M.; Chen, G.; Lu, M. Genome Survey of Misgurnus anguillicaudatus to Identify Genomic Information, Simple Sequence Repeat (SSR) Markers, and Mitochondrial Genome. Mol. Biol. Rep. 2022, 49, 2185–2196. [Google Scholar] [CrossRef] [Scilit] [PubMed]
- Panprommin, D.; Manosri, R. DNA Barcoding as an Approach for Species Traceability and Labeling Accuracy of Fish Fillet Products in Thailand. Food Control 2022, 136, 108895. [Google Scholar] [CrossRef] [Scilit]
- Bernatchez, L.; Ferchaud, A.-L.; Berger, C.S.; Venney, C.J.; Xuereb, A. Genomics for Monitoring and Understanding Species Responses to Global Climate Change. Nat. Rev. Genet. 2024, 25, 165–183. [Google Scholar] [CrossRef] [Scilit] [PubMed]
- Sodré, D.; Rodrigues-Filho, L.F.S.; Souza, R.F.C.; Rêgo, P.S.; Schneider, H.; Sampaio, I.; Vallinoto, M. Inclusion of South American Samples Reveals New Population Structuring of the Blacktip Shark (Carcharhinus limbatus) in the Western Atlantic. Genet Mol. Biol. 2012, 35, 752–760. [Google Scholar] [CrossRef] [Scilit] [PubMed]
- Alencar, S.; Bentes, B.; Sampaio, I.; Vallinoto, M.; da Silva, T.F.; da Silva, A.C.C.; Bessa-Silva, A.; Santos, S. Deep Genetic Divergences and Few Morphological Changes Support the Cryptic Speciation in Larimus breviceps (Sciaenidae, Acanthuriformes) from the Western South Atlantic. Sci. Rep. 2024, 14, 31541. [Google Scholar] [CrossRef] [Scilit]
- Dulvy, N.K.; Pacoureau, N.; Rigby, C.L.; Pollom, R.A.; Jabado, R.W.; Ebert, D.A.; Finucci, B.; Pollock, C.M.; Cheok, J.; Derrick, D.H.; et al. Overfishing Drives over One-Third of All Sharks and Rays toward a Global Extinction Crisis. Curr. Biol. 2021, 31, 4773–4787.e8. [Google Scholar] [CrossRef] [Scilit]
- Halasan, L.C.; Lin, H.-C. Diagnostic Applicability of Mitogenomics in Uncovering Intraspecific Carangid Diversifications: Insights into Phylogeny, Divergence Time, and Characterization of Two Cryptic Selaroides leptolepis Mitogenomes. Org. Divers. Evol. 2024, 24, 417–434. [Google Scholar] [CrossRef] [Scilit]
- Muhala, V.; Guimarães-Costa, A.; Macate, I.E.; Rabelo, L.P.; Bessa-Silva, A.R.; Watanabe, L.; dos Santos, G.D.; Sambora, L.; Vallinoto, M.; Sampaio, I. DNA Barcoding for the Assessment of Marine and Coastal Fish Diversity from the Coast of Mozambique. PLoS ONE 2024, 19, e0293345. [Google Scholar] [CrossRef] [Scilit]
- Artamonova, V.S.; Kolmakova, O.V.; Kirillova, E.A.; Makhrov, A.A. Phylogeny of Salmonoid Fishes (Salmonoidei) Based on MtDNA COI Gene Sequences (Barcoding). Contemp. Probl. Ecol. 2018, 11, 271–285. [Google Scholar] [CrossRef] [Scilit]
- de Sousa, R.P.C.; Bessa-Brito, C.D.; Guimarães-Costa, A.; Evangelista-Gomes, G.; Sampaio, I.; de Oliveira, E.H.C.; Vallinoto, M. Exploring the Diversity of Elopidae (Teleostei; Elopiformes) Using DNA Barcoding Analysis. Diversity 2022, 14, 1008. [Google Scholar] [CrossRef] [Scilit]
- Buhay, J.E. “COI-like” Sequences Are Becoming Problematic in Molecular Systematic and DNA Barcoding Studies. J. Crustac. Biol. 2009, 29, 96–110. [Google Scholar] [CrossRef] [Scilit]
- Bingpeng, X.; Heshan, L.; Zhilan, Z.; Chunguang, W.; Yanguo, W.; Jianjun, W. DNA Barcoding for Identification of Fish Species in the Taiwan Strait. PLoS ONE 2018, 13, e0198109. [Google Scholar] [CrossRef] [Scilit]
- Nachtigall, P.G.; Grazziotin, F.G.; Junqueira-De-Azevedo, I.L.M. MITGARD: An Automated Pipeline for Mitochondrial Genome Assembly in Eukaryotic Species Using RNA-Seq Data. Brief. Bioinform. 2021, 22, bbaa429. [Google Scholar] [CrossRef] [Scilit] [PubMed]
- Chen, S.; Zhou, Y.; Chen, Y.; Gu, J. Fastp: An Ultra-Fast All-in-One FASTQ Preprocessor. Bioinformatics 2018, 34, i884–i890. [Google Scholar] [CrossRef] [Scilit]
- Chen, S. Ultrafast One-pass FASTQ Data Preprocessing, Quality Control, and Deduplication Using Fastp. iMeta 2023, 2, e107. [Google Scholar] [CrossRef] [Scilit] [PubMed]
- Dierckxsens, N.; Mardulyn, P.; Smits, G. NOVOPlasty: De Novo Assembly of Organelle Genomes from Whole Genome Data. Nucleic Acids Res. 2016, 45, e18. [Google Scholar] [CrossRef] [Scilit]
- Rabelo, L.P.; Sodré, D.; de Sousa, R.P.C.; Watanabe, L.; Gomes, G.; Sampaio, I.; Vallinoto, M. SynGenes: A Python Class for Standardizing Nomenclatures of Mitochondrial and Chloroplast Genes and a Web Form for Enhancing Searches for Evolutionary Analyses. BMC Bioinform. 2024, 25, 160. [Google Scholar] [CrossRef] [Scilit]
- Langmead, B.; Salzberg, S.L. Fast Gapped-Read Alignment with Bowtie 2. Nat. Methods 2012, 9, 357–359. [Google Scholar] [CrossRef] [Scilit]
- Xiao, S.; Nguyen, D.T.; Wu, B.; Hao, W. Genetic Drift and Indel Mutation in the Evolution of Yeast Mitochondrial Genome Size. Genome Biol. Evol. 2017, 9, 3088–3099. [Google Scholar] [CrossRef] [Scilit]
- Danecek, P.; Bonfield, J.K.; Liddle, J.; Marshall, J.; Ohan, V.; Pollard, M.O.; Whitwham, A.; Keane, T.; McCarthy, S.A.; Davies, R.M.; et al. Twelve Years of SAMtools and BCFtools. Gigascience 2021, 10, giab008. [Google Scholar] [CrossRef] [Scilit]
- Okonechnikov, K.; Conesa, A.; García-Alcalde, F. Qualimap 2: Advanced Multi-Sample Quality Control for High-Throughput Sequencing Data. Bioinformatics 2016, 32, 292–294. [Google Scholar] [CrossRef] [Scilit] [PubMed]
- Zhu, T.; Sato, Y.; Sado, T.; Miya, M.; Iwasaki, W. MitoFish, MitoAnnotator, and MiFish Pipeline: Updates in 10 Years. Genome Biol. Evol. 2023, 40, msad035. [Google Scholar] [CrossRef] [Scilit]
- Bernt, M.; Donath, A.; Jühling, F.; Externbrink, F.; Florentz, C.; Fritzsch, G.; Pütz, J.; Middendorf, M.; Stadler, P.F. MITOS: Improved de Novo Metazoan Mitochondrial Genome Annotation. Mol. Phylogenetics Evol. 2013, 69, 313–319. [Google Scholar] [CrossRef] [Scilit]
- Lowe, T.M.; Chan, P.P. TRNAscan-SE On-Line: Integrating Search and Context for Analysis of Transfer RNA Genes. Nucleic Acids Res. 2016, 44, W54–W57. [Google Scholar] [CrossRef] [Scilit]
- Kerpedjiev, P.; Hammer, S.; Hofacker, I.L. Forna (Force-Directed RNA): Simple and Effective Online RNA Secondary Structure Diagrams. Bioinformatics 2015, 31, 3377–3379. [Google Scholar] [CrossRef] [Scilit]
- Kumar, S.; Stecher, G.; Li, M.; Knyaz, C.; Tamura, K. MEGA X: Molecular Evolutionary Genetics Analysis across Computing Platforms. Mol. Biol. Evol. 2018, 35, 1547–1549. [Google Scholar] [CrossRef] [Scilit]
- Zhang, D.; Gao, F.; Jakovlić, I.; Zou, H.; Zhang, J.; Li, W.X.; Wang, G.T. PhyloSuite: An Integrated and Scalable Desktop Platform for Streamlined Molecular Sequence Data Management and Evolutionary Phylogenetics Studies. Mol. Biol. Resour. 2020, 20, 348–355. [Google Scholar] [CrossRef] [Scilit] [PubMed]
- Grant, J.R.; Enns, E.; Marinier, E.; Mandal, A.; Herman, E.K.; Chen, C.; Graham, M.; Van Domselaar, G.; Stothard, P. Proksee: In-Depth Characterization and Visualization of Bacterial Genomes. Nucleic Acids Resour. 2023, 51, W484–W492. [Google Scholar] [CrossRef] [Scilit] [PubMed]
- Katoh, K.; Standley, D.M. MAFFT Multiple Sequence Alignment Software Version 7: Improvements in Performance and Usability. Mol. Biol. Evol. 2013, 30, 772–780. [Google Scholar] [CrossRef] [Scilit]
- Capella-Gutiérrez, S.; Silla-Martínez, J.M.; Gabaldón, T. TrimAl: A Tool for Automated Alignment Trimming in Large-Scale Phylogenetic Analyses. Bioinformatics 2009, 25, 1972–1973. [Google Scholar] [CrossRef] [Scilit]
- Castresana, J. Selection of Conserved Blocks from Multiple Alignments for Their Use in Phylogenetic Analysis. Mol. Biol. Evol. 2000, 17, 540–552. [Google Scholar] [CrossRef] [Scilit] [PubMed]
- Tan, G.; Muffato, M.; Ledergerber, C.; Herrero, J.; Goldman, N.; Gil, M.; Dessimoz, C. Current Methods for Automated Filtering of Multiple Sequence Alignments Frequently Worsen Single-Gene Phylogenetic Inference. Syst. Biol. 2015, 64, 778–791. [Google Scholar] [CrossRef] [Scilit]
- Sun, P.; Yang, Y.; Yuan, M.; Tang, Q. CamITree: A Streamlined Software for Phylogenetic Analysis of Viral and Mitochondrial Genomes. BMC Bioinform. 2025, 26, 53. [Google Scholar] [CrossRef] [Scilit]
- Minh, B.Q.; Schmidt, H.A.; Chernomor, O.; Schrempf, D.; Woodhams, M.D.; von Haeseler, A.; Lanfear, R. IQ-TREE 2: New Models and Efficient Methods for Phylogenetic Inference in the Genomic Era. Mol. Biol. Evol. 2020, 37, 1530–1534. [Google Scholar] [CrossRef] [Scilit] [PubMed]
- Ronquist, F.; Teslenko, M.; van der Mark, P.; Ayres, D.L.; Darling, A.; Höhna, S.; Larget, B.; Liu, L.; Suchard, M.A.; Huelsenbeck, J.P. MrBayes 3.2: Efficient Bayesian Phylogenetic Inference and Model Choice Across a Large Model Space. Syst. Biol. 2012, 61, 539–542. [Google Scholar] [CrossRef] [Scilit] [PubMed]
- Benson, G. Tandem Repeats Finder: A Program to Analyze DNA Sequences. Nucleic Acids Resour. 1999, 27, 573–580. [Google Scholar] [CrossRef] [Scilit] [PubMed]
- Muhala, V.; Guimarães-Costa, A.; Bessa-Silva, A.R.; Rabelo, L.P.; Carneiro, J.; Macate, I.E.; Watanabe, L.; Balcázar, O.D.; Gomes, G.E.; Vallinoto, M.; et al. Comparative Mitochondrial Genome Brings Insights to Slight Variation in Gene Proportion and Large Intergenic Spacer and Phylogenetic Relationship of Mudskipper Species. Sci. Rep. 2024, 14, 3358. [Google Scholar] [CrossRef] [Scilit]
- Tian, Y.; Smith, D.R. Recovering Complete Mitochondrial Genome Sequences from RNA-Seq: A Case Study of Polytomella Non-Photosynthetic Green Algae. Mol. Phylogenetics Evol. 2016, 98, 57–62. [Google Scholar] [CrossRef] [Scilit]
- Song, N.; An, S.; Yin, X.; Cai, W.; Li, H. Application of RNA-Seq for Mitogenome Reconstruction, and Reconsideration of Long-Branch Artifacts in Hemiptera Phylogeny. Sci. Rep. 2016, 6, 33465. [Google Scholar] [CrossRef] [Scilit]
- Li, Z.; Li, M.; Xu, S.; Liu, L.; Chen, Z.; Zou, K. Complete Mitogenomes of Three Carangidae (Perciformes) Fishes: Genome Description and Phylogenetic Considerations. Int. J. Mol. Sci. 2020, 21, 4685. [Google Scholar] [CrossRef] [Scilit]
- Li, B.; Wang, H.; Yang, L.; Liu, S.; Zhuang, Z. Complete Mitochondrial Genome of Pseudocaranx dentex (Carangidae, Perciformes) Provides Insight into Phylogenetic and Evolutionary Relationship among Carangidae Family. Genes 2021, 12, 1234. [Google Scholar] [CrossRef] [Scilit]
- Zhao, F.; Xian, L.; Zhu, K.; Zhang, N.; Guo, H.; Liu, B.; Yang, J.; Liu, B.; Zhang, D. Mitochondrial genome of eight Carangidae and phylogenetic analysis in the family. PLoS ONE 2025, 7, e0326619. [Google Scholar] [CrossRef] [Scilit]
- Li, A.; An, C.; Wang, H.; Che, S.; Liu, S.; Zhuang, Z. DNA Barcode and Correct Scientific Name of Golden Pompano, an Important Marine Aquaculture Fish Species in China. Fishes 2025, 10, 129. [Google Scholar] [CrossRef] [Scilit]
- Harrington, R.C.; Faircloth, B.C.; Eytan, R.I.; Smith, W.L.; Near, T.J.; Alfaro, M.E.; Friedman, M. Phylogenomic analysis of carangimorph fishes reveals flatfish asymmetry arose in a blink of the evolutionary eye. BMC Evol. Biol. 2016, 16, 224. [Google Scholar] [CrossRef] [Scilit] [PubMed]

Disclaimer/Publisher’s Note: The statements, opinions and data contained in all publications are solely those of the individual author(s) and contributor(s) and not of MDPI and/or the editor(s). MDPI and/or the editor(s) disclaim responsibility for any injury to people or property resulting from any ideas, methods, instructions or products referred to in the content. |
© 2026 by the authors. Licensee MDPI, Basel, Switzerland. This article is an open access article distributed under the terms and conditions of the Creative Commons Attribution (CC BY) license.