


Abstract
Eukaryotic algae are key contributors to biodiversity and ecosystem functioning in aquatic environments. However, understanding their global diversity patterns and community assembly mechanisms remains limited by the lack of high-resolution, highly specific analytical methods. Here, we present the first eukaryotic algae-specific classification database, EukAlgae-T (Eukaryotic Algae Taxonomic database), constructed based on single-copy orthologous genes. The database integrates 50,581 non-redundant marker genes from 479 high-quality genomes and was applied to analyze 939 marine metagenomic samples from the Tara Oceans project. Our results reveal that the genomically represented fraction of the global algal community is dominated by a widely distributed core taxonomic group, comprising 125 of the 230 detected species. Redundancy analysis indicated that community structure is primarily regulated by latitude and iron concentration on a global scale. In contrast, Mantel tests revealed strong regional heterogeneity, with temperature, salinity, and iron concentration acting as universal local drivers, albeit with varying effect sizes and combinations across ocean basins. Co-occurrence network analysis further demonstrated predominantly cooperative interactions among taxa, forming a highly modular and stable network structure, and identified key hub taxa characterized by low abundance but high connectivity. Together, this study provides a dedicated framework for eukaryotic algae metagenomic analysis and demonstrates that algal community assembly is driven by multi-scale environmental filtering: broadly constrained by climate zones and iron limitation at the global scale and regionally reshaped by local oceanographic processes (e.g., thermohaline structure). Cooperative coexistence and niche differentiation among taxa jointly underpin the maintenance of global algal diversity.
1. Introduction
Eukaryotic algae are central primary producers in aquatic ecosystems, driving the biogeochemical cycling of key elements, such as carbon, nitrogen, and silicon, and underpinning marine biodiversity, ecosystem stability, and functional resilience [1,2]. Their community structure is highly sensitive and rapidly responsive to environmental changes, making them reliable bioindicators of aquatic ecosystem health [3,4]. In the context of accelerating global climate change and increasing anthropogenic pressures, the marine environments are undergoing profound transformations that impose unprecedented selective forces on the composition and functioning of phytoplankton communities [5]. Despite their ecological importance, comprehensive understanding of the global diversity patterns, biogeographic distributions, and environmental drivers of eukaryotic algal communities remains limited. This knowledge gap directly constrains our ability to assess and predict the responses of marine ecosystem functions to environmental changes. Therefore, developing novel methodologies capable of accurately and comprehensively resolving complex algal communities has become an urgent challenge in marine biodiversity research.
Research on eukaryotic algae has lagged behind that of prokaryotic microorganisms, primarily due to difficulties in cultivation, low abundance of certain groups, complex genetic backgrounds, and the absence of comprehensive and highly specific genomic reference databases [6]. Consequently, studies on eukaryotic algal diversity have heavily relied on morphology-based microscopic observation [7], fluorescent probes [8], and remote sensing techniques [9], all of which have limitations in resolution, throughput, or quantitative accuracy. More recently, high-throughput sequencing-based metagenomics has opened new avenues for comprehensively profiling algal communities. Nevertheless, the taxonomic identification of eukaryotic algae still predominantly depends on amplicon sequencing techniques targeting markers such as the 18S rRNA gene [10,11,12]. Although this gene is well suited for broad phylogenetic inference [13], its high level of conservation restricts its ability to resolve closely related taxa, particularly at the genus and species levels [14,15]. Furthermore, amplicon-based methods targeting the ITS region or 18S rRNA are prone to PCR amplification biases, which can distort estimates of species abundance and relative contribution [16], thereby potentially affecting accurate inferences about diversity patterns and their ecological drivers.
Classification approaches based on single-copy orthologous genes (SOGs) provide a promising alternative for overcoming these limitations. Unlike PCR-based methods, this strategy enables species identification the direct detection of conserved, species-specific marker genes from metagenomic data. SOG-based approaches have demonstrated high resolution and robustness in prokaryotic and fungal studies, surpassing the taxonomic discriminatory power of the 16S rRNA gene [17]. Although several tools and databases have been developed for eukaryotic identification, including EukDetect and CCMetagen [18,19,20], a dedicated analysis pipeline and reference database specifically tailored to eukaryotic algae—rigorously validated for contamination control and incorporating the latest high-quality genomes—remain lacking. As a result, existing tools may provide limited taxonomic coverage, reduced specificity, or insufficient resolution when applied to large-scale surveys of marine algal diversity.
To address this gap, this study aims to: (1) construct and rigorously validate a eukaryotic algae-specific taxonomic database, EukAlgae-T, based on SOGs; (2) utilize this database to systematically characterize, for the first time on a global scale, the biogeographic distribution patterns of marine eukaryotic algal communities and identify core and rare taxa; (3) elucidate the multi-scale (global and regional) environmental drivers of community structure; and (4) uncover ecological interactions among dominant algal taxa through co-occurrence network analysis. This study provides an innovative strategy and delivers new empirical evidence and theoretical insights into the mechanisms maintaining diversity and the principles governing community assembly.
2. Materials and Methods
2.1. Data Collection and Preprocessing
Following the latest taxonomic framework [21], a total of 688 publicly available strain-level genome and draft genome datasets for eukaryotic algae were downloaded and integrated from NCBI (Bethesda, MD, USA) (data current as of 9 December 2024). Fourteen datasets with overly short genomes or suspected contamination were removed. Genomes with more than 5000 contigs or an N50 value below 1 kbp were excluded, resulting in 479 high-quality genome and draft genome assemblies.
2.2. SOGs Identification and Database Construction
BUSCO v5.6.1 (https://busco.ezlab.org/, 2 February 2026; Swiss Institute of Bioinformatics, Geneva, Switzerland) with the eukaryotic universal dataset from OrthoDB v10.1 was used to identify SOGs from the 479 high-quality eukaryotic algal genomes [22]. BUSCO utilizes HMMs for 255 eukaryotic SOGs and was run with the AUGUSTUS v3.5.0 gene predictor using default parameters. Genomes with fewer than 30 identified SOGs were discarded. From the remaining 449 genome files, 68,772 SOGs were identified. To construct a non-redundant database by removing highly similar sequences, CD-HIT (https://github.com/weizhongli/cdhit, accessed on 14 December 2024; developed at the University of Michigan, Ann Arbor, MI, USA) was used to cluster these genes at a 99% identity threshold, ultimately yielding the non-redundant eukaryotic algal marker gene database, EukAlgae-T.
2.3. Validation of the EukAlgae-T Database and Pipeline
Bacterial sequences are ubiquitous in marine metagenomes, typically constituting between 50% and 90% of the total sequencing data [23]. Therefore, it is essential to verify the absence of bacterial sequence contamination in the eukaryotic database. To ensure the absence of bacterial contamination [19] in the database and the specificity for detecting eukaryotic algae, we performed a validation following the protocol of Xie et al. [24]. First, we used bowtie2 (http://bowtie-bio.sourceforge.net/bowtie2/index.shtml, accessed on 12 January 2025; USA) to map simulated sequencing reads from 50,000 eukaryotic algal SOGs to a prokaryotic genome catalog from the NCBI RefSeq database (Bethesda, MD, USA), which contains 2.88 million non-redundant prokaryotic genomes. This step ensured the database was free from prokaryotic contamination. Read simulation was performed using ART (https://www.niehs.nih.gov/research/resources/software/biostatistics/art/, accessed on 12 January 2025; National Institute of Environmental Health Sciences, NC, USA), a suite of simulation tools for generating synthetic sequencing reads [25]. Second, to validate the specificity of EukAlgae-T and ensure no cross-kingdom contamination, we mapped simulated Illumina sequencing reads from all bacterial genomes (54 million reads, 1× coverage, simulating 279 GB from 138 GB) to the EukAlgae-T database, creating a simulated bacterial community. Third, another simulated mixed community was generated using eukaryotic algal and bacterial genome sequences from NCBI (https://www.ncbi.nlm.nih.gov/) and subsequently mapped to the constructed database for validation. To approximate realistic marine environmental conditions, the ratio of simulated bacterial reads to eukaryotic algal reads was set to 10,000:1 [26].
To validate the specificity of SOG markers for prevalent macroalgae (Nereocystis luetkeana and Macrocystis pyrifera), we performed cross-mapping against a custom database of 20 non-target brown algal genomes using Bowtie2 under stringent and relaxed parameters, complemented by BLAST analysis (https://blast.ncbi.nlm.nih.gov/Blast.cgi, accessed on 28 January 2026).
2.4. Marine Metagenomic Data Collection
The Tara Oceans project systematically collected shotgun metagenomic sequencing data for microbial communities through a global oceanographic expedition. These data were downloaded from the European Nucleotide (ENA; European Bioinformatics Institute (EMBL-EBI), Hinxton, UK) Archive before 26 October 2025, comprising 1256 high-quality metagenomic samples from 939 projects [27]. Sampling covered a wide range of marine environments globally, including surface and deep seawater layers, ensuring broad representation of marine microbial diversity and ecological function. The expedition team employed standardized sampling protocols to ensure data consistency and comparability. Specific sampling sites were distributed across various ocean basins worldwide, spanning from equatorial to polar regions, and included both coastal and open ocean environments.
2.5. Data Normalization and Processing
To eliminate the influence of sequencing depth and genome length differences on abundance estimation, species abundance was normalized using the “reads per billion per kilobase” method and used as a proxy for biomass. Firstly, metagenomic reads were mapped to the algal reference database, and species annotation was accomplished via a mapping table. Abundance was then calculated using the formula:
where R is the number of reads for the species, T is the total reads in the sample, and L is the total length of the species’ reference sequences. Finally, species-level abundances were aggregated to the class level based on the taxonomic database. This pipeline generated species- and class-level abundance matrices for 1202 samples for subsequent ecological pattern analysis.
A = (R × 109 × 1000)/(T × L),
2.6. Metagenomic Data Analysis
After quality control and decontamination using KneadData (https://huttenhower.sph.harvard.edu/kneaddata/, accessed on 18 October 2025; Huttenhower Lab, Harvard T.H. Chan School of Public Health, Boston, MA, USA), sequence alignment was performed using Bowtie2 v2.2.5. Data from 1256 metagenomic files were mapped to the EukAlgae-T database for taxonomic annotation of eukaryotic algae. Reads mapping to a reference sequence with a quality score exceeding 30 [19,28,29] were retained, selecting the highest-scoring mapped read (using Samtools v1.20; http://samtools.sourceforge.net/, accessed on 5 November 2025; open-source project maintained by Genome Research Ltd., Hinxton, UK). Custom scripts were used to analyze eukaryotic algal species taxonomic abundance.
2.7. Statistical Analysis Methods
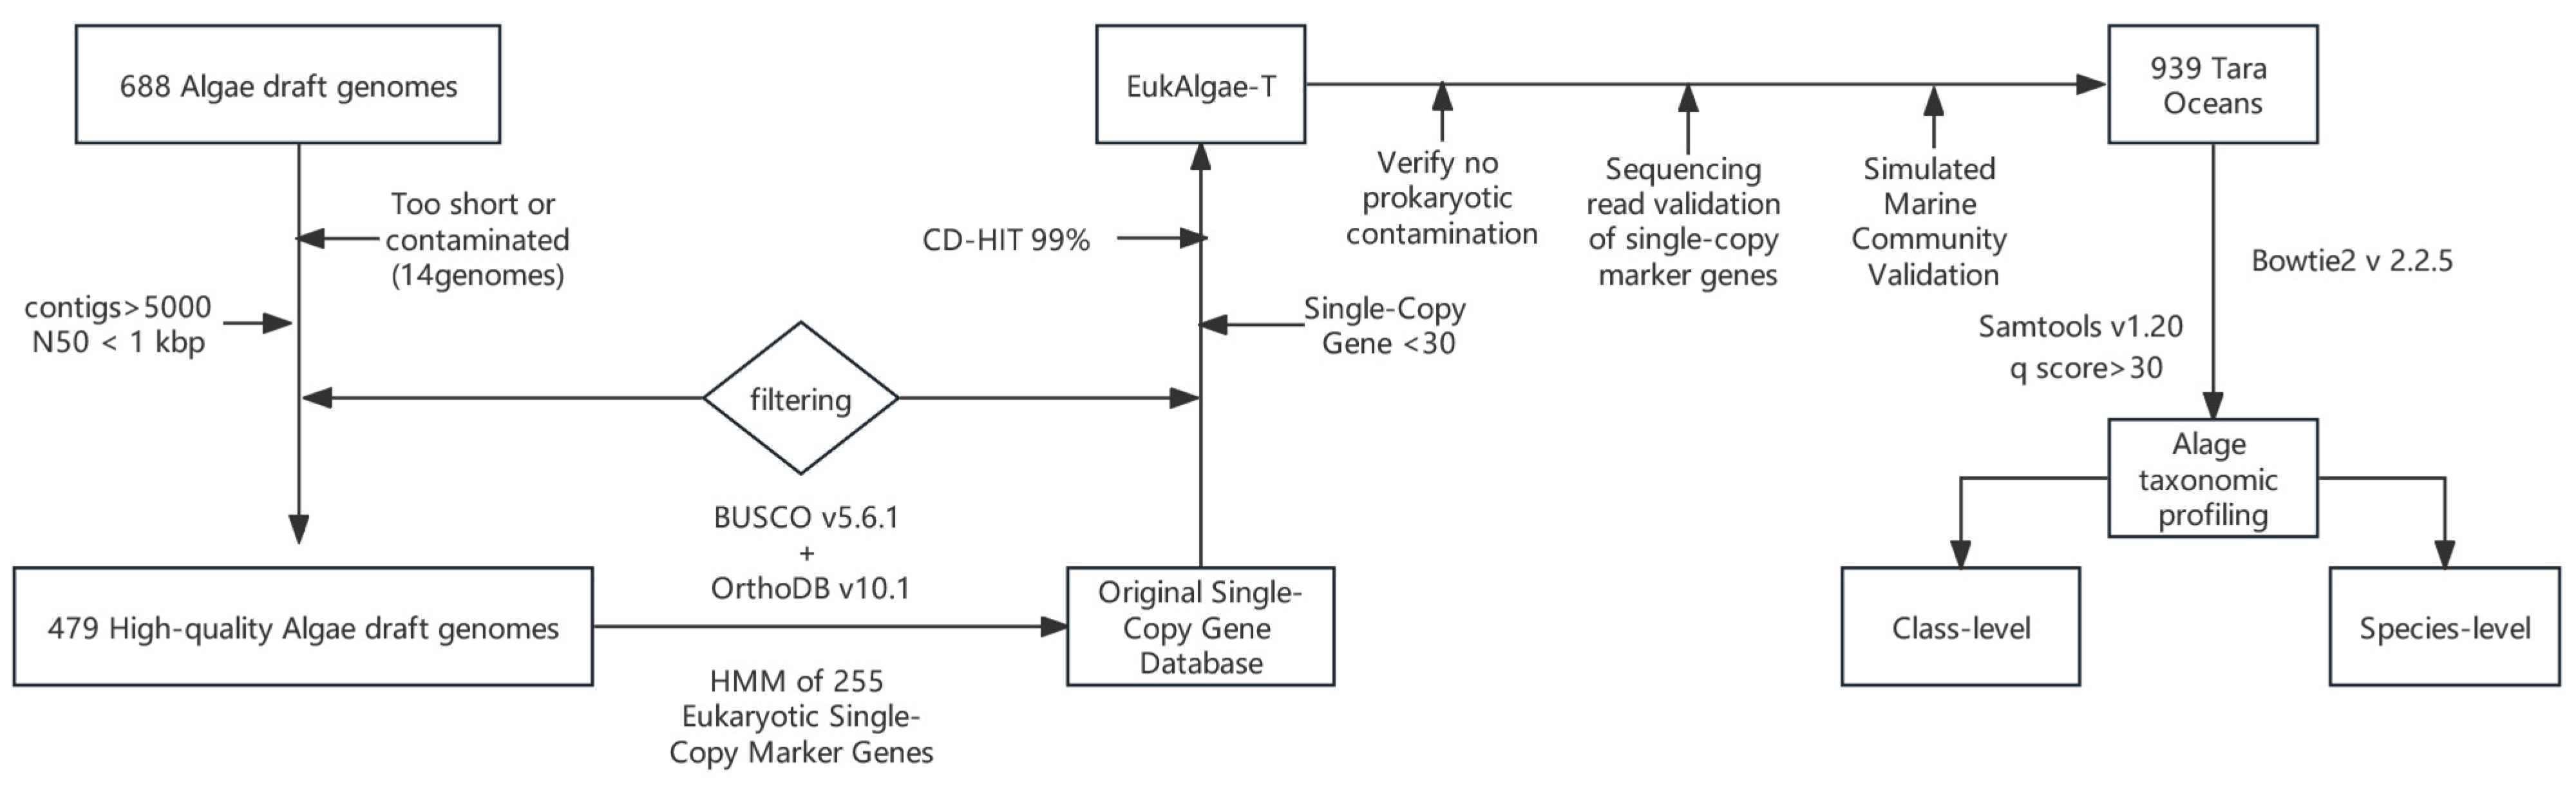
Eukaryotic algal species detected in more than 50% of the samples were defined as the core species [30]. Sampling sites were divided into seven traditional ocean basins based on geographic coordinates. This established practice for large-scale marine biogeography research [31] has been applied in previous global ocean microbiome surveys [32]. All analyses were performed in the R 4.1.2. The vegan package was used to calculate α-diversity (species richness, Shannon index) and β-diversity (based on Bray–Curtis distance). Redundancy Analysis was employed to explore the influence of environmental factors on communities, with variable collinearity assessed via Variance Inflation Factors. Mantel tests evaluated correlations between environmental factors and community structure. Co-occurrence networks were constructed based on Spearman correlation coefficients (r > 0.6, p < 0.01). All p-values were corrected using the False Discovery Rate (FDR), with an adjusted FDR < 0.05 considered statistically significant. The overall workflow of this study is depicted in Figure 1.
Figure 1.
Overview of the EukAlgae-T analysis workflow applied to 939 Tara Oceans metagenomic samples.
3. Results
3.1. Construction and Specificity Validation of the EukAlgae-T Database
EukAlgae-T database comprises 50,581 SOGs from six major phyla, including Chlorophyta and Rhodophyta, spanning 26 classes, 65 orders, 111 families, 188 genera, and 388 species (Supplementary Table S1). Species from the phylum Chlorophyta were overwhelmingly dominant, accounting for 60.1% of the total.
To assess potential bacterial contamination in the database, we simulated sequencing reads from the EukAlgae-T SOGs and mapped them to the RefSeq bacterial simulated read dataset, resulting in a mismatch rate below 0.01%. Conversely, mapping the simulated bacterial community reads to EukAlgae-T yielded a mapping rate of less than 0.01%. To further approximate a realistic marine environment, no bacterial read mapped to EukAlgae-T, corresponding a specificity of 0.9999. Together, these results demonstrate that the eukaryotic algal taxonomic database exhibits high specificity and effective resistance to bacterial contamination.
Validation of 193 SOG markers for Nereocystis luetkeana and Macrocystis pyrifera showed zero cross-mapping under stringent conditions (0/2,564,696 sequences; 95% CI upper bound: 0.000117%). Under relaxed conditions, cross-mapping remained negligible, and BLAST confirmed high specificity with only two weak matches at relaxed stringency.
3.2. Global Patterns of Algal Community Composition and Core Species
3.2.1. Core Species and Diversity Distribution Patterns
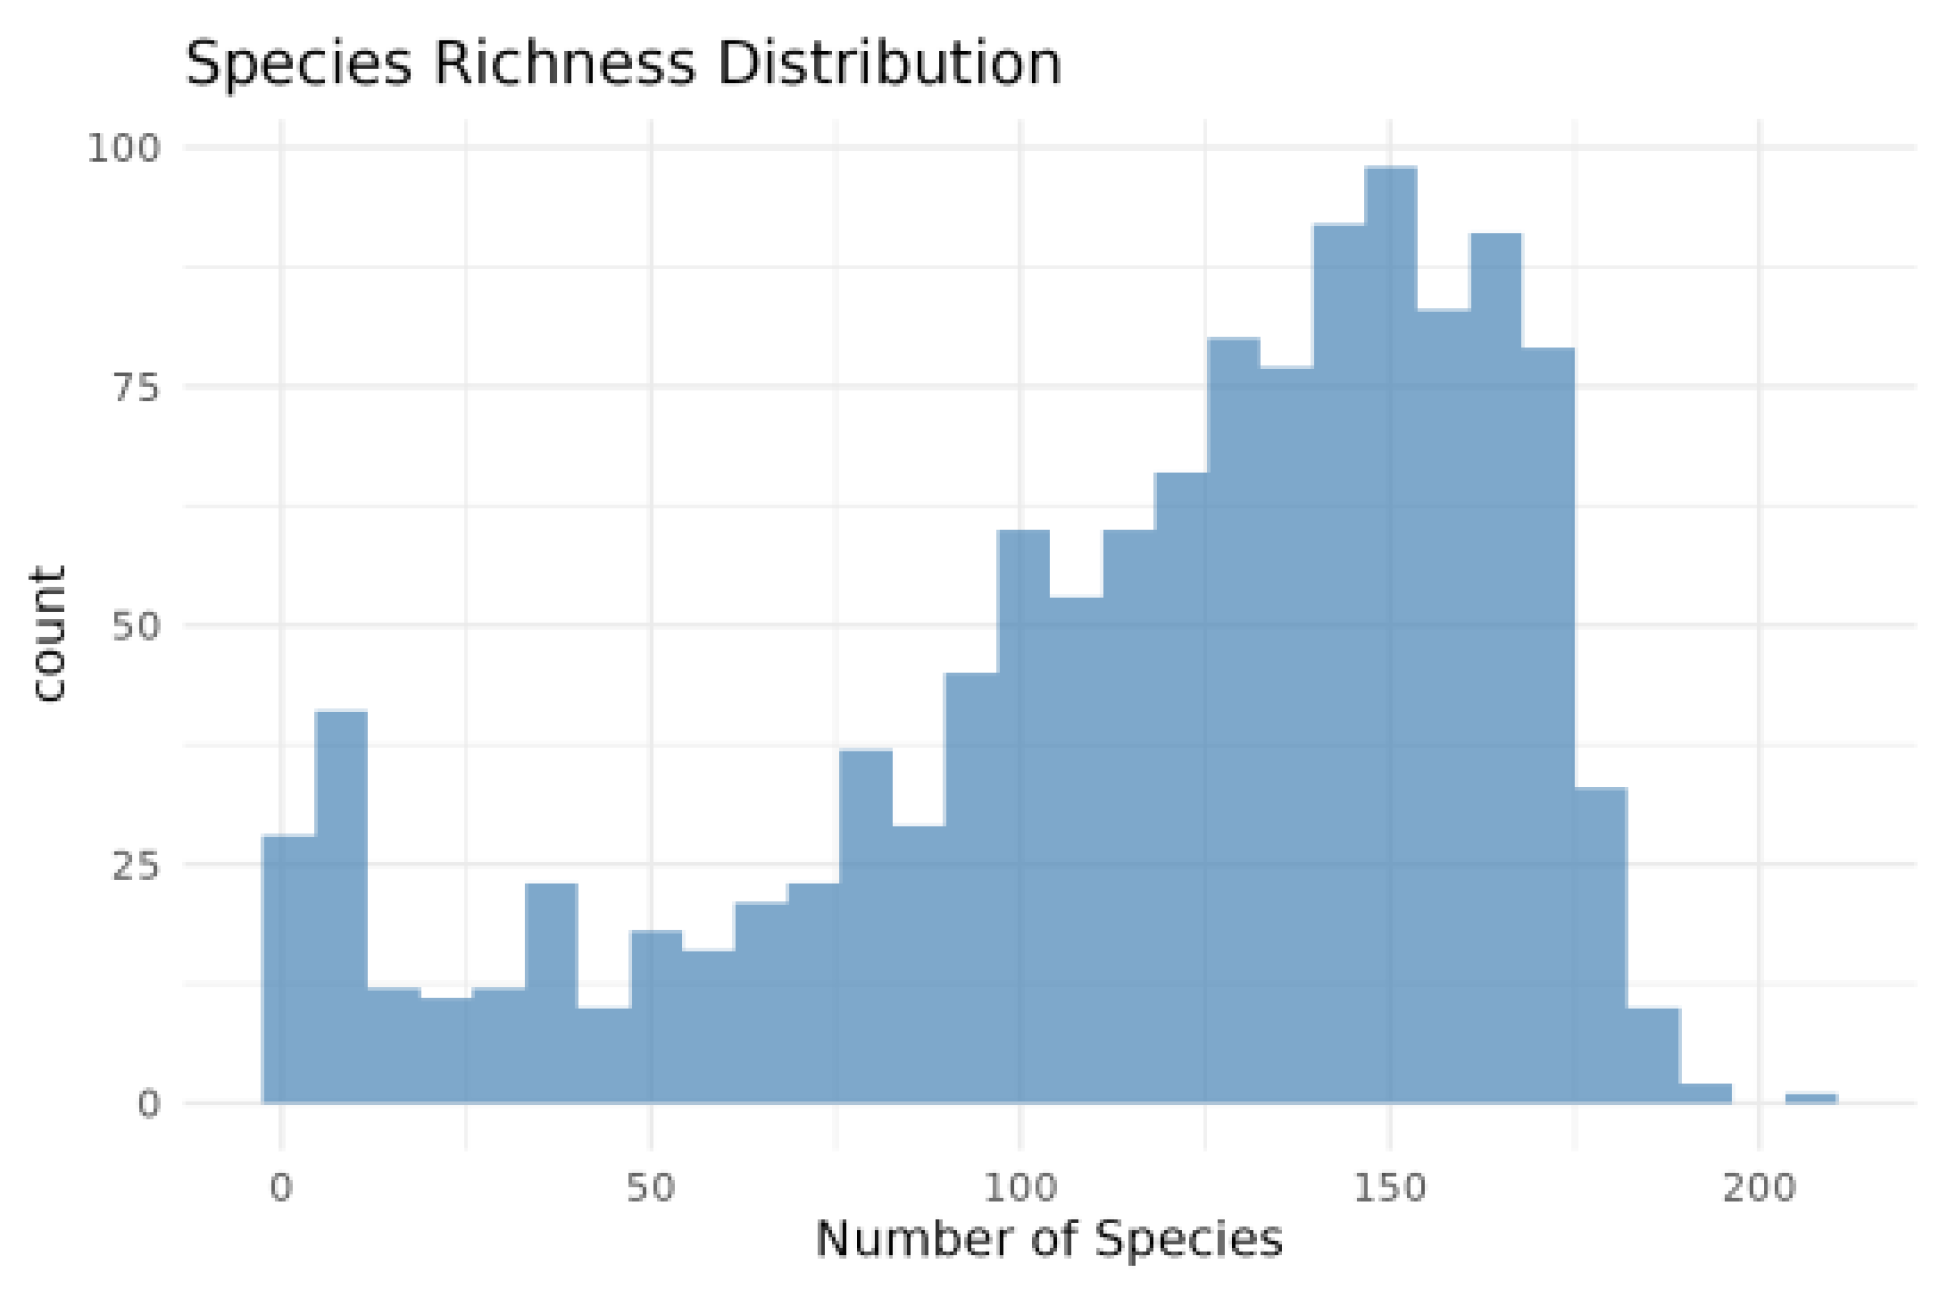
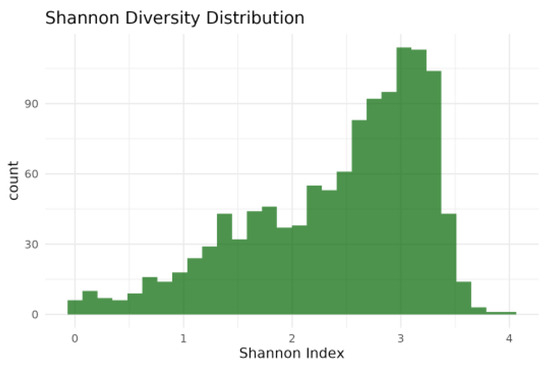
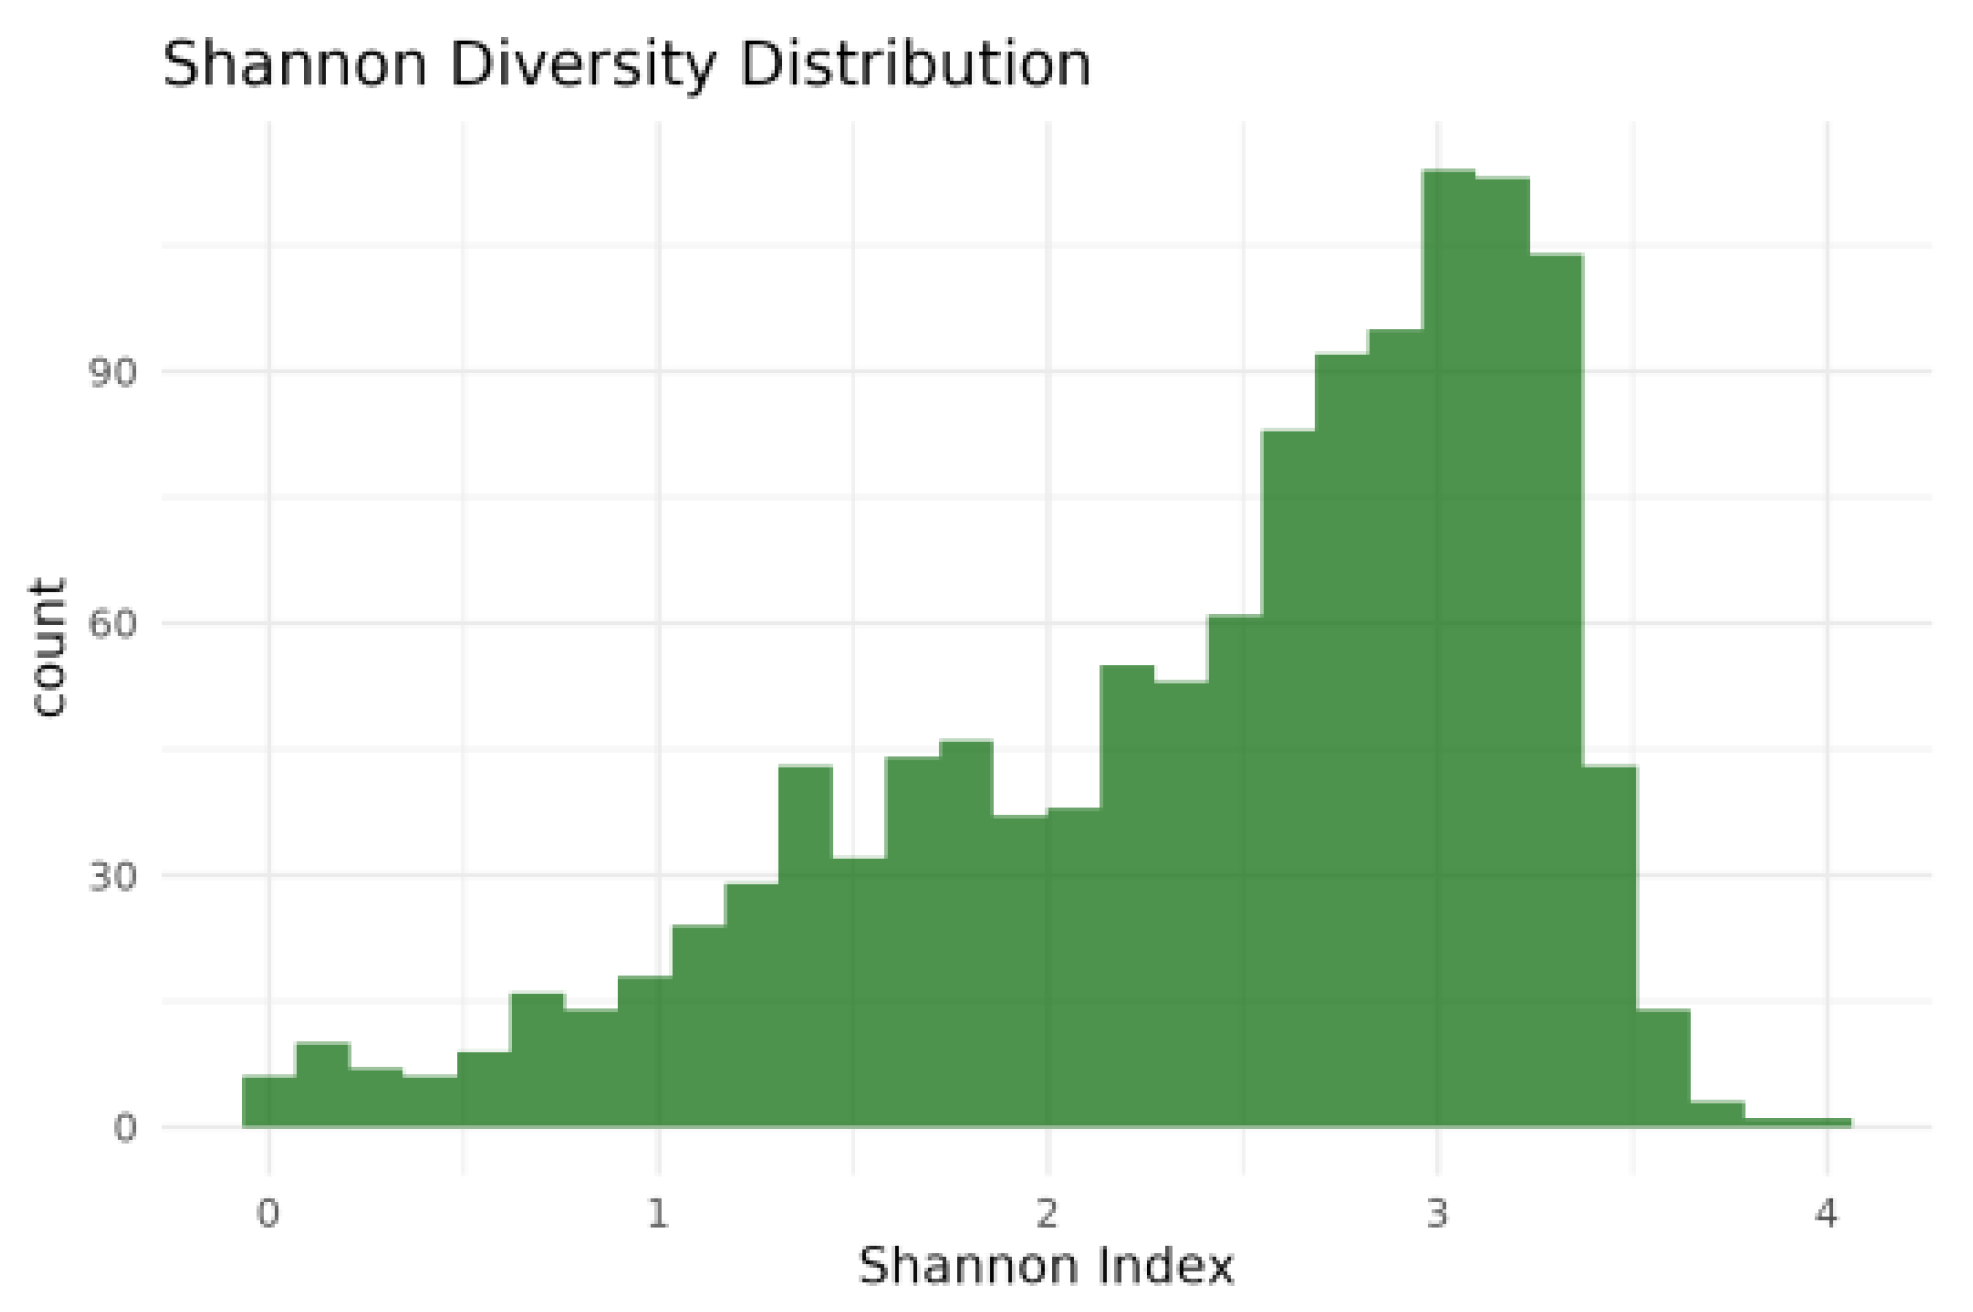
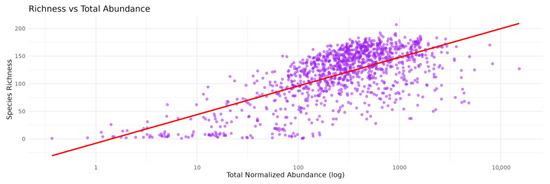
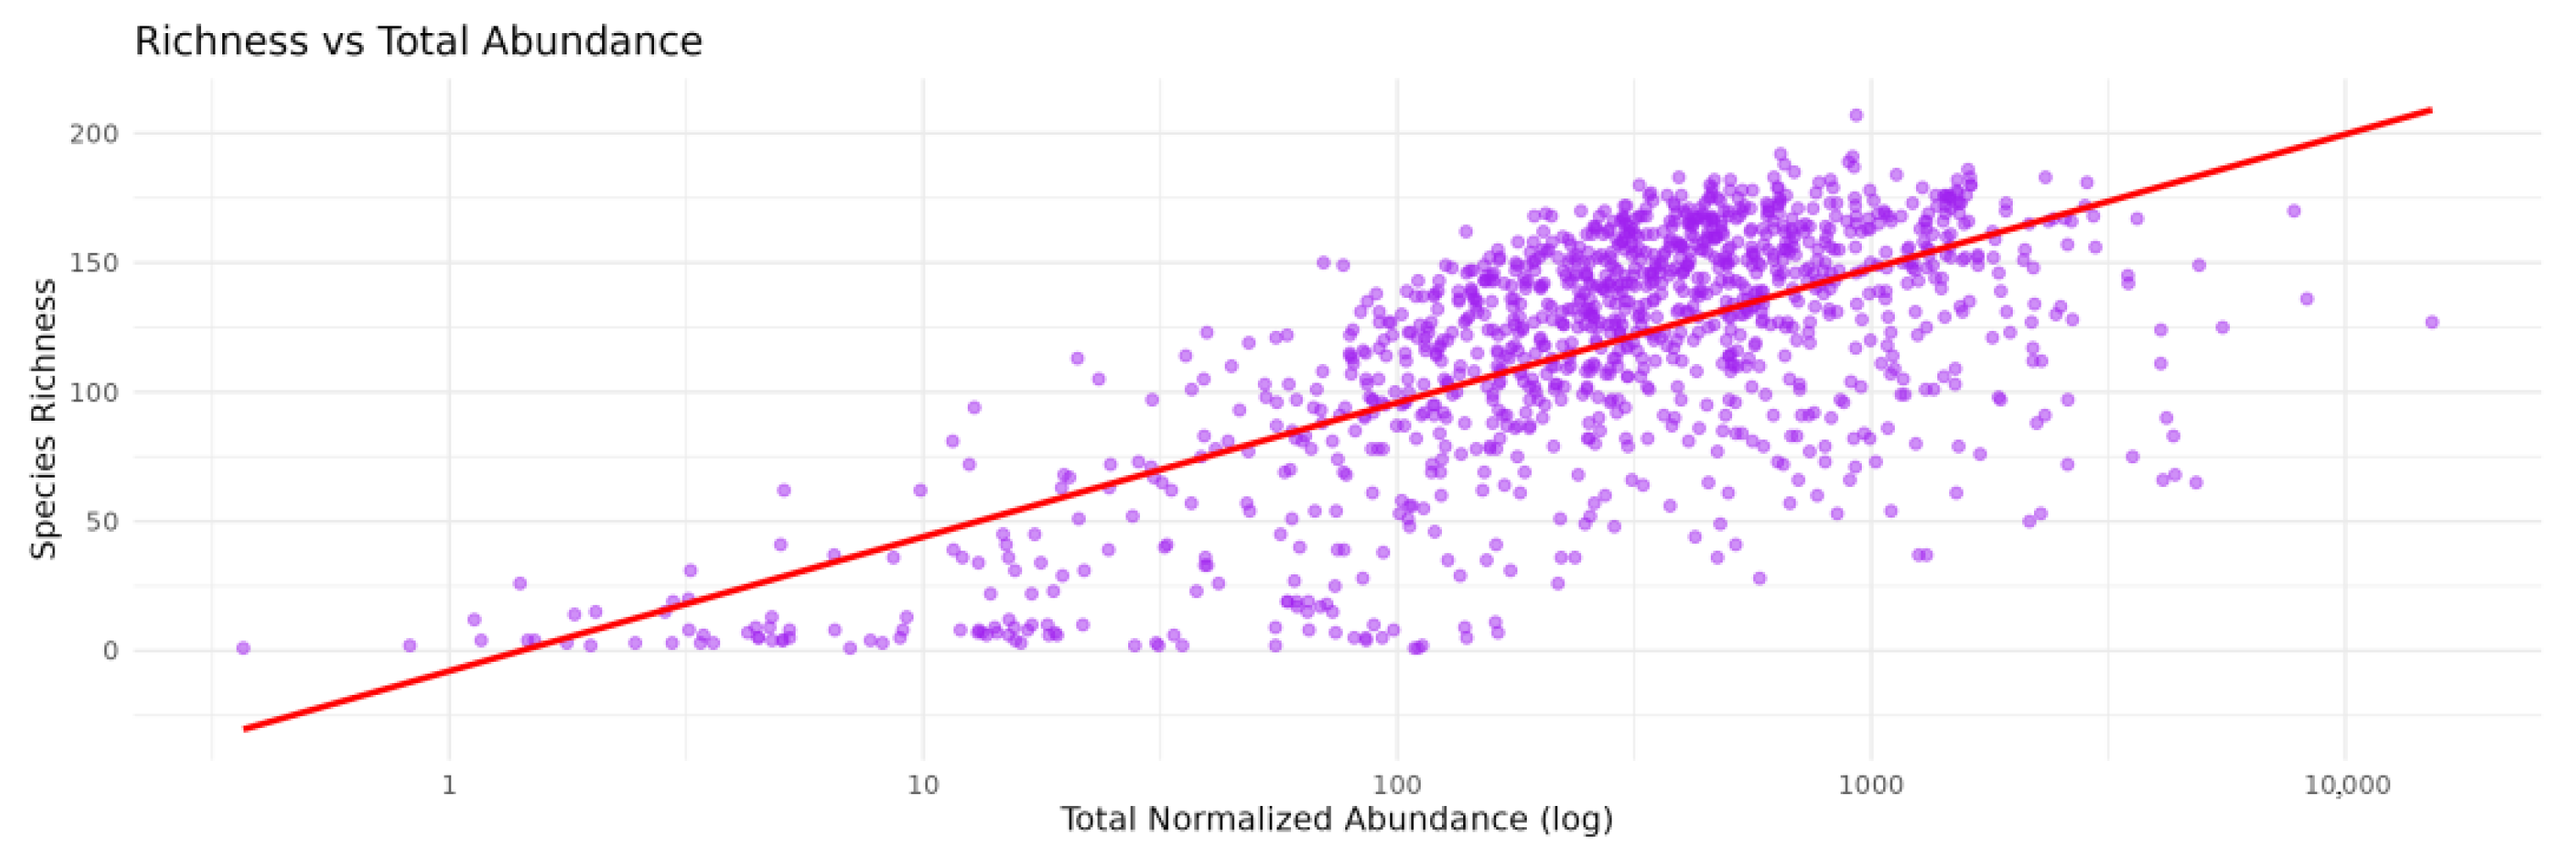
Among the 939 Tara Oceans projects, we removed samples where no eukaryotic algae were detected or where environmental data were missing and analyzed the remaining 1202 metagenomic samples. A total of 230 eukaryotic algal species were identified, of which 125 (54.3%) were classified as core species. The most dominant core taxa included the macroalga Nereocystis luetkeana (96.5%) and the picoeukaryote Micromonas commoda (94.3%). At the class level, Phaeophyceae exhibited the highest ubiquity (99.42%), while Mamiellophyceae contributed the greatest proportion to total abundance (41.71%). Algal α-diversity displayed pronounced spatial heterogeneity (Figure 2), with a mean Shannon diversity index of 2.42 ± 0.68 and a median value of 2.50 (Figure 3). Species richness was positively but weakly correlated with total abundance (ρ = 0.316, p < 0.001) (Figure 4).
Figure 2.
Distribution of species richness across all samples.
Figure 3.
Distribution of Shannon diversity index across all samples.
Figure 4.
Log-log scatter plot of species richness versus total abundance.
3.2.2. Ocean Basin Differences in Community Composition
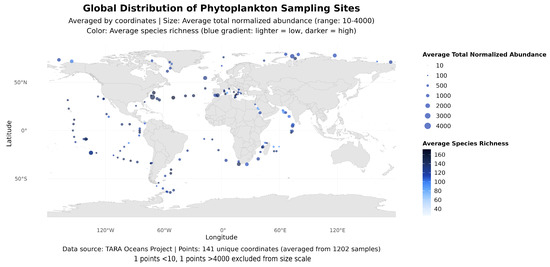
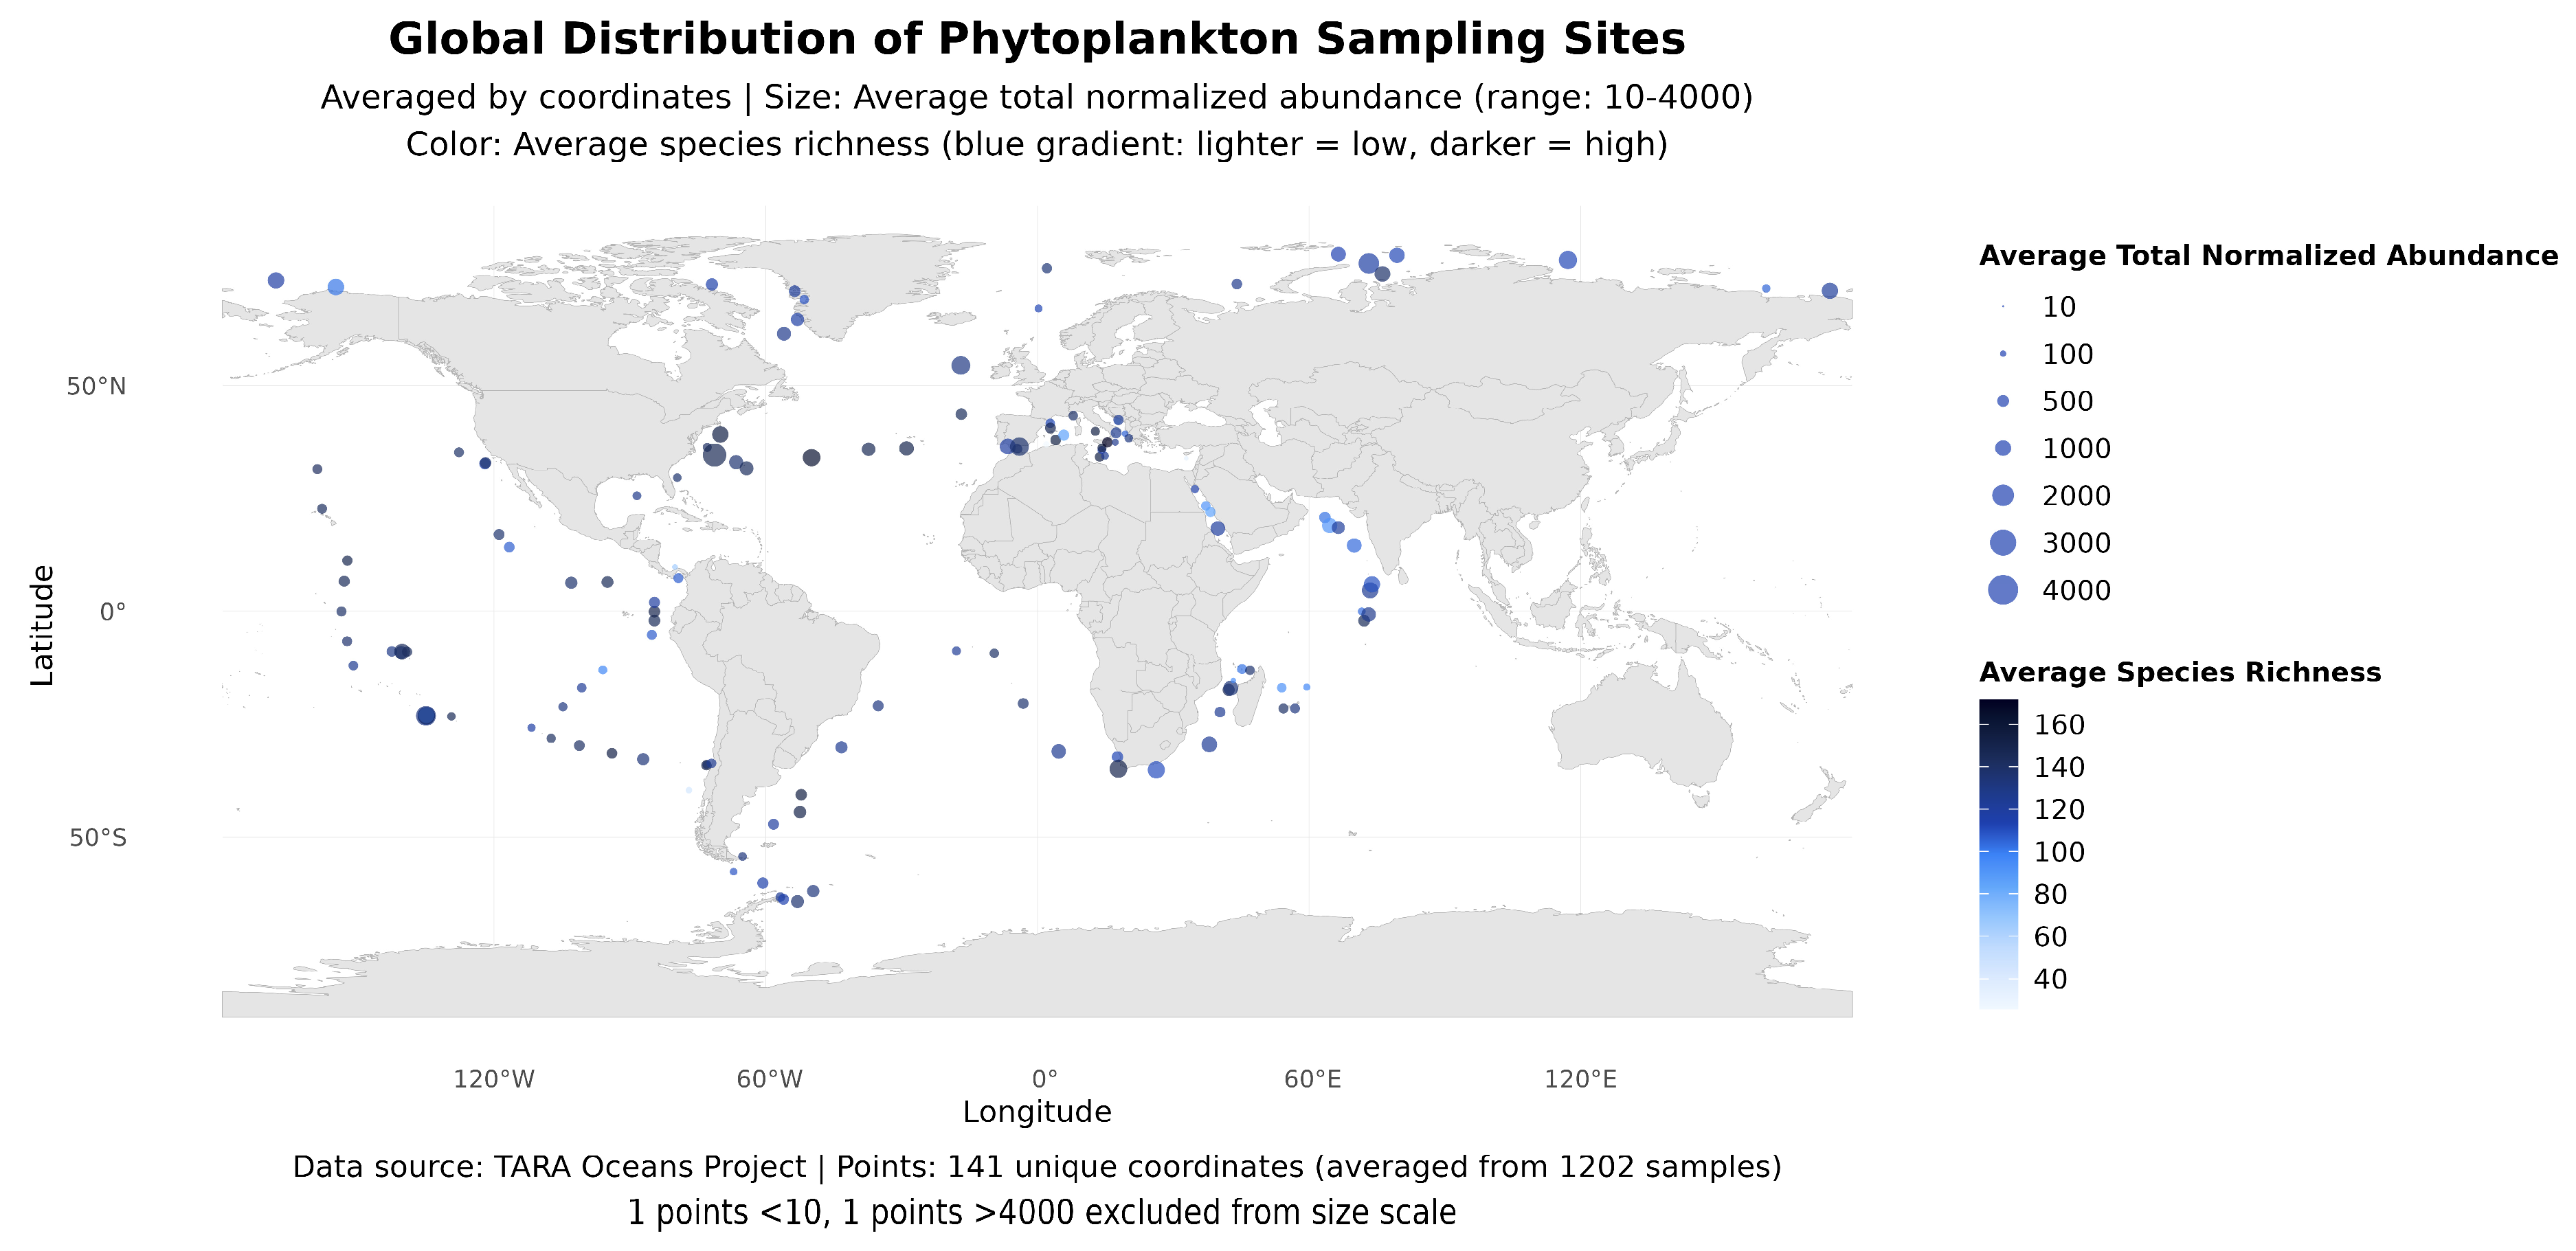
In terms of species richness, the North Pacific exhibited the highest values (mean 135.4 species), followed by the South Pacific (131.4), whereas the Indian Ocean showed the lowest richness (99.8). Notably, species richness of the Arctic Ocean (118.3) was comparable to the global average (118.2), indicating that polar ecosystems are not biodiversity-poor with respect to eukaryotic algae. At the hemispheric scale, mean species richness in the Southern Hemisphere (127.3) was significantly higher than in the Northern Hemisphere (110.4). Patterns of abundance differed among Ocean basins. the Arctic Ocean displayed the highest mean abundance (998.1), significantly exceeding all other regions, followed by the South Atlantic (517.6) and the Indian Ocean (509.4), while the North Pacific exhibited the lowest abundance (390.4). Across all seven ocean basins, species richness was positively and significantly correlated with total abundance (p < 0.001). The strongest correlation was observed in the Southern Ocean and North Atlantic (r = 0.726), whereas the Arctic Ocean showed a weaker but still significant relationship (r = 0.417). Collectively, these basin-level differences in species richness and abundance reveal clear biogeographic patterns, as depicted in the global synthesis map (Figure 5).
Figure 5.
Global distribution of eukaryotic algal ubiquity and abundance. The spatial distribution of eukaryotic algal ubiquity and abundance is based on the global sampling network of the Tara Oceans project. The map displays 141 independent geographic coordinates, with values at each site averaged across multiple samples (total sample size = 1202). Points color intensity represents the mean species richness, while the point diameter indicated mean abundance at each sampling site, illustrating the spatial heterogeneity of eukaryotic algal communities worldwide.
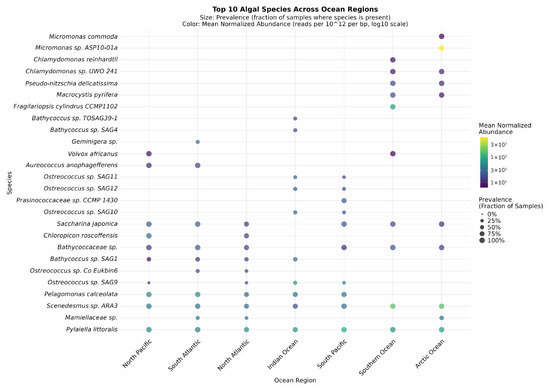
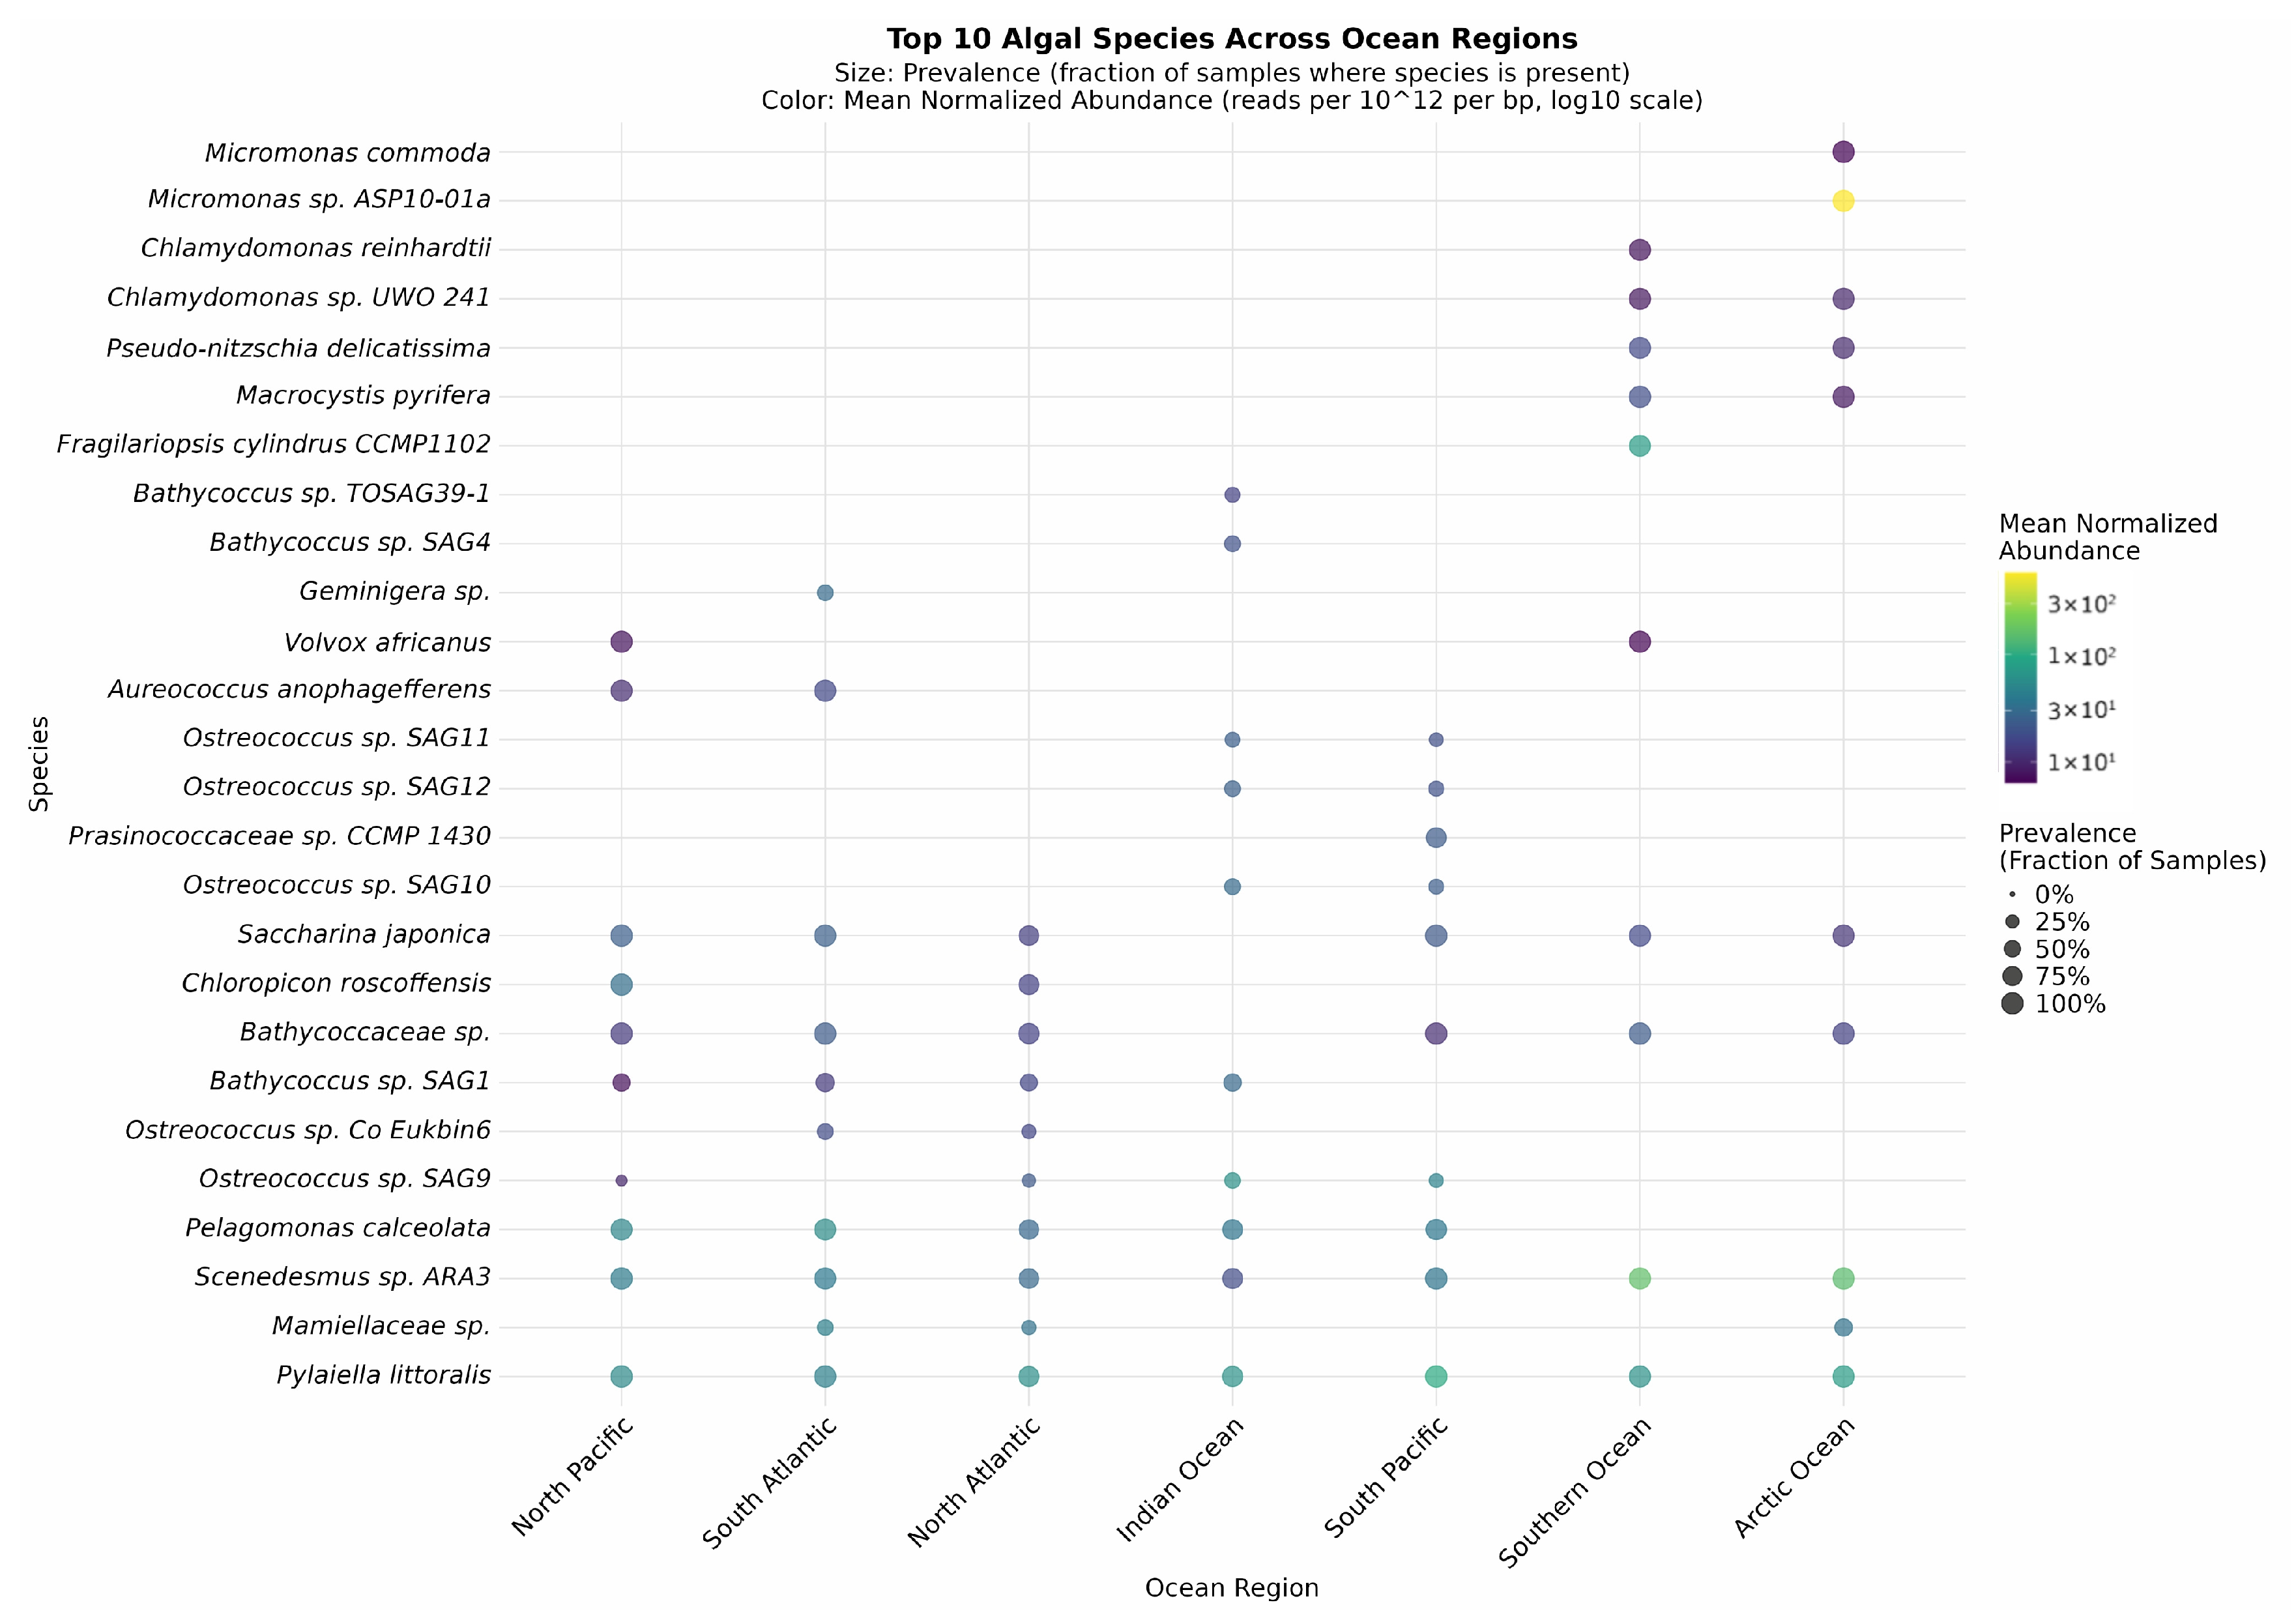
The Arctic Ocean exhibited extreme dominance by a single species (Figure 6), with Micromonas sp. ASP10-01a showing a mean abundance of 586.67—approximately 3.8 to 91.4 times higher than the most abundance species in other basins (3.8 times higher than the Southern Ocean and 91.4 times higher than the North Atlantic). In contrast, the Indian Ocean displayed a relatively even distribution of dominant species, with the top 10 species exhibiting a mean abundance of 32.7 and the lowest mean ubiquity (57.0%), indicating a more complex community structure. Across all basins, Pylaiella littoralis emerged as a cosmopolitan species, appearing in the top 10 species lists of all seven ocean basins and ranking first in abundance in four basins (North Pacific, South Pacific, Indian Ocean, North Atlantic), with ubiquity ranging from 85.4% to 100%. In parallel, several regionally specialized taxa were identified, including Micromonas sp. ASP10-01a in the Arctic Ocean, Fragilariopsis cylindrus CCMP1102 in the Southern Ocean, and Mamiellaceae sp. in the North Atlantic. Polar oceans exhibited distinct community characteristics. The Arctic Ocean showed the highest single-species dominance, with the top 10 species having a mean ubiquity of 95.0%, whereas the Southern Ocean exhibited the highest overall species ubiquity (mean 97.4%), with Bathycoccaceae sp. and the macroalga Macrocystis pyrifera detected in all samples. Notably, species ubiquity was only weakly correlated with average abundance (r = 0.07). Finally, the composition of dominant species varied markedly among basins. For example, the North Atlantic was dominated by Pylaiella littoralis, whereas the South Atlantic was dominated by Pelagomonas calceolata. In the Pacific Ocean, a hemispheric symmetry was observed, with Pylaiella littoralis ranking first in abundance in both the North and South Pacific, although its abundance was significantly higher in the latter.
Figure 6.
Bubble plot showing abundance versus ubiquity for the top 10 species across different ocean basins.
At the class level, the composition of eukaryotic algal groups exhibited pronounced basin-specific patterns. Among the three most abundant classes, the Arctic Ocean was dominated by Mamiellophyceae, Chlorophyceae, and Phaeophyceae, with Mamiellophyceae showing an exceptionally high mean abundance (650.82), far exceeding levels observed in other basins. In contrast, the Southern Ocean was characterized by a dominance of Chlorophyceae, Phaeophyceae, and Bacillariophyceae. Temperate basins, including the North Pacific and South Pacific, exhibited a co-dominant pattern of Phaeophyceae and Chlorophyceae. Notably, the overwhelming dominance of Mamiellophyceae in the Arctic Ocean contrasted sharply with its comparatively low abundance in the Southern Ocean, while Bacillariophyceae showed the opposite pattern—ranking among the most abundant classes in the Southern Ocean but absence from the top ranks in the Arctic Ocean. Pelagophyceae consistently appeared among the dominant classes in both the South Atlantic and Indian Ocean, indicating a stable presence in these lower-latitude basins.
3.3. Influence of Environmental Factors on Algal Communities
3.3.1. Global Environmental Drivers of Community Structure
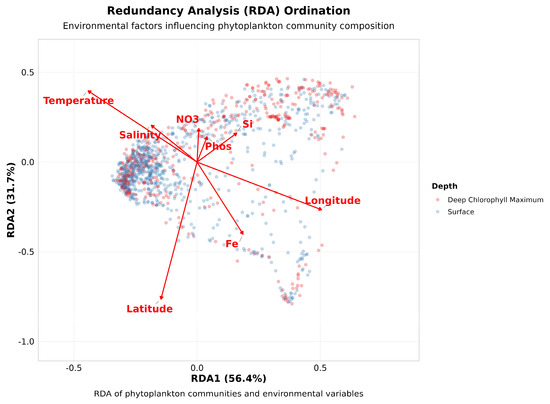
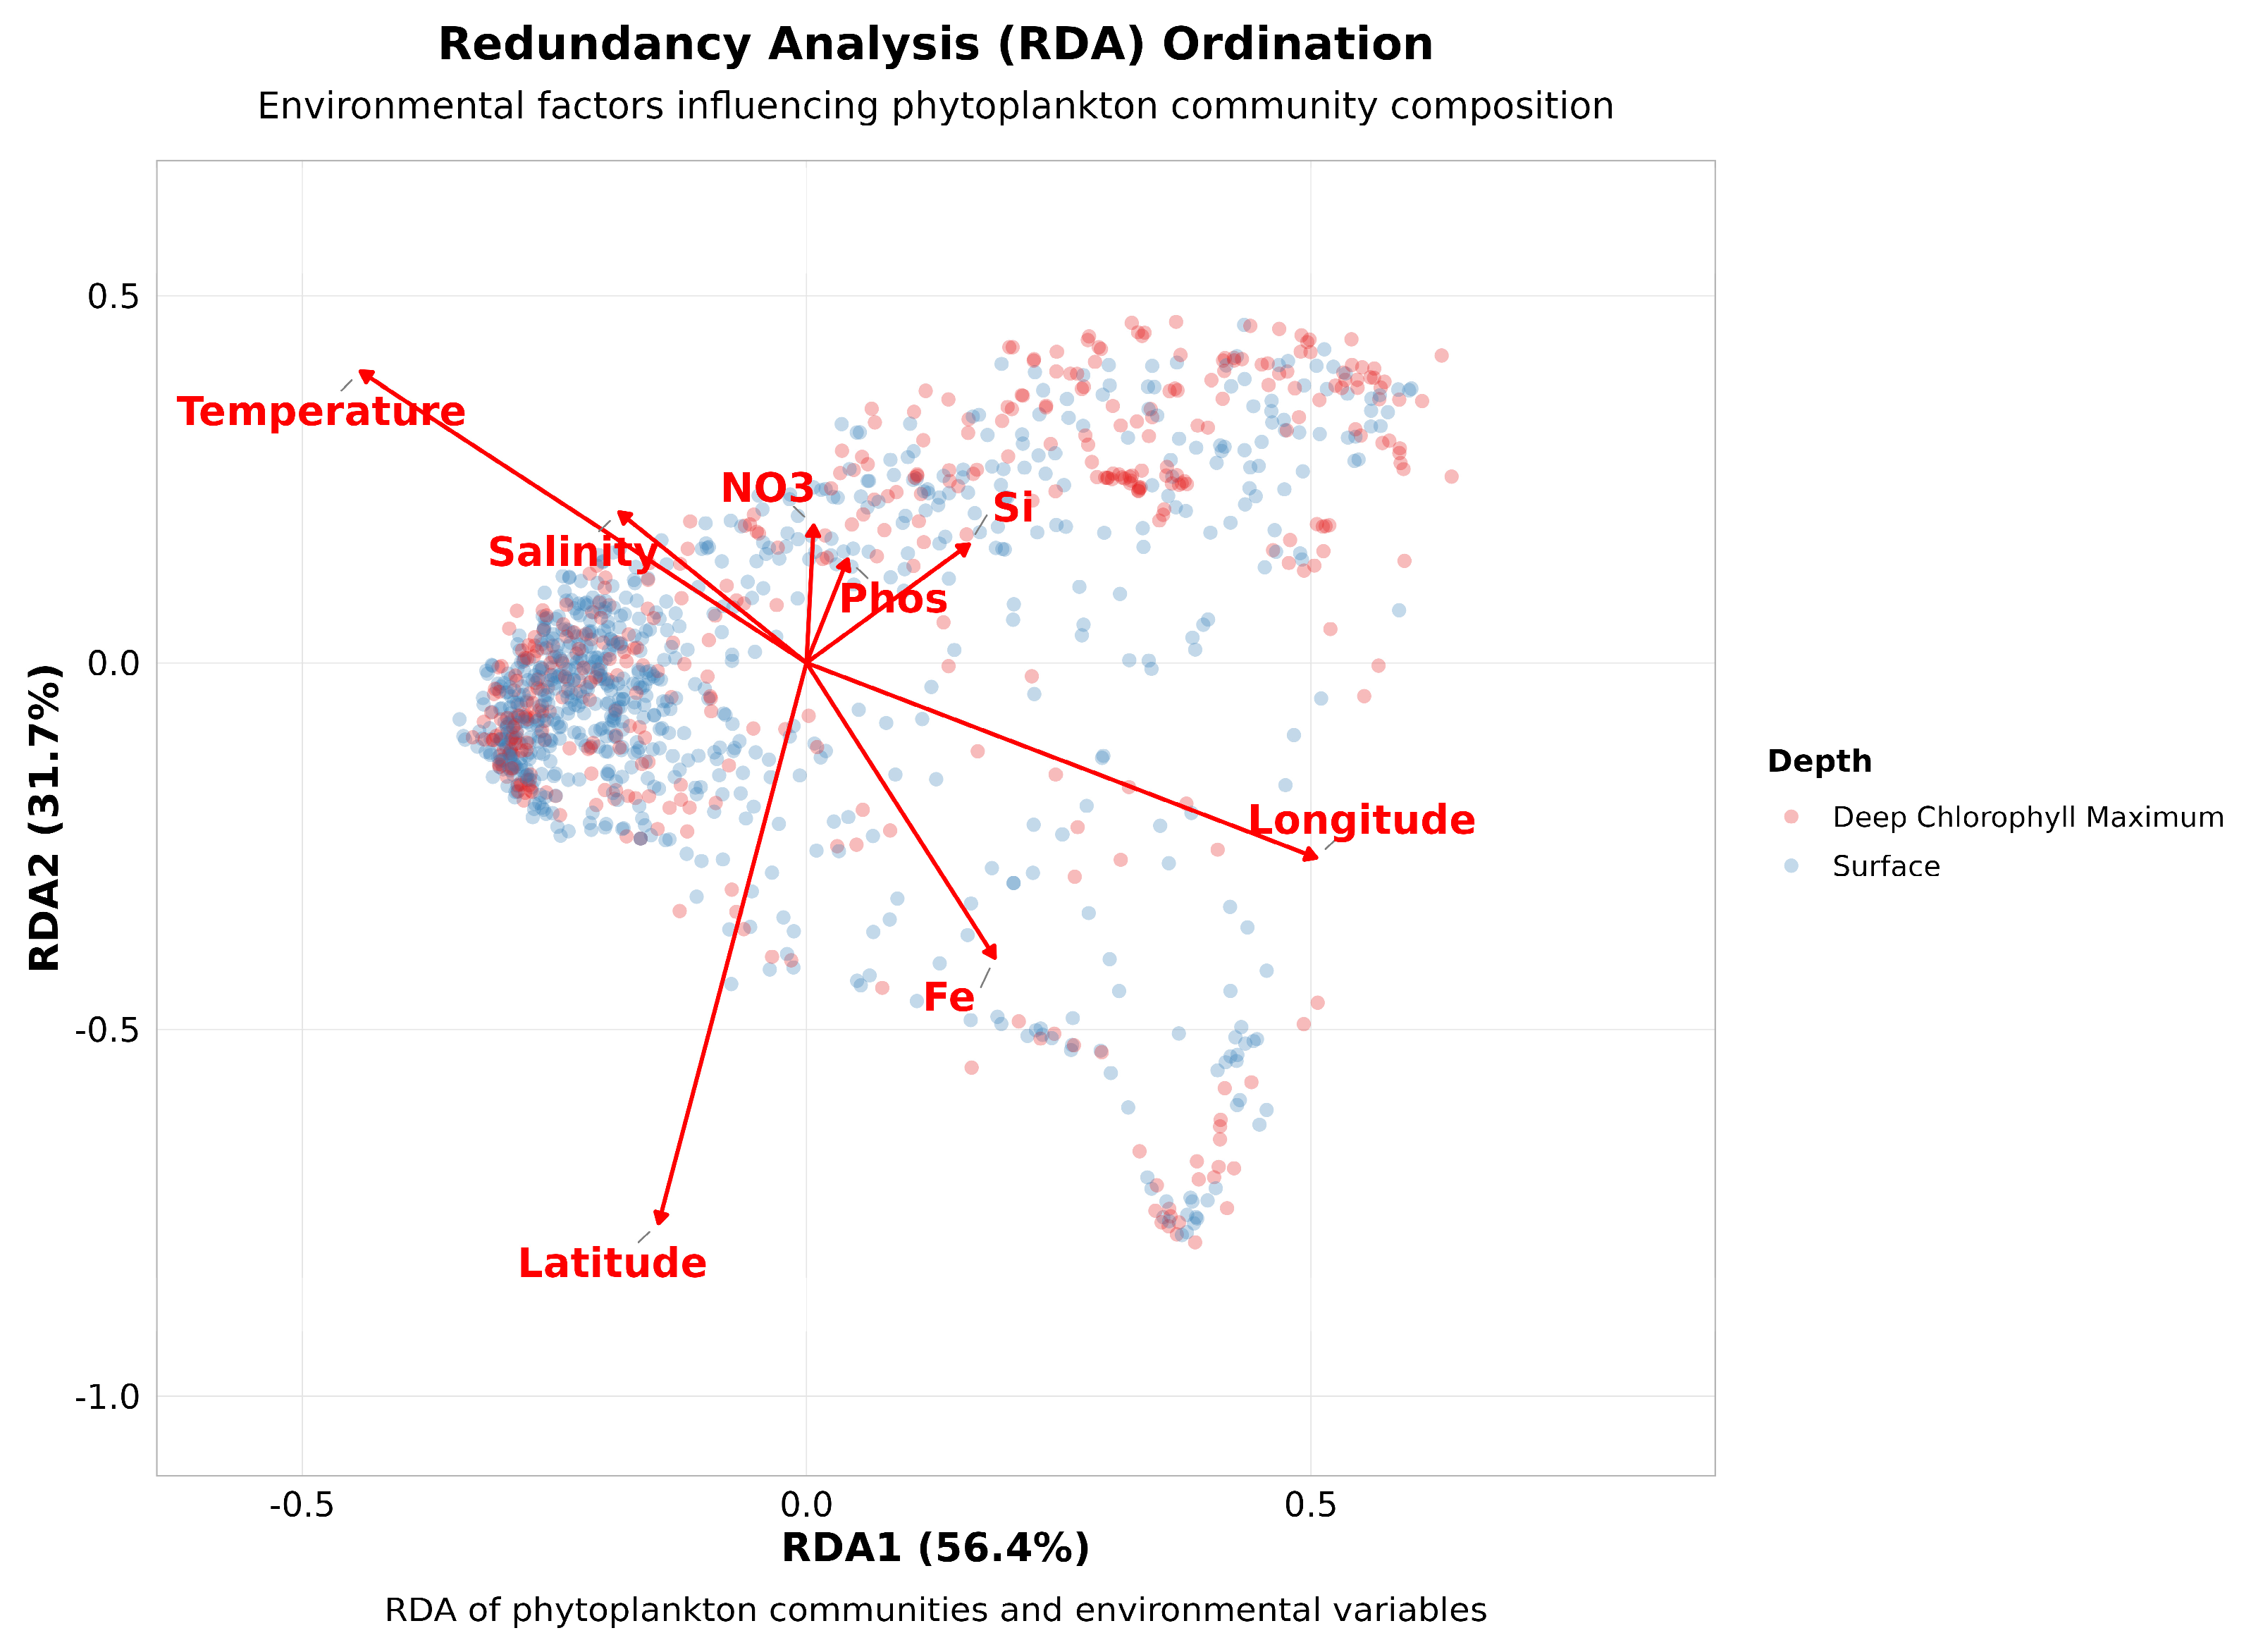
Redundancy Analysis (RDA) revealed a significant constraining effect of environmental variables on eukaryotic algal community structure (p < 0.001; Figure 7). The eight selected environmental variables jointly explained 11.46% of the total community variation. The first two ordination axes, RDA1 and RDA2, explained 56.4% and 31.7% of the constrained variance, respectively, together explaining 88.1% of the environment-community relationship.
Figure 7.
RDA ordination plot showing the effects of environmental factors on eukaryotic algal community structure. Contribution rates were calculated via partial redundancy analysis, representing the proportion of variance independently explained by each variable after controlling for the effects of others.
Table 1 shows that latitude was the most important factor affecting community structure, followed by temperature and longitude. Specifically, latitude showed a strong negative loading on the RDA2 axis, contributing 53.25% of the variance on this axis, demonstrating that the latitudinal gradient from equatorial to polar regions represents the dominant environmental filter driving community differentiation. Temperature showed substantial loadings on both RDA axes, accounting for 34.34% of the variance on RDA1 and 14.35% on RDA2. Together with latitude, temperature defined an oblique environmental gradient from low-temperature, high-latitude conditions to high-temperature, low-latitude conditions. Longitude had the largest positive loading on the RDA1, explaining 44.84% of the variance on this axis. Iron concentration (Fe) ranked as the fourth most important environmental variable and displayed a negative loading on the RDA2 aligned with the direction of latitude, contributing 14.73% of the explained variance. This pattern underscores the regulatory role of iron limitation in shaping eukaryotic algal communities in high-latitude seas.
Table 1.
Results of RDA showing the influence of environmental variables on eukaryotic algal community structure.
Salinity, Si, NO3, and Phos had relatively minor contributions to community structure. Notably, all nutrient variable arrows were concentrated in the positive quadrant of the RDA1 axis, indicating influence directions opposite to those of Fe and the major geographic factors. In addition, nitrate exhibited the highest Variance Inflation Factor value, followed by phosphate, indicating strong collinearity between these nutrient variables and other environmental variables.
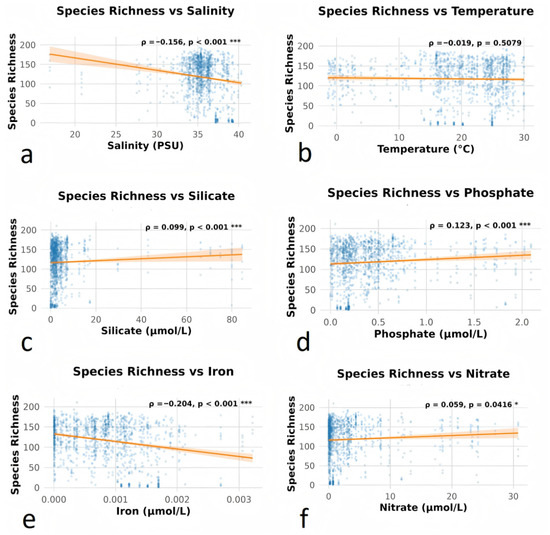
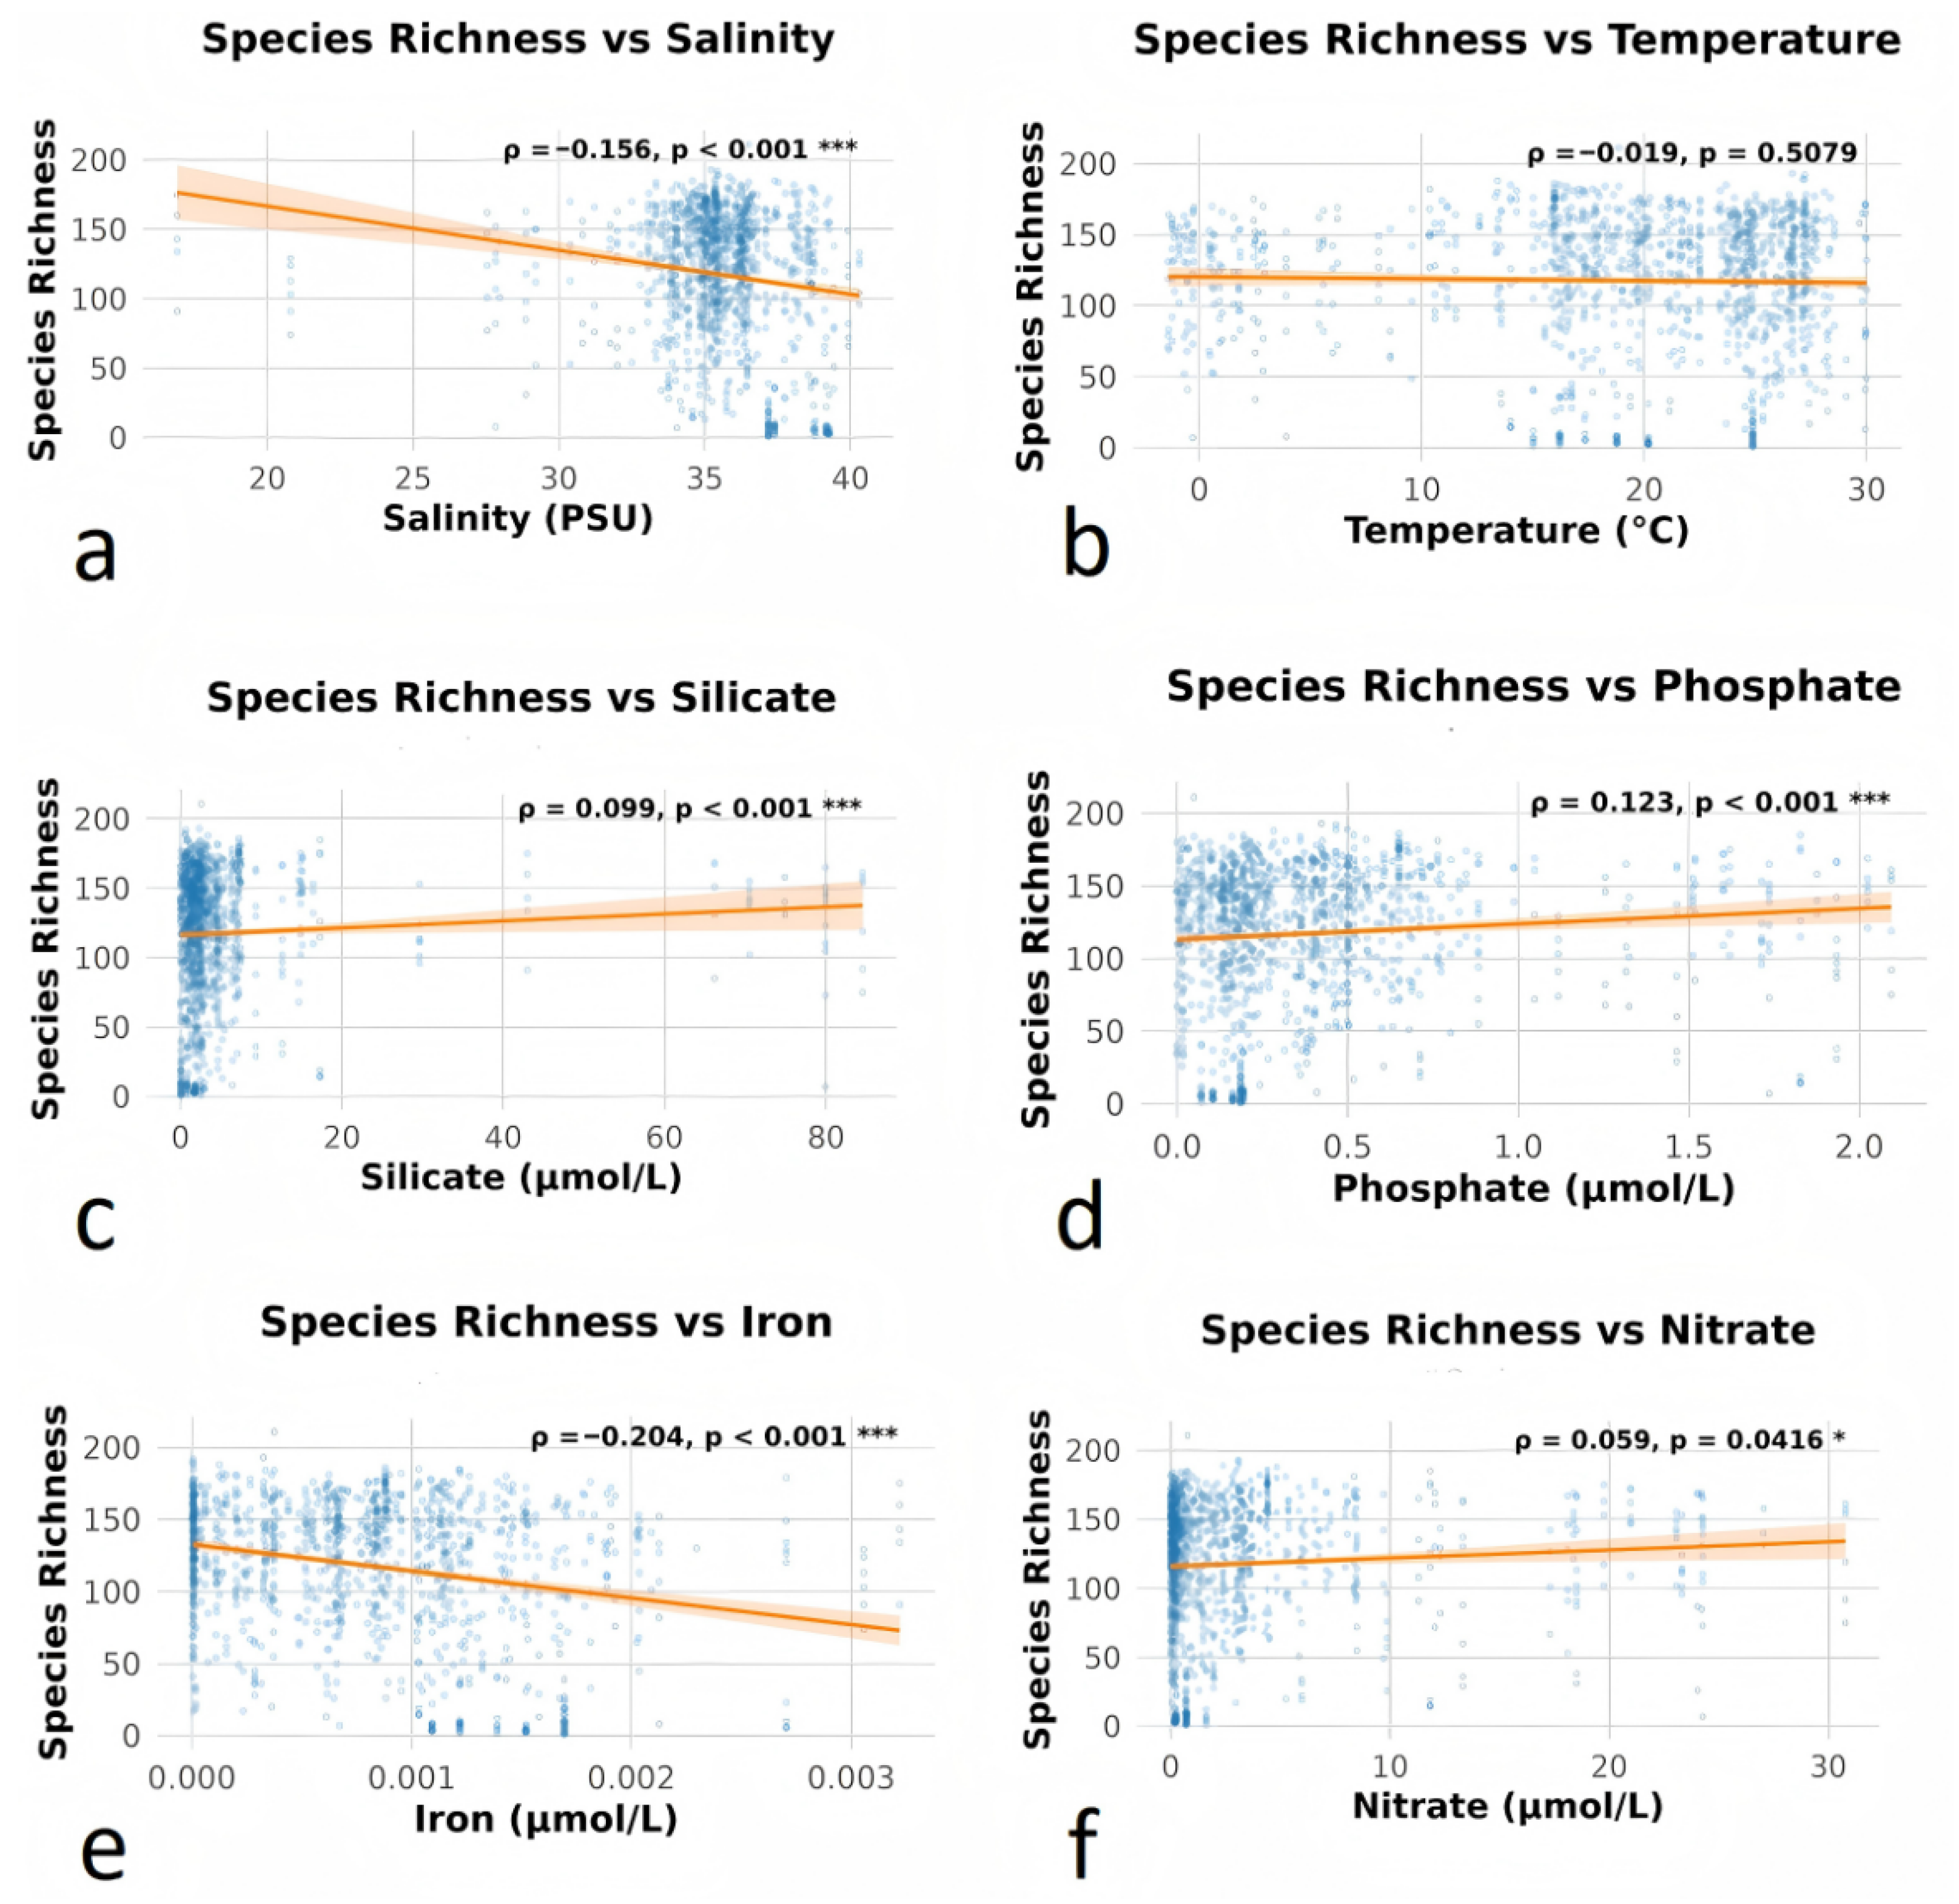
To investigate the driving role of environmental factors on algal community distribution, Spearman correlation analysis was performed. As shown in Figure 8, algal species richness exhibited significant association with multiple environmental factors. Nutrient effects were heterogeneous: phosphate (ρ = 0.123, p < 0.001) and silicate (ρ = 0.099, p < 0.001) showed significant positive correlations with species richness, although the correlation coefficients indicate weak to moderate effect sizes according to conventional guidelines. Nitrate displayed a weak but statistically significant relationship (ρ = 0.059, p = 0.0416), suggesting a negligible ecological effect at the global scale despite its statistical significance. Fe showed the strongest negative correlation with species richness (ρ = −0.204, p < 0.001), followed by salinity (ρ = −0.156, p < 0.001). In contrast, temperature was not significantly correlated with algal species richness (ρ = −0.019, p = 0.5079).
Figure 8.
Correlations between environmental factors and eukaryotic algal species richness. (a) Species richness vs. Salinity; (b) Species richness vs. Temperature; (c) Species richness vs. Silicate; (d) Species richness vs. Phosphate; (e) Species richness vs. Iron (Fe); (f) Species richness vs. Nitrate. Significance levels are indicated as *** p < 0.001, and * p < 0.05.
3.3.2. Analysis of Regional Environmental Driving Factors
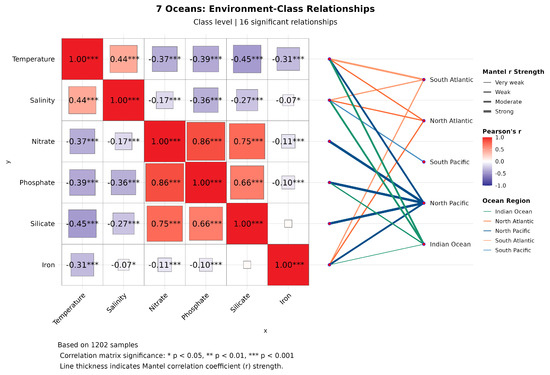
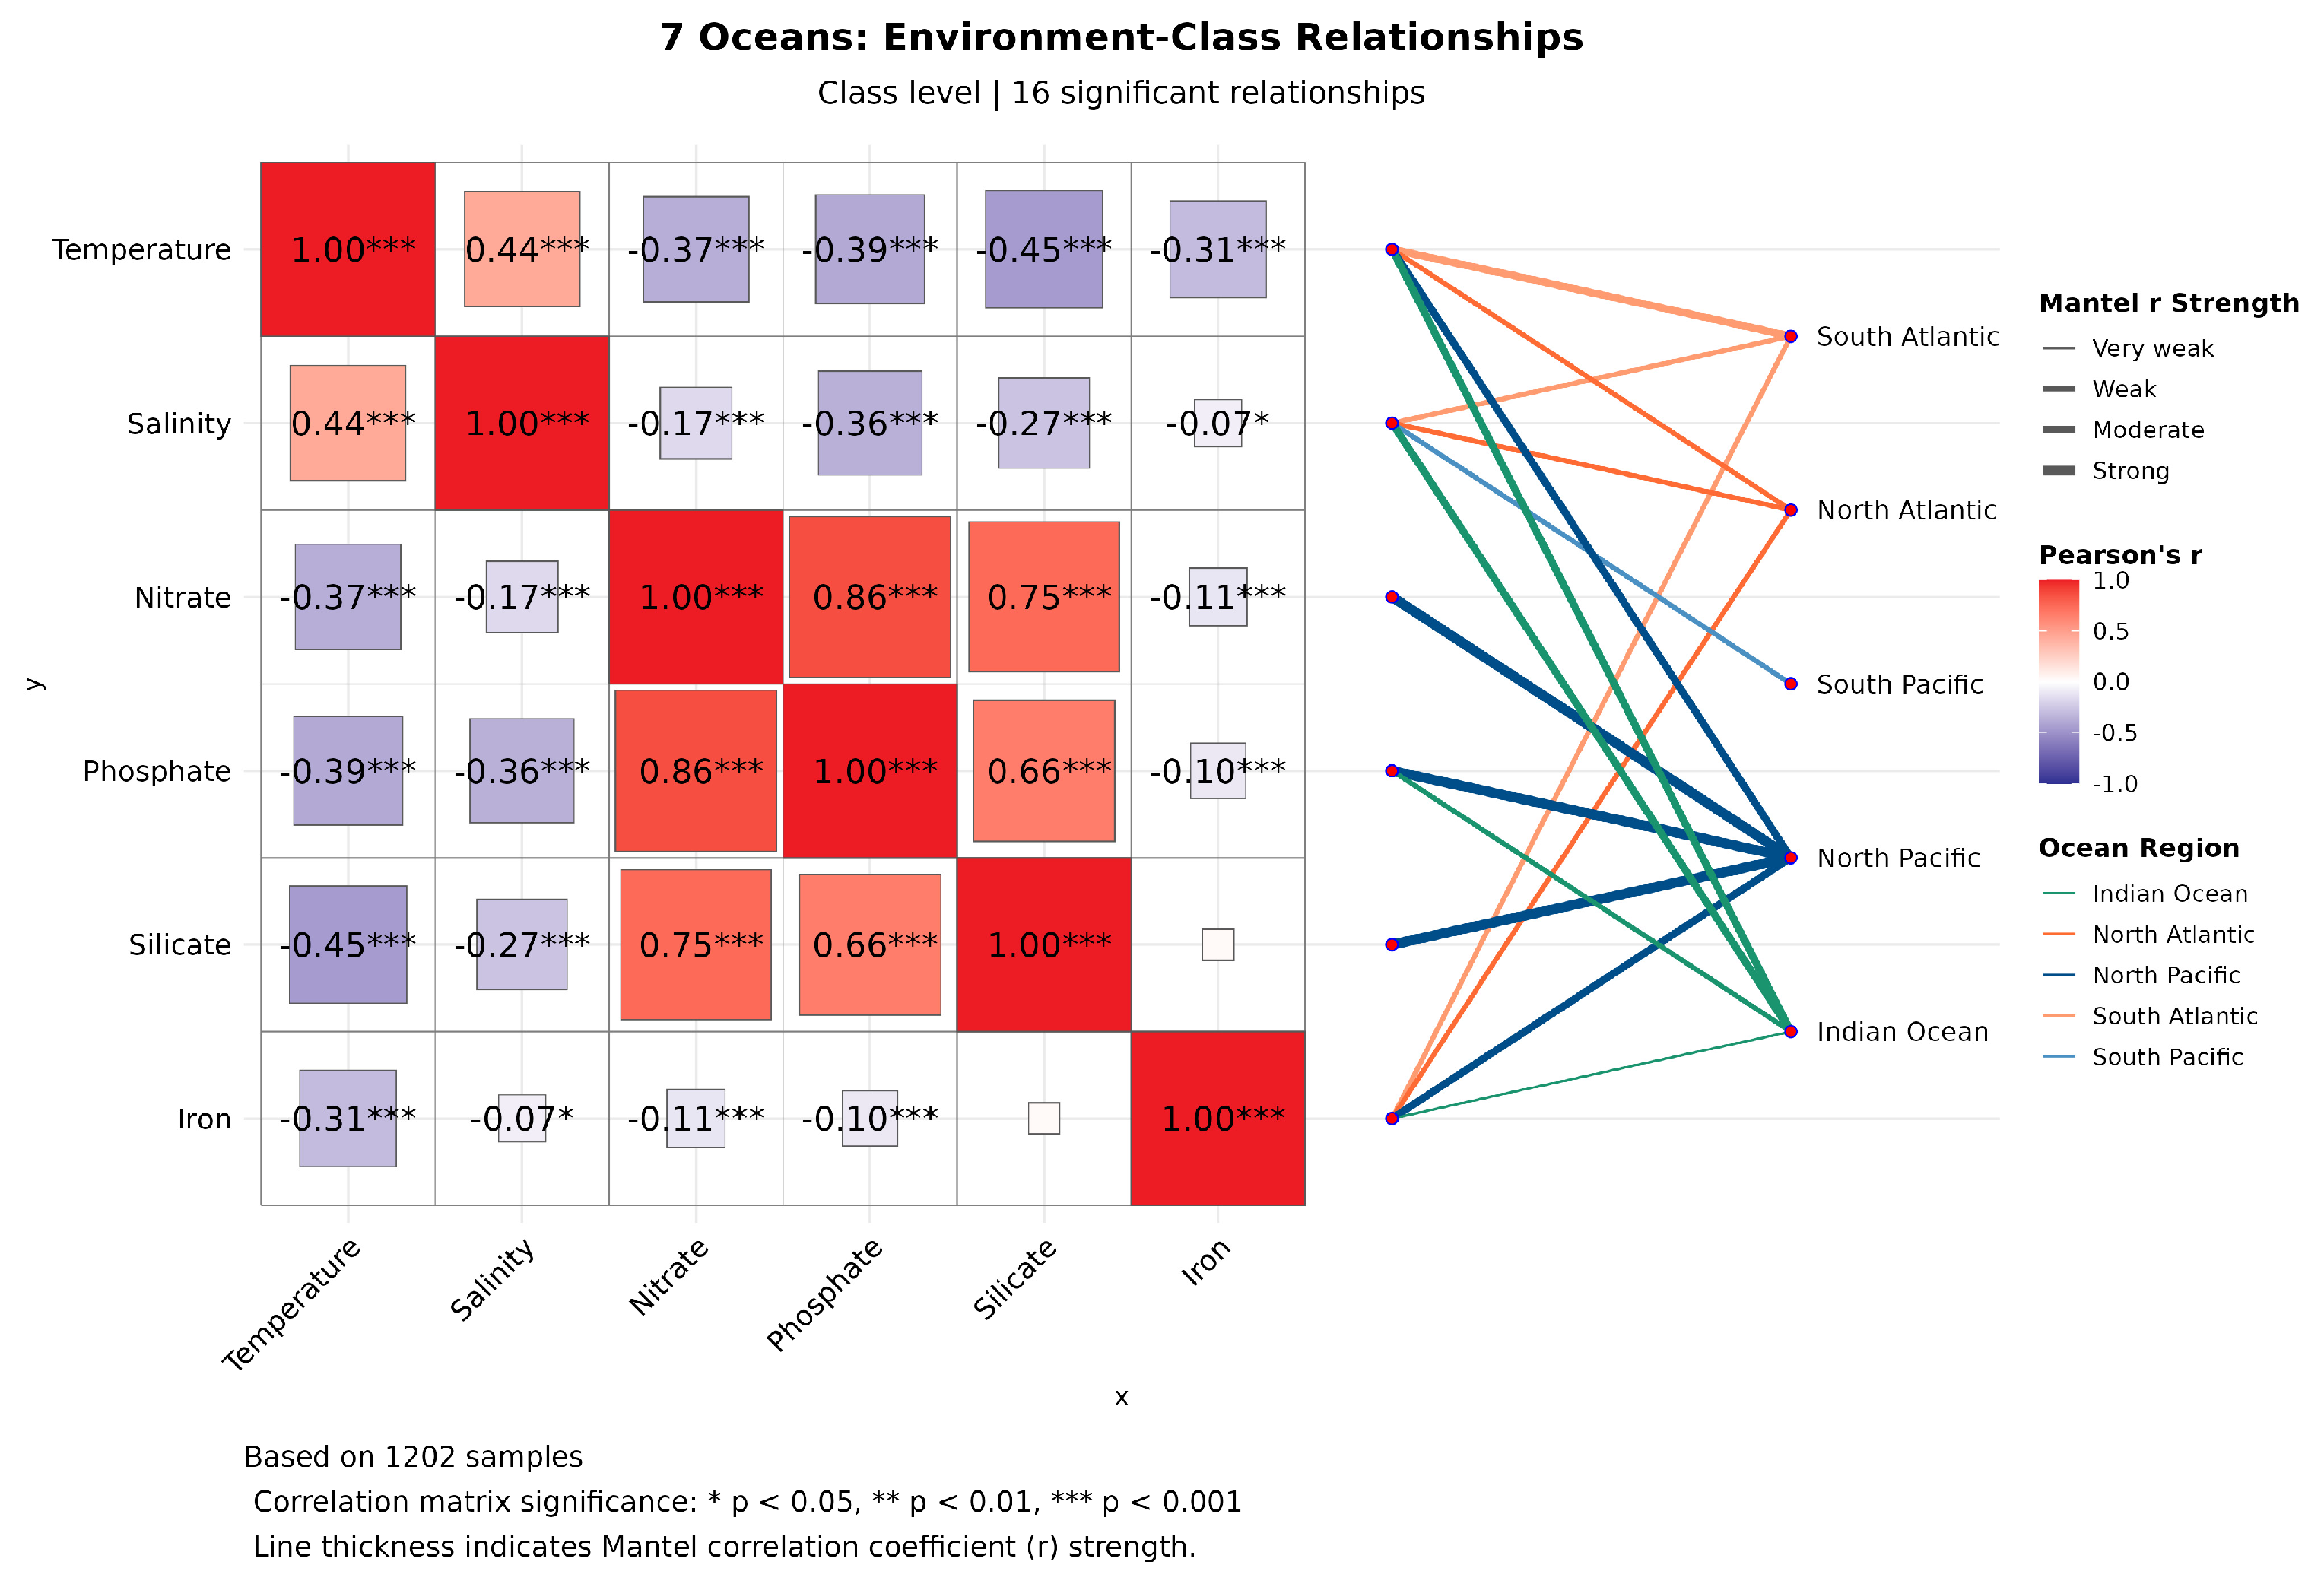
Mantel Test analysis showed that at the class level, temperature, salinity, and Fe were the primary environmental factors associated with variations in eukaryotic algal community structure (Figure 9; Table 2). Among these, temperature exhibited the strongest average effect, followed by salinity, while the influence of Fe was comparatively weaker. Phosphate, nitrate, and silicate also showed significant correlations with community distribution, although their effect strengths were more variable and generally lower than those of the primary drivers.
Figure 9.
Mantel test correlation network linking environmental factors and eukaryotic algal community structure across ocean basins. This figure summarizes Mantel test results examining relationship between six environmental factors and marine eukaryotic algal community structure at the class level across Tara Oceans basins. The left panel shows the Pearson correlation matrix among environmental factors, with the color intensity indicating the magnitude of the correlation coefficient (red for positive, purple for negative). The right panel displays significant correlations (p < 0.05) between environmental factors and community structure within each basin. Edge colors denote ocean basins (North Atlantic: orange, South Atlantic: light orange, Indian Ocean: green, North Pacific: dark blue, South Pacific: light blue), and edge thickness is proportional to the absolute value of Mantel’s r. The analysis is based on 1202 samples spanning seven major global ocean regions.
Table 2.
Mantel test results showing correlations between environmental factors and community structure across major ocean basins.
The North Pacific exhibited the highest proportion of significant environmental drivers, with silicate being the strongest environmental driver in this basin. Temperature and Fe also showed significant effects, while salinity was the only variable without a significant influence. In the Indian Ocean, temperature and salinity were the primary drivers, with phosphate and Fe also showed significant but weaker effects, suggesting potential phosphorus-iron co-limitation. The North and South Atlantic showed highly similar combinations of environmental drivers. In both regions, temperature was identified as the dominant driver, with salinity and Fe also showing significant effects, whereas other environmental factors (nitrate, phosphate, silicate) were not significant. In the South Pacific, only salinity showed a weak influence; temperature exhibited a negative but non-significant effect, and Fe showed a similar negative trend. In contrast, none of the examined environmental factors reached statistical significance in either the Arctic or Southern Oceans. This apparent “null result” may reflect the combined influence of multiple factors, including reduced environmental gradients, strong seasonal variability, or limitations in sampling resolution.
To comprehensively understand the environmental context influencing eukaryotic algal communities, we analyzed the interrelationships among six key environmental factors (Figure 9). Pearson correlation analysis revealed strong positive correlations among nutrient factors. Temperature showed significant negative correlations with the major nutrients. Fe exhibited a unique variation pattern: weak negative correlation with nitrate and phosphate, and almost no correlation with silicate. Temperature and salinity showed a moderate positive correlation, while iron and temperature showed a moderate negative correlation.
3.3.3. Correlation Between Environmental Factors and Species Abundance
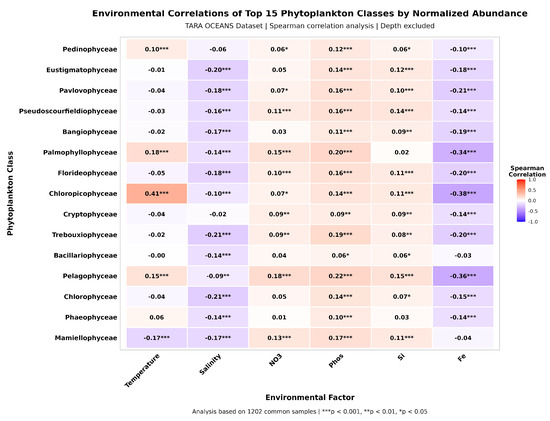
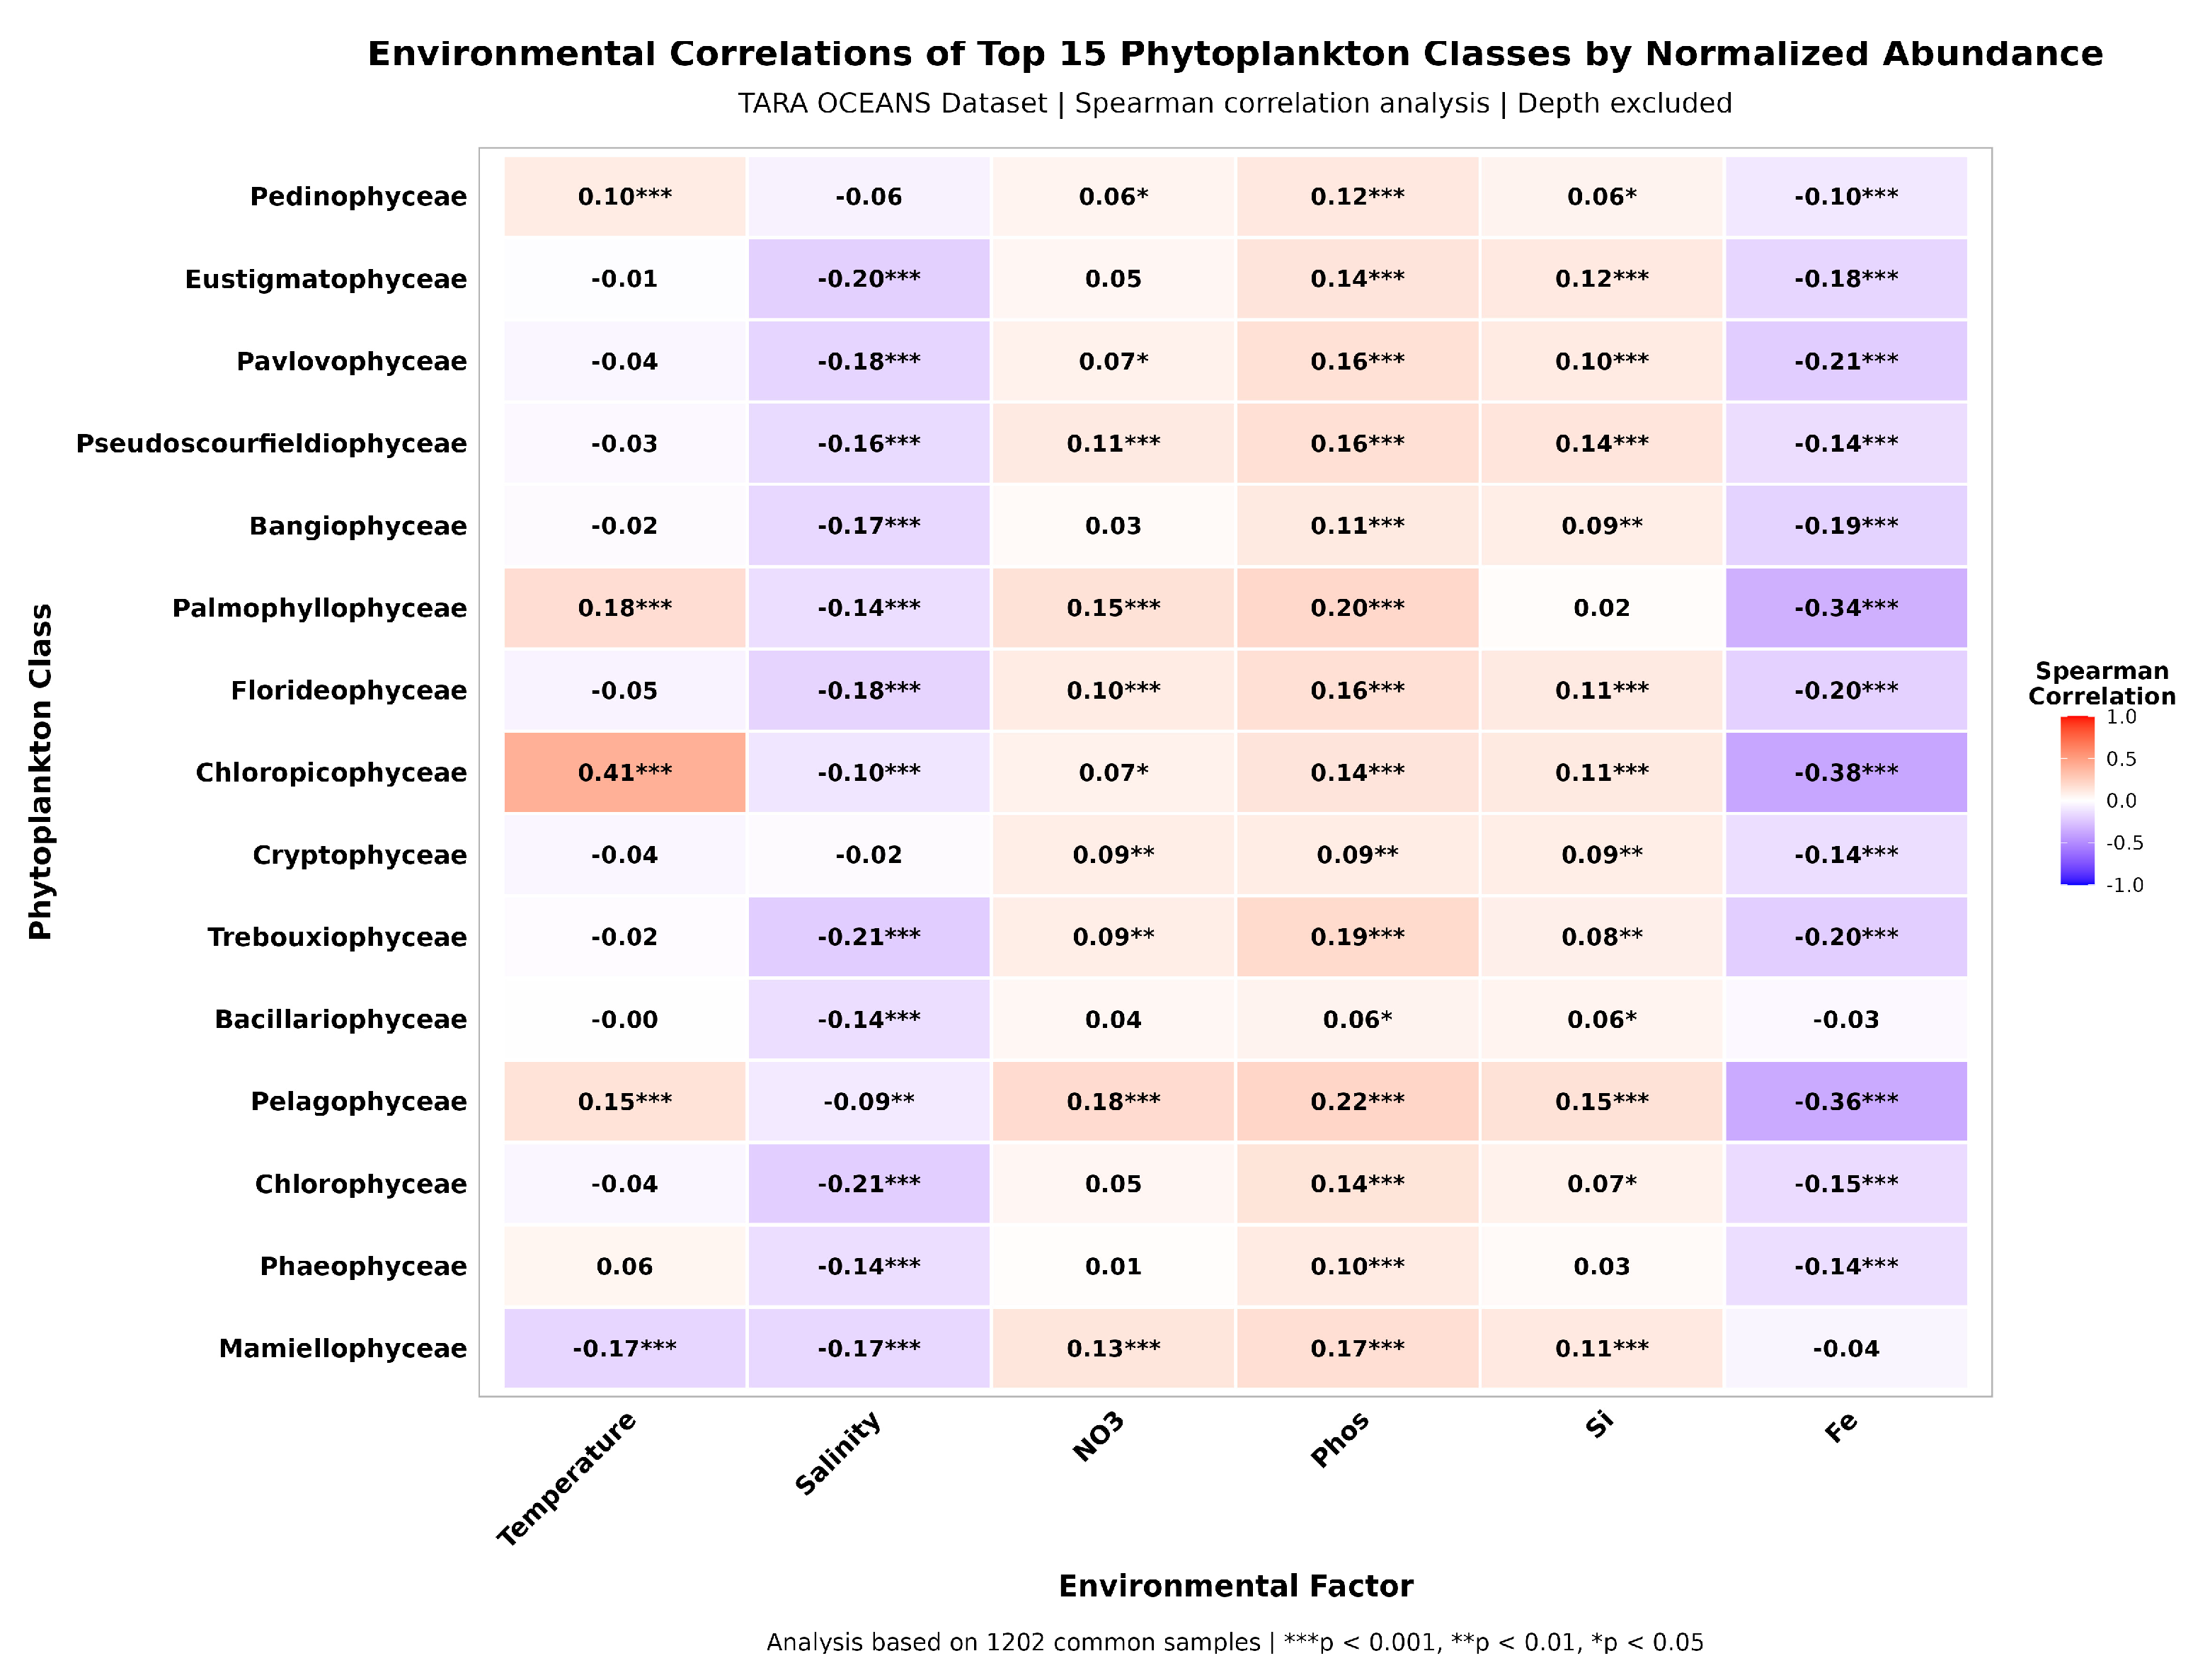
Spearman correlation analysis identified 69 significant pairwise associations (p < 0.05), accounting for 76.7% of the total. As shown in Figure 10, dominant eukaryotic algal classes exhibited distinct and contrasting environmental response strategies. Temperature response displayed clear bidirectional differentiation: Chloropicophyceae showed the strongest positive correlation with temperature, whereas Mamiellophyceae exhibited a significant negative correlation. Pelagophyceae, Palmophyllophyceae, and Pedinophyceae also demonstrated thermophilic tendencies. Fe exerted a broadly negative influence, showing significant negative correlations with 13 algal classes; Pelagophyceae and Chloropicophyceae were the strongest affected. In contrast, correlation between Fe and Mamiellophyceae or Bacillariophyceae were not statistically significant. Salinity exhibited a consistently negative effect across all 15 algal classes, with Trebouxiophyceae showing the strongest negative correlation, followed by Chlorophyceae, Eustigmatophyceae, and Palmophyllophyceae.
Figure 10.
Spearman correlation heatmap between eukaryotic algae classes and environmental factors.
Overall, nutrients exhibited predominantly positive associations with eukaryotic algal classes. Phosphate showed significant positive correlations with all 15 algal classes, while nitrate and silicate were positively correlated with 10 and 13 classes, respectively. Among these groups, Pelagophyceae displayed the strongest response to all three nutrient factors.
Based on pronounced patterns in the Spearman correlation analysis (Figure 10), we identified four main environmental preference types characterized by strong and consistent responses to specific factors: The Warm-Low Iron Preference, represented by Chloropicophyceae, showing a strong affinity for high temperature and low iron concentration. The Nutrient-Responsive Type, exemplified by Pelagophyceae, exhibited pronounced positive correlations with nitrate, phosphate, and silicate. The Generalist Type, represented by Cryptophyceae, demonstrated broad environmental tolerance range. Finally, the Cold-Adapted Type, represented by Mamiellophyceae, was characterized by a significant negative correlation with temperature.
3.4. Species Co-Occurrence Network and Key Hub Species
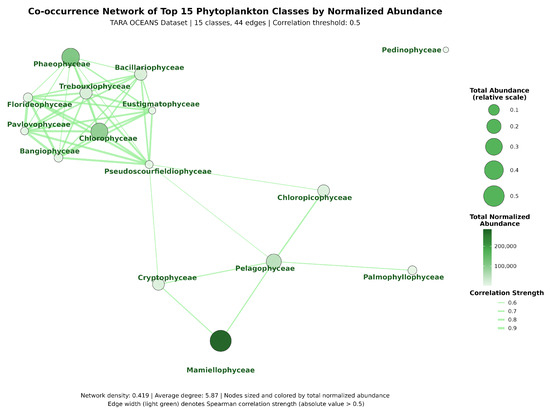
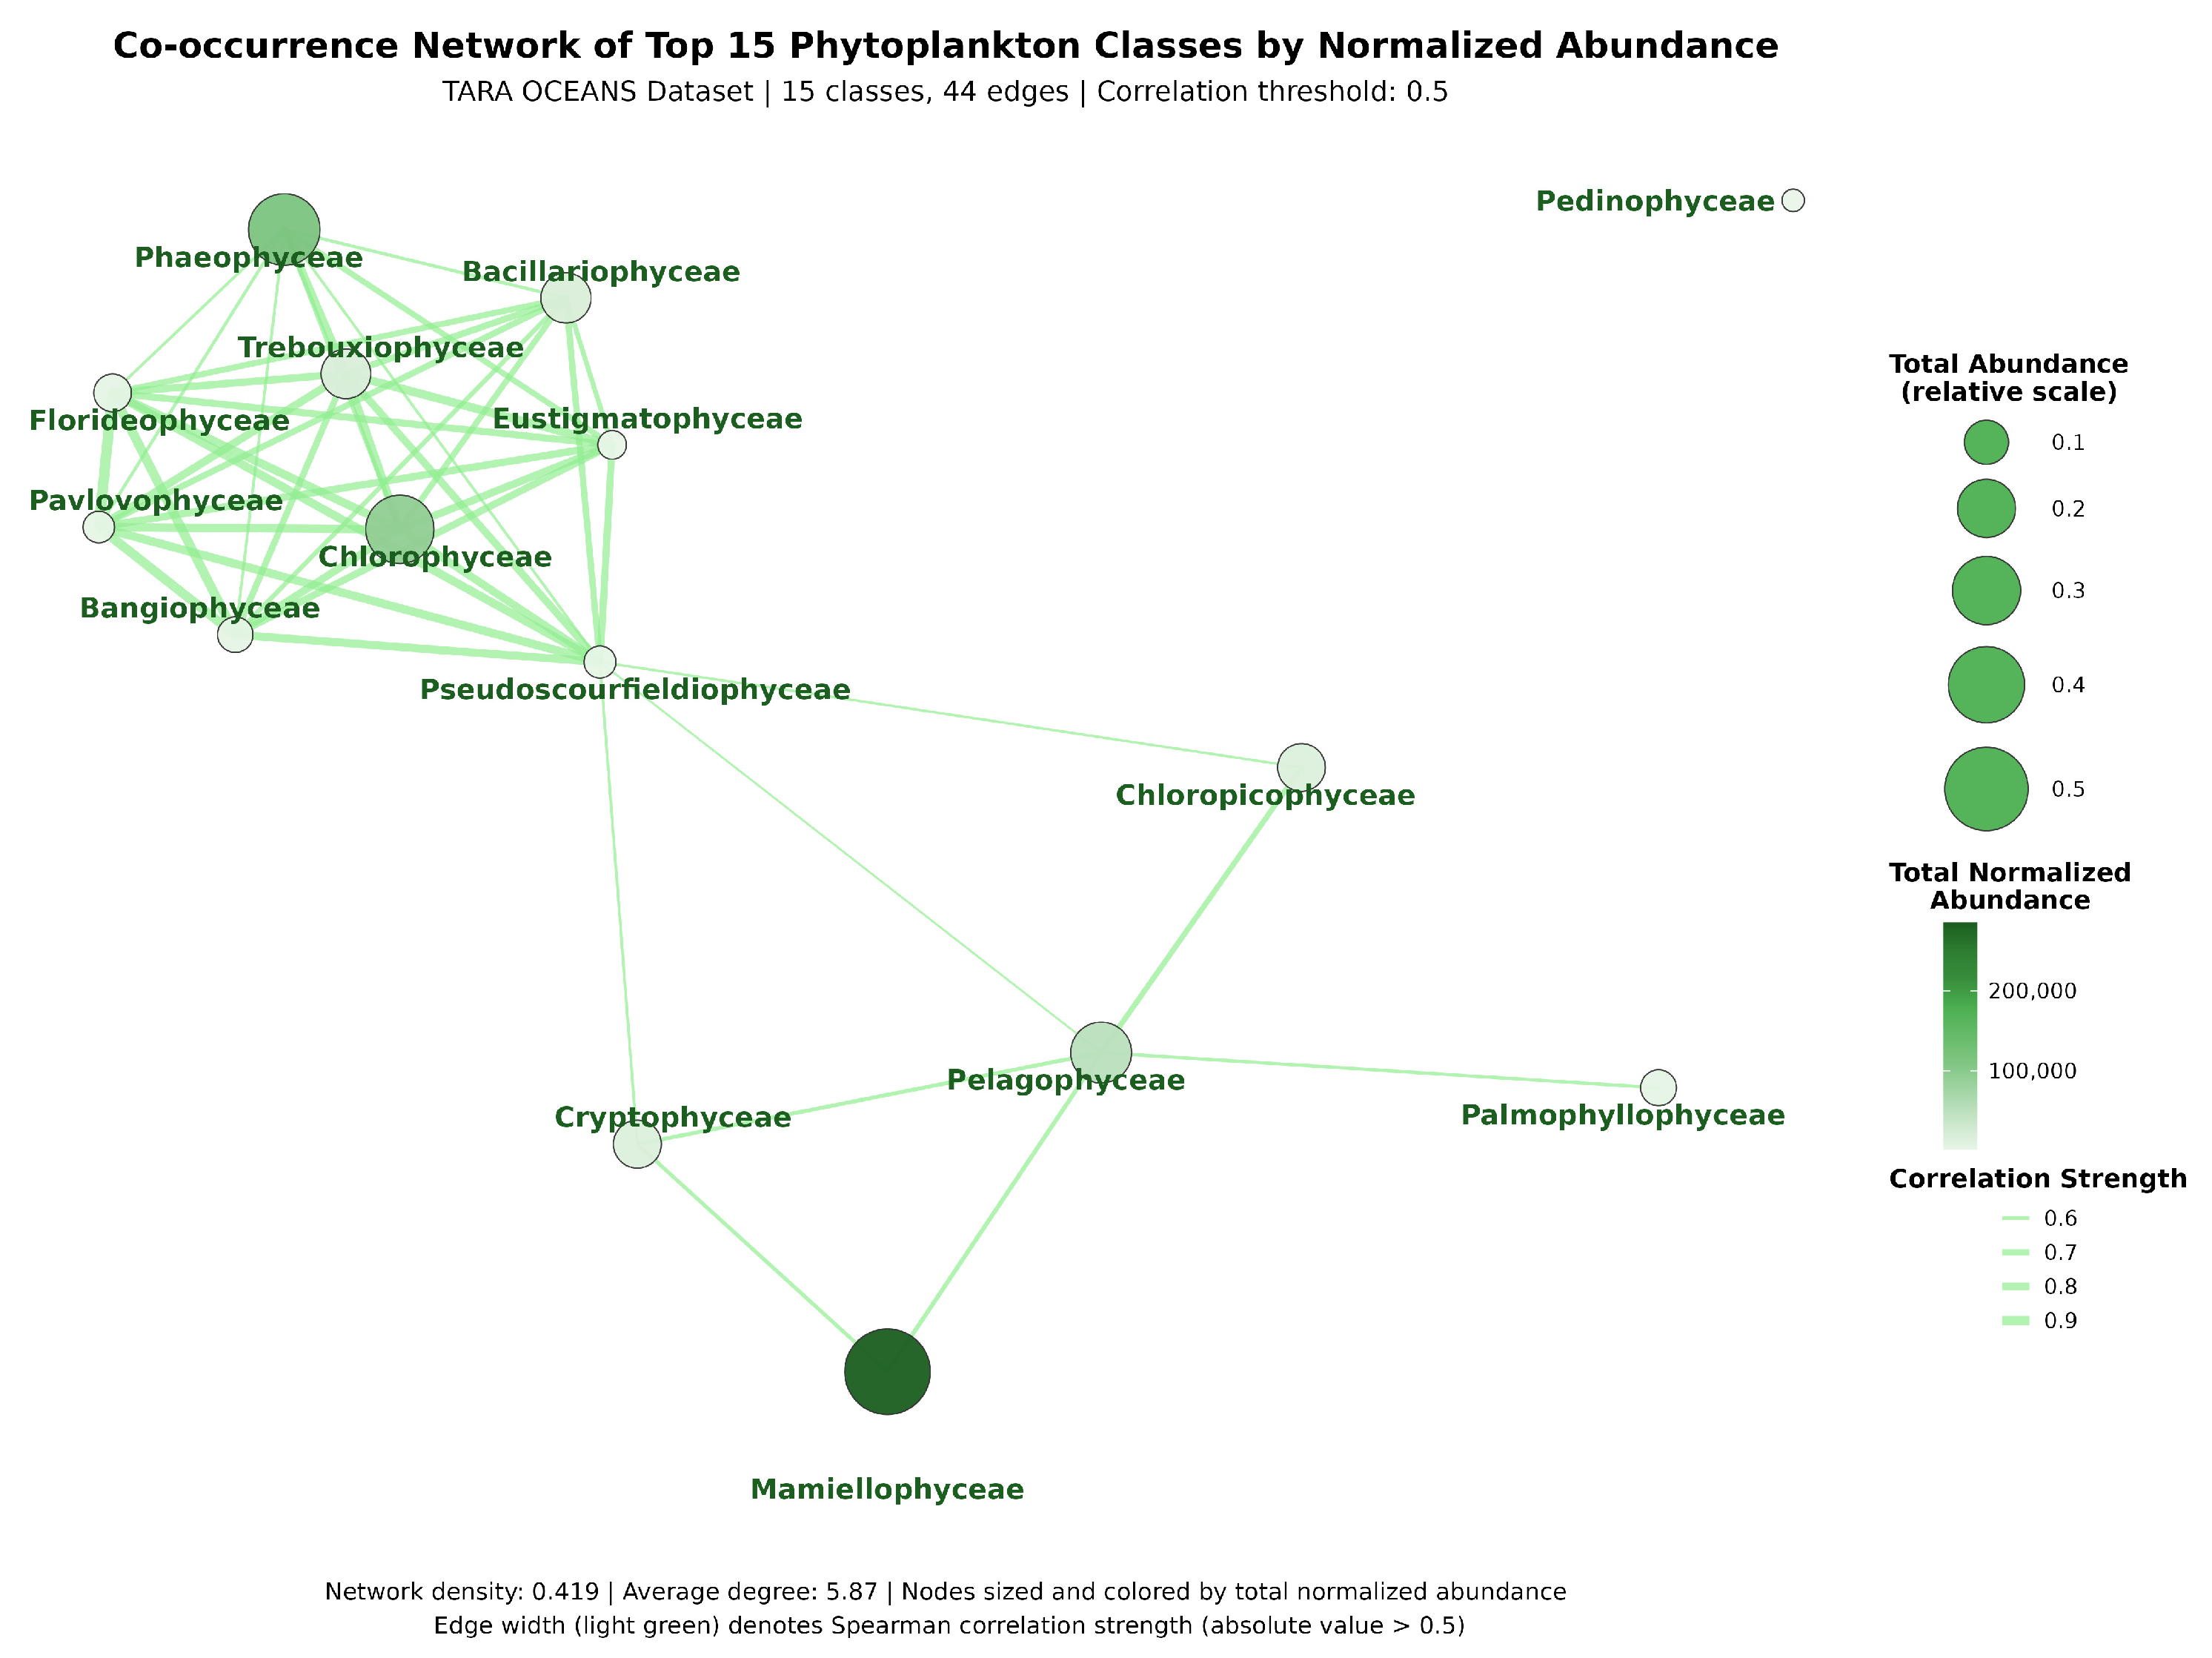
The co-occurrence network was constructed based on Spearman correlations. The network exhibited a density of 0.290, indicating that approximately 29% of all possible pairwise associations were statistically significant. The average degree was 6.67, suggesting that each algal class was, on average, significantly associated with 6–7 other classes. Degree distribution analysis identified Pseudoscourfieldiophyceae as the most highly connected node. Topological analysis revealed a high average clustering coefficient (0.859), indicative a highly modular structure. Based on combined degree and betweenness centrality metrics, several key hub classes were identified, including Pseudoscourfieldiophyceae, Trebouxiophyceae, Florideophyceae, and Bangiophyceae. Notably, all 80 edges in the network represented positive correlations; no significant negative correlations (ρ < −0.5) were found. The strongest co-occurrence relationships involved Pseudoscourfieldiophyceae, which exhibited correlation coefficients exceeding 0.6 with multiple classes. These strong positive associations likely reflect shared ecological niches or similar environmental requirements. Importantly, the most abundant class, Mamiellophyceae, did not function as a network hub, whereas the relatively lower abundance Pseudoscourfieldiophyceae displayed the highest connectivity. This highly modular and cooperative network structure is visualized in Figure 11.
Figure 11.
Co-occurrence network of eukaryotic algal classes.
4. Discussion
4.1. Tara Oceans Algal Communities Are Dominated by Widely Distributed Core Species
Our analysis identified 230 eukaryotic algal species, a number substantially lower than richness estimates reported by 18S rRNA metabarcoding surveys from the Tara Oceans project, which typically recover orders of magnitude more operational taxonomic units. This discrepancy primarily reflects the current limitation in the availability of high-quality reference genomes for eukaryotic algae and represents an inherent reference bias of genome-resolved metagenomic approaches. Accordingly, the diversity patterns described in this study should be interpreted as representing the genomically characterized fraction of global eukaryotic algal diversity, rather than the full biological diversity present in marine ecosystems. Many rare, regionally restricted, or yet-unsequenced algal lineages are likely absent from the current database and therefore undetectable by our approach.
This study reveals a global algal community pattern characterized by the coexistence of widely distributed core species and regionally restricted taxa. Although core species accounted for more than half of the detected taxa, their ecological roles and performance varied substantially across ocean basins. Notably, several macroalgal species, including Nereocystis luetkeana (96.0%) and Macrocystis pyrifera (95.7%) were identified as core species. To exclude potential cross-mapping artifacts, we validated the species specificity of SOGs from these prevalent macroalgae by cross-mapping them against a custom database of 20 non-target brown algal genomes, confirming their high specificity (Section 3.1). The frequent detection of these large, presumably sessile macroalgae in pelagic metagenomic samples is highly likely due to the widespread dispersal of their spores, gametes, thallus fragments, or eDNA, rather than the global distribution of adult individuals [33,34,35,36]. Despite the ubiquity of core species, global algal communities did not exhibit taxonomic homogenization. Instead, species richness showed only a weak positive correlation with total community abundance at the global scale. This suggests that environmental conditions promoting high biomass or productivity do not necessarily support high species diversity, and that community composition may play a more critical role in regulating ecosystem function than species richness alone [37].
The North Pacific exhibited the highest species richness but the lowest overall abundance, whereas the Arctic Ocean presented a pattern of moderate diversity coupled with extremely high biomass, driven by the dominance of a few species such as Micromonas sp. ASP10-01a. This suggests that in high-latitude, seasonally extreme environments favor a small number of highly specialized taxa with rapid growth rates and strong environmental tolerance, capable of sustaining high biomass through episodic bloom events [38,39]. In contrast, temperate and tropical oceans appear to rely more heavily on species complementarity and stable coexistence to maintain ecosystem functioning [40].
An additional notable pattern was the significantly higher average species richness observed in Southern Hemisphere oceans compared to the Northern Hemisphere. This asymmetry may reflect greater oceanic connectivity, reduced continental fragmentation, distinct historical climate dynamics, and potentially stronger anthropogenic pressures and terrestrial inputs affecting Northern Hemisphere coastal systems [40,41,42].
4.2. Multi-Scale Environmental Filtering and Hierarchy of Driving Factors
RDA revealed a significant constraining effect of environmental variables on eukaryotic algal community structure (Figure 7, Table 1). Latitude emerged as the dominant driver at the macro scale, effectively acting as a composite proxy for multiple climatic factors, including temperature and light availability. Its strong explanatory power underscores the role of climate zones as the fundamental framework shaping the global distribution of marine primary producers [43]. Fe ranked as the fourth most influential factor, exceeding the importance of traditionally emphasized macronutrients, such as NO3 and PO4. This finding provides metagenomic evidence for the central regulatory role of iron limitation in High Nutrient Low Chlorophyll regions and global algal community assembly [44]. The aligned negative effects of iron and latitude in high-latitude oceans further highlight the pervasive iron limitation pressure on algal communities in these regions [45]. In contrast, the direct contributions of macronutrients (nitrate, phosphate, silicate) in the RDA were relatively weak. Both nitrate and phosphate exhibited high Variance Inflation Factors > 4.75, suggesting that their individual effects may be masked by tight coupling with other environmental variables.
To clarify the ecological context underlying this apparent “weak signal” and to better resolve the mechanisms driving regional differentiation, we further examined the interrelationships among key environmental factors and their spatial heterogeneity (Figure 9). Strong positive correlations among nutrient factors (nitrate-phosphate, r = 0.858; nitrate-silicate, r = 0.745) not only align with Redfield stoichiometric expectations but also suggest widespread nitrogen-phosphorus co-limiting across many regions [46]. This coupling likely arises from fixed elemental uptake ratios in phytoplankton [47], stoichiometric constraints during microbial nutrient regeneration, and the homogenizing influence of large-scale ocean circulation. Temperature exhibited strong negative correlation with nutrient concentrations, reflecting the classic oceanographic contrast between warm, stratified, nutrient-poor waters and cold, well-mixed, nutrient-rich environments [2], indirectly regulating algal community structure. In contrast, Fe displayed a distinct decoupling pattern: with extremely weak correlations with major nutrients (r < 0.11). This unique feature [48] explains the formation mechanism of High Nutrient Low Chlorophyll regions. The moderate negative correlation between iron and temperature (r = −0.307) confirms relatively higher iron availability in high-latitude oceans, consistent with the observed relative prosperity of diatoms in polar regions in this study.
It is noteworthy that while several environmental factors (e.g., nitrate, phosphate) showed statistically significant correlations with algal richness (Figure 8), their effect sizes (as indicated by Spearman’s ρ) were generally low (ρ < 0.13). In large-scale metagenomic studies with high statistical power (n = 1202), even trivial effects can achieve statistical significance. Therefore, we interpret these weak correlations with caution and focus our ecological inferences on factors with both statistical significance and non-negligible effect sizes (e.g., Fe, ρ = −0.204; latitude and temperature in RDA). This approach helps avoid overinterpreting statistically significant but ecologically marginal relationships.
4.3. Heterogeneity in Regional Environmental Driving Patterns and Their Underlying Causes
Mantel test analyses revealed pronounced spatial heterogeneity in the environmental drivers shaping eukaryotic algal community structure, with dominant factors differing markedly among ocean basins and closely linked to basin-specific oceanographic processes. When interpreting these results, we considered both statistical significance and effect size (Mantel’s r). For instance, in the North and South Atlantic, salinity showed statistically significant but weak correlations (r = 0.056 and 0.072, respectively), indicating limited explanatory power, whereas temperature in the Indian Ocean exhibited a relatively stronger effect (r = 0.193). The following discussion therefore focuses on drivers that combine statistical significance with appreciable effect sizes.
The North Pacific exhibited a clear multi-factor synergistic driving pattern, with silicate emerging as the strongest driver. This finding likely reflects the substantial silicon input from the Asian continent into the Northwest Pacific, which profoundly influences regional phytoplankton dynamics [49]. In contrast, both the North and South Atlantic displayed a consistent temperature-salinity-Fe dominant pattern, where these factors were the primary significant drivers while nutrients showed no significant effects. This uniformity likely arises from the strong homogenizing influence of the Atlantic Meridional Overturning Circulation, which integrates thermohaline properties across latitudes and hemispheres, thereby making large-scale water mass structure a dominant environmental filter [50]. Polar oceans presented a distinct “null result” in Mantel tests, with none of the examined environmental variables showing significant correlations with community structure. This pattern does not imply a lack of ecological control but may be attributed to several interrelated factors: (1) reduced environmental gradients and smaller sample sizes—particularly in the Southern Ocean—which limit statistical power; (2) the extreme dominance of a few taxa (e.g., Micromonas in the Arctic) that may overwhelm community-level signals and reduce the sensitivity of β-diversity metrics to environmental gradients; and (3) the possibility that algal responses in polar ecosystems are nonlinear or threshold-driven, which linear correlation-based tests such as the Mantel test may fail to capture. Moreover, the relative environmental homogeneity in polar regions may weaken filtering effects, while unmeasured polar-specific factors, strong currents, and physical barriers (e.g., ice cover) may constrain dispersal, causing local community composition to be more influenced by stochastic events—such as episodic species introduction or loss—than by deterministic environmental filtering [51]. Despite the community-level statistical insensitivity, species-level responses and established physiological evidence continue to support the roles of temperature and iron availability as key regulators of dominant polar algae.
4.4. Specific Environmental Responses, Niche Differentiation, and Regional Dominance Patterns in Eukaryotic Algae
Region-specific environmental filtering imposes strong selective pressures on algal groups, driving pronounced niche differentiated and ultimately shaping basin-specific dominance patterns (Figure 6 and Figure 10). In the Arctic Ocean, the cold-adapted Mamiellophyceae, whose abundance is negatively correlated with temperature, achieved overwhelming dominance [52]. In particular, Micromonas sp. ASP10-01a, likely reflecting specialized membrane lipid composition and cold adaptation mechanisms. The warm-low iron preference group, represented by Chloropicophyceae, exhibited positive correlations with temperature and strong negative correlation with Fe, maintaining competitive advantage through efficient low-iron adaptation mechanisms [53,54]. As a result, Chloropicophyceae is relatively favored but not dominant in oligotrophic tropical and subtropical oceans, while remaining extremely rare in polar regions. In contrast, the nutrient-responsive type, represented by Pelagophyceae, showed strong positive correlations with N, P, and Si, indicates high nutrient requirements [55,56], and adapting to stratified oligotrophic but relatively stable nutrient waters. Its extremely low abundance in the Arctic Ocean may result from a mismatch between its high nutrient demands and the strong iron limitation characteristic of polar environment. Phaeophyceae exhibited near-global ubiquity (99.42%), yet its abundance dominance—particularly in the North Pacific and Southern Ocean—was highly environment-dependent. Brown algal abundance showed no significant correlation with temperature, nitrate, or silicate, suggesting that its competitive advantage is not directly temperature-driven but may instead be regulated by salinity structure [57], phosphorus availability, and iron limitation status.
Notably, Bacillariophyceae exhibited only a weak correlation with silicate concentration, seemingly contradicting the traditional view that silicon is the primary limiting factor for diatoms. Moreover, its global contribution to abundance (2.73%) was disproportionately low relative to its high ubiquity (94.55%). This pattern highlights the complexity of the marine silicon cycle and diatom ecological strategies at the global scale [58,59]. Much of the conventional understanding of silicon limitation derives from short-term bloom observations or region-specific studies (e.g., the Indian Sundarbans ecoregion) [60]. In contrast, our analysis captures steady-state spatial patterns, indicating that diatoms are often widespread but rarely persistently dominant across vast oceanic regions. Species- and basin-level analyses further refine this interpretation. Diatoms dominate and high biomass contributions appear to depend strongly on local, transient hydrological disturbance such as upwelling events [61], or spring stratification [45]. For example, Fragilariopsis cylindrus, a species adapted to the high-nutrient (particularly NO3 and Si [62]) and low-temperature conditions of the Southern Ocean, emerged as a dominant taxon exclusively in that basin. Conversely, in the Arctic Ocean, Bacillariophyceae did not rank among the top three classes by abundance, and F. cylindrus was absent from dominant species lists in other basins (Figure 6). This suggests that under the combined constrains of polar environments—particularly strong iron limitation—diatoms may be competitively disadvantaged relative to taxa such as Micromonas. Taken together, these findings do not negate the importance of silicon for diatoms. Rather, they indicate that silicate may not be the primary determinant of diatom presence at the global biogeographic scale; it likely functions as a critical regulatory switch that controls when and where diatoms can bloom and temporarily dominate marine phytoplankton communities [63].
Supplementary Materials
The following supporting information can be downloaded at: https://www.mdpi.com/article/10.3390/d18020110/s1, Table S1: A class-level taxonomic list detailing the number of genera and species analyzed in this study.
Author Contributions
Conceptualization, S.W. and M.W.; methodology, S.W. and X.X.; validation, X.X.; formal analysis, X.X.; investigation, S.W. and X.X.; resources, X.X.; writing—original draft preparation, X.X.; writing—review and editing, X.X., M.W. and S.W.; data curation, X.X.; supervision, S.W., M.W.; project administration, S.W. and M.W.; funding acquisition, S.W. All authors have read and agreed to the published version of the manuscript.
Funding
This research was funded by the National Natural Science Foundation of China, grant number 61601332; and the Central Government Funds for Guiding Local Scientific and Technological Development, grant number 2025ZY01039.
Institutional Review Board Statement
Not applicable.
Data Availability Statement
The EukAlgae-T database generated in this study is publicly available at https://github.com/WZU-BING/EukAlgae-T, accessed on 30 January 2026. All other relevant data are available from the corresponding authors upon reasonable request.
Acknowledgments
We thank Xiuping Su (Shaoxing Institute of Technology) for their valuable suggestions and assistance with this manuscript.
Conflicts of Interest
The authors declare no conflicts of interest.
Abbreviations
The following abbreviations are used in this manuscript:
| EukAlgae-T | Eukaryotic Algae Taxonomic database |
| Fe | Iron concentration |
| SOGs | Single-copy Orthologous Genes |
| RDA | Redundancy Analysis |
References
- Litchman, E.; Pinto, P.T.; Edwards, K.; Klausmeier, C.; Kremer, C.T.; Thomas, M.K. Global biogeochemical impacts of phytoplankton: A trait-based perspective. J. Ecol. 2015, 103, 1384–1396. [Google Scholar] [CrossRef] [Scilit]
- Hutchins, D.A.; Tagliabue, A. Feedbacks between phytoplankton and nutrient cycles in a warming ocean. Nat. Geosci. 2024, 17, 495–502. [Google Scholar] [CrossRef] [Scilit]
- Rosaldo-Benitez, V.; Ayil-Chan, G.A.; Labrín-Sotomayor, N.; Valdéz-Ojeda, R.; Pea-Ramírez, Y.J. Eukaryotic Microalgae Communities from Tropical Karstic Freshwater Lagoons in an Anthropic Disturbance Gradient Microscopic and Metagenomic Analysis. Microorganisms 2024, 12, 2368. [Google Scholar] [CrossRef] [Scilit]
- Lin, J.; Wang, H.; Chen, J.; Li, Y. Inter-algal associations and nutrients linked by Scenedesmus and Desmodesmus structure eukaryotic algal communities. Mol. Ecol. 2024, 33, e17528. [Google Scholar] [CrossRef] [Scilit]
- Mccormick, P.V.; Cairns, J. Algae as indicators of environmental change. J. Appl. Phycol. 1994, 6, 509–526. [Google Scholar] [CrossRef] [Scilit]
- Liu, X.; Xie, N.; Bai, M.; Li, J.; Wang, G. Composition change and decreased diversity of microbial eukaryotes in the coastal upwelling waters of South China Sea. Sci. Total Environ. 2021, 795, 148892. [Google Scholar] [CrossRef] [Scilit]
- Wei, L.; Su, K.; Zhu, S.; Yin, H.; Li, Z.; Chen, Z.; Li, M. Identification of microalgae by hyperspectral microscopic imaging system. Spectrosc. Lett. 2017, 50, 59–63. [Google Scholar] [CrossRef] [Scilit]
- Pan, K.; Luan, X.; Li, B.; Yu, H.; Wu, J.; Li, S.; Li, Q. Quasi-3D Fluorescence Spectroscopy for Rapid On-Site Algae Species Analysis. IEEE Sens. J. 2025, 25, 36051–36058. [Google Scholar] [CrossRef] [Scilit]
- Liu, R.; Cui, B.; Dong, W.; Fang, X.; Xiao, Y.; Zhao, X.; Cui, T.; Ma, Y.; Wang, Q. A refined deep-learning-based algorithm for harmful-algal-bloom remote-sensing recognition using Noctiluca scintillans algal bloom as an example. J. Hazard. Mater. 2024, 467, 133721. [Google Scholar] [CrossRef] [Scilit]
- Zhu, H.; Li, S.; Hu, Z.; Liu, G. Molecular characterization of eukaryotic algal communities in the tropical phyllosphere based on real-time sequencing of the 18S rDNA gene. BMC Plant Biol. 2018, 18, 365. [Google Scholar] [CrossRef] [Scilit] [PubMed]
- Banos, S.; Lentendu, G.; Kopf, A.; Wubet, T.; Glöckner, F.O.; Reich, M. A comprehensive fungi-specific 18S rRNA gene sequence primer toolkit suited for diverse research issues and sequencing platforms. BMC Microbiol. 2018, 18, 263. [Google Scholar] [CrossRef] [Scilit]
- Cuesta, E.B.; Coulibaly, B.; Bukhari, T.; Eiglmeier, K.; Riehle, M.M. Comprehensive Ecological and Geographic Characterization of Eukaryotic and Prokaryotic Microbiomes in African Anopheles. Front. Microbiol. 2021, 12, 635772. [Google Scholar] [CrossRef] [Scilit] [PubMed]
- Gong, W.; Marchetti, A. Estimation of 18S gene copy number in marine eukaryotic plankton using a next-generation sequencing approach. Front. Mar. Sci. 2019, 6, 219. [Google Scholar] [CrossRef] [Scilit]
- Latz, M.A.; Andersson, A.; Brugel, S.; Hedblom, M.; Jurdzinski, K.T.; Karlson, B.; Lindh, M.; Lycken, J.; Torstensson, A.; Andersson, A.F. A comprehensive dataset on spatiotemporal variation of microbial plankton communities in the Baltic Sea. Sci. Data 2024, 11, 18. [Google Scholar] [CrossRef] [Scilit]
- Remias, D.; Procházková, L.; Nedbalová, L.; Benning, L.G.; Lutz, S. Novel insights in cryptic diversity of snow and glacier ice algae communities combining 18S rRNA gene and ITS2 amplicon sequencing. FEMS Microbiol. Ecol. 2023, 99, fiad134. [Google Scholar] [CrossRef] [Scilit]
- Ahrendt, S.R.; Quandt, C.A.; Ciobanu, D.; Clum, A.; Salamov, A.; Andreopoulos, B.; Cheng, J.-F.; Woyke, T.; Pelin, A.; Henrissat, B.; et al. Leveraging single-cell genomics to expand the fungal tree of life. Nat. Microbiol. 2018, 3, 1417–1428. [Google Scholar] [CrossRef] [Scilit]
- Mende, D.R.; Sunagawa, S.; Zeller, G.; Bork, P. Accurate and universal delineation of prokaryotic species. Nat. Methods 2013, 10, 881–884. [Google Scholar] [CrossRef] [Scilit]
- Ferravante, C.; Memoli, D.; Palumbo, D.; Ciaramella, P.; Di Loria, A.; D’Agostino, Y.; Nassa, G.; Rizzo, F.; Tarallo, R.; Weisz, A.; et al. HOME-BIO (sHOtgun MEtagenomic analysis of BIOlogical entities): A specific and comprehensive pipeline for metagenomic shotgun sequencing data analysis. BMC Bioinform. 2021, 22, 106. [Google Scholar] [CrossRef] [Scilit]
- Lind, A.L.; Pollard, K.S. Accurate and sensitive detection of microbial eukaryotes from whole metagenome shotgun sequencing. Microbiome 2021, 9, 103. [Google Scholar] [CrossRef] [Scilit]
- Marcelino, V.R.; Clausen, P.T.L.C.; Buchmann, J.P.; Wille, M.; Iredell, J.R.; Meyer, W.; Lund, O.; Sorrell, T.C.; Holmes, E.C. CCMetagen: Comprehensive and accurate identification of eukaryotes and prokaryotes in metagenomic data. Genome Biol. 2020, 21, 34. [Google Scholar] [CrossRef] [Scilit] [PubMed]
- Baweja, P.; Sahoo, D. Classification of Algae. In The Algae World; Sahoo, D., Seckbach, J., Eds.; Springer: Dordrecht, The Netherlands, 2015; pp. 31–55. [Google Scholar]
- Manni, M.; Berkeley, M.R.; Seppey, M.; Simão, F.A.; Zdobnov, E.M. BUSCO Update: Novel and Streamlined Workflows along with Broader and Deeper Phylogenetic Coverage for Scoring of Eukaryotic, Prokaryotic, and Viral Genomes. Mol. Biol. Evol. 2021, 38, 4647–4654. [Google Scholar] [CrossRef] [Scilit]
- Sánchez, P.; Coutinho, F.H.; Sebastián, M.; Pernice, M.C.; Rodríguez-Martínez, R.; Salazar, G.; Cornejo-Castillo, F.M.; Pesant, S.; López-Alforja, X.; López-García, E.M.; et al. Marine picoplankton metagenomes and MAGs from eleven vertical profiles obtained by the Malaspina Expedition. Sci. Data 2024, 11, 154. [Google Scholar] [CrossRef] [Scilit]
- Xie, Z.; Manichanh, C. FunOMIC: Pipeline with built-in fungal taxonomic and functional databases for human mycobiome profiling. Comput. Struct. Biotechnol. J. 2022, 20, 3685–3694. [Google Scholar] [CrossRef] [Scilit]
- Huang, W.; Li, L.; Myers, J.R.; Marth, G.T. ART: A next-generation sequencing read simulator. Bioinformatics 2012, 28, 593–594. [Google Scholar] [CrossRef] [Scilit]
- Wang, J.; Deng, Y.; Chen, W.; Song, H.; Zan, F.; Wu, X.; Ren, Y. Revealing the Role of Algae in Algae Enhanced Bacteria Consortia for Municipal Wastewater Treatment: Performance, Characteristics, and Microbial Pathways. J. Water Process Eng. 2023, 53, 103640. [Google Scholar] [CrossRef] [Scilit]
- Sunagawa, S.; Acinas, S.G.; Bork, P.; Bowler, C.; Tara Oceans Coordinators; Eveillard, D.; Gorsky, G.; Guidi, L.; Iudicone, D.; Karsenti, E.; et al. Tara Oceans: Towards global ocean ecosystems biology. Nat. Rev. Microbiol. 2020, 18, 428–445. [Google Scholar] [CrossRef] [Scilit]
- Qin, J.; Li, R.; Raes, J.; Arumugam, M.; Burgdorf, K.S.; Manichanh, C.; Nielsen, T.; Pons, N.; Levenez, F.; Yamada, T.; et al. A human gut microbial gene catalogue established by metagenomic sequencing. Nature 2010, 464, 59–65. [Google Scholar] [CrossRef] [Scilit] [PubMed]
- Milanese, A.; Mende, D.R.; Paoli, L.; Salazar, G.; Ruscheweyh, H.J.; Cuenca, M.; Hingamp, P.; Alves, R.; Costea, P.I.; Coelho, L.P. Microbial abundance, activity and population genomic profiling with mOTUs2. Nat. Commun. 2019, 10, 1014. [Google Scholar] [CrossRef] [Scilit] [PubMed]
- Neu, A.T.; Allen, E.E.; Roy, K. Defining and quantifying the core microbiome: Challenges and prospects. Proc. Natl. Acad. Sci. USA 2021, 118, e2104429118. [Google Scholar] [CrossRef] [Scilit]
- Reygondeau, G.; Longhurst, A.; Martinez, E.; Beaugrand, G.; Maury, O. Dynamic biogeochemical provinces in the global ocean. Glob. Biogeochem. Cycles 2013, 27, 1046–1058. [Google Scholar] [CrossRef] [Scilit]
- Lima-Mendez, G.; Faust, K.; Henry, N.; Decelle, J.; Iudicone, D. Ocean plankton. Determinants of community structure in the global plankton interactome. Science 2015, 348, 1262073. [Google Scholar] [CrossRef] [Scilit]
- Amsler, C.D.; Neushul, M. Photosynthetic physiology and chemical composition of spores of the kelps Macrocystis pyrifera, Nereocystis luetkeana, Laminaria farlowii, and Pterygophora californica (Phaeophyceae). J. Phycol. 1991, 27, 26–34. [Google Scholar] [CrossRef] [Scilit]
- Coyer, J.A.; Robertson, D.L.; Alberte, R.S. Genetic variability and parentage in Macrocystis pyrifera (Phaeophyceae) using multi-locus DNA fingerprinting. J. Phycol. 1995, 31, 819–823. [Google Scholar] [CrossRef] [Scilit]
- Michelou, V.K.; Caporaso, J.G.; Knight, R.; Palumbi, S.R. The Ecology of Microbial Communities Associated with Macrocystis pyrifera. PLoS ONE 2013, 8, e67480. [Google Scholar] [CrossRef] [Scilit]
- Lin, J.D.; Lemay, M.A.; Parfrey, L.W. Diverse Bacteria Utilize Alginate Within the Microbiome of the Giant Kelp Macrocystis pyrifera. Front. Microbiol. 2018, 9, 1914. [Google Scholar] [CrossRef] [Scilit]
- Bowker, M.A.; Rengifo-Faiffer, M.C.; Antoninka, A.J.; Grover, H.S.; Coe, K.K.; Fisher, K.; Mishler, B.D.; Oliver, M.; Stark, L.R. Community composition influences ecosystem resistance and production more than species richness or intraspecific diversity. Oikos 2021, 130, 1915–1928. [Google Scholar] [CrossRef] [Scilit]
- Belevich, T.A.; Milyutina, I.A.; Abyzova, G.A.; Troitsky, A.V. The pico-sized Mamiellophyceae and a novel Bathycoccus clade from the summer plankton of Russian Arctic Seas and adjacent waters. FEMS Microbiol. Ecol. 2020, 97, fiaa251. [Google Scholar] [CrossRef] [Scilit] [PubMed]
- Metfies, K.; von Appen, W.-J.; Kilias, E.; Nicolaus, A.; Nöthig, E.-M. Biogeography and Photosynthetic Biomass of Arctic Marine Pico-Eukaroytes during Summer of the Record Sea Ice Minimum 2012. PLoS ONE 2016, 11, e0148512. [Google Scholar] [CrossRef] [Scilit] [PubMed]
- Irigoien, X.; Huisman, J.; Harris, R.P. Global biodiversity patterns of marine phytoplankton and zooplankton. Nature 2004, 429, 863–867. [Google Scholar] [CrossRef] [Scilit]
- Chaudhary, C.; Saeedi, H.; Costello, M.J. Bimodality of Latitudinal Gradients in Marine Species Richness. Trends Ecol. Evol. 2016, 31, 670–676. [Google Scholar] [CrossRef] [Scilit]
- Hachich, N.F.; Bonsall, M.B.; Arraut, E.M.; Barneche, D.R.; Lewinsohn, T.M.; Floeter, S.R. Island biogeography: Patterns of marine shallow-water organisms in the Atlantic Ocean. J. Biogeogr. 2015, 42, 1871–1882. [Google Scholar] [CrossRef] [Scilit]
- Jonkers, L.; Hillebrand, H.; Kucera, M. Global change drives modern plankton communities away from the pre-industrial state. Nature 2019, 570, 372–375. [Google Scholar] [CrossRef] [Scilit]
- Yao, B.; Xi, B.-D.; Hu, C.-M.; Ding, J.-T.; Zhang, J.-T.; Xu, Q.-G.; Liu, H.L. A review of iron limitation on the growth and competition of phytoplankton. Ecol. Environ. 2010, 19, 459–465. [Google Scholar] [CrossRef]
- Hyun, M.J.; Choi, D.H.; Lee, H.; Won, J.; Kim, G.-U.; Lee, Y.; Jeong, J.-Y.; Ra, K.; Yang, W.; Lee, J.; et al. Phytoplankton spring succession pattern in the Yellow Sea surveyed at Socheongcho Ocean Research Station. Front. Mar. Sci. 2023, 10, 1280612. [Google Scholar] [CrossRef] [Scilit]
- Tanioka, T.; Garcia, C.A.; Larkin, A.A.; Garcia, N.S.; Fagan, A.J.; Martiny, A.C. Global patterns and predictors of C:N:P in marine ecosystems. Commun. Earth Environ. 2022, 3, 271. [Google Scholar] [CrossRef] [Scilit]
- Hillebrand, H.; Steinert, G.; Boersma, M.; Malzahn, A.; Meunier, C.L.; Plum, C.; Ptacnik, R. Goldman revisited: Faster-growing phytoplankton has lower N:P and lower stoichiometric flexibility. Limnol. Oceanogr. 2013, 58, 2076–2088. [Google Scholar] [CrossRef] [Scilit]
- Jabre, L.; Bertrand, E.M. Interactive effects of iron and temperature on the growth of Fragilariopsis cylindrus. Limnol. Oceanogr. Lett. 2020, 5, 407–417. [Google Scholar] [CrossRef] [Scilit]
- Sun, C.; Song, Z.; Ran, X. Composition and transport of silicon in rivers of the Bohai rim with implications for the coastal environment. Sci. Total Environ. 2024, 947, 174544. [Google Scholar] [CrossRef] [Scilit]
- Bagatinsky, V.A.; Diansky, N.A. Contributions of Climate Changes in Temperature and Salinity to the Formation of North Atlantic Thermohaline Circulation Trends in 1951–2017. Mosc. Univ. Phys. Bull. 2022, 77, 315–323. [Google Scholar] [CrossRef] [Scilit]
- Mccoy, D.; Bianchi, D.; Stewart, A.L. Global observations of submesoscale coherent vortices in the ocean. Prog. Oceanogr. 2020, 189, 102452. [Google Scholar] [CrossRef] [Scilit]
- Milyutina, I.A.; Belevich, T.A.; Ilyash, L.V.; Troitsky, A.V. Insight into picophytoplankton diversity of the subarctic White Sea—The first recording of Pedinophyceae in environmental DNA. Microbiol. Open 2019, 8, e892. [Google Scholar] [CrossRef] [Scilit] [PubMed]
- Ebenezer, V.; Hu, Y.; Carnicer, O.; Irwin, A.J.; Follows, M.J.; Finkel, Z.V. Elemental and macromolecular composition of the marine Chloropicophyceae, a major group of oceanic photosynthetic picoeukaryotes. Limnol. Oceanogr. 2022, 67, 2297–2310. [Google Scholar] [CrossRef] [Scilit]
- Tagliabue, A.; Bowie, A.R.; Boyd, P.W.; Buck, K.N.; Johnson, K.S.; Saito, M.A. The integral role of iron in ocean biogeochemistry. Nature 2017, 543, 51–59. [Google Scholar] [CrossRef] [Scilit] [PubMed]
- Cui, L.; Lu, X.; Dong, Y.; Cen, J.; Cao, R.; Pan, L.; Lu, S.; Ou, L. Relationship between phytoplankton community succession and environmental parameters in Qinhuangdao coastal areas, China: A region with recurrent brown tide outbreaks. Ecotoxicol. Environ. Saf. 2018, 159, 85–93. [Google Scholar] [CrossRef] [Scilit]
- Qiao, L.; Yu, J.; Li, Y.; Guo, H.; Zhen, Y.; Zhang, L.; Mi, T.; Zhang, F.; Bao, Z. Succession of the Nanoplankton Community during a Brown Tide in a Scallop Culture Area in China. Ocean. Sci. J. 2019, 54, 375–392. [Google Scholar] [CrossRef] [Scilit]
- Zhang, X.; Fan, X.; Wang, Y.; Xu, D.; Zhang, J.; Ye, N. Exploring Core Response Mechanisms to Multiple Environmental Stressors Via A Genome-Wide Study in the Brown Alga Saccharina japonica (Laminariales, Phaeophyceae). J. Phycol. 2021, 57, 345–354. [Google Scholar] [CrossRef] [Scilit]
- Pujari, L.; Wu, C.; Kan, J.; Li, N.; Wang, X.; Zhang, G.; Shang, X.; Wang, M.; Zhou, C.; Sun, J. Diversity and Spatial Distribution of Chromophytic Phytoplankton in the Bay of Bengal Revealed by RuBisCO Genes (rbcL). Front. Microbiol. 2019, 10, 1501. [Google Scholar] [CrossRef] [Scilit]
- Sahina, A.; Geetanjali, D.; Karankumar, R.; Suman, N.; Wodeyar, A.; Bhusan, N.B.; Kumar, J.A.; Taterao, L.A. Spatio-temporal dynamics of phytoplankton diversity and community structure in relation to environmental variables in the Northwest Coasts of India. Arab. J. Geosci. 2024, 17, 459–465. [Google Scholar] [CrossRef] [Scilit]
- Gogoi, P.; Sinha, A.; Tayung, T.; Naskar, M.; Sarkar, S.D.; Ramteke, M.H.; Das, S.K.; Kumar, K.L.; Suresh, V.R.; Das, B.K. Unravelling the structural changes of periphyton in relation to environmental variables in a semilotic environment in the Sundarban eco-region, India. Arab. J. Geosci. 2021, 14, 2038. [Google Scholar] [CrossRef] [Scilit]
- Zhao, J.; Zhao, B.; Kong, N.; Li, M.; Li, F.; Liu, J.; Wang, L.; Song, L. Water stratification alters phytoplankton assemblages in scallop farming waters of the North Yellow Sea in China. Mar. Environ. Res. 2024, 196, 106435. [Google Scholar] [CrossRef] [Scilit]
- Sarmiento, J.L.; Gruber, N.; Brzezinski, M.A.; Dunne, J.P. High-latitude controls of thermocline nutrients and low latitude biological productivity. Nature 2004, 427, 56–60. [Google Scholar] [CrossRef] [Scilit] [PubMed]
- Kramer, S.J.; Bolaos, L.M.; Catlett, D.; Chase, A.P.; Behrenfeld, M.J.; Boss, E.S.; Crockford, E.T.; Giovannoni, S.J.; Graff, J.R.; Hantjens, N. Toward a synthesis of phytoplankton community composition methods for global-scale application. Limnol. Oceanogr. Methods 2024, 22, 217–240. [Google Scholar] [CrossRef] [Scilit]

Disclaimer/Publisher’s Note: The statements, opinions and data contained in all publications are solely those of the individual author(s) and contributor(s) and not of MDPI and/or the editor(s). MDPI and/or the editor(s) disclaim responsibility for any injury to people or property resulting from any ideas, methods, instructions or products referred to in the content. |
© 2026 by the authors. Licensee MDPI, Basel, Switzerland. This article is an open access article distributed under the terms and conditions of the Creative Commons Attribution (CC BY) license.