


Abstract
Currently, the degradation of global ecosystem services and the decline in biodiversity are pressing issues, and the conflict between ecological conservation and economic development in old industrial bases is intensifying. This study takes Liaoning Province, which exhibits a distinct ecological gradient, as its research area. By constructing a three-tier nested framework at the grid, county, and city levels, and combining spatial autocorrelation, GWR, SOM, and XGBoost-SHAP models, we assess the spatial differentiation, trade-offs and synergies, and multi-scale driving associations of five core ecosystem services. The results indicate that: ① ecosystem services exhibit a pattern characterized by “mountains in the east, water in the west, and a granary in the center, Wet mountains in the east, dry hills in the west, granary plains in the central region” with the intensity of spatial aggregation decreasing as the scale increases; ② food provisioning and regulating support services remain in a trade-off relationship, and service bundles shift from locally fine-grained differentiation to city-level functional aggregation; ③ riving associations exhibit significant scale-dependent differentiation, with factors exhibiting nonlinear thresholds and interactions. This study establishes a multi-scale analytical framework for ecosystem services in old industrial bases, providing a foundation for regional ecological restoration and coordinated development.
1. Introduction
Ecosystem services form the natural foundation upon which human society depends for its survival and development; however, their ongoing degradation has become a key bottleneck constraining global sustainable development. The Millennium Ecosystem Assessment (MA, 2005) clearly states that more than 60% of global ecosystem service resources are already being used unsustainably or are in a state of degradation, and this trend is projected to accelerate over the next half-century [1]. Subsequently, the IPBES (2019) global assessment report further confirmed that the scale of biodiversity loss and ecosystem functional decline is unprecedented, with over one million species at risk of extinction and the capacity of ecosystems to provide regulatory and provisioning services continuing to decline, directly threatening human well-being and socioeconomic sustainable development [2].
Substantial progress has been made in ecosystem service (ES) research, establishing a comprehensive framework encompassing theory, methodology, and application. Theoretically, the field has evolved from initial conceptualization and classification to exploring the coupled relationships among ecosystem structure, function, and services, and further to analyses of supply–demand balances, spatial flows, and human well-being linkages—shifting from a purely ecological perspective toward an integrated natural–social–economic systems view. Methodologically, assessment approaches have advanced from qualitative description to quantitative evaluation and from single-method to multi-method integration. Early value-based assessments (e.g., Costanza’s global valuation) and equivalent-factor methods (adapted for China by Xie Gaodi et al.) were widely applied but struggled with spatial heterogeneity [3,4]. Subsequently, mass-based assessments using specialized models such as InVEST, ARIES, and SoLVES gained prominence. Among these, InVEST has become the dominant tool for quantitative ES assessment due to its capacity to accurately quantify multiple services, adapt to multi-scale analyses, leverage readily available data, and produce spatially explicit outputs, making it widely used in regional, watershed, and urban agglomeration studies [5,6]. More recently, multi-model coupling and scenario simulation have further enhanced assessment accuracy and predictive capability [7]. On trade-offs and synergies, research has progressed from simple correlation identification to analyzing spatial differentiation, formation mechanisms, and optimization strategies, clarifying that ESs exhibit either trade-off (one service gains at another’s expense) or synergistic (simultaneous enhancement) relationships—providing crucial evidence for multifunctional ecosystem management and ecological spatial planning.
Despite these advances, three critical gaps remain. First, multi-scale effects are insufficiently understood. Although scale has become a recognized paradigm in landscape ecology, the mechanisms underlying scale effects, how ES patterns shift across spatial scales, and how scale selection influences conclusions require further investigation [8]. Second, socioecological mechanism analysis in specific regions—particularly areas with distinctive industrial histories—remains underexplored, especially regarding how long-term industrialization interacts with natural gradients to shape ES trajectories. Third, while interpretable machine learning methods such as XGBoost and SHAP are increasingly applied to ES driver analysis, these approaches remain statistical explanatory tools and cannot directly prove causality. Their results must therefore be interpreted in conjunction with regional geographic contexts, ecological processes, and socioeconomic mechanisms, avoiding the simplistic equation of model-derived importance with ecological causality.
Liaoning Province, as the core of Northeast China’s traditional industrial base, offers a compelling case to address these gaps. Its ES evolution is shaped not only by natural geographic gradients but also profoundly by decades of industrialization, land-use change, resource exploitation, and recent economic restructuring, pollution control, and ecological restoration—making it a typical region for investigating ES changes under dual pressures of natural processes and socioeconomic transformation [9].
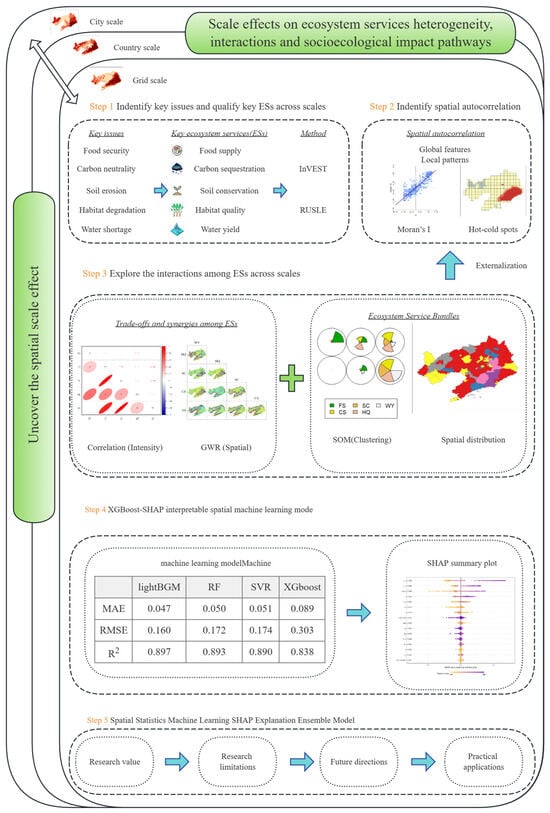
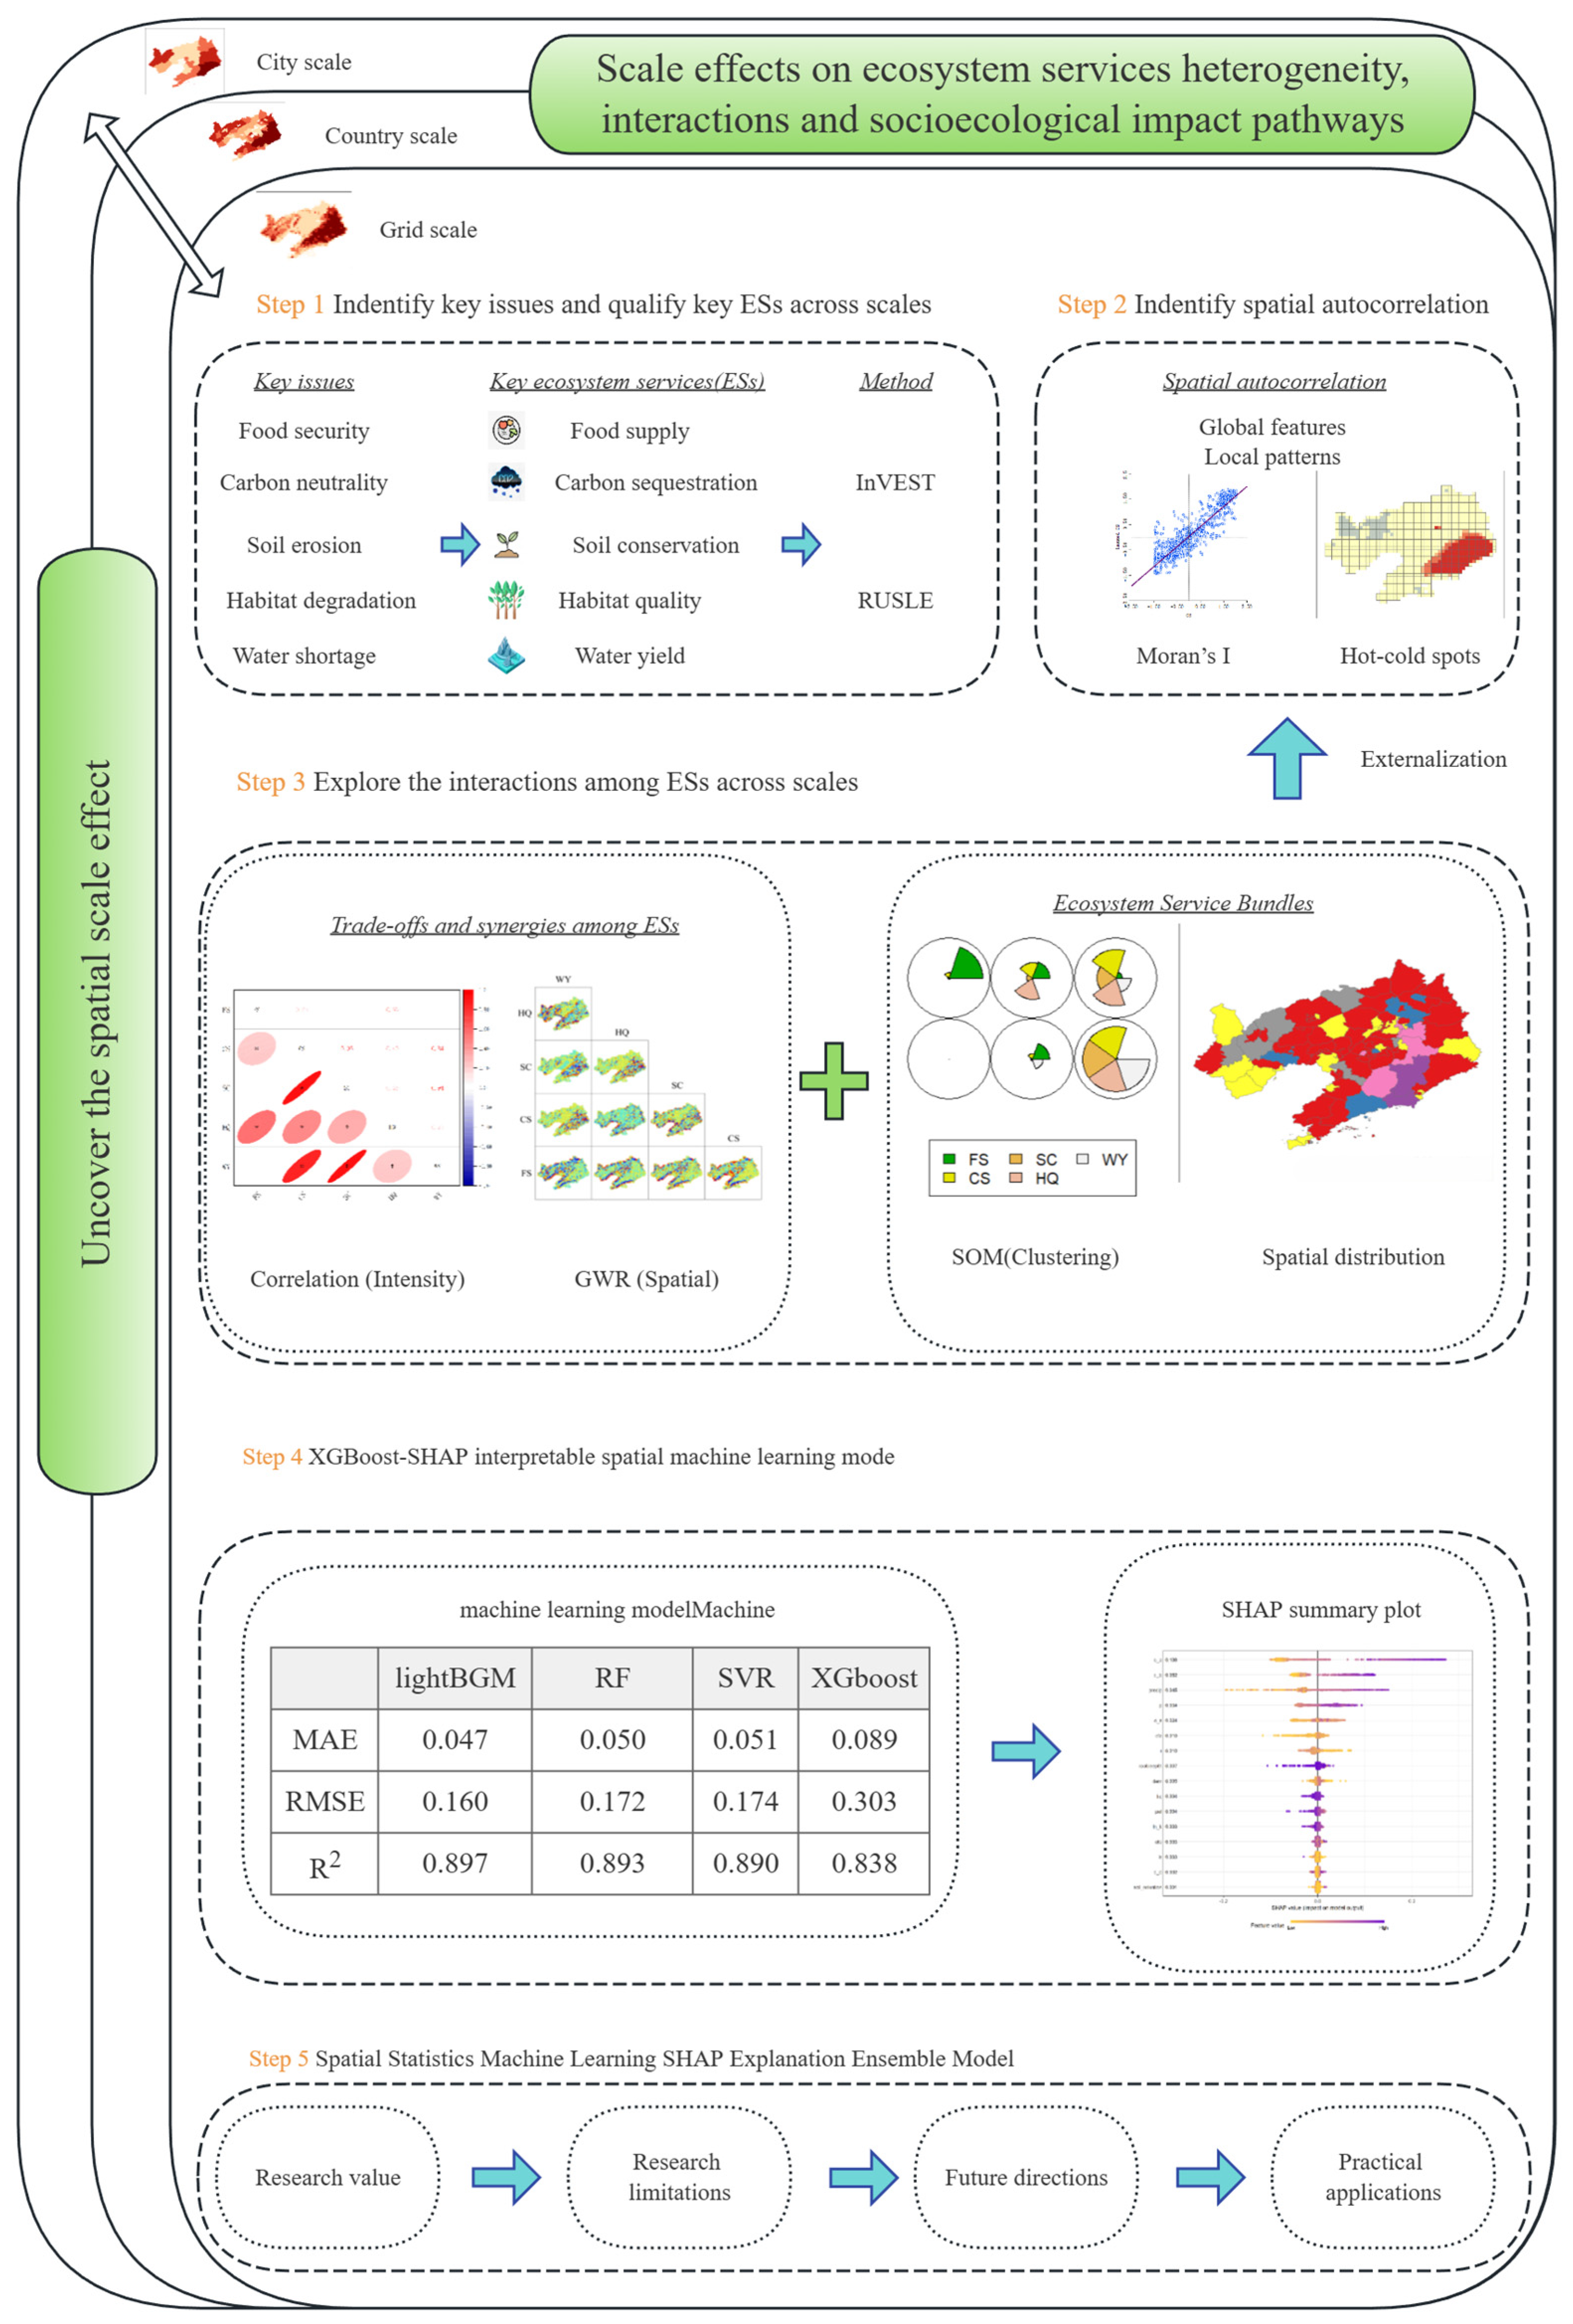
This study aims to: (1) characterize the spatial distribution, spatial autocorrelation patterns, and scale transition laws of ESs in Liaoning Province under a nested multi-scale framework; (2) reveal the spatial changes in trade-offs and synergies among ESs across different scales; and (3) identify key drivers influencing ES changes and analyze the combined driving effects and pathways at multiple scales (Figure 1). Our innovations are twofold: we overcome single-scale limitations by establishing a systematic multi-scale analytical framework that elucidates ES scale effects and cross-scale evolution patterns; and we integrate multiple analytical methods to achieve a multi-scale, multi-dimensional quantitative driver analysis, enhancing precision in understanding ES driving associations in regionally distinctive contexts. The findings will provide scientific support for synergistic optimization of multifunctional ESs, ecological conservation, and high-quality development coordination in Liaoning’s old industrial base, while offering methodological references for similar regions.
Figure 1.
Research framework.
2. Data Sources and Methods
2.1. Data Sources
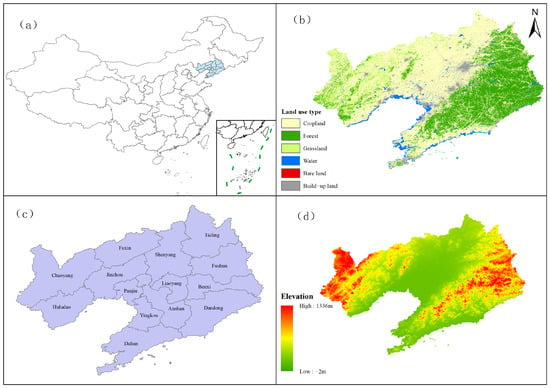
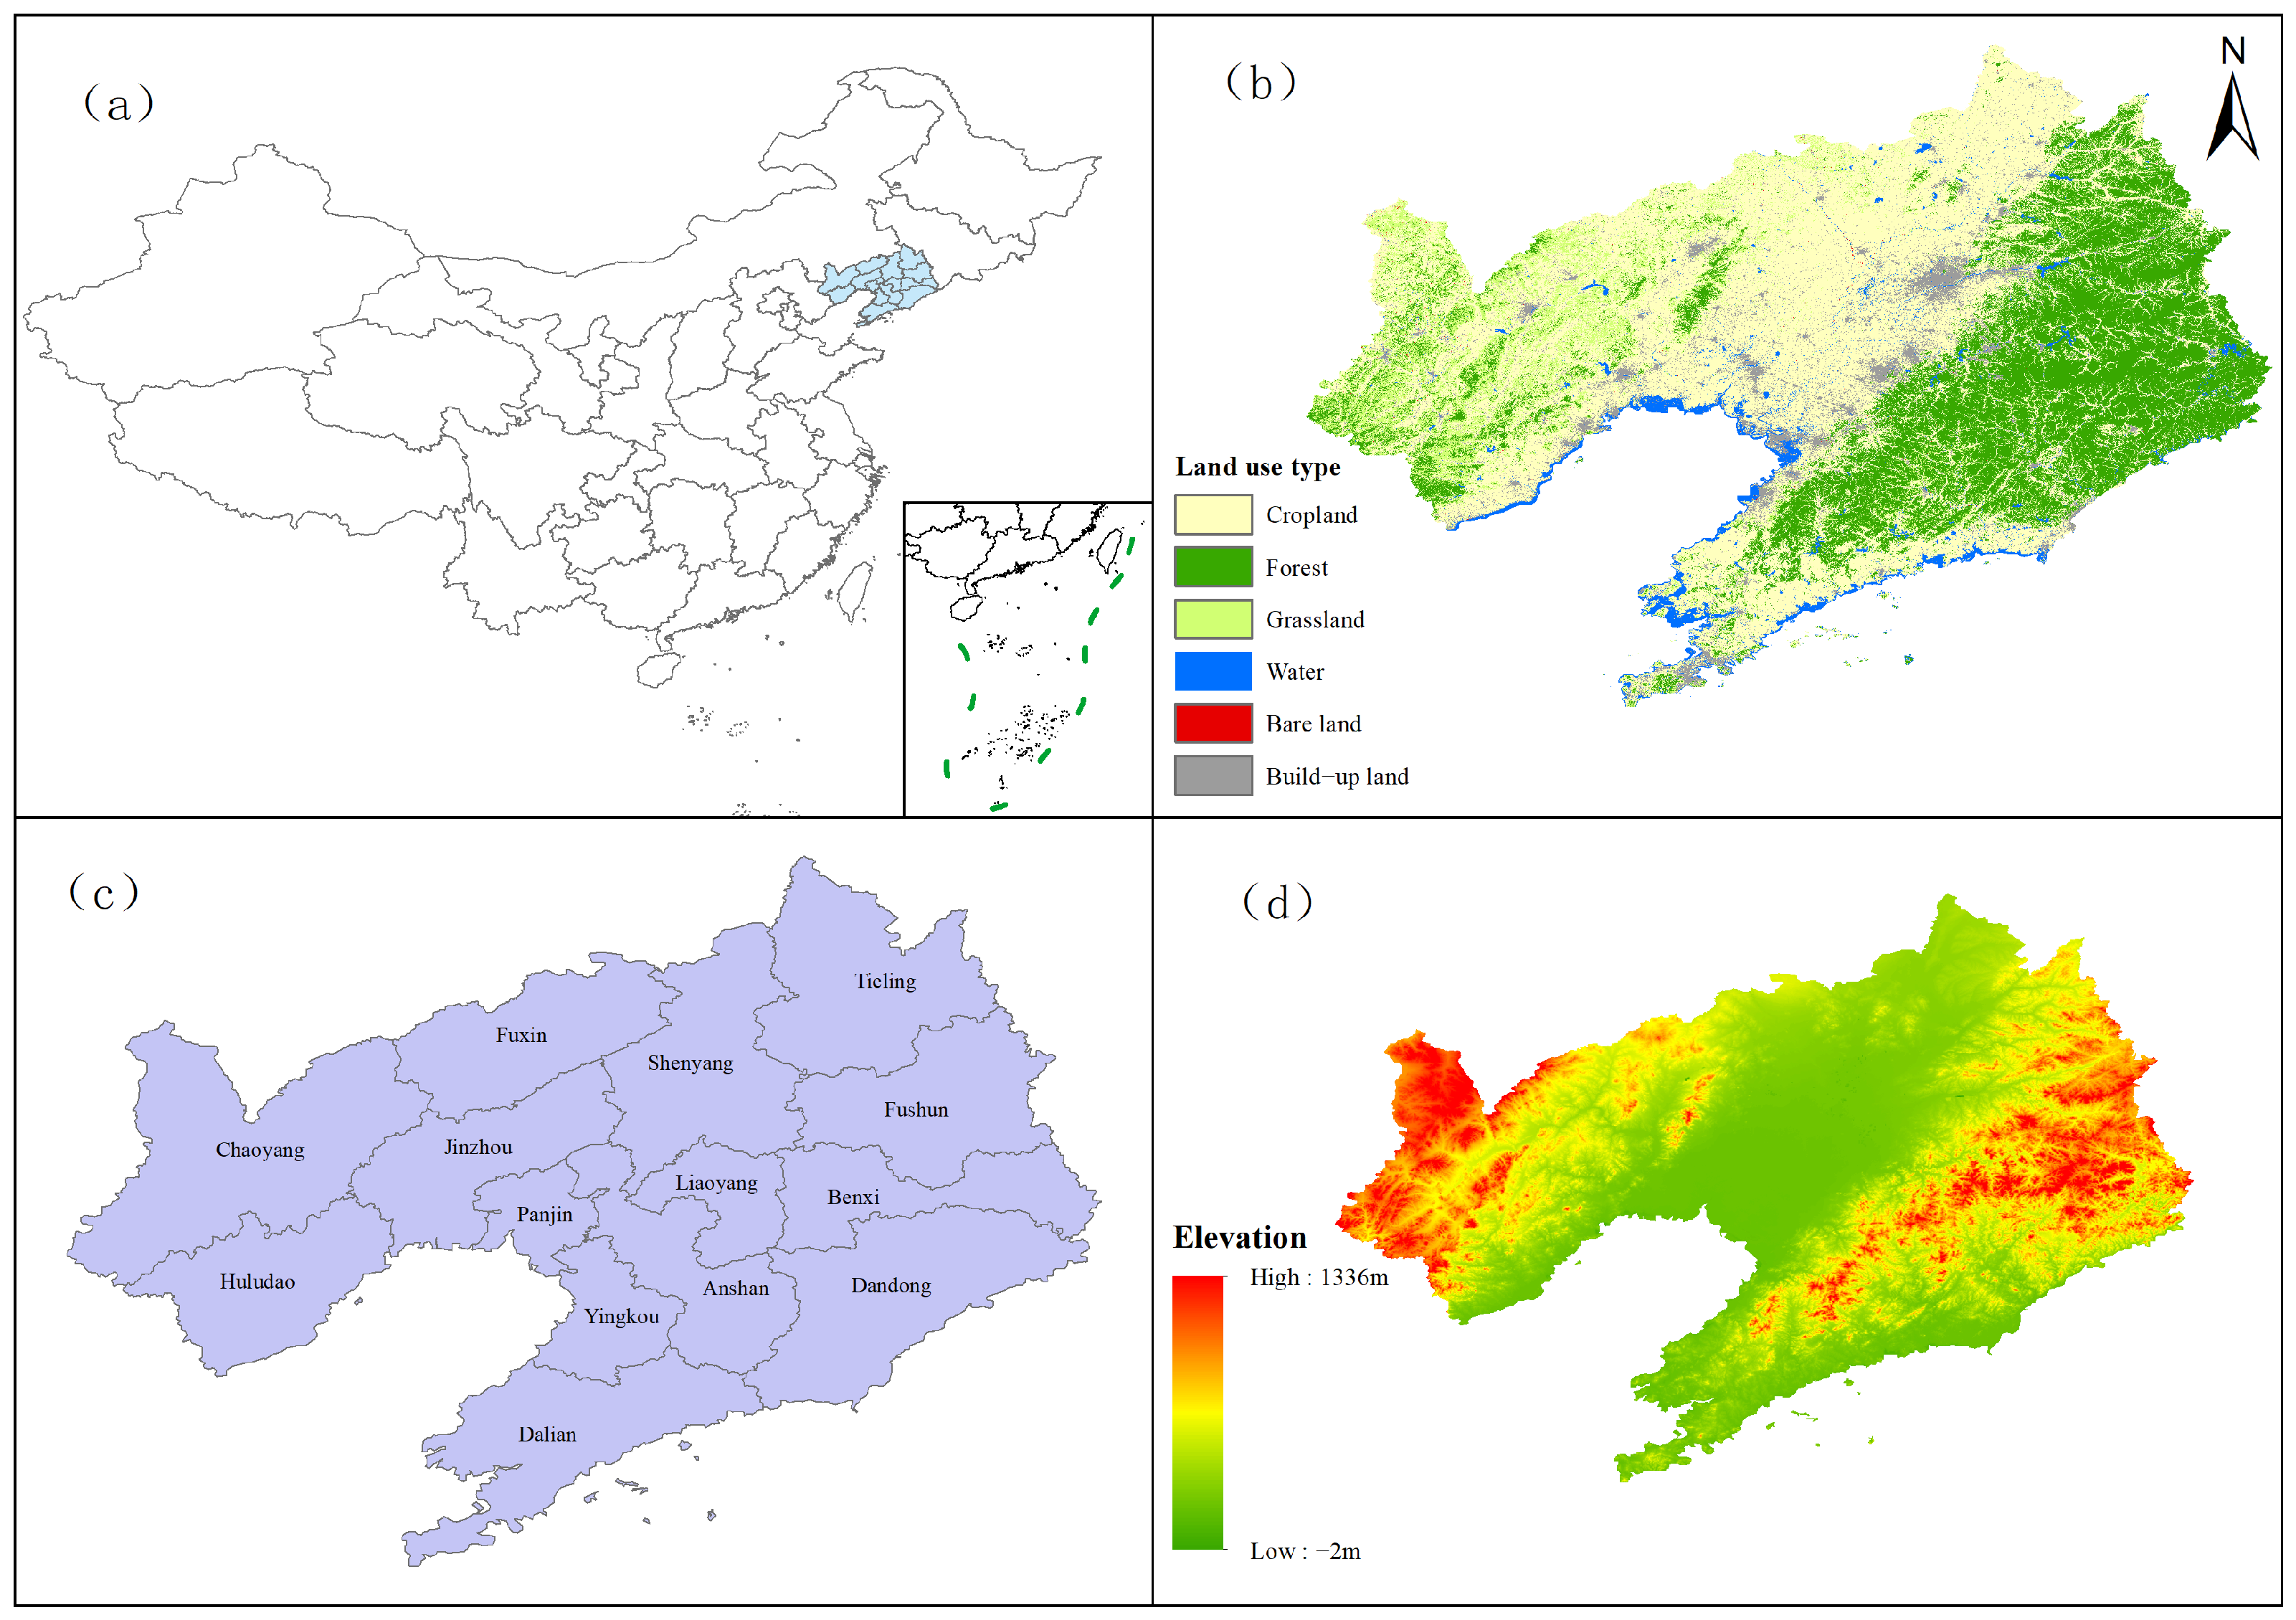
Liaoning Province is located in the heart of Northeast Asia (118°53′–125°46′ E, 38°43′–43°26′ N). It comprises 14 prefecture-level cities and 100 county-level administrative units, with a land area of 148,000 square kilometers, a maritime area of 150,000 square kilometers, and a total coastline of 2290 km. It is the only province in Northeast China that is both coastal and bordered by another country (Figure 2). Its physical geography follows a pattern of “six parts mountains, one part water, and three parts farmland”: the terrain is generally higher in the north and lower in the south. Liaodong and Liaoxi consist mainly of hills and mountains (average elevations of 800 m and 500 m, respectively), while the central region is primarily the Liao River alluvial plain (elevation approximately 200 m). Mountains account for about 59.5% of the area, and plains account for about 32.4%. A narrow coastal corridor has formed along the Bohai Sea coast in Western Liaoning. The province’s water system is centered on the Liao River (total length 1345 km), with 432 rivers having a drainage area of over 100 km2. The Liaodong Peninsula has a coastline of 2292 km, accounting for 12% of the national total. Ecologically, the Liao River estuary features a globally representative temperate coastal wetland system; it serves as a key area for international migratory bird migration and a breeding ground for the West Pacific spotted seal, while western Liaoning faces the challenge of desertification.
Figure 2.
(a) Location and general characteristics of the study area; geographical location of Liaoning Province; (b) land use in Liaoning Province; (c) administrative boundaries of Liaoning Province; (d) elevation in Liaoning Province.
2.2. Multi-Scale Assessment of Ecosystem Services
Given the critical role of ecosystem hierarchical complexity and scale effects in shaping the patterns, processes, and interactions of ecosystem services (ESs), this study employs multi-dimensional data for spatial assessment (Table 1) and constructs a multi-spatial-scale ES assessment framework [10]. This framework aims to capture the spatial heterogeneity of ESs across different scales and reveal their cross-scale patterns, thereby providing a foundation for a deeper understanding of the driving associations of ESs and the development of targeted management strategies.
Table 1.
Data sources and description.
2.2.1. Selection of Assessment Scales
This study evaluates ESs at three spatial scales: grid, county, and city [11]. The selection of these three scales is primarily based on the following considerations: Ecological process alignment: The grid scale (15 km × 15 km grids were used in this study) can accurately reflect the spatial heterogeneity of local ecological processes and environmental factors, serving as the basic unit for understanding micro-level changes in ESs. The county and city scales are the primary levels for regional land-use planning and the formulation and implementation of ecological conservation policies; assessment results can directly support local decision-making needs. Data availability and comparability: The selected scales align with the resolution or statistical units of primary data sources (such as remote sensing imagery and socioeconomic statistical yearbooks), ensuring the feasibility of data acquisition. Additionally, the three scales exhibit a hierarchical relationship, facilitating cross-scale comparative analysis. The selection of the grid scale aims to ensure spatial continuity and comparability, and the grid scale is comparable to the area of a township in Liaoning Province (231.88 square kilometers).
2.2.2. Selection of Ecosystem Service Types
To ensure a comprehensive assessment of ecosystem functions in Liaoning Province, this study selected five representative ecosystem services (ESs) for evaluation, taking into account the province’s unique physical geography, ecosystem types, and key ecological challenges: (1) Food Provision: As a critical provisioning service, FS serves as the material foundation for ensuring regional food security and social stability, holding a central position particularly in the agricultural zone of the central Liaoning Plain [12]. (2) Carbon storage: This represents the role of ecosystems in regulating climate and mitigating global warming [13]. Assessing ecosystem services is crucial for understanding the contributions of Liaoning’s ecosystems—including forests (in the mountainous regions of eastern and western Liaoning) and wetlands (at the Liao River estuary)—to achieving the “dual carbon” goals. (3) Soil Conservation (SC): This reflects the ecosystem’s capacity to prevent soil erosion and maintain land productivity. This holds significant practical implications for mitigating the risk of desertification in the western Liaoning region and ensuring regional ecological security [14]. (4) Habitat Quality (HQ): Measures an ecosystem’s capacity to maintain biodiversity and support the survival and reproduction of species [15]. Assessing HQ is crucial for addressing habitat fragmentation and biodiversity loss in Liaoning Province caused by rapid urbanization. (5) Water Yield: Refers to an ecosystem’s capacity to provide freshwater, playing a key role in supporting domestic, industrial, and agricultural water use in Liaoning Province, as well as maintaining the health of aquatic ecosystems [16]. Assessing WY helps address the pressure caused by the uneven spatial distribution of water resources in the region. These five services cover the three major ES categories of provisioning (FS, WY), regulating (CS, SC), and supporting (HQ) services, and can comprehensively reflect the primary ecosystem functions in Liaoning Province and their contributions to human well-being. Food supply, carbon sequestration, habitat quality, and water yield were calculated using the InVEST model, while soil conservation was calculated using the RUSLE model.
2.3. Spatial Autocorrelation of Ecosystem Services Across Scales
Accurately identifying hotspots and coldspots of ecosystem services (ESs) is a key prerequisite for revealing spatial heterogeneity and formulating differentiated ecological management strategies. This study employs spatial autocorrelation methods to examine ESs at different scales, using the Moran’s I index to assess overall spatial correlation and determine correlation trends within the study area [17]. Since Liaoning Province only has 100 counties and 14 cities, this could lead to R2 being inaccurate. The Getis–Ord GI (hotspot) method was used to statistically analyze local autocorrelation, conducting a quantitative analysis of the hotspot and coldspot patterns for five core ESs—including food provisioning and carbon sequestration—across three scales: 15 km grids, county-level, and city-level in Liaoning Province. Specific clusters were detected, highlighting hotspots (high-value areas) and coldspots (low-value areas) [18]. Combining these methods provides a comprehensive understanding of the spatial distribution of ESs, capturing relationships and variations from macro- to micro-scales. The statistic is defined as follows:
where n represents the total number of spatial units. Xi, Xj are the attribute values of the i th and j th units. Wij is the spatial weight, representing the spatial proximity relationship between units i and j. is the total sum of the weight matrix, used for normalization.
where denotes the spatial weight between units i and j; is the attribute value of unit j; and n is the total number of units.
2.4. Trade-Offs and Synergies in Ecosystem Services
Correlation analysis involves analyzing the various elements of the ESs to measure the degree of association between two variables. The purpose of correlation analysis is to identify relationships among the components of ESs and express them using appropriate statistical indicators. This study employs Pearson’s correlation coefficient to quantify the relationships among the various scales within ESs. To capture spatial heterogeneity, the study utilizes a geographically weighted regression (GWR) model to analyze the components of ESs. The GWR is set up with the kernel function selection as FIXED (fixed distance method), and the kernel bandwidth is chosen by AIC, determining the optimal bandwidth through the minimum information criterion, thereby reducing multicollinearity [19]. The statistic is defined as follows:
where r is the correlation coefficient; Xi and Yi are the observed values of the two variables; and and are their mean values. The coefficient ranges from −1 to 1. Values closer to ±1 indicate stronger correlations, with positive values representing positive correlations and negative values indicating negative correlations.
where (ui,vi) are the coordinates of sampling point I, and βk(ui,vi) is the k-th regression parameter at the sampling point.
2.5. Identification of ES Clusters
ES clusters refer to groups of synchronized ecosystem services (ESs) that are interrelated across spatial and temporal dimensions. Self-organizing maps (SOMs), as an unsupervised neural network technique that integrates dimension reduction and clustering functions, classify study units into different ES cluster categories based on spatial similarity criteria [20]. The entire analysis process was conducted using the Kohonen package in the R programming environment.
2.6. Identification and Interpretation of Ecosystem Service Drivers
To accurately identify the driving associations of ecosystem services (ESs) across multiple spatial scales in Liaoning Province, this study selected five typical machine learning models: LightGBM, Random Forest (RF), Support Vector Regression (SVR), and Extreme Gradient Boosting (XGBoost). Predict ESs using basic data, where the independent variable is the basic data and the dependent variable is ESs. The models’ performance in explaining the drivers of ESs was evaluated across three dimensions: Mean Absolute Error (MAE), Root Mean Square Error (RMSE), and Coefficient of Determination (R2) [21,22,23,24,25,26], The final hyperparameters were set as follows: nrounds = 100, eta = 0.05, max_depth = 6, subsample = 0.8, and colsample_bytree = 0.8. These settings were used to balance model fit and generalization and to reduce the risk of overfitting. The multi-scale comparison of model performance not only reveals differences in the applicability of various algorithms but also reflects the scale-dependent characteristics of the ESs driving associations in Liaoning Province, providing a solid methodological foundation for subsequent interpretability analysis of the driving factors. All analyses were performed using R for Windows 4.5.2 and the relevant libraries. The model is formulated as:
where is the sum of squared residuals. is the L1 norm penalty term, used to constrain the magnitude of the model coefficients.
where is the kernel function.
where is the loss function; Ω(fn) is the regularization term; γ represents model complexity; T is the number of leaf nodes; and ω is the weight vector of the leaf nodes.
2.7. SHAP Explanatory Model
The SHAP model is used to explain the relative contributions of different factors to the ecosystem service prediction results in the XGBoost model [27]. It is important to emphasize that SHAP values reflect the statistical association and predictive contribution between variables and model outputs; they do not directly prove the existence of causal relationships among variables. Therefore, this study employs SHAP analysis to identify key factors associated with changes in ecosystem services across different scales, the direction of their effects, and potential nonlinear response characteristics. It then provides an ecological interpretation by integrating these findings with the physical geography of Liaoning Province, land-use processes, and characteristics of socioeconomic transformation, without equating model contributions directly with actual ecological causal effects. The formulas are as follows:
where ϕi denotes the total SHAP value of feature i; S is a subset excluding feature i; |S| is the subset size; M is the total number of features; and fX(S) is the model prediction for subset S.
3. Results
3.1. Spatial Characteristics of Ecosystem Services Across Scales
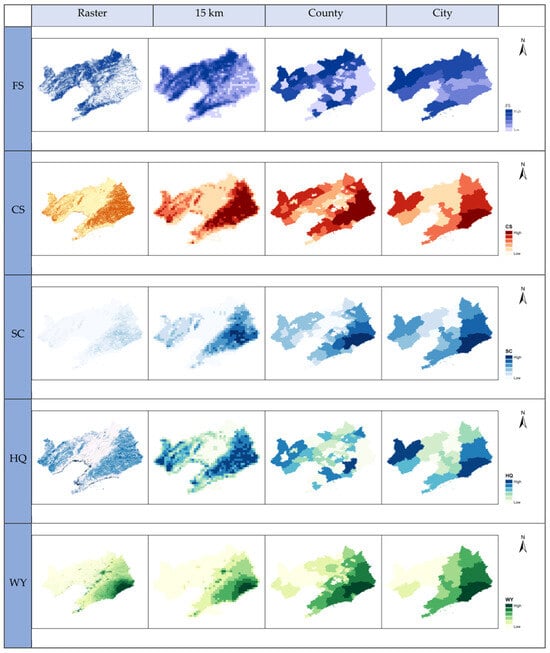
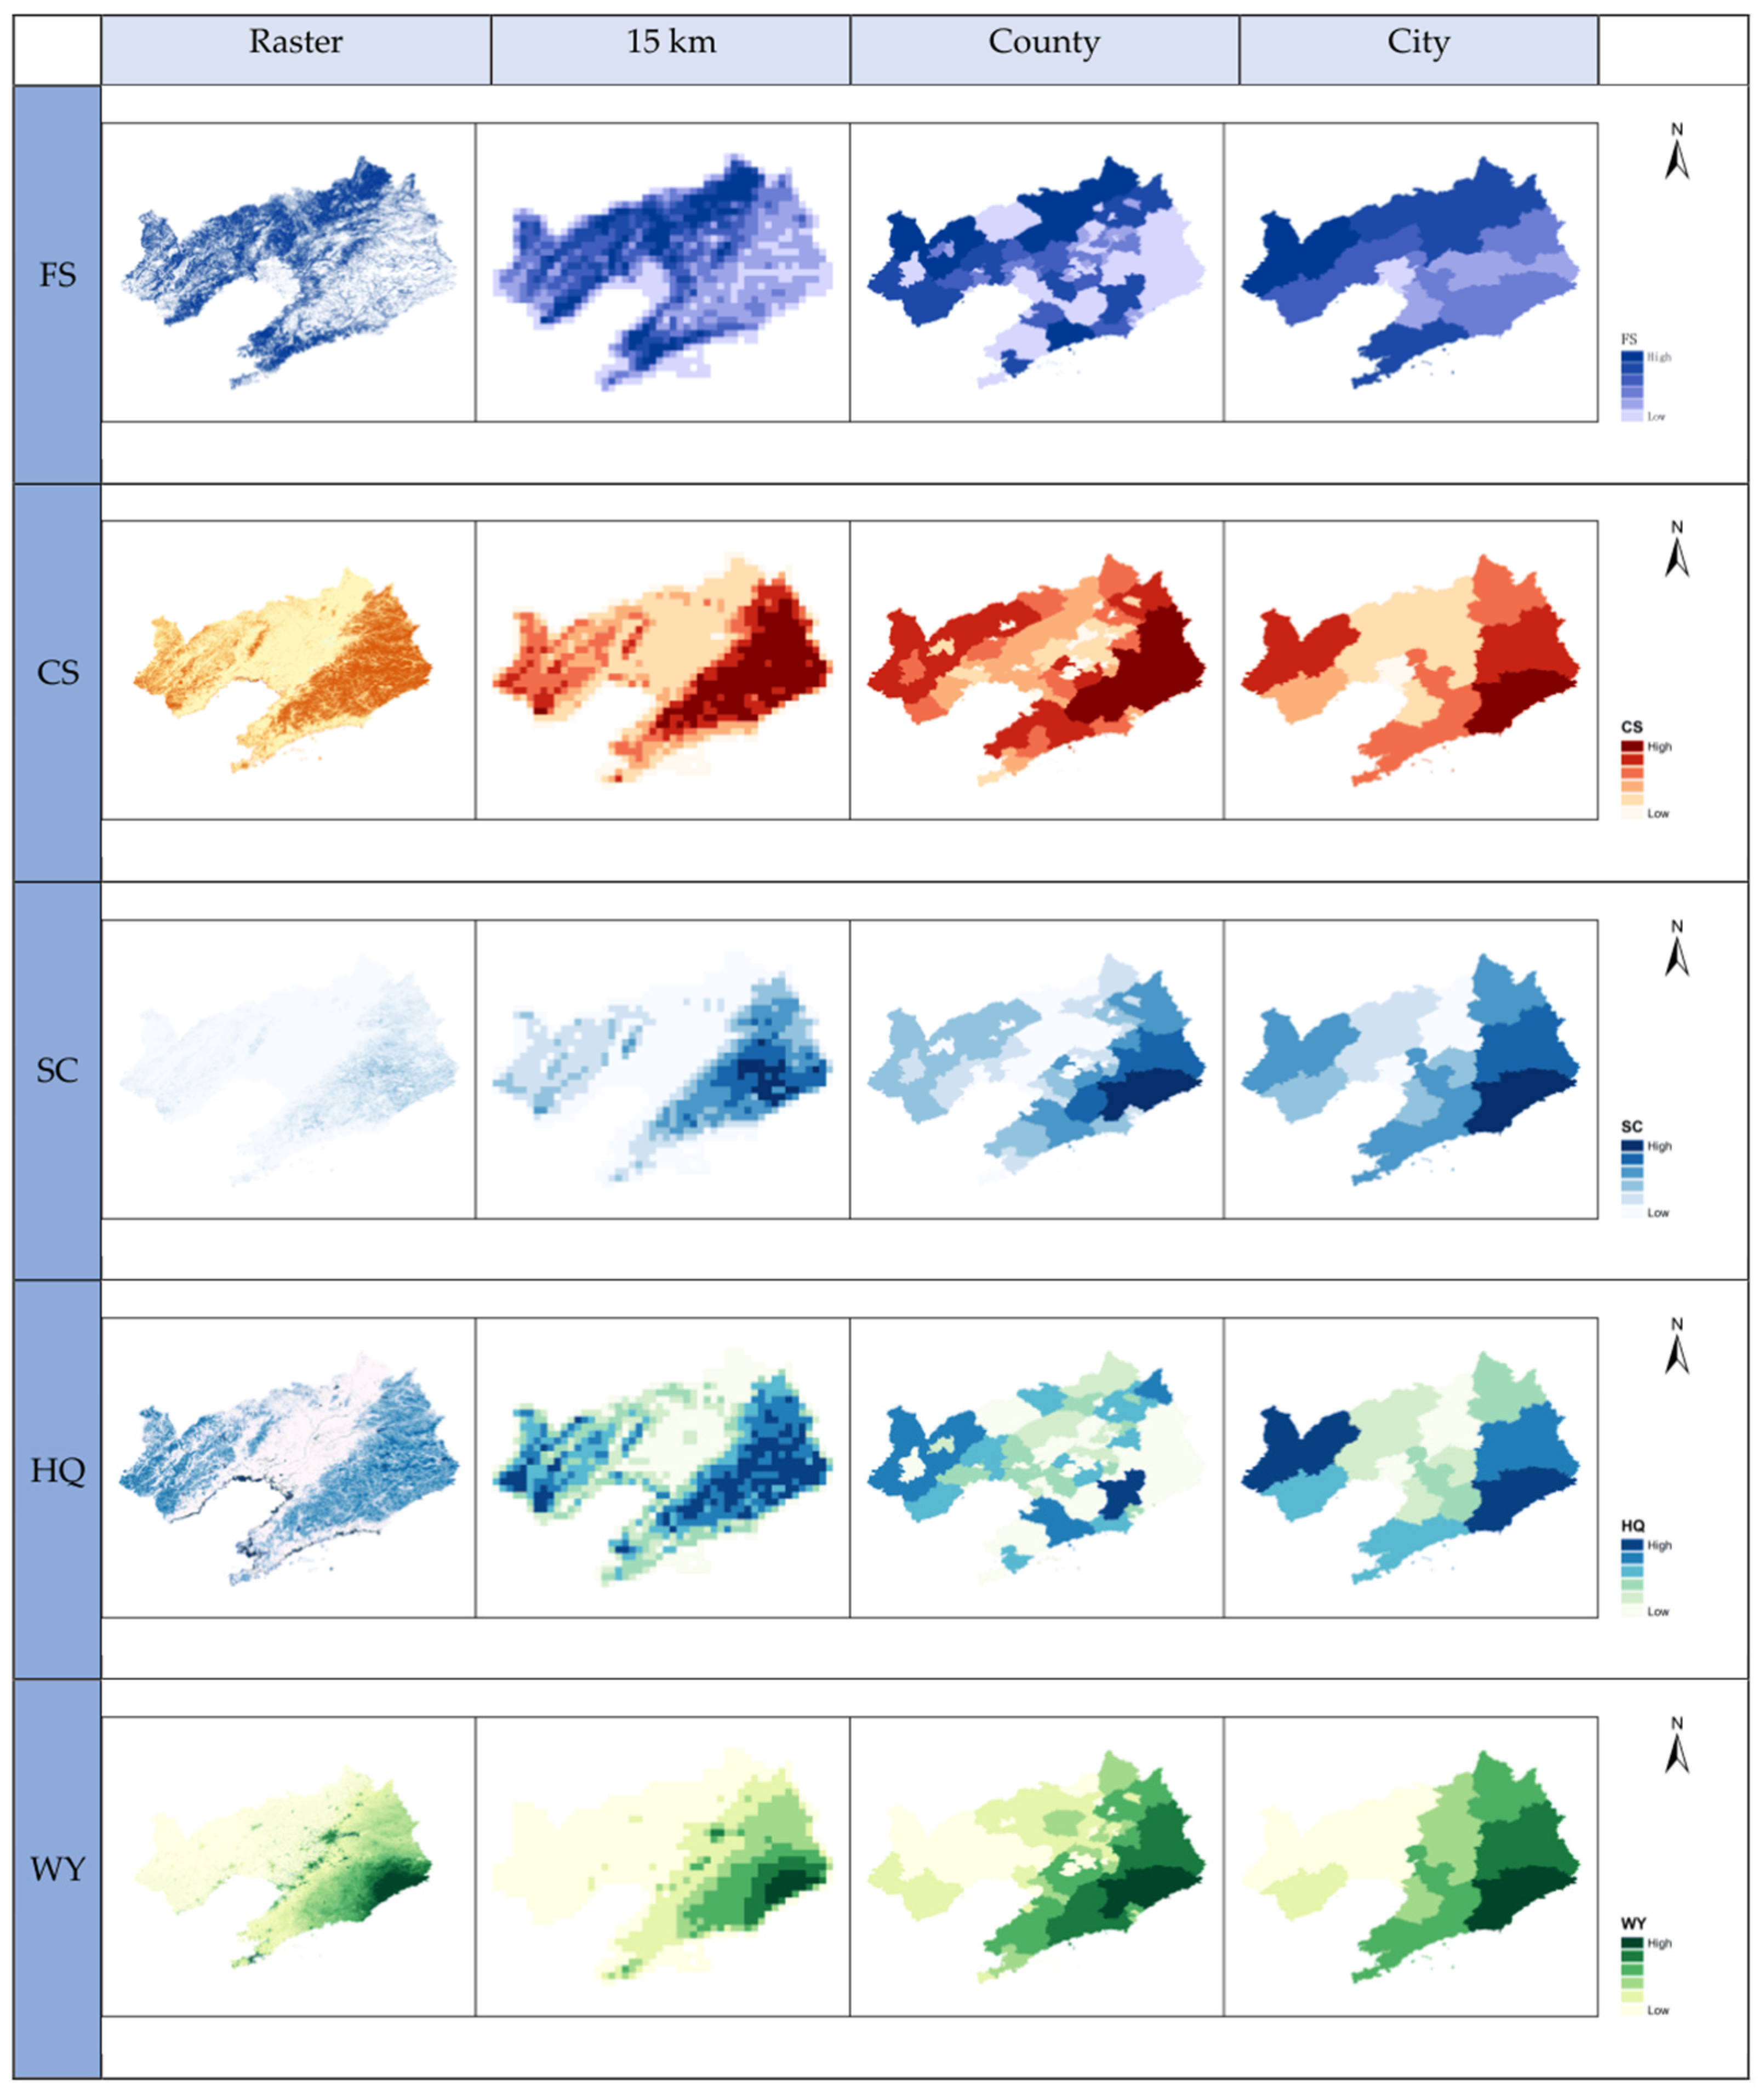
The spatial patterns and scale effects of ecosystem services form a crucial foundation for regional ecosystem management and spatial planning. To systematically reveal the spatial differentiation characteristics of ecosystem services in Liaoning Province and their patterns of variation across scales, this study conducted quantitative assessments and spatial representations of five core ecosystem services—food provision, carbon sequestration, soil conservation, habitat quality, and water yield—across three spatial scales: 15 km grid, county, and city. The study identified the consistency and differences in service distribution across different scales, analyzed the mechanisms underlying the formation of service spatial patterns driven by both natural geographic patterns and human activities, and provided intuitive spatial evidence for multi-scale ecological management and functional zoning. The spatial distribution patterns of each ecosystem service across multiple scales are shown in Figure 3.
Figure 3.
Spatial patterns of cross-scale ecosystem services.
Five core ecosystem services in Liaoning Province exhibit significant spatial heterogeneity, yet their overall patterns remain relatively stable across multiple scales [28]. The spatial distributions of carbon sequestration, soil conservation, and habitat quality are highly coordinated. High-value areas are concentrated in the mountainous forest ecosystems of eastern and western Liaoning, while low-value areas are primarily distributed in the urban and intensive agricultural zones of the central Liao River Plain, highlighting the central role of mountainous forests in regional ecological regulation and biodiversity conservation. The patterns of food provisioning services and regulating services show clear spatial complementarity, with high-value areas concentrated in the central Liaohe Plain where high-quality farmland is densely distributed, while low-value areas are primarily located in mountainous ecological buffer zones and areas of high urbanization intensity. Water yield is controlled by the coupling of precipitation and topography; high-value areas are concentrated in the precipitation-rich mountainous regions of Eastern Liaoning, while low-value areas are contiguously distributed in the arid and semi-arid hilly regions of Western Liaoning. As the spatial scale increases from grid cells to county and city levels, local variations in ecosystem services are gradually smoothed out, and spatial heterogeneity is somewhat reduced. However, the overall spatial structure of “mountains in the east, water in the west, and a granary in the center, Wet mountains in the east, dry hills in the west, granary plains in the central region” remains stable, indicating that the natural geographical substrate and the intensity of human activities jointly shape the basic spatial pattern of ecosystem services in Liaoning Province.
3.2. Spatial Autocorrelation
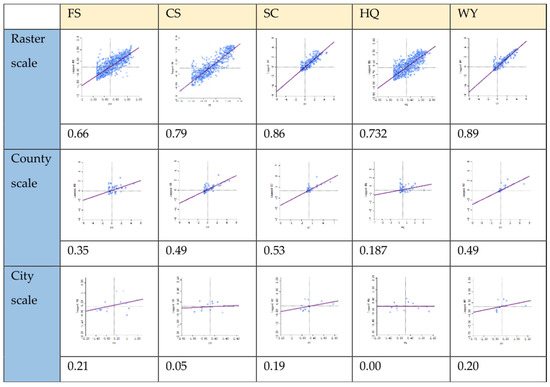
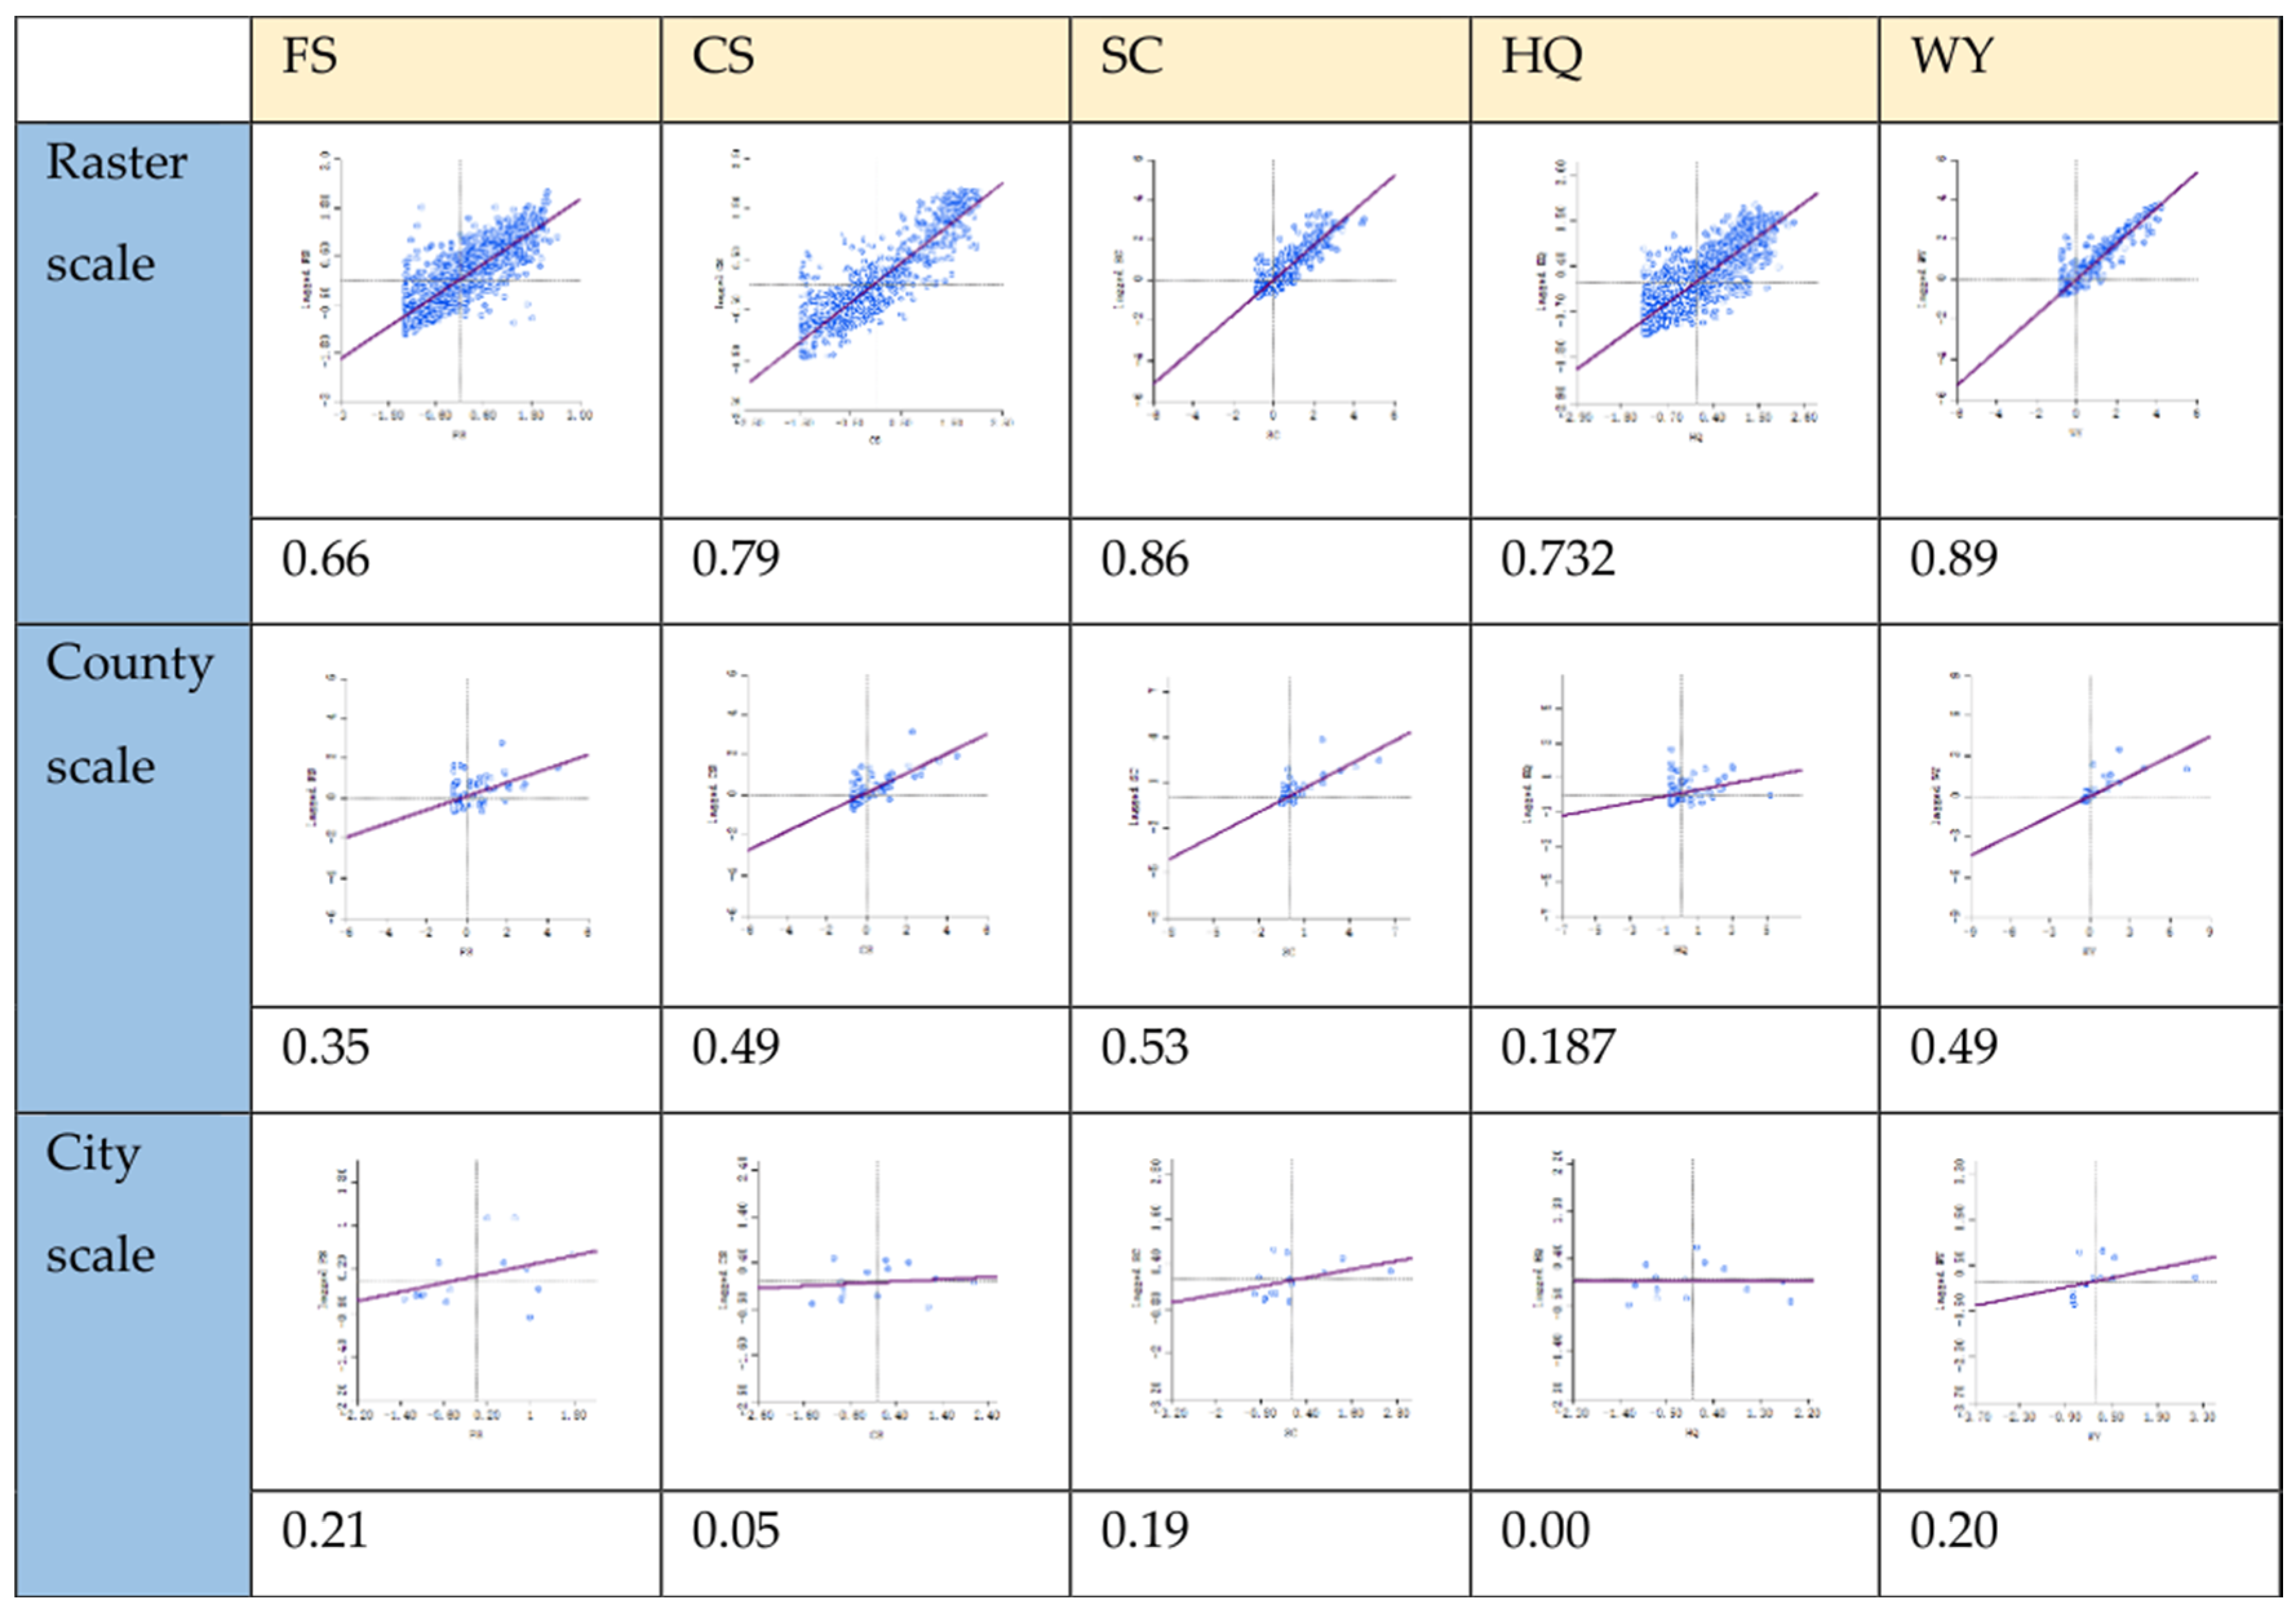
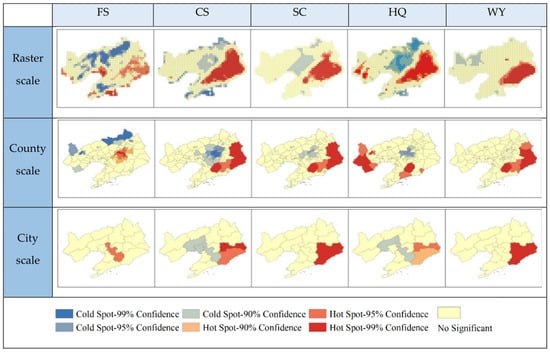
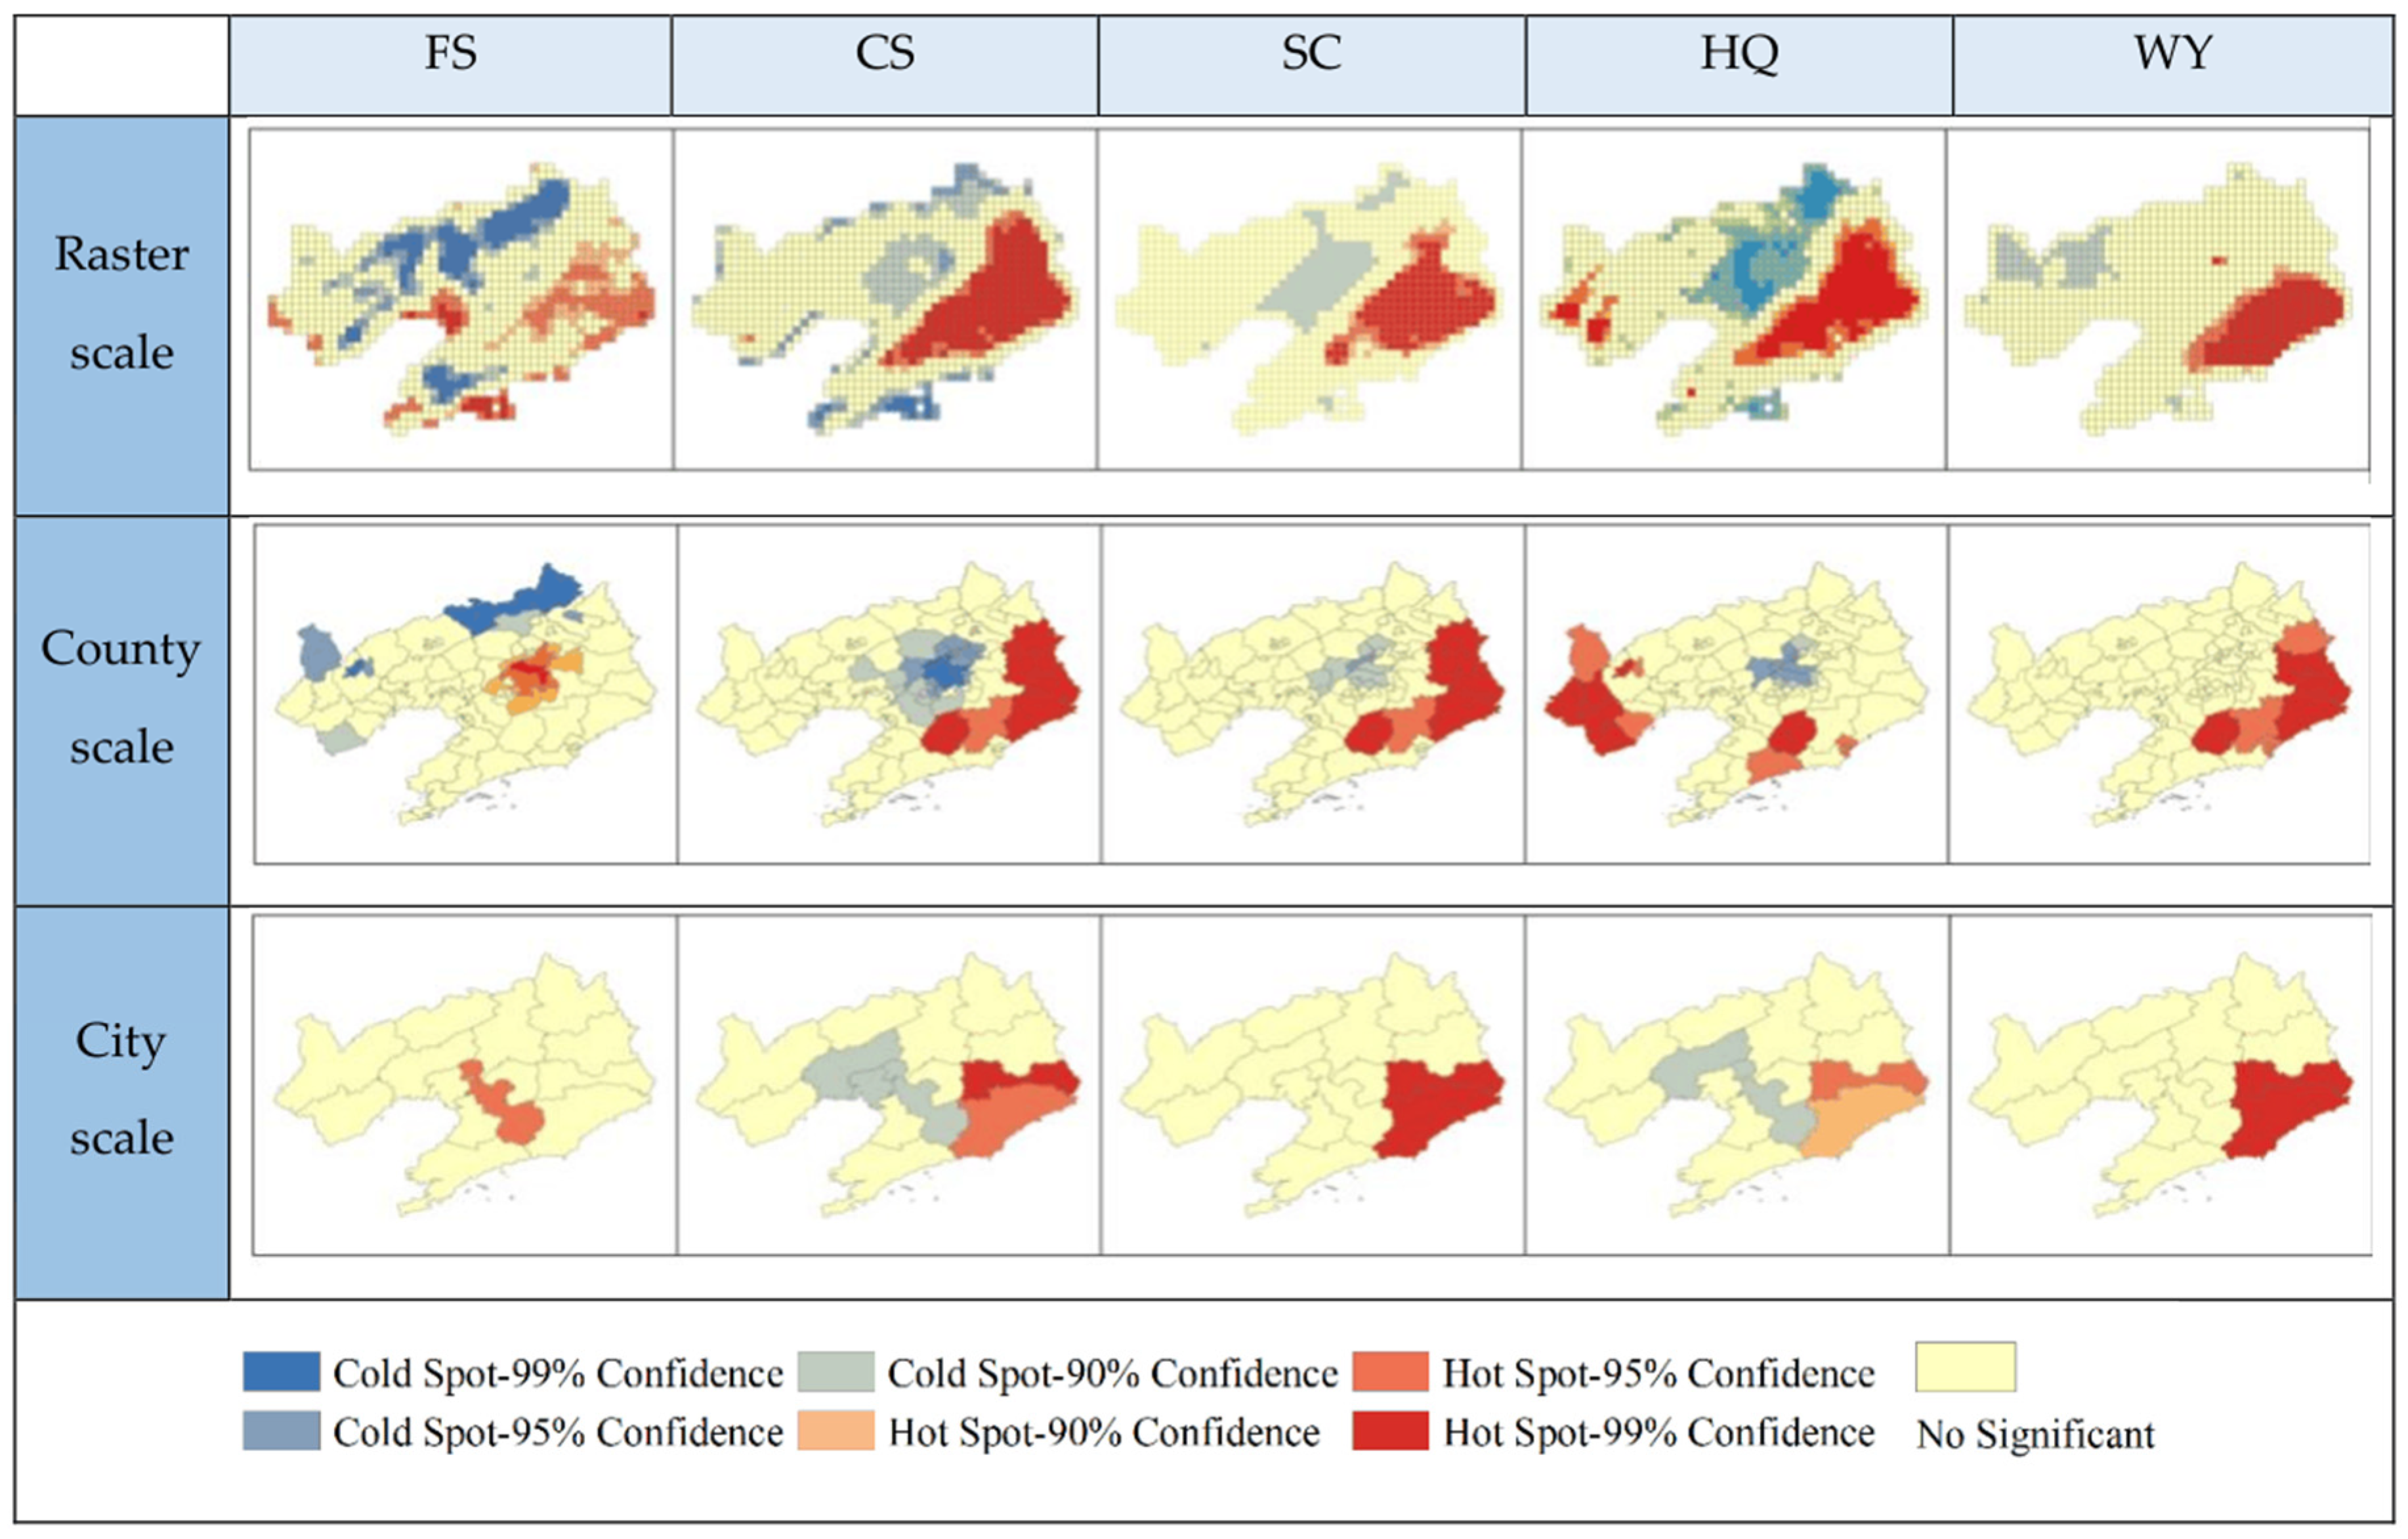
Spatial autocorrelation is a key method for identifying the spatial clustering characteristics and hotspot/coldspot distribution patterns of ecosystem services, effectively revealing their spatial dependence and heterogeneity patterns. To clarify the spatial association patterns and clustering characteristics of ecosystem services in Liaoning Province across multiple scales, this study employs the global Moran’s I index to measure the overall degree of spatial autocorrelation and uses the Getis–Ord Gi statistic to identify cold and hot spots. Comparative analyses were conducted at three scales—15 km grid, county, and city—to systematically reveal the patterns of how increasing scale affects the spatial aggregation, pattern integrity, and local heterogeneity of ecosystem services, thereby providing spatial statistical evidence for differentiated ecological management and the identification of key areas. The global autocorrelation indices and hotspot/coldspot patterns of ecosystem services at each scale are shown in Figure 4 and Figure 5.
Figure 4.
Moran’s index of ecosystem service functions.
Figure 5.
Cross-scale cold and hot spots in ESs.
The results of the global Moran’s I analysis indicate that the spatial clustering of ecosystem services in Liaoning Province exhibits a strong scale dependency, with the spatial autocorrelation index at the grid scale being significantly higher than that at the county and city scales. At the grid scale, Moran’s I values for all ecosystem services were high, indicating significant positive spatial correlation, with local ecological processes driving spatial clustering at this fine scale. As the scale increased to the county and city levels, the intensity of clustering dropped sharply, and some services approached random distribution at the city scale. This disparity is primarily driven by two factors: first, administrative units often encompass composite landforms such as mountains, plains, and wetlands, leading to the averaging of internal ecosystem service heterogeneity. Second, the grid scale utilizes high-resolution remote sensing data capable of precisely capturing subtle local variations, whereas the administrative scale relies on statistical data that masks internal spatial heterogeneity.
The patterns of hotspots and coldspots also exhibit distinct cross-scale differentiation. The grid scale can finely depict local ecological patterns: hotspots for carbon sequestration, soil conservation, and habitat quality are concentrated in the mountainous forest areas of eastern and western Liaoning, while coldspots precisely correspond to the central urban–agricultural transition zone. Hotspots for food provision are concentrated in the agricultural areas of the Liaohe Plain, forming a spatial complementarity with regulatory services, and hotspots and coldspots for water yield exhibit a north–south differentiation driven by water and heat conditions. At the county level, influenced by the integration effect of administrative boundaries, hotspots exhibit contiguous distribution, resulting in reduced fragmentation. At the urban level, ecosystem types are highly composite, further weakening the hotspot pattern and leading to greater dispersion. Overall, the fine-grid scale is suitable for targeted ecological restoration and precise management, while the county and urban scales are more conducive to regional ecological coordination and collaborative governance. This multi-scale pattern provides a scientific basis for tiered ecological management in Liaoning Province.
3.3. Trade-Offs and Synergies Among Ecosystem Services
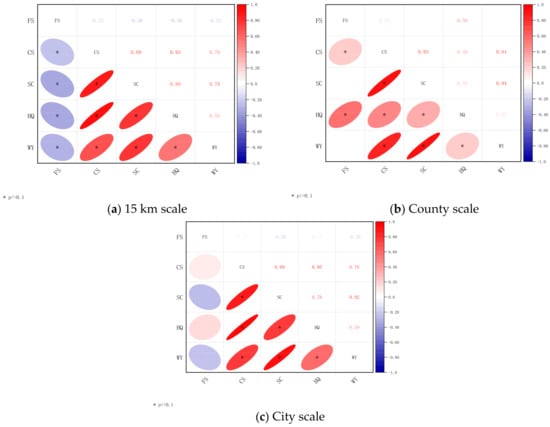
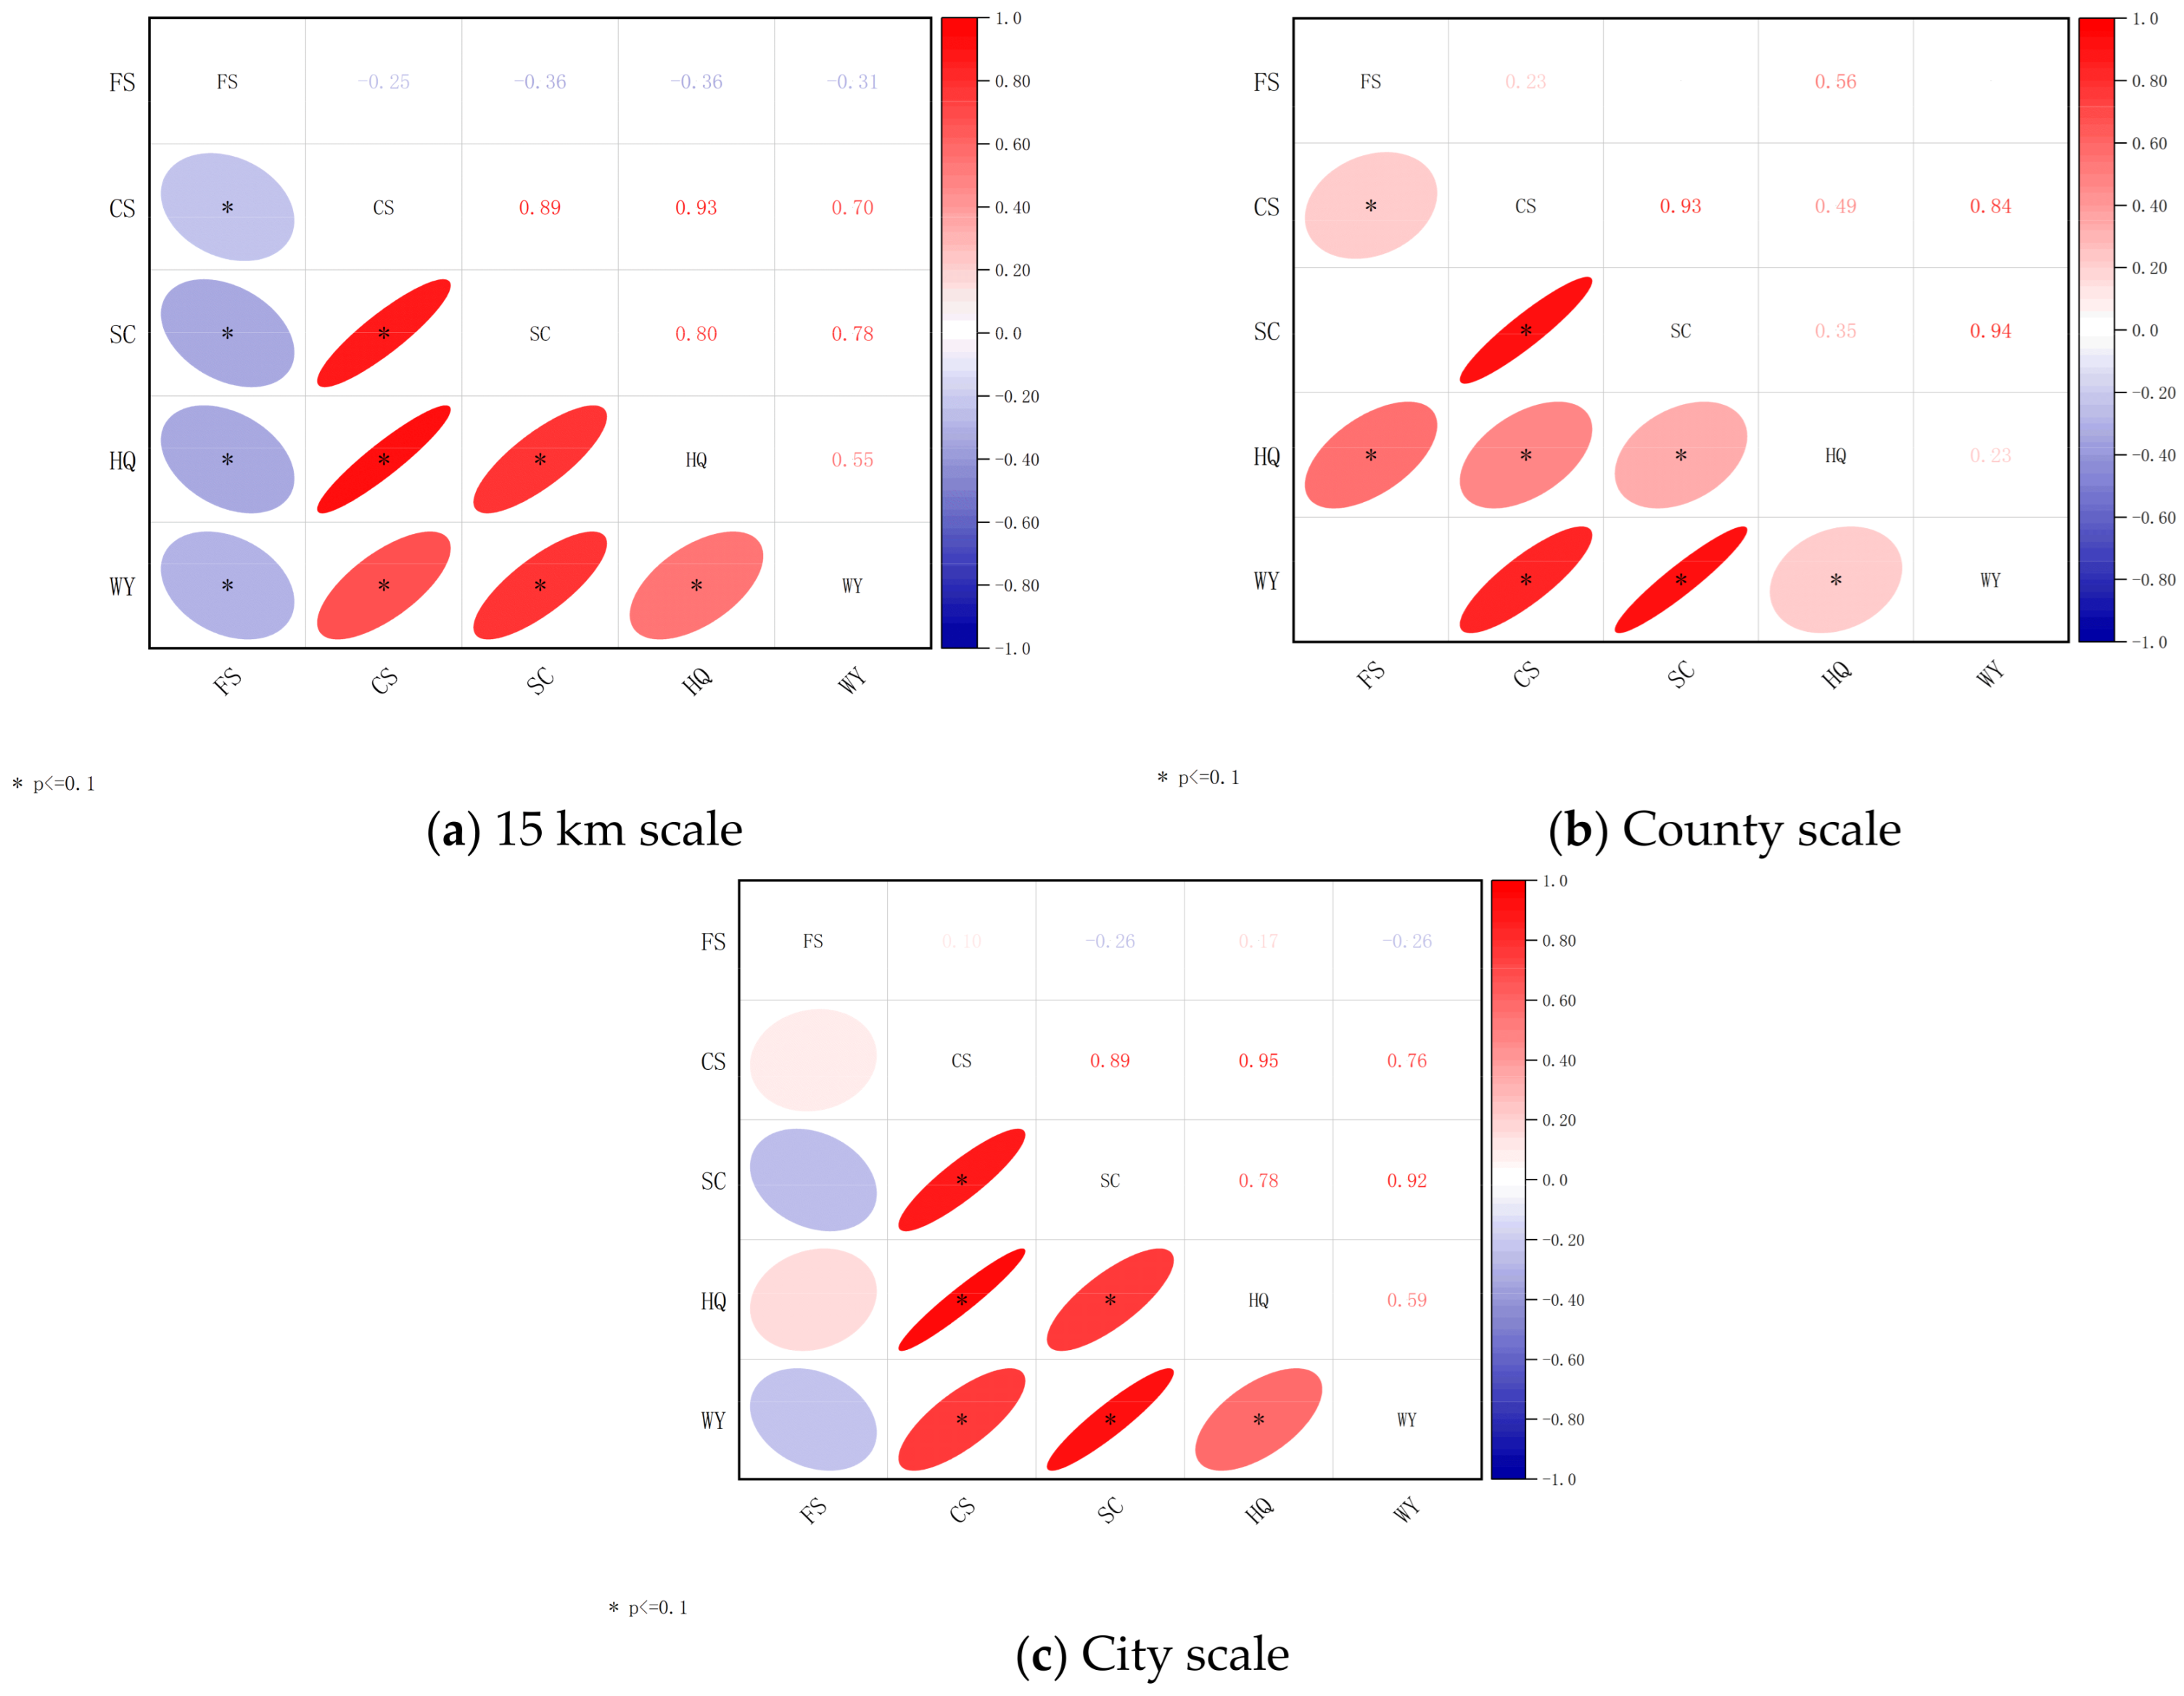
The trade-offs and synergies among ecosystem services serve as the core basis for the multifunctional management and spatially optimized allocation of regional ecosystems. During their evolution, different services often exhibit trade-off characteristics—where one service gains at the expense of another—or synergy characteristics—where multiple services increase simultaneously. The intensity of these relationships and their spatial patterns exhibit significant scale dependence and spatial heterogeneity. To systematically reveal the interaction patterns among five core ecosystem services in Liaoning Province—food provision, carbon sequestration, soil conservation, habitat quality, and water yield—this study employs Pearson correlation analysis to identify global trade-offs and synergy identification, and employs a geographically weighted regression (GWR) model to characterize the local spatial differentiation of service relationships. By analyzing both global and local levels across three scales—grid, county, and city—this study quantitatively elucidates the spatial patterns and underlying mechanisms of ecosystem service interactions, thereby providing scientific support for the coordinated enhancement of regional ecosystem services and the mitigation of conflicts. Global correlation analysis reflects the overall association trends, while the GWR model effectively captures local heterogeneity, thereby more accurately revealing the distinct characteristics of service relationships across different geographical contexts. The results of the correlation analysis are shown in Figure 6. Overall, using p < 0.1 is the most obvious result in the comparison.
Figure 6.
Correlation between cross-scale ESs.
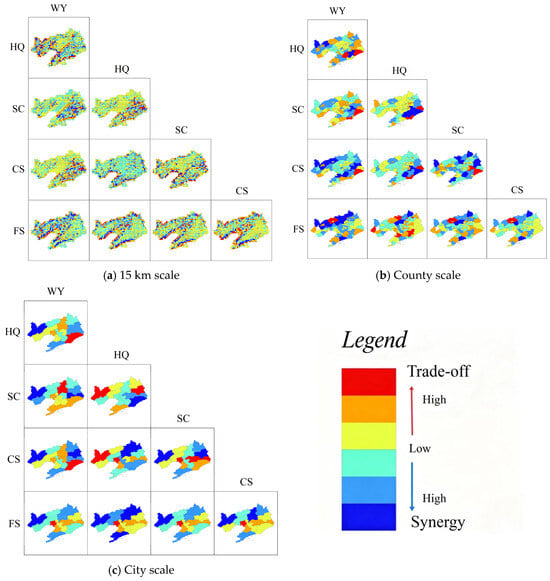
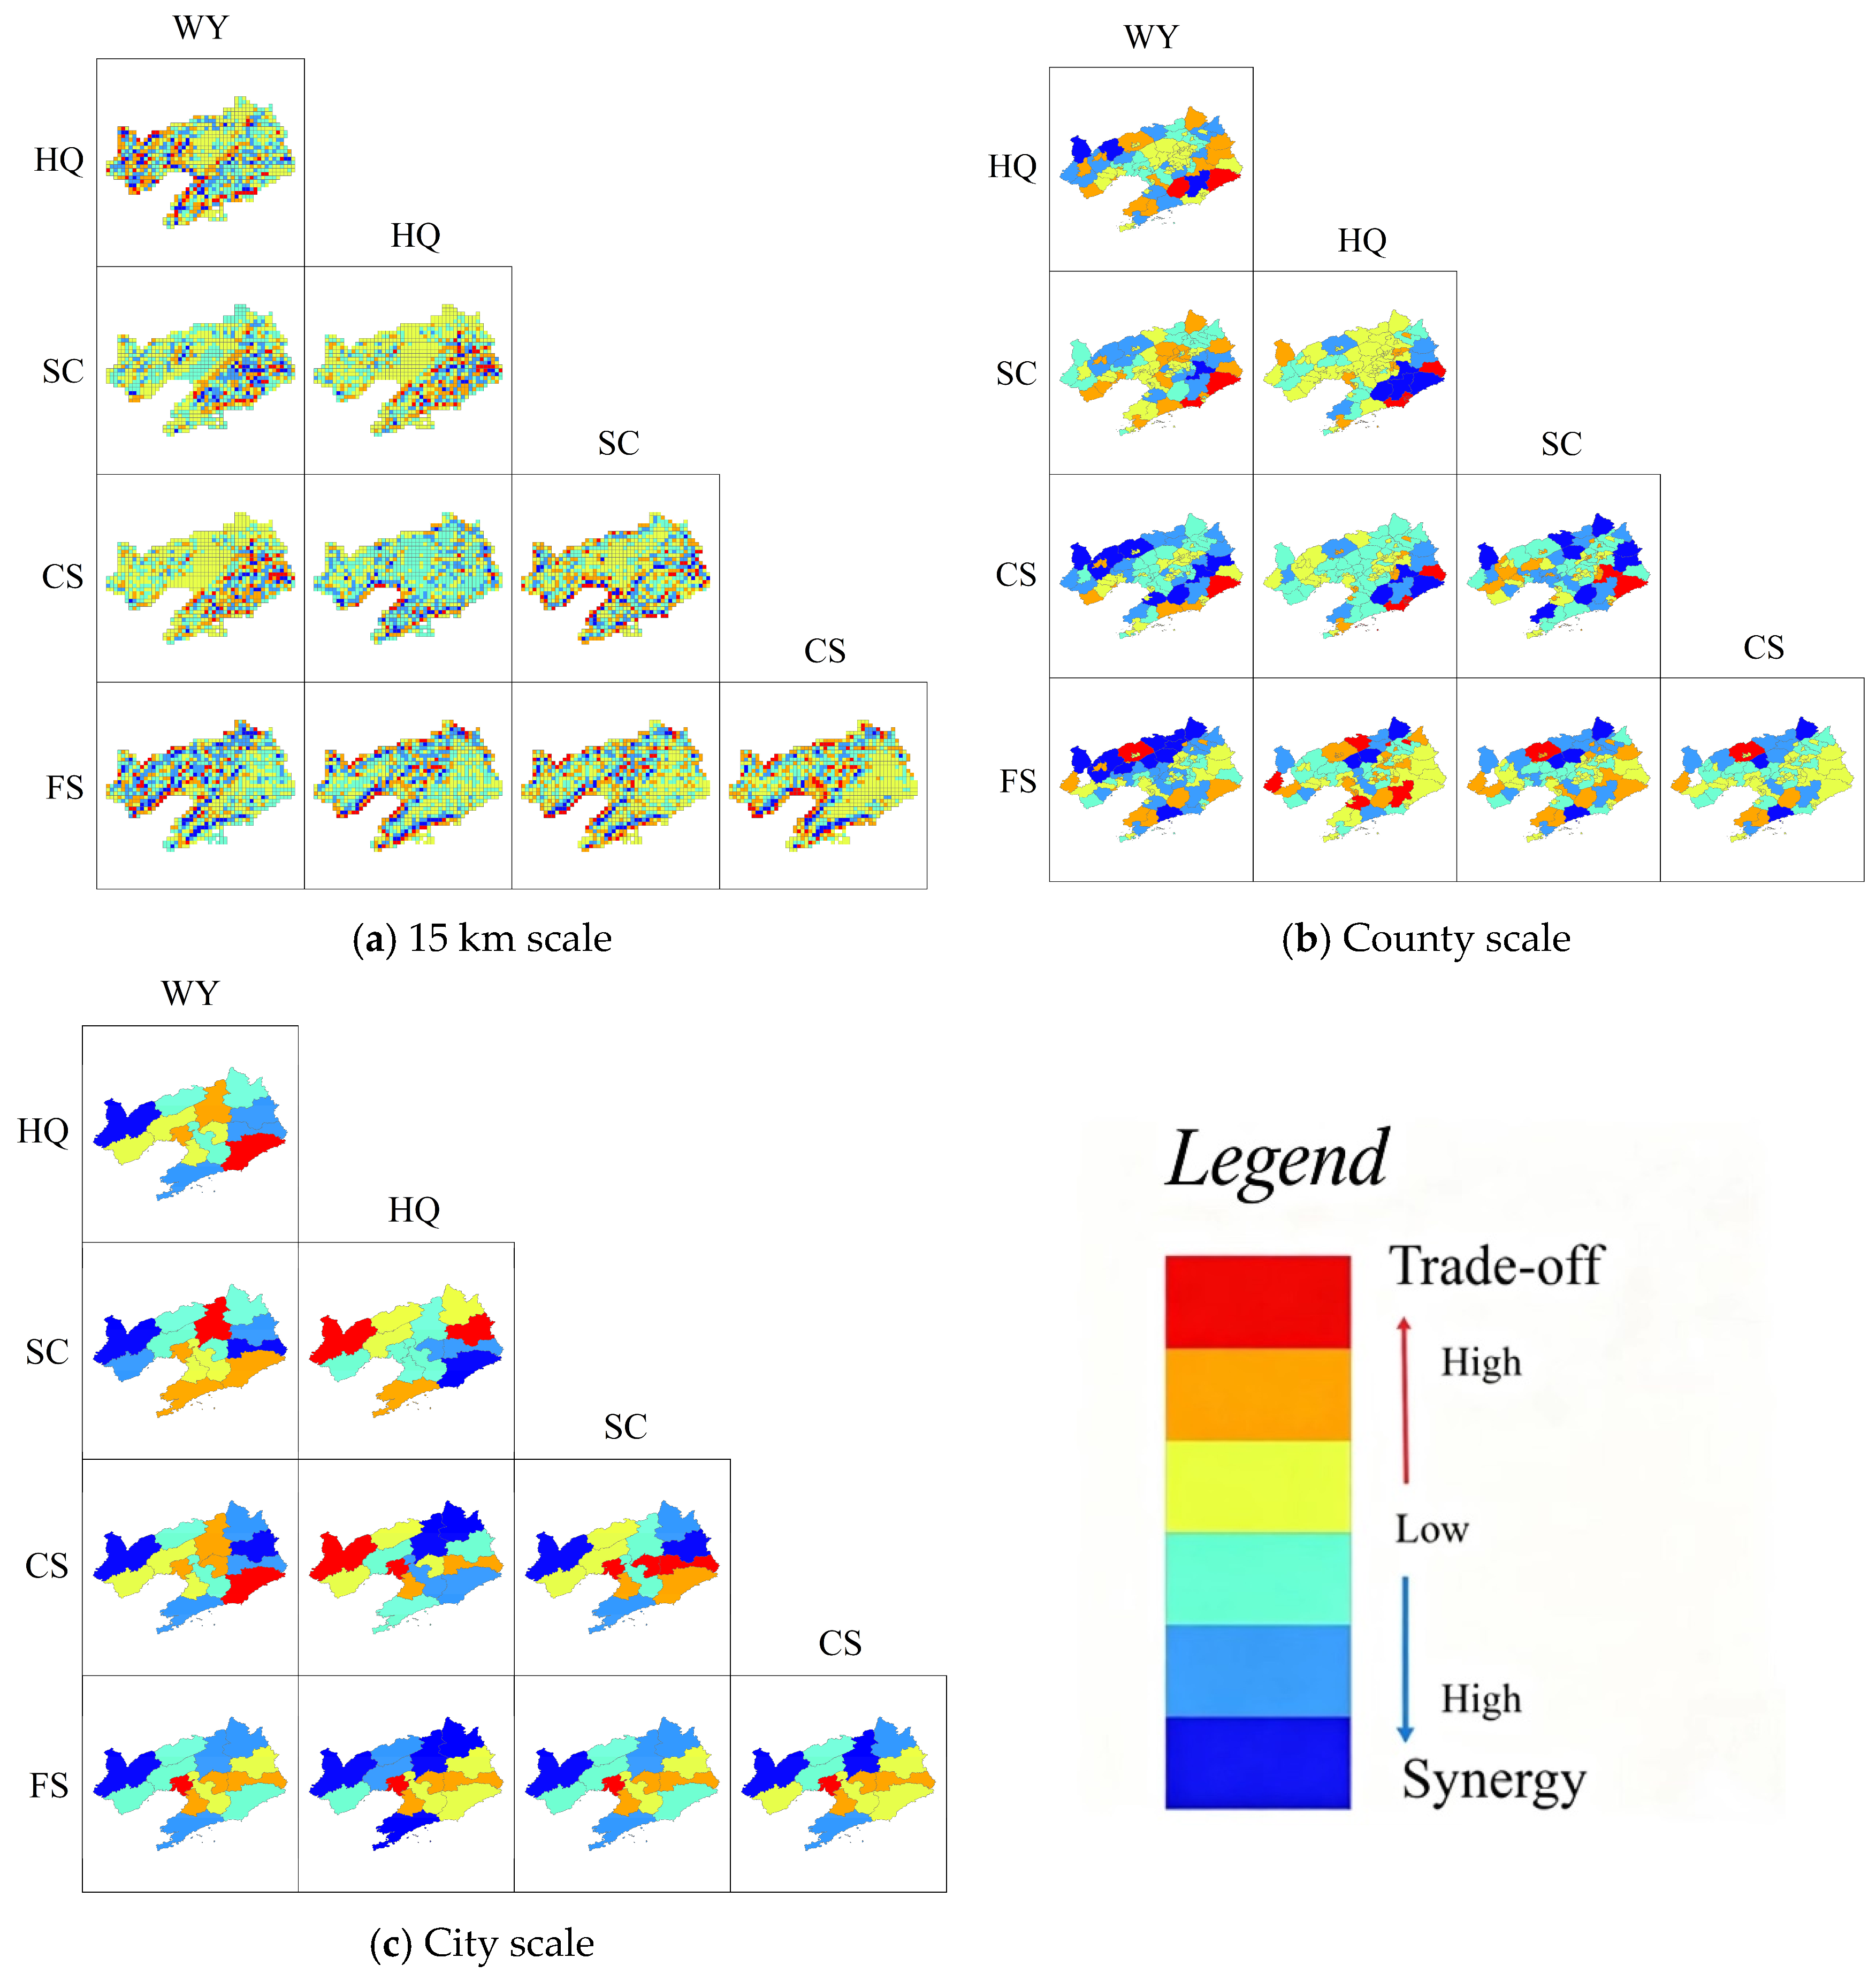
A global correlation analysis indicates that the trade-offs and synergies among ecosystem services in Liaoning Province exhibit significant scale dependence and structural stability (Figure 7). Food supply (FS) exhibits a significant negative correlation with carbon sequestration (CS), soil conservation (SC), habitat quality (HQ), and water yield (WY) across all three scales, forming a stable trade-off relationship. The intensity of this trade-off is highest at the grid scale and gradually weakens at the county and city scales. This pattern may be related to competition between agricultural production spaces and ecological conservation areas; farmland expansion continues to encroach upon ecological lands such as forests and wetlands, leading to a decline in the supply capacity of regulating and supporting services. In contrast, regulatory and supporting services generally exhibit a synergistic relationship. Carbon sequestration, soil conservation, habitat quality, and water yield demonstrate high synergy at the grid scale, with the forest ecosystems of the Eastern Liaoning Mountains exhibiting a strong synergistic pattern of simultaneous improvement in multiple services. As the scale increases to the county and city levels, ecosystem types within administrative units become more complex, leading to a differentiation in synergistic relationships, with only some services maintaining a significant positive correlation.
Figure 7.
Spatial synergies and trade-offs in cross-scale ESs.
The results of the GWR local analysis indicate that trade-offs and synergies among ecosystem services exhibit strong spatial heterogeneity. The grid scale allows for a detailed depiction of local differences: the intensity of trade-offs between food supply and carbon sequestration exhibits a pattern of “strong in the central region, weak in the east and west,” with the most prominent trade-offs occurring in urban–agricultural composite areas such as Shenyang, Anshan, and Panjin; the trade-off between food supply and soil conservation exhibits a pattern of “strong in western Liaoning, weak in eastern Liaoning,” as the semi-arid reclaimed farmland in western Liaoning is ecologically fragile, and agricultural development has a significant impact on soil conservation functions. The synergy between carbon sequestration and water yield exhibits a “strong in Eastern Liaoning, weak in Western Liaoning” pattern. In Eastern Liaoning, high vegetation cover and abundant precipitation form a strong synergistic support, whereas in Western Liaoning, aridity and water scarcity limit this synergy. Spatial heterogeneity at the county level shows some convergence, but the core patterns remain stable. At the urban scale, distinct regional differentiation is evident: economically developed cities such as Shenyang, Dalian, and Anshan are characterized by a predominance of service trade-offs, while eco-cities are dominated by synergies; in contrast, degraded cities in Western Liaoning exhibit an overall low level of service provision and weak interrelationships. These patterns clearly reveal how natural conditions and human activities jointly shape the pattern of service interactions, providing scientific support for the zoned and categorized implementation of ecosystem service synergy optimization in Liaoning Province.
3.4. Identification of Ecosystem Service Bundles
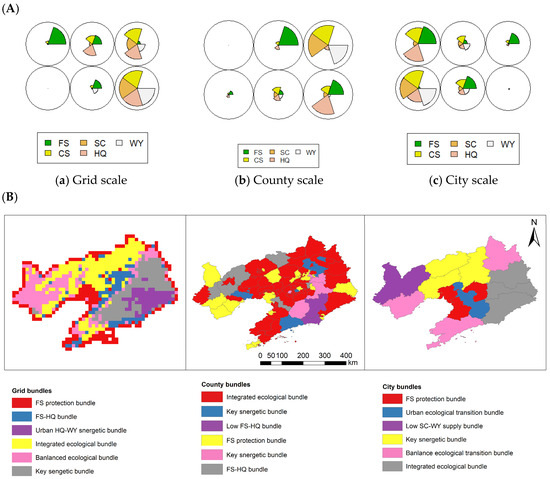
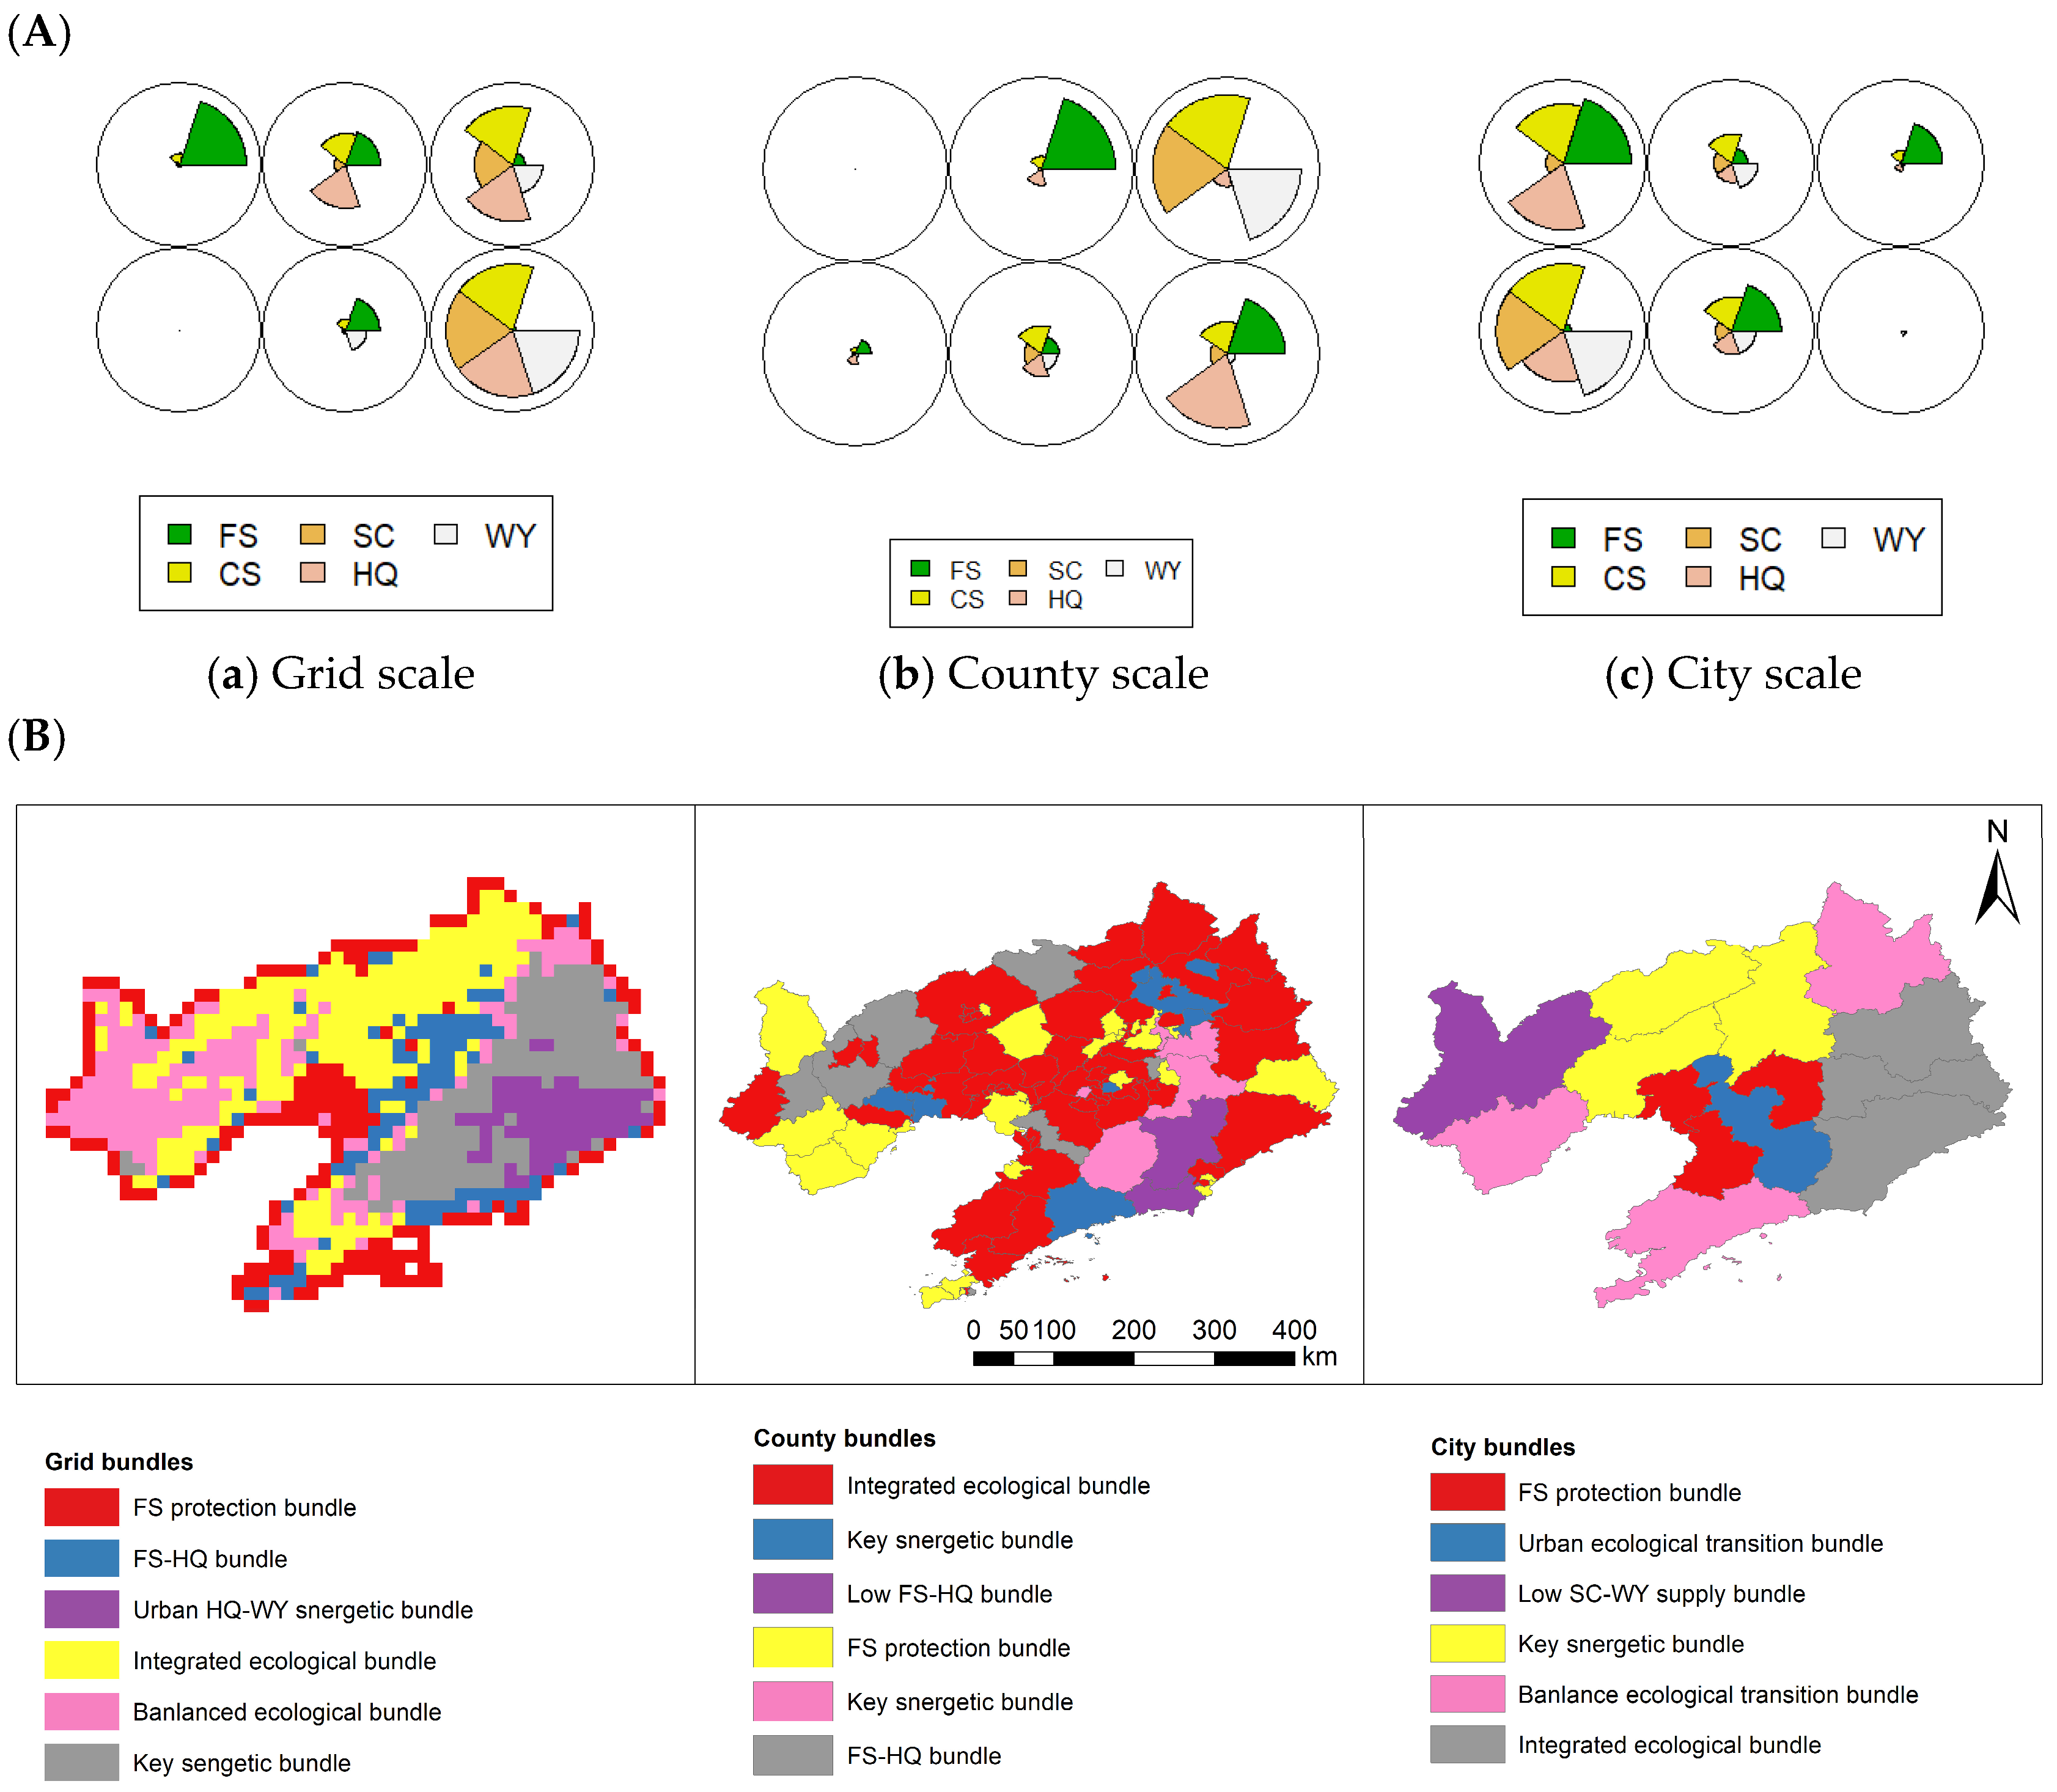
An ecosystem service bundle (ES bundle) is a functional combination of multiple services that coexist stably over the long term in a given spatial area; it provides an intuitive reflection of the multifunctional supply patterns and dominant service types of regional ecosystems. To reveal the spatial clustering characteristics and functional combination patterns of ecosystem services in Liaoning Province, this study employed the self-organizing map (SOM) method to conduct ecosystem service clustering and type identification across three spatial scales: 15 km grid, county, and city. Through unsupervised learning, spatial units with similar service structures and functional characteristics were grouped into the same service bundle, thereby characterizing the overall functional pattern of regional ecosystem services and their cross-scale evolution. The SOM model effectively reduces redundancy in multi-dimensional service data while preserving intrinsic inter-service relationships and spatial heterogeneity. It accurately identifies typical functional combinations such as mountainous synergy, plain provisioning, wetland composite, urban degradation, and ecological fragility, providing an intuitive typological basis for the multifunctional zoning and differentiated management of ecosystems in Liaoning Province. The number, structure, and spatial distribution of ES bundles exhibit significant differences across scales; as the scale increases, local heterogeneity is integrated, and the types of service bundles tend to simplify. The corresponding classification results are shown in Figure 8A,B.
Figure 8.
(A) SOM radial histogram; (B) spatial distribution of ES bundles at different scales.
Clustering results based on the SOM model indicate that ecosystem service combinations in Liaoning Province exhibit significant spatial heterogeneity and scale dependence, displaying distinct features of typological simplification and functional aggregation as the scale increases. At the grid scale, five typical ES bundles can be distinctly identified: the Mountain Multifunctional Synergistic Bundle is concentrated in the forested mountainous areas of eastern and western Liaoning, exhibiting high synergistic values for carbon sequestration, soil conservation, habitat quality, and water yield, serving as the core carrier of the regional ecological security barrier; the Plain Food Supply Dominant Bundle is concentrated in the central Liaohe Plain, characterized by high food supply values and low values for other services, reflecting a pattern dominated by agricultural production; the Liaohe Estuary Wetland Complex Function cluster combines carbon sequestration, biodiversity maintenance, and moderate food supply capacity, exhibiting a balanced functional structure; the Urban Ecological Degradation cluster is primarily distributed in built-up areas such as Shenyang, Dalian, and Anshan, with all service types showing consistently low values; the Western Liaoning Transition Function cluster exists in a state of ecologically fragile equilibrium, with moderate soil conservation and food supply but relatively low carbon sequestration and water yield.
At the county level, influenced by the integration of internal heterogeneity within administrative units, the number of ES clusters was reduced to four categories. The Western Liaoning Transition cluster and the Plain Supply cluster were partially merged, resulting in a more regular overall pattern. At the urban level, the classification was further simplified into three categories: ecologically synergistic cities, agriculture-dominated cities, and urban degradation cities. The composite functional characteristics of the Liao River Estuary wetlands were classified under agriculture-dominated cities. Differences across scales indicate that finer grids are better suited to capturing local functional differentiation, while administrative scales are more conducive to macro-level management. These findings provide intuitive spatial evidence for implementing multi-scale, differentiated optimization of ecosystem multifunctionality in Liaoning Province, as well as empirical references for service bundle research in old industrial bases and regions with significant ecological gradients.
3.5. Machine Learning-Based Determinants of Ecosystem Services
To accurately identify the core drivers of ecosystem services across multiple scales in Liaoning Province and select the optimal fitting model, this study employed four mainstream machine learning methods—LightGBM, Random Forest (RF), Support Vector Regression (SVR), and Extreme Gradient Boosting (XGBoost)—to conduct comparative performance tests across three spatial scales: 15 km grids, county-level, and city-level. Using Mean Absolute Error (MAE), Root Mean Square Error (RMSE), and Coefficient of Determination (R2) as core evaluation metrics, we systematically assessed the fitting capabilities and scale adaptability of different models in capturing the driving relationships of ecosystem services. This approach identified the model framework most suitable for analyzing multi-scale driving associations in the study area, thereby providing a reliable methodological foundation for subsequent SHAP interpretability analysis. The performance of different models varied significantly across scales. These accuracy differences not only reflect the algorithms’ ability to capture nonlinear relationships and spatial heterogeneity but also directly reveal the scale-dependent characteristics of ecosystem service driving associations in Liaoning Province. The relevant results are shown in Table 2.
Table 2.
Comparison of accuracy among different machine learning models across various scales.
Based on the quantitative results of model fitting and validation, all four model types demonstrated good fitting performance on the training set, with the Coefficient of Determination R2 ranging from 0.84 to 0.90. Among them, Light-BGM achieved the highest fitting accuracy, while XGBoost had the relatively lowest training accuracy. In independent validation at the county level, SVR and Light-BGM demonstrated the best predictive performance, with R2 values both approaching 0.98 and a standardized Mean Absolute Error (MASE) below 0.1; Random Forest (RF) ranked second; XGBoost had the lowest validation accuracy among the four models, with an R2 of 0.713 and relatively higher prediction error. In the city-level cross-scale validation, the generalization ability of all four models declined significantly: RF, SVR, and Light-BGM all exhibited extreme overfitting with R2 = 1.0, and their MASE values were all greater than 1, with predictive performance weaker than the mean benchmark; XGBoost, however, could not effectively calculate the coefficient of Determination R2 (denoted as NA) because the variance of the target variable in the city-level validation samples approached zero—its MASE reached 2.12, and its prediction error was the highest among the four models.
The scale-dependent variations in model performance accurately reflect the scale-dependent characteristics of ecosystem service drivers in Liaoning Province. Overall, the fitting and generalization performance of the four machine learning models at the county scale were generally reliable. Among them, SVR and LightGBM demonstrated superior comprehensive predictive performance and should be prioritized as modeling options at the county scale. However, in cross-scale prediction scenarios at the city level, all models exhibited severe overfitting and generalization failure, with insufficient spatial transferability, rendering them unsuitable for direct application in cross-scale predictions. Compared with the other models, although XGBoost did not exhibit extreme overfitting (R2 = 1) due to its built-in regularization mechanism, its cross-scale prediction error remained relatively high due to issues with spatial heterogeneity and model complexity under small sample sizes. The results of this model comparison not only elucidate the methodological foundation of this study but also provide a scientific basis for model selection in research on the driving mechanisms of ecosystem services in old industrial bases and regions with significant ecological gradients.
3.6. Multi-Scale Nonlinear Effects and Interaction Mechanisms Driving Ecosystem Services
Based on the SHAP (SHapley Additive exPlanations) model, this study interprets the XGBoost prediction results and analyzes the relative contributions of natural environmental, socioeconomic, land-use, and human activity factors to the spatial variation in ecosystem services. It should be noted that SHAP analysis is an interpretable machine learning method; its results primarily reflect the degree of contribution of different variables to model predictions, rather than causal inferences in the strict sense. Therefore, this study focuses on the associative characteristics, scale differences, and potential mechanisms of action of the driving factors, and provides a comprehensive interpretation by integrating regional socioecological processes.
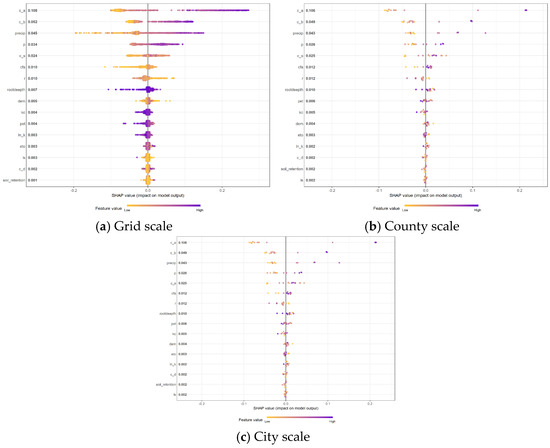
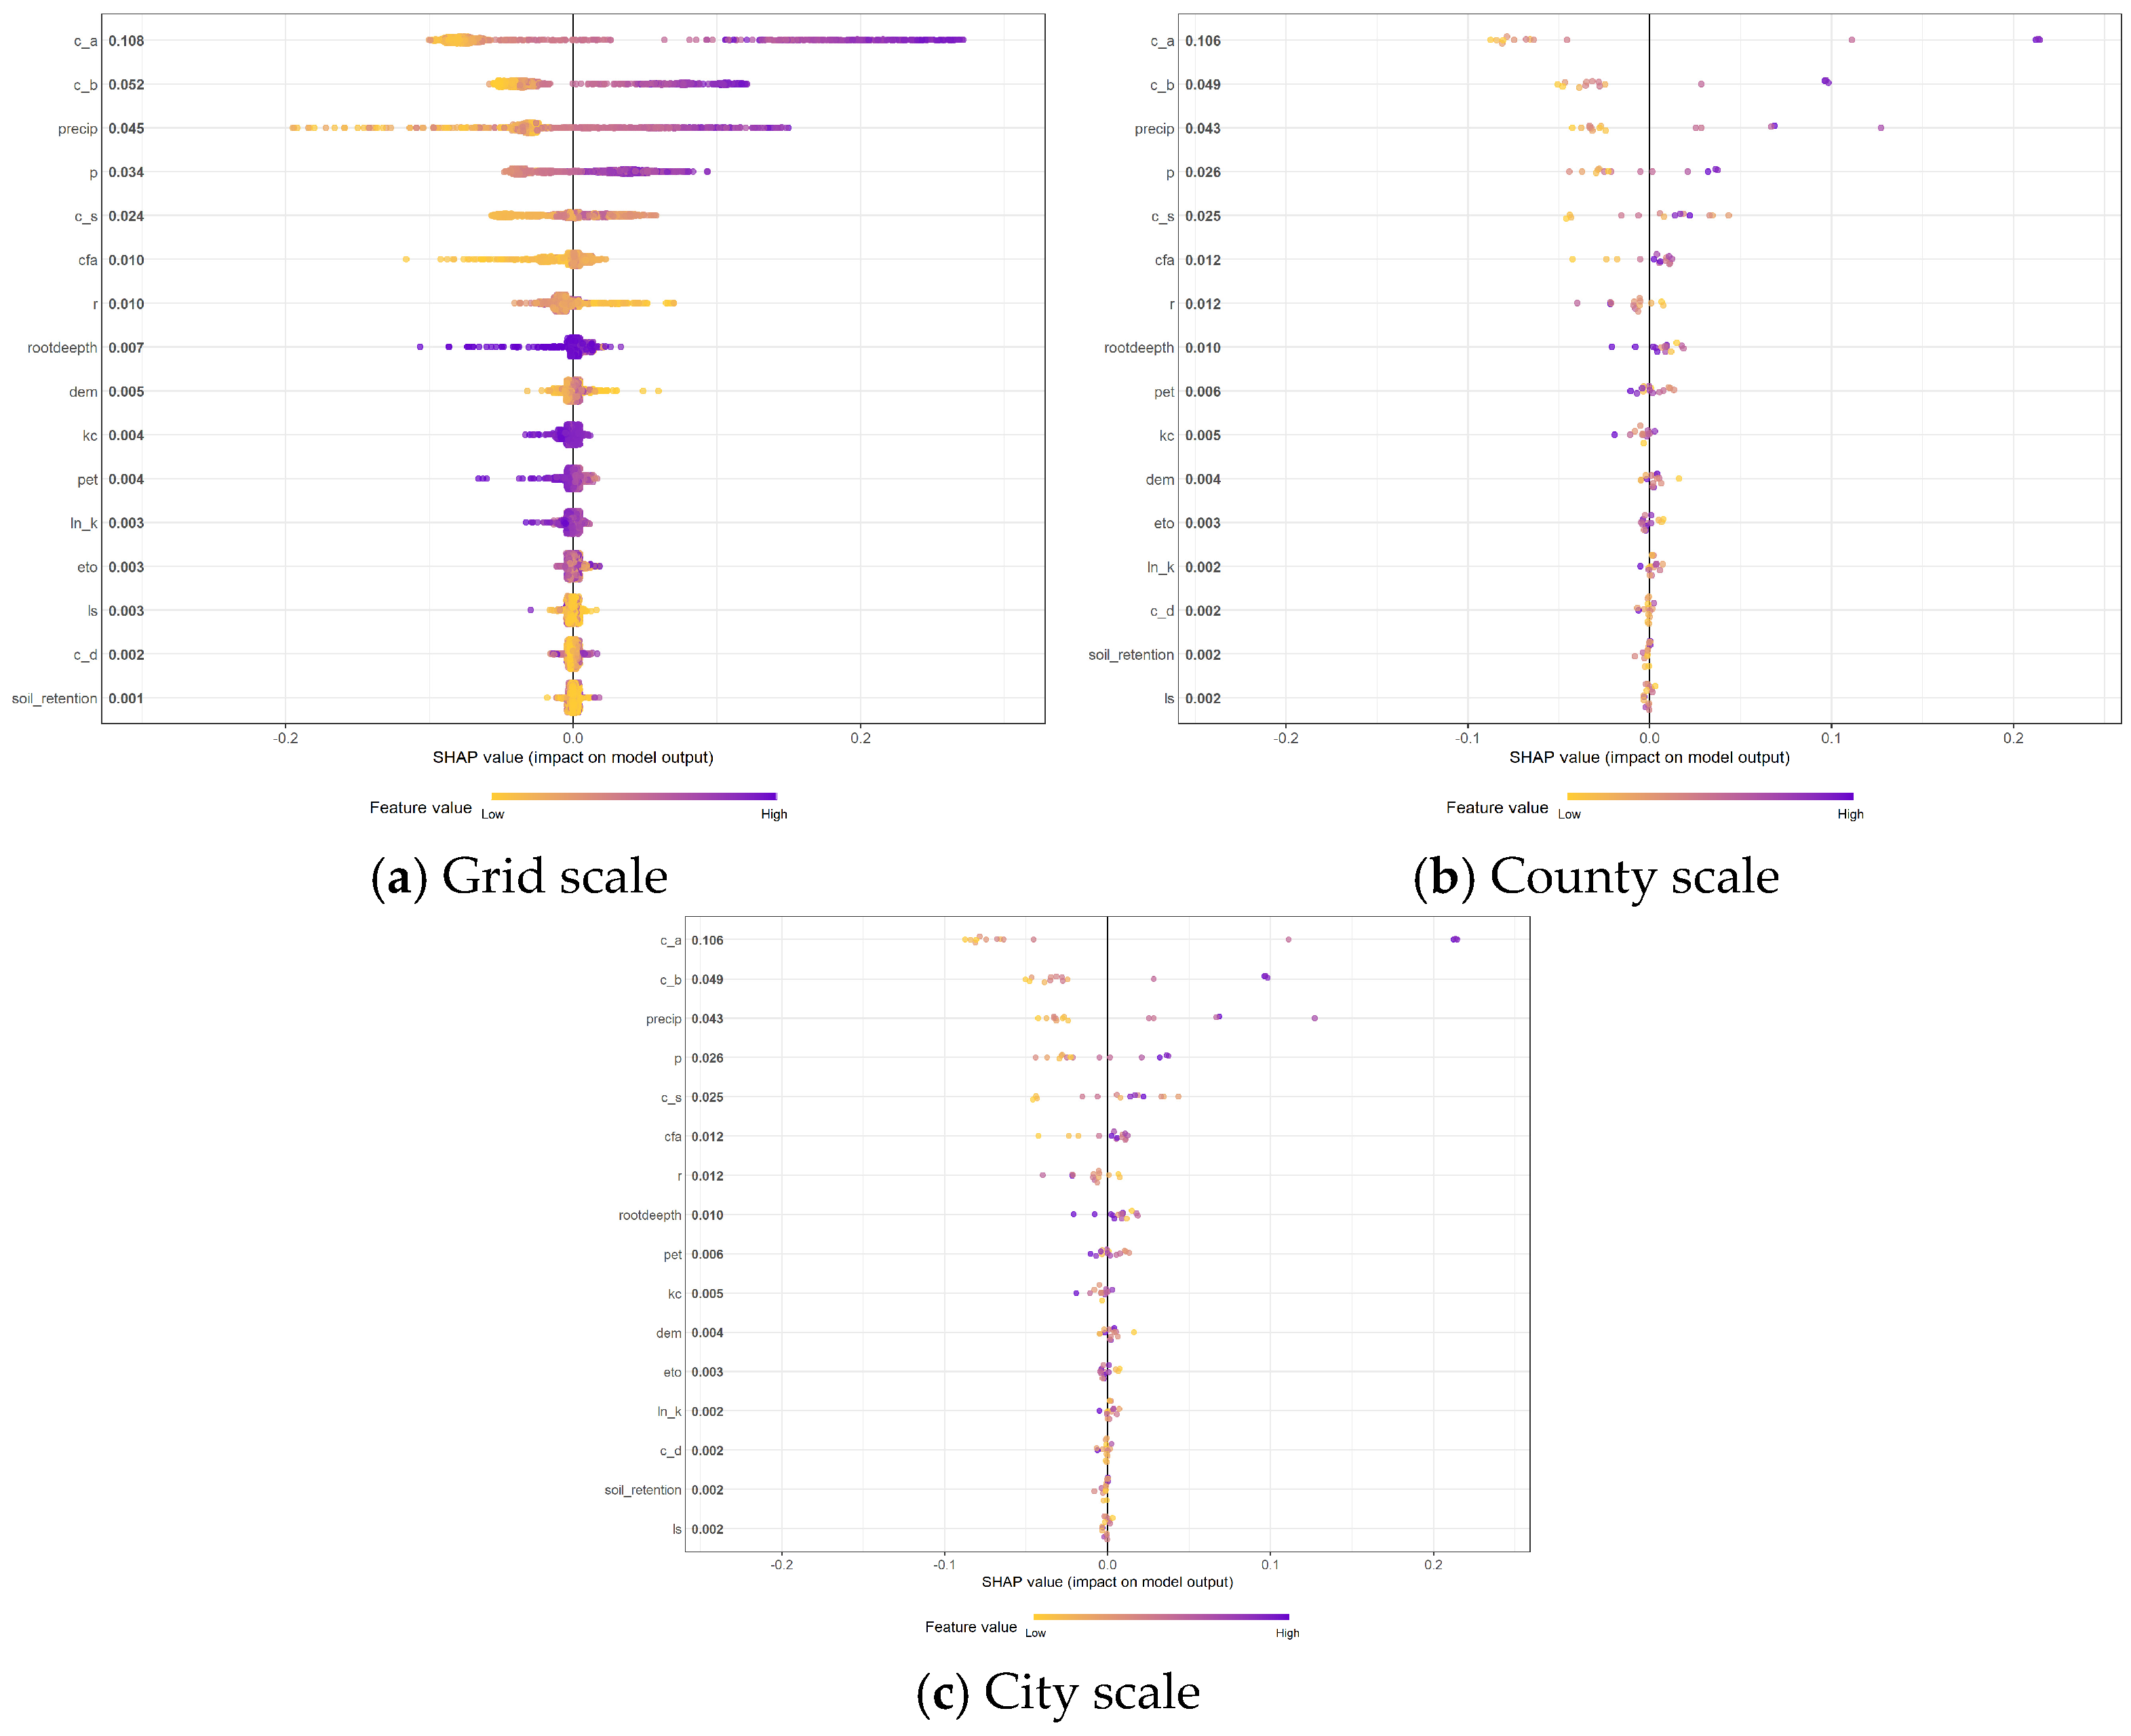
Multi-scale attribution results based on the XGBoost model combined with the SHAP explainability method show that the importance of drivers of ecosystem services in Liaoning Province exhibits a clear hierarchical structure, and that the core dominant factors remain stable across different scales. Across the three scales—grid, county, and city—the landscape pattern index c_a consistently ranked first in terms of average absolute SHAP values (0.108, 0.093, and 0.106, respectively), making it the core driver contributing most significantly to ecosystem services. The landscape pattern index c_b and the precipitation factor precip constitute the second tier of drivers, with average absolute SHAP values ranging from 0.04 to 0.05; local factors such as soil water-holding capacity, slope, and reference crop evapotranspiration all have average absolute SHAP values below 0.01, indicating weak explanatory power for the model output. In terms of the direction of influence, core factors such as c_a, c_b, and precip all exhibit typical gradient effects: high values of these characteristics correspond to positive SHAP values, significantly enhancing the provision of ecosystem services; low values correspond to negative SHAP values, manifesting as a pronounced inhibitory effect, and overall, they follow a monotonically positive correlation pattern.
Changes in spatial scale significantly modulate the relative importance and functional characteristics of driving factors, revealing clear scale-dependent patterns. First, the regulatory role of landscape pattern factors exhibits cross-scale stability; c_a occupies a primary position across all three scales, indicating that the dominant role of land-use and landscape spatial configurations in ecosystem services is unaffected by changes in spatial granularity and constitutes a core regulatory factor for ecosystem service provision. Second, the explanatory power of climatic factors is particularly pronounced at the county scale, where precipitation (precip) surpasses c_b in importance, becoming the second-most significant driving factor. This reflects that, as the basic unit of ecological governance, counties are characterized by water and thermal conditions and landscape patterns jointly exerting a key regulatory role; at the municipal scale, the importance of precipitation factors declines slightly, primarily due to the small sample size of administrative units and increased estimation variability. Third, local, fine-scale factors exhibit a pronounced scale-dependent attenuation effect. Factors such as soil properties, terrain slope, and vegetation root depth exhibit only weak explanatory power at the grid scale; as spatial aggregation increases, their local effects are gradually smoothed out, and their contributions at the county and city scales continue to decline, making it difficult for them to exert a significant influence on overall regional ecosystem services. Furthermore, at the grid scale, the sample size is sufficient, the distribution of SHAP values is continuous and dense, and the gradient effects of the factors are clearly defined; at the county and city administrative scales, the sample size decreases, the distribution of points becomes more discrete, and the influence of outlier samples on the model increases.
3.7. Multi-Scale Nonlinear Effects and the Mechanisms of Interaction with Ecosystem Services
Following the identification of the dominant driving factors through the multi-scale SHAP contribution analysis (Figure 9), further investigation was conducted to reveal the nonlinear response characteristics and threshold effects of key variables. Although SHAP values quantify the relative contribution of each predictor to ecosystem service variation, they cannot directly characterize how predictor changes affect model outputs across their value ranges. Therefore, SHAP dependence plots were employed to examine the marginal effects, response directions, and potential ecological thresholds of dominant drivers at different spatial scales.
Figure 9.
SHAP-value map of Liaoning Province.
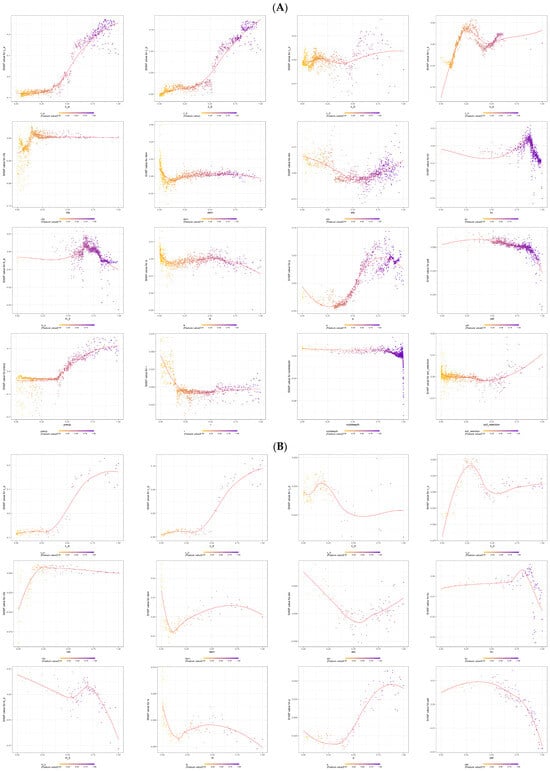
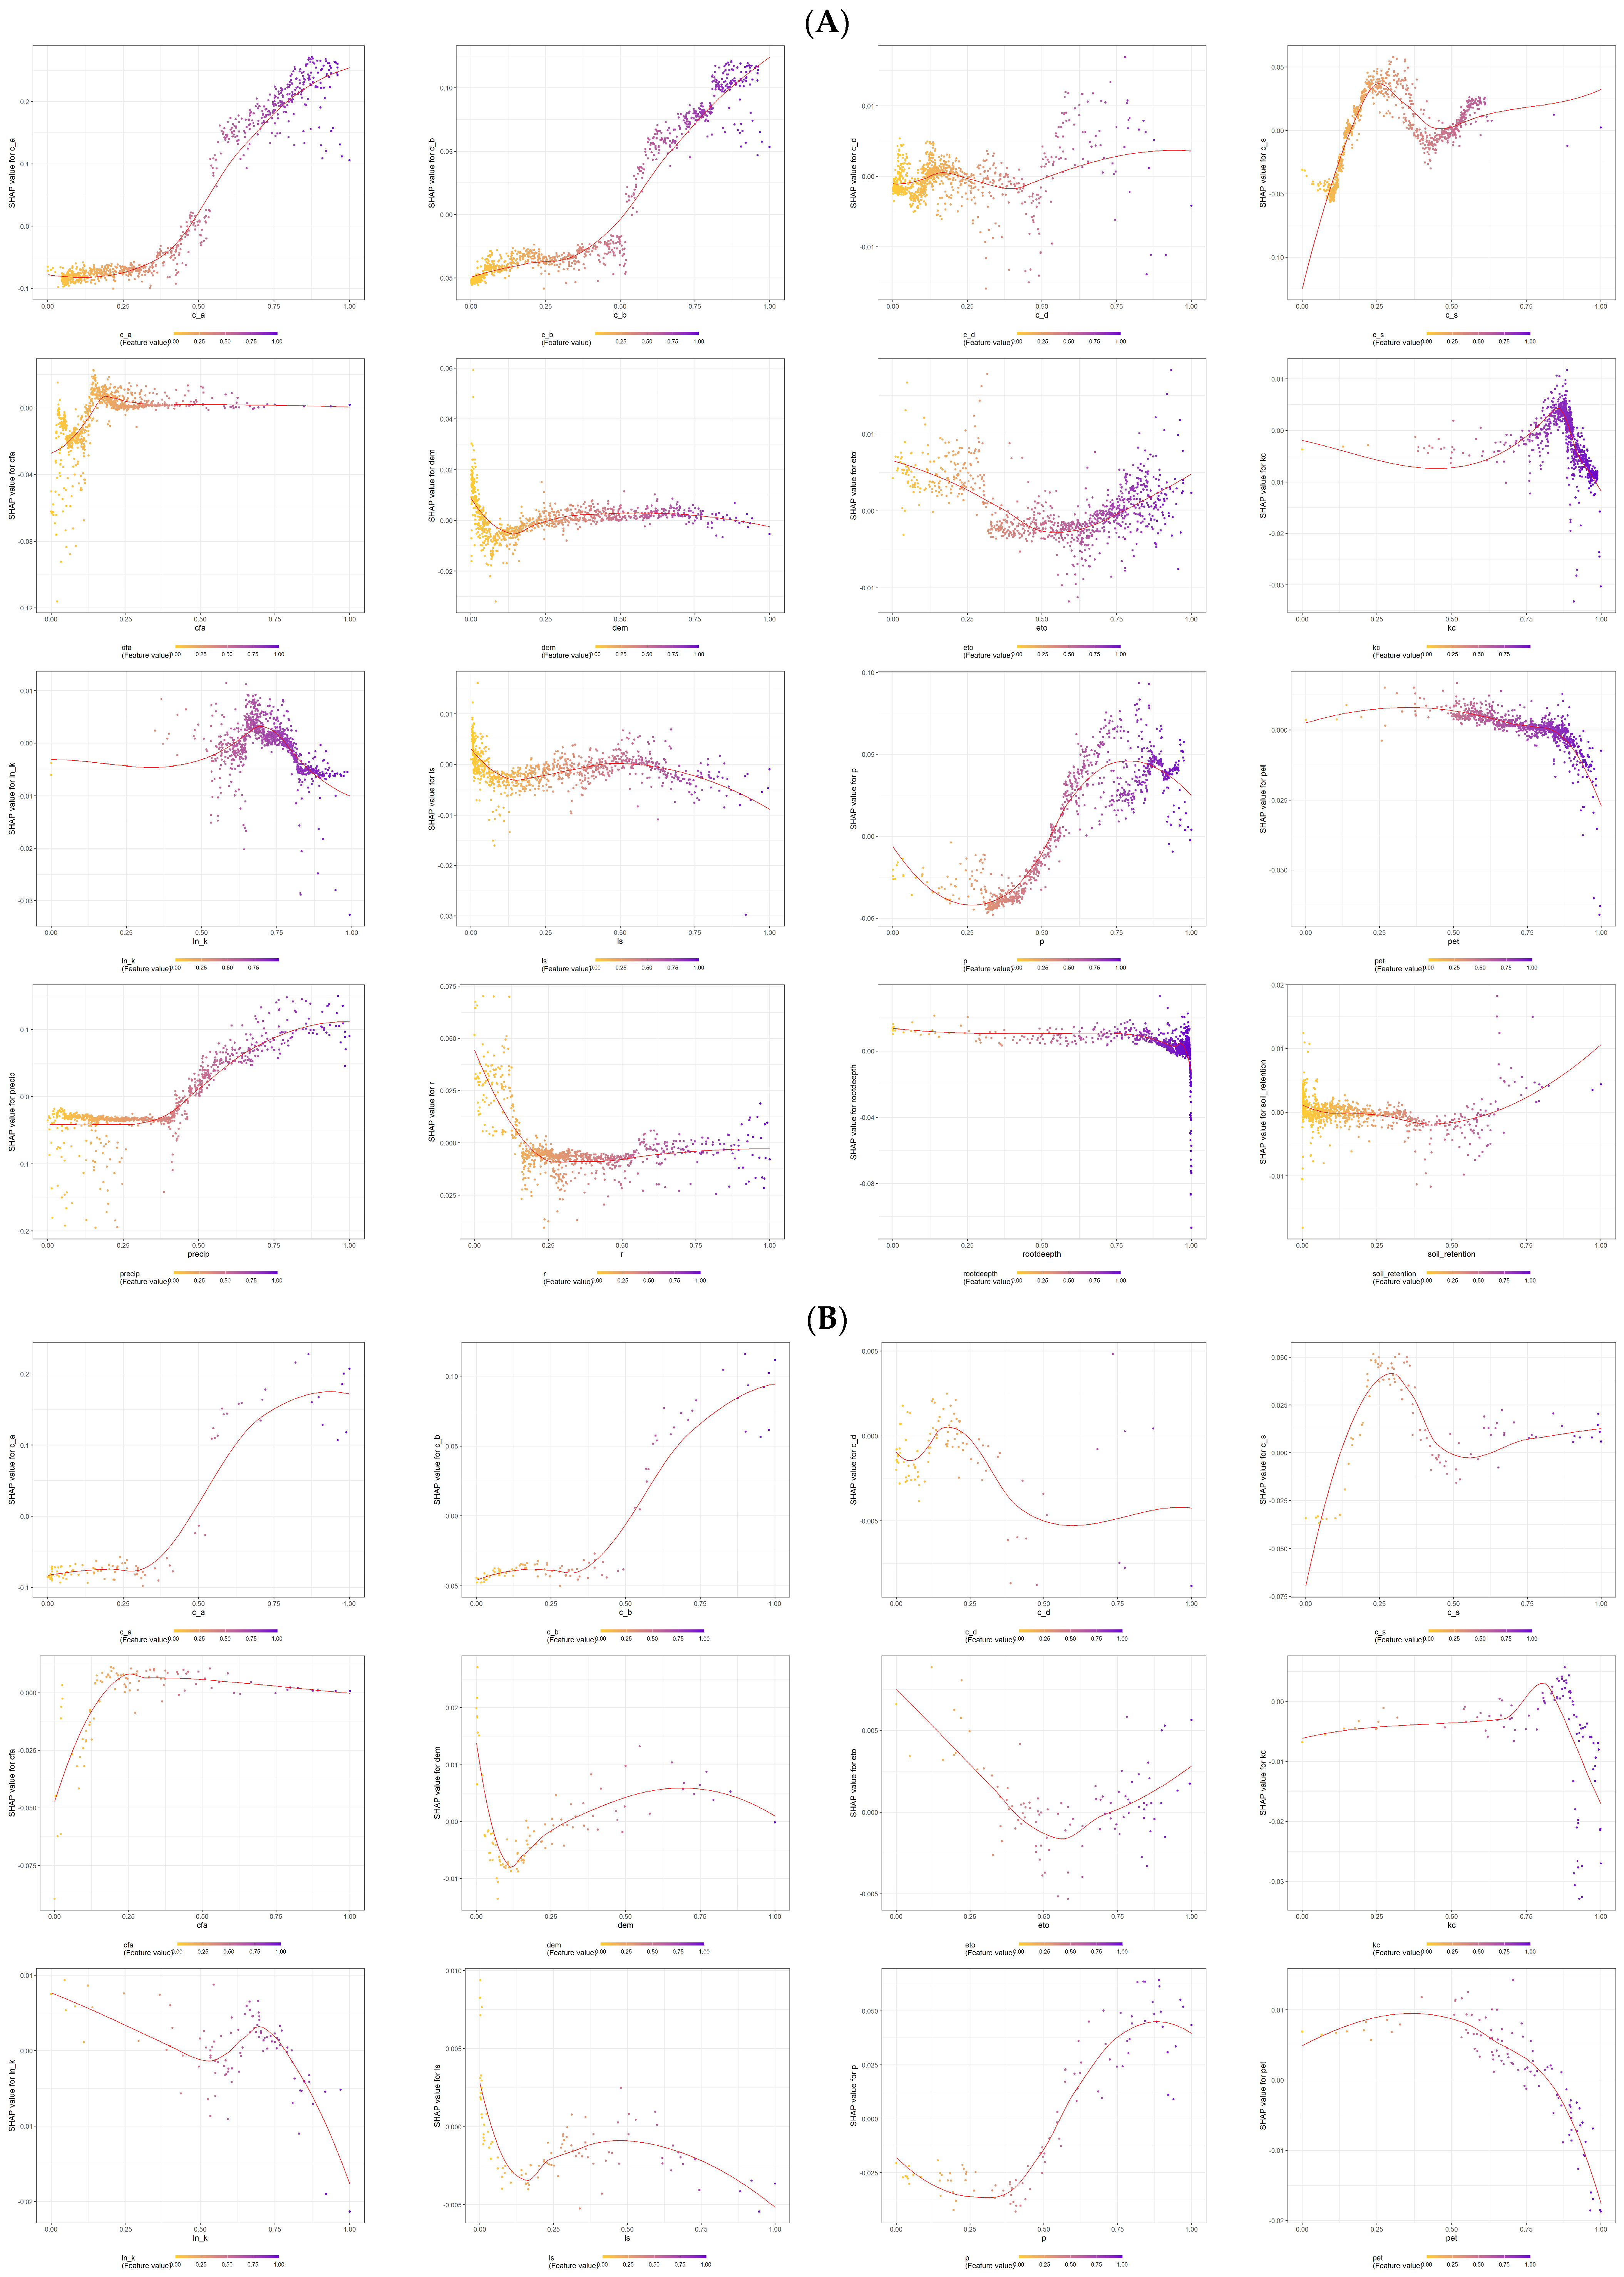
At the grid scale, where local ecological heterogeneity is best preserved, the relationships between major environmental factors and ecosystem service responses were first analyzed. The nonlinear response patterns of dominant variables, including vegetation carbon pools, precipitation, evapotranspiration, and soil-related factors, are presented in Figure 10A.
Figure 10.
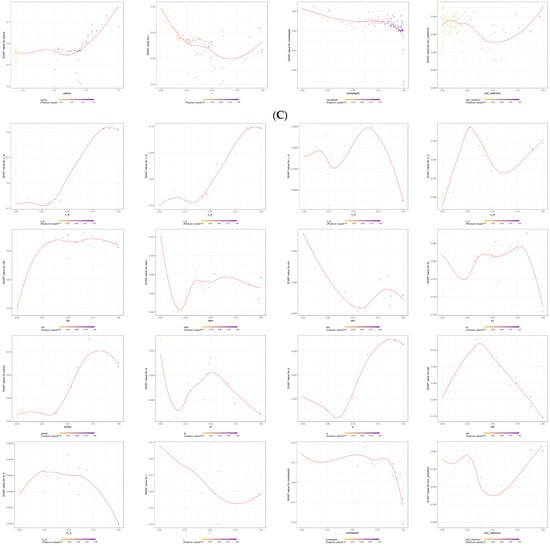
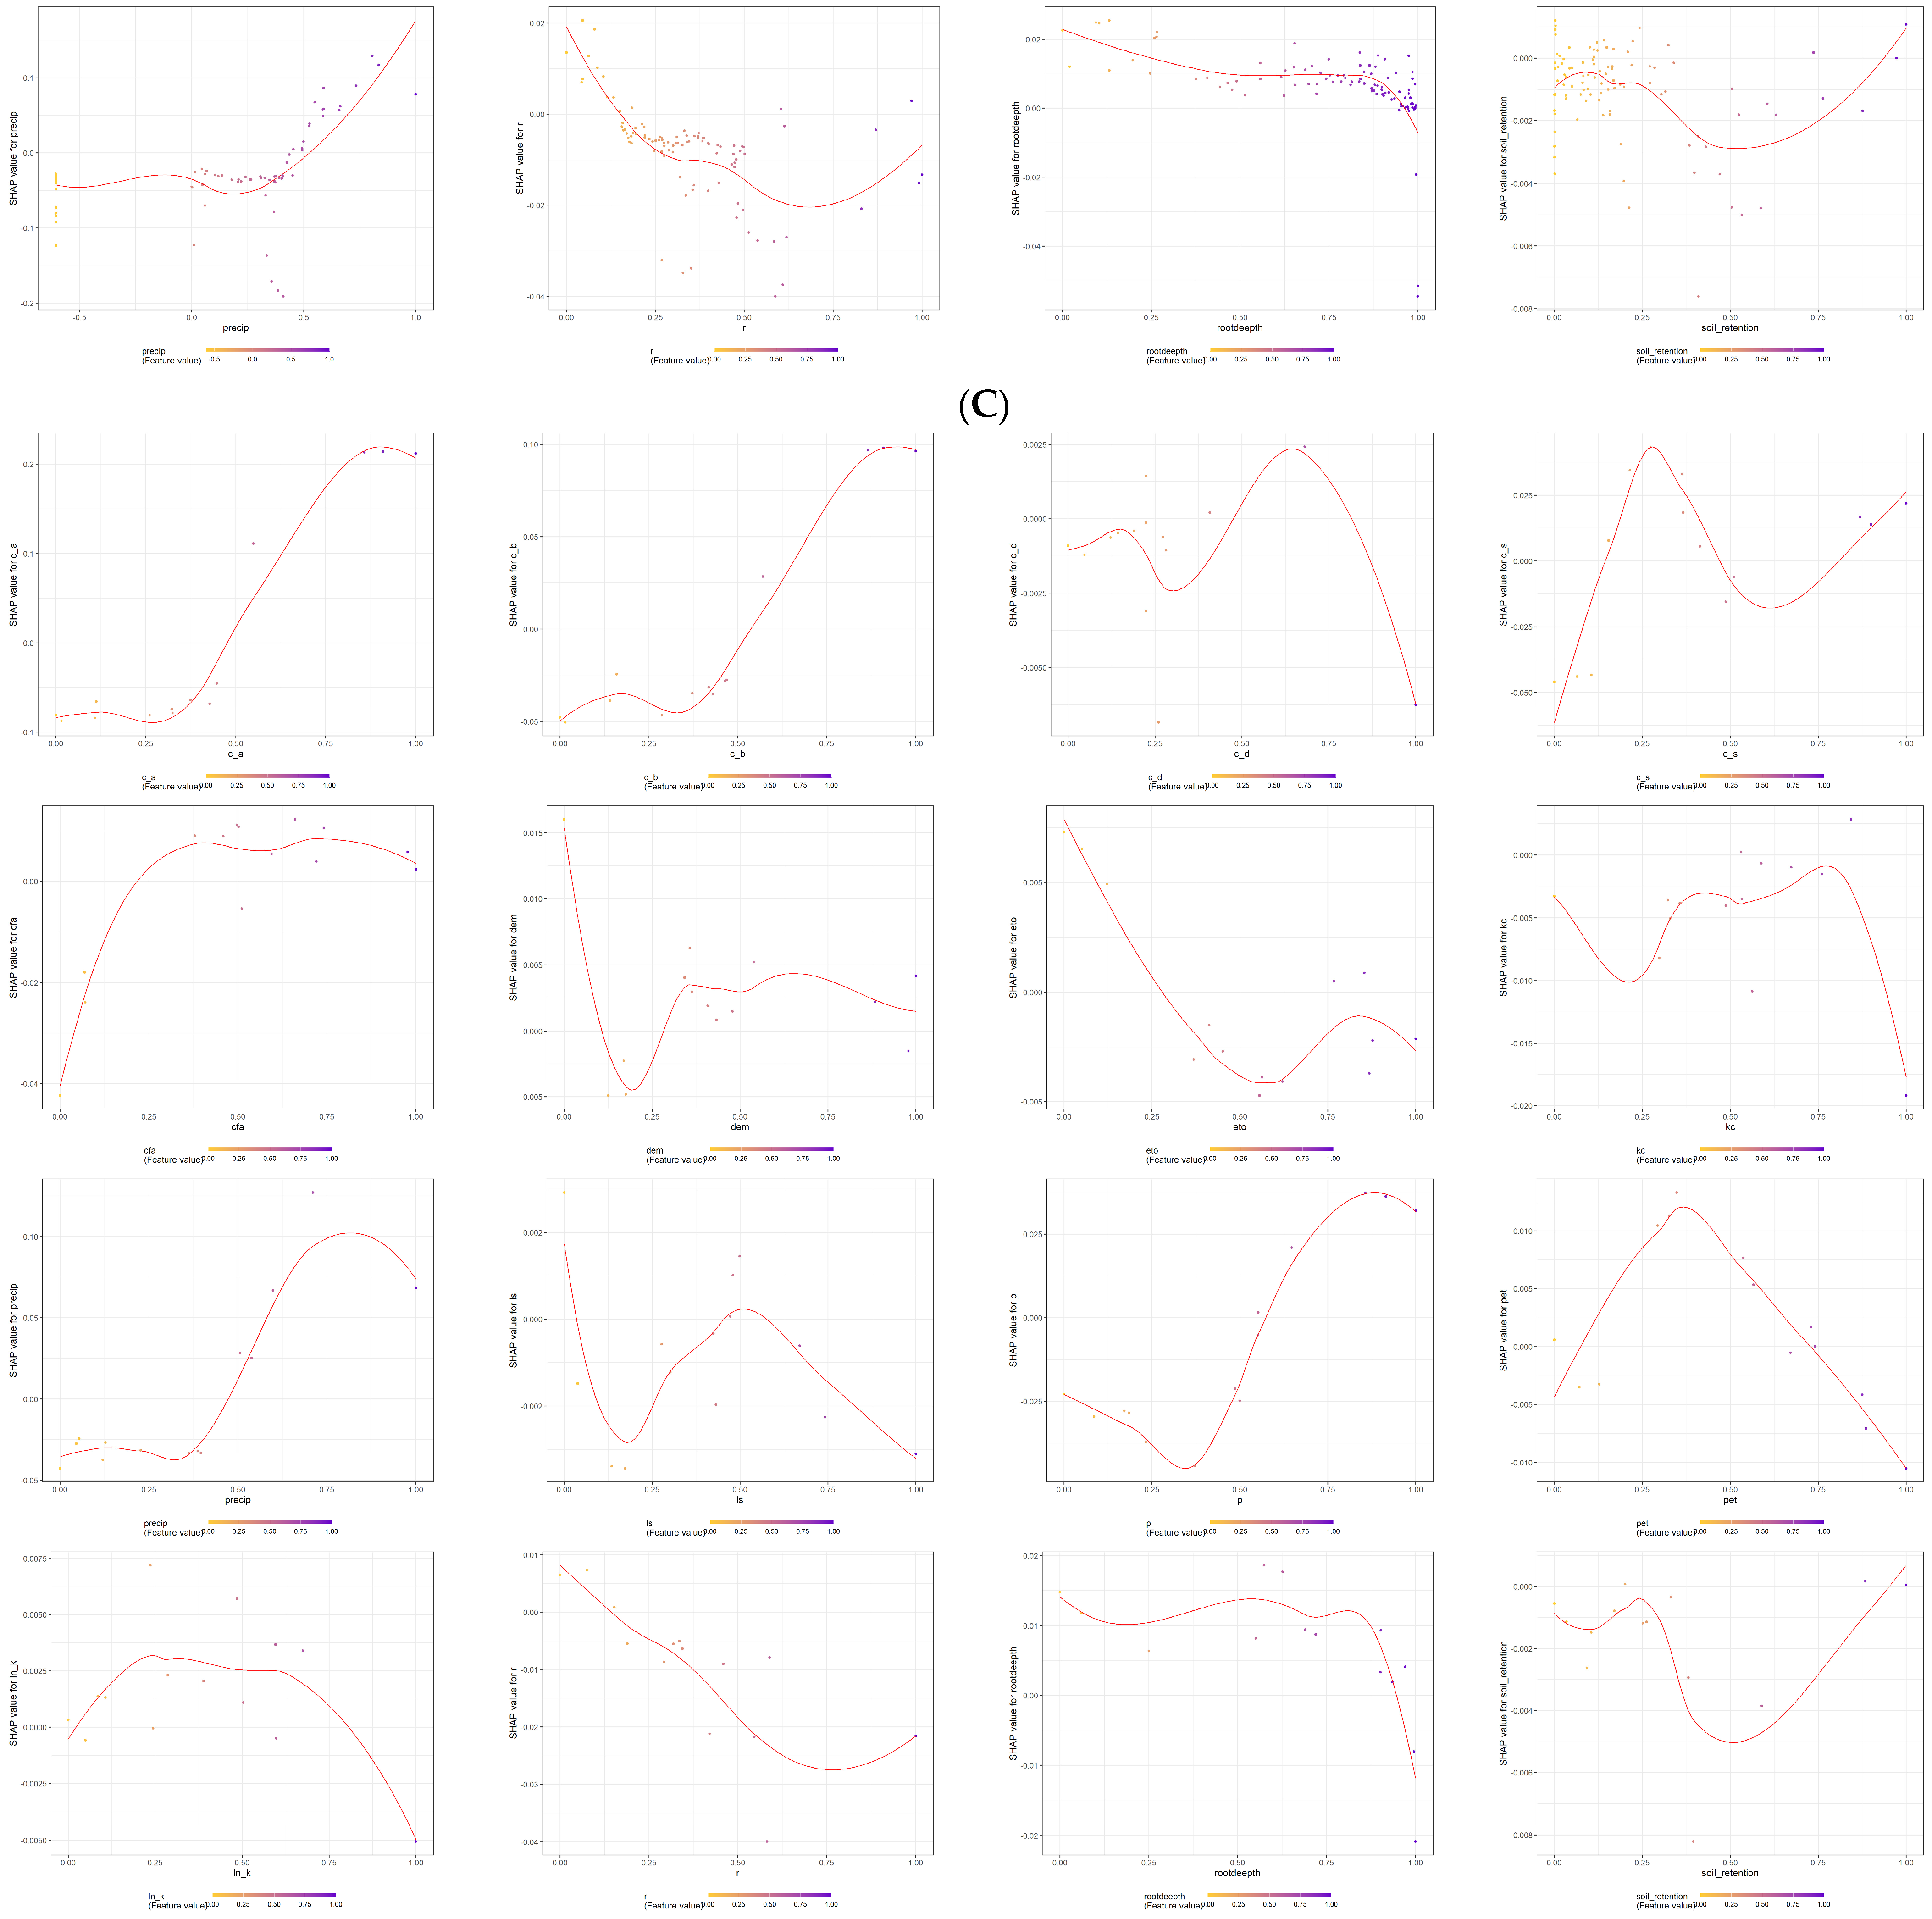
(A) Grid-scale SHAP dependence plot. (B) Country-scale SHAP dependence plot. (C) City-scale SHAP dependence plot.
Based on the XGBoost-SHAP explainable machine learning model, this study quantified the contribution and marginal effects of various driving factors on the target variable. The results indicate that the effects of these factors on ecosystem services generally exhibit significant nonlinear characteristics and threshold effects rather than simple linear relationships.
SHAP analysis indicates that carbon pool factors are the dominant drivers of spatial variation in the target variable, with aboveground biomass carbon (c_a) making the largest contribution, followed by belowground biomass carbon (c_b) and precipitation (precip); soil carbon (c_s) and soil and water conservation measures (p) also exhibit high importance. Topographic and soil property factors made relatively minor contributions, while vegetation carbon pools and moisture conditions were the core determinants of the spatial pattern of ecosystem services in the study area. The marginal effects of each driving factor exhibited significant nonlinearity and threshold characteristics. c_a and c_b showed “S-shaped” responses: their effects were mild when values were below 0.5, but the positive effects increased rapidly once the threshold was exceeded. Precipitation also has a critical point at 0.5; low precipitation constrains ecosystem services, while its positive effect increases linearly once the threshold is exceeded. ETO and p exhibit a “U-shaped” curve, with a negative impact in the middle range, reflecting the antagonistic effects of water and heat processes. Soil carbon (c_s) follows an inverted U-shaped curve, with marginal benefits diminishing after reaching a contribution peak at 0.25. Topography and soil auxiliary factors also exhibit marginal constraint effects: as elevation rises above 0.25, the contribution shifts from positive to weakly negative; root depth exhibits a sudden change at 1.0, with deep roots significantly inhibiting hydrological processes. The crop coefficient (kc) forms a peak threshold at 0.8; beyond this value, ecosystem service functions decline rapidly. In summary, the XGBoost-SHAP model reveals the nonlinear driving mechanisms of ecosystem services, with vegetation carbon pools and precipitation serving as core drivers, and clear thresholds for their effects, providing a quantitative basis for precise ecological regulation.
At the county scale (Figure 10B), the driving mechanisms of ecosystem services exhibit a pronounced spatial integration effect: compared to the 15 km grid scale, the contribution of local environmental factors further decreases, while the importance of landscape structure and climatic factors—which exert regional control—increases. SHAP dependencies indicate that landscape pattern factors continue to exhibit strong explanatory power, with c_a (aboveground carbon-related landscape factor) and c_b (belowground carbon-related factor) consistently emerging as the primary driving variables. This suggests that vegetation carbon pools and their spatial distribution are the core foundations influencing the region’s capacity to provide ecosystem services.
However, compared to the grid scale, the response curves of the driving factors at the county scale are smoother, and the characteristics of local abrupt changes are significantly attenuated. This suggests that spatial aggregation at the administrative unit scale attenuates microenvironmental differences, causing ecosystem service responses to gradually shift from local ecological processes to regional integrated regulatory processes. In particular, the importance of the precipitation factor (precip) has significantly increased at the county scale, and its SHAP value exhibits a stable positive response relationship, indicating that moisture conditions have become a key factor limiting the maintenance of regional ecosystem functions.
Specifically, c_a and c_b exhibit a distinct nonlinear enhancement effect. When carbon stock levels are low, the growth in their contribution to ecosystem services is slow; once a certain threshold is exceeded, the SHAP values increase rapidly, indicating that vegetation restoration can generate gains in ecosystem functions once it reaches a certain level. Precipitation exhibits a typical water-limiting effect, with ecosystem services in low-precipitation areas being significantly suppressed, while the ecosystem’s regulatory capacity gradually increases as precipitation rises. ETO exhibits a nonlinear negative feedback relationship; higher evapotranspiration demands may increase water stress on the ecosystem, thereby reducing its capacity to provide ecosystem services. The influence of soil attributes (soil retention, c_s) and topographic factors (DEM, LS) further weakens, suggesting that at the county scale, their effects are primarily manifested indirectly through landscape patterns and water–heat conditions.
This shift in scale indicates that, at the county management level, the mechanism underlying ecosystem service formation has gradually shifted from “environmental resource constraints” to “joint regulation by ecological structure and climatic conditions.”
At the city scale (Figure 10C), due to the further increase in spatial aggregation, the relationships driving ecosystem services exhibit greater complexity and scale dependence. Compared to the grid and county scales, the SHAP response curves are generally more discrete, and the contributions of some factors show fluctuations and intensification. This reflects that, under conditions of smaller sample sizes, ecological heterogeneity within administrative units is compressed, while urban development patterns exert a stronger influence on ecological processes.
At the municipal scale, the landscape pattern factor c_a continues to make the highest contribution, indicating that land-use structure and the configuration of ecological spaces are dominant factors that remain stable across scales. This further demonstrates that ecosystem services are not determined solely by the natural environment but are subject to long-term control by regional land-use practices and patterns of ecological space organization. This is primarily manifested as follows: (1) The cross-scale stability of landscape pattern factors has increased; c_a and c_b still maintain high SHAP contributions at the municipal scale, indicating that even as the spatial scale expands, the structure of ecological space remains a key factor determining differences in ecosystem services. Differences in ecosystem service levels among cities essentially reflect variations in the proportions of forests, farmland, wetlands, and built-up areas, as well as their spatial connectivity. (2) The role of climatic factors tends to become regionalized—precipitation (precip) still maintains a positive contribution at the city-level scale, but its response curve flattens, indicating that the impact of precipitation on ecosystem services has shifted from a direct limiting effect to a regional ecological background condition. At the same time, as environmental variations within the city scale are averaged out, the importance of local water and heat conditions decreases. (3) The impacts of human activities and land use gradually become apparent. Compared to fine-scale analyses, land-use-related indicators exhibit greater significance at the city scale. This indicates that, at the city scale, differences in ecosystem services are not only controlled by natural gradients but are also influenced by a combination of factors, including urban expansion, the intensity of agricultural production, and ecological space conservation policies.
The results of the SHAP analysis across three scales indicate that the driving mechanisms of ecosystem services exhibit significant scale dependence: at the grid scale, ecosystem services are primarily jointly controlled by vegetation carbon pools, moisture conditions, and local environmental factors, reflecting micro-scale ecological processes. At the county scale, the driving mechanisms gradually shift toward landscape structure and regional water and heat conditions, reflecting comprehensive regulatory effects at the ecological management unit scale. At the city scale, land-use patterns and regional development models become key factors influencing variations in ecosystem services, reflecting the coupling between the natural environment and human activities. Therefore, strategies for enhancing ecosystem services should not adopt a single-scale management model but should instead implement differentiated regulatory measures based on a spatial scale: at the local scale, strengthen vegetation restoration and ecological engineering projects; at the county level, optimize land-use structure and water resource allocation; and at the municipal level, promote ecological spatial planning and regional collaborative governance.
4. Discussion
This study focuses on Liaoning Province, where the characteristics of an old industrial base overlap with those of an ecological gradient, and establishes a three-tiered, nested, multi-scale assessment system comprising 15 km grids, counties, and cities to systematically analyze the spatial patterns, trade-offs and synergies, service bundle characteristics, and multi-dimensional driving associations of five core ecosystem services. This study addresses the shortcomings of existing research, which often lack systematic multi-scale analysis, insufficiently quantify driving associations, and fail to address the specific characteristics of particular regions [29]. The results indicate that ecosystem services in Liaoning Province exhibit a spatial structure characterized by “higher levels in the east, lower levels in the west, and complementary patterns in the central region”; increasing the spatial scale smooths out local heterogeneity and weakens spatial autocorrelation [30]. Food provisioning and regulating services exhibit a stable trade-off relationship across the entire region; however, this relationship is not simply a matter of competition for ecological space, but rather the comprehensive result of the combined effects of long-term land-use adjustments, changes in agricultural production methods, industrial restructuring, urban expansion, and ecological governance. Agricultural production areas on the Liaohe Plain ensure regional food supply, but the expansion of agricultural land has also increased pressure on the protection of ecological spaces; meanwhile, the construction of the Liao Dong Mountain ecological barrier and the protection of the Liaohe Estuary wetlands have promoted carbon sequestration, improved habitat quality, and enhanced water conservation functions. Therefore, the trade-off pattern of ecosystem services reflects the dynamic coordination process between resource utilization and ecological protection during the transformation of Liaoning’s old industrial base. The driving factors of ecosystem services exhibit distinct scale-dependent variations, and the study’s findings have been validated through multi-model verification and SHAP interpretability analysis, demonstrating robustness [31]. The core findings of this study closely align with cutting-edge research both domestically and internationally. On the one hand, they confirm nature’s powerful controlling role in ecosystem services; by integrating Liaoning Province’s complex topography, they quantitatively reveal the unique phenomenon where spatial aggregation intensity declines sharply as scale increases, thereby filling a gap in relevant research [32]. On the other hand, regarding trade-off and synergy relationships, this study verifies the rigid conflict between agricultural production and ecological regulation, clarifies regional differences in intensity, and supplements the theory of service interactions. Furthermore, in terms of driving associations, the XGBoost-SHAP framework reveals the scale dependence and action thresholds of factors and quantifies the saturation effect of municipal-level policy interventions, providing new empirical support for ecological policy evaluation.
The value of this study lies primarily in two aspects: methodological integration and the exploration of regional mechanisms. First, through multi-scale comparisons at the grid, county, and city levels, this study systematically reveals the patterns of ecosystem service spatial distribution, trade-off and synergy relationships, and service combinations as they vary with scale. Second, the XGBoost-SHAP framework was introduced to identify factors associated with changes in ecosystem services and their nonlinear association characteristics [33]. At the same time, this study fully acknowledges the interpretive limitations of machine learning models; SHAP results cannot replace causal inference, and the importance of variables such as land use, population, and policy merely reflects their contribution to the model’s predictive outcomes. Future research should integrate causal inference models, natural experiments, and long-term ecological monitoring data to further validate the actual mechanisms of action of key factors.
Subsequent research can be deepened in three directions to provide guidance for refined ecological management in Liaoning. First, future research could extend the temporal scale to incorporate the long-term dynamics of ecosystem services and their driving factors, thereby clarifying the evolutionary pathways and dynamic feedback mechanisms of socioecological systems across different time scales [34]. Second, research could focus on the adaptability of local policies by conducting multi-scenario benefit pre-assessments for current policies—such as desertification control in northwestern Liaoning, the construction of the eastern Liaoning ecological barrier, and ecological protection compensation—to provide guidance for policy optimization. Finally, research methods should be iteratively localized by integrating multi-source data—including high-resolution remote sensing, ground-based monitoring, and field surveys—to calibrate model parameters for local ecosystems such as black soil and coastal wetlands, refine the multi-scale coupled assessment framework, and enhance the reliability of assessment results.
In summary, the multi-scale assessment framework established in this study and the empirical insights gained not only provide scientific support for ecosystem management and sustainable development decision-making in Liaoning Province but also offer theoretical methods and practical case studies that can be referenced by other regions globally that possess complex geographical patterns and face multiple development pressures when conducting multi-scale ecosystem service research. Future research will further deepen dynamic modeling, service expansion, scale-related analysis, and mechanism elucidation, providing a more robust scientific foundation for building a modern society characterized by harmonious coexistence between humans and nature.
5. Conclusions
This study established a multi-scale analytical framework integrating spatial autocorrelation analysis, geographically weighted regression, self-organizing maps, and interpretable machine learning approaches to systematically investigate ecosystem services (ESs), their trade-offs and synergies, service bundles, and driving associations in Liaoning Province—a representative old industrial base with strong ecological gradients. The main conclusions are summarized as follows.
(1) Ecosystem services in Liaoning Province exhibited pronounced spatial heterogeneity and clear scale-dependent characteristics. Across the grid, county, and city scales, ES patterns were consistently shaped by the combined effects of natural geographical gradients and human activities, forming an overall spatial structure characterized by “mountains in the east, water in the west, and a granary in the center”. As the spatial scale increased, local ecological heterogeneity gradually smoothed, resulting in weakened spatial aggregation intensity. These findings highlight the necessity of incorporating scale effects into ecosystem service assessment and ecological planning.
(2) Trade-offs and synergies among ecosystem services showed both structural stability and spatial differentiation across scales. Food provisioning exhibited persistent trade-offs with regulating and supporting services, reflecting the conflict between agricultural production and ecological conservation. In contrast, carbon sequestration, soil conservation, habitat quality, and water yield generally showed synergistic relationships, particularly in mountainous forest ecosystems. The intensity and spatial distribution of these interactions varied substantially among regions, indicating that ecosystem management should consider local ecological conditions rather than applying uniform strategies.
(3) Ecosystem service bundles displayed significant spatial differentiation and scale-dependent aggregation characteristics. At the fine spatial scale, multiple functional clusters were identified, including mountainous multifunctional synergy areas, plain food-production areas, wetland composite-function areas, urban ecological degradation areas, and ecologically fragile transition zones. With increasing spatial aggregation, service bundles became simplified and transformed from locally differentiated ecological functions into broader regional functional patterns. This indicates that fine-scale analyses are more suitable for ecological restoration and targeted management, whereas administrative scales provide stronger support for regional coordination and governance.
(4) The driving mechanisms of ecosystem services demonstrated significant scale dependence and nonlinear response characteristics [35]. Among multiple environmental, landscape, and socioeconomic factors, landscape configuration factors, particularly c_a, consistently showed the strongest contribution across different scales, indicating that ecological spatial structure plays a dominant role in regulating ecosystem service provision. Precipitation and other environmental factors exhibited scale-dependent effects, while local soil and terrain factors showed decreasing explanatory power with increasing spatial aggregation. The XGBoost-SHAP framework further revealed nonlinear response patterns and potential thresholds of key drivers, providing new insights into the complex mechanisms underlying ecosystem service variations.
(5) The integrated framework proposed in this study provides a methodological reference for ecosystem service assessment in regions experiencing simultaneous ecological constraints and socioeconomic transformation. The results suggest that differentiated management strategies should be implemented according to spatial scales: vegetation restoration and ecological engineering should be strengthened at local scales, land-use optimization and resource allocation should be emphasized at county scales, and ecological spatial planning and regional cooperation should be promoted at city scales. Although interpretable machine learning improves the understanding of complex ecological relationships, the SHAP-based results represent predictive contributions and statistical associations rather than direct causal mechanisms. Future studies should integrate long-term ecological monitoring, causal inference approaches, and multi-scenario simulations to further clarify ecosystem service evolution pathways and support adaptive ecological management.
Overall, this study advances the understanding of how spatial scale regulates ecosystem service patterns, interactions, and driving associations in old industrial regions. The proposed multi-scale framework and empirical findings provide scientific support for ecological restoration, landscape optimization, and sustainable development in regions facing complex interactions between environmental protection and socioeconomic transformation.
Author Contributions
Conceptualization, B.X. and R.Y.; software, T.Z.; validation, Y.L. (Yilong Luo); resources, Y.L. (Yunlong Liu); data curation, B.X. and R.Y.; writing—original draft preparation, B.X.; writing—review and editing, R.Y.; visualization, B.X.; supervision, H.W.; funding acquisition, M.L. All authors have read and agreed to the published version of the manuscript.
Funding
This study was supported by the Science and Technology Plan of Liaoning Province (2024JH2/102400061); the Dalian Science and Technology Innovation Fund (2024JJ11PT007, 2025JJ12GX014); the Dalian Science and Technology Program for Innovation Talents of Dalian (2022RJ06); the Liaoning Province Education Department Scientific research platform construction project (LJ232410158056); Basic Scientific Research Funds of Dalian Ocean University (2024JBPTZ001), and the Liaoning Province Data Center Project (2025JH27/10100005).
Data Availability Statement
Data will be made available on request.
Acknowledgments
We thank the National Marine Scientific Data Center for their data support (Dalian) (http://odc.dlou.edu.cn/), as well as the National Science and Technology Infrastructure, Liaoning Marine and Polar Science Data Center, and Dalian Marine Science Data Center for providing valuable data and information. We also thank the reviewers for carefully reviewing the manuscript and providing valuable comments to help improve this paper.
Conflicts of Interest
The authors declare that they have no known competing financial interests or personal relationships that could have appeared to influence the work reported in this paper.
Abbreviations
The following abbreviations are used in this manuscript:
| c_a | Aboveground carbon |
| c_b | Soil carbon |
| precip | Precipitation |
| p | Precipitation-related variables |
| c_s | Soil carbon |
| cfa | Climate factors |
| r | Rainfall erosivity |
| dem | Elevation |
| kc | Crop factor |
| ln_k | Soil erodibility |
| pet | Potential evapotranspiration |
| eto | Reference evapotranspiration |
| ls | Slope length and steepness factor |
| c_d | Dead organic carbon |
| rootdeepth | Root depth |
| soil_retention | Soil conservation |
References
- Bennett, E.M.; Reid, W.; Carpenter, S.; Dietz, T.; Peterson, G.; Ash, N.; Beard, T.D.; Beck, S.; Biggs, R.; Castree, N.; et al. The future of Global Environmental Assessments: 20 years after the Millennium Ecosystem Assessment. Curr. Opin. Environ. Sustain. 2026, 79, 101618. [Google Scholar] [CrossRef] [Scilit]
- Montana, J. Balancing authority and meaning in global environmental assessment: An analysis of organisational logics and modes in IPBES. Environ. Sci. Policy 2020, 112, 245–253. [Google Scholar] [CrossRef] [Scilit]
- Costanza, R.; d’Arge, R.; De Groot, R.; Farber, S.; Grasso, M.; Hannon, B.; Limburg, K.; Naeem, S.; O’Neill, R.V.; Paruelo, J.; et al. The value of the world’s ecosystem services and natural capital. Nature 1997, 387, 253–260. [Google Scholar] [CrossRef] [Scilit]
- Lu, Y.; Xu, C.; Wang, X. A novel modification framework for evaluating ecosystem service value in China’s five major freshwater lakes and their surrounding cities from 2002 to 2022. Ecol. Indic. 2025, 177, 113711. [Google Scholar] [CrossRef] [Scilit]
- Shi, H.; Duan, H.; Li, X.; Wang, G.; Chen, A.; Liang, D. Impact of land use change on carbon storage based on the PLUS–InVEST model: A case study in the urban belt along the Yellow River, China. J. Arid. Land 2026, 18, 452–476. [Google Scholar] [CrossRef] [Scilit]
- Zhang, M.; Fan, M.; Chen, Y.; Wang, J. Estimating and mapping cultural ecosystem services in Yarlung Tsangpo Grand Canyon National Park using MLLMs and the SolVES model. Appl. Geogr. 2026, 189, 103937. [Google Scholar] [CrossRef] [Scilit]
- Liu, X.; Li, Y.; Lu, J.; Song, T.; Zhang, S. Urban growth simulation guided by ecosystem service trade-offs in Wuhan metropolitan area: Methods and implications for spatial planning. Ecol. Indic. 2024, 167, 112687. [Google Scholar] [CrossRef] [Scilit]
- Yuan, X.; Pan, P.; Jiang, Y.; Zhang, Z.; Liu, B. Assessing thresholds and spatial effects of drivers on multi-scale ecosystem service supply-demand matching. Ecol. Indic. 2026, 185, 114805. [Google Scholar] [CrossRef] [Scilit]
- Yang, Y.; Liu, L.; Zheng, Q.; Qiao, X.; Zhang, H.; Gu, Y. Landscape-Driven Spatial Heterogeneity of Ecosystem Service Values and Its Implications for Land Use Planning in the Huaihe River Basin. Land 2026, 15, 1670. [Google Scholar] [CrossRef] [Scilit]
- Marchioni, M.; Raimondi, F.; Becciu, G.; Dresti, C. Nature-based solutions for watershed management: An investigation on water-related ecosystem services delivery at multiple spatial scales. Ecosyst. Serv. 2025, 73, 101718. [Google Scholar] [CrossRef] [Scilit]
- Yuan, Z.; Cao, M.; Chen, M.; Lü, G.; Liu, Y.; Yang, W.; Ni, H. Multi-scale supply-demand security assessment of water-energy-food related ecosystem services from an interaction perspective. Ecol. Indic. 2026, 182, 114584. [Google Scholar] [CrossRef] [Scilit]
- Ding, T.; Chen, J.; Fang, L.; Yang, W.; Liu, X. Assessing urban ecosystem service supply from the water-energy-food system and multi-scenario perspective. Sustain. Cities Soc. 2025, 135, 107020. [Google Scholar] [CrossRef] [Scilit]
- Pi, Z.; Liu, X.; Wei, Y.; Wang, X.; Zang, Z.; Song, X. Spatiotemporal variation in carbon sequestration in the forest ecosystem of Hainan Island over a 30-year period and its driving factors. Ecol. Indic. 2026, 182, 114587. [Google Scholar] [CrossRef] [Scilit]
- Chen, W.; Wang, G.; Gu, T.; Fang, C.; Pan, S.; Zeng, J.; Wu, J. Simulating the impact of urban expansion on ecosystem services in Chinese urban agglomerations: A multi-scenario perspective. Environ. Impact Assess. Rev. 2023, 103, 107275. [Google Scholar] [CrossRef] [Scilit]
- Hu, Y.; Tian, G.; Chen, Q.; Xu, E.; Dong, N. Impact of urban habitat fragmentation on habitat quality: A perspective of multi-scale grids analysis. J. Environ. Manag. 2026, 397, 128350. [Google Scholar] [CrossRef] [Scilit] [PubMed]
- Wang, K.; Li, X.; Lyu, X.; Dang, D.; Cao, W.; Du, Y. Unraveling the complex interconnections between food-energy-water nexus sustainability and the supply-demand of related ecosystem services. J. Environ. Manag. 2024, 370, 122532. [Google Scholar] [CrossRef] [Scilit] [PubMed]
- Zhang, L.; Guo, J.; Wang, X.; Zhang, R.; Zhou, J.; Li, L.; Yang, X.; Yu, X. Grassland and forest fire risk research based on multi-criteria decision analysis techniques: Method comparison and driver analysis. Environ. Model. Softw. 2026, 195, 106750. [Google Scholar] [CrossRef] [Scilit]
- Han, R.; Feng, C.-C.; Xu, N.; Guo, L. Spatial heterogeneous relationship between ecosystem services and human disturbances: A case study in Chuandong, China. Sci. Total Environ. 2020, 721, 137818. [Google Scholar] [CrossRef] [Scilit] [PubMed]
- Pumhirunroj, B.; Littidej, P.; Boonmars, T.; Artchayasawat, A.; Buasri, N.; Slack, D. Spatial prediction of the probability of liver fluke infection using a geographic weighted regression (GWR) model in waterways connecting the Mekong River, Sakon Nakhon of Thailand. One Health 2026, 22, 101320. [Google Scholar] [CrossRef] [Scilit] [PubMed]
- Lin, Z.; He, Z.; Ye, C.; Li, Y.; Liu, H.; Ding, S.; Qiao, X.; Xiong, J.; Huang, J.; Hu, X.; et al. Spatiotemporal evolution of trade-off/synergy relationships and bundles in ecosystem services in Fujian, China: An integrated PLUS-InVEST-SOM framework. J. Clean. Prod. 2026, 550, 147925. [Google Scholar] [CrossRef] [Scilit]
- Ke, Z.L. Application of Lasso and Related Methods in Multiple Linear Regression Models. Doctoral Dissertation, Beijing Jiaotong University, Beijing, China, 2011. [Google Scholar]
- Chen, T.; Guestrin, C. XGBoost: A Scalable Tree Boosting System; ACM: New York, NY, USA, 2016. [Google Scholar]
- Meng, Q. LightGBM: A Highly Efficient Gradient Boosting Decision Tree; Curran Associates, Inc.: Red Hook, NY, USA, 2018. [Google Scholar]
- Çelikten, H. Evaluating machine learning (RF, XGBoost) and statistical model (MLR) for PM10 and air quality prediction: A case from Kars, Türkiye. Atmos. Pollut. Res. 2026, 17, 102975. [Google Scholar] [CrossRef] [Scilit]
- Heilemann, J.; Klassert, C.; Samaniego, L.; Thober, S.; Marx, A.; Boeing, F.; Klauer, B.; Gawel, E. Projecting impacts of extreme weather events on crop yields using LASSO regression. Weather Clim. Extrem. 2024, 46, 100738. [Google Scholar] [CrossRef] [Scilit]
- Zhang, G.; Li, X.; Zhang, L.; Wei, X. Dynamics and causes of cropland non-agriculturalization in typical regions of China: An explanation based on interpretable machine learning. Ecol. Indic. 2024, 166, 112348. [Google Scholar] [CrossRef] [Scilit]
- Fang, X.; Bai, Y. Spatial correlation of carbon emissions in China’s coastal areas: The spatiotemporal nonlinear characteristics and spatial heterogeneity. Urban Clim. 2026, 65, 102823. [Google Scholar] [CrossRef] [Scilit]
- Kruk, M. SHAP-NET, a network based on Shapley values as a new tool to improve the explainability of the XGBoost-SHAP model for the problem of water quality. Environ. Model. Softw. 2025, 188, 106403. [Google Scholar] [CrossRef] [Scilit]
- Deng, C.; Zhang, G.; Liu, Y.; Gong, Y.; Fu, J. Integrating hotspots, trade-offs and bundles to reveal the spatial interactions among four water-related ecosystem services for systematic watershed management. Ecol. Eng. 2025, 219, 107714. [Google Scholar] [CrossRef] [Scilit]
- Die, H.; Guo, F.; Meng, Q.; Schlink, U.; Wang, S.; Hertel, D.; Gao, J. A novel dual-layer composite framework for downscaling urban land surface temperature coupled with spatial autocorrelation and spatial heterogeneity. Int. J. Appl. Earth Obs. Geoinf. 2024, 130, 103900. [Google Scholar] [CrossRef] [Scilit]
- Yu, D.; Zhou, Z.; Chen, M.; Liu, J.; Wang, N.; Zhu, B.; Cao, Y. Identifying the driving mechanisms of ecosystem health in a typical ecologically fragile region: A study based on the XGBoost–SHAP model. Ecol. Indic. 2025, 181, 114472. [Google Scholar] [CrossRef] [Scilit]
- Wang, X.; Zhao, X.; Ran, Y.; Fan, Y.; Li, W.; Ye, X.; Zhou, Y.; Wang, Y.; Liu, F. Sustainable management of plateau mountainous urban agglomerations based on the ecosystem services supply-demand balance: Application of scale and threshold effects. J. Clean. Prod. 2026, 556, 148141. [Google Scholar] [CrossRef] [Scilit]
- Xi, L.; Qi, Z.; Feng, Y.; Cao, X.; Zou, J.; Han, J. An explainable machine learning approach (SHAP) to assessing desertification risk and its drivers in the Ring-Tarim Basin, 1990–2020. Environ. Impact Assess. Rev. 2026, 118, 108309. [Google Scholar] [CrossRef] [Scilit]
- Wang, H.; Wang, Y.; Ding, X.; Tang, J.; Li, R.; Li, K. Spatio-temporal evolution and driving mechanisms of ecological resilience: The Guanzhong Plain Urban Agglomeration case. Environ. Sustain. Indic. 2026, 30, 101229. [Google Scholar] [CrossRef] [Scilit]
- Ma, D.; Wang, Q.; Huang, Q.; Yu, Y.; Yan, Y. Spatio-temporal heterogeneity and drivers of landscape aesthetics and ecosystem services in the Bohai Rim urban agglomeration under urbanization. J. Environ. Manag. 2026, 400, 128814. [Google Scholar] [CrossRef] [Scilit] [PubMed]

Disclaimer/Publisher’s Note: The statements, opinions and data contained in all publications are solely those of the individual author(s) and contributor(s) and not of MDPI and/or the editor(s). MDPI and/or the editor(s) disclaim responsibility for any injury to people or property resulting from any ideas, methods, instructions or products referred to in the content. |
© 2026 by the authors. Licensee MDPI, Basel, Switzerland. This article is an open access article distributed under the terms and conditions of the Creative Commons Attribution (CC BY) license.