


Abstract
Urban ponds are increasingly recognised as important refuges for freshwater biodiversity within human-dominated landscapes. However, phytoplankton and zooplankton are often studied separately, leaving unresolved whether different plankton components provide a consistent picture of biodiversity responses to urban pressure. We investigated both plankton groups in 15 small urban ponds in Poznań (western Poland) differing in the degree of human impact. We compared community structure, species richness, abundance, indicator taxa, and relationships with trophic state. A total of 339 phytoplankton and 148 zooplankton taxa were recorded, including 99 rotifers, 35 cladocerans, and 14 copepods. Zooplankton responded strongly to human impact, with significantly lower species richness in more strongly impacted ponds than in less disturbed ponds. This difference was also reflected in cumulative richness, which reached 128 taxa in only seven less disturbed ponds compared with 91 taxa in eight human-impacted ponds. In contrast, phytoplankton richness did not differ between pond categories, although its abundance was significantly higher in more strongly impacted ponds. Increasing trophic state was associated with lower zooplankton richness but higher abundance of both zooplankton and phytoplankton. Notably, corresponding biodiversity metrics of phytoplankton and zooplankton were not significantly related, indicating that the two groups conveyed largely independent ecological information. Community composition analyses further revealed contrasting responses: the degree of human impact significantly explained zooplankton composition, whereas none of the tested environmental variables significantly explained phytoplankton composition. Several eutrophic rotifer taxa, including Brachionus angularis, Anuraeopsis fissa, and Keratella tecta, were associated with anthropogenically influenced ponds, while fourteen indicator species characterised less disturbed ponds. Our results show that the ecological picture of an urban pond depends partly on which plankton component is examined. Despite sharing the same ponds and environmental setting, phytoplankton and zooplankton conveyed contrasting and largely independent biodiversity signals. Zooplankton provided a clearer signal of local anthropogenic disturbance, whereas phytoplankton responses were expressed mainly through changes in abundance and trophic-state-related patterns. Thus, relying on a single plankton group may provide only a partial assessment of biodiversity responses to urban pressure. Integrating phytoplankton and zooplankton can provide a more complete ecological assessment, while the high taxonomic richness recorded particularly in less disturbed ponds reinforces the biodiversity value of small urban waters.
1. Introduction
Urban expansion exerts increasing pressure on freshwater ecosystems by modifying habitat characteristics and contributing to changes in aquatic biodiversity [1,2]. Freshwater ecosystems located within urban areas are exposed to multiple and often interacting anthropogenic pressures, including eutrophication, pollution, hydrological alteration, and habitat fragmentation [3]. Small ponds may be particularly vulnerable because of their limited size, shallow depth, and close connection with the surrounding catchment. At the same time, however, they can support high aquatic biodiversity and provide valuable habitats in heavily modified landscapes [4]. Urban ponds can therefore act as important refuges for freshwater biodiversity, with even artificial or modified water bodies supporting diverse biological communities [3]. Their considerable variation in water quality, habitat structure, and local human influence makes them particularly suitable systems for examining how freshwater communities respond under urban environmental pressure.
Plankton communities are widely recognised as sensitive indicators of environmental conditions in freshwater ecosystems because of their relatively rapid responses to changes in water quality, trophic state, and habitat characteristics [5,6]. Phytoplankton and zooplankton occupy different trophic positions and are shaped by partly different ecological processes, so their responses to environmental pressure may differ [7]. Phytoplankton respond directly to changes in nutrient availability and physicochemical conditions, making them particularly responsive to eutrophication and other water-quality alterations associated with urbanisation [5,8]. Zooplankton, in contrast, are influenced not only by food resources and water chemistry but also by biotic interactions, predation, and habitat structure. Aquatic vegetation can be particularly important by increasing habitat complexity and providing feeding habitats and refuges from predation for many zooplankton taxa [9]. Consequently, the same environmental change may be expressed differently in phytoplankton and zooplankton communities.
Zooplankton, including rotifers, cladocerans, and copepods, represent a major component of freshwater biodiversity and play a central role in aquatic food webs by transferring energy from primary producers and microbial communities to higher trophic levels [10,11]. Small water bodies can support particularly diverse zooplankton assemblages, including numerous littoral and vegetation-associated taxa, and thus contribute substantially to biodiversity at both local and regional scales [12]. Their high diversity is partly supported by the environmental heterogeneity of small water bodies, including variation in vegetation, morphology, food resources, and predation [13,14]. Habitat degradation may therefore affect zooplankton not only by reducing species richness but also by altering community composition and the representation of taxa with different ecological requirements [15]. This may be especially important in urban ponds, where habitat modification and deterioration of water quality often occur together.
Despite the widespread use of plankton as an indicator of freshwater environmental change, phytoplankton and zooplankton are still frequently investigated separately. Consequently, relatively little is known about whether the two communities provide similar biodiversity signals when exposed to the same human pressures within the same water bodies, particularly in small urban ecosystems [16,17]. This is important because urban environmental change affects water quality, trophic conditions, habitat structure, and biotic interactions simultaneously, whereas phytoplankton and zooplankton may differ in their sensitivity to these factors [18].
Small urban ponds provide a useful system for testing whether phytoplankton and zooplankton respond similarly to the same local anthropogenic conditions. Such responses may differ not only in richness, diversity, and abundance, but also in community composition and the occurrence of particular taxa. Direct comparison of the two plankton components is therefore important because an assessment based on only one of them may provide an incomplete picture of biodiversity responses in urban freshwaters [6,19].
We investigated phytoplankton and zooplankton communities in 15 small urban water bodies representing different degrees of human pressure. Our main objective was to determine whether the two plankton components provide similar or contrasting biodiversity signals within the same urban ecosystems. We compared species diversity and abundance between ponds classified as anthropogenically influenced and less anthropogenically influenced, examined responses to trophic state and environmental conditions, and analysed patterns in community composition and indicator taxa.
Because phytoplankton and zooplankton are shaped by partly different environmental and biological factors, we expected their responses to local human impact to differ. However, rather than predicting a specific direction of these responses, we tested whether such differences were expressed in biodiversity patterns and community composition.
2. Materials and Methods
2.1. Study Area
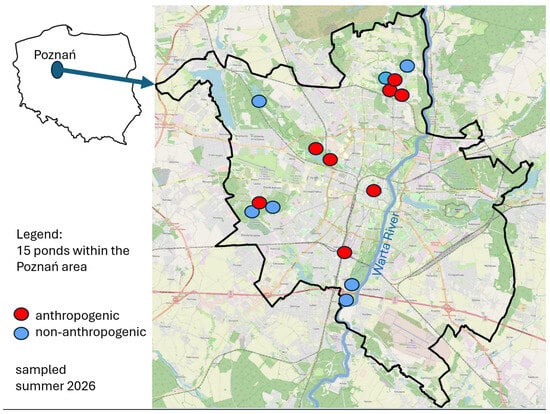
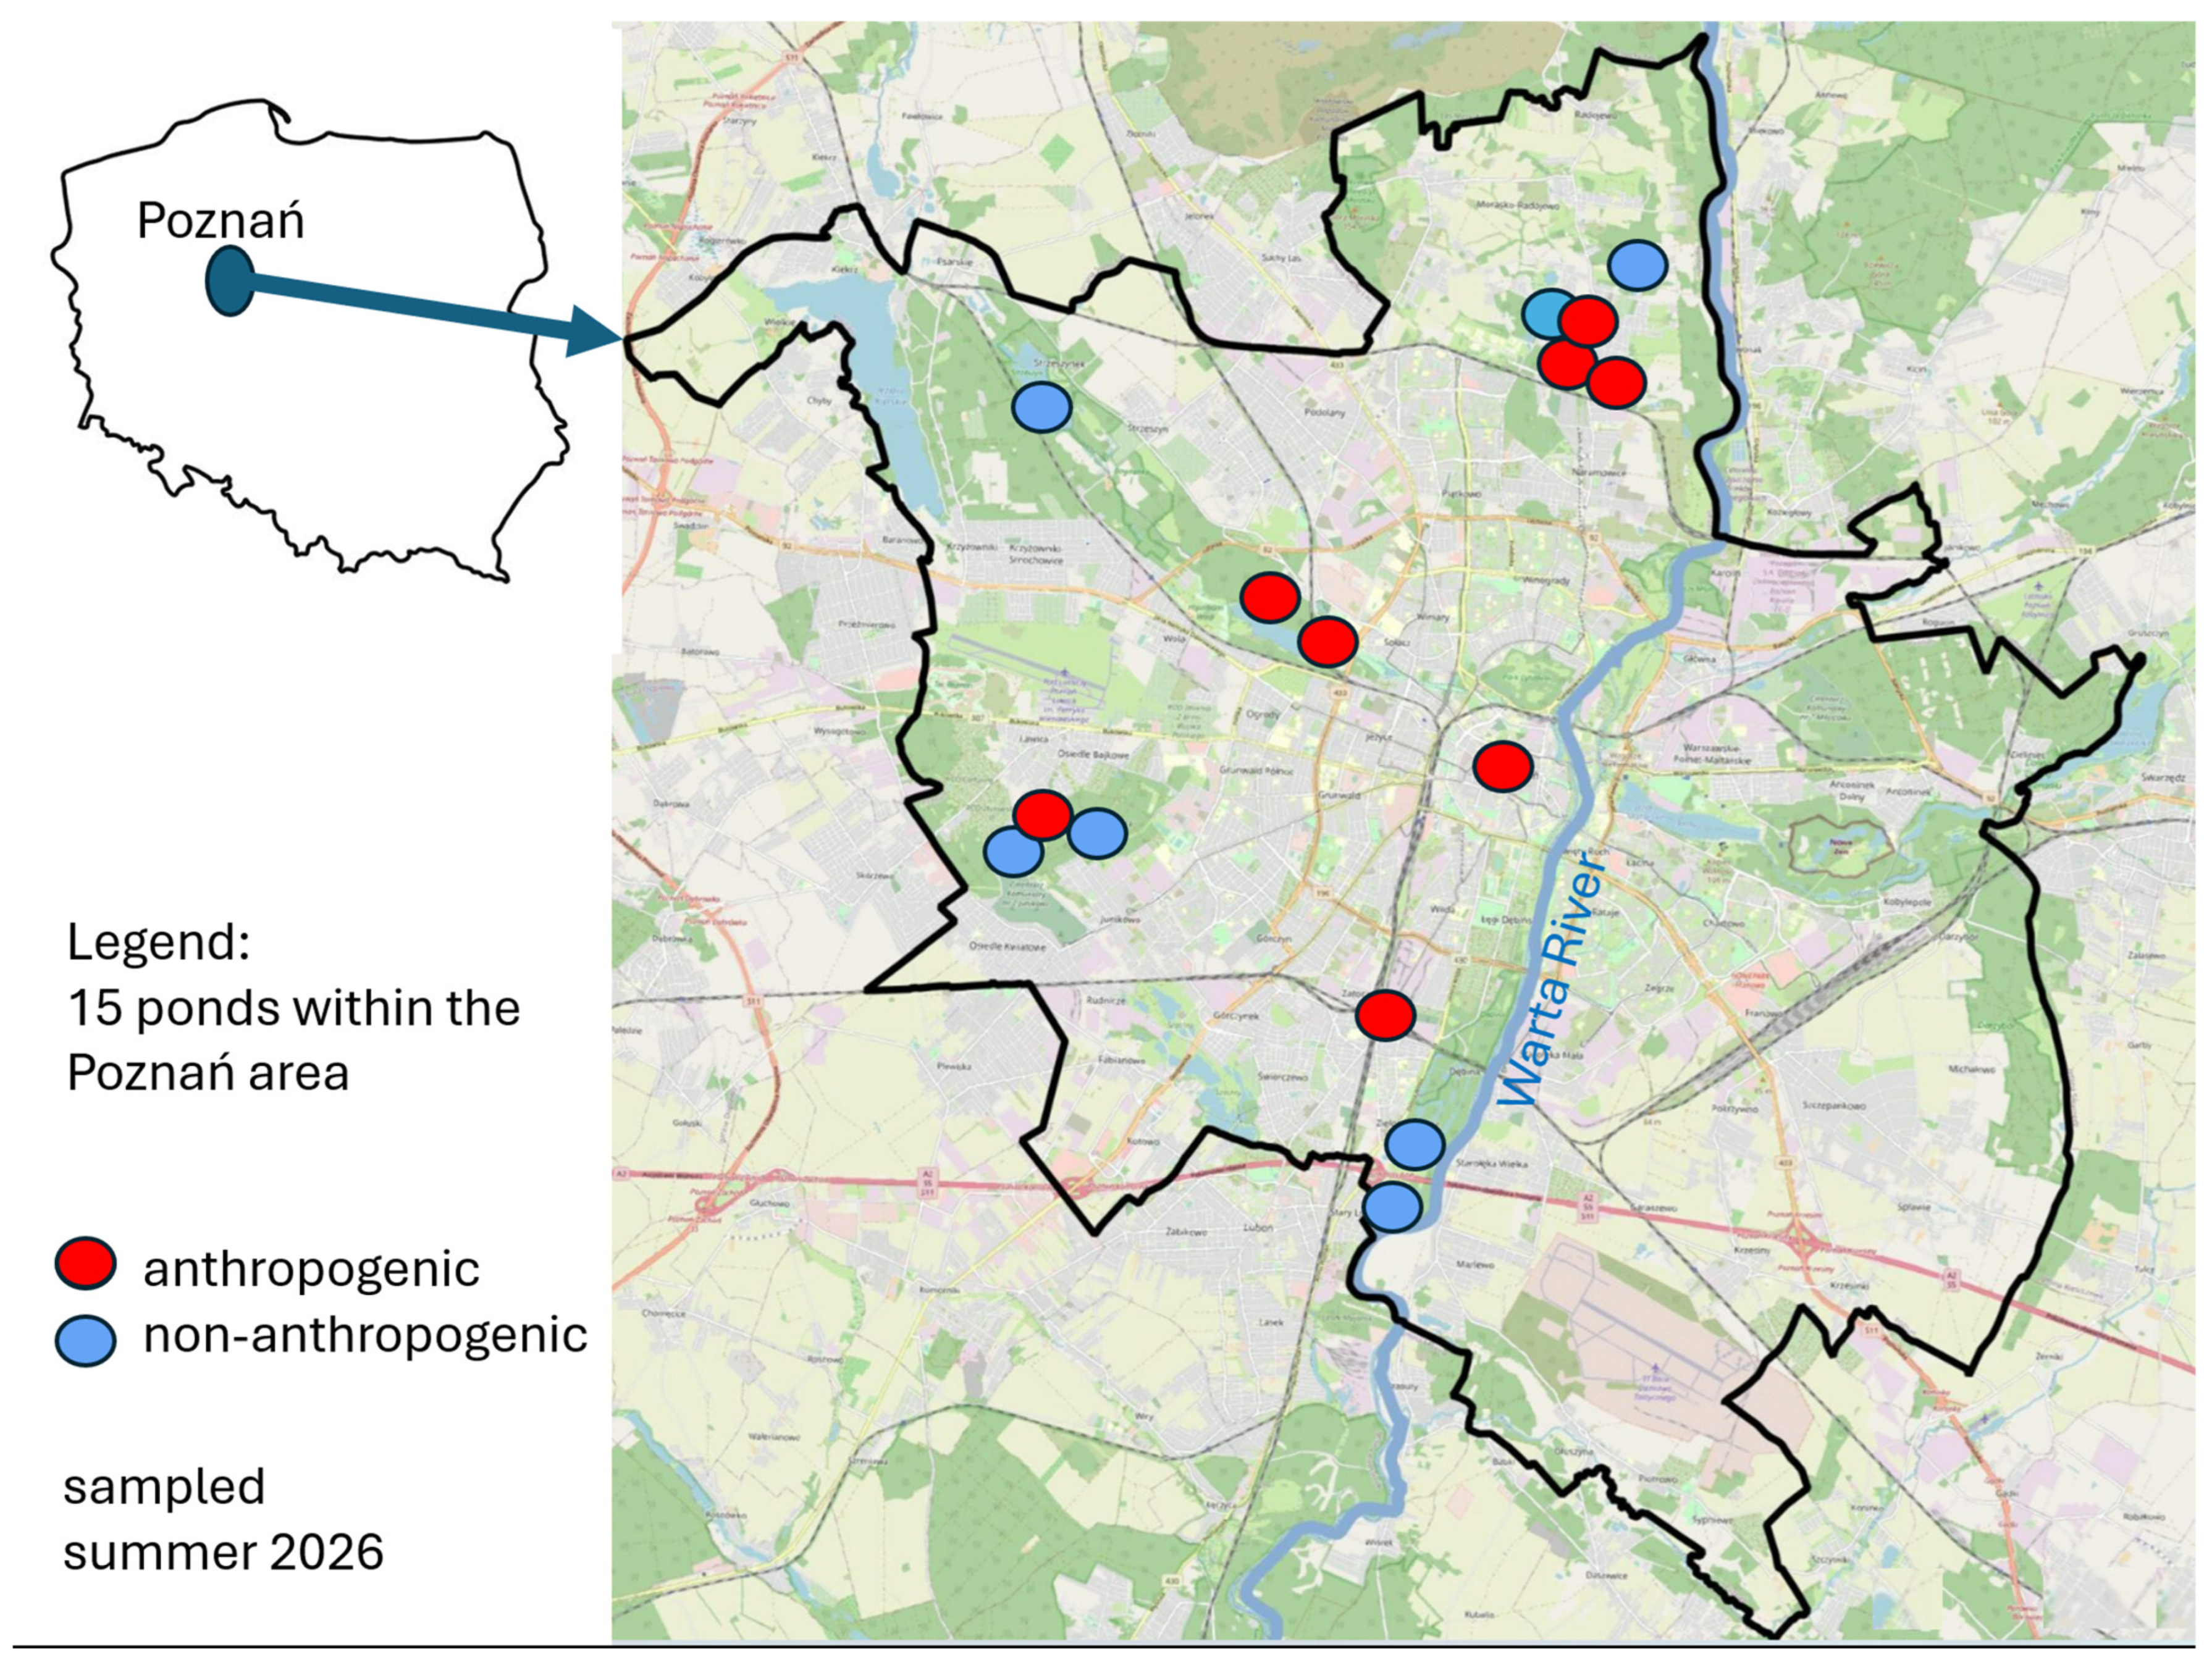
The study was conducted in 15 small water bodies located within the urban area of Poznań, western Poland (Figure 1). The investigated ponds were distributed across different parts of the city and represented a broad range of local environmental conditions and degrees of human influence.
Figure 1.
Location of the 15 urban ponds investigated in Poznań, western Poland. Red circles indicate anthropogenically influenced (Anthr) ponds, and blue circles indicate less anthropogenically influenced (N-anthr) ponds. All ponds were sampled during summer 2026.
The water bodies differed in origin, morphology, surrounding land use, and habitat characteristics. Eight ponds were artificial, and seven were of glacial origin. Pond surface area ranged from 0.10 to 2.49 ha and maximum depth from 0.5 to 4.5 m. The ponds also differed considerably in macrophyte cover, shading, fish presence, water chemistry, and trophic conditions (Table S1).
The ponds represented contrasting levels of local anthropogenic influence, with eight classified as anthropogenically influenced (Anthr) and seven as less anthropogenically influenced (N-anthr). The criteria used for this classification are described below.
2.2. Sampling and Environmental Variables
Field investigations were conducted between June and August 2026, during the period of well-developed aquatic vegetation. Three replicate plankton samples were collected from each pond (45 samples in total), and mean values from the three replicates were used as representative pond-level values for statistical analyses.
Water temperature, oxygen saturation, electrical conductivity (EC), pH, and water transparency (Secchi disk visibility, SDV) were measured in situ (YSI 556, Yellow Springs Instruments, Yellow Springs, OH, USA). Macrophyte cover was estimated as the percentage of the pond area occupied by aquatic vegetation. Shading was visually estimated on an ordinal scale from 1 (little or no shading) to 5 (strong shading), according to the proportion of the pond surface shaded by surrounding trees and vegetation during the sampling period. Fish presence was assessed qualitatively as a binary variable (presence/absence) based on direct field observations and, where available, supporting evidence from fishing activity and information provided by anglers encountered at the study sites.
Water samples were collected for the determination of total reactive phosphorus (TRP), ammonium (NH4+), nitrate (NO3−), nitrite (NO2−), and chlorophyll-a (Chl-a). Chemical analyses were performed according to Standard Methods (APHA) [20]. Ammonium, nitrate, and nitrite concentrations were summed and expressed as dissolved inorganic nitrogen (DIN). Chlorophyll-a concentrations were determined fluorometrically and corrected for pheopigments.
Based on field assessment of the immediate surroundings and visible human pressure, the ponds were assigned to two categories of local anthropogenic influence. Classification was based on the dominant character of the immediate pond surroundings, particularly the presence of built-up areas, roads, intensively managed or recreational areas, and the extent of less transformed vegetation. Eight ponds were classified as anthropogenically influenced (Anthr), representing sites with relatively strong direct human pressure, including densely built-up residential areas and other intensively used parts of the city. Seven ponds were classified as less anthropogenically influenced (N-anthr), representing sites with comparatively limited direct human disturbance, including meadows, parks, and forested areas. This classification was used as a qualitative descriptor of local human impact rather than as a quantitative measure of urbanisation.
2.3. Phytoplankton and Zooplankton Analyses
Phytoplankton quantitative samples were collected directly from the open-water zone without concentration and preserved immediately with Lugol’s iodine solution. In addition, live material concentrated using a plankton net (45 µm) was examined under a light microscope to support taxonomic identification, particularly of morphologically similar taxa. Preserved samples were stored in darkness until analysis. Quantitative analyses were performed using the Utermöhl sedimentation method [21] and an inverted microscope. Organisms were identified to the lowest possible taxonomic level using standard taxonomic keys. Taxonomic nomenclature was verified according to AlgaeBase [22]. Phytoplankton abundance was expressed as individuals per litre (ind. L−1).
Zooplankton samples were collected from the open-water zone by filtering 20 L of water through a 45-µm plankton net and were preserved with 96% ethanol. At least 1 mL of the concentrated sample, corresponding to 1 L of the original pond water, was analysed for each sample. Individuals were counted under a microscope, and abundance was expressed as individuals per litre (ind. L−1).
Rotifers, cladocerans, and copepods were identified using standard taxonomic keys [23,24,25,26]. Bdelloidea were included in quantitative analyses but were not identified to species level. The relative contribution of eutrophic species to the total abundance of each major zooplankton group was calculated and expressed as a percentage. Rotifer species were classified according to their trophic preferences following Ejsmont-Karabin [27], whereas the classification of eutrophic cladoceran and copepod species followed Ejsmont-Karabin and Karabin [28].
Species richness and total abundance were calculated for phytoplankton and zooplankton and separately for their major taxonomic groups. Zooplankton groups comprised Rotifera, Cladocera, and Copepoda, whereas phytoplankton groups comprised Cyanobacteria, Chlorophyta, Charophyta, Chrysophyta, Bacillariophyta, Cryptophyta, Haptophyta, Bigyra, Dinophyta, Ochrophyta, and Euglenozoa. Shannon diversity (H′) was calculated using natural logarithms, and Pielou evenness as J = H′/ln(S), where S is species richness.
2.4. Trophic State Assessment
Trophic state was assessed using a modified Carlson-type trophic state index (mTSI) based on chlorophyll-a and total reactive phosphorus (TRP), following the general approach proposed by Carlson [29]. Secchi depth was excluded because many ponds were shallow and water transparency frequently extended to the bottom, making this measure strongly dependent on pond depth. As total phosphorus was not available for all ponds, TRP was used as the phosphorus metric. The mTSI was calculated as the mean of the chlorophyll-a and TRP component indices. Ponds were classified as oligotrophic (mTSI < 40), mesotrophic (40–<50), eutrophic (50–<70), or hypereutrophic (≥70).
2.5. Statistical Analyses
Differences in plankton community descriptors between anthropogenically influenced (Anthr) and less anthropogenically influenced (N-anthr) ponds were tested using two-sided Mann–Whitney U tests. The analyses included total species richness and abundance of phytoplankton and zooplankton, as well as richness, abundance, Shannon diversity, and Pielou evenness of their major taxonomic groups. Additional zooplankton descriptors included the relative contributions of Rotifera, Cladocera, and Copepoda and the proportions of eutrophic species within these groups. Differences in mTSI between Anthr and N-anthr ponds were assessed using the same test. Selected community descriptors were visualised using boxplots with individual pond observations; abundance was presented on a logarithmic scale.
To account for the unequal number of Anthr (n = 8) and N-anthr (n = 7) ponds, cumulative species richness was additionally compared using sample-based rarefaction. Species accumulation was evaluated separately for phytoplankton and zooplankton in each pond category based on species incidence across ponds. Expected cumulative richness was calculated with increasing numbers of ponds, and comparisons between Anthr and N-anthr ponds were standardised to an equal sampling effort of seven ponds.
Relationships between trophic state and plankton community descriptors were examined using Spearman rank correlations, with mTSI treated as a continuous variable. Relationships between phytoplankton and zooplankton biodiversity patterns were assessed using Spearman correlations between corresponding whole-community descriptors: species richness, abundance, Shannon diversity, and Pielou evenness. Selected relationships with mTSI were visualised using scatterplots, with abundance presented on a logarithmic scale. Mann–Whitney U tests, Spearman rank correlations, and sample-based rarefaction were performed using Statistica 13.1.
Indicator species analysis (IndVal) was used to identify taxa significantly associated with Anthr and N-anthr ponds [30]. To reduce the influence of rare occurrences, only taxa recorded in at least four of the 15 ponds were included. Indicator values combined species specificity and frequency of occurrence within each pond category, and statistical significance was assessed using 999 permutations. Analyses were performed in PAST 4.13 software [31].
Relationships between plankton community composition and environmental variables were analysed separately for phytoplankton and zooplankton using Canoco Version 4.5 [32]. Detrended correspondence analysis (DCA) was first performed to select the appropriate constrained ordination method. As gradient lengths exceeded 3 standard deviation (SD) units, canonical correspondence analysis (CCA) was used. Only taxa recorded in at least four ponds were included, and species abundance data were square-root transformed to reduce the influence of highly abundant taxa. Explanatory variables included local anthropogenic influence (Anthr/N-anthr), mTSI, macrophyte cover, shading, fish presence, pond surface area, electrical conductivity (EC), pH, oxygen saturation, dissolved inorganic nitrogen (DIN), and Secchi disk visibility (SDV). Although SDV was excluded from the trophic state index calculation because water transparency in many shallow ponds was strongly constrained by pond depth, it was retained as an independent environmental variable in the CCA, as transparency may still influence community composition regardless of its suitability as a trophic state indicator. Explanatory variables were screened for multicollinearity using the variance inflation factor (VIF), and variables with VIF ≥ 10 were excluded. The significance of individual explanatory variables was assessed using Monte Carlo permutation tests with 999 permutations.
3. Results
A total of 339 phytoplankton and 148 zooplankton taxa were recorded across the 15 investigated ponds. The zooplankton taxa comprised 99 rotifers, 35 cladocerans, and 14 copepods. Trophic conditions ranged from oligotrophic to eutrophic (mTSI 21.9–63.4), with one pond classified as oligotrophic, five as mesotrophic, and nine as eutrophic.
3.1. Community-Level Responses to Human Impact
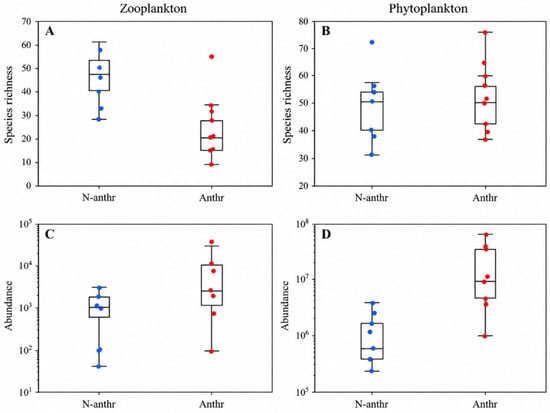
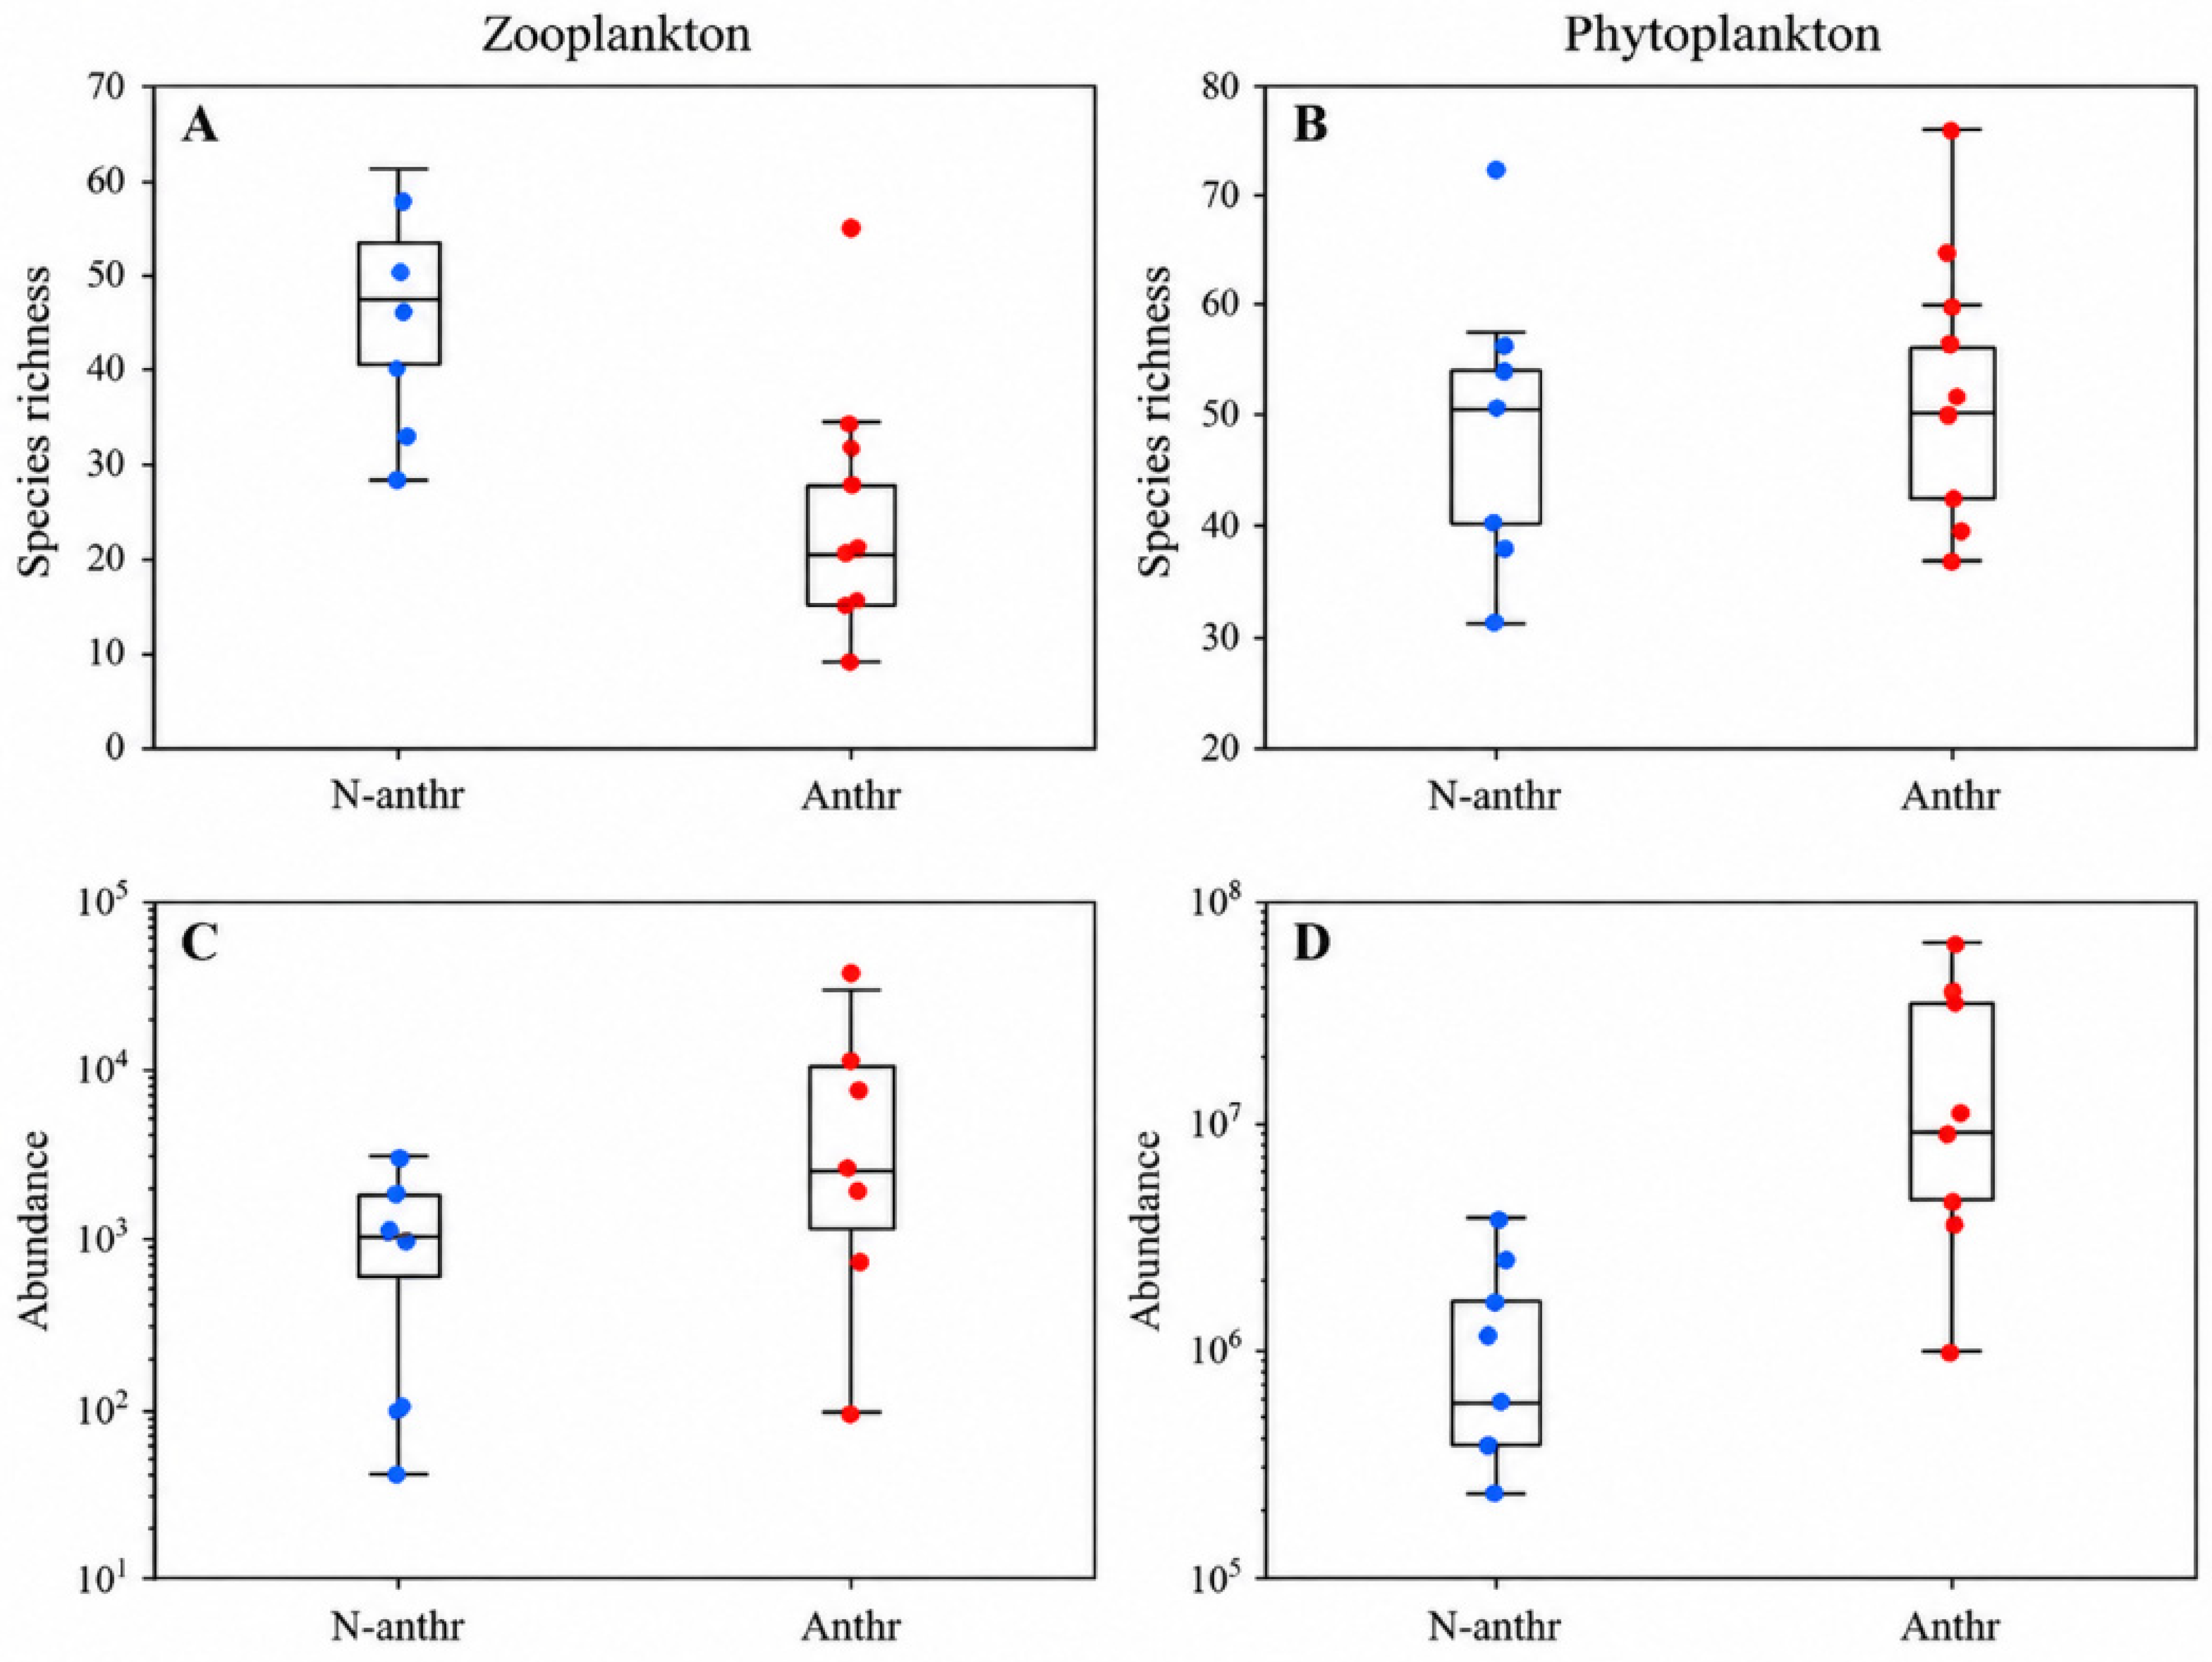
Phytoplankton and zooplankton showed contrasting responses to the level of human pressure (Figure 2; Table S2). Total zooplankton richness was significantly lower in Anthr than in N-anthr ponds (median 22.5 vs. 49.0 taxa; p = 0.011; Figure 2A), whereas total zooplankton abundance did not differ significantly between the two pond categories (p = 0.281; Figure 2C). Rotifer richness showed a similar pattern and was significantly lower in Anthr ponds (p = 0.012). In contrast, total phytoplankton richness did not differ between Anthr and N-anthr ponds (p = 0.561; Figure 2B), while total phytoplankton abundance was significantly higher in Anthr ponds (7.05 × 10⁶ vs. 0.47 × 10⁶ ind. L−1; p = 0.004; Figure 2D). Among phytoplankton groups, Euglenozoa showed significantly higher richness (p = 0.003), abundance (p = 0.014), and Shannon diversity (p = 0.012) in Anthr ponds.
Figure 2.
Contrasting responses of zooplankton and phytoplankton to anthropogenic influence in urban ponds. Species richness of (A) zooplankton and (B) phytoplankton, and total abundance of (C) zooplankton and (D) phytoplankton in less anthropogenically influenced (N-anthr) and anthropogenically influenced (Anthr) ponds. Boxes represent the interquartile range with the median, and points represent individual ponds. Abundance is presented on a logarithmic scale.
Cumulative richness also differed between the two pond categories (Table 1). Zooplankton cumulative richness was lower in Anthr than in N-anthr ponds (91 vs. 128 taxa). After standardising sampling effort to seven ponds per category, expected zooplankton richness in Anthr ponds was 85.5 taxa compared with 128 taxa observed in the seven N-anthr ponds. In contrast, cumulative phytoplankton richness was similar after standardisation (226.6 taxa in Anthr vs. 222 taxa in N-anthr ponds).
Table 1.
Observed and standardised cumulative taxon richness of zooplankton and phytoplankton in N-anthr and Anthr ponds.
3.2. Relationships with Trophic State and Between Plankton Communities
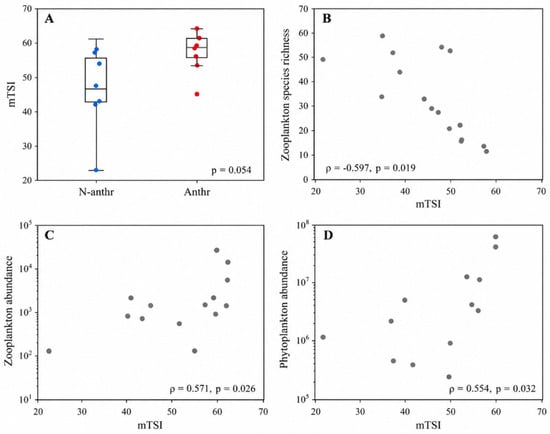
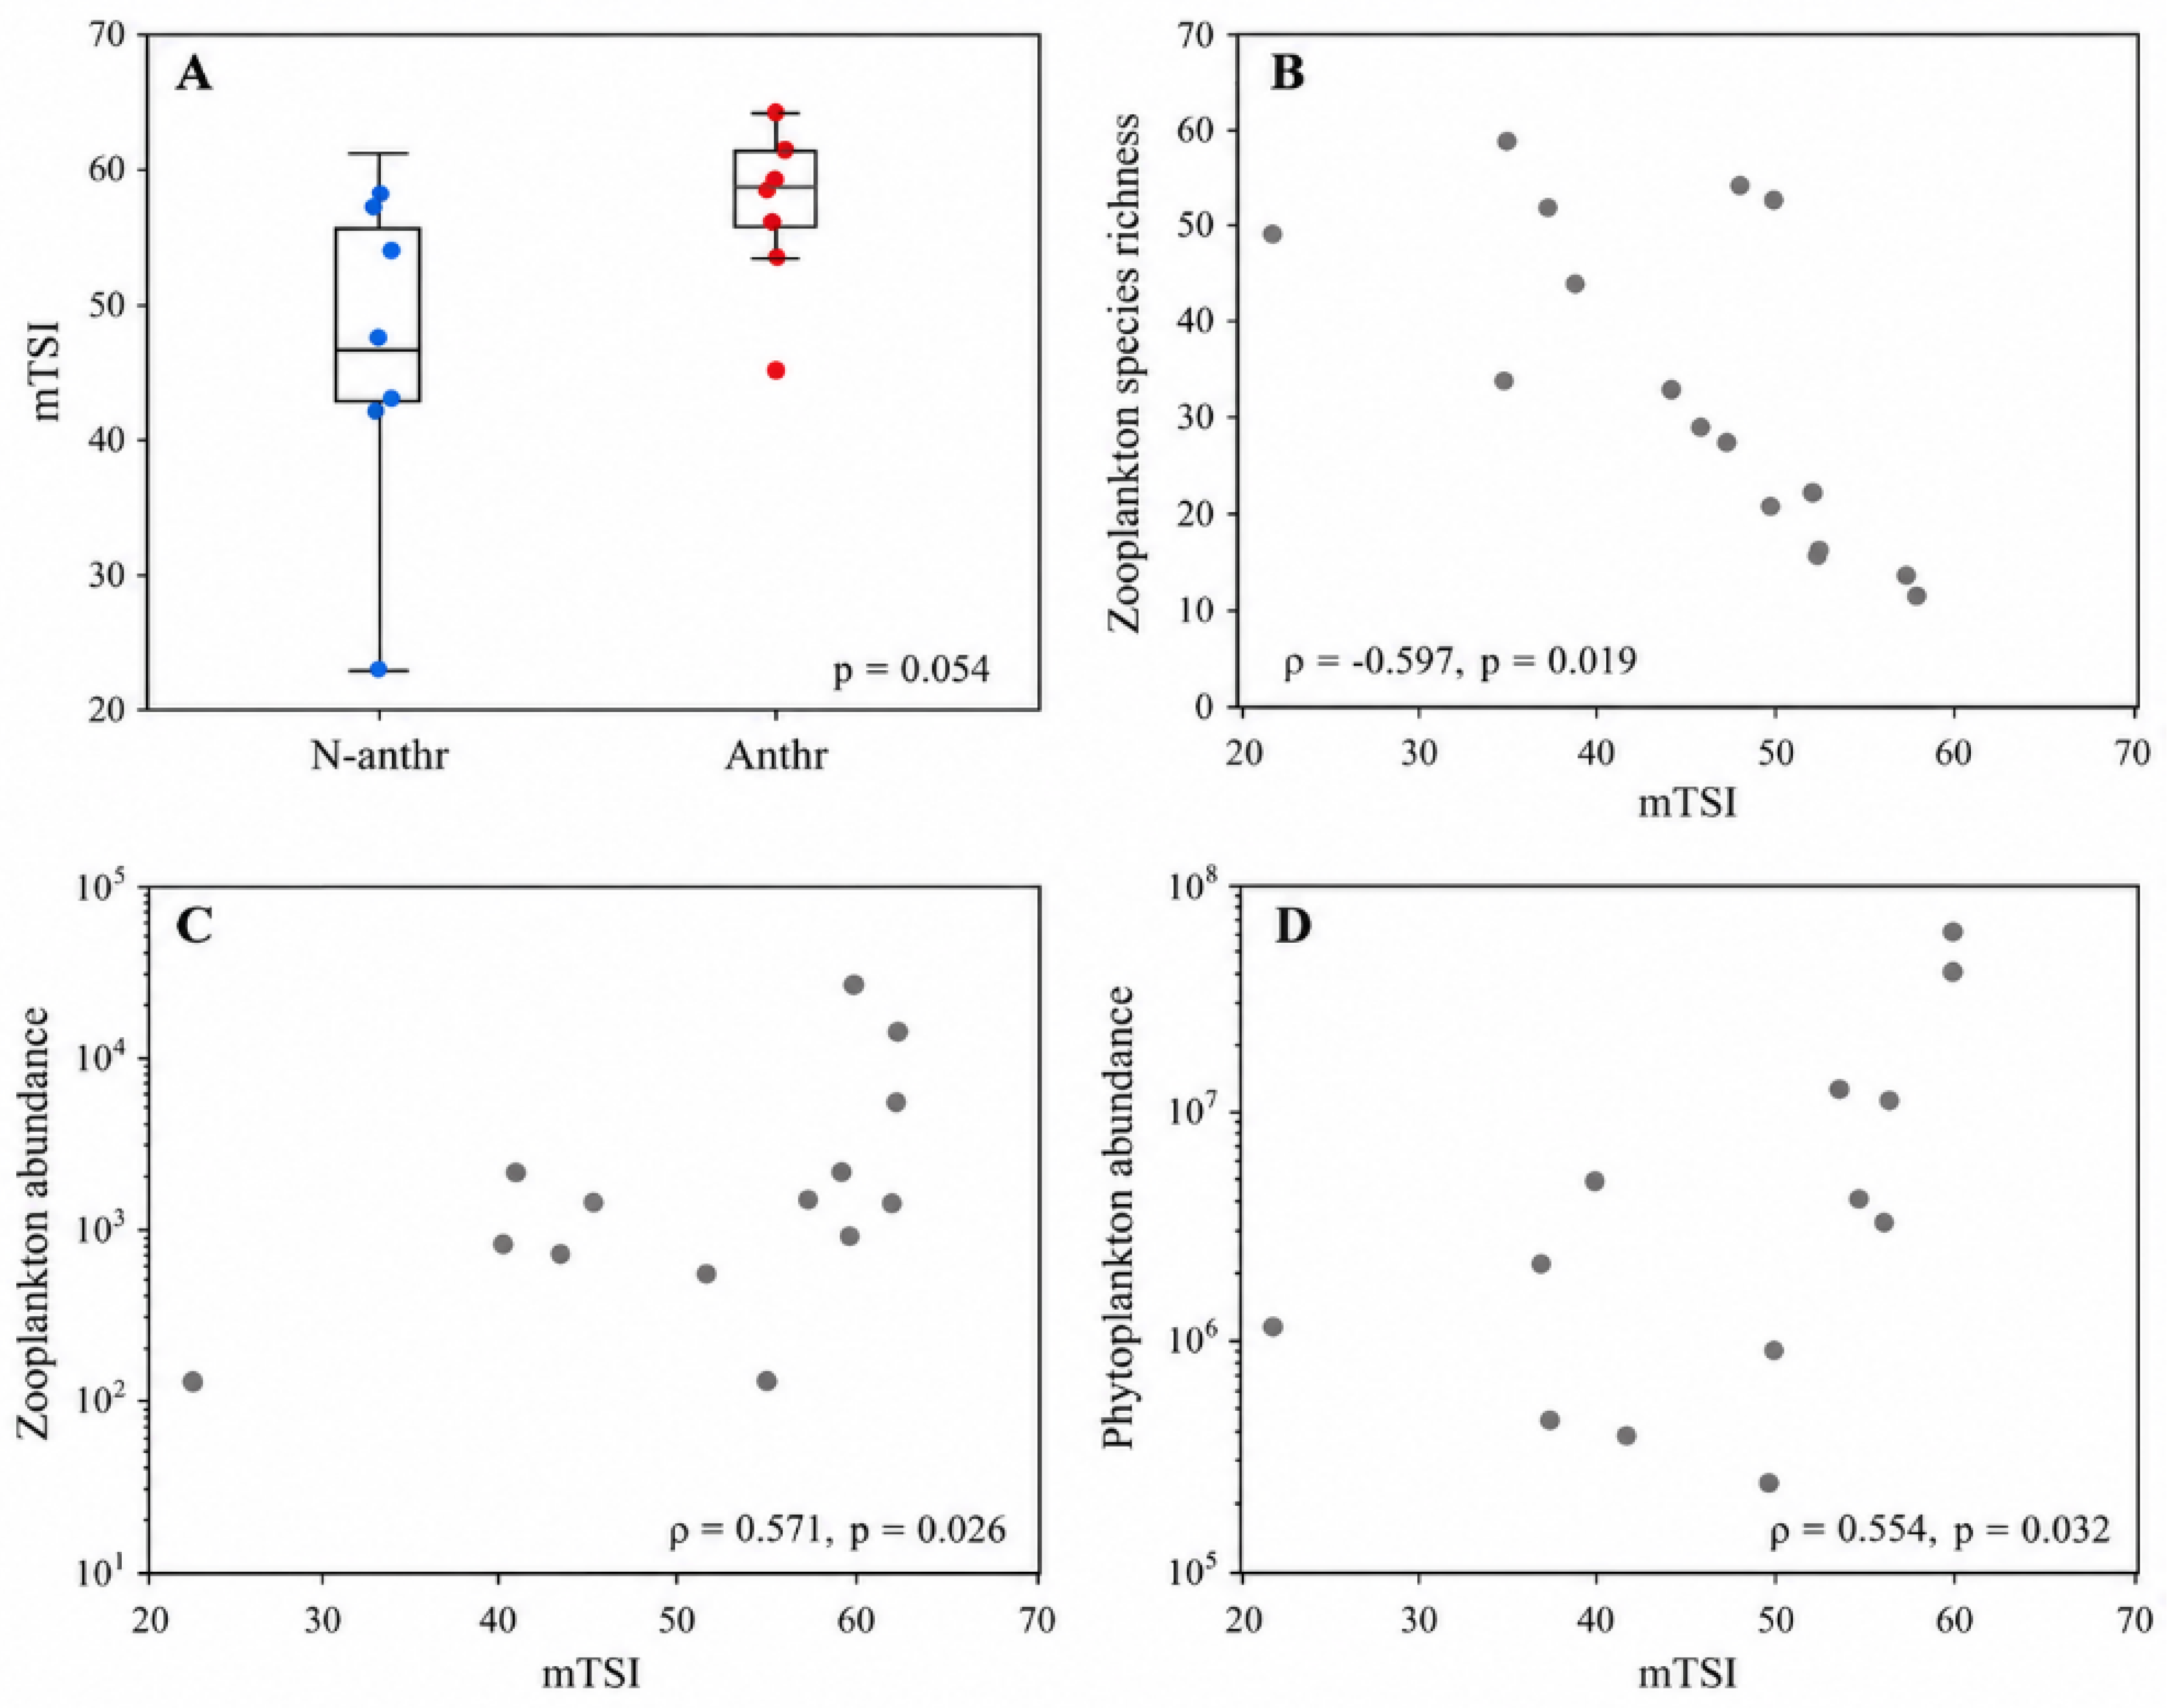
Trophic state was associated with different aspects of phytoplankton and zooplankton community structure (Figure 3; Table S2). Zooplankton richness decreased with increasing mTSI (ρ = −0.597, p = 0.019; Figure 3B), whereas zooplankton abundance increased (ρ = 0.571, p = 0.026; Figure 3C). Phytoplankton abundance also increased with mTSI (ρ = 0.554, p = 0.032; Figure 3D), while total phytoplankton richness was not significantly related to mTSI. Among phytoplankton groups, Euglenozoa abundance showed the strongest positive relationship with mTSI (ρ = 0.771, p < 0.001), whereas Charophyta richness decreased with increasing mTSI (ρ = −0.723, p = 0.002; Table S2). Anthr ponds had a higher median mTSI than N-anthr ponds (59.94 vs. 46.73), although the difference was not statistically significant (p = 0.054; Figure 3A).
Figure 3.
Relationships between trophic state and plankton community responses in urban ponds. (A) Modified trophic state index (mTSI) in less anthropogenically influenced (N-anthr) and anthropogenically influenced (Anthr) ponds; relationships between mTSI and (B) total zooplankton richness, (C) total zooplankton abundance, and (D) total phytoplankton abundance. Points represent individual ponds. Abundance in panels (C,D) is presented on a logarithmic scale. The p-value in panel (A) is based on the Mann–Whitney U test; Spearman rank correlation coefficients (ρ) and corresponding p-values are shown for panels (B–D).
No significant relationships were found between corresponding phytoplankton and zooplankton community descriptors. Species richness was not significantly related between the two plankton components (ρ = 0.080, p = 0.777), nor were Shannon diversity (ρ = 0.004, p = 0.990) or Pielou evenness (ρ = −0.107, p = 0.704). Total phytoplankton and zooplankton abundances showed a positive but non-significant relationship (ρ = 0.443, p = 0.098).
3.3. Environmental Structuring of Phytoplankton and Zooplankton Composition
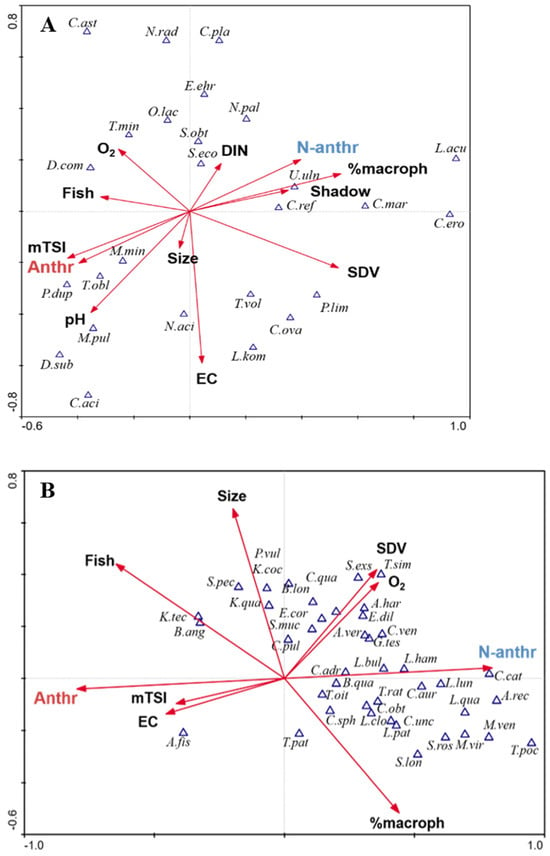
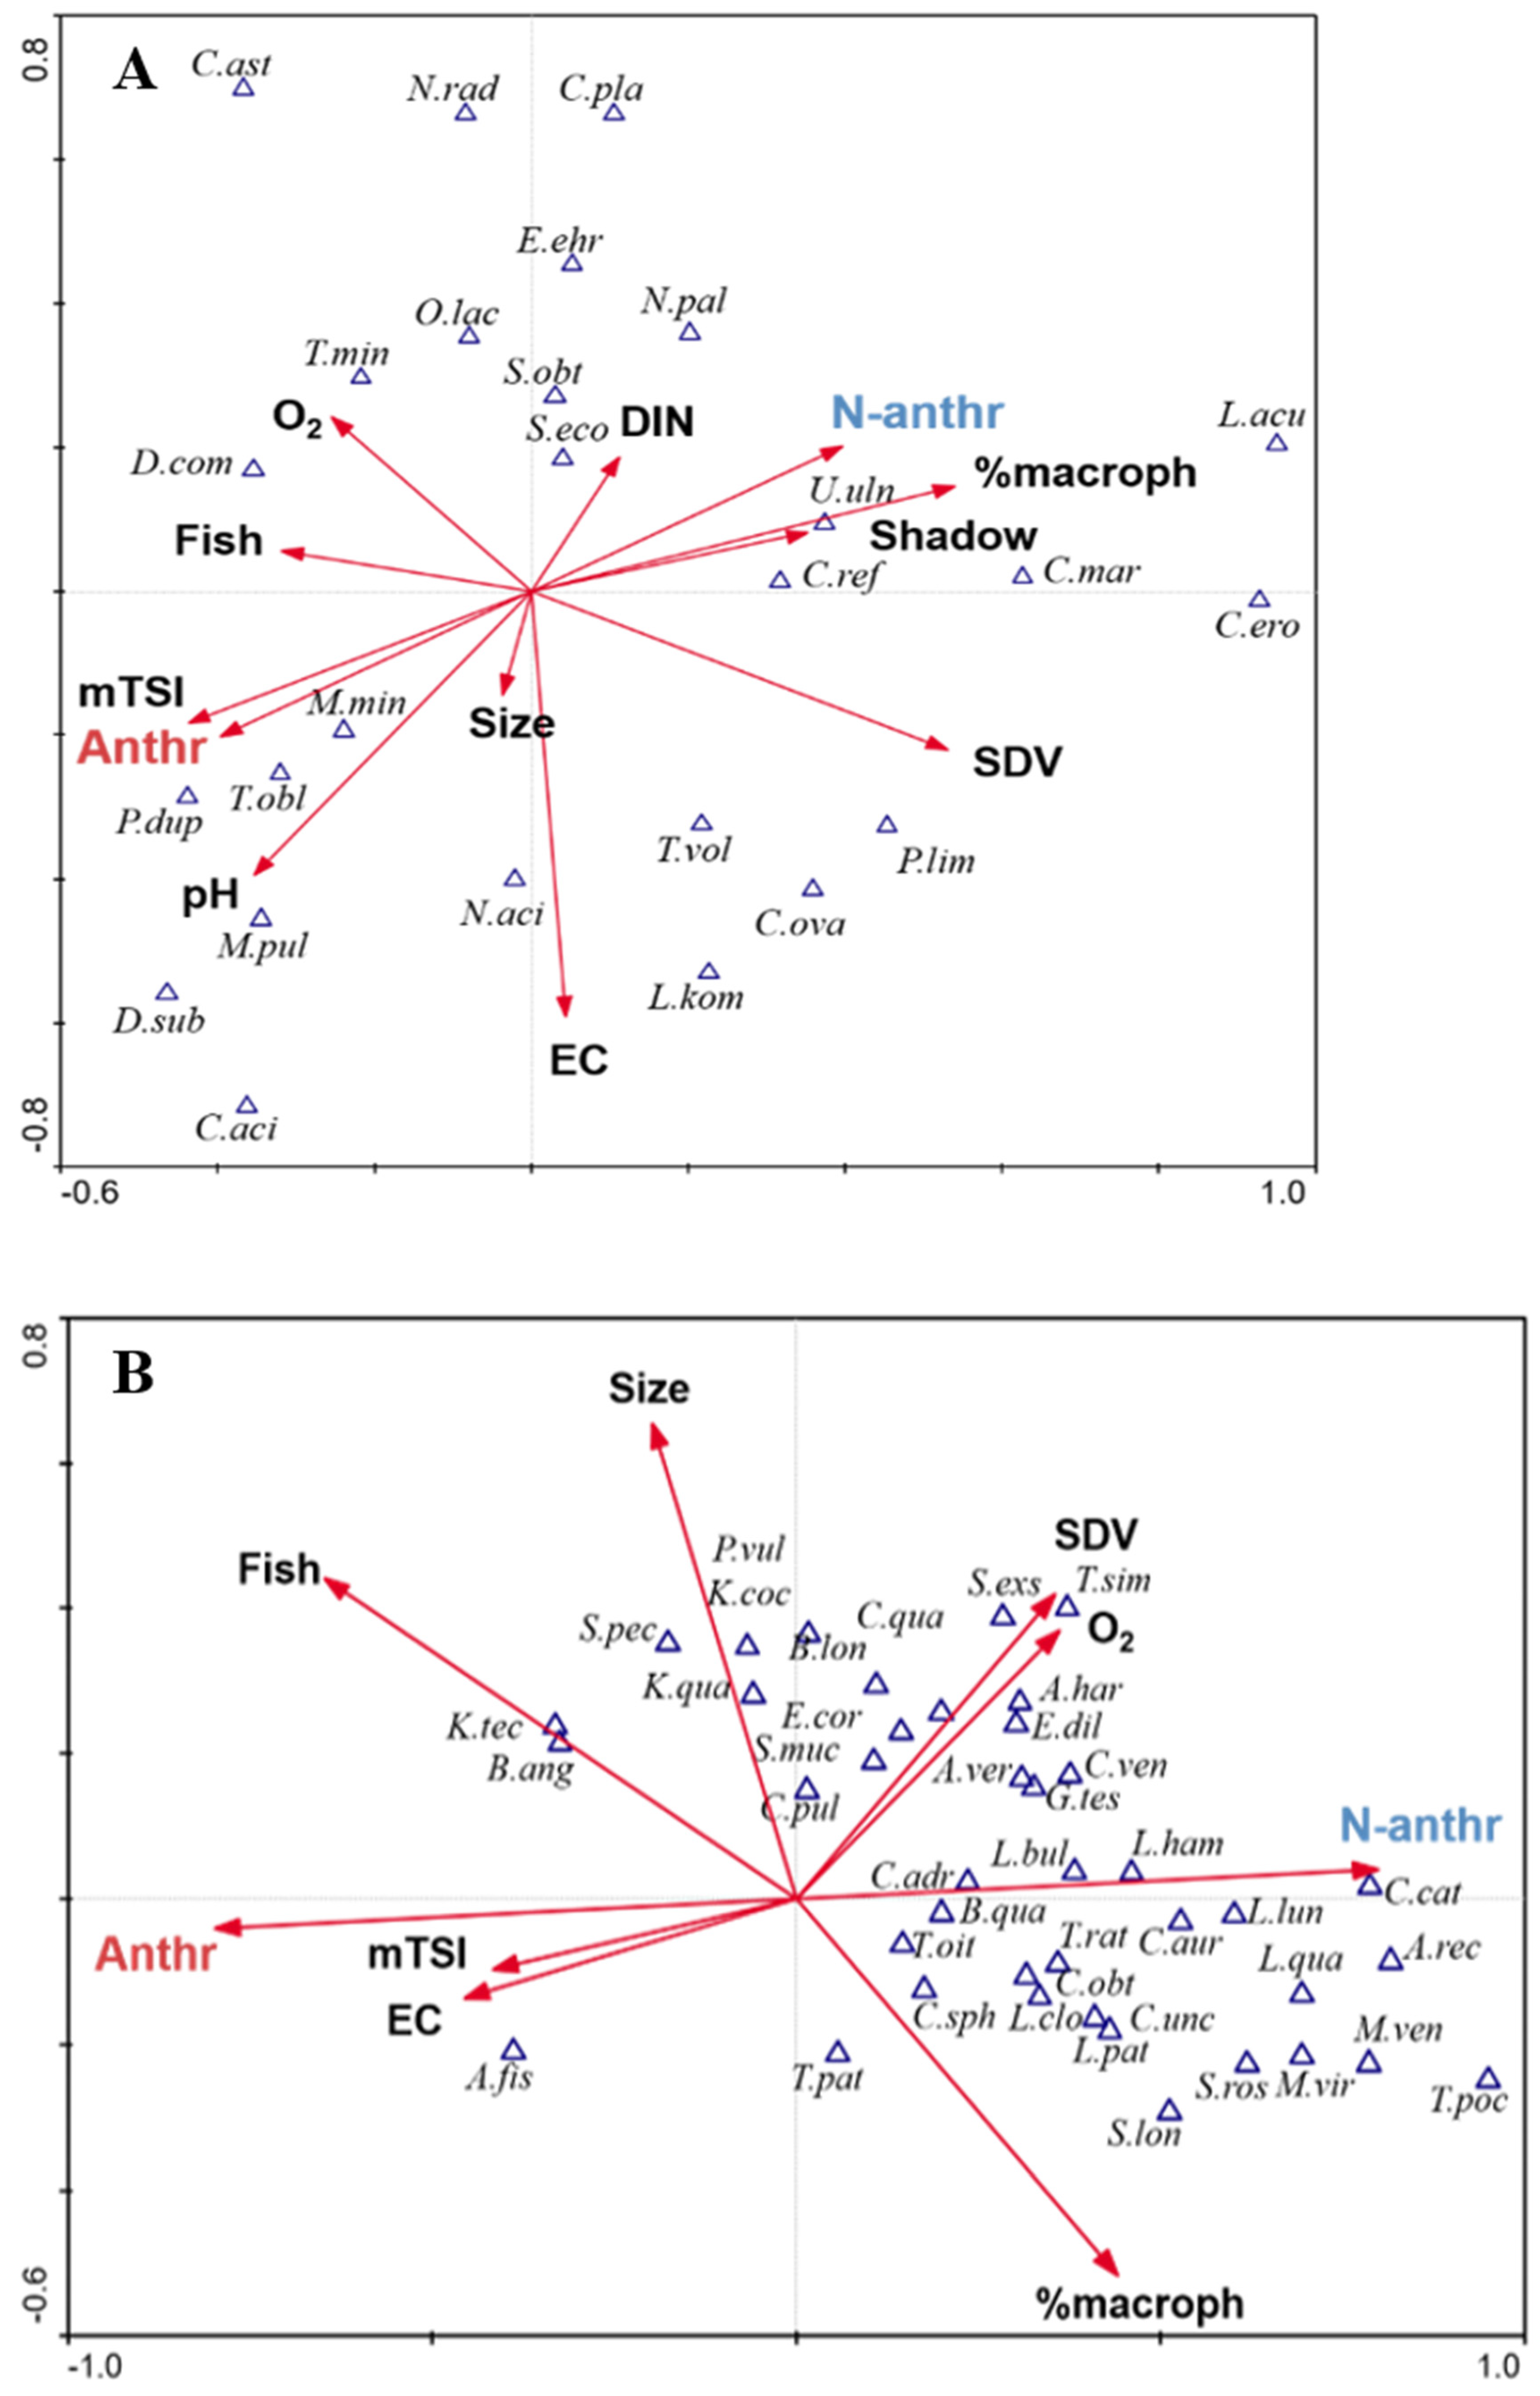
CCA showed that none of the analysed environmental variables significantly explained variation in phytoplankton community composition (Monte Carlo permutation tests, p > 0.05 for all variables; Figure 4A). Macrophyte cover showed the highest explanatory contribution (λA = 0.20), followed by electrical conductivity, although neither relationship was statistically significant. Individual taxa nevertheless occupied different positions in the ordination space. Euglena ehrenbergii was positioned in the direction of higher DIN, Pseudanabaena limnetica in the direction of higher water transparency (SDV), whereas Pediastrum duplex was positioned closer to the Anthr and mTSI vectors. These patterns are descriptive, as none of the tested environmental variables significantly explained phytoplankton community composition.
Figure 4.
Canonical correspondence analysis (CCA) ordination diagrams showing relationships between explanatory variables and species composition of (A) phytoplankton and (B) zooplankton in 15 urban ponds. Only taxa recorded in at least four ponds were included in the analyses. Arrows represent explanatory variables, and species are indicated by abbreviated names. In the phytoplankton analysis, none of the explanatory variables was statistically significant (p > 0.05), whereas in the zooplankton analysis, local anthropogenic influence (Anthr/N-anthr) significantly explained variation in species composition (F = 3.13, p = 0.002, λA = 0.35). Legend: 1. Environmental variables: Anthr—anthropogenically influenced ponds; N-anthr—less anthropogenically influenced ponds; mTSI—modified Carlson-type trophic state index; DIN—dissolved inorganic nitrogen; %macroph—macrophyte cover; Shadow—degree of pond shading; Fish—fish presence; Size—pond surface area; EC—electrical conductivity; SDV—Secchi disk visibility; O2—oxygen saturation. 2. Phytoplankton: C. aci—Closteriopsis acicularis, C. ast—Coelastrum astroideum, C. ero—Cryptomonas erosa, C. mar—C. marssonii, C. ova—C. ovata, C. refl—C. reflexa, D. com—Desmodesmus communis, D. sub—D. subspicatus, E. ehr—Euglena ehrenbergii, L. acu—Lepocinclis acus, L. kom—Lemmermannia komarekii, M. min—Monoraphidium minutum, M. pul—Mucidosphaerium pulchellum, N. aci—Nitzschia acicularis, N. pal—N. palea, N. rad—Navicula radiosa, O. lac—Oocystis lacustris, P. dup—Pediastrum duplex, P. lim—Pseudanabaena limnetica, S. eco—Scenedesmus ecornis, S. obt—S. obtusus, T. vol—Trachelomonas volvocina, T. min—Tetraedron minimum, T. obl—Tetradesmus obliquus, U. uln—Ulnaria ulna. 3. Zooplankton: A. fis—Anuraeopsis fissa, B. ang—Brachionus angularis, B. qua—Brachionus quadridentatus, C. aur—Cephalodella auriculata, C. cat—Cephalodella catellina, C. ven—Cephalodella ventripes, C. adr—Colurella adriatica, C. obt—Colurella obtusa, C. unc—Colurella uncinata, E. dil—Euchlanis dilatata, K. coc—Keratella cochlearis, K. tec—Keratella tecta, K. qua—Keratella quadrata, L. bul—Lecane bulla, L. clo—Lecane closterocerca, L. ham—Lecane hamata, L. lun—Lecane luna, L. qua—Lecane quadridentata, L. pat—Lepadella patella, M. ven—Mytilina ventralis, P. vul—Polyarthra vulgaris, S. lon—Scaridium longicaudum, S. ros—Squatinella rostrum, S. pec—Synchaeta pectinata, T. pat—Testudinella patina, T. rat—Trichocerca rattus, T. sim—Trichocerca similis, T. poc—Trichotria pocillum, A. har—Acroperus harpae, A. rec—Alona rectangula, E. cor—Eubosmina coregoni, B. lon—Bosmina longirostris, C. pul—Ceriodaphnia pulchella, C. qua—Ceriodaphnia quadrangula, C. sph—Chydorus sphaericus, G. tes—Graptoleberis testudinaria, S. muc—Scapholeberis mucronata, S. exs—Simocephallus exspinosus, A. ver—Acanthocyclops vernalis, M. vir—Megacyclops viridis, T. oit—Thermocyclops oithonoides.
In contrast, local anthropogenic influence (Anthr/N-anthr) was the only explanatory variable that significantly explained zooplankton community composition (λA = 0.35, F = 3.13, p = 0.002; Figure 4B). Anuraeopsis fissa, Brachionus angularis, and Keratella tecta were positioned towards Anthr ponds, whereas a broader group of rotifers and crustaceans, including Cephalodella auriculata, C. catellina, Colurella uncinata, Lecane quadridentata, L. luna, Alona rectangula, Graptoleberis testudinaria, and Megacyclops viridis, were positioned towards N-anthr ponds. None of the other environmental variables significantly explained zooplankton community composition (p > 0.05).
3.4. Indicator Taxa Associated with Human Impact
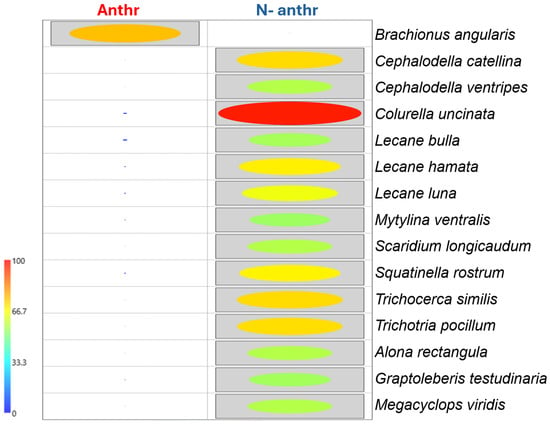
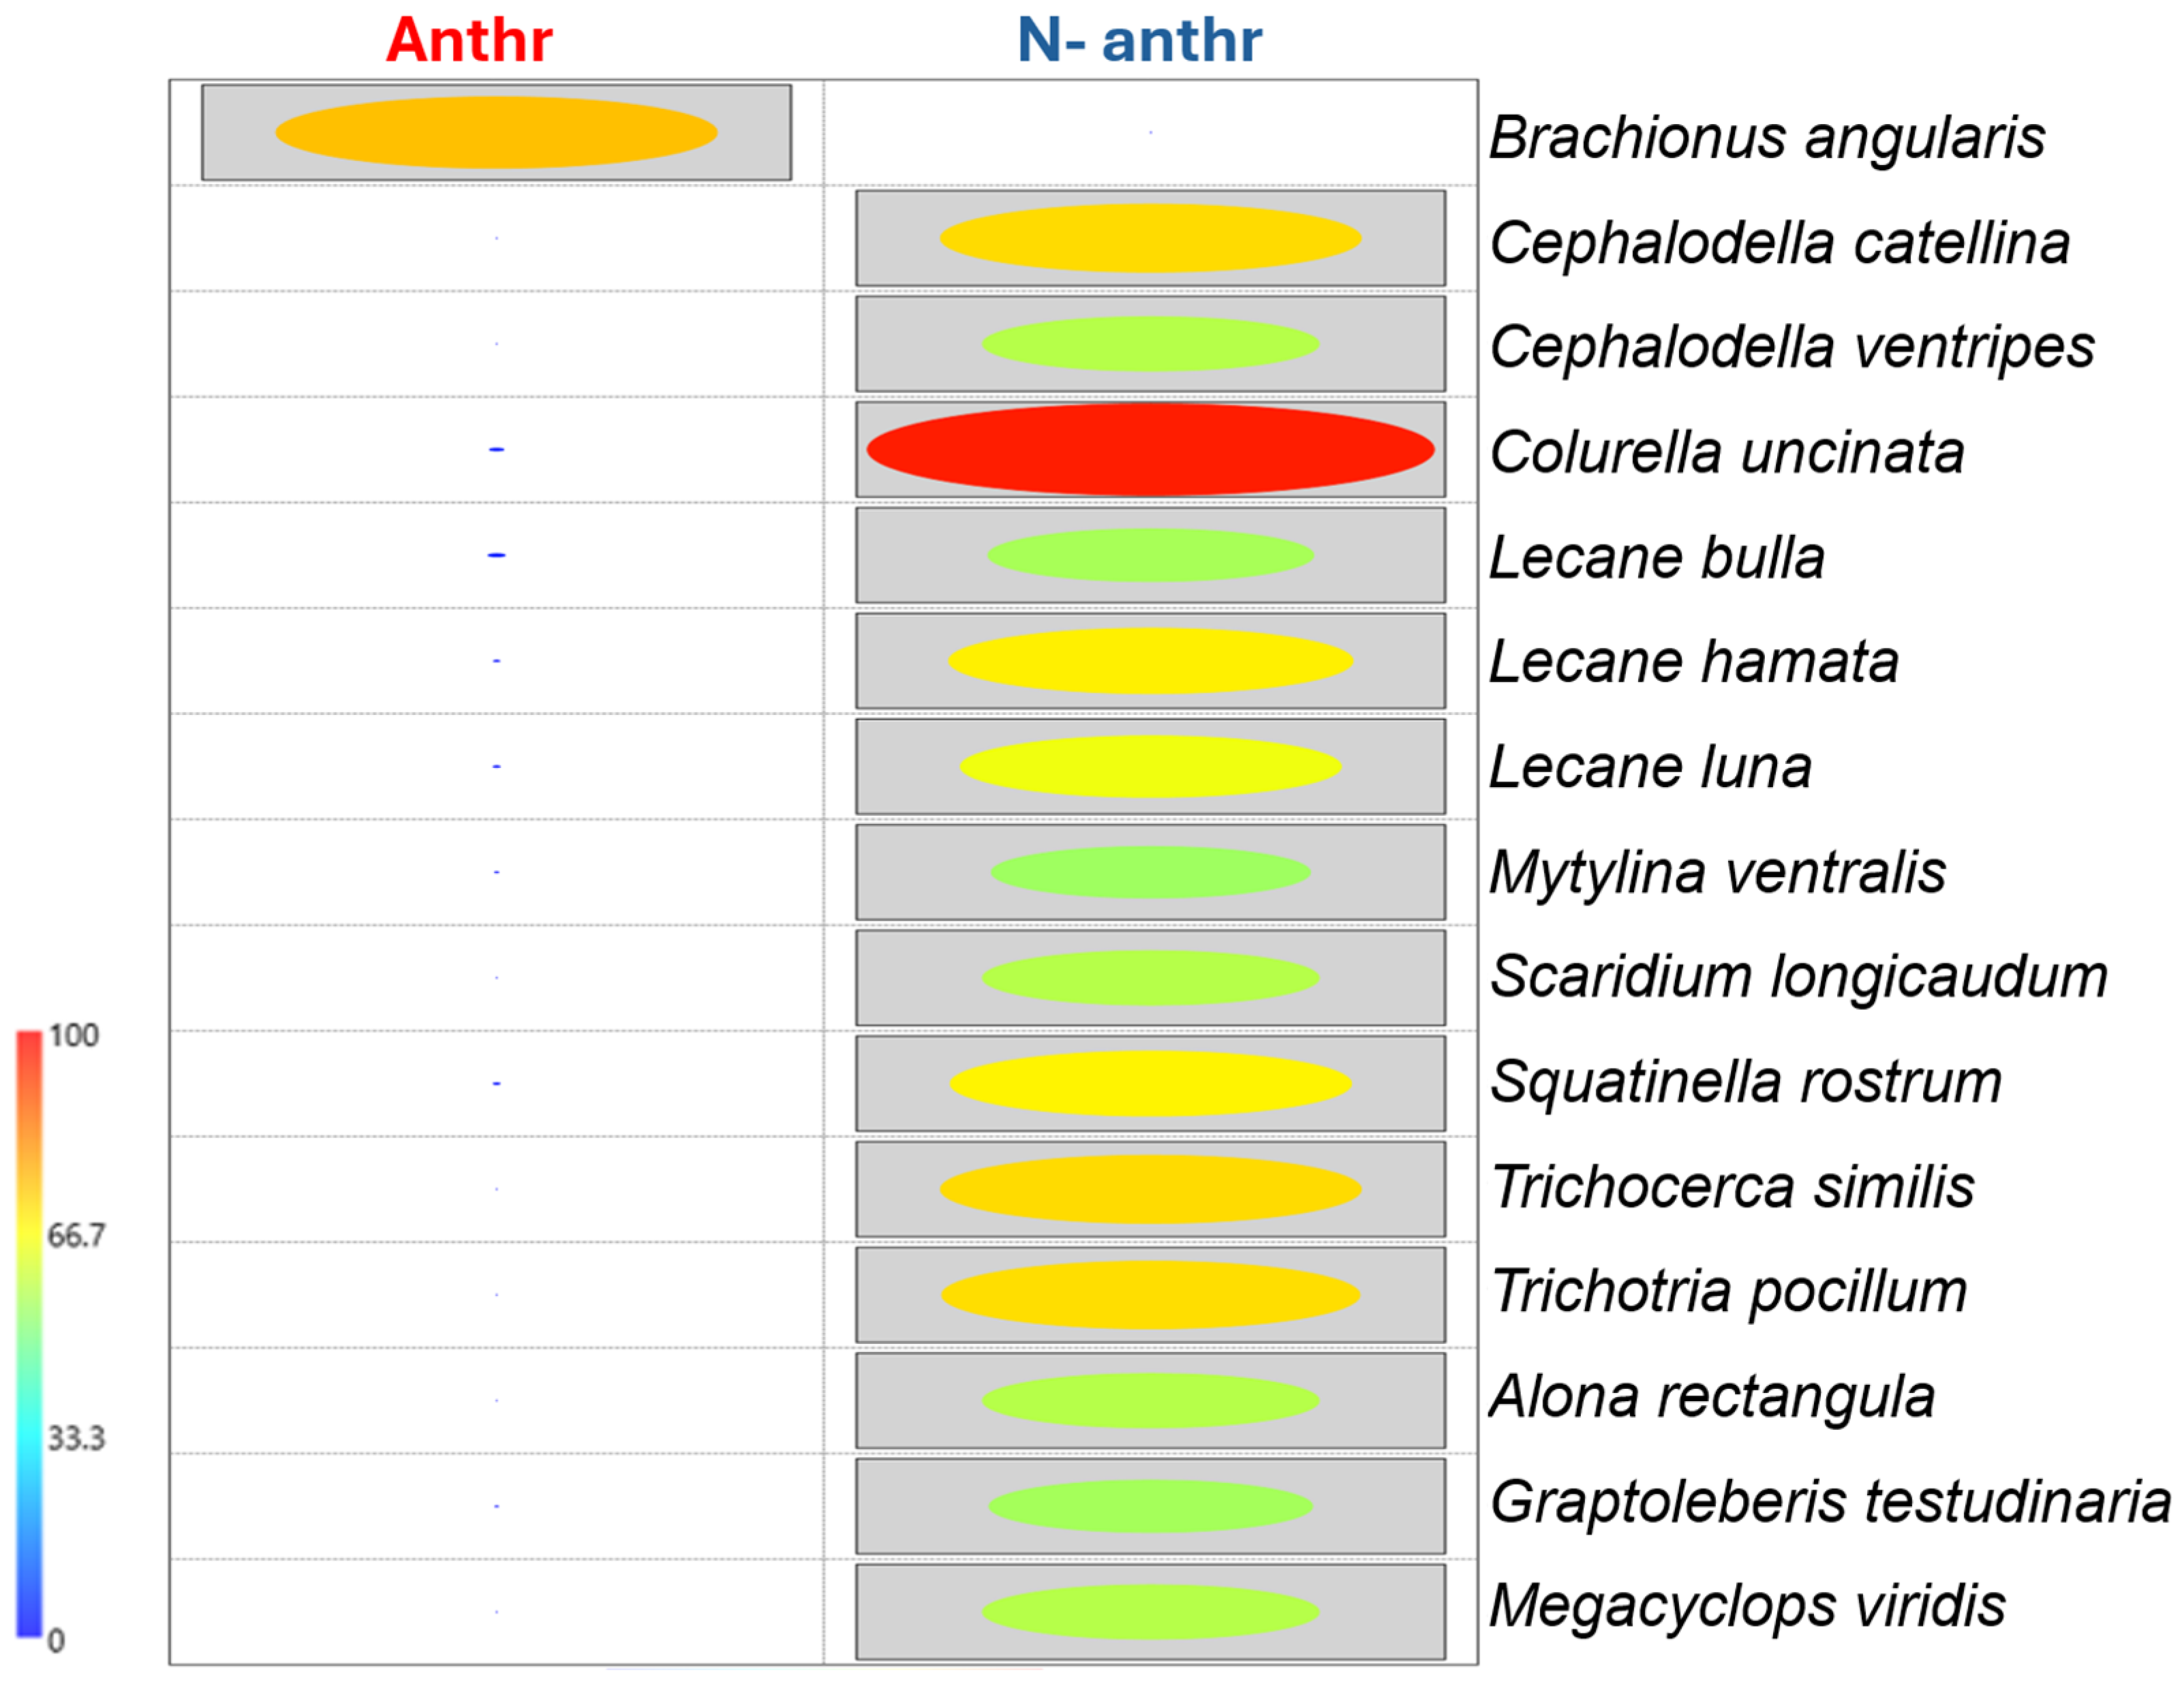
Indicator species analysis (IndVal) revealed a pronounced asymmetry in zooplankton taxa associated with contrasting levels of human impact. Fourteen species were significant indicators of less anthropogenically influenced (N-anthr) ponds, including eleven rotifers (Cephalodella catellina, C. ventripes, Colurella uncinata, Lecane bulla, L. hamata, L. luna, Mytilina ventralis, Scaridium longicaudum, Squatinella rostrum, Trichocerca similis, and Trichotria pocillum), two cladocerans (Alona rectangula and Graptoleberis testudinaria), and one copepod (Megacyclops viridis). In contrast, only one species, the rotifer Brachionus angularis, was a significant indicator of anthropogenically influenced (Anthr) ponds (Figure 5). Among the N-anthr indicators, Colurella uncinata showed the highest indicator value.
Figure 5.
Indicator species analysis (IndVal) showing significant zooplankton indicator taxa associated with anthropogenically influenced (Anthr) and less anthropogenically influenced (N-anthr) urban ponds. Colours represent indicator values (IndVal, %) ranging from 0 to 100, with higher values indicating a stronger association with a particular pond category. Only taxa with significant associations (p < 0.05) are shown.
4. Discussion
4.1. Contrasting Responses of Phytoplankton and Zooplankton to Human Impact
Our results demonstrate a clear contrast in the responses of phytoplankton and zooplankton to local anthropogenic pressure. Zooplankton diversity declined significantly in anthropogenically influenced ponds, while zooplankton abundance remained relatively stable. In contrast, phytoplankton diversity was largely unaffected, whereas phytoplankton abundance increased substantially. This pattern suggests that anthropogenic disturbance influenced zooplankton primarily by reducing taxonomic richness, while its effects on phytoplankton were expressed mainly through increased biomass and abundance. Consequently, elevated plankton abundance did not translate into greater biodiversity, emphasizing that productivity and diversity do not necessarily respond similarly to environmental pressures [6,33,34].
The lower cumulative richness observed in anthropogenically influenced ponds suggests that human activities may reduce the diversity of ecological niches available for zooplankton. Habitat simplification, diminished littoral vegetation, and other environmental alterations associated with urbanisation can limit the coexistence of taxa with different ecological requirements, leading to communities dominated by a smaller number of tolerant species. Similar patterns have been reported in other freshwater ecosystems, where habitat heterogeneity promotes zooplankton diversity, whereas environmental degradation is associated with reduced taxonomic richness [35,36]. Importantly, zooplankton abundance did not decline together with species richness, suggesting that anthropogenic influence affected community diversity rather than overall abundance. One possible explanation is that anthropogenic pressure led to habitat simplification, reduced littoral habitat availability, altered land use surrounding the ponds, and increased environmental disturbance associated with human activities. Such conditions may favour a limited number of tolerant taxa while reducing the occurrence of more sensitive species, thereby maintaining overall abundance despite a decline in taxonomic richness. Similar patterns, characterized by reduced species richness but stable or elevated abundance, have been reported from nutrient-enriched and disturbed freshwater ecosystems [37,38]. The environmental variables assessed in the present study support this interpretation, suggesting that differences between pond categories were associated with multiple habitat characteristics rather than trophic state alone.
Phytoplankton showed a different response. Total species richness was similar between Anthr and N-anthr ponds, and cumulative richness remained almost unchanged after standardisation (226.6 vs. 222 taxa), whereas total abundance was much higher in Anthr ponds. This suggests that anthropogenic influence affected mainly phytoplankton abundance and the contribution of particular taxonomic groups, rather than overall species richness. Such a pattern may result from nutrient enrichment favouring the growth of some taxa without necessarily reducing total phytoplankton richness [39,40].
The absence of a significant relationship between phytoplankton richness and mTSI may reflect the high dispersal ability and rapid turnover of phytoplankton species. Small urban ponds often receive propagules from multiple sources [8,41], while nutrient enrichment may promote the proliferation of certain taxa without necessarily causing local species loss [42]. Consequently, changes in phytoplankton communities may be expressed more strongly through abundance patterns than through species richness. This is the positive relationship between phytoplankton abundance and mTSI observed in the present study. Euglenozoa provide a particularly clear example, as their richness, abundance, and Shannon diversity increased under more eutrophic conditions. Euglenoids are frequently associated with nutrient-rich, organically enriched, and highly productive waters [43,44].
Zooplankton biodiversity therefore appears to be more clearly associated with local anthropogenic influence than phytoplankton biodiversity. This contrast is consistent with our expectation that the two plankton components would respond differently.
4.2. Plankton Responses to Trophic State
Trophic state was related to different aspects of phytoplankton and zooplankton communities. With increasing mTSI, zooplankton species richness decreased, whereas total abundance increased. This suggests that more eutrophic conditions can support high zooplankton abundance despite lower species richness, a pattern also reported along trophic gradients in lakes and more generally associated with ecological changes accompanying eutrophication [45,46].
Rotifers may contribute to this pattern, as many species respond rapidly to eutrophication because of their short generation times and ability to use small food particles, bacteria, and detritus [47]. Nutrient-rich conditions may therefore favour tolerant rotifer species, allowing high abundance to coexist with lower species richness [48,49].
Phytoplankton responded differently. Total abundance increased with mTSI, whereas species richness showed no significant relationship, indicating that increasing trophic conditions were reflected more strongly in phytoplankton abundance than in species richness. Our results suggest that phytoplankton reflected trophic conditions more clearly than local anthropogenic influence. The positive relationship between phytoplankton abundance and mTSI, together with the lack of differences in species richness between pond categories, indicates that phytoplankton responded primarily to nutrient availability and ecosystem productivity rather than to anthropogenic disturbance itself. This pattern is consistent with the rapid response of phytoplankton communities to nutrient enrichment and changes in productivity [8,50]. Euglenozoa showed the strongest positive relationship with mTSI, consistent with their association with nutrient-rich and productive waters [44,51]. In contrast, Charophyta richness decreased with increasing mTSI, which may reflect the preference of many charophyte taxa for clearer and less nutrient-rich waters [52,53].
Trophic state did not fully explain the differences between Anthr and N-anthr ponds. Although Anthr ponds had a higher median mTSI, the difference was not statistically significant (p = 0.054). Local anthropogenic influence therefore appears to reflect more than eutrophication alone and may also involve differences in habitat structure, surrounding land use, and direct human activities affecting pond ecosystems, such as shoreline alteration and recreational use [54,55].
4.3. Relationships Between Phytoplankton and Zooplankton Diversity
The contrasting responses of phytoplankton and zooplankton were also reflected in the lack of significant relationships between the two plankton components. Their species richness, Shannon diversity, and evenness were not significantly related, and the relationship between their total abundances was also not significant. Thus, even within the same ponds and under the same local environmental conditions, the two plankton components did not provide similar biodiversity signals. Although phytoplankton is generally regarded as a sensitive indicator of environmental change because of its rapid response to nutrient enrichment and physicochemical fluctuations, the present study suggests that phytoplankton and zooplankton reflect different dimensions of ecosystem change. Phytoplankton primarily tracked trophic conditions and productivity, whereas zooplankton more clearly reflected local anthropogenic disturbance. Together, these groups provide complementary information on ecological status.
This lack of congruence may reflect the different factors shaping the two communities. Phytoplankton can respond rapidly to nutrient availability and changes in productivity, mainly through changes in abundance and the contribution of particular taxonomic groups [50,56]. Zooplankton is also influenced by food availability, but its community structure depends on additional factors such as habitat structure, fish predation, and trophic interactions, which may modify the effects of resource availability [57]. These differences may explain why environmental change does not produce parallel responses in phytoplankton and zooplankton biodiversity.
An assessment based on only one plankton component may provide an incomplete picture of biodiversity responses to anthropogenic influence. In particular, phytoplankton richness alone would not reveal the decline in zooplankton diversity observed in Anthr ponds. Considering both communities may therefore provide a more complete assessment of biodiversity change in urban ponds [58,59].
4.4. Zooplankton Community Composition and Indicator Taxa
The response of zooplankton to local anthropogenic influence was also evident at the community composition level. In the CCA, Anthr/N-anthr was the only significant factor explaining zooplankton community composition, whereas none of the tested environmental variables significantly explained phytoplankton composition. The absence of significant environmental predictors for phytoplankton community composition may indicate that the measured variables did not fully capture the processes structuring phytoplankton assemblages. Stochastic colonisation, seasonal succession, short-term fluctuations in nutrient availability, and biotic interactions may contribute substantially to phytoplankton variability in small urban ponds [60]. This provides further evidence that zooplankton community composition was more clearly associated with local anthropogenic influence than phytoplankton composition and that the zooplankton response involved not only species richness but also changes in community composition.
Several rotifer species, including Brachionus angularis, Anuraeopsis fissa, and Keratella tecta, were associated with the Anthr side of the CCA. These species are commonly reported from eutrophic and highly productive waters and are considered tolerant of deteriorated environmental conditions [27,61,62]. Among them, B. angularis was also the only significant indicator of Anthr ponds in the IndVal analysis, strengthening its association with more strongly transformed urban ponds. In contrast, 14 species were significant indicators of N-anthr ponds. These included several littoral rotifers, such as Colurella uncinata, Lecane spp., and Cephalodella spp., as well as crustaceans including Alona rectangula, Graptoleberis testudinaria, and Megacyclops viridis. Many of these taxa are associated with vegetated littoral habitats and structurally diverse environments [63]. Their occurrence suggests that ponds undergoing lower human stress may provide a wider range of suitable habitats for zooplankton.
The marked difference in the number of indicator species between the two pond categories may indicate a simplification of zooplankton communities under stronger local anthropogenic pressure. N-anthr ponds supported more characteristic species, including many littoral and vegetation-associated taxa, whereas only B. angularis was a significant indicator of Anthr ponds. Similar simplification of zooplankton communities has been reported under human disturbance in other freshwater ecosystems [64]. The CCA and IndVal results therefore provide consistent evidence that zooplankton community composition can provide a sensitive signal of local anthropogenic influence in urban ponds.
4.5. Urban Ponds as Biodiversity Refuges in Transformed Landscape
Despite their small size and urban location, the 15 ponds supported high plankton diversity, with 339 phytoplankton and 148 zooplankton taxa recorded. The zooplankton community alone included 99 rotifers, 35 cladocerans, and 14 copepods. Particularly important were less anthropogenically influenced ponds, which supported 128 zooplankton taxa across only seven water bodies. These findings highlight the ecological value of small ponds in transformed urban landscapes and support growing evidence that networks of small water bodies can contribute substantially to biodiversity at the landscape scale [3,35].
The importance of small urban ponds extends beyond their biodiversity value. Small water bodies and wetlands contribute to water retention, increase habitat diversity, and form elements of blue-green infrastructure in cities. Their role may become increasingly important under climate change, particularly where drought, high temperatures, and water shortages are becoming more frequent [4]. Maintaining existing ponds and small wetlands, including less intensively managed sites, should therefore be an important part of urban planning and biodiversity conservation. Protecting these habitats may help preserve both freshwater biodiversity and the ecological functions of urban landscapes.
These conclusions should, however, be considered in the context of the sampling design. The 15 ponds were sampled during one summer season, and the Anthr/N-anthr classification represented a qualitative assessment of local anthropogenic influence rather than a quantitative measure of urbanisation. Further studies covering more ponds, seasons, and direct measures of human pressure would help determine how general these patterns are across urban landscapes.
5. Conclusions
This study demonstrated that phytoplankton and zooplankton provided contrasting biodiversity signals in small urban ponds exposed to different levels of anthropogenic influence. Zooplankton responded to local human pressure, exhibiting reduced species richness, simplified community composition, and fewer indicator taxa in anthropogenically influenced ponds. In contrast, phytoplankton responses were expressed primarily through increased abundance and stronger relationships with trophic state rather than through changes in species richness.
The absence of significant relationships between corresponding phytoplankton and zooplankton diversity metrics indicates that these communities reflect different aspects of ecosystem functioning and environmental change. Consequently, assessments based on a single plankton component may overlook important ecological patterns.
Our findings highlight the value of integrating phytoplankton and zooplankton in the ecological assessment of urban freshwater ecosystems. They also emphasize the importance of small urban ponds, particularly less disturbed sites, as reservoirs of freshwater biodiversity. Conservation and management of these habitats should therefore be considered an important component of urban biodiversity strategies.
Supplementary Materials
The following supporting information can be downloaded at: https://www.mdpi.com/article/10.3390/d18100620/s1, Table S1. Environmental characteristics of the 15 studied ponds. The table includes pond identity, human-impact type (Anthr, anthropogenic; N-anthr, non-anthropogenic), pond origin (artif-artificial or glac- glacial), trophic category, surface area (ha), maximum depth (m), shading intensity, percentage cover of macrophytes, modified trophic state index (mTSI), and fish occurrence (presence = 1, absence = 0), TRP (Total Reactive Phosphorus), DIN (Dissolved Inorganic Nitrogen), chla-chlorophyll a concentration. Table S2. Differences in phytoplankton and zooplankton community descriptors between anthropogenically influenced (Anthr) and less anthropogenically influenced (N-anthr) ponds, and their relationships with trophic state (mTSI). Values are presented as median (min–max). Differences between pond categories were tested using two-sided Mann–Whitney U tests; relationships with mTSI were assessed using Spearman rank correlations.
Author Contributions
Conceptualization, N.K.-K.; methodology, N.K.-K. and A.K.; formal analysis, N.K.-K. and A.K.; investigation, N.K.-K. and A.K.; data curation, N.K.-K. and A.K.; writing—original draft preparation, N.K.-K. and A.K.; writing—review and editing, N.K.-K. and A.K.; visualization, N.K.-K. and A.K.; supervision, N.K.-K. All authors have read and agreed to the published version of the manuscript.
Funding
This research received no external funding.
Institutional Review Board Statement
Not applicable.
Informed Consent Statement
Not applicable.
Data Availability Statement
The data presented in this study are available from the corresponding author upon reasonable request.
Conflicts of Interest
The authors declare no conflicts of interest.
References
- Sousa, M.C.; Martins, R.; Simões, N.E.; Feio, M.J. Ecosystem services of urban rivers: A systematic review. Aquat. Sci. 2025, 87, 10. [Google Scholar] [CrossRef] [Scilit]
- Mendonça, L.B.G.; de Oliveira, A.K.N.; Pereira, A.L.A.; de Jesus, G.S.; Lima, J.S.; Bortolini, J.C. Systematic review reveals patterns, trends, and knowledge gaps in the urban ecology of freshwater ecosystems. Hydrobiologia 2026, 853, 4465–4488. [Google Scholar] [CrossRef] [Scilit]
- Hill, M.J.; Biggs, J.; Thornhill, I.; Briers, R.A.; Gledhill, D.G.; White, J.C.; Wood, P.J.; Hassall, C. Urban ponds as an aquatic biodiversity resource in modified landscapes. Glob. Change Biol. 2018, 24, 986–999. [Google Scholar] [CrossRef] [Scilit] [PubMed]
- Oertli, B.; Parris, K.M. Toward management of urban ponds for freshwater biodiversity. Ecosphere 2019, 10, e02810. [Google Scholar] [CrossRef] [Scilit]
- Jeppesen, E.; Meerhoff, M.; Holmgren, K.; González-Bergonzoni, I.; Teixeira-de Mello, F.; Declerck, S.A.J.; De Meester, L.; Søndergaard, M.; Lauridsen, T.L.; Bjerring, R.; et al. Impacts of climate warming on lake fish community structure and potential effects on ecosystem function. Hydrobiologia 2010, 646, 73–90. [Google Scholar] [CrossRef] [Scilit]
- Goździejewska, A.M.; Cymes, I.; Glińska-Lewczuk, K. Zooplankton functional diversity as a bioindicator of freshwater ecosystem health across land use gradient. Sci. Rep. 2024, 14, 18456. [Google Scholar] [CrossRef] [Scilit] [PubMed]
- Lampert, W.; Sommer, U. Limnoecology: The Ecology of Lakes and Streams, 2nd ed.; Oxford University Press: Oxford, UK, 2007. [Google Scholar]
- Reynolds, C.S. The Ecology of Phytoplankton; Cambridge University Press: Cambridge, UK, 2006. [Google Scholar]
- Cassan, L.; Laurens, P. Design of emergent and submerged rock-ramp fish passes. Knowl. Manag. Aquat. Ecosyst. 2016, 417, 45. [Google Scholar] [CrossRef] [Scilit]
- Jeppesen, E.; Jensen, J.P.; Søndergaard, M.; Lauridsen, T.; Landkildehus, F. Trophic structure, species richness and biodiversity in Danish lakes: Changes along a phosphorus gradient. Freshw. Biol. 2000, 45, 201–218. [Google Scholar] [CrossRef] [Scilit]
- López, C.; Bonecker, C.; Perbiche-Neves, G.; Elías-Gutiérrez, M. The lack of researchers: A critical threat to studies on freshwater zooplankton in Latin America. Diversity 2025, 17, 381. [Google Scholar] [CrossRef] [Scilit]
- Sługocki, Ł.; Brysiewicz, A. Divergence of zooplankton assemblages in unstable fishless and stable fish ponds. Hydrobiologia 2024, 851, 3881–3896. [Google Scholar] [CrossRef] [Scilit]
- Kuczyńska-Kippen, N. Seasonal changes of the rotifer community in the littoral of a polymictic lake. Verhandlungen Der Int. Ver. Für Theor. Und Angew. Limnol. 2001, 27, 2964–2967. [Google Scholar] [CrossRef] [Scilit]
- Thomaz, S.M.; Cunha, E.R. The role of macrophytes in habitat structuring in aquatic ecosystems: Methods of measurement, causes and consequences on animal assemblages composition and biodiversity. Acta Limnol. Bras. 2010, 22, 218–236. [Google Scholar] [CrossRef] [Scilit]
- Fernández-Aláez, C.; Fernández-Aláez, M.; López-Vázquez, M.; García-Girón, J. Local environmental and spatial processes, not land use, shape the taxonomic and functional structure of pond zooplankton communities. Aquat. Sci. 2026, 88, 44. [Google Scholar] [CrossRef] [Scilit]
- Shen, Y.; Zhou, X.; Zhang, J.; Li, Q.; Zhang, Y.; Zuo, Q. Insights into the effects of environmental factors on phytoplankton and microzooplankton at a basin scale: Diversity, assembly mechanisms, and co-occurrence networks. Front. Mar. Sci. 2024, 11, 1462432. [Google Scholar] [CrossRef] [Scilit]
- Phonmat, P.; Chaichana, R.; Rakasachat, C.; Klongvessa, P.; Chanthorn, W.; Moukomla, S. Phytoplankton and zooplankton assemblages driven by environmental factors along trophic gradients in Thai lentic ecosystems. Diversity 2025, 17, 372. [Google Scholar] [CrossRef] [Scilit]
- De Meester, L.; Declerck, S.A.J.; Ger, K.A. Beyond Daphnia: A plea for a more inclusive and unifying approach to freshwater zooplankton ecology. Hydrobiologia 2023, 850, 4693–4703. [Google Scholar] [CrossRef] [Scilit]
- Tang, X.; Huang, Y.; Chen, C.; He, H.; Qin, Q.; Xu, F.; Zhang, F. Phyto- and zooplankton diversity under land use and water quality dynamics in the Jialing River, China. Diversity 2025, 17, 707. [Google Scholar] [CrossRef] [Scilit]
- APHA. Standard Methods for the Examination of Water and Wastewater, 19th ed.; American Public Health Association: Washington, DC, USA, 1995. [Google Scholar]
- Utermöhl, H. Zur Vervollkommnung der quantitativen Phytoplankton-Methodik. Mitteilungen Int. Ver. Für Theor. Und Angew. Limnol. 1958, 9, 1–38. [Google Scholar] [CrossRef] [Scilit]
- Guiry, M.D.; Guiry, G.M. AlgaeBase. In World-Wide Electronic Publication; University of Galway: Galway, Ireland, 2026; Available online: https://www.algaebase.org (accessed on 10 September 2026).
- Einsle, U. Crustacea: Copepoda: Calanoida und Cyclopoida. In Süsswasserfauna Von Mitteleuropa; Schwoerbel, J., Zwick, P., Eds.; Gustav Fischer Verlag: Berlin, Germany, 1993. [Google Scholar]
- Radwan, S.; Bielańska-Grajner, I.; Ejsmont-Karabin, J. Wrotki Rotifera. Fauna Słodkowodna Polski; Oficyna Wydawnicza Tercja: Łódź, Poland, 2004. [Google Scholar]
- Rybak, J.I.; Błędzki, L.A. Freshwater Planktonic Crustaceans: Identification Key; Wydawnictwo Uniwersytetu Warszawskiego: Warszawa, Poland, 2010. [Google Scholar] [CrossRef] [Scilit]
- Koste, W. Die Rädertiere Mitteleuropas; Gebrüder Borntraeger: Berlin, Germany, 1978. [Google Scholar]
- Ejsmont-Karabin, J.; Karabin, A. The suitability of zooplankton as lake ecosystem indicator: Crustacean trophic state index. Pol. J. Ecol. 2013, 61, 561–573. [Google Scholar]
- Ejsmont-Karabin, J. The usefulness of zooplankton as lake ecosystem indicators: Rotifer trophic state index. Pol. J. Ecol. 2012, 60, 339–350. [Google Scholar]
- Carlson, R.E. A trophic state index for lakes. Limnol. Oceanogr. 1977, 22, 361–369. [Google Scholar] [CrossRef] [Scilit]
- Dufrêne, M.; Legendre, P. Species assemblages and indicator species: The need for a flexible asymmetrical approach. Ecol. Monogr. 1997, 67, 345–366. [Google Scholar] [CrossRef] [Scilit]
- Hammer, Ø.; Harper, D.A.T.; Ryan, P.D. PAST: Paleontological Statistics Software Package for Education and Data Analysis. Palaeontol. Electron. 2001, 4, 9. [Google Scholar]
- Ter Braak, C.J.F.; Šmilauer, P. CANOCO Reference Manual and CanoDraw for Windows User’s Guide: Software for Canonical Community Ordination (Version 4.5); Microcomputer Power: Ithaca, NY, USA, 2002. [Google Scholar]
- Ma, M.; Li, J.; Lu, A.; Zhu, P.; Yin, X. Effects of phytoplankton diversity on resource use efficiency in a eutrophic urban river of Northern China. Front. Environ. Sci. 2024, 12, 1389220. [Google Scholar] [CrossRef] [Scilit]
- Rocha, G.M.; Cagnin, R.C.; Rodrigues, S.K.; Lehrback, B.D.; Gramlich, K.C.; Neto, R.R.; Sá, F.; Féres, J.C.; Kandler, G.M.; Santos, R.C.; et al. Anthropogenic pressure drives phytoplankton and zooplankton biodiversity homogenization in tropical coastal lagoons of different conservation statuses. J. Plankton Res. 2026, 48, fbag031. [Google Scholar] [CrossRef] [Scilit]
- Chen, J.; Zheng, F.; Li, D.; Zhou, R.; Jv, W.; Leng, X.; Xia, L.; An, S. Zeta diversity reveals the small wetland complex promotes biodiversity. Water 2024, 16, 476. [Google Scholar] [CrossRef] [Scilit]
- Duré, G.A.V.; Nascimento, J.R.; Ramos, E.A.; Silva, A.C.S.; Silva, A.G.; Ribeiro, S.M.M.S.; Simões, N.R. Urban pollution promotes biotic simplification of the zooplankton community in ponds in northeastern Brazil. Freshw. Biol. 2025, 70, e70059. [Google Scholar] [CrossRef] [Scilit]
- Jeppesen, E.; Kronvang, B.; Meerhoff, M.; Søndergaard, M.; Hansen, K.M.; Andersen, H.E.; Lauridsen, T.L.; Liboriussen, L.; Beklioglu, M.; Özen, A.; et al. Climate change effects on runoff, catchment phosphorus loading and lake ecological state, and potential adaptations. J. Environ. Qual. 2009, 38, 1930–1941. [Google Scholar] [CrossRef] [Scilit] [PubMed]
- Wang, H.; Molinos, J.G.; Heino, J.; Zhang, H.; Zhang, P.; Xu, J. Eutrophication causes invertebrate biodiversity loss and decreases cross-taxon congruence across anthropogenically disturbed lakes. Environ. Int. 2021, 153, 106494. [Google Scholar] [CrossRef] [Scilit] [PubMed]
- Tian, W.; Zheng, H.; Wang, L.; Li, H.; Wang, X. Effects of river-lake interactions in water and sediment on phosphorus in Dongting Lake, China. Environ. Sci. Pollut. Res. 2017, 24, 23250–23260. [Google Scholar] [CrossRef] [Scilit] [PubMed]
- Kozak, A.; Kowalczewska-Madura, K. Phytoplankton community structure in small water bodies on the Cybina River. Botanika-Steciana 2009, 13, 133–136. [Google Scholar]
- Padisák, J.; Crossetti, L.O.; Naselli-Flores, L. Use and misuse in the application of the phytoplankton functional classification. Hydrobiologia 2009, 621, 1–19. [Google Scholar] [CrossRef] [Scilit]
- Tian, W.; Zhang, H.; Zhao, L.; Zhang, F.; Huang, H. Phytoplankton diversity effects on community biomass and stability along nutrient gradients in a eutrophic lake. Int. J. Environ. Res. Public Health 2017, 14, 95. [Google Scholar] [CrossRef] [Scilit] [PubMed]
- Wołowski, K.; Duangjan, K.; Dempster, T.; Tsarenko, P.; Poniewozik, M.; Koreiviene, J. Colour range of euglenoid (Euglenophyceae) blooms. Plant Fungal Syst. 2024, 69, 99–108. [Google Scholar] [CrossRef] [Scilit]
- Poniewozik, M.; Juráň, J. Extremely high diversity of euglenophytes in a small pond in eastern Poland. Plant Ecol. Evol. 2018, 151, 18–34. [Google Scholar] [CrossRef] [Scilit]
- Smith, V.H. Eutrophication of freshwater and coastal marine ecosystems: A global problem. Environ. Sci. Pollut. Res. 2003, 10, 126–139. [Google Scholar] [CrossRef] [Scilit] [PubMed]
- Dodson, S.I.; Arnott, S.E.; Cottingham, K.L. The relationship in lake communities between primary productivity and species richness. Ecology 2000, 81, 2662–2679. [Google Scholar] [CrossRef] [Scilit] [PubMed]
- Oh, H.J.; Jeong, H.G.; Nam, G.S.; Oda, Y.; Dai, W.; Lee, E.H.; Kong, D.; Hwang, S.J.; Chang, K.H. Comparison of taxon-based and trophic-based response patterns of rotifer community to water quality: Applicability of the rotifer functional group as an indicator of water quality. Anim. Cells Syst. 2017, 21, 133–140. [Google Scholar] [CrossRef] [Scilit] [PubMed]
- Kuczyńska-Kippen, N.; Zhang, C.; Mleczek, M.; Špoljar, M. Rotifers as indicators of trophic state in small water bodies with different catchments (field vs. forest). Hydrobiologia 2025, 852, 2669–2685. [Google Scholar] [CrossRef] [Scilit]
- Wang, B.; Yin, X. Homogenization of functional diversity of rotifer communities in relation to eutrophication in an urban river of North China. Biology 2023, 12, 1488. [Google Scholar] [CrossRef] [Scilit] [PubMed]
- Napiórkowska-Krzebietke, A.; Pasztaleniec, A.; Hutorowicz, A. Phytoplankton metrics response to increasing phosphorus and nitrogen gradient in shallow lakes. J. Elem. 2012, 17, 289–303. [Google Scholar]
- Wołowski, K.; Hindák, F. Atlas of Euglenophytes. In VEDA; Publishing House of the Slovak Academy of Sciences: Bratislava, Slovakia, 2005. [Google Scholar]
- Kolada, A. Charophyte variation in sensitivity to eutrophication affects their potential for the trophic and ecological status indication. Knowl. Manag. Aquat. Ecosyst. 2021, 422, 30. [Google Scholar] [CrossRef] [Scilit]
- Schubert, H.; Blindow, I.; Bueno, N.C.; Casanova, M.T.; Pełechaty, M.; Pukacz, A. Ecology of charophytes: Permanent pioneers and ecosystem engineers. Perspect. Phycol. 2018, 5, 61–74. [Google Scholar] [CrossRef] [Scilit]
- Rosińska, J.; Rybak, M.S.; Kowalczewska-Madura, K.; Dondajewska-Pielka, R.; Kozak, A.; Gołdyn, R. Spatio-temporal variations in water quality of a river-lake system during restoration treatments. Environ. Monit. Assess. 2022, 194, 636. [Google Scholar] [CrossRef] [Scilit] [PubMed]
- Dos Santos, N.G.; Chiarelli, L.J.; Morari, P.H.R.; Souza, M.E.T.; Calixto, G.; Kato, B.E.D.; Rodrigues, G.L.D.P.; Figueira, L.C.; Castilho-Noll, M.S.M. How land use affects freshwater zooplankton communities: A global overview. Hydrobiologia 2025, 852, 2555–2580. [Google Scholar] [CrossRef] [Scilit]
- Kozak, A.; Rosińska, J.; Gołdyn, R. Changes in the phytoplankton structure due to prematurely limited restoration treatments. Pol. J. Environ. Stud. 2018, 27, 1097–1103. [Google Scholar] [CrossRef] [Scilit] [PubMed]
- Nicolle, A.; Hansson, L.-A.; Brodersen, J.; Nilsson, P.A.; Brönmark, C. Interactions between predation and resources shape zooplankton population dynamics. PLoS ONE 2011, 6, e16534. [Google Scholar] [CrossRef] [Scilit] [PubMed]
- Heino, J. Are indicator groups and cross-taxon congruence useful for predicting biodiversity in aquatic ecosystems? Ecol. Indic. 2010, 10, 112–117. [Google Scholar] [CrossRef] [Scilit]
- Teittinen, A.; Muukkonen, P.; Soininen, J. Cross-taxon congruence and factors associated with phytoplankton and zooplankton biodiversity in boreal lakes. Freshw. Biol. 2025, 70, e70057. [Google Scholar] [CrossRef] [Scilit]
- Behrenfeld, M.J.; Boss, E.S.; Halsey, K.H. Phytoplankton community structuring and succession in a competition-neutral resource landscape. ISME Commun. 2021, 1, 12. [Google Scholar] [CrossRef] [Scilit] [PubMed]
- Choi, Y.; Oh, H.-J.; Hong, G.-H.; Lee, D.-H.; Kim, J.-H.; Park, S.-H.; Yun, J.-H.; Chang, K.-H. Zooplankton community responses to eutrophication and TOC: Network clustering in regionally similar reservoirs. Water 2025, 17, 2051. [Google Scholar] [CrossRef] [Scilit]
- Mäemets, A. Rotifers as indicators of lake types in Estonia. Hydrobiologia 1983, 104, 357–361. [Google Scholar] [CrossRef] [Scilit]
- Kuczyńska-Kippen, N.; Basińska, A. Habitat as the most important influencing factor for the rotifer community structure at landscape level. Int. Rev. Hydrobiol. 2014, 99, 58–64. [Google Scholar] [CrossRef] [Scilit]
- Florescu, L.I.; Moldoveanu, M.M.; Dumitrache, C.A.; Catana, R.D. Zooplankton indicators of ecological functioning along an urbanisation gradient. Diversity 2026, 18, 58. [Google Scholar] [CrossRef] [Scilit]

Disclaimer/Publisher’s Note: The statements, opinions and data contained in all publications are solely those of the individual author(s) and contributor(s) and not of MDPI and/or the editor(s). MDPI and/or the editor(s) disclaim responsibility for any injury to people or property resulting from any ideas, methods, instructions or products referred to in the content. |
© 2026 by the authors. Licensee MDPI, Basel, Switzerland. This article is an open access article distributed under the terms and conditions of the Creative Commons Attribution (CC BY) license.