


Abstract
Glycyrrhiza uralensis Fisch. is a valuable perennial medicinal legume with multiple pharmacological activities. G. uralensis from the Ordos Plateau is widely recognized for its high quality, with flavonoids serving as its primary bioactive components. However, substantial variation exists among cultivated populations in terms of quality, which limit the sustainable utilization of this medicinal plant. In this study, root tissues, rhizosphere soil, and bulk soil samples were collected from three wild (W1–W3) and two cultivated (C1–C2) populations of G. uralensis across the Ordos Plateau. Flavonoid metabolomics and fungal community analyses were integrated to investigate the relationship between rhizosphere fungi and flavonoid accumulation. The results showed that the cultivated C1 group exhibited higher liquiritin content and greater rhizosphere fungal diversity, suggesting that wild origin does not necessarily guarantee higher medicinal quality in G. uralensis. Thirteen differentially abundant fungal genera were significantly associated with flavonoid accumulation. Correlation analysis identified genus-specific associations between Alfaria, Alternaria, Botryotrichum, Fusarium, and Pseudogymnoascus and metabolites involved in the liquiritin biosynthetic pathway. These results revealed associations between the relative abundances of selected rhizosphere fungal genera and the contents of specific flavonoid metabolites in G. uralensis, and identified key fungal communities. This study provides candidate fungal taxa and testable hypotheses for future studies on the associations between rhizosphere fungi and flavonoid metabolism in G. uralensis.
1. Introduction
Medicinal plants are an important source of bioactive natural products, and their therapeutic properties are largely attributable to structurally diverse secondary metabolites [1]. Among them, Glycyrrhiza uralensis Fisch. (G. uralensis) is widely recognized in both traditional and modern pharmacopoeias for its abundant flavonoids and triterpene saponins. Although the biosynthetic pathways of these metabolites have been extensively elucidated, their accumulation is strongly influenced by environmental conditions, developmental stage, and cultivation practices [2]. These findings indicated that accumulation of metabolites in plants is jointly regulated by genetic factors and environmental influences.
In China, the Ordos Plateau is one of the primary production regions for G. uralensis. Located between the Sandy Plateau and the Loess Plateau, this region is characterized by complex topography, abundant sunshine, strong solar radiation, high accumulated temperatures, and large diurnal temperature fluctuations. The loose sandy soil and calcium-rich environment have likely promoted the adaptation of local G. uralensis populations, resulting in strong tolerance to drought, wind erosion, temperature extremes, and saline-alkaline stress. The local G. uralensis possess excellent qualities, including distinctive red periderm, elevated starch and glycyrrhizin contents, smooth transverse section, high trace mineral abundance, and significant medicinal value. G. uralensis from this region is widely exported, owing to its high value.
In recent years, the demand for G. uralensis has continued to increase, whereas wild resources have declined because of long-term overharvesting and are now listed as nationally protected wild plants. Consequently, cultivation has become the primary strategy for ensuring a sustainable supply. However, differences in geographic origin, cultivation management, and environmental conditions result in considerable variation in the quality of cultivated G. uralensis. These differences lead to inconsistent accumulation of bioactive constituents and considerable variation in product quality, creating a major challenge to quality standardization and sustainable industrial development of G. uralensis.
The microbial community has been regarded as a functional extension of the host genome [3,4,5]. Among different microbial habitats, the rhizosphere microbiome plays a vital role in nutrient acquisition, stress adaptation, and immune adaptation [5,6]. In a wide range of medicinal plants and crops, rhizosphere-enriched microbial taxa are significantly associated with the accumulation of flavonoids and terpenoids [7]. At the mechanistic level, microbial communities synthesize and supply a various of metabolic precursors and cofactors, thereby regulating the host biosynthetic pathways [8]. Second, microorganisms produce signaling molecules, including phytohormones and quorum-sensing molecules, which can reprogram the host’s transcriptional regulatory network [9]. Furthermore, microbial colonization and establishment in plant roots can alter the expression of key biosynthetic enzymes, such as cytochrome P450 monooxygenases and chalcone synthases, thereby affecting the biosynthesis and accumulation of secondary metabolites [10].
In crop research, omics studies have revealed significant synergistic response patterns between microbial community structure and the synthesis and accumulation of plant metabolites under different environmental conditions [11,12]. By comparison, studies applying multi omics approaches to medicinal plants remain relatively limited [4,13,14]. In the G. uralensis research system, key functional genes involved in flavonoids and triterpenoid biosynthesis have been identified and functionally characterized [15]. However, the contribution of the rhizosphere microbiome to the regulation of these metabolic pathways remains poorly understood. Whether specific microbial taxa and functional communities actively mediate metabolic reprogramming in G. uralensis also remains unclear. Elucidating this issue will not only help explain the ecological mechanisms and evolutionary patterns underlying the formation of bioactive metabolites in medicinal plants but also provide a theoretical basis for the subsequent development of microbiome-based strategies to improve the quality of medicinal materials [4,6].
As the core production region for authentic Chinese G. uralensis, the Ordos Plateau is one of the major production regions of high quality G. uralensis in China. Its distinctive environmental conditions contribute to the strong stress tolerance and desirable medicinal characteristics of local populations. The rhizosphere microbial community serves as a key link connecting environmental conditions, plant physiology, and secondary metabolism. In this study, wild and cultivated G. uralensis from the Ordos Plateau were compared by integrating flavonoid metabolomics with rhizosphere fungal community analyses. The study aimed to identify fungal taxa associated with the accumulation of liquiritin and its biosynthetic intermediates. These findings provided new insights into improving cultivation quality of G. uralensis. They laid theoretical foundations for the targeted cultivation improvement and sustainable utilization.
2. Materials and Methods
2.1. Plant and Soil Materials
The roots of wild (W1, W2 and W3) and cultivated (C1 and C2) G. uralensis were collected in April 2025 from the heart of the Kubuqi Desert (40.72 N 108.31 E) and Jangui village (40.78 N 108.32 E) in Hangjin Banner, Ordos, Inner Mongolia Autonomous Region, China, respectively. All samples were identified as G. uralensis Fisch. by Yun Sheng, a cultivation specialist at Inner Mongolia Saiwai Shuomo Chinese Herbal Medicine Co., Ltd. (Inner Mongolia, China). The W1, W2, and W3 G. uralensis grew naturally at three distinct locations within the central Kubuqi Desert. Since wild G. uralensis is not managed under cultivation, the exact age of individual plants could not be determined. Based on field evaluations conducted by medicinal plant specialists and experienced local growers, the wild G. uralensis in this study were estimated to be approximately 3–5 years old. The cultivated C1 and C2 G. uralensis had been grown for three years in two separate fields in Jangui Village. A total of 15 G. uralensis were included in this study. Rhizosphere soil was carefully collected with sterile brushes for microbial sequencing. Each root sample was divided into two portions. One portion was immediately frozen in liquid nitrogen and stored at −80 °C for total metabolite extraction. The remaining portion was immediately transferred to new sterile bags and stored at −80 °C. In addition, the bulk soil of each root pit was also collected in sterile centrifuge tubes for microbial analysis. The elevation of each sampling site was recorded during field sampling (Table 1).
Table 1.
Sample Collection Information.
2.2. Metabolite Measurements
Total metabolites were extracted from fresh roots. Metabolic profiling was carried out with a Vanquish Core ultra-high-performance liquid chromatography system interfaced with a Q Exactive HF-X MS Orbitrap mass spectrometer (Thermo Fisher Scientific, Waltham, MA, USA) [16]. Target metabolites were chromatographically separated using a CSH C18 column (50 mm × 2.1 mm; 1.7 µm, Waters Corporation, Milford, MA, USA). During chromatographic analysis, the column and autosampler were kept at 40 °C and 15 °C, respectively, and a 1 μL aliquot of each sample was injected [16]. The mobile phase consisted of a 10 mM ammonium acetate (BioXtra grade; Sigma-Aldrich, St. Louis, MO, USA) aqueous solution as solvent A, and acetonitrile (HPLC grade; Merck KGaA, Darmstadt, Germany) as solvent B. The mobile phase was delivered at 0.4 mL/min. The gradient elution program was as follows: 0–8 min 10–50% B, 8–9 min 50–80% B, 9–11 min 80–95% B, 11–12 min 95–95% B, 12–12.01 min 95–10% B, 12.01–14 min 10–10% B [17]. The ion source was operated with a spray voltage of 3200 V, a capillary temperature of 320 °C, a sheath gas flow rate of 30 arb, an auxiliary gas flow rate of 10 arb, and an auxiliary gas heater temperature of 400 °C [17]. Data acquisition and processing were performed using Thermo Xcalibur Qual Browser software [17]. Flavonoid metabolites were quantified by comparing the peak areas of metabolites with the corresponding calibration curves.
2.3. Metabolomic Data Analysis
Metabolite data with more than 50% missing values within any group or across all groups were excluded. A total of 127 flavonoid metabolites were retained. The remaining data were subjected to logarithmic (LOG) transformation and centering (CTR) formatting using SIMCA software (V18.0.1, Sartorius Stedim Data Analytics AB, Umea, Sweden) for subsequent principal component analysis (PCA). Differential metabolites were identified using univariate analysis (UVA) and analysis of variance (ANOVA) based on p values. Euclidean distance matrices were calculated based on the quantitative values of differential metabolites to perform clustering of differential metabolites using the fully linked method, and the results were visualized as heatmaps. The significance of metabolite abundance among groups was further presented using box plots. The DAMs were annotated using the KEGG Pathway database. Pathway enrichment analysis was subsequently performed by calculating the Rich Factor and Fisher exact test p values, and the results were presented as KEGG enrichment plots for the differentially expressed metabolites.
2.4. Acquisition of Microbial Resources and ITS rRNA Sequencing
Rhizosphere microbial samples were collected by removing loosely attached soil from the root surface, gently shaking the roots to eliminate residual bulk soil, and then brushing the soil tightly adhering to the root surface with sterile brushes. These samples were regarded as the rhizosphere microbial samples. Microbial DNA extraction from rhizosphere and bulk soil samples was performed using the TIANamp Soil DNA Kit (TIANGEN BIOTECH (BEIJING) CO., LTD., Bejing, China) in accordance with the manufacturer’s instructions. Ten nanograms of DNA from each sample were used for the ITS1 region of the rRNA operon amplicon sequencing with the primer pair ‘ITS1F: CTTGGTCATTTAGAGGAAGTAA’ and ‘ITS2: GCTGCGTTCTTCATCGATGC’ [18]. After quantitative validation using Qubit and qPCR, the library was sequenced on the Illumina MiSeq platform (Illumina, Inc., San Diego, CA, USA). Ultimately, the ITS1 region of the rRNA operon was completed for 15 rhizosphere samples and 15 soil samples.
2.5. Microbiome Data Analysis
Sequencing data were assigned to individual samples according to barcode sequences and polymerase chain reaction primer sequences. After removal of bar code and primer sequences, paired end reads were assembled using FLASH (Version 1.2.11, http://ccb.jhu.edu/software/FLASH/) [19] to generate Raw Tags. Subsequently, the Cut Adapt software (Version 3.3) was employed to match the reverse primer sequences and excise the remaining sequences. The assembled Raw Tags were subjected to rigorous filtration using Fastp software (Version 0.23.1) to obtain high-quality Clean Tags [20,21]. After the aforementioned processing, the obtained Tags require treatment to remove chimeric sequences. Clean Tags sequences are compared with the species annotation database in the Unite database to detect chimeric sequences, and the chimeric sequences are ultimately removed to obtain the final Effective Tags [22]. For the obtained Effective Tags, noise reduction was performed using the DADA2 module in the QIIME2 software (Version 2025.4), yielding the final Amplicon Sequence Variants (ASVs) and the feature table [23,24]. After quality filtering, denoising, and chimera removal, the number of reads retained per sample ranged from 39,107 to 112,909. Species annotation was performed using QIIME2 software with the Unite (Version 9.0) database [25]. Microbial community diversity within individual samples was evaluated using α-diversity indices. The Chao1, Observed ASVs, and Pielou’s evenness index were calculated using QIIME2 software [26]. To minimize the effects of sequencing depth on alpha-diversity estimates, all samples were rarefied to the minimum sequencing depth of 39,107 reads per sample [27]. The β-diversity based on Bray–Curtis distance was also calculated using QIIME2 software. LEfSe was used to identify taxonomic biomarkers among groups. Taxa with abundances below 0.05% were removed prior to analysis. The Kruskal–Wallis test was set with a p-value < 0.05 as the significant threshold for identifying significant taxonomic biomarkers.
2.6. Correlation Analysis
Statistical analyses were carried out in R (Version 4.5.3). The correlations between variables was assessed using Spearman’s rank correlation analysis. Correlations with a p < 0.05 were considered statistically significant. Correlation analyses were performed using data from 15 individual plant samples (n = 15), without averaging the data at the population level. No adjustment for multiple comparisons was applied. Correlation heatmap and box-plot analyses were performed by the GenesCloud tools (https://www.genescloud.cn).
3. Results
3.1. Metabolic Profile Composition Analysis of G. uralensis
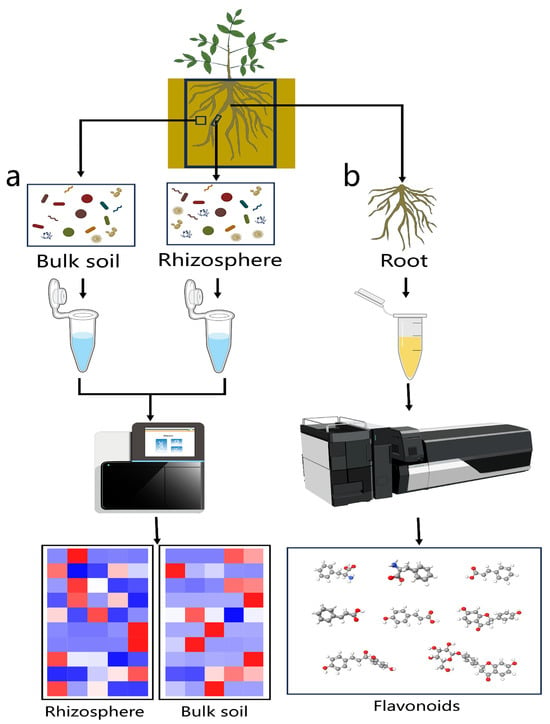
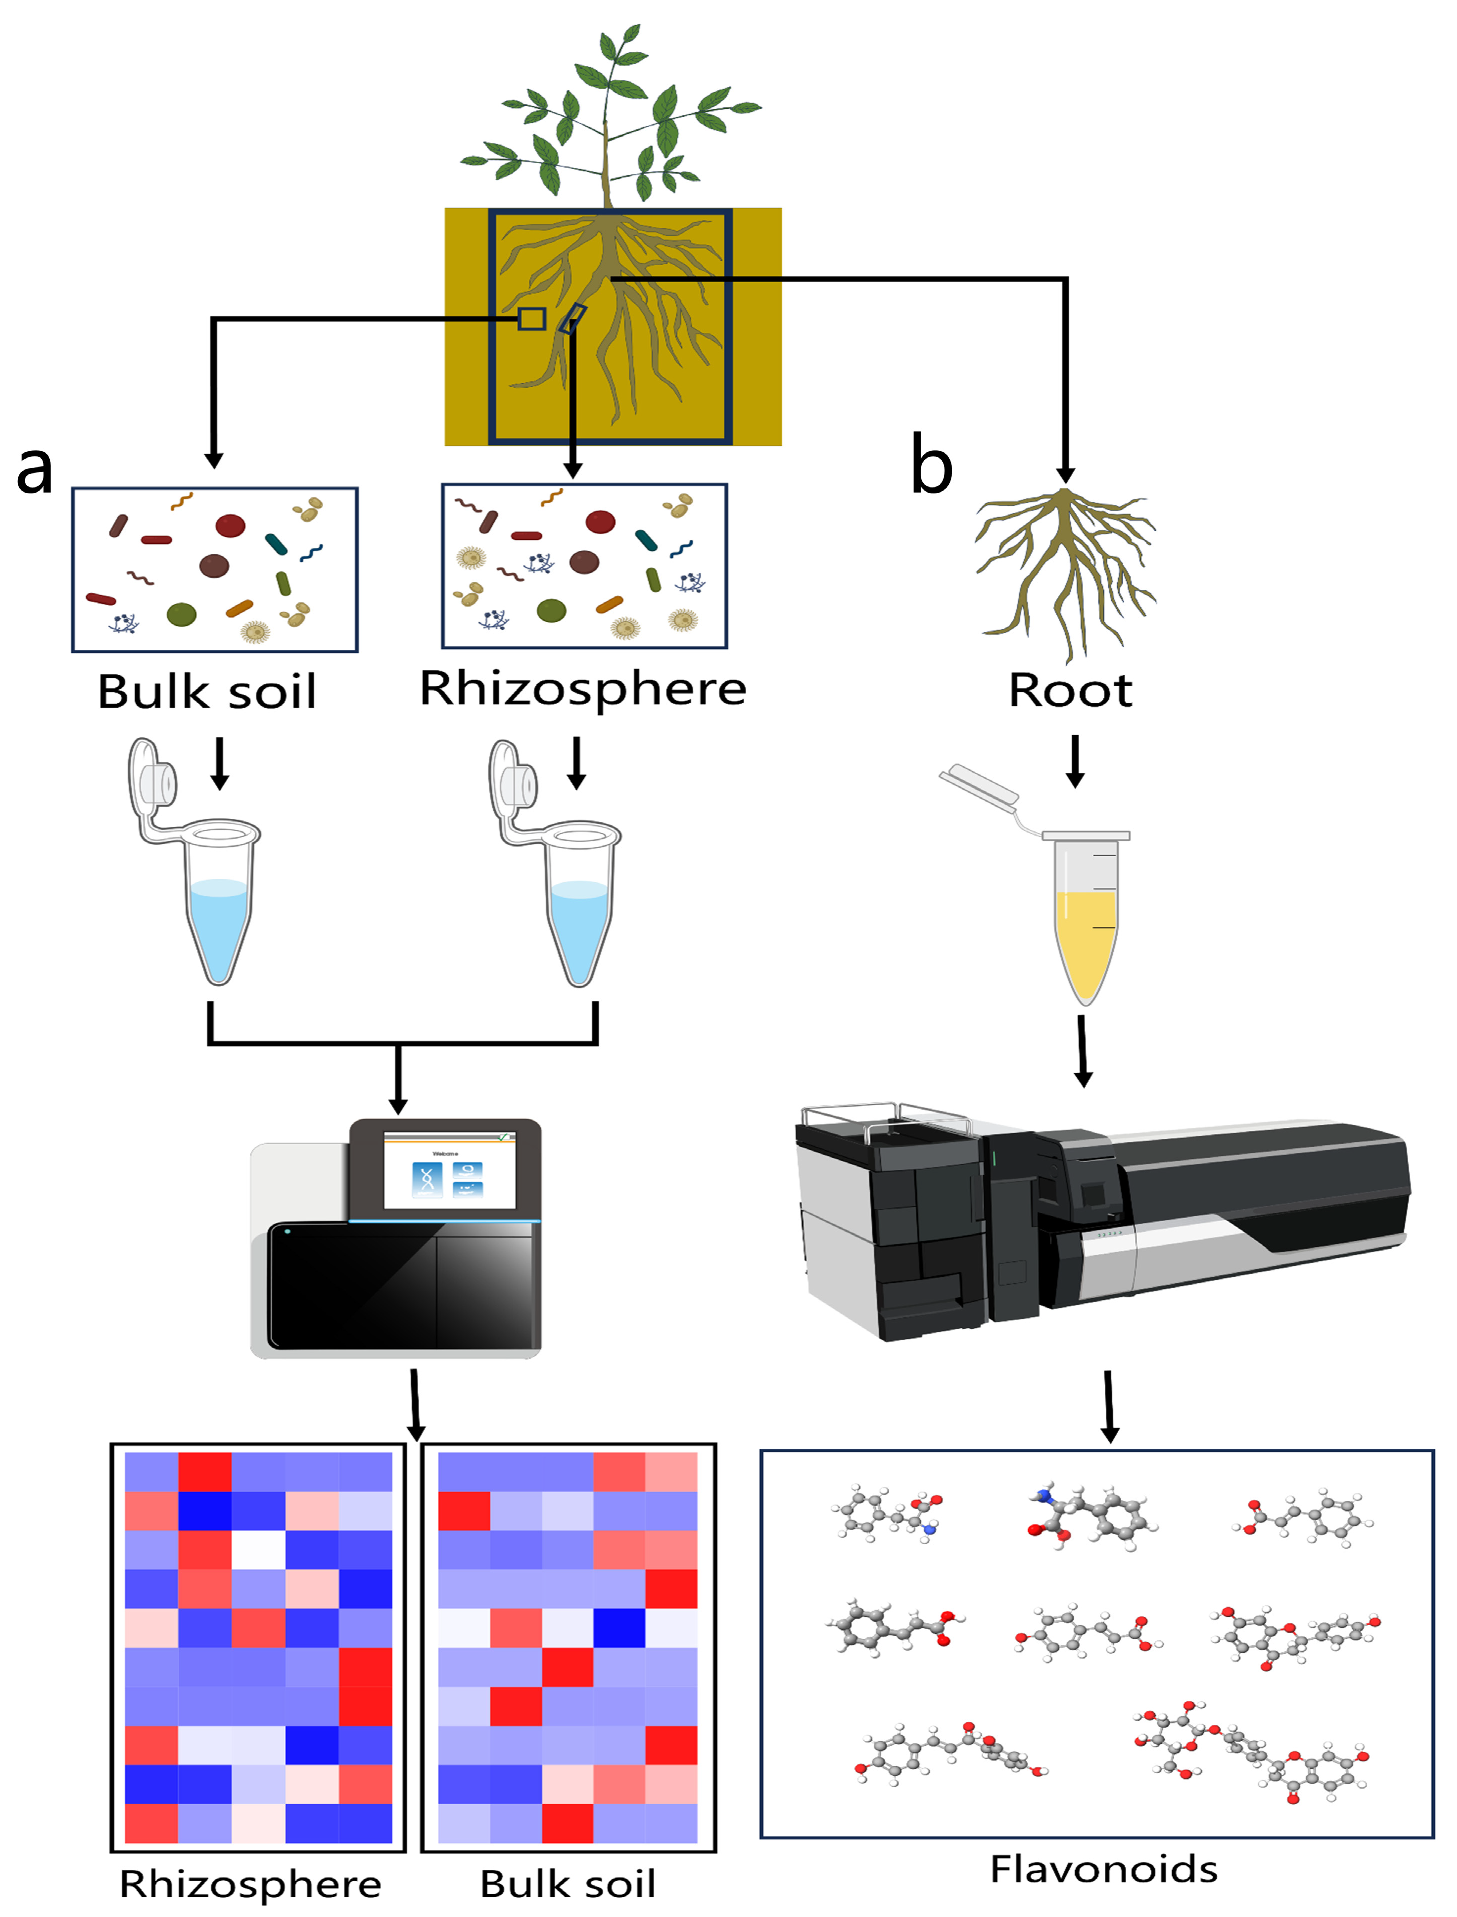
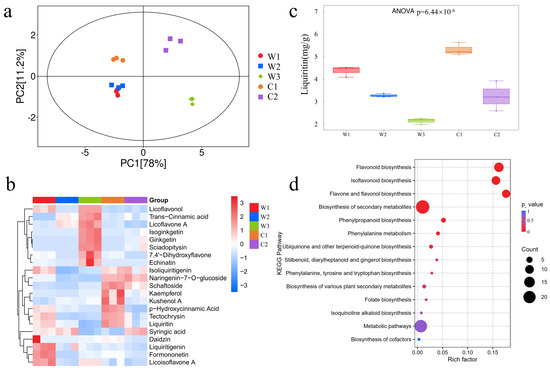
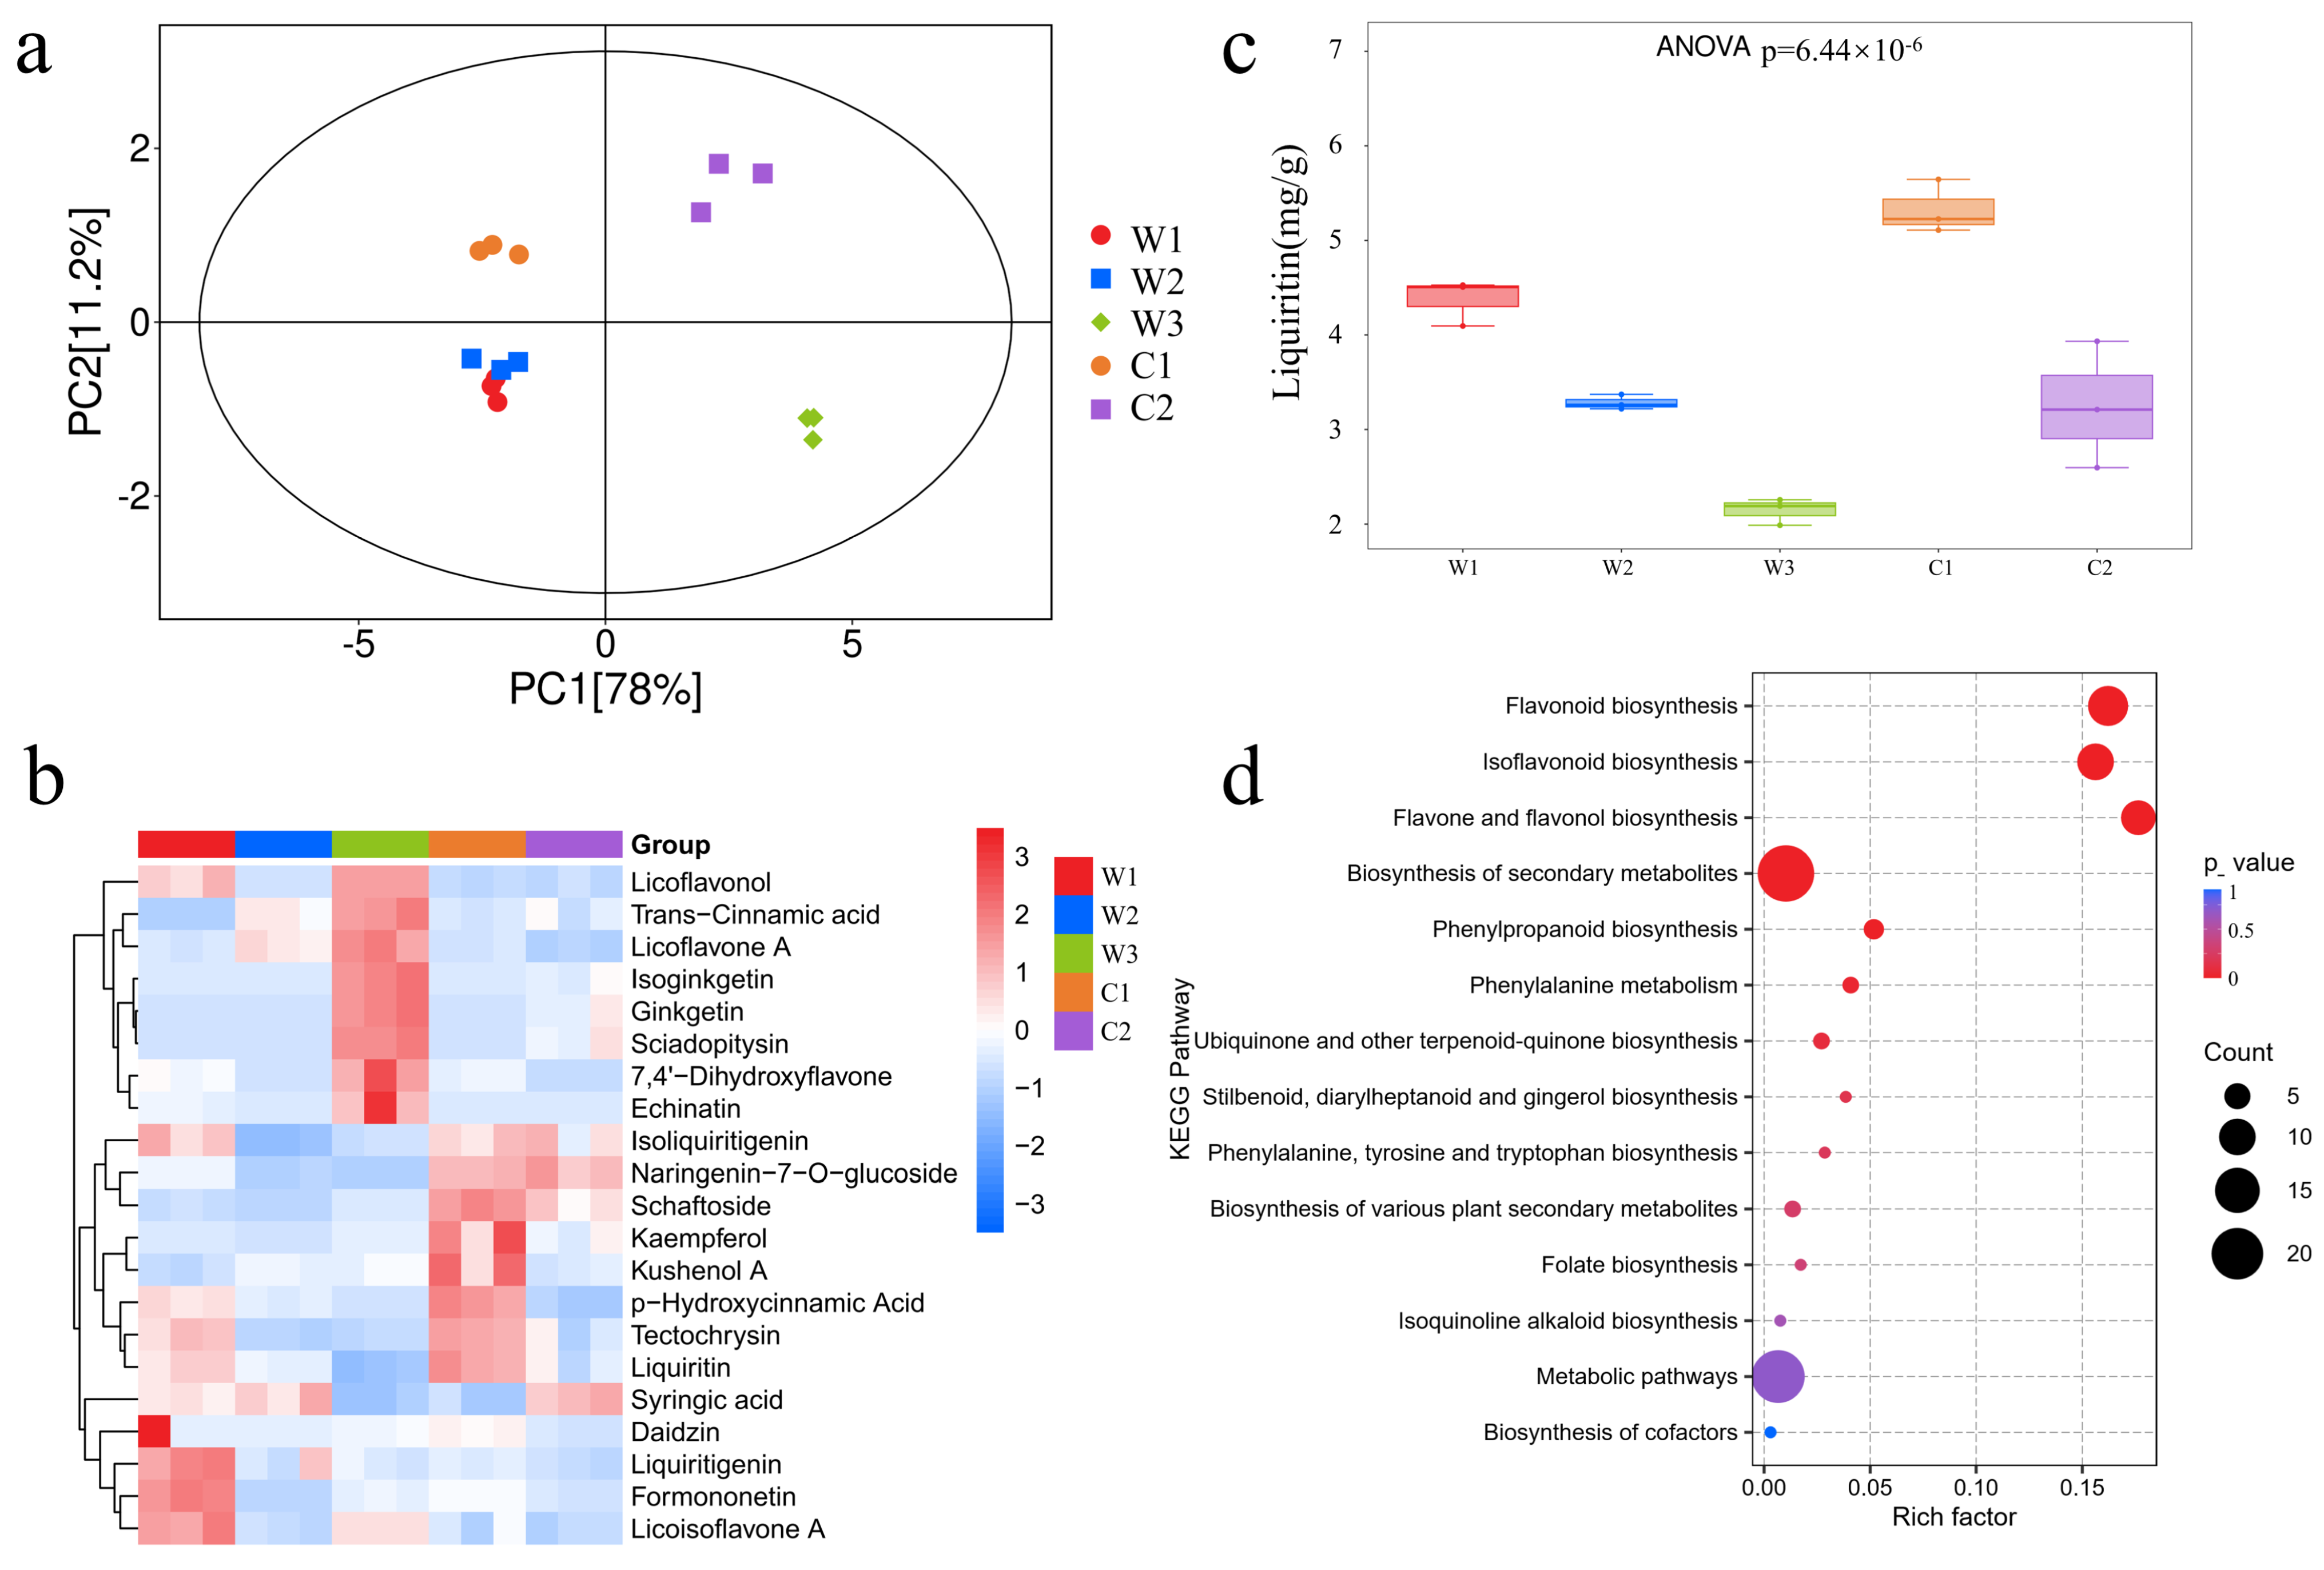
A total of 127 flavonoid metabolites were identified by LC-MS analysis (Figure 1b). Principal component analysis (PCA) of the metabolomic data showed that biological replicates clustered closely (Figure 2a), indicating good reproducibility and data reliability. The W1 and W2 groups, both representing wild-type G. uralensis, clustered closely together, whereas the other groups were clearly separated. The first principal component (PC1) accounted for 78% of the total variance. The C2 and W3 groups were distinctly separated along the PC1 axis, indicating substantial metabolic differences among the samples. Samples from the W1, W2, and C1 groups clustered on the left side of the plot with no clear separation, indicating relatively similar metabolic profiles along the PC1 axis. All wild G. uralensis samples clustered in the lower half of the plot along the PC2 axis, whereas the cultivated samples clustered in the upper half. This separation, which accounted for 11.2% of the total variance, suggested that PC2 may reflect metabolic differences associated with the two cultivation types, namely wild and cultivated.
Figure 1.
Analysis workflow. (a) Microbial ITS sequencing. (b) LC-MS/MS quantitative analysis of flavonoids.
Figure 2.
Metabolic profile characteristics among G. uralensis comparison groups. (a) shows the principal component analysis (PCA) plot of flavonoid metabolites. (b) shows the clustering heatmap of major DAMs. (c) shows a box-and-whisker plot comparing liquiritin accumulation among groups. (d) KEGG enrichment bubble plot of differential metabolites. (The x-axis is Rich Factor; the y-axis is pathway name. Bubble color represents p-value (red = high significance), and bubble size represents the number of differential metabolites).
To investigate metabolic variation among the G. uralensis samples, metabolomic profiles were compared across all groups, resulting in the identification of 119 differentially accumulated metabolites (p < 0.05). These metabolites included several major bioactive compounds, such as liquiritin, liquiritigenin, isoliquiritigenin, licoflavone A, and licoflavonol. Among them, liquiritin showed the highest concentration, ranging from 2.1–5.3 mg/g. The 21 differentially accumulated metabolites (DAMs), selected based on the greatest variation and highest concentrations, were subjected to further analysis (Table S1). The corresponding total ion chromatogram (TIC) profiles are provided in Figure S1. A clustering heatmap was generated to compare the accumulation patterns of these metabolites among the five groups (Figure 2b). Seven metabolites, including liquiritin and liquiritigenin, accumulated at higher levels in the W1 group. Eight metabolites, including licoflavone A and licoflavonol, showed higher accumulation in group W3. In addition, eight metabolites, including liquiritin and isoliquiritigenin, accumulated at higher levels in the C1 group. Liquiritin is a key contributor to the medicinal properties of G. uralensis [28]. In this study, the C1 group showed the highest liquiritin content among the five groups, followed by the W1 group, whereas the W3 group exhibited the lowest liquiritin accumulation (Figure 2c). As a cultivated G. uralensis, C1 displayed a higher liquiritin accumulation than the wild G. uralensis, indicating wild origin does not necessarily guarantee higher medicinal quality in G. uralensis.
To elucidate the biological functions associated with DAMs, KEGG pathway enrichment analysis was performed (Figure 2d). DAMs were significantly enriched in flavonoid biosynthesis, isoflavonoid biosynthesis, and flavonoid and flavanone biosynthesis pathways (p < 0.01). Enrichment of the isoflavonoid biosynthesis pathway was associated with the accumulation of characteristic bioactive compounds, such as isoliquiritigenin and liquiritin. Enrichment of the flavonol biosynthesis pathway may reflect physiological regulation associated with antioxidant activity or stress responses in the samples.
3.2. Ecological Niche Distribution Characteristics of G. uralensis Microbiome
ITS amplicon sequencing of rhizosphere and bulk soil samples was performed (Figure 1a), resulting in the identification of 8523 fungal amplicon sequence variants (ASVs).
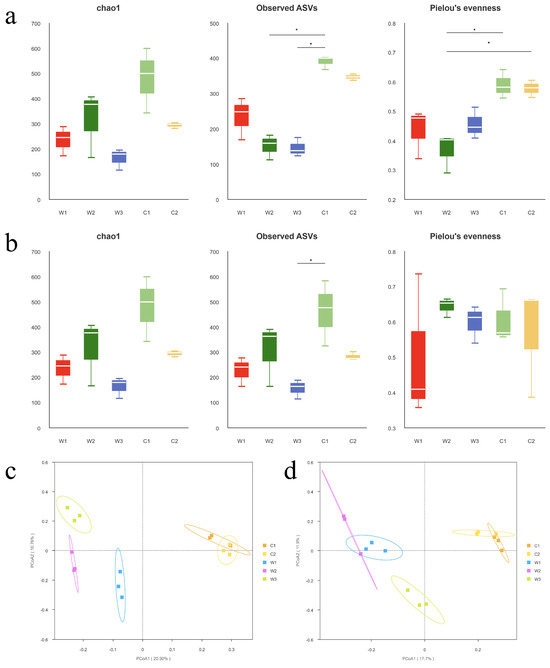
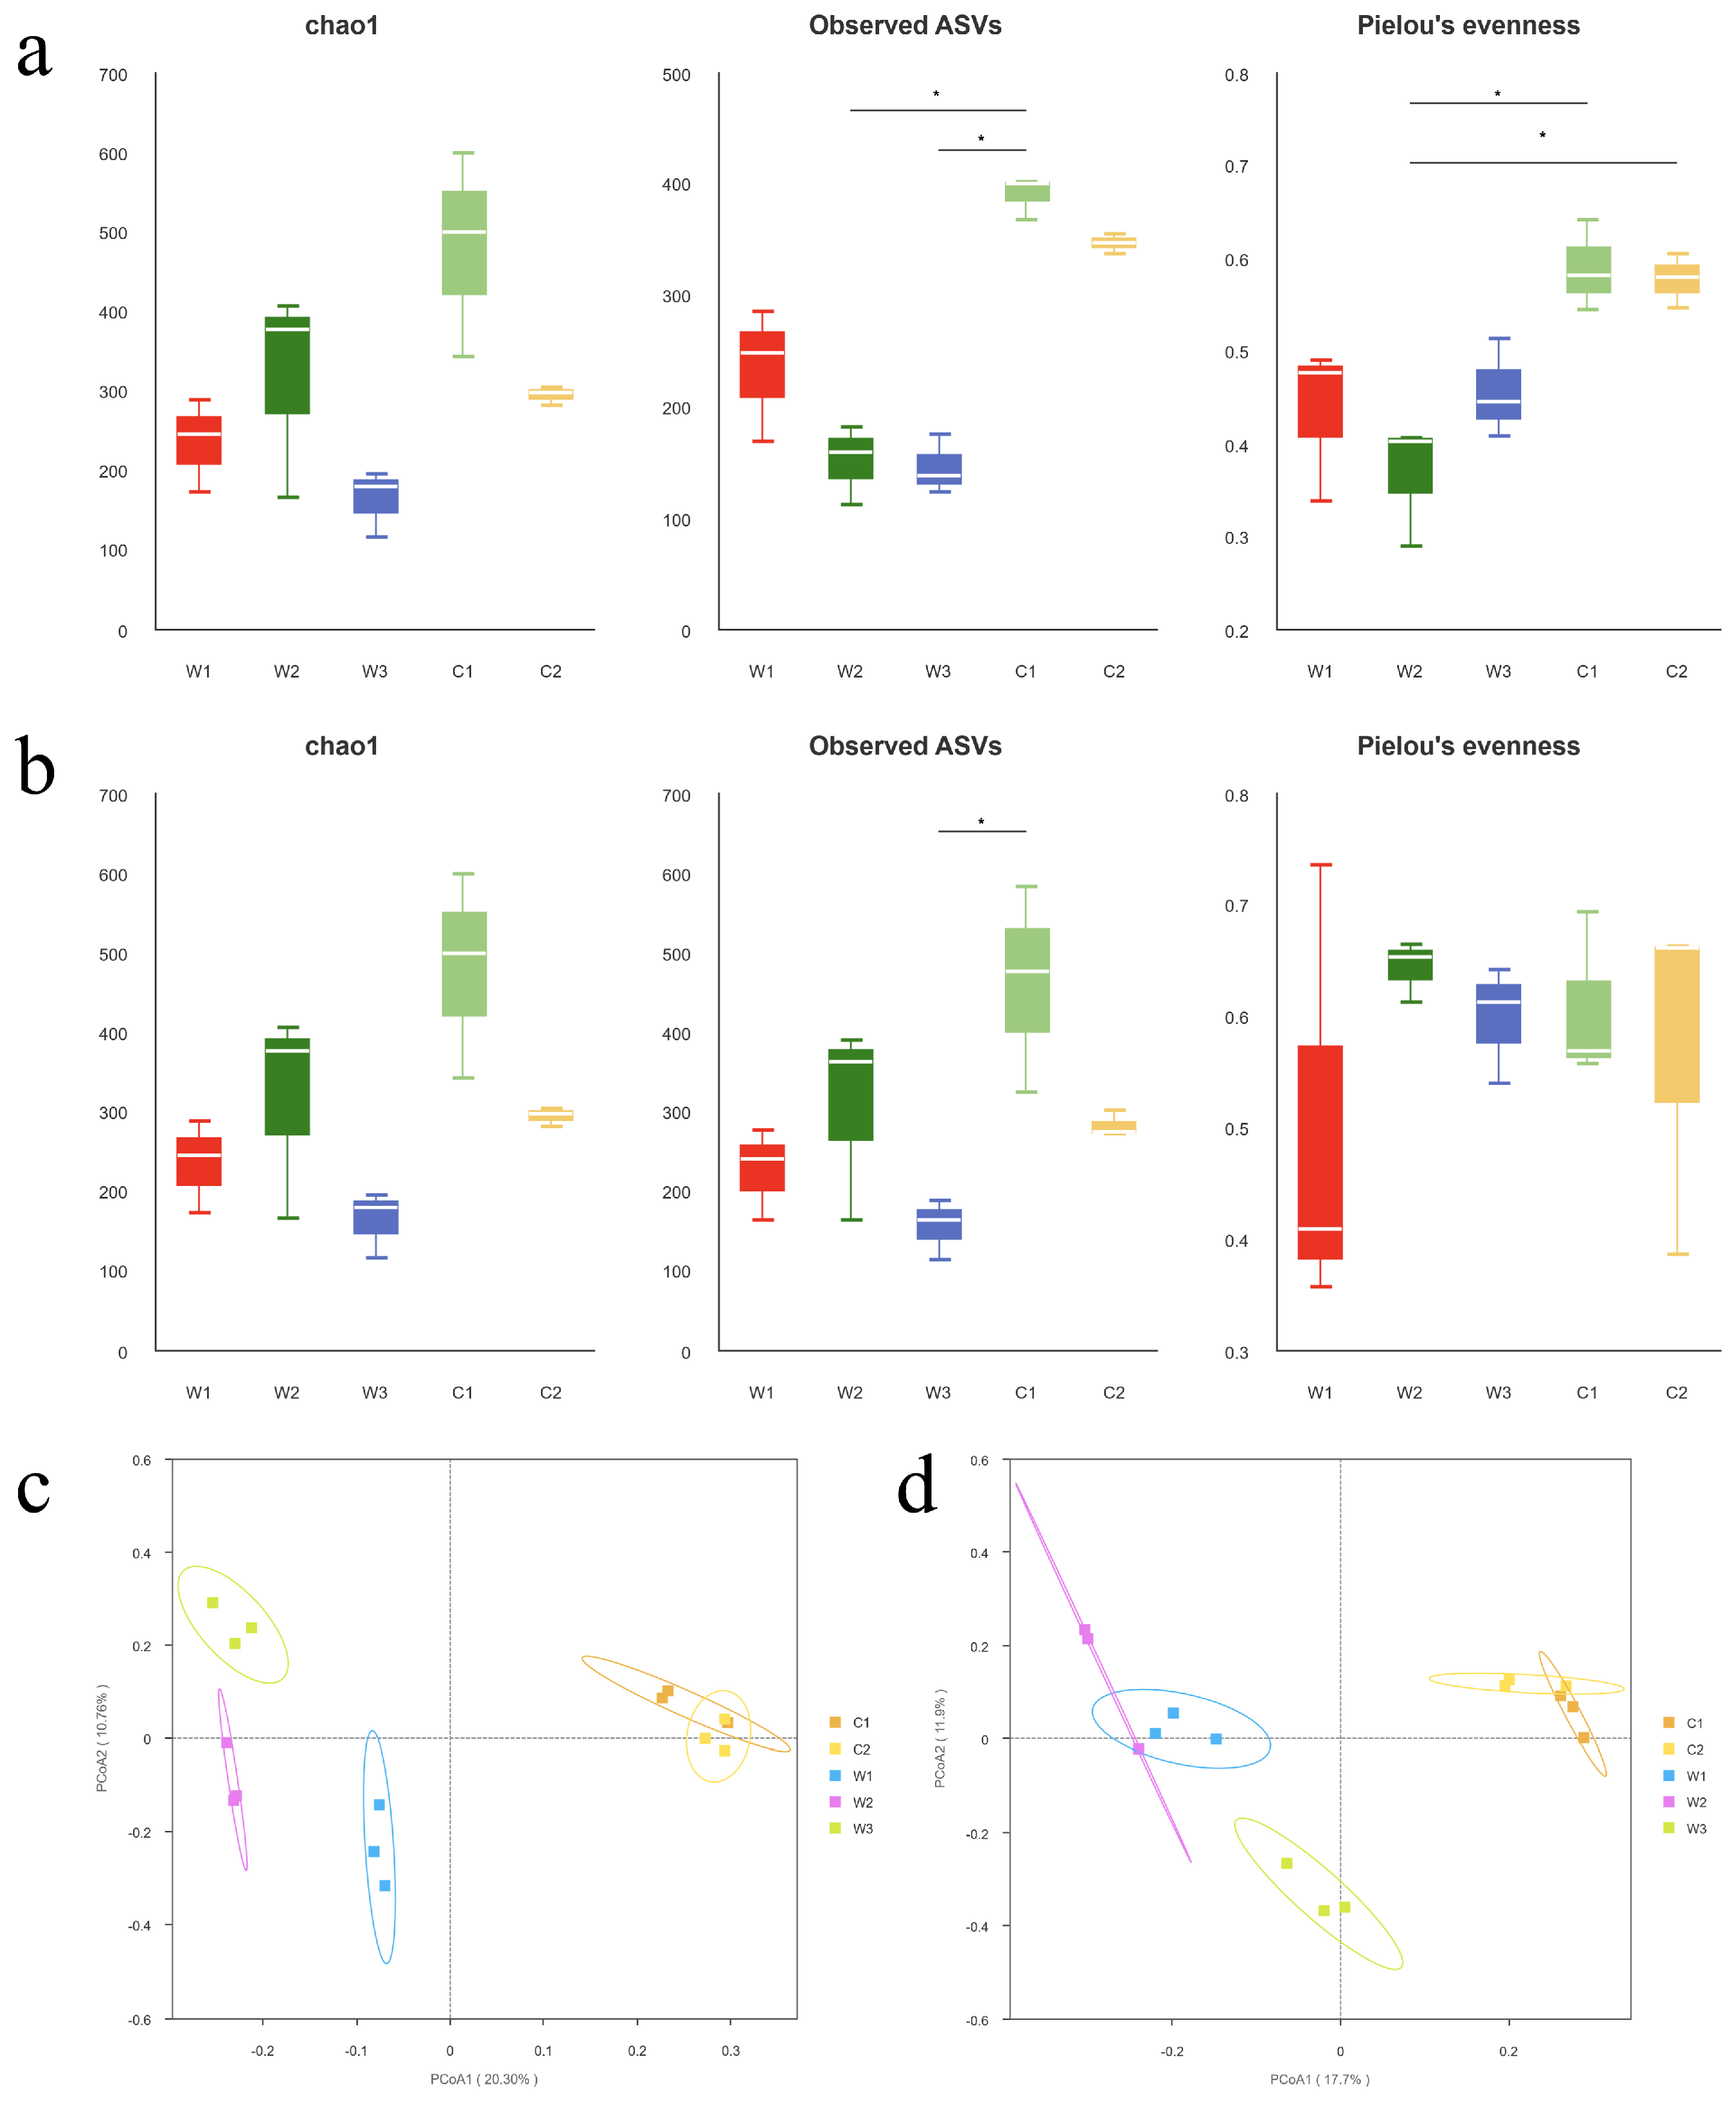
In the rhizosphere microenvironment (Figure 3a), the Chao-1 and Observed ASV indices were highest in the C1 group among all comparison groups and were significantly higher than those in the W2 and W3 groups (p < 0.05), indicating greater microbial richness in the C1 group. Concurrently, the C1 group also exhibited the highest Pielou’s evenness index, indicating a more even distribution of fungal taxa and a more balanced community structure. Overall, the α-diversity indices were higher in cultivated samples than those in wild samples. Examination of soil microbial communities (Figure 3b) revealed that the α-diversity indices of the rhizosphere fungal communities in the W2 group were lower than those in the bulk soil. The Chao1 index and Observed ASVs index of the rhizosphere and bulk soil fungal communities in group W3 remained largely unchanged. The α-diversity indices of both the rhizosphere and bulk soil fungal communities were high in the C1 group, indicating greater fungal richness and diversity.
Figure 3.
Visualization of microbial community differences across different ecological niches in G. uralensis. (a,b) show α-diversity metrics for rhizosphere and bulk soil fungal communities. (c,d) show PCoA results of β-diversity analysis based on Bray–Curtis distance for rhizosphere and bulk soil fungal communities.
β-diversity analysis based on Bray–Curtis dissimilarity was performed to evaluate the overall differences in fungal community composition among groups. Principal coordinate analysis (PCoA) revealed distinct clustering patterns of rhizosphere fungal communities among different groups, with the first two principal coordinates (PC1 and PC2) explaining 20.30% and 10.76% of the total variation, respectively (Figure 3c). PERMANOVA further confirmed significant differences in rhizosphere fungal community composition among groups (R2 = 0.45, p = 0.002). Similarly, PCoA based on Bray–Curtis distance demonstrated clear separation patterns of bulk soil fungal communities among groups, with PC1 and PC2 accounting for 17.70% and 11.90% of the total variation, respectively (Figure 3d). The PERMANOVA results indicated that bulk soil fungal community structures were significantly different among groups (R2 = 0.45, p = 0.001).
3.3. Screening for Key Microbial Communities
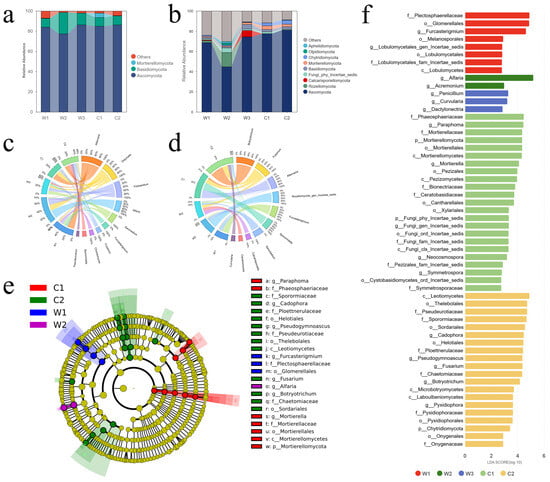
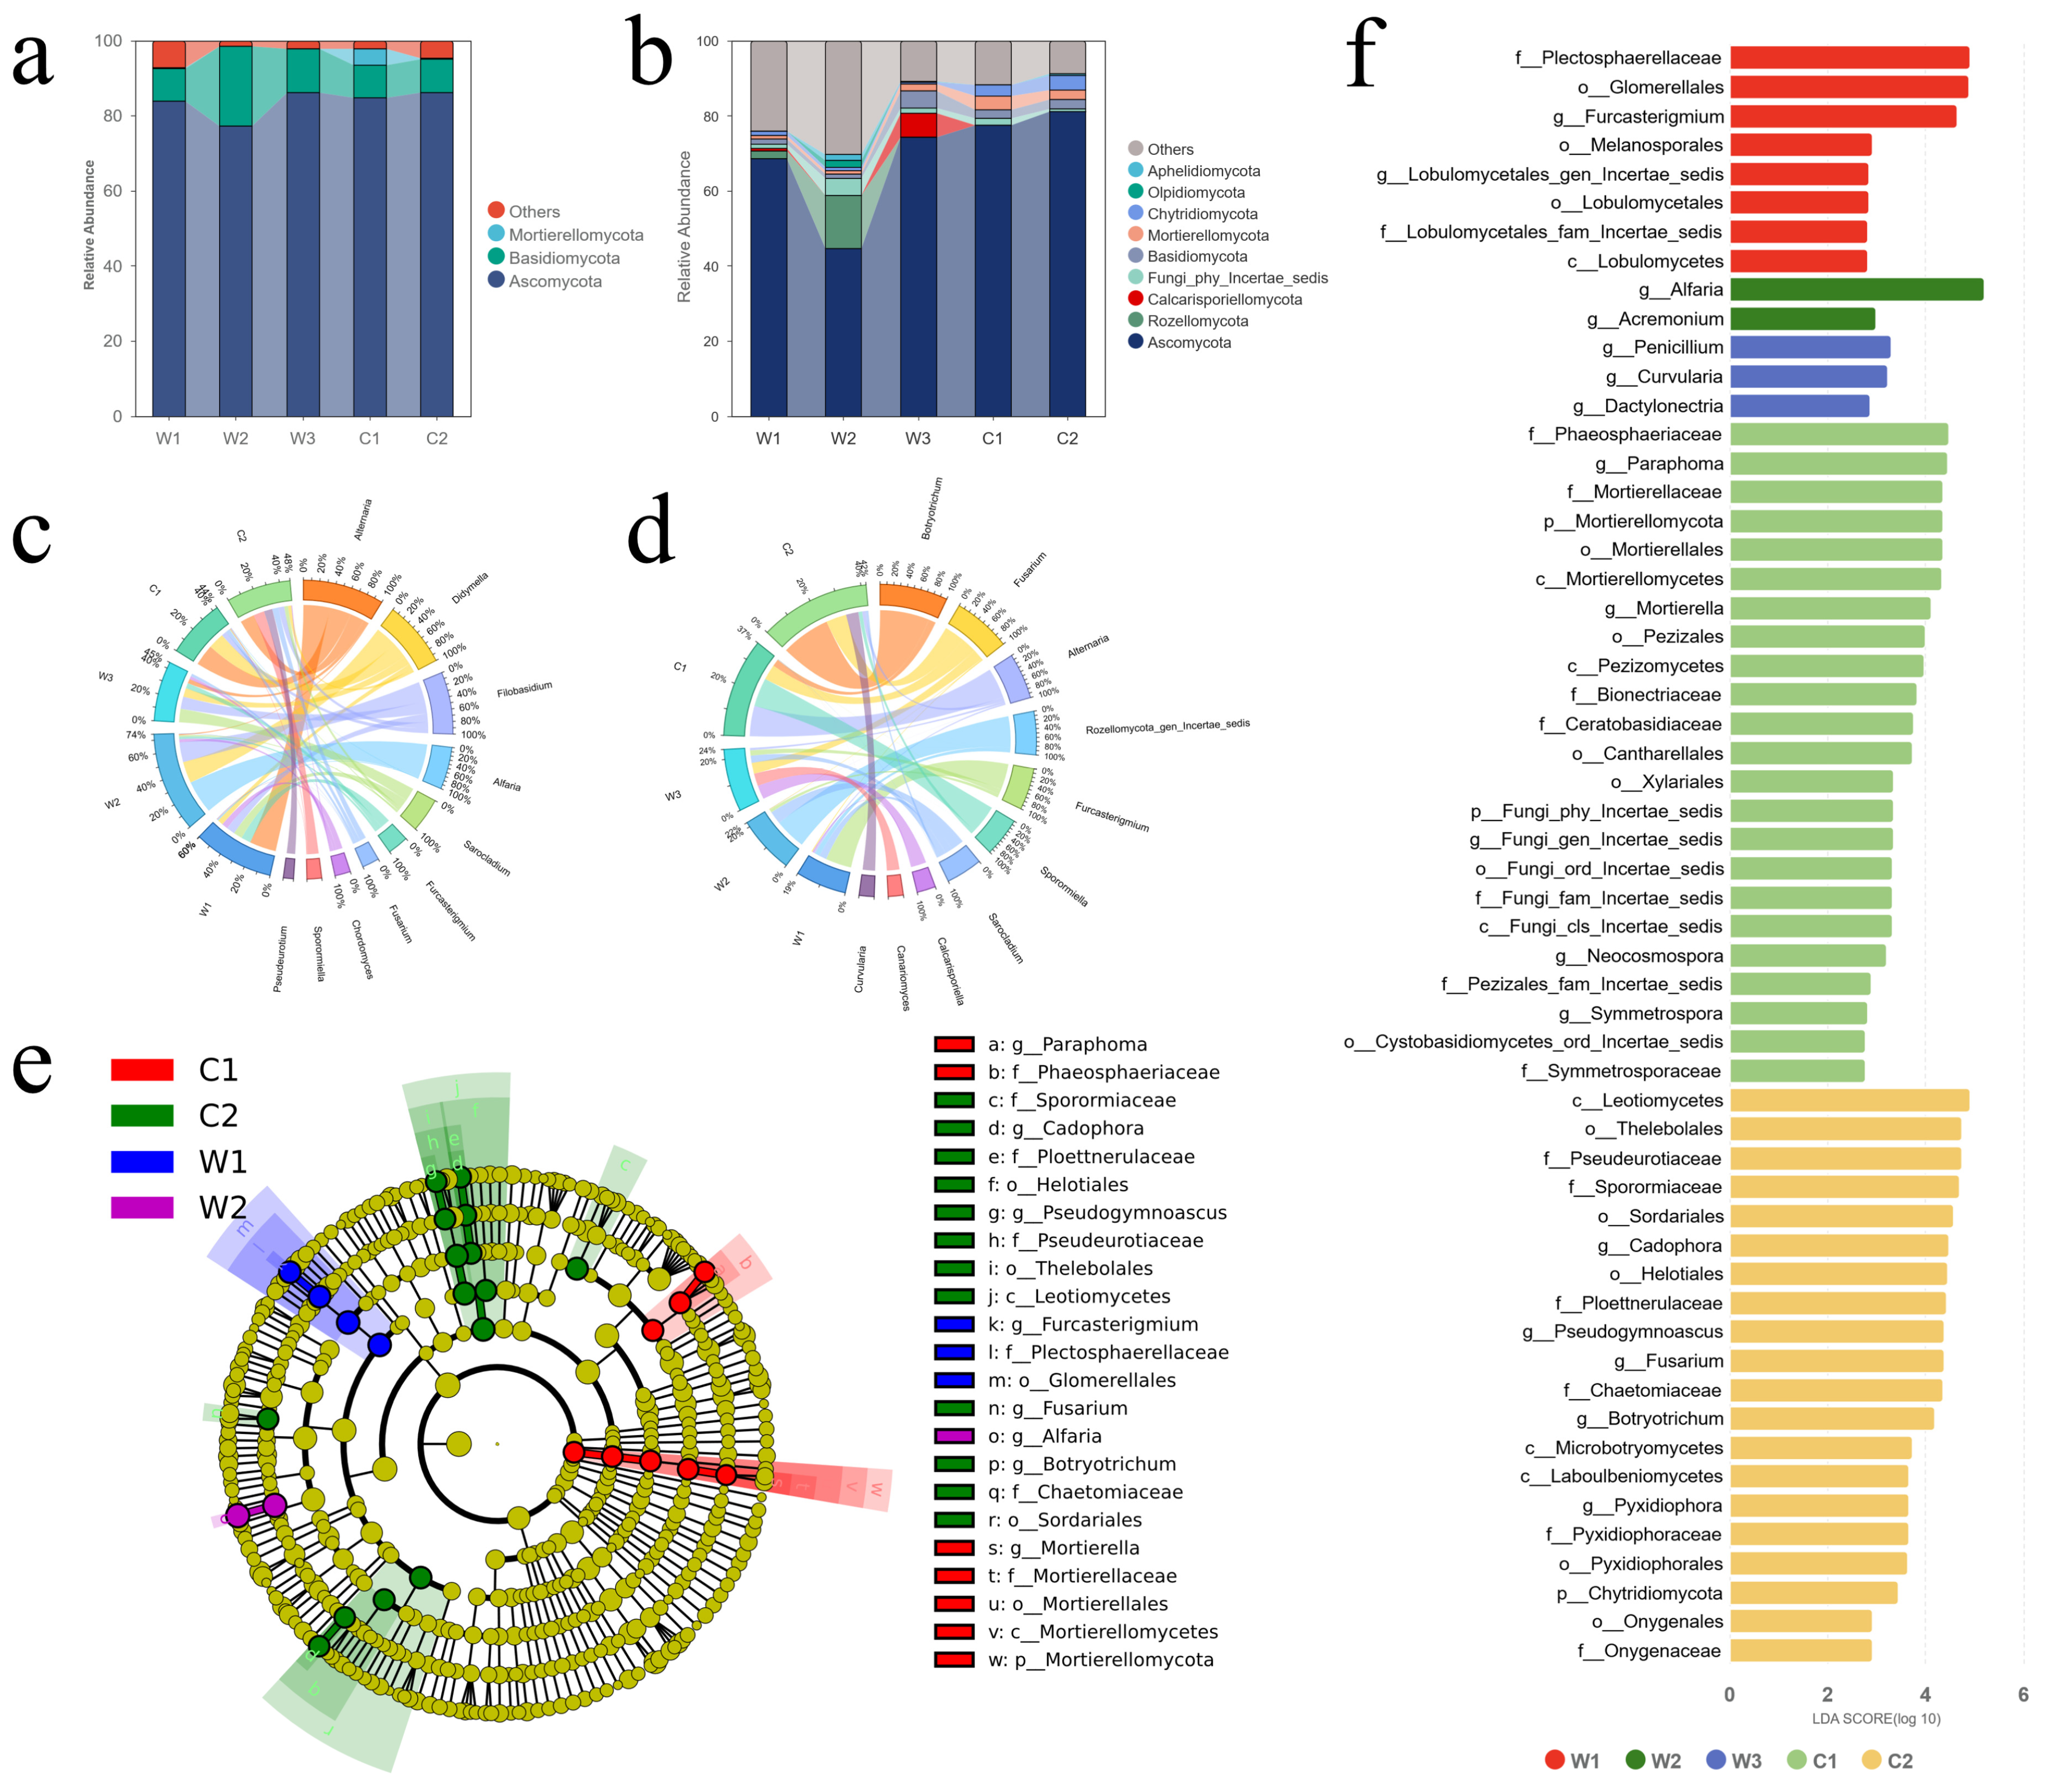
Taxonomic analysis revealed that Ascomycota, Basidiomycota, and Mortierellomycota were enriched in the rhizosphere environment (Figure 4a), with the fungal community primarily dominated by specific genera, including Alternaria, Didymella, and Alfaria (Figure 4c). In bulk soil, the dominant taxa were Alternaria, Botryotrichum, and Rozellomycota gen. incertae sedis (Figure 4b). The relative abundances of Ascomycota, Basidiomycota, and Mortierellomycota were significantly lower than those in the rhizosphere (Figure 4d). Although the cultivated groups C1 and C2 exhibited similar overall rhizosphere fungal community structures, significant differences were observed in the relative abundance of various fungal genera, which may be associated with the metabolic differences between the two cultivated groups. In contrast, the W1, W2, and W3 groups exhibited distinct rhizosphere microbial compositions.
Figure 4.
Microbiome distribution of G. uralensis. (a) Abundance of fungal phyla in the rhizosphere. (b) Abundance of fungal phyla in bulk soil. (c) Circos diagram of the top 10 fungal genera in the rhizosphere. (d) Circos diagram of the top 10 fungal genera in bulk soil. (e) Cladogram from LEfSe analysis (p < 0.05, LDA > 4). (f) LDA score plot (p < 0.05, LDA > 2). Low-abundance taxa with abundances below 1‰ (per thousand) are indicated in gray in (a,b).
Linear discriminant analysis effect size (LEfSe) was performed to identify differentially abundant microbial biomarkers among groups. The LDA score plot (Figure 4f; p < 0.05, LDA > 2) identified 56 significantly different microbial taxa, including 13 fungal genera (Table 2). Among these taxa, the dominant biomarkers in group C1 included Paraphoma (LDA = 4.48) and Mortierella (LDA = 4.13). Most of these taxa could be plant-associated fungi, potentially including plant growth-promoting fungi (PGPF). The core biomarkers in the W3 group included Penicillium, Curvularia, and Dactylonectria, many of which may often be associated with plant pathogenicity or stress tolerance. The phylogenetic cladogram (Figure 4e; p < 0.05, LDA > 4) further revealed that the C1 group was enriched in lineages related to Mortierellomycota and Phaeosphaeriaceae, the C2 group was enriched in lineages affiliated with Leotiomycetes and Sordariales, and the W1 group was enriched in lineages related to Glomerellales. Overall, these findings indicated significant differences in microbial community characteristics among the five G. uralensis groups.
Table 2.
Distribution of abundance of key microbial genera.
3.4. Fungal Genera Covariant with Flavonoid Metabolites
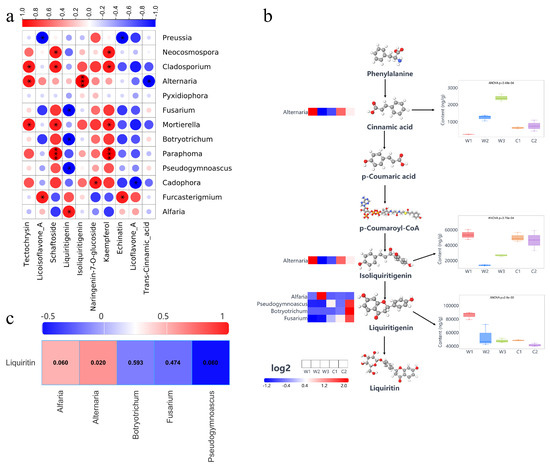
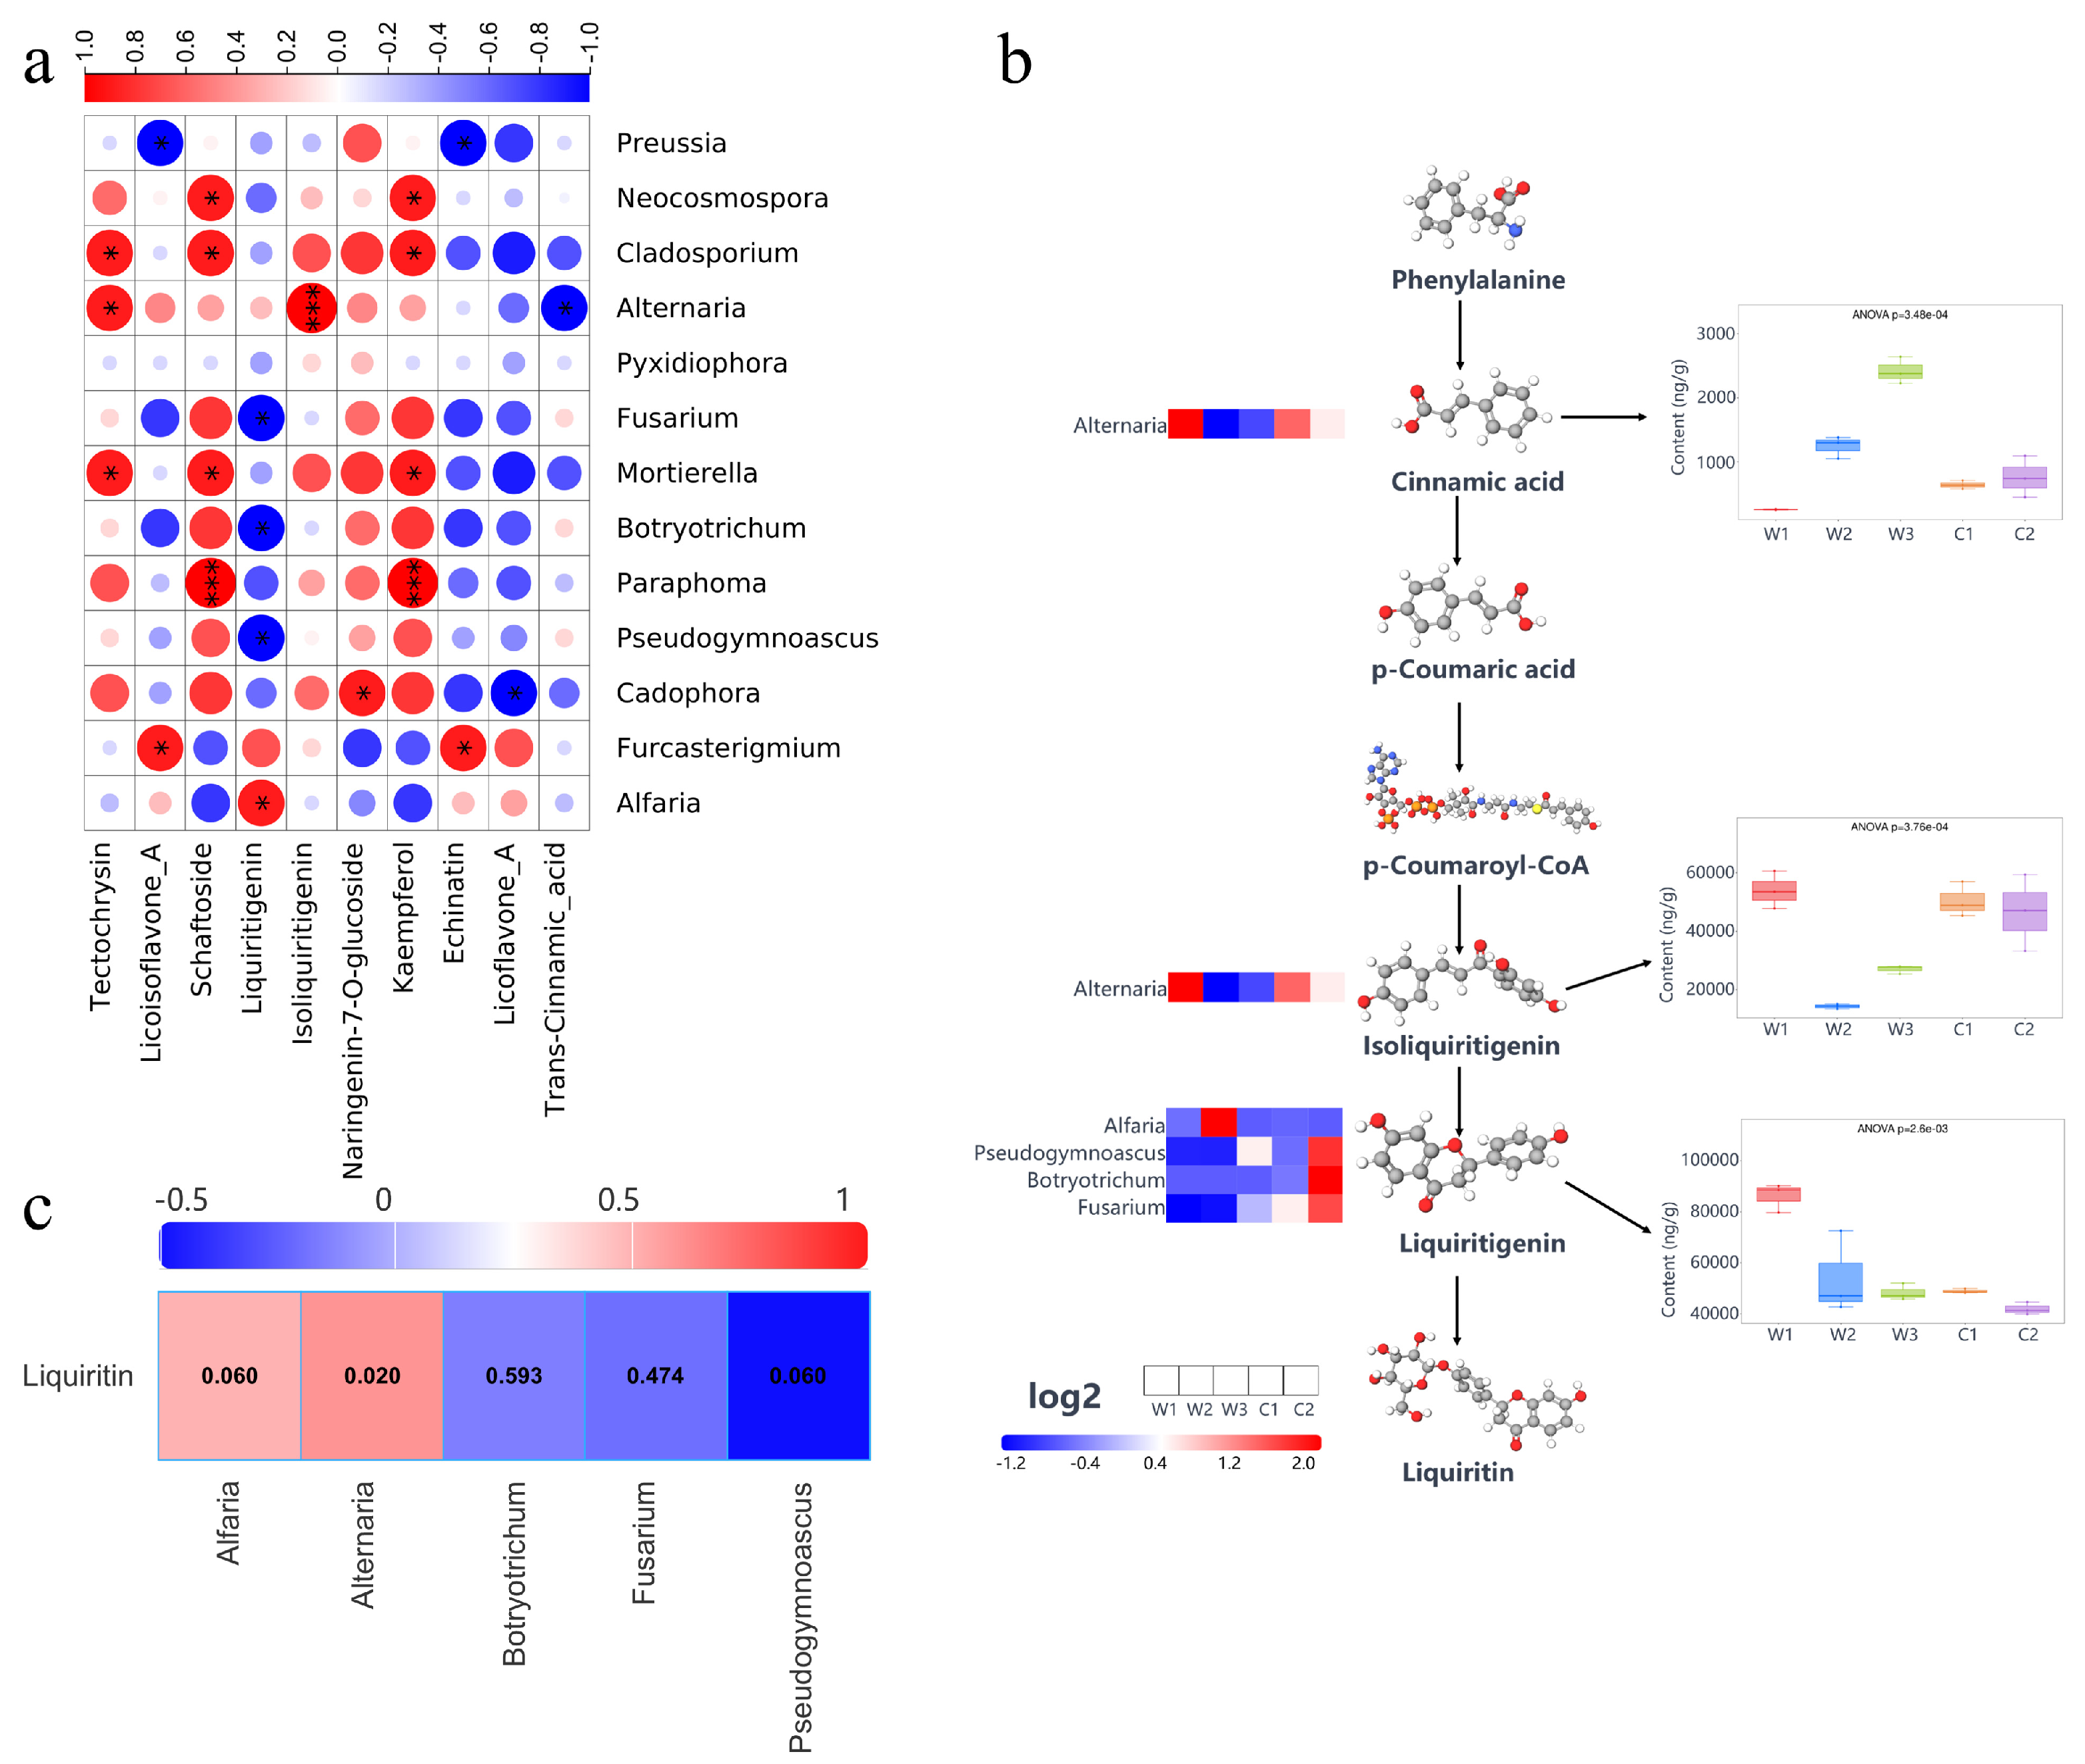
To elucidate potential associations between rhizosphere microbial abundance and metabolite accumulation, Spearman’s rank correlation analysis was performed to evaluate the relationships between DAMs and the relative abundances of fungal genera (Figure 5a). The relative abundances of Mortierella and Cladosporium were strongly positively correlated with the accumulation of tectochrysin, schaftoside, and kaempferol, whereas the relative abundances of Paraphoma and Neocosmospora were strongly positively correlated with the accumulation of schaftoside and kaempferol. These results suggested that these fungal genera may be associated with flavonoid biosynthesis or flavonoid accumulation in G. uralensis. The accumulation of liquiritigenin was strongly negatively correlated with the abundances of Pseudogymnoascus, Botryotrichum, and Fusarium, but strongly positively correlated with the abundance of Alfaria, suggesting that these fungal genera may be associated with the biosynthesis or accumulation of liquiritigenin. The abundance of Furcasterigmium was strongly positively correlated with the accumulation of Licoisoflavone A and Echinatin, whereas the abundance of Preussia was strongly negatively correlated with the accumulation of these two metabolites. Notably, the levels of these metabolites were associated with the relative abundances of specific fungal taxa.
Figure 5.
Correlation analysis between metabolites and fungal genera. (a) Correlation analysis between key microbial genera and metabolites (|R| > 0.6, p < 0.05). (b) Schematic model of the liquiritin biosynthetic pathway, on the right, the concentrations of metabolites in the samples, and on the left, the abundance distribution of fungal genera strongly correlated with the metabolites in each group. (c) Correlation analysis between microbial genus-level abundance and liquiritin accumulation.
To further examine the associations between key fungal taxa and metabolites involved in the phenylpropanoid and flavonoid biosynthetic pathways, we analyzed variation in the contents of major metabolites in the liquiritin biosynthetic pathway and their associations with rhizosphere fungal genera in G. uralensis (Figure 5b). The results showed that the metabolic pathway from the phenylalanine to liquiritin remained active in all groups. The cinnamic acid content was significantly higher in the W3 group (p < 0.05), whereas the abundance of Alternaria remained comparatively low. This suggests a negative association between cinnamic acid content and Alternaria abundance. The contents of isoliquiritigenin and liquiritigenin reached their highest levels in the W1 group. The isoliquiritigenin content in the cultivated strain remained comparable to that in the W1 group, whereas liquiritigenin content remained relatively low. In addition, Alternaria abundance was positively correlated with isoliquiritigenin content. Furthermore, Pseudogymnoascus, Botryotrichum, and Fusarium were negatively correlated with liquiritigenin accumulation. These results suggested that specific rhizosphere fungi may be associated with flavonoid biosynthesis and metabolite conversion under the experimental conditions. Correlation analysis between the relative abundances of selected fungal genera and liquiritin content (Figure 5c) showed that none of the five genera showed a significant correlation with liquiritin content, consistent with the pattern observed in Figure 5a.
4. Discussion
Liquiritin is recognized as a key quality marker of G. uralensis [29,30]. Enhancing the accumulation of major bioactive compounds has become an important objective in the molecular breeding of G. uralensis in China. In the present study, flavonoid metabolomic analysis revealed significant differences in metabolite composition and abundance. Notably, liquiritin, one of the major bioactive compounds, showed considerable variation among the different groups. Higher liquiritin concentrations were detected in the cultivated samples, particularly in the C1 group, than in some wild samples. These findings challenge the traditional assumption that wild medicinal plants are inherently superior to cultivated ones. It also suggests that optimized cultivation management practices may be associated with the accumulation of medicinal compounds at levels comparable to or higher than those observed in wild G. uralensis [28,31]. The differentially accumulated metabolites were primarily enriched in flavonoid biosynthesis, isoflavonoid biosynthesis, and flavanone biosynthesis pathways. These pathways constitute the core metabolic axis responsible for the biosynthesis of bioactive compounds in medicinal plants [32,33,34]. Similar enrichment of these metabolic pathways has also been observed in other medicinal plants, such as ginseng, where these pathways are closely associated with microbiome related metabolic changes [35]. The enrichment of the isoflavone biosynthesis pathway suggests that the synthesis of characteristic bioactive compounds, such as isoliquiritigenin and liquiritin, may be enhanced. Isoflavones are important bioactive compounds but also play key roles in plant defense responses and rhizosphere microbial signaling [36].
Significant differences in fungal community diversity and structure were observed among G. uralensis groups, with samples from the cultivated C1 group exhibiting significantly higher microbial diversity. The higher α-diversity observed in the C1 group also indicates a more balanced microbial community structure [37]. Notably, the C1 group also showed the highest liquiritin content, suggesting a potential association between microbial richness and host metabolic output [38]. Marked differences in microbial community composition between rhizosphere and bulk soils indicated that plants may selectively recruit or suppress specific microbial groups through the secretion of root exudates and secondary metabolites [39].
Identifying microbial biomarkers that distinguish different ecological niches is a crucial prerequisite for elucidating the mechanisms underlying functional interactions between plants and microbes [40]. The fungal taxa enriched in the W3 group were mainly composed of typical plant pathogens or stress-tolerant fungi [41,42]. In contrast, Mortierella, which was significantly enriched in the C1 group, may play important ecological functions and could potentially contribute to nutrient transformation, plant growth promotion, and regulation of secondary metabolism [43]. These findings indicate that different ecological environments or cultivation conditions can be associated with distinct microbial communities. This phenomenon is consistent with theoretical models suggesting that plants regulate rhizosphere microbial communities through metabolic filtering and environmental feedback [44]. Correlation analysis further demonstrated close associations between microbial abundance and metabolite accumulation. The accumulation of flavonoids, including liquiritigenin, tectochrysin, schaftoside, and kaempferol, suggests that specific microbial groups may be associated with flavonoid biosynthesis. This interpretation is consistent with previous findings showing that rhizosphere microorganisms can influence biosynthesis by regulating carbon flux allocation and inducing the expression of key enzymes, such as chalcone synthase [45,46].
By examining the biosynthetic pathway of liquiritin, five fungal genera were identified, including Alfaria, Pseudogymnoascus, Botryotrichum, Fusarium, and Alternaria. The five fungal genera showed distinct associations with metabolites involved in the liquiritin biosynthetic pathway rather than with liquiritin itself. Alternaria was associated with cinnamic acid and isoliquiritigenin, whereas Pseudogymnoascus, Botryotrichum, and Fusarium were negatively associated with liquiritigenin. These patterns indicate genus-specific fungal–metabolite associations within the pathway and should not be interpreted as direct associations with liquiritin accumulation. Species belonging to the genus Fusarium have been reported to disrupt host metabolism through pathogenic activity and inhibit the synthesis of secondary metabolites [47]. Different fungal taxa showed positive or negative associations with specific flavonoid metabolites, indicating contrasting correlation patterns among taxa. Beneficial symbiotic microorganisms can promote metabolite accumulation by enhancing nutrient uptake and producing signaling molecules [48]. These observations further highlight the complex regulatory relationships between microorganisms and plant metabolites.
This study has several limitations that need to be noted. First, the samples have similar genetic backgrounds. This cannot replace direct measurement of the genotype of individual plants. Second, soil physicochemical properties were not measured in this study, and the comparison between wild and cultivated populations was fully confounded by sampling location and management practices, making their respective effects impossible to separate. Third, we focused solely on the community composition of rhizosphere fungi. The functional roles of key microbial groups and their interactions with plant metabolism have not yet been fully explored. Despite these limitations, this study still reveals a close association between the rhizosphere fungal structure of G. uralensis and its flavonoid metabolic pathways. These findings provide candidate fungal taxa and testable hypotheses for future studies on the associations between rhizosphere fungi and flavonoid metabolism in G. uralensis. Future research should integrate genomics, transcriptomics, soil physicochemical measurements, and controlled pot experiments. Inoculation experiments using isolated fungal strains are needed to determine whether the identified fungal taxa directly affect flavonoid metabolism. These experiments may also help clarify the biological processes underlying the observed associations.
In conclusion, our results revealed a close relationship between rhizosphere fungal communities and flavonoid accumulation in G.uralensis. Among the five populations, C1 exhibited the highest liquiritin content and significantly higher fungal alpha diversity than W2 and W3. However, this pattern was not observed in C2. Therefore, the co-occurrence of high liquiritin content and high fungal diversity in C1 should be regarded as a population-specific observation rather than evidence of a general effect of cultivation. Several fungal genera showed associations with specific metabolites in the liquiritin biosynthetic pathway, although none of the five genera examined was significantly correlated with liquiritin content. These findings identify candidate fungal–metabolite associations for further experimental investigation. This study improves our understanding of the ecological factors associated with medicinal quality in G. uralensis and provides a basis for considering rhizosphere fungal communities in the sustainable cultivation of medicinal plants.
Supplementary Materials
The following supporting information can be downloaded at: https://www.mdpi.com/article/10.3390/d18100609/s1, Table S1. Main differences in the distribution of metabolite content. Figure S1. TIC profiles of 21 metabolites across all samples. 1: Syingic acid; 2: p-Hydoxycinnamic acid; 3: Trans-cinnamic acid; 4: Schaftoside; 5: Daidzin; 6: Liquiritin; 7: Naringenin-7-O-glucoside; 8: 7,4’-Dihydroxyflavone; 9: Liquiritigenin; 10: Tectochrysin; 11: Echinatin/Kaempferol; 12: Isoliquiritigenin; 13: Formononetin; 14: Licoflavone A; 15: Licoisoflavone A; 16: Ginlgetin; 17: Isoginkgetin; 18: Licoflavonol; 19: Sciadopitysin; 20: Kushenol A.
Author Contributions
Conceptualization, Y.L. and D.F.; methodology, D.F. and Y.L.; validation, D.F., Y.L. and W.W.; formal analysis, Y.L.; investigation, D.F.; resources, Y.L.; data curation, D.F. and X.Z.; writing—original draft preparation, D.F., X.Z. and J.L.; writing—review and editing, Y.L.; visualization, D.F., H.Q. and S.W.; supervision, Y.L.; project administration, Y.L.; funding acquisition, Y.L. All authors have read and agreed to the published version of the manuscript.
Funding
This research was financially supported by the Inner Mongolia Autonomous Region Natural Science Key Project Fund (2023ZD13), Basic Scientific Research Business Expenses of Universities Directly under the Inner Mongolia Autonomous Region (2023RCTD022), and Inner Mongolia Hangjin Banner Science and Technology Planning Project (2025HJGJ13).
Institutional Review Board Statement
Not applicable.
Data Availability Statement
The raw sequencing data generated in this study have been deposited in the NCBI Sequence Read Archive (SRA) database under BioProject accession number PRJNA1529195. The original contributions presented in the study are included in the article. Further inquiries can be directed to the corresponding author.
Acknowledgments
The authors would like to thank Inner Mongolia Saiwai Shuomo Chinese Herbal Medicine Co., Ltd. for providing the experimental samples for this study, and also thank GenesCloud (https://www.genescloud.cn) and NovoMagic for their graphical analysis tools. The authors have reviewed and edited the output and take full responsibility for the content of this publication.
Conflicts of Interest
The authors declare no conflicts of interest.
Abbreviations
The following abbreviations are used in this manuscript:
| ASV | Amplicon Sequence Variant |
| HPLC | High Performance Liquid Chromatography |
| ITS | Internal Transcribed Spacer |
| KEGG | Kyoto Encyclopedia of Genes and Genomes |
| LC-MS/MS | Liquid Chromatography-tandem Mass Spectrometry |
| LDA | Linear Discriminant Analysis |
| LEfSe | Linear Discriminant Analysis Effect Size |
| MS | Mass Spectrometry |
| PCA | Principal Component Analysis |
| PCoA | Principal Coordinates Analysis |
References
- Alseekh, S.; Aharoni, A.; Brotman, Y.; Contrepois, K.; D’Auria, J.; Ewald, J.; Ewald, J.C.; Fraser, P.D.; Giavalisco, P.; Hall, R.D.; et al. Mass spectrometry-based metabolomics: A guide for annotation, quantification and best reporting practices. Nat. Methods 2021, 18, 747–756. [Google Scholar] [CrossRef] [Scilit] [PubMed]
- Poria, V.; Dębiec-Andrzejewska, K.; Fiodor, A.; Lyzohub, M.; Ajijah, N.; Singh, S.; Pranaw, K. Plant growth-promoting bacteria (PGPB) integrated phytotechnology: A sustainable approach for remediation of marginal lands. Front. Plant Sci. 2022, 13, 999866. [Google Scholar] [CrossRef] [Scilit] [PubMed]
- Bulgarelli, D.; Schlaeppi, K.; Spaepen, S.; Ver Loren van Themaat, E.; Schulze-Lefert, P. Structure and functions of the bacterial microbiota of plants. Annu. Rev. Plant Biol. 2013, 64, 807–838. [Google Scholar] [CrossRef] [Scilit] [PubMed]
- Fitzpatrick, C.R.; Salas-González, I.; Conway, J.M.; Finkel, O.M.; Gilbert, S.; Russ, D.; Teixeira, P.J.P.L.; Dangl, J.L. The plant microbiome: From ecology to reductionism and beyond. Annu. Rev. Microbiol. 2020, 74, 81–100. [Google Scholar] [CrossRef] [Scilit] [PubMed]
- Fonseca-García, C.; Pettinga, D.; Wilson, A.; Elmore, J.R.; McClure, R.; Atim, J.; Pedraza, J.; Hutmacher, R.; Turumtay, H.; Tian, Y.; et al. Defined synthetic microbial communities colonize and benefit field-grown sorghum. ISME J. 2024, 18, wrae126. [Google Scholar] [CrossRef] [Scilit] [PubMed]
- Toju, H.; Peay, K.G.; Yamamichi, M.; Narisawa, K.; Hiruma, K.; Naito, K.; Fukuda, S.; Ushio, M.; Nakaoka, S.; Onoda, Y.; et al. Core microbiomes for sustainable agroecosystems. Nat. Plants 2018, 4, 247–257. [Google Scholar] [CrossRef] [Scilit] [PubMed]
- Zhalnina, K.; Louie, K.B.; Hao, Z.; Mansoori, N.; da Rocha, U.N.; Shi, S.; Cho, H.; Karaoz, U.; Loqué, D.; Bowen, B.P.; et al. Dynamic root exudate chemistry and microbial substrate preferences drive patterns in rhizosphere microbial community assembly. Nat. Microbiol. 2018, 3, 470–480. [Google Scholar] [CrossRef] [Scilit] [PubMed]
- Bhat, B.A.; Tariq, L.; Nissar, S.; Islam, S.T.; Islam, S.U.; Mangral, Z.; Ilyas, N.; Sayyed, R.Z.; Muthusamy, G.; Kim, W.; et al. The role of plant-associated rhizobacteria in plant growth, biocontrol and abiotic stress management. J. Appl. Microbiol. 2022, 133, 2717–2741. [Google Scholar] [CrossRef] [Scilit] [PubMed]
- Sasse, J.; Martinoia, E.; Northen, T. Feed your friends: Do plant exudates shape the root microbiome? Trends Plant Sci. 2018, 23, 25–41. [Google Scholar] [CrossRef] [Scilit] [PubMed]
- Liu, L.; Si, L.; Zhang, L.; Guo, R.; Wang, R.; Dong, H.; Guo, C. Metabolomics and transcriptomics analysis revealed the response mechanism of alfalfa to combined cold and saline-alkali stress. Plant J. 2024, 119, 1900–1919. [Google Scholar] [CrossRef] [Scilit] [PubMed]
- Gao, M.; Bai, L.; Xiao, L.; Peng, H.; Chen, Q.; Qiu, W.; Song, Z. Micro (nano) plastics and phthalate esters drive endophytic bacteria alteration and inhibit wheat root growth. Sci. Total Environ. 2024, 906, 167734. [Google Scholar] [CrossRef] [Scilit] [PubMed]
- Li, J.; Yang, X.; Chen, M.; Zhang, L. Enhancing the effect of novel Cd mobilization bacteria on phytoremediation and microecology of cadmium contaminated soil. Int. J. Phytoremediation 2025, 27, 287–297. [Google Scholar] [CrossRef] [Scilit] [PubMed]
- Vorholt, J.A.; Vogel, C.; Carlström, C.I.; Müller, D.B. Establishing causality: Opportunities of synthetic communities for plant microbiome research. Cell Host Microbe 2017, 22, 142–155. [Google Scholar] [CrossRef] [Scilit] [PubMed]
- Sauer, S.; Dlugosch, L.; Kammerer, D.R.; Stintzing, F.C.; Simon, M. The microbiome of the medicinal plants Achillea millefolium L. and Hamamelis virginiana L. Front. Microbiol. 2021, 12, 696398. [Google Scholar] [CrossRef] [Scilit] [PubMed]
- Yin, Y.; Li, Y.; Jiang, D.; Zhang, X.; Gao, W.; Liu, C. De novo biosynthesis of liquiritin in Saccharomyces cerevisiae. Acta Pharm. Sin. B 2020, 10, 711–721. [Google Scholar] [CrossRef] [Scilit] [PubMed]
- Zhou, Y.; Yang, X.; Hong, C.; Guan, T.; Xiao, P.; Yang, Y.; Zhang, C.; He, Z. Periplaneta americana extract protects glutamate-induced nerve cell damage by inhibiting N-Methyl-D-Aspartate receptor activation. Biology 2025, 14, 193. [Google Scholar] [CrossRef] [Scilit] [PubMed]
- Zhang, B.; Zhou, Z.; Fan, L. Ultrasonic power as a switch: Tailoring gellan gum-Lonicera caerulea polyphenol complexes for enhanced stability or bioaccessibility. LWT 2026, 247, 119308. [Google Scholar] [CrossRef] [Scilit]
- Xiong, W.; Zhao, Q.; Xue, C.; Xun, W.; Zhao, J.; Wu, H.; Li, R.; Shen, Q. Comparison of fungal community in black pepper-vanilla and vanilla monoculture systems associated with vanilla fusarium wilt disease. Front. Microbiol. 2016, 7, 117. [Google Scholar] [CrossRef] [Scilit] [PubMed]
- Magoč, T.; Salzberg, S.L. FLASH: Fast length adjustment of short reads to improve genome assemblies. Bioinformatics 2011, 27, 2957–2963. [Google Scholar] [CrossRef] [Scilit] [PubMed]
- Bokulich, N.A.; Subramanian, S.; Faith, J.J.; Gevers, D.; Gordon, J.I.; Knight, R.; Mills, D.A.; Caporaso, J.G. Quality-filtering vastly improves diversity estimates from Illumina amplicon sequencing. Nat. Methods 2013, 10, 57–59. [Google Scholar] [CrossRef] [Scilit] [PubMed]
- Chen, S.; Zhou, Y.; Chen, Y.; Gu, J. fastp: An ultra-fast all-in-one FASTQ preprocessor. Bioinformatics 2018, 34, i884–i890. [Google Scholar] [CrossRef] [Scilit]
- Edgar, R.C.; Haas, B.J.; Clemente, J.C.; Quince, C.; Knight, R. UCHIME improves sensitivity and speed of chimera detection. Bioinformatics 2011, 27, 2194–2200. [Google Scholar] [CrossRef] [Scilit] [PubMed]
- Callahan, B.J.; McMurdie, P.J.; Rosen, M.J.; Han, A.W.; Johnson, A.J.A.; Holmes, S.P. DADA2: High-resolution sample inference from Illumina amplicon data. Nat. Methods 2016, 13, 581–583. [Google Scholar] [CrossRef] [Scilit] [PubMed]
- Bolyen, E.; Rideout, J.R.; Dillon, M.R.; Bokulich, N.A.; Abnet, C.C.; Al-Ghalith, G.A.; Alexander, H.; Alm, E.J.; Arumugam, M.; Asnicar, F.; et al. Reproducible, interactive, scalable and extensible microbiome data science using QIIME 2. Nat. Biotechnol. 2019, 37, 852–857. [Google Scholar] [CrossRef] [Scilit] [PubMed]
- Nilsson, R.H.; Larsson, K.H.; Taylor, A.F.S.; Bengtsson-Palme, J.; Jeppesen, T.S.; Schigel, D.; Kennedy, P.; Picard, K.; Glöckner, F.O.; Tedersoo, L.; et al. The UNITE database for molecular identification of fungi: Handling dark taxa and parallel taxonomic classifications. Nucleic Acids Res. 2019, 47, D259–D264. [Google Scholar] [CrossRef] [Scilit] [PubMed]
- Caporaso, J.G.; Kuczynski, J.; Stombaugh, J.; Bittinger, K.; Bushman, F.D.; Costello, E.K.; Fierer, N.; Gonzalez Peña, A.; Goodrich, J.K.; Gordon, J.I.; et al. QIIME allows analysis of high-throughput community sequencing data. Nat. Methods 2010, 7, 335–336. [Google Scholar] [CrossRef] [Scilit] [PubMed]
- Weiss, S.; Xu, Z.Z.; Peddada, S.; Amir, A.; Bittinger, K.; Gonzalez, A.; Lozupone, C.; Zaneveld, J.R.; Vázquez-Baeza, Y.; Birmingham, A.; et al. Normalization and microbial differential abundance strategies depend upon data characteristics. Microbiome 2017, 5, 27. [Google Scholar] [CrossRef] [Scilit] [PubMed]
- Zhong, C.; Chen, C.; Gao, X.; Tan, C.; Bai, H.; Ning, K. Multi-omics profiling reveals comprehensive microbe-plant-metabolite regulation patterns for medicinal plant Glycyrrhiza uralensis Fisch. Plant Biotechnol. J. 2022, 20, 1874–1887. [Google Scholar] [CrossRef] [Scilit] [PubMed]
- Pastorino, G.; Cornara, L.; Soares, S.; Rodrigues, F.; Oliveira, M.B.P.P. Liquorice (Glycyrrhiza glabra): A phytochemical and pharmacological review. Phytother. Res. 2018, 32, 2323–2339. [Google Scholar] [CrossRef] [Scilit] [PubMed]
- Chen, J.; Li, L.F.; Lin, Z.Z.; Cheng, X.L.; Wei, F.; Ma, S.C. A quality-comprehensive-evaluation-index-based model for evaluating traditional Chinese medicine quality. Chin. Med. 2023, 18, 89. [Google Scholar] [CrossRef] [Scilit] [PubMed]
- Tsipinana, S.; Husseiny, S.; Alayande, K.A.; Raslan, M.; Amoo, S.; Adeleke, R. Contribution of endophytes towards improving plant bioactive metabolites: A rescue option against red-taping of medicinal plants. Front. Plant Sci. 2023, 14, 1248319. [Google Scholar] [CrossRef] [Scilit] [PubMed]
- Wang, Z.F.; Liu, J.; Yang, Y.A.; Zhu, H.L. A review: The anti-inflammatory, anticancer and antibacterial properties of four kinds of licorice flavonoids isolated from licorice. Curr. Med. Chem. 2020, 27, 1997–2011. [Google Scholar] [CrossRef] [Scilit] [PubMed]
- Guo, Y.; Wu, Y.; Huang, T.; Huang, D.; Zeng, Q.; Wang, Z.; Hu, Y.; Liang, P.; Chen, H.; Zheng, Z.; et al. Licorice flavonoid ameliorates ethanol-induced gastric ulcer in rats by suppressing apoptosis via PI3K/AKT signaling pathway. J. Ethnopharmacol. 2024, 325, 117739. [Google Scholar] [CrossRef] [Scilit] [PubMed]
- Zhang, X.; Zhang, G.; Yan, Q.; Ahmad, B.; Pei, J.; Huang, L. Quality variation and salt-alkali-tolerance mechanism of Cynomorium songaricum: Interacting from microbiome-transcriptome-metabolome. Sci. Total Environ. 2024, 919, 170801. [Google Scholar] [CrossRef] [Scilit] [PubMed]
- Hyun, T.K. Composition, diversity, and functional roles of the rhizosphere microbiome in Panax ginseng. Plant Pathol. J. 2025, 41, 425–436. [Google Scholar] [CrossRef] [Scilit] [PubMed]
- Hassan, S.; Mathesius, U. The role of flavonoids in root-rhizosphere signalling: Opportunities and challenges for improving plant-microbe interactions. J. Exp. Bot. 2012, 63, 3429–3444. [Google Scholar] [CrossRef] [Scilit] [PubMed]
- Delgado-Baquerizo, M.; Oliverio, A.M.; Brewer, T.E.; Benavent-González, A.; Eldridge, D.J.; Bardgett, R.D.; Maestre, F.T.; Singh, B.K.; Fierer, N. A global atlas of the dominant bacteria found in soil. Science 2018, 359, 320–325. [Google Scholar] [CrossRef] [Scilit] [PubMed]
- Song, P.; Deng, Y.; Yu, Y.; Zhang, L.; Liu, Y. Plant growth-promoting microorganisms mediate plant metabolic reprogramming to manage the rhizospheric microbiome. Microorganisms 2026, 14, 578. [Google Scholar] [CrossRef] [Scilit] [PubMed]
- Santoyo, G. How plants recruit their microbiome? New insights into beneficial interactions. J. Adv. Res. 2022, 40, 45–58. [Google Scholar] [CrossRef] [Scilit] [PubMed]
- Dijoux, J.; Gigante, S.; Lecellier, G.; Guentas, L.; Burtet-Sarramegna, V. Plant nickel-exclusion versus hyperaccumulation: A microbial perspective. Microbiome 2025, 13, 110. [Google Scholar] [CrossRef] [Scilit] [PubMed]
- Dean, R.; Van Kan, J.A.; Pretorius, Z.A.; Hammond-Kosack, K.E.; Di Pietro, A.; Spanu, P.D.; Rudd, J.J.; Dickman, M.; Kahmann, R.; Ellis, J.; et al. The top 10 fungal pathogens in molecular plant pathology. Mol. Plant Pathol. 2012, 13, 414–430. [Google Scholar] [CrossRef] [Scilit] [PubMed]
- Fisher, M.C.; Henk, D.A.; Briggs, C.J.; Brownstein, J.S.; Madoff, L.C.; McCraw, S.L.; Gurr, S.J. Emerging fungal threats to animal, plant and ecosystem health. Nature 2012, 484, 186–194. [Google Scholar] [CrossRef] [Scilit] [PubMed]
- Chang, L.; Chen, H.; Tang, X.; Zhao, J.; Zhang, H.; Chen, Y.Q.; Chen, W. Advances in improving the biotechnological application of oleaginous fungus Mortierella alpina. Appl. Microbiol. Biotechnol. 2021, 105, 6275–6289. [Google Scholar] [CrossRef] [Scilit] [PubMed]
- Liu, Y.; Wilson, A.J.; Han, J.; Hui, A.; O’Sullivan, L.; Huan, T.; Haney, C.H. Amino acid availability determines plant immune homeostasis in the rhizosphere microbiome. mBio 2023, 14, e0342422. [Google Scholar] [CrossRef] [Scilit] [PubMed]
- Araújo, W.L.; Nunes-Nesi, A.; Nikoloski, Z.; Sweetlove, L.J.; Fernie, A.R. Metabolic control and regulation of the tricarboxylic acid cycle in photosynthetic and heterotrophic plant tissues. Plant Cell Environ. 2012, 35, 1–21. [Google Scholar] [CrossRef] [Scilit] [PubMed]
- Rai, A.; Saito, K.; Yamazaki, M. Integrated omics analysis of specialized metabolism in medicinal plants. Plant J. 2017, 90, 764–787. [Google Scholar] [CrossRef] [Scilit] [PubMed]
- Zheng, J.; Zhang, C.; Xiang, S.; Li, M.; Wang, H.; Shi, K.; Tondrob, D.; Han, Y. Integrated metabolomics and metagenomics uncover pathogenic mechanisms of Fusarium wilt and faba bean defense responses. npj Sci. Food 2026, 10, 25. [Google Scholar] [CrossRef] [Scilit] [PubMed]
- Singh, B.K.; Hu, H.W.; Macdonald, C.A.; Xiong, C. Microbiome-facilitated plant nutrient acquisition. Cell Host Microbe 2025, 33, 869–881. [Google Scholar] [CrossRef] [Scilit] [PubMed]

Disclaimer/Publisher’s Note: The statements, opinions and data contained in all publications are solely those of the individual author(s) and contributor(s) and not of MDPI and/or the editor(s). MDPI and/or the editor(s) disclaim responsibility for any injury to people or property resulting from any ideas, methods, instructions or products referred to in the content. |
© 2026 by the authors. Licensee MDPI, Basel, Switzerland. This article is an open access article distributed under the terms and conditions of the Creative Commons Attribution (CC BY) license.