


Abstract
Geographic variation in colorectal cancer (CRC) incidence and mutational spectra has been well described, whereas the extent to which regional context is associated with tumor evolutionary timing remains unclear. We first examined the association between CRC incidence and mean annual temperature and then analyzed whole-exome sequencing data from 688 microsatellite-stable (MSS) CRCs across four Chinese cohorts, classifying tumors from Harbin and Beijing (n = 65) as the cold-region group and those from Guangzhou (n = 623) as the non-cold-region group. Comparative analyses revealed differences in mutational processes and evolutionary timing between the two groups. Specifically, cold-region tumors exhibited higher estimated contributions from mutational signature SBS93, a more polarized distribution of copy-number gain timing, and later inferred molecular timing of whole-genome doubling. Patients in the cold-region group were also diagnosed at younger ages, and higher SBS93 exposure was associated with younger age at diagnosis. In contrast, no widespread differences were detected in driver gene mutation frequencies, copy-number alterations, genomic instability metrics, or most immune-related features. Together, these findings suggest distinct mutational processes and evolutionary timing patterns in MSS CRCs from cold-region and non-cold-region cohorts, providing new insights into the geographic heterogeneity of colorectal cancer evolution.
1. Introduction
Colorectal cancer remains a major global health challenge, with its incidence varying approximately tenfold across regions [1,2]. Recent large-scale international cohorts reveal that MSS CRCs exhibit striking geographic variations in mutational processes [3]. These findings indicate that geographic factors are not merely extrinsic epidemiological features, but may also be reflected in the cancer genome, potentially influencing tumor evolution.
While mutational catalogues provide a snapshot of this geographic diversity [3], the underlying evolutionary dynamics remain to be fully elucidated. Recent advances in cancer phylogenetics, particularly the molecular-timing analyses of copy number gains and whole-genome duplication (WGD) events, now permit dissection of the temporal dynamics of large-scale chromosomal alterations from copy-number profiles [4,5]. These approaches make it possible to move beyond static genomic descriptions and reconstruct the history of major chromosomal events during tumor evolution.
However, whether these geographic differences extend beyond mutational spectra to influence the temporal ordering of chromosomal events remains unclear [3,6,7]. Because mutational processes and copy-number evolution have seldom been analyzed jointly in MSS colorectal cancer, we lack a comprehensive understanding of whether geographic factors influence not only specific mutational processes but also the temporal ordering of copy number alterations [4,8].
Among the many interconnected geographic characteristics, climate represents an important dimension of regional variation, and mean annual ambient temperature provides a measurable descriptor of regional climatic conditions. In an exploratory ecological analysis, we observed a nonlinear relationship between country-level colorectal cancer incidence and mean annual ambient temperature, with an apparent change in the fitted trend around 15.95 °C. We used this value as a descriptive reference for grouping the available Chinese cohorts from northern and southern cities with contrasting climatic conditions into cold-region and non-cold-region cohorts, respectively, rather than as an established biological threshold or a measure of individual temperature exposure. We subsequently integrated whole-exome sequencing data to systematically compare their genomic landscapes, mutational processes, and the molecular timing of major chromosomal events. This integrated approach extends the investigation of geographic heterogeneity in MSS CRC beyond mutational landscapes to the evolutionary dynamics of chromosomal alterations.
2. Results
2.1. Patterns of CRC Incidence in Relation to Temperature and Stratification of MSS CRC Cohorts
Global mapping of CRC incidence revealed a striking geographical gradient, with the highest age-standardized incidence rates (ASRs) concentrated in Europe, North America, Australia, New Zealand and parts of southern South America, and with incidence tending to increase towards higher-latitude regions (Figure 1A, Tables S1 and S2). Across countries, mean annual temperature was inversely associated with CRC incidence, with the fitted curve showing relatively stable incidence patterns at the lower- and higher-temperature ranges separated by a marked transition (Figure 1B). To account for potential socioeconomic confounding, we further modeled the temperature–incidence relationship using a GAM adjusted for country-level Human Development Index (HDI). The smooth temperature term remained statistically significant after adjustment for country-level HDI (approximate F-test, p = 3.63 × 10⁻⁴). Second-derivative analysis of the HDI-adjusted GAM identified the major transition at 15.95 °C, with a 95% percentile bootstrap interval of 12.61–18.95 °C. Using 15.95 °C as the operational threshold, we found that countries with mean annual temperatures below 15.95 °C showed significantly higher ASRs than those with mean annual temperatures between 15.95 °C and 30 °C (Figure 1C). Stratification in 5 °C increments further supported this observation, as countries in lower-temperature bins generally exhibited higher ASRs than those in warmer bins (Figure 1D).
Figure 1.
Colorectal cancer incidence in relation to mean annual temperature and clinical characteristics of cold-region and non-cold-region MSS CRC cohorts. (A) Worldwide distribution of country-level CRC ASRs. Darker shading denotes higher incidence, whereas gray indicates unavailable data. (B) Nonlinear association between mean annual temperature and CRC ASR across countries. Points represent individual countries; the red triangle represents the inflection point; the green curve represents the GAM-fitted temperature–incidence relationship, with shading indicating the 95% confidence interval. The vertical dashed line denotes the 15.95 °C operational threshold derived from second-derivative analysis of the HDI-adjusted GAM. (C) ASR comparison between countries with mean annual temperatures < 15.95 °C and those with temperatures of 15.95–30 °C. Center lines, medians; box limits, IQR; whiskers, 1.5 × IQR; red dots, means. (D) ASR comparison across 5 °C temperature bins. Horizontal brackets indicate statistically significant pairwise differences between temperature bins. Asterisks denote statistical significance (** p < 0.01, *** p < 0.001). Two-sided Wilcoxon rank-sum tests were used in panels (C,D) (pairwise for the temperature bins in (D)). (E) Age at diagnosis in cold-region and non-cold-region MSS CRC cases. (F) TNM-stage distribution among tumors with available staging information (cold-region, n = 42, all from the in-house Beijing cohort; non-cold-region, n = 623). (G) Sex distribution in cold-region and non-cold-region MSS CRC cases. (H) Venous invasion status among tumors with available annotations (cold-region, n = 9, all from the Hu Harbin cohort; non-cold-region, n = 507). (I) Perineural invasion status among tumors with available annotations (cold-region, n = 9, all from the Hu Harbin cohort; non-cold-region, n = 503). Percentages in panels (F,H,I) use the numbers of tumors with non-missing information as denominators. Missing-data counts by source cohort and geographic group are reported in Table S3. p-values are displayed in the respective panels.
We assembled 1107 primary CRC cases with whole-exome sequencing data from four cohorts across three cities. All samples were processed using a unified pipeline integrating multiple somatic variant callers and copy-number alteration detection methods. After stringent quality control (Methods), 688 MSS tumors were retained for downstream analyses. These included 42 tumors from the in-house Beijing cohort, 14 from the Yang Beijing cohort, 9 from the Hu Harbin cohort, and 623 from the SYSUCC Changkang Guangzhou cohort (Tables S3 and S15). We classified the Beijing and Harbin cohorts from Northern China as the cold-region group and the Guangzhou cohort from Southern China as the non-cold-region group. Among patients with available information, compared with the non-cold-region group, the cold-region group showed a lower mean age at diagnosis (mean ± SD: 53.2 ± 17.7 vs. 58.7 ± 12.0 years; n = 65 vs. 623; p = 0.03; Figure 1E, Figure S1; Table S3) and a distinct TNM stage composition, with more stage III tumors (n = 22/42 vs. 175/623, 52.4% vs. 28.1%) and fewer stage II (n = 11/42 vs. 210/623, 26.2% vs. 33.7%) and stage IV (n = 4/42 vs. 165/623, 9.5% vs. 26.5%) cases (p = 0.0047; Figure 1F). By contrast, no statistically significant differences were detected in sex distribution (male patients, 39/65 vs. 361/623, 60% vs. 58%, p = 0.749), venous invasion (n = 4/9 vs. 111/507, 44% vs. 22%, p = 0.227), or perineural invasion (n = 4/9 vs. 91/503, 44% vs. 18%, p = 0.113) between groups (Figure 1G–I).
2.2. Genomic Landscape in Cold-Region and Non-Cold-Region CRCs
No statistically significant difference in nonsynonymous tumor mutational burden (TMB) was detected between cold-region and non-cold-region tumors (1.92 vs. 1.95/Mb, p = 0.97; Figure 2A). Across the combined dataset, 22 significantly mutated genes (SMGs) were identified by MutSigCV [9], MutSig2CV [10], and dNdScv [11], including 19 known colorectal cancer drivers (Figure 2B). Both groups exhibited the canonical driver-gene pattern involving TP53, APC, KRAS, and PIK3CA. Non-cold-region tumors carried a modestly higher number of mutated driver genes per tumor than cold-region tumors (mean 2.41 vs. 2.10, p = 0.04; Figure 2C), but no individual driver gene showed a frequency difference that remained statistically significant after multiple-testing correction (Figure 2D; Table S4).
Figure 2.
Genomic landscape of cold-region and non-cold-region MSS colorectal cancers. (A) Distribution of TMB in cold-region and non-cold-region MSS tumors. (B) Oncoprint showing the mutational landscape of significantly mutated genes identified across the entire dataset and in cold-region and non-cold-region tumors. (C) Distribution of the number of mutated driver genes per tumor in the two groups. (D) Mirrored bar plots comparing mutation frequencies of individual driver genes between cold-region and non-cold-region MSS tumors. No individual driver gene remained significantly different after multiple-testing correction. (E) Frequencies of chromosome arm-level copy-number gains and losses in cold-region and non-cold-region groups. Significantly altered arms within each group are outlined in black, and arms showing significant between-group differences are marked by green dots. (F) Genome-wide frequencies of focal somatic copy-number gains and losses in cold-region and non-cold-region tumors. (G) Focal cytobands showing nominal differences in gain or loss frequency between cold-region and non-cold-region tumors. p-values and FDR values are indicated in the corresponding panel where applicable.
We next asked whether the copy-number alteration (CNA) landscape differed between the two groups. In cold-region tumors, GISTIC2.0 [12] analysis identified 8 arm-level gains and 8 arm-level losses, including gains on 1q, 7p, 7q, 8q, 13q, 16p, 20p, and 20q, as well as losses on 1p, 14q, 15q, 17p, 17q, 18p, 18q, and 22q (Figure 2E). Between geographic groups, statistically detectable differences involved a limited subset of chromosome arms (FDR < 0.1; Figure 2E; Table S5). At higher resolution, we identified 95 recurrent focal copy-number alteration peaks across the entire dataset, comprising 55 amplification and 40 deletion regions (Figure S2), and recurrent focal alterations were observed in both groups (Figure 2F). Although five focal events achieved nominal significance, none remained significant after FDR adjustment (Figure 2G; Table S6). At the gene level, nominally higher frequencies of RBM38 (89.2% vs. 78.8%, p = 0.0465) and ADNP2 (87.7% vs. 76.6%, p = 0.0405) alterations in cold-region tumors were not retained after FDR adjustment (Figure S3; Table S7).
2.3. Comparisons of Mutational Signatures Between Cold-Region and Non-Cold-Region Tumors
To ascertain whether mutational signature profiles differed between the geographically distinct cohorts, we compared the activity of mutational signatures between cold-region and non-cold-region MSS CRCs. Across the cohort, signature contributions were heterogeneous. SBS1, SBS5, and ROS-associated mutational processes predominated in most tumors, whereas SBS93 was prominent in a subset of cases (Figure S4). To improve the robustness of evolutionary-stage comparisons, mutational signature analyses were restricted to samples containing at least 20 SNVs in each of the clonal and subclonal mutation sets (Table S8). Notably, cold-region tumors exhibited a significantly higher contribution of SBS93 than non-cold-region tumors (p = 0.015; Figure 3A and Figure S5). Within this filtered subset, the higher SBS93 contribution in cold-region tumors was also observed in both the clonal (early) and subclonal (late) compartments (p = 0.017 and p = 0.017, respectively; Figure 3B,C). Consistent with these findings, stratified tumor-level bootstrap analyses of posterior-averaged relative SBS93 exposure showed positive differences in mean SBS93 exposure between cold-region and non-cold-region tumors in the overall (mean difference = 0.0258, 95% CI: 0.00123–0.0523), clonal (0.0252, 95% CI: 0.00102–0.0511), and subclonal (0.0272, 95% CI: 0.00187–0.0558) analyses, with all confidence intervals excluding zero. In contrast, no significant differences were observed for the other evaluated mutational signatures. Within the cold-region group, the difference in SBS93 exposure between Beijing and Harbin tumors was not statistically significant (p = 0.42; Figure S6), although a significant difference was observed between the in-house and Yang cohorts, both of which originated from Beijing. An additional exploratory analysis showed no statistically significant association between SBS88 exposure and age at diagnosis (Pearson’s r = −0.0575, p = 0.135).
Figure 3.
Mutational signature profiles in the analyzed MSS CRC cohorts. (A–C) Mutational signature exposures were compared for the entire mutation set (A) and clonal (B) and subclonal (C) mutation sets. For the clonal and subclonal comparisons, relative exposure was calculated as the mean mutation-level posterior attribution probability within each tumor and corresponding mutation compartment. All three analyses included the same 569 tumors (49 cold-region and 520 non-cold-region tumors), each containing at least 20 SNVs in both the clonal and subclonal compartments. For each box plot, the center horizontal line indicates the median, and the lower and upper bounds of the box indicate the 25th and 75th percentiles, respectively. Whiskers show 1.5× the interquartile range (IQR). Two-sided Wilcoxon test—nominal p values are shown for the SBS93 comparisons in the panels. (D) Stacked bar plots showing the distribution of mutational-signature attribution across driver mutations in non-cold-region and cold-region tumors. Numbers indicate the ratio of SBS93-attributed driver mutations to total number of driver mutations in each group. The reported p = 0.087 was obtained using a two-sided Fisher’s exact test. (E) Signature attribution across driver-mutation categories, including APC c.3922A>T, other APC mutations, TP53 mutations and all remaining driver mutations. Numbers indicate SBS93-attributed mutations/total mutations in each category. (F) Multivariable linear regression analysis of age at diagnosis associated with clinicogenomic features. Forest plot displaying the estimated regression coefficients (black squares) and their corresponding 95% confidence intervals (horizontal lines) for diverse clinical and genomic variables. The vertical gray line indicates the null effect (coefficient = 0). Signature exposure was the MSA-estimated sample-level relative signature contribution (0–1, unitless), and regression coefficient is expressed in years per 1-unit increase in this contribution.
Within the annotated driver genes, SBS93-attributed mutations tended to be more frequent in cold-region tumors than in non-cold-region tumors (13/374 vs. 77/3850, p = 0.087; Figure 3D). Among individual driver events, APC c.3922A>T showed a relatively high proportion of SBS93 attribution (3/7) compared with other APC mutations (8/414), TP53 mutations (2/416), and all remaining driver mutations (77/3387) (Figure 3E). This recurrent APC alteration was also enriched in cold-region tumors (4/65 vs. 3/623; odds ratio = 13.44, p = 0.0021). Its SBS93 attribution was also numerically higher than that of other mutations sharing the same T[T>A]T context (3/7 vs. 5/24; odds ratio = 2.74, two-sided Fisher’s exact p = 0.335). All seven APC c.3922A>T calls were further supported by manual inspection of tumor and matched-normal sequencing alignments using Integrative Genomics Viewer (IGV), which showed tumor-specific alternative-read support on both strands without obvious alignment abnormalities in the representative reads examined (Figure S7). Association analyses using the original signature exposure estimates showed that tumors harboring APC mutations exhibited higher SBS93 exposure than wild-type cases (Figure S8, Table S9). After excluding driver-gene mutations from signature refitting, APC-mutant tumors continued to exhibit numerically higher mean SBS93 exposure than wild-type tumors (0.0384 vs. 0.0243; Wilcoxon p = 0.0547), indicating a directionally consistent association with attenuated statistical support. Together, these observations suggest a possible association between SBS93-related mutagenesis and recurrent APC alterations, particularly APC c.3922A>T.
To assess the clinical relevance of this mutational process, we performed multivariable linear regression modeling with age at diagnosis as the dependent variable. After adjustment for WGD molecular time, TNM stage, and tumor purity, we identified a significant inverse association between relative SBS93 exposure and age at diagnosis (estimate = −27.14, p = 0.0035; Figure 3F), indicating that increased SBS93 exposure was significantly associated with a younger age at diagnosis. In this model, a 0.1 increase in relative SBS93 exposure corresponded to an estimated 2.71-year lower age at diagnosis. This inverse association remained evident in a complementary model adjusting for geographic group, TNM stage, and tumor purity (estimate = −28.21, p = 4.46 × 10⁻⁵; Figure S9), as well as in an analysis restricted to non-cold-region tumors (estimate = −24.14, p = 0.0007; Figure S10). Furthermore, as expected, SBS1 showed a positive association with age at diagnosis (estimate = 33.85, p < 0.0001; Figure S11). Consistent positive associations were also observed in the geographic group-adjusted model (estimate = 32.87, p < 0.0001; Figure S12) and the non-cold-region-only model (estimate = 31.72, p < 0.0001; Figure S13).
2.4. No Consistent Between-Group Differences Were Detected in the Evaluated Genomic Instability Metrics
To assess genomic instability across the regional cohorts, we calculated multiple genomic instability metrics in cold-region and non-cold-region MSS tumors. Comparisons of chromosomal instability measures, including aneuploidy score, weighted genome instability index (wGII), and the proportion of the genome affected by loss of heterozygosity (pLOH), did not identify consistent between-group differences, and the baseline frequencies of WGD and TP53 mutation likewise did not show detectable differences (Figure 4A, Table S10). Homologous recombination deficiency (HRD)-related features, including the fraction of HRD-positive tumors (isHRD), HRD scores (HRDsum), telomeric allelic imbalance (HRD-AI), loss of heterozygosity events (HRD-LOH), and large-scale state transitions (HRD-LST), also showed no consistent statistically detectable group differences in these comparisons (Figure 4A).
Figure 4.
Comparisons of genomic instability metrics between cold-region and non-cold-region tumors. (A) Between-group comparisons of WGD status, TP53 mutation frequency, and metrics related to chromosomal instability (CIN), homologous recombination deficiency (HRD), and genomic scar across MSS tumors and the indicated WGD/TP53-stratified subsets. Symbol size denotes −log10(p-value), and color represents the direction and magnitude of the log2 effect (non-cold versus cold). No metric showed a consistent between-group difference after multiple-testing correction. (B) Heatmaps showing average-normalized chromosome-arm ploidy in cold-region and non-cold-region tumors across the MSS dataset and after stratification by WGD status. Asterisks denote statistical significance (* p < 0.05, ** p < 0.01). Arm-level differences are limited in number, most evident in the WGD-negative subset, and do not indicate a genome-wide shift in chromosomal imbalance between geographic groups.
After further stratification by WGD and TP53 status, the between-group differences in the evaluated genomic instability metrics were also not statistically significant (Figure 4A). Although pLOH showed a nominal difference in the WGD-negative TP53-mutant subset, this comparison did not remain significant after correction for multiple testing (p = 0.048, FDR = 0.214). Consistent with this, observed differences in arm-level aneuploidy within the WGD-negative subset involved a limited number of chromosome arms rather than a widespread shift across the genome (Figure 4B).
2.5. Timing of Copy-Number Gains and WGD Events
To determine whether the regional differences between the cohorts were evident in copy-number evolution, we evaluated the molecular timing of large-scale copy-number gains and whole-genome doubling. Using the cancerTiming method [13,14], we mapped copy-number gains onto a molecular-time scale ranging from 0 to 1, with lower values denoting earlier acquisition during clonal evolution. At the individual-tumor level, the mean proportions of copy-number gain events occurring around early clonal initiation (molecular time < 0.1) and during the pre-expansion phase of clonal evolution (molecular time > 0.9) were 27.3% and 39.0%, respectively, in cold-region tumors (31 WGD-negative tumors), compared with 20.0% and 28.1% in non-cold-region tumors (282 WGD-negative tumors). Consistently, the mean proportion of gain events with molecular times <0.1 or >0.9 was higher in cold-region tumors than in non-cold-region tumors (66.2% vs. 48.1%; two-sided Wilcoxon rank-sum test, p = 0.00214), indicating a more polarized distribution of gain timing. After retaining only gains in segments containing at least six mutations, the corresponding proportions remained higher in cold-region tumors (24 cold-region and 242 non-cold-region tumors) (54.3% vs. 31.7%; p = 0.0055). This pattern also remained significant in a multivariable linear regression adjusting for tumor purity and sequencing depth (p = 1.39 × 10⁻⁵; Figure S14). At the event level, the unadjusted comparison of overall copy-number gain timing between cold-region and non-cold-region tumors did not reach statistical significance (p = 0.052; Figure 5B). After adjustment for tumor purity and sequencing depth, the regional coefficient was −0.063 (95% CI, −0.123 to −0.002; p = 0.0419; Figure S15).
Figure 5.
Inferred copy-number gain and whole-genome doubling timing in cold-region and non-cold-region MSS CRC cohorts. (A) Distribution of the molecular timing of copy-number gain events across autosomes in cold-region and non-cold-region MSS CRCs. Top histograms summarize the number of timed gains per chromosome, and side density plots summarize the overall distribution of gain timing. Molecular time values range from 0 to 1, with smaller values indicating earlier events; gain events before 0.1 correspond to very early clonal initiation, whereas gain events after 0.9 correspond to the period immediately preceding clonal expansion. The extreme-timing fractions (66.2% vs. 48.1%) represent mean proportions across individual tumors (n = 31 cold-region vs. 282 non-cold-region tumors), with each tumor contributing one observation to the Wilcoxon rank-sum test. (B) Event-level distribution of copy-number gain timing (159 gain events from 31 cold-region tumors and 1843 gain events from 282 non-cold-region tumors). The nominal p-value indicated in the figure is based on an event-level comparison that does not account for within-tumor correlation among gain events. (C–E) WGD molecular timing in all evaluable WGD-positive tumors ((C); n = 29 cold-region vs. 283 non-cold-region tumors), TP53-mutant WGD-positive tumors ((D); n = 23 cold-region vs. 189 non-cold-region tumors) and TP53-wild-type WGD-positive tumors ((E); n = 6 cold-region vs. 94 non-cold-region tumors). (F) Multivariable logistic regression evaluating the association of SBS93 exposure with WGD timing, with adjustment for covariates. Samples with high SBS93 exposure were coded as 1. The cold-region group comprises cohorts from Beijing and Harbin; the non-cold-region group comprises the Guangzhou cohort. p-values are shown in the corresponding panels.
When the analysis was restricted to WGD-positive tumors with evaluable molecular timing (n = 312; 29 cold-region and 283 non-cold-region tumors), WGD events occurred significantly later in the evolutionary history of cold-region tumors than in non-cold-region tumors (p = 0.006, Figure 5C, Figure S16). Stratification by TP53 mutational status demonstrated that this delayed onset of WGD was more evident in TP53-mutant tumors (n = 212; 23 cold-region and 189 non-cold-region tumors; p = 0.018, Figure 5D), whereas TP53-wild-type tumors (n = 100; 6 cold-region and 94 non-cold-region tumors) showed no statistically significant between-group differences in WGD timing (p = 0.13, Figure 5E). These results indicate that the evolutionary divergence between cold-region and non-cold-region tumors is captured most clearly by later WGD, against a background of more polarized gain timing in the cold-region group.
Across the entire cohort, high SBS93 exposure was significantly associated with earlier WGD timing (odds ratio = 0.12, p = 0.0211; Figure 5F, Figure S17), whereas no significant association was observed between WGD timing and patient age at diagnosis (Figure 3F). Furthermore, we related WGD molecular time to genomic instability features and mutational burden and found that these relationships were selective rather than universal (Figure S18). In cold-region tumors, earlier WGD acquisition was associated with higher TMB (Pearson’s r = −0.38, p = 0.04). In contrast, in non-cold-region tumors, earlier WGD was associated with higher HRDsum (Pearson’s r = −0.16, p = 0.0075), HRD-AI (Pearson’s r = −0.18, p = 0.0019), HRD-LST (Pearson’s r = −0.18, p = 0.002), and the number of mutated driver genes (Pearson’s r = −0.13, p = 0.030; Figure S18). In keeping with these observations, WGD-positive tumors within each geographic group also showed higher aneuploidy, wGII, pLOH, and HRD-related metrics than WGD-negative tumors (Figure S19). Together, these findings indicate differences in the estimated molecular timing of copy-number gains and WGD between the analyzed northern cold-region and southern non-cold-region tumors, although the underlying causes of these differences remain uncertain.
2.6. Immunogenicity and Immune Evasion Landscapes of Cold-Region and Non-Cold-Region Tumors
We next evaluated whether regional cohort differences were accompanied by differences in tumor immunogenicity. Across the entire, clonal, and subclonal mutation sets, the comparisons did not identify consistent differences in neoantigen burden, neoepitope burden, immunogenicity metrics, or the fraction of neoantigens derived from driver genes; the same descriptive pattern was observed after stratification by WGD status (Figure 6A; Table S11). As expected, neoantigen and neoepitope burdens were strongly correlated with mutational burden in both groups (Figure S20). Although only a small fraction of mutations or predicted neoantigens were shared between regions (Figure 6B,C), recurrent neoantigens were dominated by canonical driver events (18/20; hypergeometric test, p = 1.5 × 10⁻¹⁴), and no individual neoantigen showed a frequency difference that survived multiple-testing correction (FDR > 0.05; Figure 6D; Table S12).
Figure 6.
Immunogenicity, immunoediting and genetic immune-evasion alterations in cold-region and non-cold-region tumors. (A) Summary of between-group comparisons of immunogenicity metrics in MSS tumors, shown for the entire cohort and after stratification by WGD status. Metrics include total, clonal and subclonal neoantigen and neoepitope burden, neoepitope rates, immunogenic measures, and the fraction of neoantigens derived from driver genes. Box size denotes −log10(p-value), and color represents the direction and magnitude of the log2 effect (non-cold versus cold). (B,C) Shared mutations (B) and shared neoantigens (C) detected in cold-region and non-cold-region tumors. (D) Frequencies of the 20 most recurrent neoantigens across the two groups, and neoantigens derived from driver genes are marked in red. (E) Comparison of the extent of immunoediting (left panel) and the fraction of immunoedited tumors (right panel) across the entire evolutionary process between the two groups. (F) Gene-level frequencies of allelic loss in antigen-presentation pathway genes and IFN-γ pathway genes in cold-region and non-cold-region tumors. Asterisks denote nominally significant between-group differences before multiple-testing correction. No gene showed a consistent between-group difference after correction for multiple comparisons. (G,H) Summary of antigen-presentation pathway alterations (G) and IFN-γ pathway alterations (H), showing the proportion of tumors with any allelic loss in this pathway (left panel) and the number of affected antigen-presentation genes per tumor (right panel). (I,J) Frequencies of HLA LOH (I) and B2M LOH (J).
Analysis of immunoediting and genetic immune evasion provided further descriptive information on the two cohorts. Immune dN/dS estimates for the entire and clonal mutation sets did not reveal a consistent between-group difference in the available cases, and the proportions of tumors classified as immunoedited were not detectably different (Figure 6E and Figure S21). At the genomic level, comparisons of allelic losses affecting antigen-presentation or IFN-γ signaling genes did not identify consistent differences after the reported corrections (Figure 6F–H and Figure S22; Table S13), nor did the comparison of human leukocyte antigen loss of heterozygosity (HLA LOH; p = 0.790; Figure 6I). Although B2M loss of heterozygosity appeared more frequent in non-cold-region tumors in the unadjusted comparison, it did not remain significant after multiple-testing correction (p = 0.032, FDR = 0.491; Figure 6J).
2.7. Sensitivity Analysis Using a Balanced Cohort Subset
To assess sensitivity to unequal cohort sizes, we compared a random balanced subset of 50 cold-region and 50 non-cold-region tumors with the full cohort (Table S14). In this subset, higher estimated SBS93 contributions remained detectable in the entire, clonal, and subclonal mutation sets (nominal p = 0.036, 0.038, and 0.039, respectively), as did the higher extreme gain-timing proportion in cold-region tumors (64.4% versus 42.1%; p = 0.022). The WGD-timing difference remained directionally similar (mean 0.741 versus 0.675), with greater uncertainty (p = 0.123), and GISTIC identified fewer recurrent focal CNA peaks in the smaller subset (19 versus 95 in the full cohort).
3. Discussion
Recent studies have highlighted geography-linked mutational heterogeneity in CRC [3], but whether such variation extends to the molecular timing of chromosomal events remains less well understood. By combining an analysis of temperature and CRC incidence with a genomic comparison of Chinese MSS CRC cohorts from climatically contrasting cities, we identified regional differences in estimated SBS93 contribution and molecular evolutionary timing. In the pooled comparison, cold-region tumors from northern cohorts showed higher estimated SBS93 activity, including APC-associated mutations, although this SBS93 signal depended strongly on the in-house Beijing cohort, as well as differences in copy-number gain and WGD timing compared with non-cold-region tumors from Guangzhou. These findings suggest that geographic heterogeneity in the analyzed MSS CRC cohort may involve both mutational processes and the timing of chromosomal alterations.
A feature of cold-region tumors was the higher estimated SBS93 contribution, with some SBS93-attributed mutations mapping to the APC gene. This difference was observed in both clonal and subclonal mutation sets, indicating that the regional variation in SBS93 contribution was detectable across different evolutionary phases. APC, a core regulator of WNT signaling, is a well-established early driver of the conventional adenoma–carcinoma sequence in colorectal cancer [15,16]. We also identified SBS93-attributed mutations involving APC, including the APC c.3922A>T substitution, although the number of such events was limited. Recent work has also highlighted SBS93 as an important mutational process in colorectal cancer and linked it to transcriptional strand bias [5]. Consistent with that study [5], we also observed a strong association between higher SBS93 exposure and younger age at diagnosis. However, the etiology of SBS93 remains unresolved, and whether ambient temperature contributes to this mutational signature remains to be determined. Future studies integrating detailed environmental exposure data with genomic profiling, complemented by experimental investigations, may help elucidate the factors underlying its regional variation.
A second major distinction between cold-region and non-cold-region tumors lay in the molecular timing of copy-number evolution. At the tumor level, cold-region tumors showed a more polarized distribution of gain timing, with a greater fraction of gains arising either at tumor initiation or immediately preceding the onset of clonal expansion, together with later whole-genome doubling. This gain-timing pattern persisted after excluding low-mutation segments and adjusting for tumor purity and sequencing depth (Figure S14). Recent studies have revealed that changes in the temporal ordering of copy-number gains can promote tumor expansion [13,17], and that WGD can buffer deleterious alterations while increasing genome plasticity [18,19,20]. In this context, our findings suggest that cold-region and non-cold-region tumors may differ in the temporal organization of chromosomal alterations during tumor evolution. Although higher SBS93 exposure was associated with earlier WGD in the pooled analysis, the between-region comparison showed later WGD in cold-region tumors. These associations summarize different comparisons and may reflect regional or cohort-related heterogeneity. We therefore discuss them separately rather than inferring a direct mechanistic relationship between SBS93 and WGD timing. Although no widespread statistically significant between-group differences were detected in individual driver mutation frequencies, focal copy-number alterations, genomic instability metrics, or most immune-related features, some potentially meaningful differences may nevertheless have gone undetected.
Despite integrating epidemiological and genomic data from multiple sources, several limitations should be acknowledged. The global analysis was ecological in nature, relying on country-level colorectal cancer incidence and mean annual temperature. The HDI-adjusted, data-derived temperature transition at 15.95 °C was therefore used as an operational threshold for geographic stratification rather than as a biologically established temperature boundary. Such an association cannot establish individual temperature exposure or distinguish the potential influence of temperature from other national-level factors, including socioeconomic development, dietary patterns, obesity prevalence, cancer screening practices, and registry-related differences. The genomic comparison included four cohorts from three Chinese cities, with the northern cold-region cohorts comprising samples from Beijing and Harbin and the southern non-cold-region cohort comprising samples from Guangzhou. All tumors in the non-cold-region group originated from a single Guangzhou cohort, whereas the cold-region group comprised separate cohorts from Beijing and Harbin. Geographic grouping was therefore completely confounded with cohort membership, making it impossible to distinguish regional or climatic associations from cohort-specific clinical and technical factors. The location of sample collection may not accurately reflect patients’ long-term residential or environmental exposure histories. Detailed individual-level information on dietary habits, smoking, alcohol consumption, body mass index, physical activity, gut microbiota, occupational or environmental exposures, socioeconomic characteristics, and access to colorectal cancer screening was not consistently available. Potential differences in population genetic background were not specifically evaluated. These unmeasured factors may have contributed to the observed regional differences but could not be adequately assessed. Although a unified bioinformatics pipeline was applied, differences in sample processing, sequencing platforms, capture strategies, sequencing depth, and tumor purity across cohorts may have influenced mutational signature estimation and molecular timing analyses.
In addition, the small cold-region group (n = 65), together with incomplete clinical annotations, limited the precision and sensitivity of the between-group comparisons. A single balanced random subset (50 tumors per group; Table S14) retained several of the observed patterns, although the statistical evidence varied across outcomes. TNM stage was recorded for 42 cold-region tumors, all from the in-house Beijing cohort, whereas venous and perineural invasion were recorded for only 9 cold-region tumors, all from the Hu Harbin cohort (Table S3). This cohort-specific availability, as well as differences in referral and case selection, could contribute to the observed TNM-stage composition. Primary tumor sidedness and treatment history were unavailable for all 65 cold-region tumors (Table S3), limiting adjustment for several potentially relevant clinical factors. The absence of a statistically detectable difference in individual driver mutation frequencies, focal CNAs, genomic instability, or immune-related features should therefore be interpreted within the power of this exploratory comparison and does not constitute an equivalence analysis. For SBS93, p-values in the entire, clonal, and subclonal comparisons were nominal and were not FDR-adjusted across tested mutational signatures or analysis compartments; these signature observations warrant independent confirmation. The use of single-sample bulk whole-exome sequencing also restricted the resolution of mutational signature attribution and evolutionary timing reconstruction. The observed differences should therefore be interpreted as associations between the analyzed regional cohorts rather than evidence that ambient temperature directly influences mutagenesis or tumor evolutionary timing. Future studies involving larger, independently sampled cohorts, harmonized sequencing protocols, detailed individual exposure histories collected through standardized assessments of diet, physical activity, body mass index, smoking, and alcohol use, and longitudinal or multi-region genomic profiling will be needed to disentangle climatic and non-climatic influences on colorectal cancer evolution. An additional limitation of this study is the lack of independent, source-matched validation. No non-cold-region samples were sequenced alongside our in-house Beijing cohort, and we were also unable to identify a sufficiently large, publicly accessible cohort of MSS CRC from Northern China for independent validation of SBS93 attribution and molecular timing in the present within-China comparison. Therefore, potential cohort-specific technical effects cannot be entirely excluded, and the observed differences cannot be conclusively attributed to geographical or climatic factors. Future studies using independent cohorts with harmonized sequencing protocols will be essential to validate these findings.
We also compared SBS93-attributed mutations with other mutations within each cohort using sample-level mean VAF, positive-to-negative strand-count ratios, and mean within-read positions (Figure S23). The mean VAF was lower for SBS93-attributed mutations in the Guangzhou and in-house Beijing cohorts, while only the in-house Beijing cohort showed a significant difference in mean within-read position. No cohort showed a significant difference in the positive-to-negative strand-count ratio. The Zhao/SYSUCC Guangzhou and in-house Beijing cohorts, which had the largest sample sizes, showed broadly similar directions of difference in VAF and within-read position. Pooling larger, technically harmonized datasets may help clarify the stability and reproducibility of these trends, but it cannot by itself eliminate batch-specific biases. However, these descriptive comparisons cannot fully exclude sequencing artifacts. The strand-count ratio does not assess all forms of read-orientation bias, and VAF and read positions may vary with biological characteristics, read length, alignment, and library preparation. Source-specific technical effects therefore remain a concern, especially because cohort and region cannot be disentangled in this study. Independent cohorts with comparable sample processing and access to harmonized aligned-read and library information are needed to validate SBS93 attribution.
In summary, by integrating climatic and epidemiological data with whole-exome sequencing data, we identified differences in mutational processes and molecular evolutionary timing between cold-region and non-cold-region MSS colorectal cancers. In the analyzed cohorts, cold-region tumors from the northern Chinese cities showed higher estimated SBS93 contributions and differences in inferred copy-number gain and WGD timing relative to non-cold-region tumors from Guangzhou. These findings extend our understanding of geographic heterogeneity in MSS colorectal cancer, highlighting distinct patterns of mutational processes and evolutionary timing across regions with contrasting climatic backgrounds.
4. Materials and Methods
4.1. Cohort Assembly and Sample Stratification
Whole-exome sequencing data were assembled from four colorectal cancer cohorts, including an in-house Beijing cohort (n = 58, fresh-frozen tissues, Illumina HiSeq, Novogene, Beijing, China), the SYSUCC Changkang Project cohort from Guangzhou (n = 1015, formalin-fixed paraffin-embedded [FFPE] tissues, Illumina Novaseq, HaploX Biotechnology, Shenzhen, China) [21], the Yang cohort from Beijing (n = 20, Illumina HiSeq, Inc., San Diego, CA, USA) [22], and the Hu cohort from Harbin (n = 14, FFPE tissues, Illumina Novaseq, Novogene, Beijing, China) [23]. To establish a comparable analytical cohort, we excluded tumors exhibiting platinum- or ultraviolet-induced mutational signatures (SBS31, SBS35, or SBS7), tumors reported as non-colorectal or non-primary colorectal malignancies, tumors classified as MSI or as the POLE subtype, reported hypermutated tumors, samples with fewer than 50 somatic SNVs, and samples with tumor purity below 25%. The Hu cohort comprised patients with synchronous right- and left-sided primary colorectal cancers. To ensure one tumor-level observation per patient, only the tumor with the highest purity was retained per patient for our analyses [24]. After filtering, 688 tumors were retained for analysis, including 9 from the Hu cohort (mean sequencing depth, 71.0×; mean tumor purity, 46.8%), 14 from the Yang cohort (159.0×; 55.5%), 623 from the Zhao cohort (206.0×; 48.2%), and 42 from the in-house cohort (217.0×; 55.7%) (Table S15). The mean sequencing depth of tumor samples was 203.93×, with an interquartile range of 154.7×–231.48×. All cohorts received approval from the respective institutional ethics committees, and written informed consent was obtained from all participants. This study strictly adhered to the ethical principles of the Declaration of Helsinki. Sample-level clinical characteristics and missing-data annotations are provided in Supplementary Table S15. Meanwhile, to facilitate the assessment of clinical data completeness across cohorts, we additionally summarized clinical variables by source cohort and geographic region, explicitly reporting variable-specific denominators and missing-data counts (Table S3).
To explore the relationship between climate and CRC incidence, global incidence data for 185 countries in 2022 were obtained from GLOBOCAN 2022, produced by the International Agency for Research on Cancer (IARC). Correspondingly, global historical climate observations (1991–2020) were collected from the Climate Change Knowledge Portal (CCKP). Country-level Human Development Index (HDI) values for 2022 were obtained from the United Nations Development Programme (UNDP) and incorporated as a covariate to account for differences in socioeconomic development. Countries with missing HDI data were excluded from the HDI-adjusted analysis. For the sequencing cohorts, high-resolution meteorological data for Beijing, Harbin, and Guangzhou were extracted from the ECMWF ERA5-Land dataset.
The nonlinear relationship between country-level mean annual temperature and CRC age-standardized incidence rate (ASR) was modeled using a generalized additive model (GAM), with mean annual temperature fitted as a smooth term and HDI included as a covariate. The model was estimated using restricted maximum likelihood (REML). To quantitatively define the major transition in the temperature–incidence relationship, the second derivative of the fitted temperature function was calculated using central finite differences, and the transition temperature was defined as the negative-to-positive zero crossing of the second derivative. The uncertainty of the estimated transition was assessed using 1000 country-level bootstrap resamplings, with the HDI-adjusted GAM refitted and the transition re-estimated in each replicate. A 95% percentile bootstrap interval was calculated from the resulting distribution of transition estimates.
The resulting transition temperature was used as an operational reference for subsequent geographic stratification of the sequencing cohorts. Applying this reference, MSS CRC samples were categorized into two groups based on 1991–2020 annual means: a cold-region group comprising cohorts from Northern China (Harbin: 3.69 °C; Beijing: 10.63 °C) and a non-cold-region group comprising a cohort from Southern China (Guangzhou: 21.49 °C).
4.2. Whole-Exome Sequencing and Data Processing
For the in-house cohort, paired tumor and matched normal samples underwent whole-exome sequencing after DNA quality assessment by agarose-gel electrophoresis and Qubit-based quantification. Samples with DNA concentrations of at least 20 ng/μL and total input of at least 0.6 μg were used for library construction. Genomic DNA was fragmented to 180–280 bp, libraries were prepared with Agilent SureSelect Human All Exon V5/V6 capture kits, and qualified libraries were sequenced as 150-bp paired-end reads on the Illumina HiSeq platform with target depths of 200× for tumors and 100× for matched normal samples. Across cohorts, raw sequencing data were aligned to the GRCh38 reference genome with BWA-MEM (v0.7.17) [25]. Alignments were converted to BAM, sorted, and indexed with SAMtools (v1.16.1) [26], PCR duplicates were marked with Picard MarkDuplicates (v3.0.0, https://broadinstitute.github.io/picard/, accessed on 6 March 2024), and base-quality score recalibration was performed with GATK (v4.4.0) [27]. Primary sequencing quality control included assessment of alignment performance, insert-size distributions, and depth profiles before downstream somatic variant and copy-number analyses.
4.3. Somatic Variant Identification
High-confidence somatic SNVs and indels were identified using an ensemble variant calling strategy that combined Mutect2 (GATK v4.4.0) [28], VarScan2 (v2.4.6) [29], Strelka2 (v2.9.10) [30], MuSE (v2.0) [31], BCFtools (v1.16) [32], and SomaticSniper (v1.0.5.0) [33] on paired tumor–normal samples aligned to GRCh38. Candidate variants were reformatted into a common representation and retained only when supported by at least two independent callers. Additional filtering included matched-normal review of variant allele counts, local realignment-based review of candidate loci, panel-of-normals filtering, and exclusion of likely germline variants using gnomAD [34].
4.4. Identifying Microsatellite Instability and POLE Status
Microsatellite status was determined from tumor–normal exome data with MSIsensor (v0.6) [35] run in paired mode with default settings. Samples with an MSIsensor score below 3.5 were classified as MSS, and those with scores of 3.5 or higher were classified as MSI. Tumors with DNA polymerase proofreading deficiency were identified by pathogenic hotspot variants in the exonuclease domains of POLE or POLD1 [36,37,38,39,40,41,42,43]. When such variants were present, the sample was assigned to the POLE subtype irrespective of the MSIsensor result. MSI tumors, POLE-subtype tumors, and other hypermutated samples were excluded from the final analytic MSS cohort.
4.5. Copy-Number Alteration Calling
Allele-specific copy-number profiles were inferred from matched tumor–normal data with ASCAT (v3.2.0) [44], FACETS (v0.6.2) [45], Sequenza (v3.0.0) [46], TitanCNA (v1.40.0) [47], and Sclust (v1.1) [48]. To obtain a consensus copy-number segmentation for downstream evolutionary analyses, we adopted the consensus integration framework proposed by Dentro et al. [49] to derive a consensus breakpoint set for each sample from the five initial outputs, and subsequently defined consensus segments. Specifically, outlier purity and ploidy estimates were filtered with predefined tolerance windows (ploidy tolerance 1.0; purity tolerance 0.2), after which consensus tumor purity and ploidy were derived from the density peaks of the retained estimates. Allele-specific copy-number calls from each method were then remapped to the consensus segments, and a multi-step voting procedure that incorporated local genomic context was used to assign the major copy-number and minor copy-number state for each segment. These consensus segments, purity estimates, and ploidy estimates were used as the primary copy-number inputs for the evaluation of clonality and the molecular timing of WGD and gain events.
4.6. Subclonal Reconstruction
Somatic mutations were assigned to clonal and subclonal populations using PyClone (v0.13.1) [50]. PyClone models variant allele frequencies (VAFs) using a beta-binomial framework to account for fluctuations in sequencing depth and employs a Dirichlet process mixture model to infer the number of mutation clusters without prespecifying cluster number. Posterior distributions were estimated by Markov chain Monte Carlo (MCMC) sampling with 100,000 iterations and 1000 burn-in iterations to ensure model convergence and stability. For each mutation, cancer cell fraction (CCF) and cluster assignment were then inferred. Mutation clusters were ranked according to their CCF, and the cluster with the highest CCF was defined as the founder clone; mutations assigned to this cluster were classified as clonal, whereas mutations assigned to all remaining clusters were classified as subclonal.
4.7. WGD Classification
Whole-genome doubling was evaluated from the consensus allele-specific copy-number profiles using the WGD algorithm described by Dewhurst et al. and Carter et al. [51,52]. For each tumor, we calculated the proportion of the autosomal genome with a major copy number greater than or equal to 2 (Pm). Samples with Pm greater than or equal to 50% were treated as WGD candidates. To assess the significance of this duplication event while accounting for chromosome-arm-specific gain and loss tendencies, arm-level major and minor copy-number states were summarized from segment-level calls, and a permutation framework was used to compare the observed burden of arm-level gains with the burden expected under the sample-specific copy-number background. WGD status was then assigned with a ploidy-aware decision rule: tumors were classified as WGD-positive when ploidy was less than or equal to 3 with p less than or equal to 0.001, when ploidy was 4 with p less than or equal to 0.05, when ploidy was 5 with p less than or equal to 0.5, or when ploidy was at least 6. The p ≤ 0.5 threshold for tumors with ploidy = 5 was adopted from the fun.GD.status() function available in the publicly accessible R code of López et al. (GDsims_functions.R) [20] and Qiu et al. (GD.functions.R) [53]. Compared with the original algorithm described by Dewhurst et al., which directly classified all tumors with ploidy ≥ 5 as WGD-positive, this code-based criterion introduces an additional p-value requirement for the ploidy-5 category, thereby providing a more restrictive classification intended to reduce potential WGD overclassification.
4.8. Molecular Timing of Copy-Number Gain and WGD Events
Molecular timing of copy-number gains and WGD events was estimated with the cancerTiming method [13,14]. In gained regions, clonal mutations that occurred before the gain were expected to be duplicated and therefore to appear as double-copy mutations, whereas mutations that occurred after the gain remained single-copy. The relative counts of single-copy and double-copy mutations were used to estimate the molecular timing of gain events for copy-number states with a unique simplest history, including events with major/minor copy-number states of 2/0, 2/1, 2/2, or 3/1. In WGD-positive tumors, these gained segments were combined and weighted by their mutation counts to derive the molecular timing of the WGD event. Gain events were displayed individually to describe their timing distributions, while gain-timing polarization was assessed using one summary per WGD-negative tumor. For each WGD-negative tumor, we calculated the proportion of timed copy-number gain events with molecular time <0.1 or >0.9; this per-tumor summary was used for between-group comparisons using a two-sided Wilcoxon rank-sum test. As a sensitivity analysis, gains in segments with fewer than six mutations were excluded before recalculating the per-tumor proportions. We further used multivariable linear regression to evaluate the association between regional group and the per-tumor extreme-timing proportion after adjustment for tumor purity and sequencing depth (Figure S14). Event-level molecular-time estimates were obtained from the CancerTiming results, and their corresponding confidence intervals were estimated using a parametric bootstrap procedure. The molecular-time estimates (Gain.MolecularTime) and the lower and upper bounds of the 95% confidence intervals (Time.lower.CI and Time.upper.CI, respectively) are provided in Table S16. Confidence intervals that could not be estimated are indicated as NA. For comparisons of WGD molecular timing, each evaluable WGD-positive tumor contributed a single timing estimate.
4.9. Mutational Signature Extraction and Mutation-Level Attribution
Mutational signatures were extracted from the SBS96 trinucleotide matrices of MSS colorectal tumors using SigProfilerExtractor (v1.1.25) [54]. All signature extraction runs were performed using random initialization (NMF_init = “random”) and default parameters, evaluating 1 to 10 signature solutions across 500 non-negative matrix factorization (NMF) replicates [55]. The optimal number of de novo signatures was determined by minimizing the mean cosine distance between the reconstructed and observed mutational spectra while ensuring that the average stability remained above 0.8.
The extracted de novo signatures were decomposed into COSMIC (v3.4) reference signatures using SigProfilerAssignment (v0.1.9), based on the GRCh38 reference genome [55]. An initial unrestricted decomposition was used to identify samples with atypical or non-target mutational profiles. The sample-level signature exposures obtained from the initial unrestricted COSMIC decomposition are provided in Table S17. Before the final extraction, eight outlier samples with POLE-like, MSI-like, or atypical SBS12-dominant mutational profiles were excluded from the mutation signature analyses to avoid distortion by extreme mutational processes [56]. The de novo extraction was then repeated in the refined MSS cohort, and the final COSMIC decomposition was restricted to signature categories considered relevant to the target MSS CRC context, excluding MMR-deficiency, polymerase-deficiency, BER-deficiency, treatment-, chemotherapy-, tobacco-, UV-, artifact-, and lymphoid-associated signatures (Table S18).
A signature corresponding to SBS93 emerged during the de novo extraction procedure. To further support its annotation, the extracted SBS96 profile was compared with all COSMIC v3.4 SBS reference signatures using cosine similarity. The extracted profile showed the highest similarity to SBS93 (cosine similarity = 0.8843), substantially exceeding the next-best matches, including SBS40b (0.7247) and SBS9 (0.6847). The extracted SBS93-like mutational spectrum and the corresponding COSMIC v3.4 SBS93 reference spectrum are presented in Figure S24 to facilitate direct comparison of their SBS96 profiles.
For subsequent signature refitting, the candidate reference signature set was supplemented with COSMIC SBS2, SBS13, SBS18, and SBS88 to account for additional biologically plausible mutational processes, including potentially tumor-type-relevant signatures [3,5]. Sample-level signature exposures were estimated by refitting the observed SBS96 spectra against the predefined candidate signature set using the Mutational Signature Attribution (MSA) framework (v2.0) [57,58], with 200 bootstrap replicates performed to assess the stability and uncertainty of the exposure estimates (Table S19). Given their shared etiology, the exposures of SBS18 and SBS36 were aggregated into a single composite “ROS” signature in the final contribution matrix [59].
For mutation-level attribution, the trinucleotide context of each somatic SNV was combined with the corresponding sample-level signature exposures in a Bayesian framework to estimate posterior probabilities of attribution to individual signatures. Each mutation was assigned to the signature with the highest posterior probability. This procedure provides a relative probabilistic attribution rather than a definitive assignment of mutational origin. For comparisons across evolutionary states, relative signature exposure was calculated for each tumor by averaging the mutation-level posterior attribution probabilities across SNVs in the corresponding overall, clonal, and subclonal mutation sets, with clonal and subclonal status defined using the corresponding partitions [60]. To reduce instability arising from sparse mutation spectra, comparisons of signature contributions between cold-region and non-cold-region tumors across clonal and subclonal states were restricted to samples containing at least 20 SNVs in both the clonal and subclonal components.
To further quantify group-level uncertainty in SBS93 exposure estimates, we performed 5000 stratified tumor-level bootstrap resamplings using these posterior-averaged relative exposure estimates. Tumors were sampled with replacement within each geographic group while preserving the original group sizes. For each bootstrap iteration, we calculated the mean SBS93 exposure in each group and the corresponding between-group difference (cold-region minus non-cold-region). Percentile-based 95% confidence intervals were obtained from the 2.5th and 97.5th percentiles of the bootstrap distributions. The analysis was performed separately for the overall, clonal, and subclonal compartments using the same subset of tumors meeting the minimum mutation-count criterion.
To evaluate potential sequencing-related biases, SBS93-attributed mutations were compared with mutations attributed to other signatures within each source cohort (Figure S23). Three metrics were calculated separately for the two mutation classes within each sample: (i) mean variant allele frequency (VAF), with each mutation’s VAF calculated from alternative- and reference-allele supporting read counts; (ii) the number of mutations on the positive strand divided by the number on the negative strand; and (iii) mean position of the mutations within sequencing reads. The resulting sample-level measurements were compared between mutation classes within each source cohort. The strand-count ratio represents a count-based measure of strand imbalance rather than a formal transcriptional-strand-bias test.
For regression analyses of signature presence, sample-level signature attributions were dichotomized using their confidence intervals, with presence defined as a lower confidence limit greater than zero and absence defined as a lower confidence limit of zero. If a signature was present in at least 70% of cases, it was further dichotomized into groups above and below the median of attributed mutation counts. These binary attributions served as dependent variables in logistic regression models [61]. TNM stage and tumor purity were included as covariates to adjust for potential confounding.
Linear regression models were fitted to evaluate the association between age at diagnosis and SBS93 exposure [62]. SBS93 exposure was expressed as a relative signature contribution ranging from 0 to 1. The primary age-association model (Figure 3F) included WGD molecular time, TNM stage, and tumor purity as covariates (n = 307). Additional sensitivity analyses were performed using a model adjusting for geographic group, TNM stage, and tumor purity without WGD molecular time (n = 657; Figure S9), and a model restricted to non-cold-region tumors adjusting for TNM stage and tumor purity (n = 615; Figure S10). SBS1 was also evaluated as an internal positive control in all three age-association models, replacing SBS93 while retaining the corresponding sample sets and other covariates (Figures S11–S13).
4.10. Genome-Instability Metrics
Aneuploidy score was defined as the number of altered autosomal chromosome arms, excluding the short arms of acrocentric chromosomes [63,64]. The weighted genome instability index (wGII) was computed by determining the proportion of aberrant bases relative to the nearest integer ploidy per autosome, followed by an across-chromosome average [51]. The proportion of loss of heterozygosity (pLOH) was defined as the fraction of the genome in segments with a major copy number greater than or equal to 1 and a minor copy number equal to 0 [65]. HRD was assessed using scarHRD [66], which integrates three types of HRD-associated genomic scars, including HRD-LOH (loss of heterozygosity), HRD-AI (telomeric allelic imbalance), and HRD-LST (large-scale transitions), and the combined HRDsum was used to classify samples as HRD-positive when HRDsum was at least 42.
4.11. Immunogenicity, Immunoediting, and Immune-Evasion Analyses
HLA class I genotypes were determined from matched-normal BAM files using POLYSOLVER [67], and HLA-I loss of heterozygosity (LOH) was evaluated using LOHHLA [68]. HLA alleles were considered lost when the estimated allele-specific copy number was below 0.5 and Pval_unique was below 0.1; samples with unresolved calls and no positive LOH evidence were classified as undetermined. For neoantigen prediction, all mutant 8–11-mer peptides derived from nonsynonymous mutations were evaluated against individual HLA-I genotypes using NetMHCpan v4.1 [69]. Weak and strong binders were defined by %Rank_EL (eluted-ligand rank score) <2.0% and <0.5%, respectively. Neoantigen and neoepitope burdens represent mutations giving rise to predicted binding peptides and the number of predicted neoepitopes, respectively, normalized per megabase of sequenced genomic territory. Mutation-level immunogenicity was additionally characterized using the patient harmonic-mean best rank (PHBR) [5,70]. No patient-specific RNA-expression filter was applied to neoantigen or neoepitope predictions because matched tumor RNA-seq data were not available.
Immunoediting was assessed using the immune dN/dS approach with SOPRANO [71] (ExonicOnly mode and 192-trinucleotide-context correction). Patient-specific immunopeptidomes included HLA-I-binding 9-mers (%Rank_EL < 0.5%) supported by validated IEDB peptide records, restricted to genes with a mean TPM > 1 in external pan-cancer TCGA data. This external expression-based reference criterion was used only for immune dN/dS analysis, not to filter tumor neoantigen predictions. Among tumors with evaluable immune dN/dS estimates, values < 1 were classified as immunoedited and values ≥ 1 as non-immunoedited. Genetic immune-evasion events affecting antigen-presentation and IFN-gamma pathway genes were assessed using somatic variants and consensus allele-specific copy-number profiles. At the gene level, LOH was defined as major copy number ≥ 1 and minor copy number = 0, and homozygous deletion as both allele copy numbers = 0. B2M LOH was called using the gene-level copy-number criterion, separately from HLA-I allele-specific LOH assessed by LOHHLA. Detailed algorithms, annotation resources, and gene sets are provided in the Supplementary Methods.
4.12. Statistical Analysis
All statistical analyses were performed in R (v4.3.2). Categorical variables were compared using two-sided chi-square tests, with Fisher’s exact tests applied when any expected cell count was less than 5. Continuous variables were compared between two independent groups using two-sided Wilcoxon rank-sum tests, a non-parametric method that does not require normally distributed data. Associations between continuous variables were assessed using Pearson’s correlation test. For multiple comparisons, p-values were adjusted using the false discovery rate (FDR) procedure. A two-sided p value or FDR-adjusted p value < 0.05 was considered statistically significant. In box plots and violin plot insets, boxes represent the interquartile range, center lines represent medians, whiskers extend to the most extreme values within 1.5 times the interquartile range, and points beyond that range are shown as outliers. As an exploratory sensitivity analysis of unequal group sizes, we randomly selected 50 tumors from each geographic group and repeated the selected comparisons summarized in Table S14. The p-values for SBS93 exposure comparisons in the entire, clonal, and subclonal mutation sets were not FDR-adjusted. Meanwhile, for the regional SBS93 sensitivity analysis, a multivariable linear regression model included geographic group, tumor sequencing depth, and tumor purity (n = 679; Figure S5).
4.13. Software and Code Availability Statement
No novel bioinformatics software was developed in this study. All computational analyses were conducted using previously published software tools and established analytical methods. The source code or official project websites for the principal software packages are provided below. Allele-specific copy-number profiles were generated using ASCAT v3.2.0 (https://github.com/VanLoo-lab/ascat, accessed on 13 May 2024), FACETS v0.6.2 (https://github.com/mskcc/facets, accessed on 13 May 2024), Sequenza v3.0.0 (https://sequenzatools.bitbucket.io/, accessed on 13 May 2024), TitanCNA v1.40.0 (https://github.com/gavinha/TitanCNA, accessed on 13 May 2024), and Sclust v1.1 (https://cunlab.org/2018/05/25/sclust/, accessed on 13 May 2024). Consensus copy-number integration was based on the previously published framework of Dentro et al., for which reference implementations are publicly available through consensus-bp (https://github.com/morrislab/consensus-bp, accessed on 24 August 2024), icgc_consensus_copynumber (https://github.com/sdentro/icgc_consensus_copynumber, accessed on 24 August 2024), and icgc_consensus_purity (https://github.com/sdentro/icgc_consensus_purity, accessed on 24 August 2024). WGD classification followed a published simulation-based framework, for which an implementation is publicly available at (https://github.com/ucbtsl1/lopez_etal_2019_wgd-cancer/blob/master/GDsims_functions.R, accessed on 16 December 2024). The specific classification criteria applied in this study are detailed in the Materials and Methods. Molecular timing of copy-number gains and WGD events was estimated using cancerTiming (https://github.com/epurdom/cancerTiming, accessed on 28 February 2025). Clonal and subclonal reconstruction was performed using PyClone v0.13.1 (https://github.com/Roth-Lab/pyclone, accessed on 1 May 2025). Mutational signatures were extracted using SigProfilerExtractor v1.1.25 (https://github.com/SigProfilerSuite/SigProfilerExtractor, accessed on 8 June 2025), decomposed and assigned using SigProfilerAssignment v0.1.9 (https://github.com/SigProfilerSuite/SigProfilerAssignment, accessed on 8 June 2025), and quantified with confidence intervals using MSA v2.0 (https://gitlab.com/s.senkin/MSA, accessed on 19 January 2026). HLA class I typing was performed using POLYSOLVER (https://software.broadinstitute.org/cancer/cga/polysolver, accessed on 29 September 2025), and HLA loss of heterozygosity was evaluated using LOHHLA (https://github.com/mskcc/lohhla, accessed on 25 October 2025). Neoepitope prediction was performed using NetMHCpan v4.1 (https://services.healthtech.dtu.dk/services/NetMHCpan-4.1/, accessed on 3 November 2025), and immune dN/dS was calculated using SOPRANO (https://github.com/instituteofcancerresearch/SOPRANO, accessed on 7 January 2026). B2M loss of heterozygosity was assessed from consensus allele-specific copy-number profiles using the criteria described in the Supplementary Methods. Additional genomic analyses: Recurrent copy-number alterations were identified using GISTIC2.0 v2.0.23 (https://github.com/broadinstitute/gistic2, accessed on 23 May 2025), and homologous recombination deficiency was evaluated using scarHRD (https://github.com/sztup/scarHRD, accessed on 4 October 2025). Statistical analyses were performed using R v4.3.2 (https://www.r-project.org/). The computational methods, software versions, principal parameters, and study-specific analytical criteria are described in the Materials and Methods and Supplementary Methods.
Supplementary Materials
The following supporting information can be downloaded at https://www.mdpi.com/article/10.3390/ijms272210389/s1, References [72,73,74,75,76,77,78,79,80] are cited in the Supplementary Materials.
Author Contributions
Conceptualization, Y.X. and X.Z. (Xinxin Zhang); Methodology, Y.X., K.L. and X.L.; Formal Analysis, Investigation, and Visualization, Y.X., K.L., X.L. and L.D.; Writing—Original Draft Preparation, K.L. and X.L.; Writing—Review & Editing, L.D., Y.L. (Yu Liu), X.Z. (Xuhao Zhang), F.Q., X.Z. (Xinxin Zhang), B.Z., and Y.L. (Yujia Lan); Supervision, Y.X. and X.Z. (Xinxin Zhang); Project Administration, Y.X.; Funding Acquisition, Y.X. All authors have read and agreed to the published version of the manuscript.
Funding
This work was supported by the National Natural Science Foundation of China (U21A20196) awarded to Y.X., and the National Key Research & Development Program of China (2024YFA1307001) awarded to Y.X.
Institutional Review Board Statement
The study was conducted in accordance with the Declaration of Helsinki. The in-house Beijing cohort was approved by the Ethics Committee of National Cancer Center/Cancer Hospital, Chinese Academy of Medical Sciences and Peking Union Medical College (protocol code 23/094-3836; date of approval: 3 April 2023. The previously published SYSUCC Changkang Project, Yang, and Hu cohorts received ethical approval from their respective institutional ethics committees [21,22,23].
Informed Consent Statement
Informed consent was obtained from all subjects involved in the study.
Data Availability Statement
Raw sequencing data generated in this study, including WES data, have been deposited in the Genome Sequence Archive for Human (GSA-Human), National Genomics Data Center, under accession number HRA013005 and are available through controlled access. Access requests require submission of the GSA Human data application form and approval by the corresponding Data Access Committee. Sequencing data from the Changkang Project cohort were obtained from GSA-Human under accession number HRA000873. Sequencing data from the Yang cohort were obtained from the National Center for Biotechnology Information (NCBI) BioProject under accession number PRJNA588158. The Hu cohort data were obtained from the corresponding author of the original study upon request.
Conflicts of Interest
The authors declare no conflicts of interest.
References
- Sung, H.; Ferlay, J.; Siegel, R.L.; Laversanne, M.; Soerjomataram, I.; Jemal, A.; Bray, F. Global Cancer Statistics 2020: GLOBOCAN Estimates of Incidence and Mortality Worldwide for 36 Cancers in 185 Countries. CA Cancer J. Clin. 2021, 71, 209–249. [Google Scholar] [CrossRef] [Scilit] [PubMed]
- Bray, F.; Laversanne, M.; Sung, H.; Ferlay, J.; Siegel, R.L.; Soerjomataram, I.; Jemal, A. Global cancer statistics 2022: GLOBOCAN estimates of incidence and mortality worldwide for 36 cancers in 185 countries. CA Cancer J. Clin. 2024, 74, 229–263. [Google Scholar] [CrossRef] [Scilit] [PubMed]
- Diaz-Gay, M.; Dos Santos, W.; Moody, S.; Kazachkova, M.; Abbasi, A.; Steele, C.D.; Vangara, R.; Senkin, S.; Wang, J.; Fitzgerald, S.; et al. Geographic and age variations in mutational processes in colorectal cancer. Nature 2025, 643, 230–240. [Google Scholar] [CrossRef] [Scilit] [PubMed]
- Baker, T.M.; Lai, S.; Lynch, A.R.; Lesluyes, T.; Yan, H.; Ogilvie, H.A.; Verfaillie, A.; Dentro, S.; Bowes, A.L.; Pillay, N.; et al. The History of Chromosomal Instability in Genome-Doubled Tumors. Cancer Discov. 2024, 14, 1810–1822. [Google Scholar] [CrossRef] [Scilit] [PubMed]
- Cornish, A.J.; Gruber, A.J.; Kinnersley, B.; Chubb, D.; Frangou, A.; Caravagna, G.; Noyvert, B.; Lakatos, E.; Wood, H.M.; Thorn, S.; et al. The genomic landscape of 2,023 colorectal cancers. Nature 2024, 633, 127–136. [Google Scholar] [CrossRef] [Scilit] [PubMed]
- Yang, L.; Wang, S.; Lee, J.J.; Lee, S.; Lee, E.; Shinbrot, E.; Wheeler, D.A.; Kucherlapati, R.; Park, P.J. An enhanced genetic model of colorectal cancer progression history. Genome Biol. 2019, 20, 168. [Google Scholar] [CrossRef] [Scilit] [PubMed]
- Nunes, L.; Li, F.; Wu, M.; Luo, T.; Hammarstrom, K.; Torell, E.; Ljuslinder, I.; Mezheyeuski, A.; Edqvist, P.H.; Lofgren-Burstrom, A.; et al. Prognostic genome and transcriptome signatures in colorectal cancers. Nature 2024, 633, 137–146. [Google Scholar] [CrossRef] [Scilit] [PubMed]
- Cross, W.; Kovac, M.; Mustonen, V.; Temko, D.; Davis, H.; Baker, A.M.; Biswas, S.; Arnold, R.; Chegwidden, L.; Gatenbee, C.; et al. The evolutionary landscape of colorectal tumorigenesis. Nat. Ecol. Evol. 2018, 2, 1661–1672. [Google Scholar] [CrossRef] [Scilit] [PubMed]
- Lawrence, M.S.; Stojanov, P.; Polak, P.; Kryukov, G.V.; Cibulskis, K.; Sivachenko, A.; Carter, S.L.; Stewart, C.; Mermel, C.H.; Roberts, S.A.; et al. Mutational heterogeneity in cancer and the search for new cancer-associated genes. Nature 2013, 499, 214–218. [Google Scholar] [CrossRef] [Scilit] [PubMed]
- Lawrence, M.S.; Stojanov, P.; Mermel, C.H.; Robinson, J.T.; Garraway, L.A.; Golub, T.R.; Meyerson, M.; Gabriel, S.B.; Lander, E.S.; Getz, G. Discovery and saturation analysis of cancer genes across 21 tumour types. Nature 2014, 505, 495–501. [Google Scholar] [CrossRef] [Scilit] [PubMed]
- Martincorena, I.; Raine, K.M.; Gerstung, M.; Dawson, K.J.; Haase, K.; Van Loo, P.; Davies, H.; Stratton, M.R.; Campbell, P.J. Universal Patterns of Selection in Cancer and Somatic Tissues. Cell 2017, 171, e21, Erratum in: Cell 2018, 173, 1823. https://doi.org/10.1016/j.cell.2018.06.001. [Google Scholar]
- Mermel, C.H.; Schumacher, S.E.; Hill, B.; Meyerson, M.L.; Beroukhim, R.; Getz, G. GISTIC2.0 facilitates sensitive and confident localization of the targets of focal somatic copy-number alteration in human cancers. Genome Biol. 2011, 12, R41. [Google Scholar] [CrossRef] [Scilit] [PubMed]
- Gerstung, M.; Jolly, C.; Leshchiner, I.; Dentro, S.C.; Gonzalez, S.; Rosebrock, D.; Mitchell, T.J.; Rubanova, Y.; Anur, P.; Yu, K.; et al. The evolutionary history of 2,658 cancers. Nature 2020, 578, 122–128, Erratum in Nature 2023, 614, E42. https://doi.org/10.1038/s41586-022-05601-4. [Google Scholar] [CrossRef] [Scilit] [PubMed]
- Purdom, E.; Ho, C.; Grasso, C.S.; Quist, M.J.; Cho, R.J.; Spellman, P. Methods and challenges in timing chromosomal abnormalities within cancer samples. Bioinformatics 2013, 29, 3113–3120. [Google Scholar] [CrossRef] [Scilit] [PubMed]
- Sadien, I.D.; Davies, R.J.; Wheeler, J. The genomics of sporadic and hereditary colorectal cancer. Ann. R. Coll. Surg. Engl. 2024, 106, 313–320. [Google Scholar] [CrossRef] [Scilit] [PubMed]
- Gharib, E.; Robichaud, G.A. From Crypts to Cancer: A Holistic Perspective on Colorectal Carcinogenesis and Therapeutic Strategies. Int. J. Mol. Sci. 2024, 25., 9463. [Google Scholar] [CrossRef] [Scilit] [PubMed]
- Wang, Z.; Xia, Y.; Mills, L.; Nikolakopoulos, A.N.; Maeser, N.; Dehm, S.M.; Sheltzer, J.M.; Sun, R. Evolving copy number gains promote tumor expansion and bolster mutational diversification. Nat. Commun. 2024, 15, 2025. [Google Scholar] [CrossRef] [Scilit] [PubMed]
- Lau, T.Y.; Poon, R.Y.C. Whole-Genome Duplication and Genome Instability in Cancer Cells: Double the Trouble. Int. J. Mol. Sci. 2023, 24, 3733. [Google Scholar] [CrossRef] [Scilit] [PubMed]
- Quinton, R.J.; DiDomizio, A.; Vittoria, M.A.; Kotynkova, K.; Ticas, C.J.; Patel, S.; Koga, Y.; Vakhshoorzadeh, J.; Hermance, N.; Kuroda, T.S.; et al. Whole-genome doubling confers unique genetic vulnerabilities on tumour cells. Nature 2021, 590, 492–497, Erratum in Nature 2021, 593, E15. https://doi.org/10.1038/s41586-021-03591-3. [Google Scholar] [CrossRef] [Scilit] [PubMed]
- Lopez, S.; Lim, E.L.; Horswell, S.; Haase, K.; Huebner, A.; Dietzen, M.; Mourikis, T.P.; Watkins, T.B.K.; Rowan, A.; Dewhurst, S.M.; et al. Interplay between whole-genome doubling and the accumulation of deleterious alterations in cancer evolution. Nat. Genet. 2020, 52, 283–293. [Google Scholar] [CrossRef] [Scilit] [PubMed]
- Zhao, Q.; Wang, F.; Chen, Y.X.; Chen, S.; Yao, Y.C.; Zeng, Z.L.; Jiang, T.J.; Wang, Y.N.; Wu, C.Y.; Jing, Y.; et al. Comprehensive profiling of 1015 patients’ exomes reveals genomic-clinical associations in colorectal cancer. Nat. Commun. 2022, 13, 2342. [Google Scholar] [CrossRef] [Scilit] [PubMed]
- Yang, C.; Chen, N.; Li, X.; Lu, D.; Hou, Z.; Li, Y.; Jin, Y.; Gu, J.; Yin, Y. Mutations in the coat complex II component SEC23B promote colorectal cancer metastasis. Cell Death Dis. 2020, 11, 157. [Google Scholar] [CrossRef] [Scilit] [PubMed]
- Hu, H.; Zhang, Q.; Huang, R.; Gao, Z.; Yuan, Z.; Tang, Q.; Gao, F.; Wang, M.; Zhang, W.; Ma, T.; et al. Genomic Analysis Reveals Heterogeneity Between Lesions in Synchronous Primary Right-Sided and Left-Sided Colon Cancer. Front. Mol. Biosci. 2021, 8, 689466. [Google Scholar] [CrossRef] [Scilit] [PubMed]
- Zhang, T.; Joubert, P.; Ansari-Pour, N.; Zhao, W.; Hoang, P.H.; Lokanga, R.; Moye, A.L.; Rosenbaum, J.; Gonzalez-Perez, A.; Martinez-Jimenez, F.; et al. Genomic and evolutionary classification of lung cancer in never smokers. Nat. Genet. 2021, 53, 1348–1359. [Google Scholar] [CrossRef] [Scilit] [PubMed]
- Li, H.; Durbin, R. Fast and accurate short read alignment with Burrows-Wheeler transform. Bioinformatics 2009, 25, 1754–1760. [Google Scholar] [CrossRef] [Scilit] [PubMed]
- Li, H.; Handsaker, B.; Wysoker, A.; Fennell, T.; Ruan, J.; Homer, N.; Marth, G.; Abecasis, G.; Durbin, R.; Genome Project Data Processing, S. The Sequence Alignment/Map format and SAMtools. Bioinformatics 2009, 25, 2078–2079. [Google Scholar] [CrossRef] [Scilit] [PubMed]
- McKenna, A.; Hanna, M.; Banks, E.; Sivachenko, A.; Cibulskis, K.; Kernytsky, A.; Garimella, K.; Altshuler, D.; Gabriel, S.; Daly, M.; et al. The Genome Analysis Toolkit: A MapReduce framework for analyzing next-generation DNA sequencing data. Genome Res. 2010, 20, 1297–1303. [Google Scholar] [CrossRef] [Scilit] [PubMed]
- Cibulskis, K.; Lawrence, M.S.; Carter, S.L.; Sivachenko, A.; Jaffe, D.; Sougnez, C.; Gabriel, S.; Meyerson, M.; Lander, E.S.; Getz, G. Sensitive detection of somatic point mutations in impure and heterogeneous cancer samples. Nat. Biotechnol. 2013, 31, 213–219. [Google Scholar] [CrossRef] [Scilit] [PubMed]
- Koboldt, D.C.; Zhang, Q.; Larson, D.E.; Shen, D.; McLellan, M.D.; Lin, L.; Miller, C.A.; Mardis, E.R.; Ding, L.; Wilson, R.K. VarScan 2: Somatic mutation and copy number alteration discovery in cancer by exome sequencing. Genome Res. 2012, 22, 568–576. [Google Scholar] [CrossRef] [Scilit] [PubMed]
- Kim, S.; Scheffler, K.; Halpern, A.L.; Bekritsky, M.A.; Noh, E.; Kallberg, M.; Chen, X.; Kim, Y.; Beyter, D.; Krusche, P.; et al. Strelka2: Fast and accurate calling of germline and somatic variants. Nat. Methods 2018, 15, 591–594. [Google Scholar] [CrossRef] [Scilit] [PubMed]
- Fan, Y.; Xi, L.; Hughes, D.S.; Zhang, J.; Zhang, J.; Futreal, P.A.; Wheeler, D.A.; Wang, W. MuSE: Accounting for tumor heterogeneity using a sample-specific error model improves sensitivity and specificity in mutation calling from sequencing data. Genome Biol. 2016, 17, 178. [Google Scholar] [CrossRef] [Scilit] [PubMed]
- Danecek, P.; Bonfield, J.K.; Liddle, J.; Marshall, J.; Ohan, V.; Pollard, M.O.; Whitwham, A.; Keane, T.; McCarthy, S.A.; Davies, R.M.; et al. Twelve years of SAMtools and BCFtools. Gigascience 2021, 10, giab008. [Google Scholar] [CrossRef] [Scilit] [PubMed]
- Larson, D.E.; Harris, C.C.; Chen, K.; Koboldt, D.C.; Abbott, T.E.; Dooling, D.J.; Ley, T.J.; Mardis, E.R.; Wilson, R.K.; Ding, L. SomaticSniper: Identification of somatic point mutations in whole genome sequencing data. Bioinformatics 2012, 28, 311–317. [Google Scholar] [CrossRef] [Scilit] [PubMed]
- Gudmundsson, S.; Singer-Berk, M.; Watts, N.A.; Phu, W.; Goodrich, J.K.; Solomonson, M.; Genome Aggregation Database, C.; Rehm, H.L.; MacArthur, D.G.; O’Donnell-Luria, A. Variant interpretation using population databases: Lessons from gnomAD. Hum. Mutat. 2022, 43, 1012–1030. [Google Scholar] [CrossRef] [Scilit]
- Niu, B.; Ye, K.; Zhang, Q.; Lu, C.; Xie, M.; McLellan, M.D.; Wendl, M.C.; Ding, L. MSIsensor: Microsatellite instability detection using paired tumor-normal sequence data. Bioinformatics 2014, 30, 1015–1016. [Google Scholar] [CrossRef] [Scilit] [PubMed]
- Cancer Genome Atlas Research, N.; Kandoth, C.; Schultz, N.; Cherniack, A.D.; Akbani, R.; Liu, Y.; Shen, H.; Robertson, A.G.; Pashtan, I.; Shen, R.; et al. Integrated genomic characterization of endometrial carcinoma. Nature 2013, 497, 67–73, Erratum in Nature 2013, 500, 242. [Google Scholar] [CrossRef] [Scilit] [PubMed]
- Bellido, F.; Pineda, M.; Aiza, G.; Valdes-Mas, R.; Navarro, M.; Puente, D.A.; Pons, T.; Gonzalez, S.; Iglesias, S.; Darder, E.; et al. POLE and POLD1 mutations in 529 kindred with familial colorectal cancer and/or polyposis: Review of reported cases and recommendations for genetic testing and surveillance. Genet. Med. 2016, 18, 325–332. [Google Scholar] [CrossRef] [Scilit] [PubMed]
- Leon-Castillo, A.; Britton, H.; McConechy, M.K.; McAlpine, J.N.; Nout, R.; Kommoss, S.; Brucker, S.Y.; Carlson, J.W.; Epstein, E.; Rau, T.T.; et al. Interpretation of somatic POLE mutations in endometrial carcinoma. J. Pathol. 2020, 250, 323–335. [Google Scholar] [CrossRef] [Scilit] [PubMed]
- Hamzaoui, N.; Alarcon, F.; Leulliot, N.; Guimbaud, R.; Buecher, B.; Colas, C.; Corsini, C.; Nuel, G.; Terris, B.; Laurent-Puig, P.; et al. Genetic, structural, and functional characterization of POLE polymerase proofreading variants allows cancer risk prediction. Genet. Med. 2020, 22, 1533–1541. [Google Scholar] [CrossRef] [Scilit] [PubMed]
- Hu, Z.; Wu, Z.; Liu, W.; Ning, Y.; Liu, J.; Ding, W.; Fan, J.; Cai, S.; Li, Q.; Li, W.; et al. Proteogenomic insights into early-onset endometrioid endometrial carcinoma: Predictors for fertility-sparing therapy response. Nat. Genet. 2024, 56, 637–651. [Google Scholar] [CrossRef] [Scilit] [PubMed]
- Ambrosini, M.; Rousseau, B.; Manca, P.; Artz, O.; Marabelle, A.; Andre, T.; Maddalena, G.; Mazzoli, G.; Intini, R.; Cohen, R.; et al. Immune checkpoint inhibitors for POLE or POLD1 proofreading-deficient metastatic colorectal cancer. Ann. Oncol. 2024, 35, 643–655. [Google Scholar] [CrossRef] [Scilit] [PubMed]
- Church, D.N.; Briggs, S.E.; Palles, C.; Domingo, E.; Kearsey, S.J.; Grimes, J.M.; Gorman, M.; Martin, L.; Howarth, K.M.; Hodgson, S.V.; et al. DNA polymerase epsilon and delta exonuclease domain mutations in endometrial cancer. Hum. Mol. Genet. 2013, 22, 2820–2828. [Google Scholar] [CrossRef] [Scilit] [PubMed]
- Rayner, E.; van Gool, I.C.; Palles, C.; Kearsey, S.E.; Bosse, T.; Tomlinson, I.; Church, D.N. A panoply of errors: Polymerase proofreading domain mutations in cancer. Nat. Rev. Cancer 2016, 16, 71–81. [Google Scholar] [CrossRef] [Scilit] [PubMed]
- Van Loo, P.; Nordgard, S.H.; Lingjaerde, O.C.; Russnes, H.G.; Rye, I.H.; Sun, W.; Weigman, V.J.; Marynen, P.; Zetterberg, A.; Naume, B.; et al. Allele-specific copy number analysis of tumors. Proc. Natl. Acad. Sci. USA 2010, 107, 16910–16915. [Google Scholar] [CrossRef] [Scilit] [PubMed]
- Shen, R.; Seshan, V.E. FACETS: Allele-specific copy number and clonal heterogeneity analysis tool for high-throughput DNA sequencing. Nucleic Acids Res. 2016, 44, e131. [Google Scholar] [CrossRef] [Scilit] [PubMed]
- Favero, F.; Joshi, T.; Marquard, A.M.; Birkbak, N.J.; Krzystanek, M.; Li, Q.; Szallasi, Z.; Eklund, A.C. Sequenza: Allele-specific copy number and mutation profiles from tumor sequencing data. Ann. Oncol. 2015, 26, 64–70. [Google Scholar] [CrossRef] [Scilit] [PubMed]
- Ha, G.; Roth, A.; Khattra, J.; Ho, J.; Yap, D.; Prentice, L.M.; Melnyk, N.; McPherson, A.; Bashashati, A.; Laks, E.; et al. TITAN: Inference of copy number architectures in clonal cell populations from tumor whole-genome sequence data. Genome Res. 2014, 24, 1881–1893. [Google Scholar] [CrossRef] [Scilit] [PubMed]
- Cun, Y.; Yang, T.P.; Achter, V.; Lang, U.; Peifer, M. Copy-number analysis and inference of subclonal populations in cancer genomes using Sclust. Nat. Protoc. 2018, 13, 1488–1501. [Google Scholar] [CrossRef] [Scilit] [PubMed]
- Dentro, S.C.; Leshchiner, I.; Haase, K.; Tarabichi, M.; Wintersinger, J.; Deshwar, A.G.; Yu, K.; Rubanova, Y.; Macintyre, G.; Demeulemeester, J.; et al. Characterizing genetic intra-tumor heterogeneity across 2,658 human cancer genomes. Cell 2021, 184, 2239–2254.E39. [Google Scholar] [CrossRef] [Scilit] [PubMed]
- Roth, A.; Khattra, J.; Yap, D.; Wan, A.; Laks, E.; Biele, J.; Ha, G.; Aparicio, S.; Bouchard-Cote, A.; Shah, S.P. PyClone: Statistical inference of clonal population structure in cancer. Nat. Methods 2014, 11, 396–398. [Google Scholar] [CrossRef] [Scilit] [PubMed]
- Dewhurst, S.M.; McGranahan, N.; Burrell, R.A.; Rowan, A.J.; Gronroos, E.; Endesfelder, D.; Joshi, T.; Mouradov, D.; Gibbs, P.; Ward, R.L.; et al. Tolerance of whole-genome doubling propagates chromosomal instability and accelerates cancer genome evolution. Cancer Discov. 2014, 4, 175–185. [Google Scholar] [CrossRef] [Scilit] [PubMed]
- Carter, S.L.; Cibulskis, K.; Helman, E.; McKenna, A.; Shen, H.; Zack, T.; Laird, P.W.; Onofrio, R.C.; Winckler, W.; Weir, B.A.; et al. Absolute quantification of somatic DNA alterations in human cancer. Nat. Biotechnol. 2012, 30, 413–421. [Google Scholar] [CrossRef] [Scilit] [PubMed]
- Qiu, M.Z.; Chen, Q.; Zheng, D.Y.; Zhao, Q.; Wu, Q.N.; Zhou, Z.W.; Yang, L.Q.; Luo, Q.Y.; Sun, Y.T.; Lai, M.Y.; et al. Precise microdissection of gastric mixed adeno-neuroendocrine carcinoma dissects its genomic landscape and evolutionary clonal origins. Cell Rep. 2023, 42, 112576. [Google Scholar] [CrossRef] [Scilit] [PubMed]
- Islam, S.M.A.; Diaz-Gay, M.; Wu, Y.; Barnes, M.; Vangara, R.; Bergstrom, E.N.; He, Y.; Vella, M.; Wang, J.; Teague, J.W.; et al. Uncovering novel mutational signatures by de novo extraction with SigProfilerExtractor. Cell Genom. 2022, 2, 100179. [Google Scholar] [CrossRef] [Scilit] [PubMed]
- Nam, Y.; Gomez, K.; Reynier, J.B.; Khamnei, C.; Aitken, M.; Zheng, V.; Lhakhang, T.; Casula, M.; Palmieri, G.; Cossu, A.; et al. Genomic landscape of virus-associated cancers. Nat. Commun. 2025, 16, 5887. [Google Scholar] [CrossRef] [Scilit] [PubMed]
- Kubler, K.; Nardone, A.; Anand, S.; Gurevich, D.; Gao, J.; Droog, M.; Hermida-Prado, F.; Akhshi, T.; Feiglin, A.; Feit, A.S.; et al. Tamoxifen induces PI3K activation in uterine cancer. Nat. Genet. 2025, 57, 2192–2202. [Google Scholar] [CrossRef] [Scilit] [PubMed]
- Senkin, S.; Moody, S.; Diaz-Gay, M.; Abedi-Ardekani, B.; Cattiaux, T.; Ferreiro-Iglesias, A.; Wang, J.; Fitzgerald, S.; Kazachkova, M.; Vangara, R.; et al. Geographic variation of mutagenic exposures in kidney cancer genomes. Nature 2024, 629, 910–918. [Google Scholar] [CrossRef] [Scilit] [PubMed]
- Senkin, S. MSA: Reproducible mutational signature attribution with confidence based on simulations. BMC Bioinform. 2021, 22, 540. [Google Scholar] [CrossRef] [Scilit] [PubMed]
- Ahlgren, L.; Pilheden, M.; Sturesson, H.; Song, G.; Walsh, M.P.; Yang, M.; Maillard, M.; Zhao, H.; Cheng, Z.; Singh, V.; et al. The genomic landscape of relapsed infant and childhood KMT2A-rearranged acute leukemia. Nat. Commun. 2025, 16, 8964. [Google Scholar] [CrossRef] [Scilit] [PubMed]
- Abbas, S.; Pich, O.; Devonshire, G.; Zamani, S.A.; Katz-Summercorn, A.; Killcoyne, S.; Cheah, C.; Nutzinger, B.; Grehan, N.; Lopez-Bigas, N.; et al. Mutational signature dynamics shaping the evolution of oesophageal adenocarcinoma. Nat. Commun. 2023, 14, 4239. [Google Scholar] [CrossRef] [Scilit] [PubMed]
- Torrens, L.; Moody, S.; de Carvalho, A.C.; Kazachkova, M.; Abedi-Ardekani, B.; Cheema, S.; Senkin, S.; Cattiaux, T.; Cortez Cardoso Penha, R.; Atkins, J.R.; et al. The complexity of tobacco smoke-induced mutagenesis in head and neck cancer. Nat. Genet. 2025, 57, 884–896. [Google Scholar] [CrossRef] [Scilit] [PubMed]
- Ni Leathlobhair, M.; Frangou, A.; Kinnersley, B.; Cornish, A.J.; Chubb, D.; Lakatos, E.; Arumugam, P.; Gruber, A.J.; Law, P.; Tapinos, A.; et al. Genomic landscape of adult testicular germ cell tumours in the 100,000 Genomes Project. Nat. Commun. 2024, 15, 9247. [Google Scholar] [CrossRef] [Scilit] [PubMed]
- Taylor, A.M.; Shih, J.; Ha, G.; Gao, G.F.; Zhang, X.; Berger, A.C.; Schumacher, S.E.; Wang, C.; Hu, H.; Liu, J.; et al. Genomic and Functional Approaches to Understanding Cancer Aneuploidy. Cancer Cell 2018, 33, 676–689.E3. [Google Scholar] [CrossRef] [Scilit] [PubMed]
- Loveday, C.; Litchfield, K.; Proszek, P.Z.; Cornish, A.J.; Santo, F.; Levy, M.; Macintyre, G.; Holryod, A.; Broderick, P.; Dudakia, D.; et al. Genomic landscape of platinum resistant and sensitive testicular cancers. Nat. Commun. 2020, 11, 2189. [Google Scholar] [CrossRef] [Scilit] [PubMed]
- Martinez-Jimenez, F.; Movasati, A.; Brunner, S.R.; Nguyen, L.; Priestley, P.; Cuppen, E.; Van Hoeck, A. Pan-cancer whole-genome comparison of primary and metastatic solid tumours. Nature 2023, 618, 333–341. [Google Scholar] [CrossRef] [Scilit] [PubMed]
- Sztupinszki, Z.; Diossy, M.; Krzystanek, M.; Reiniger, L.; Csabai, I.; Favero, F.; Birkbak, N.J.; Eklund, A.C.; Syed, A.; Szallasi, Z. Migrating the SNP array-based homologous recombination deficiency measures to next generation sequencing data of breast cancer. npj Breast Cancer 2018, 4, 16. [Google Scholar] [CrossRef] [Scilit] [PubMed]
- Shukla, S.A.; Rooney, M.S.; Rajasagi, M.; Tiao, G.; Dixon, P.M.; Lawrence, M.S.; Stevens, J.; Lane, W.J.; Dellagatta, J.L.; Steelman, S.; et al. Comprehensive analysis of cancer-associated somatic mutations in class I HLA genes. Nat. Biotechnol. 2015, 33, 1152–1158. [Google Scholar] [CrossRef] [Scilit] [PubMed]
- McGranahan, N.; Rosenthal, R.; Hiley, C.T.; Rowan, A.J.; Watkins, T.B.K.; Wilson, G.A.; Birkbak, N.J.; Veeriah, S.; Van Loo, P.; Herrero, J.; et al. Allele-Specific HLA Loss and Immune Escape in Lung Cancer Evolution. Cell 2017, 171, 1259–1271.E11. [Google Scholar] [CrossRef] [Scilit] [PubMed]
- Reynisson, B.; Alvarez, B.; Paul, S.; Peters, B.; Nielsen, M. NetMHCpan-4.1 and NetMHCIIpan-4.0: Improved predictions of MHC antigen presentation by concurrent motif deconvolution and integration of MS MHC eluted ligand data. Nucleic Acids Res. 2020, 48, W449–W454. [Google Scholar] [CrossRef] [Scilit] [PubMed]
- Marty, R.; Kaabinejadian, S.; Rossell, D.; Slifker, M.J.; van de Haar, J.; Engin, H.B.; de Prisco, N.; Ideker, T.; Hildebrand, W.H.; Font-Burgada, J.; et al. MHC-I Genotype Restricts the Oncogenic Mutational Landscape. Cell 2017, 171, 1272–1283.E15. [Google Scholar] [CrossRef] [Scilit] [PubMed]
- Zapata, L.; Caravagna, G.; Williams, M.J.; Lakatos, E.; AbdulJabbar, K.; Werner, B.; Chowell, D.; James, C.; Gourmet, L.; Milite, S.; et al. Immune selection determines tumor antigenicity and influences response to checkpoint inhibitors. Nat. Genet. 2023, 55, 451–460. [Google Scholar] [CrossRef] [Scilit] [PubMed]
- Bailey, M.H.; Tokheim, C.; Porta-Pardo, E.; Sengupta, S.; Bertrand, D.; Weerasinghe, A.; Colaprico, A.; Wendl, M.C.; Kim, J.; Reardon, B.; et al. Comprehensive Characterization of Cancer Driver Genes and Mutations. Cell 2018, 173, 371–385.e18, Erratum in Cell 2018, 174, 1034–1035. https://doi.org/10.1016/j.cell.2018.07.034. [Google Scholar] [CrossRef] [Scilit] [PubMed]
- Hess, J.M.; Bernards, A.; Kim, J.; Miller, M.; Taylor-Weiner, A.; Haradhvala, N.J.; Lawrence, M.S.; Getz, G. Passenger Hotspot Mutations in Cancer. Cancer Cell 2019, 36, 288–301.e14. [Google Scholar] [CrossRef] [Scilit] [PubMed]
- Sondka, Z.; Dhir, N.B.; Carvalho-Silva, D.; Jupe, S.; Madhumita; McLaren, K.; Starkey, M.; Ward, S.; Wilding, J.; Ahmed, M.; et al. COSMIC: A curated database of somatic variants and clinical data for cancer. Nucleic Acids Res. 2024, 52, D1210–D1217. [Google Scholar] [CrossRef] [Scilit] [PubMed]
- Chakravarty, D.; Gao, J.; Phillips, S.M.; Kundra, R.; Zhang, H.; Wang, J.; Rudolph, J.E.; Yaeger, R.; Soumerai, T.; Nissan, M.H.; et al. OncoKB: A Precision Oncology Knowledge Base. JCO Precis. Oncol. 2017, 1, 1–16. [Google Scholar] [CrossRef] [Scilit] [PubMed]
- Martinez-Jimenez, F.; Muinos, F.; Sentis, I.; Deu-Pons, J.; Reyes-Salazar, I.; Arnedo-Pac, C.; Mularoni, L.; Pich, O.; Bonet, J.; Kranas, H.; et al. A compendium of mutational cancer driver genes. Nat. Rev. Cancer 2020, 20, 555–572. [Google Scholar] [CrossRef] [Scilit] [PubMed]
- Cancer Genome Atlas Research, N., Comprehensive molecular profiling of lung adenocarcinoma. Nature 2014, 511, 543–550, Erratum in Nature 2018, 559, E12. https://doi.org/10.1038/s41586-018-0228-6. [Google Scholar] [CrossRef] [Scilit] [PubMed]
- Cancer Genome Atlas Research, N. Comprehensive genomic characterization of squamous cell lung cancers. Nature 2012, 489, 519–525. [Google Scholar] [CrossRef] [Scilit] [PubMed]
- Campbell, J.D.; Alexandrov, A.; Kim, J.; Wala, J.; Berger, A.H.; Pedamallu, C.S.; Shukla, S.A.; Guo, G.; Brooks, A.N.; Murray, B.A.; et al. Distinct patterns of somatic genome alterations in lung adenocarcinomas and squamous cell carcinomas. Nat. Genet 2016, 48, 607–616. [Google Scholar] [CrossRef] [Scilit] [PubMed]
- Gao, J.; Shi, L.Z.; Zhao, H.; Chen, J.; Xiong, L.; He, Q.; Chen, T.; Roszik, J.; Bernatchez, C.; Woodman, S.E.; et al. Loss of IFN-gamma Pathway Genes in Tumor Cells as a Mechanism of Resistance to Anti-CTLA-4 Therapy. Cell 2016, 167, 397–404.e9. [Google Scholar] [CrossRef] [Scilit] [PubMed]
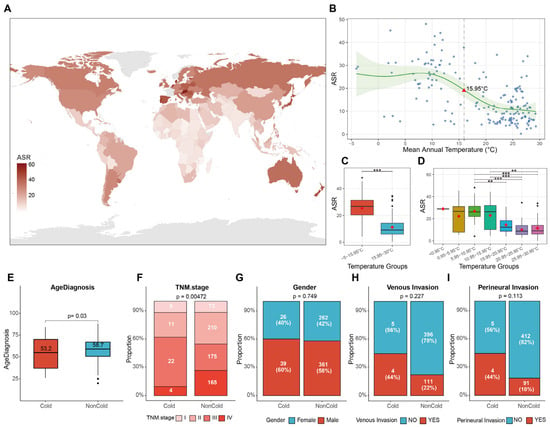
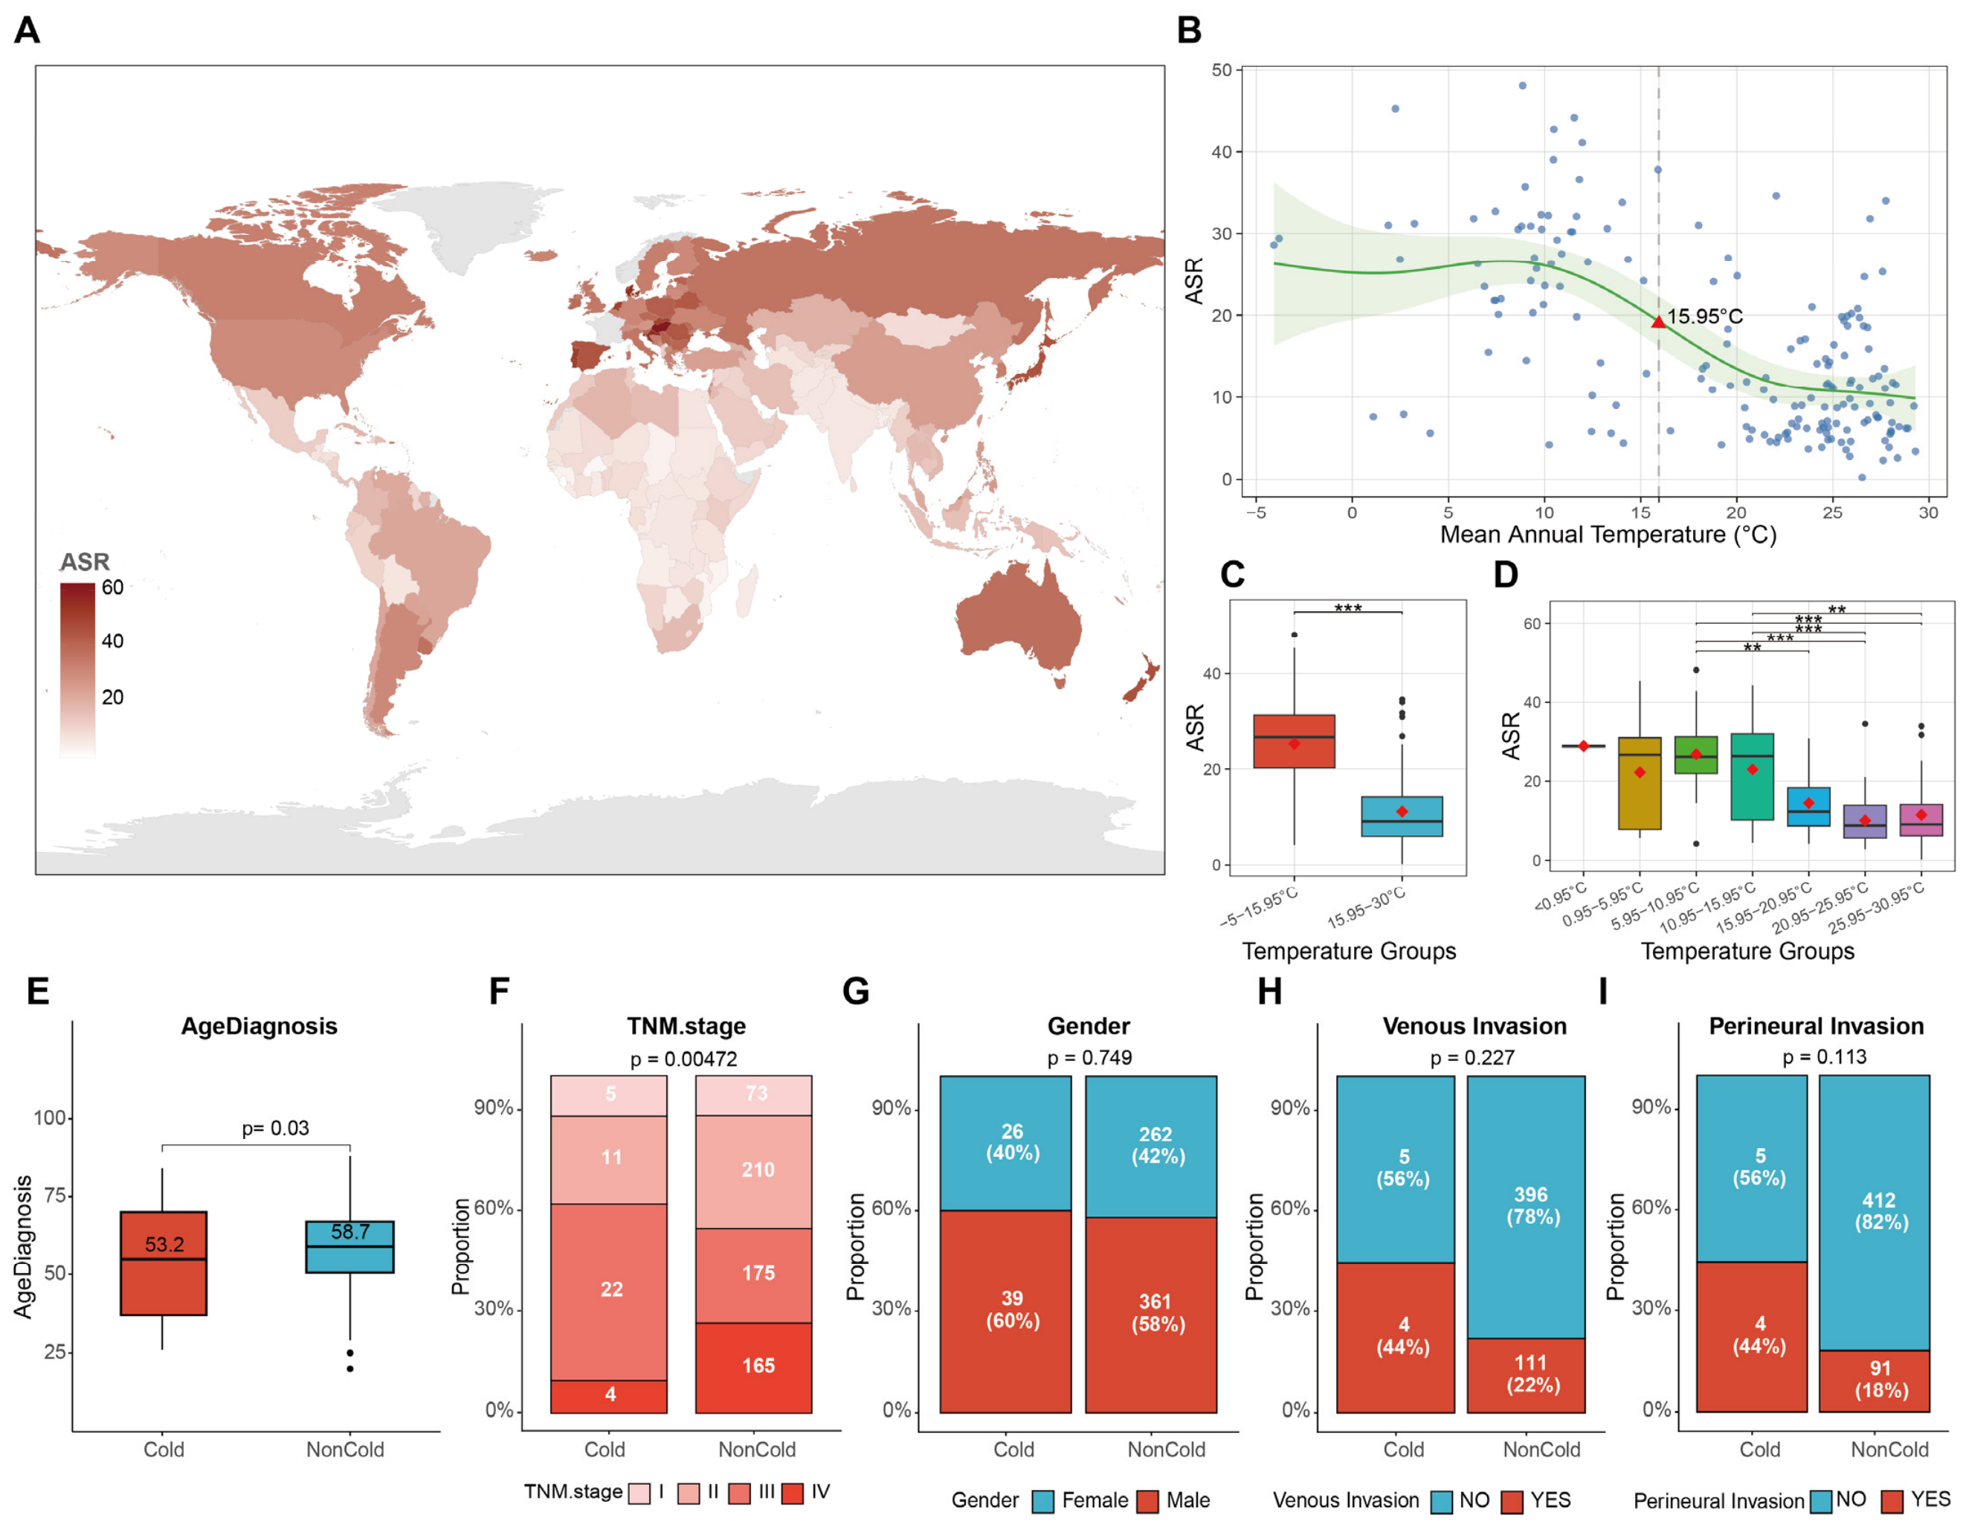
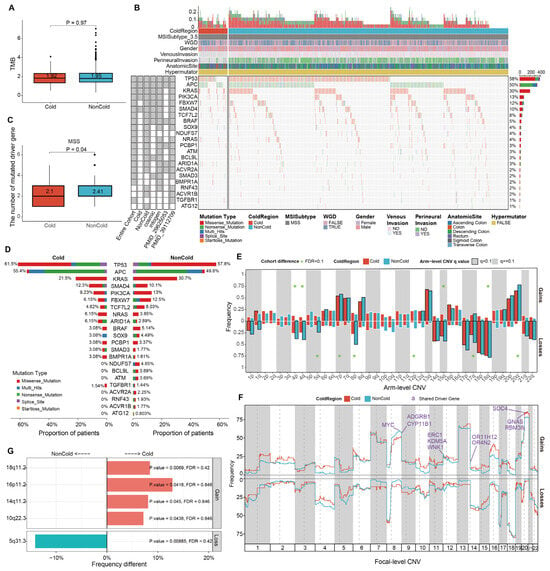
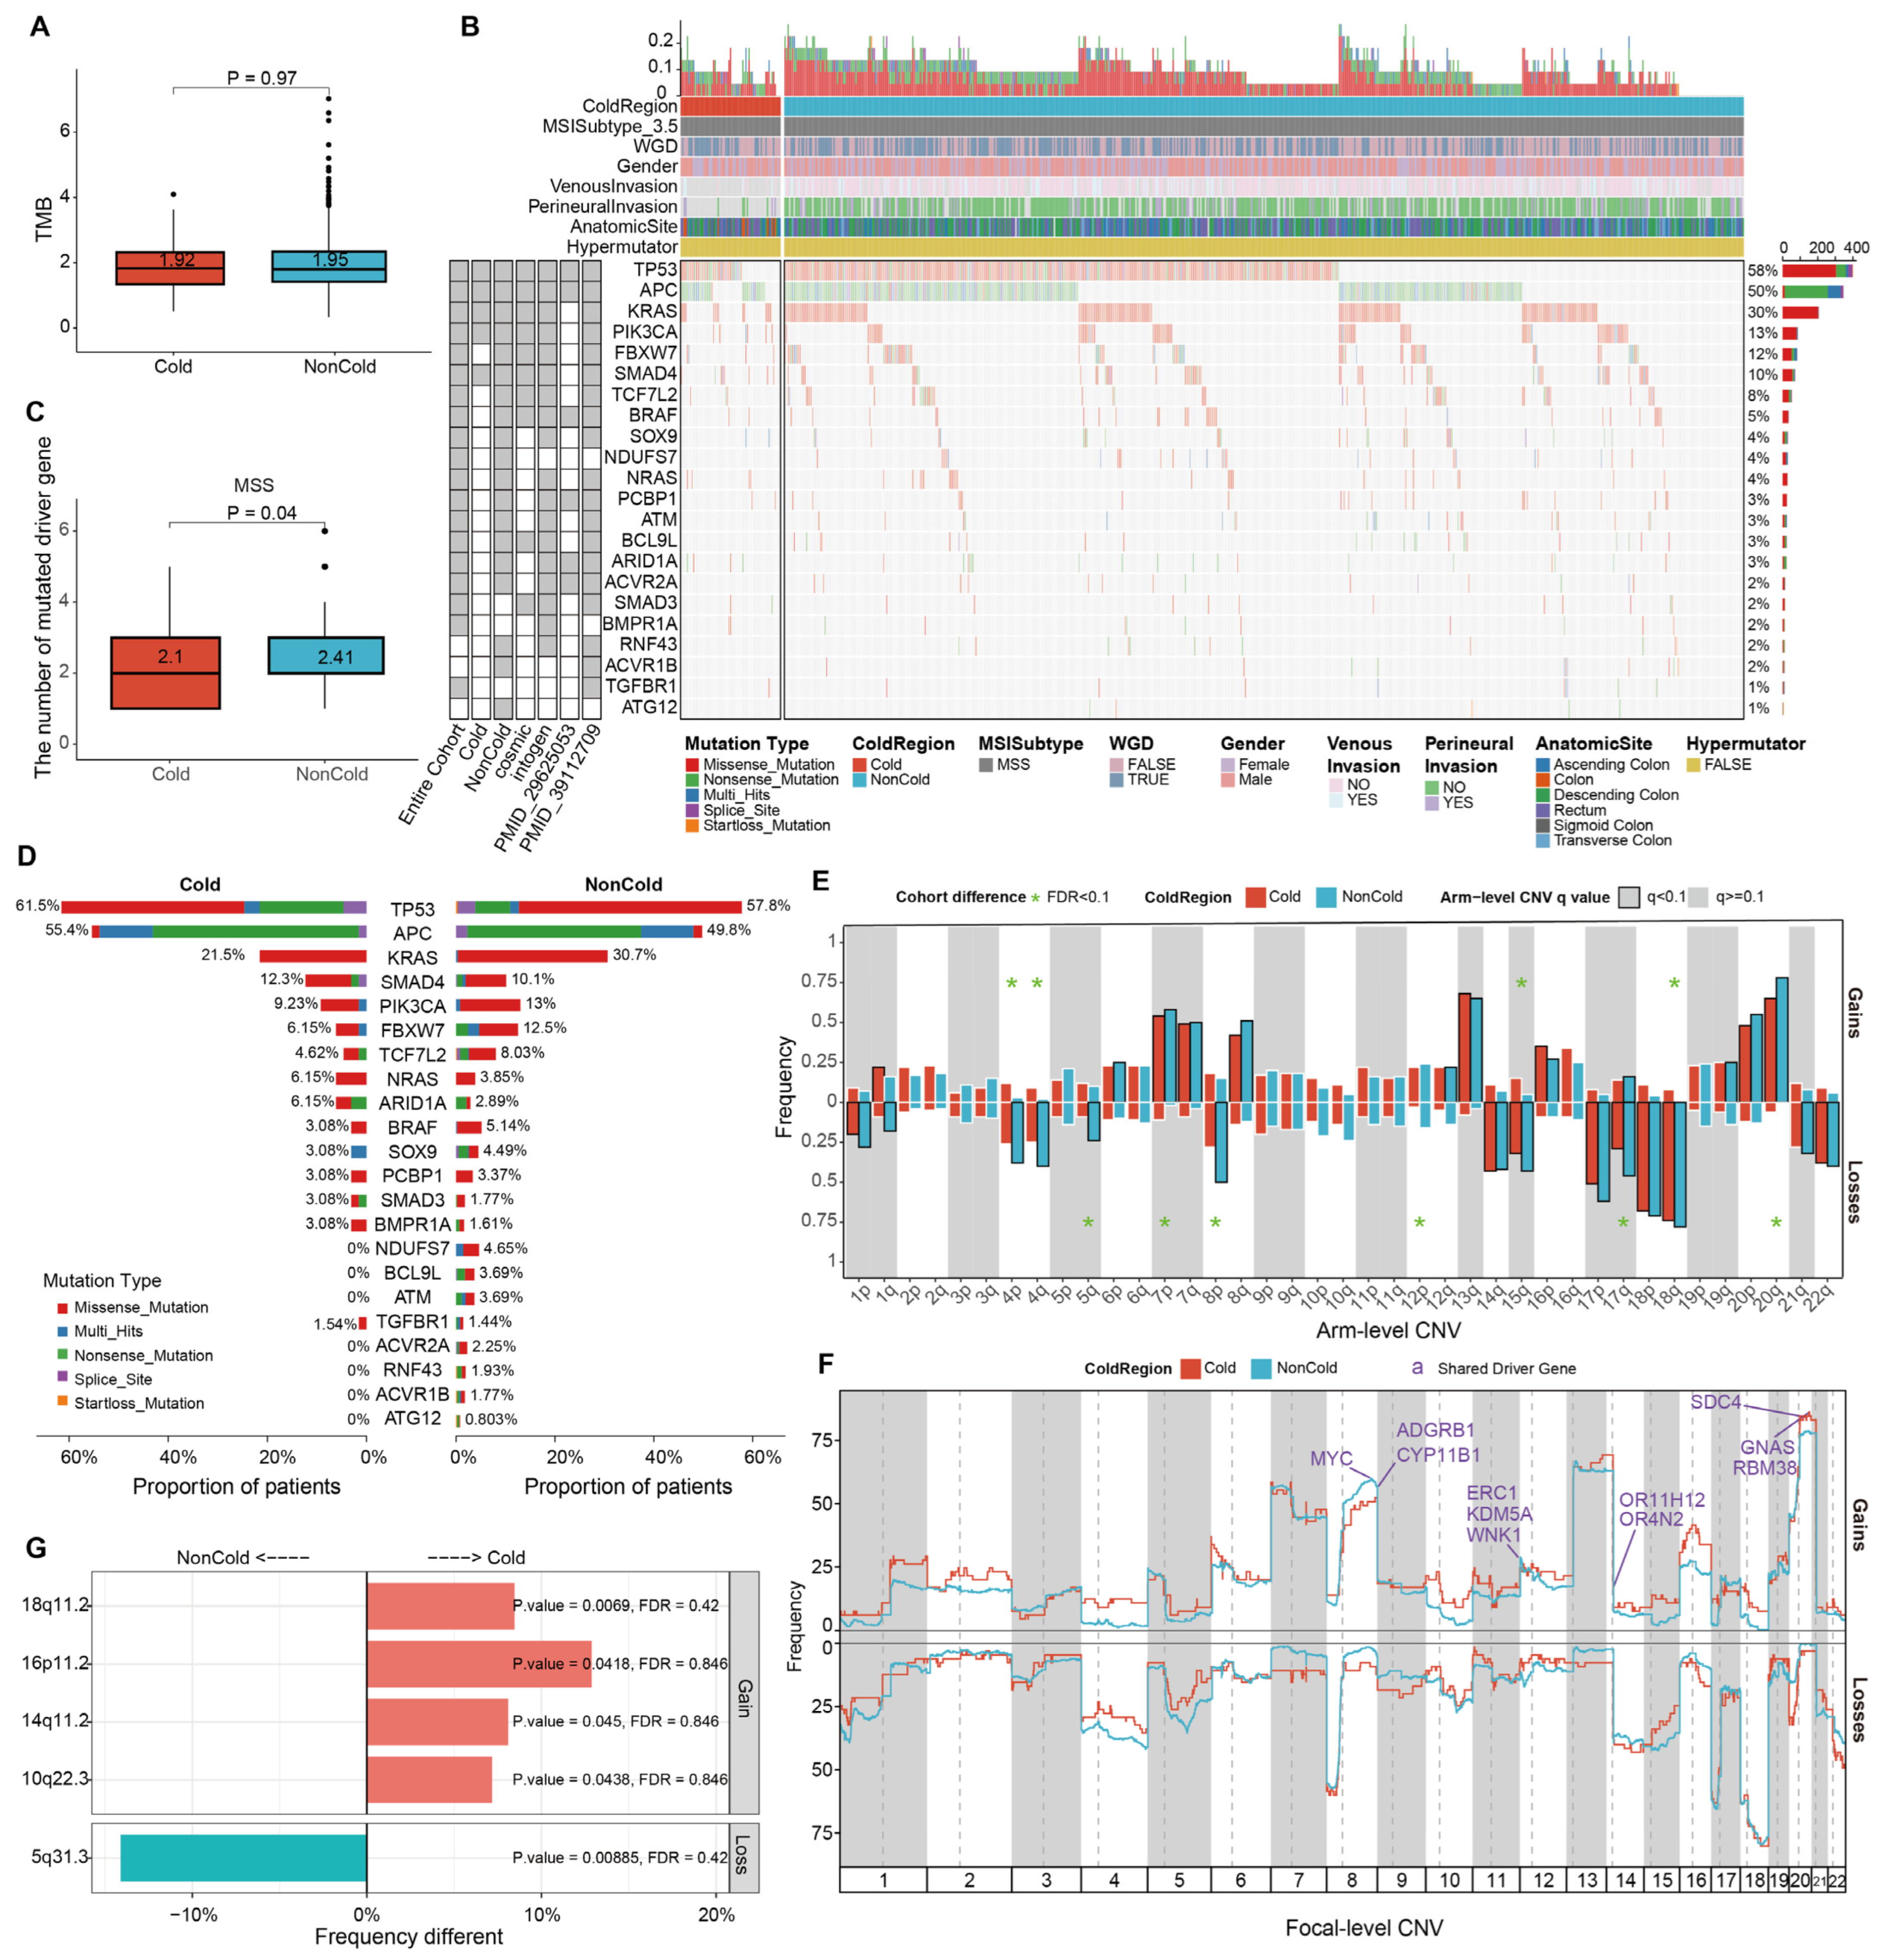
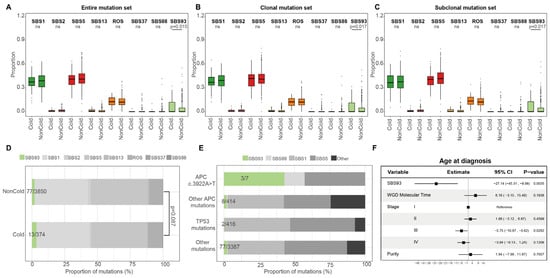
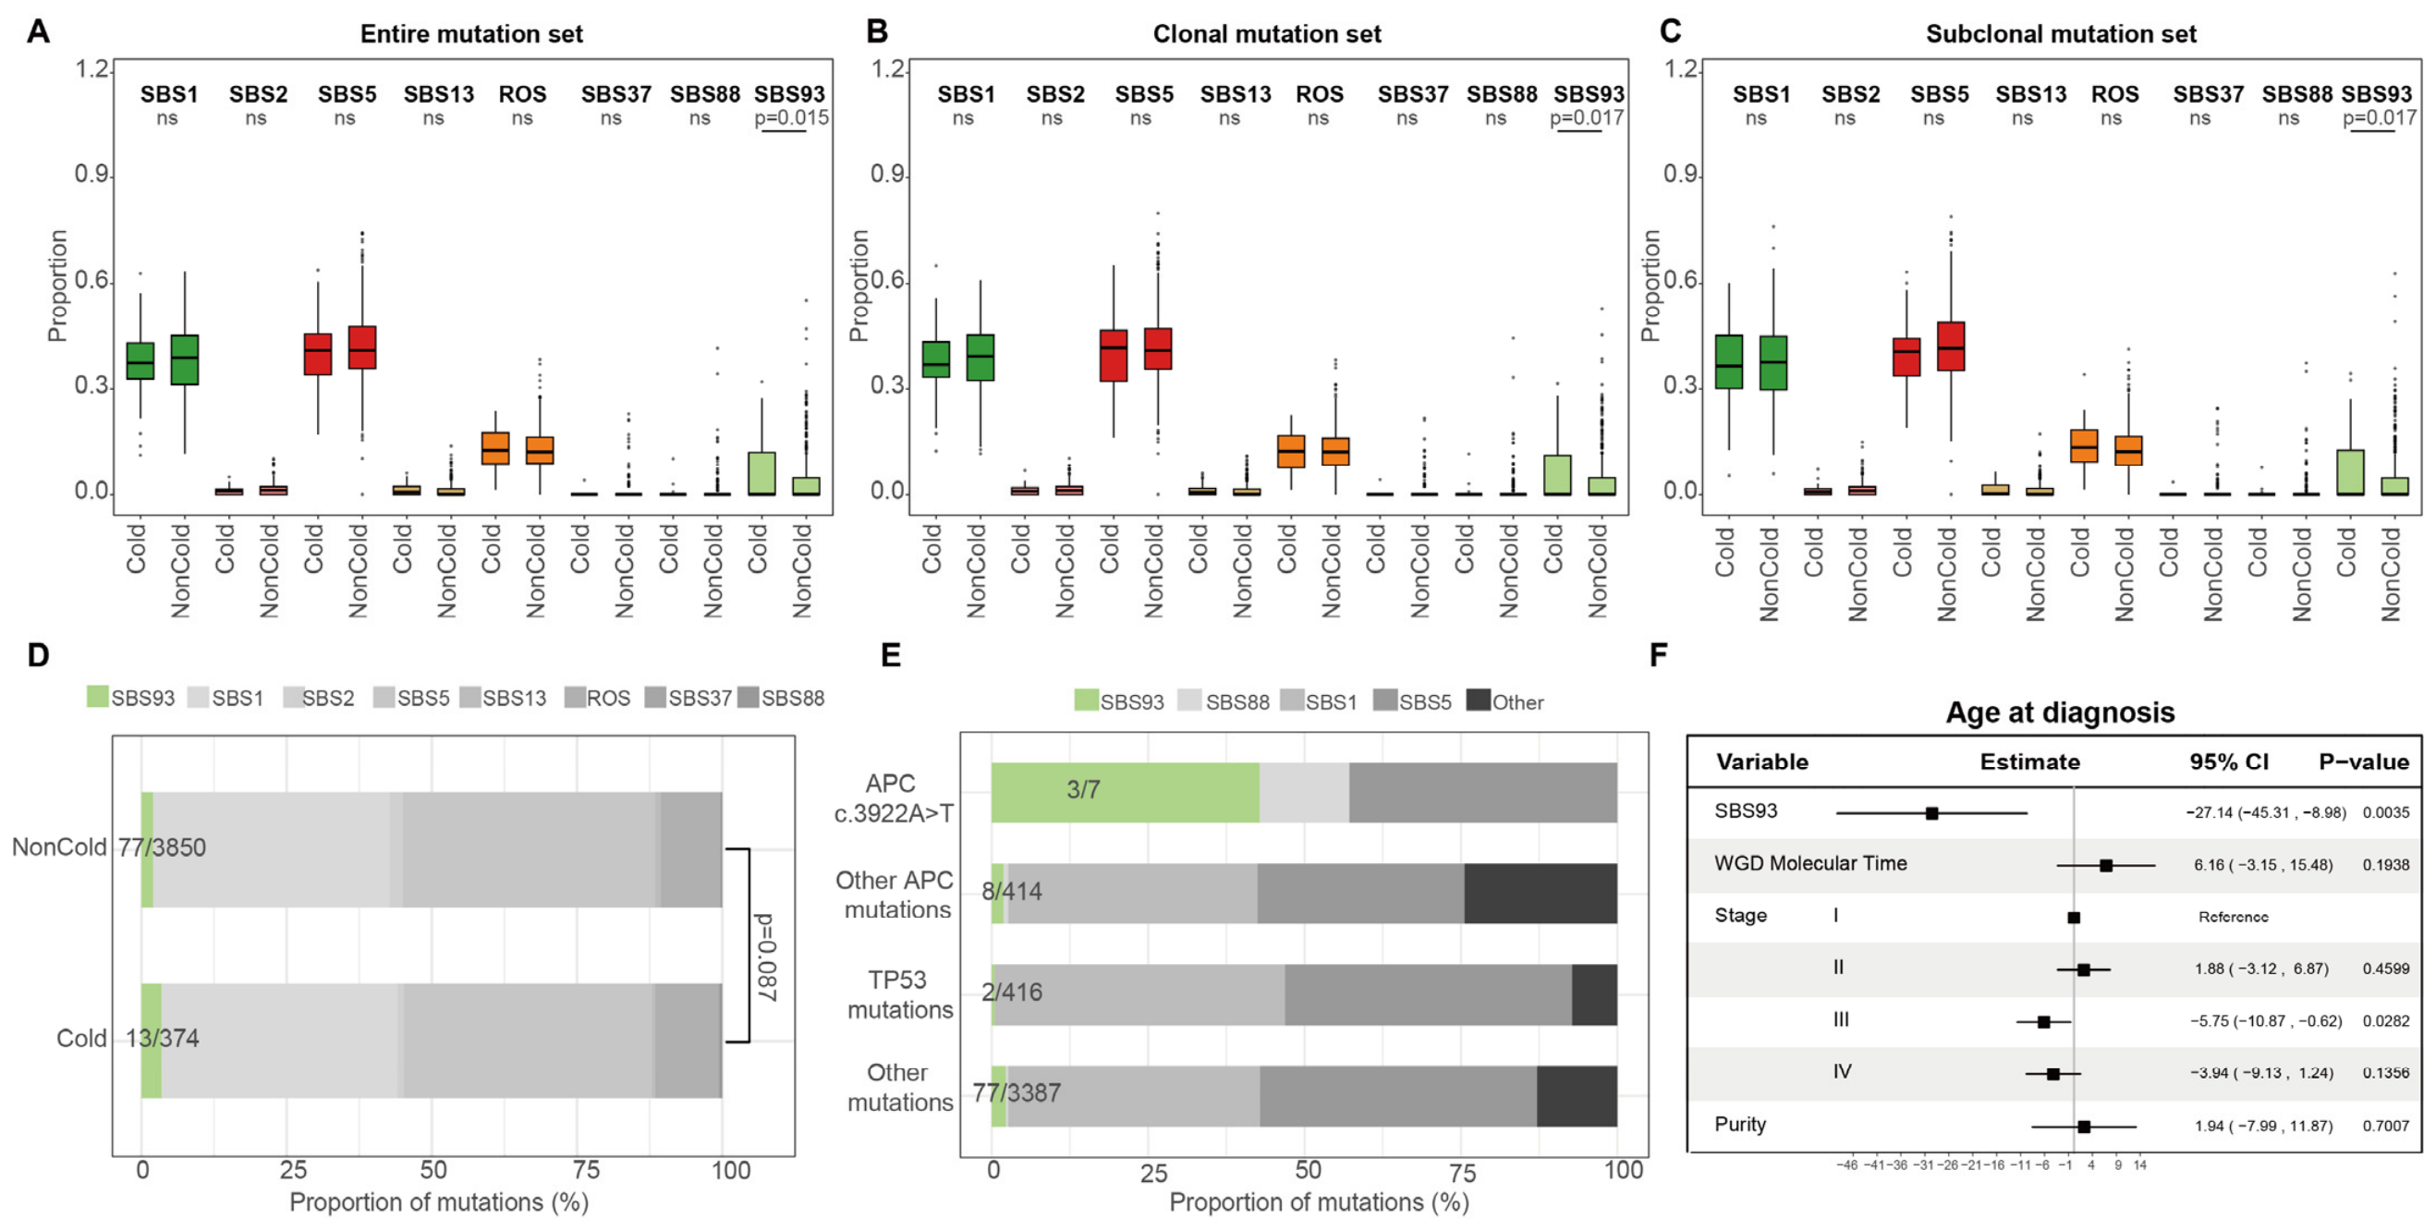
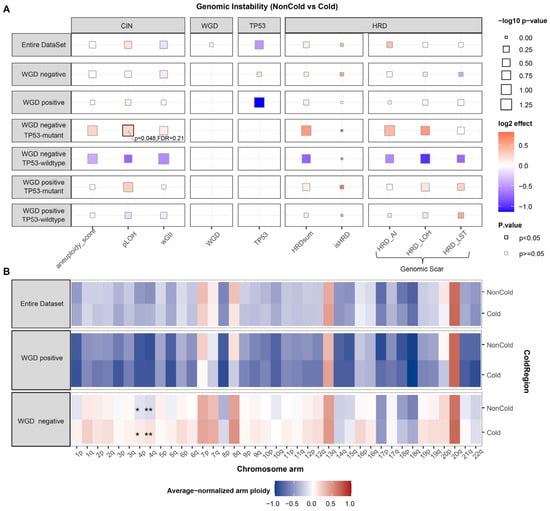
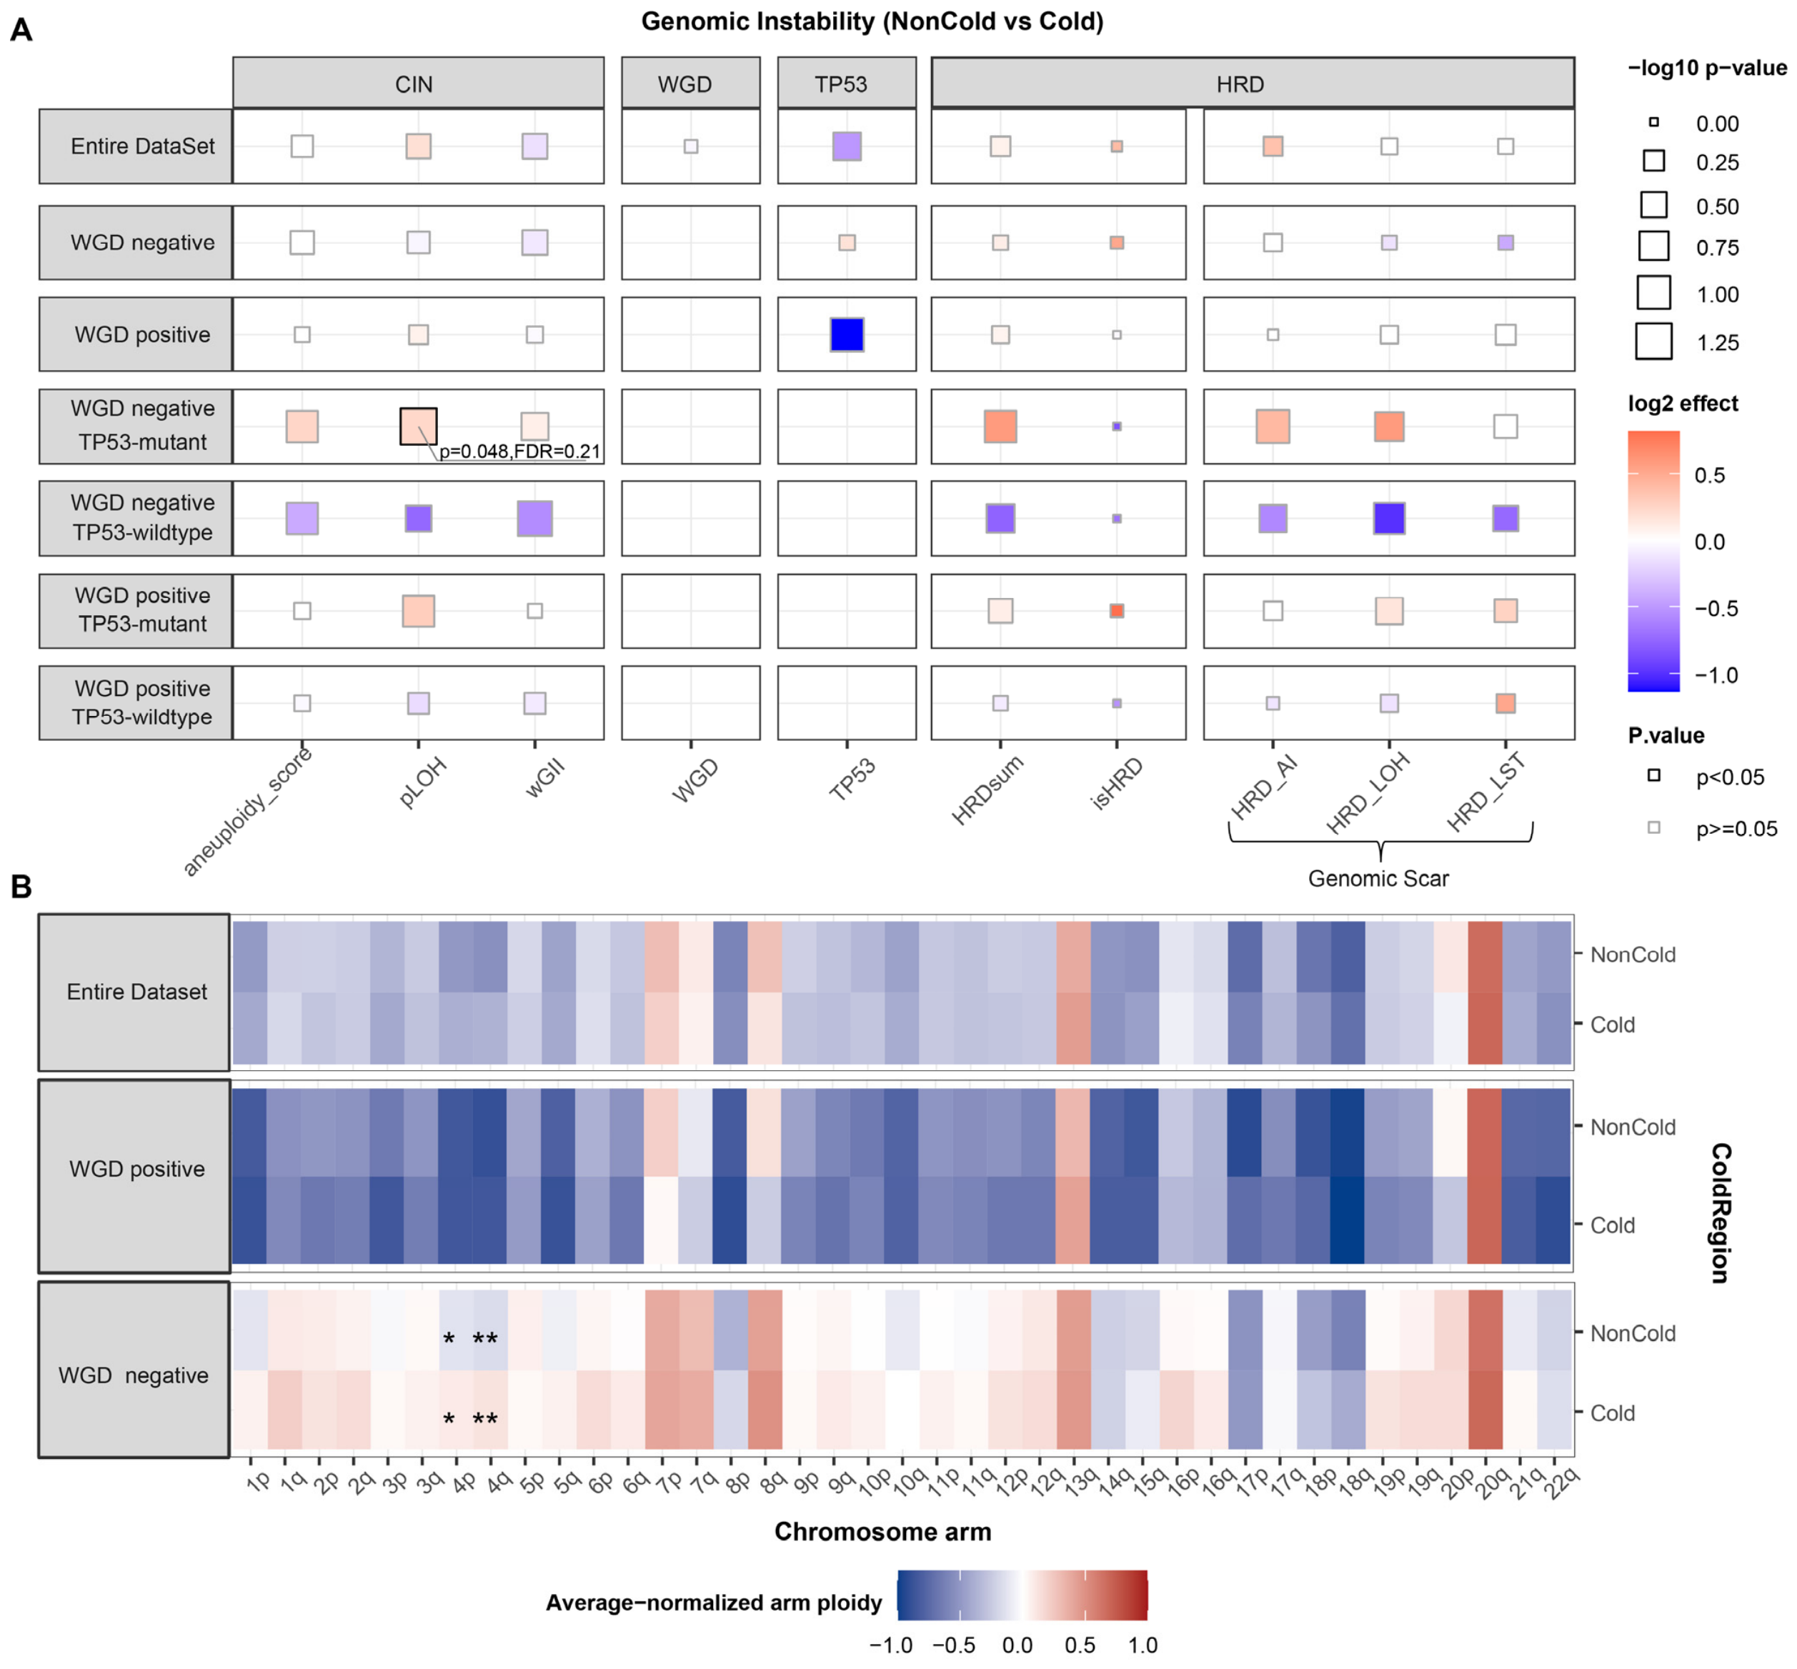
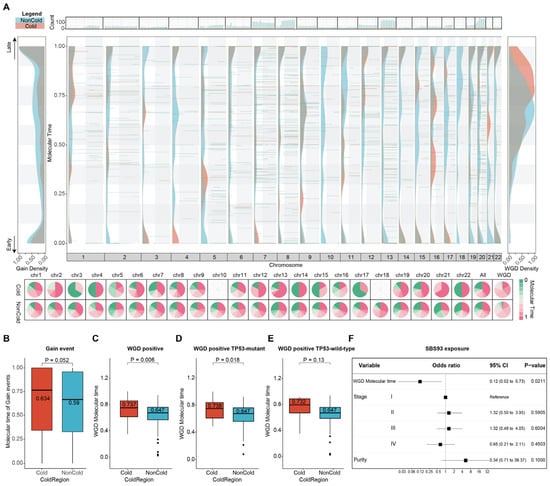
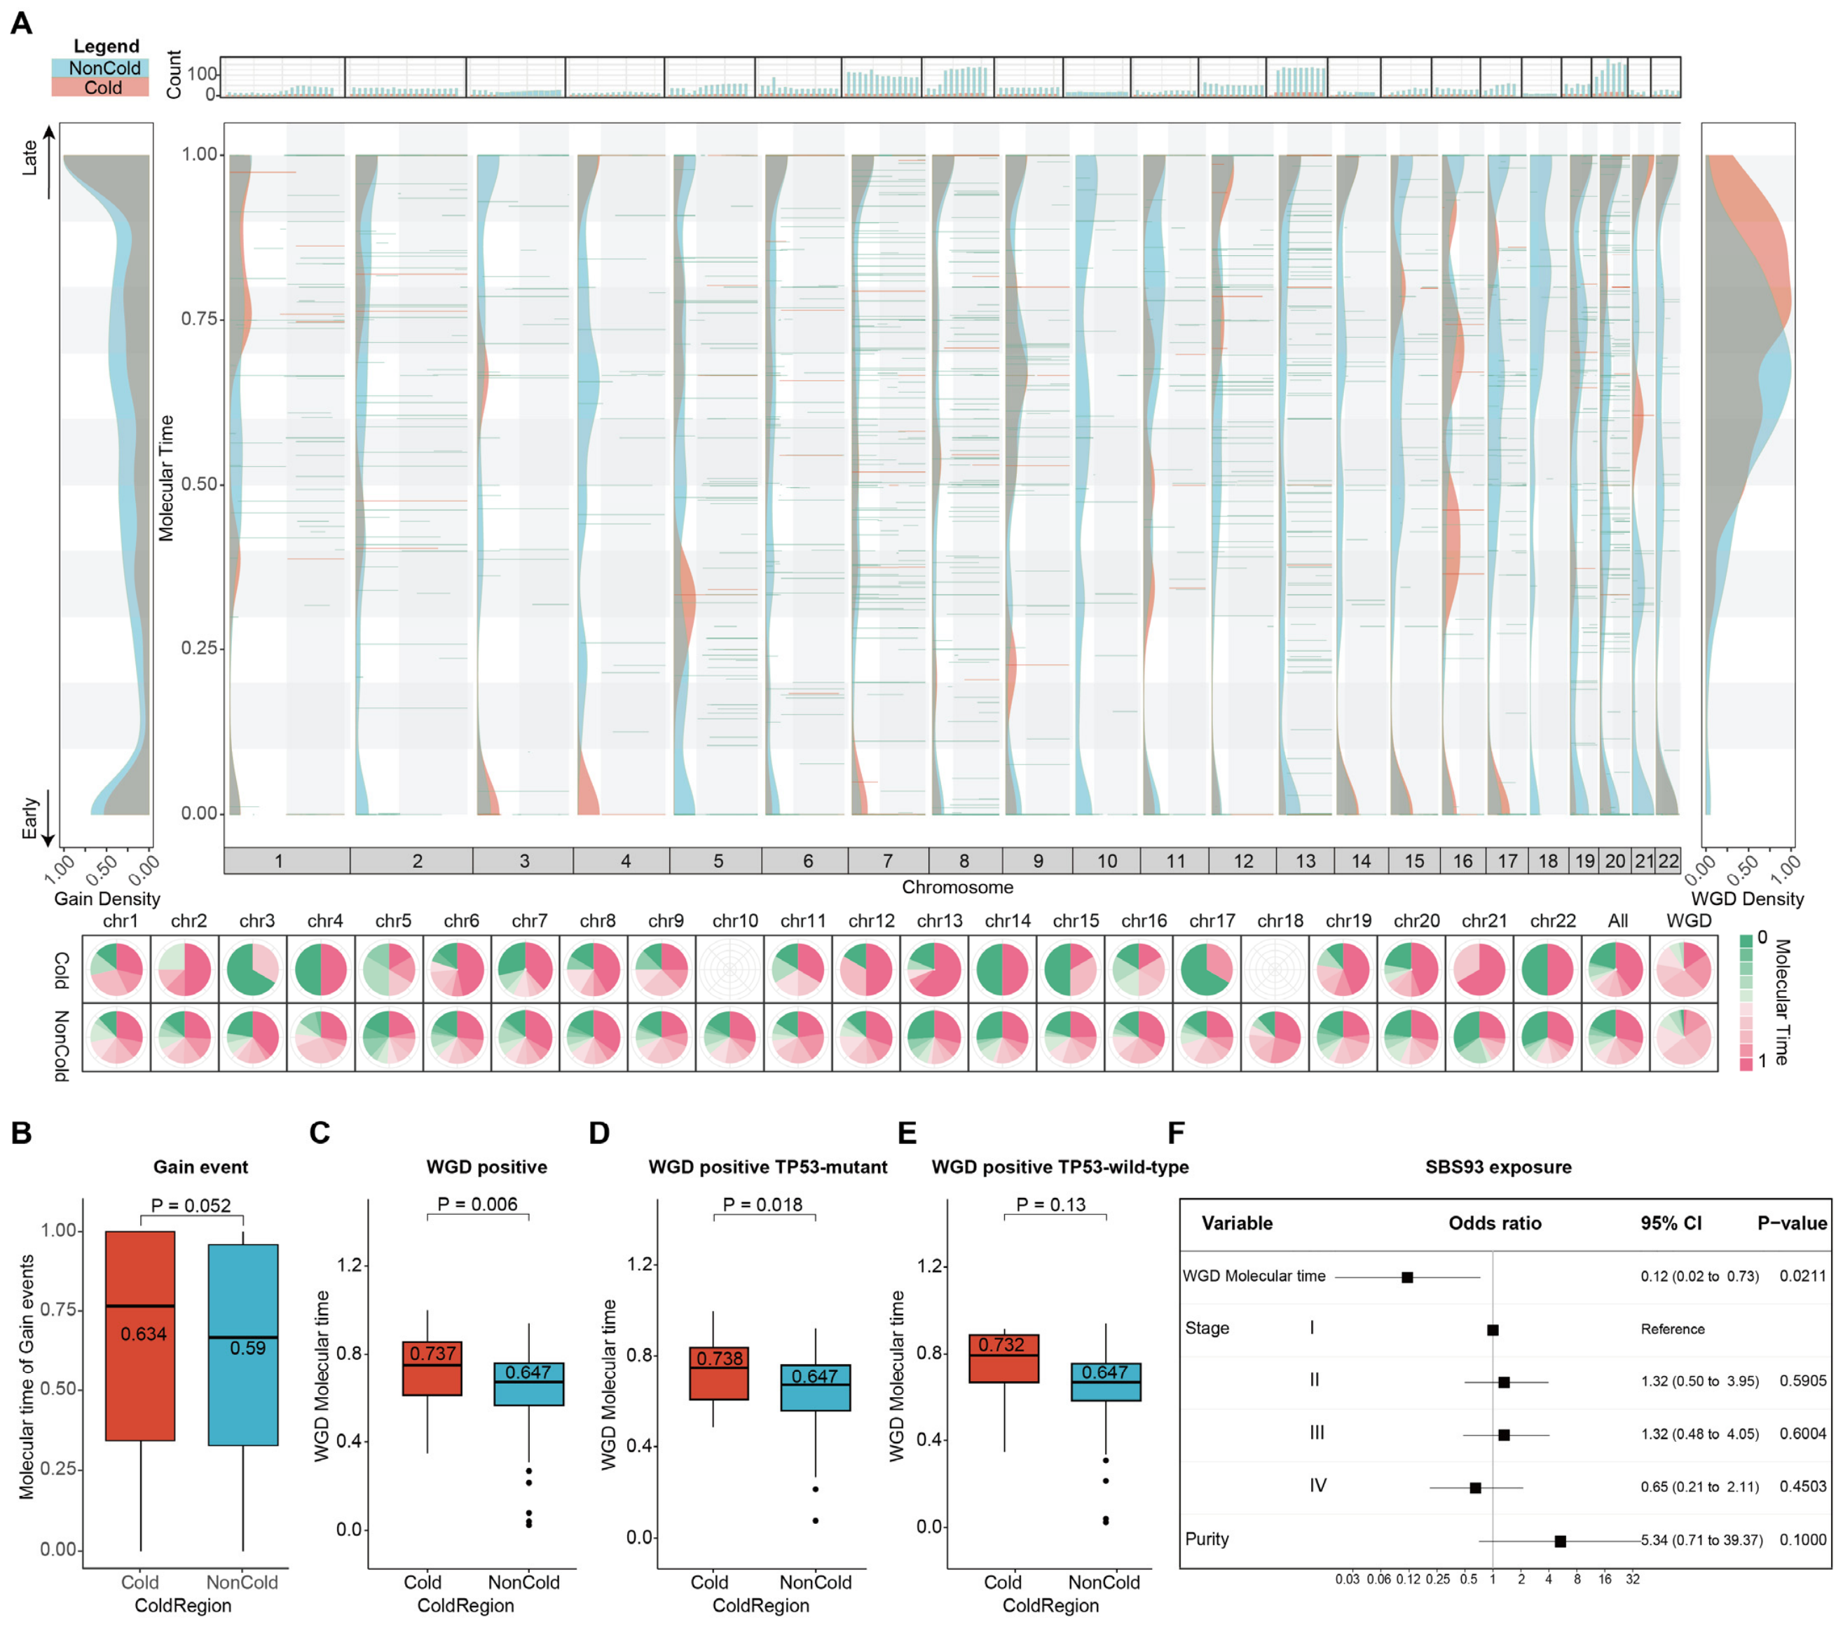
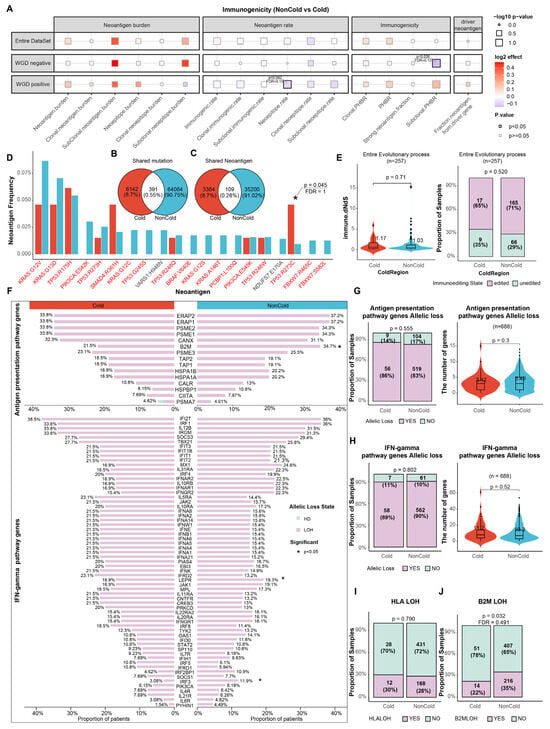
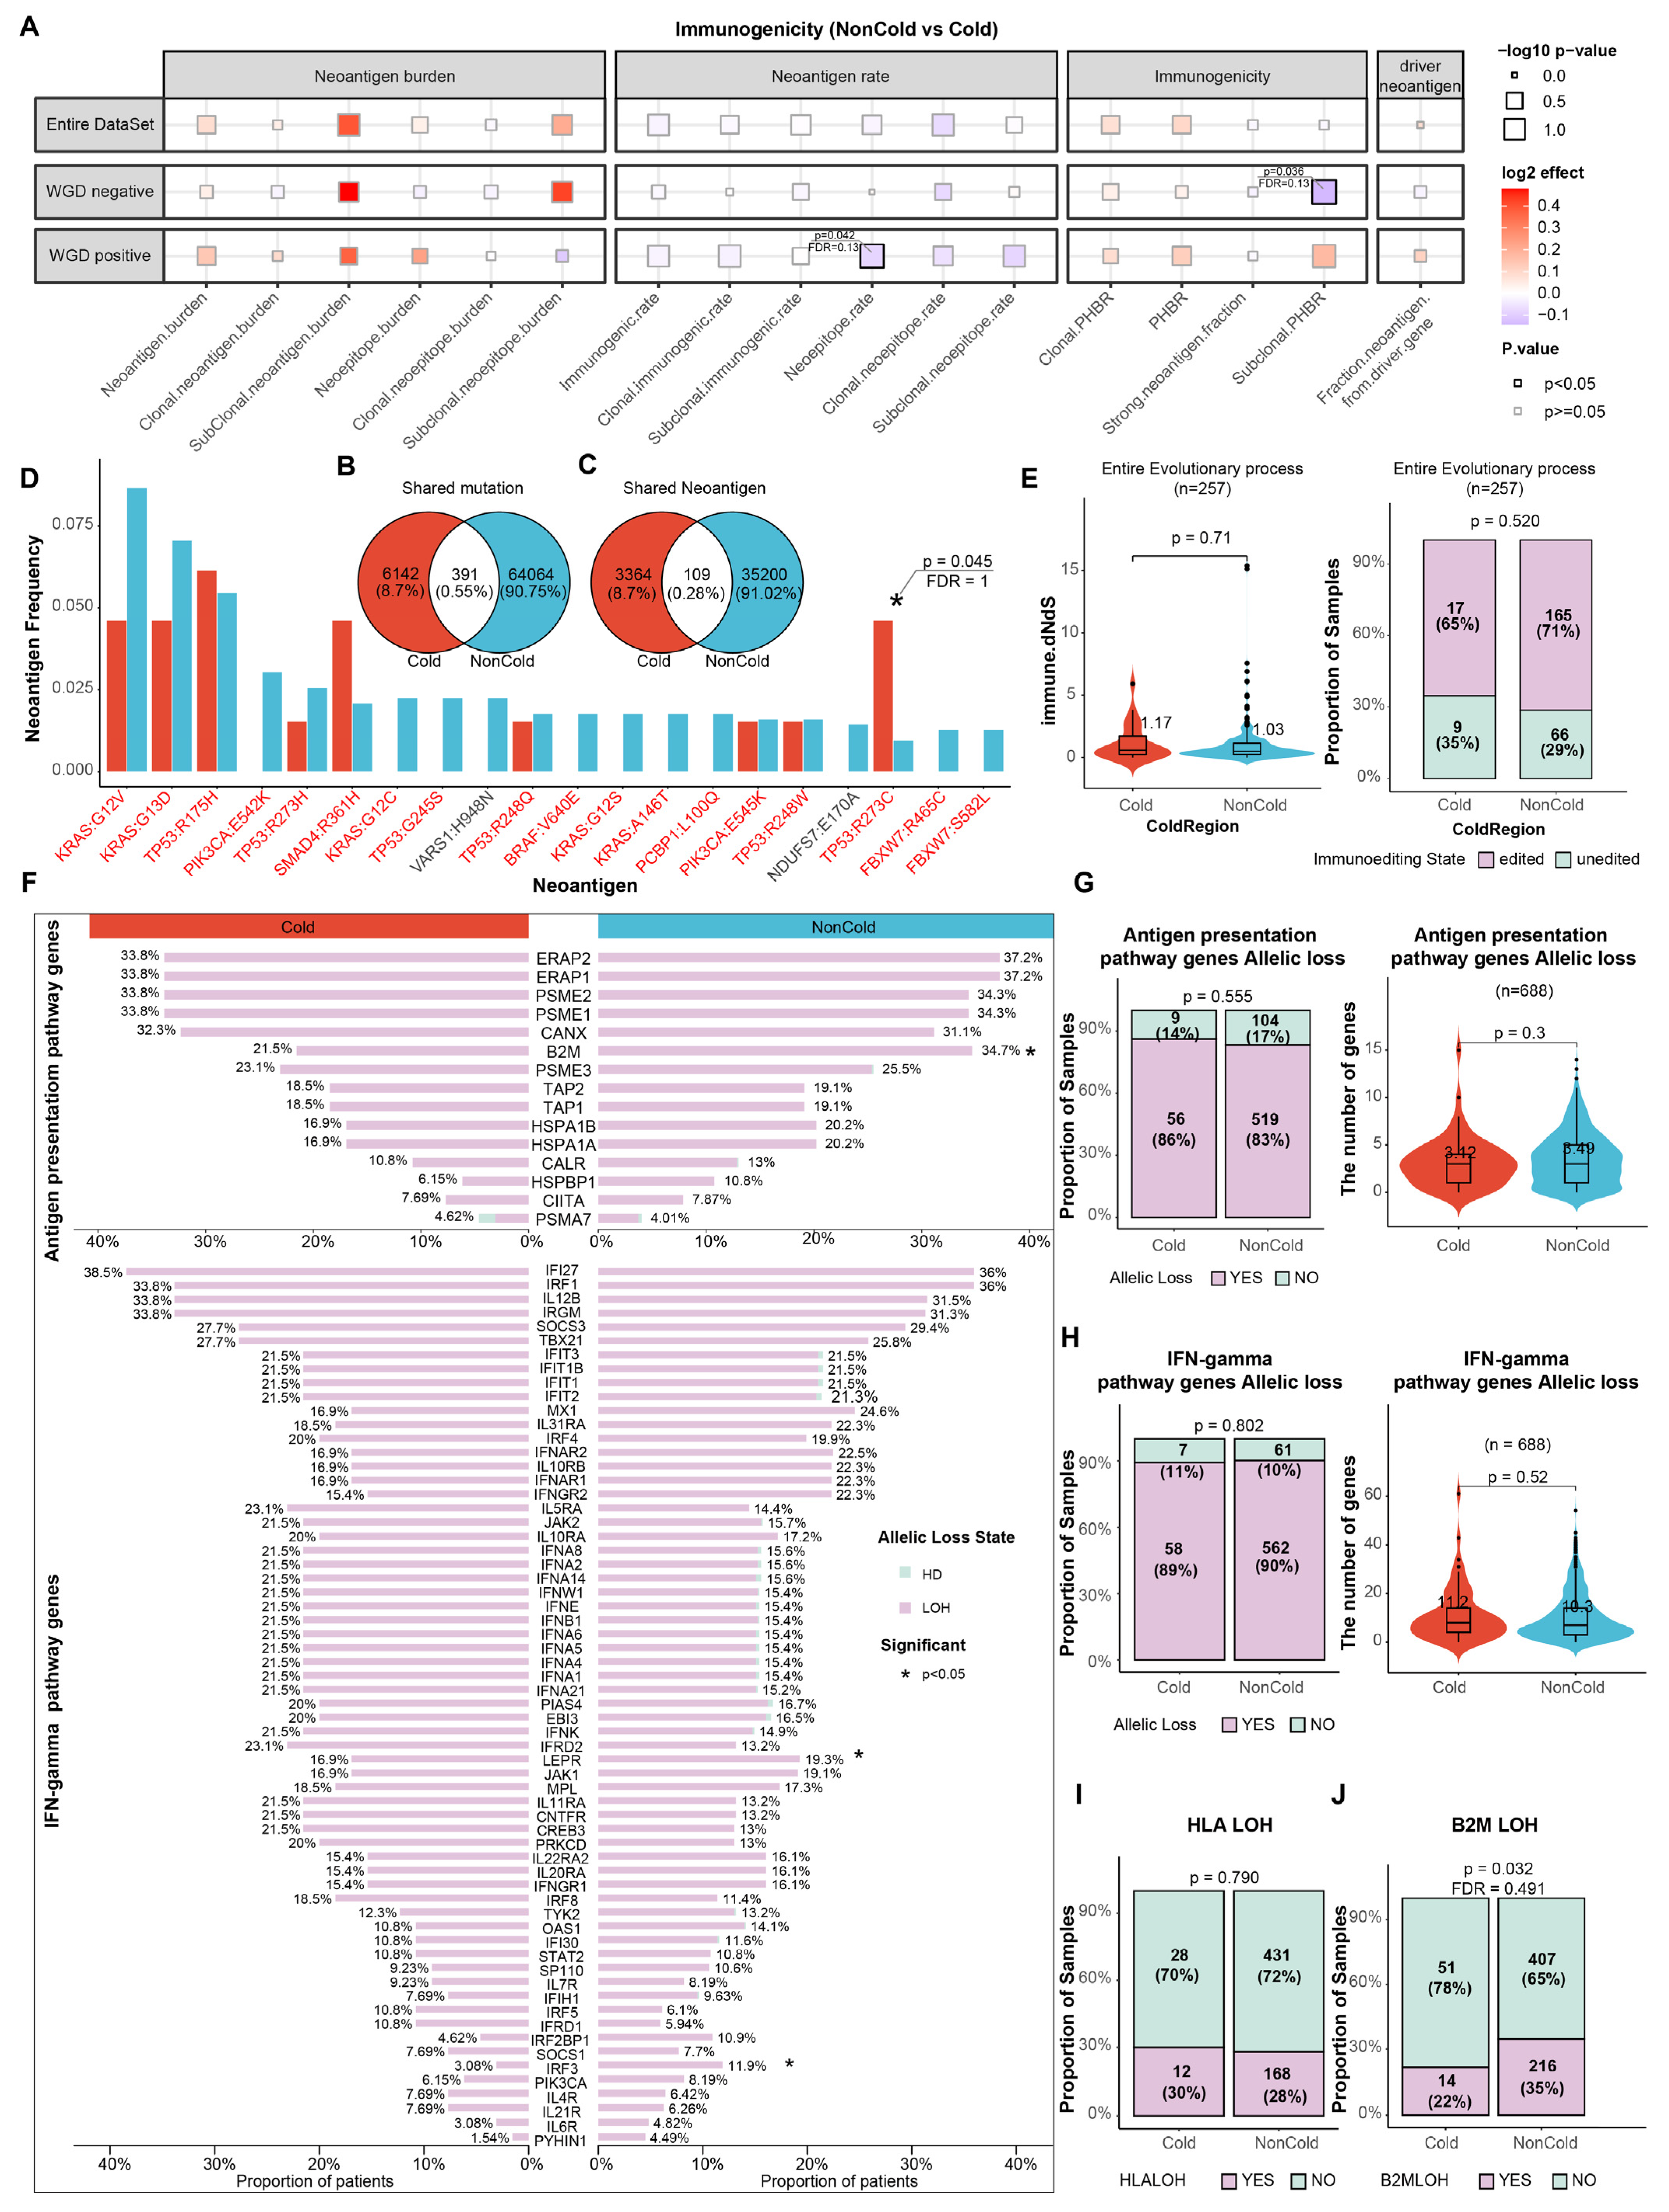
Disclaimer/Publisher’s Note: The statements, opinions and data contained in all publications are solely those of the individual author(s) and contributor(s) and not of MDPI and/or the editor(s). MDPI and/or the editor(s) disclaim responsibility for any injury to people or property resulting from any ideas, methods, instructions or products referred to in the content. |
© 2026 by the authors. Licensee MDPI, Basel, Switzerland. This article is an open access article distributed under the terms and conditions of the Creative Commons Attribution (CC BY) license.