


Abstract
Increased kidney lipid content during obesity contributes to obesity-related kidney injury but mechanisms of renal lipid accumulation during obesity are incompletely understood. Lean mice also accumulate renal lipid during fasting but how kidney lipid metabolism responds to fasting during obesity is not clear. Mice fed a normal diet (ND) or a high-fat diet (HFD) for 17 weeks underwent either ad libitum feeding (NDfd and HFDfd) or an overnight 16 h fast (NDfa and HFDfa) before measurement of renal lipid and kidney transcriptomics by RNA-seq. Renal triglyceride was increased in NDfa mice compared to NDfd mice and also increased in HFDfd mice compared to NDfd. However HFDfa mice did not have greater renal triglyceride than HFDfd mice. RNA-seq demonstrated increased fatty acid metabolism gene expression in NDfa and HFDfa mice compared to the fed controls, but was significantly greater in NDfa than HFDfa mice. Peroxisomal gene expression was also enriched in NDfa compared to HFDfa mice. Expression of peroxisomal fatty acid oxidation genes Acox1 and Ehhadh, increased in NDfa compared to NDfd, while expression of these genes was not changed in HFDfa compared to HFDfd. These results indicate that obesity blunts fasting-induced peroxisomal fatty acid oxidation gene expression.
1. Introduction
The prevalence of chronic kidney disease (CKD) has risen dramatically in the past several decades, contributing significantly to rising health care costs [1,2]. Obesity represents an important independent risk factor for the development and progression of CKD beyond the effects of hypertension and diabetes [3,4]. Nonetheless, the current therapeutic approach to patients with CKD focuses primarily on the control of blood pressure and hyperglycemia, and is incompletely effective [5]. This illustrates the need for a better understanding of the pathophysiologic changes that occur in the kidney with obesity in order to develop new management strategies.
Lipotoxicity has recently been recognized as a significant contributing factor in obesity-related kidney injury. In this process, excess ectopic deposition of lipid in the renal cortex leads to mitochondrial dysfunction, oxidative stress, inflammation, and ultimately cell death, fibrosis and renal dysfunction [6,7,8]. However, how this lipid accumulation takes place during obesity and how it promotes cellular dysfunction are incompletely understood, although accumulation of circulating lipid, impaired renal fatty acid oxidation, and increased renal lipogenesis have all been implicated [9,10].
Acute fasting is one setting in which physiologic renal lipid accumulation is known to occur in the absence of obesity [11]. However, there is limited information about how renal lipid accumulation during fasting in lean individuals differs from the kidney’s response to fasting during obesity. One recent study has suggested that processes like lipogenesis in the kidney are less responsive to fasting in obese mice, but further information on overall lipid accumulation and other components of lipid biochemistry like fatty acid oxidation remained unexplored [12]. We therefore designed this study using direct quantitation of renal lipid and state-of-the-art transcriptomics to investigate how renal lipid metabolism gene expression changes during acute fasting in the setting of diet-induced obesity.
2. Results
2.1. HFD Increased Mouse Body Weight and Early Markers of Obesity-Related Kidney Injury
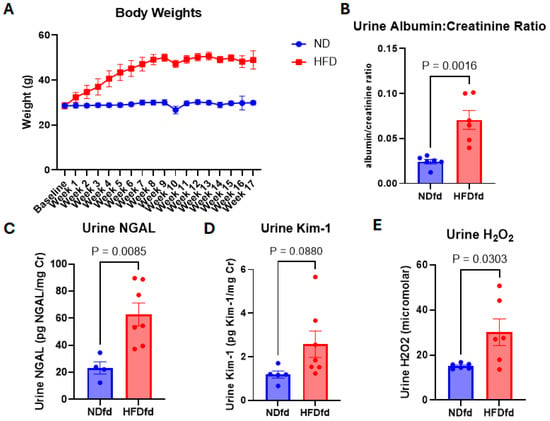
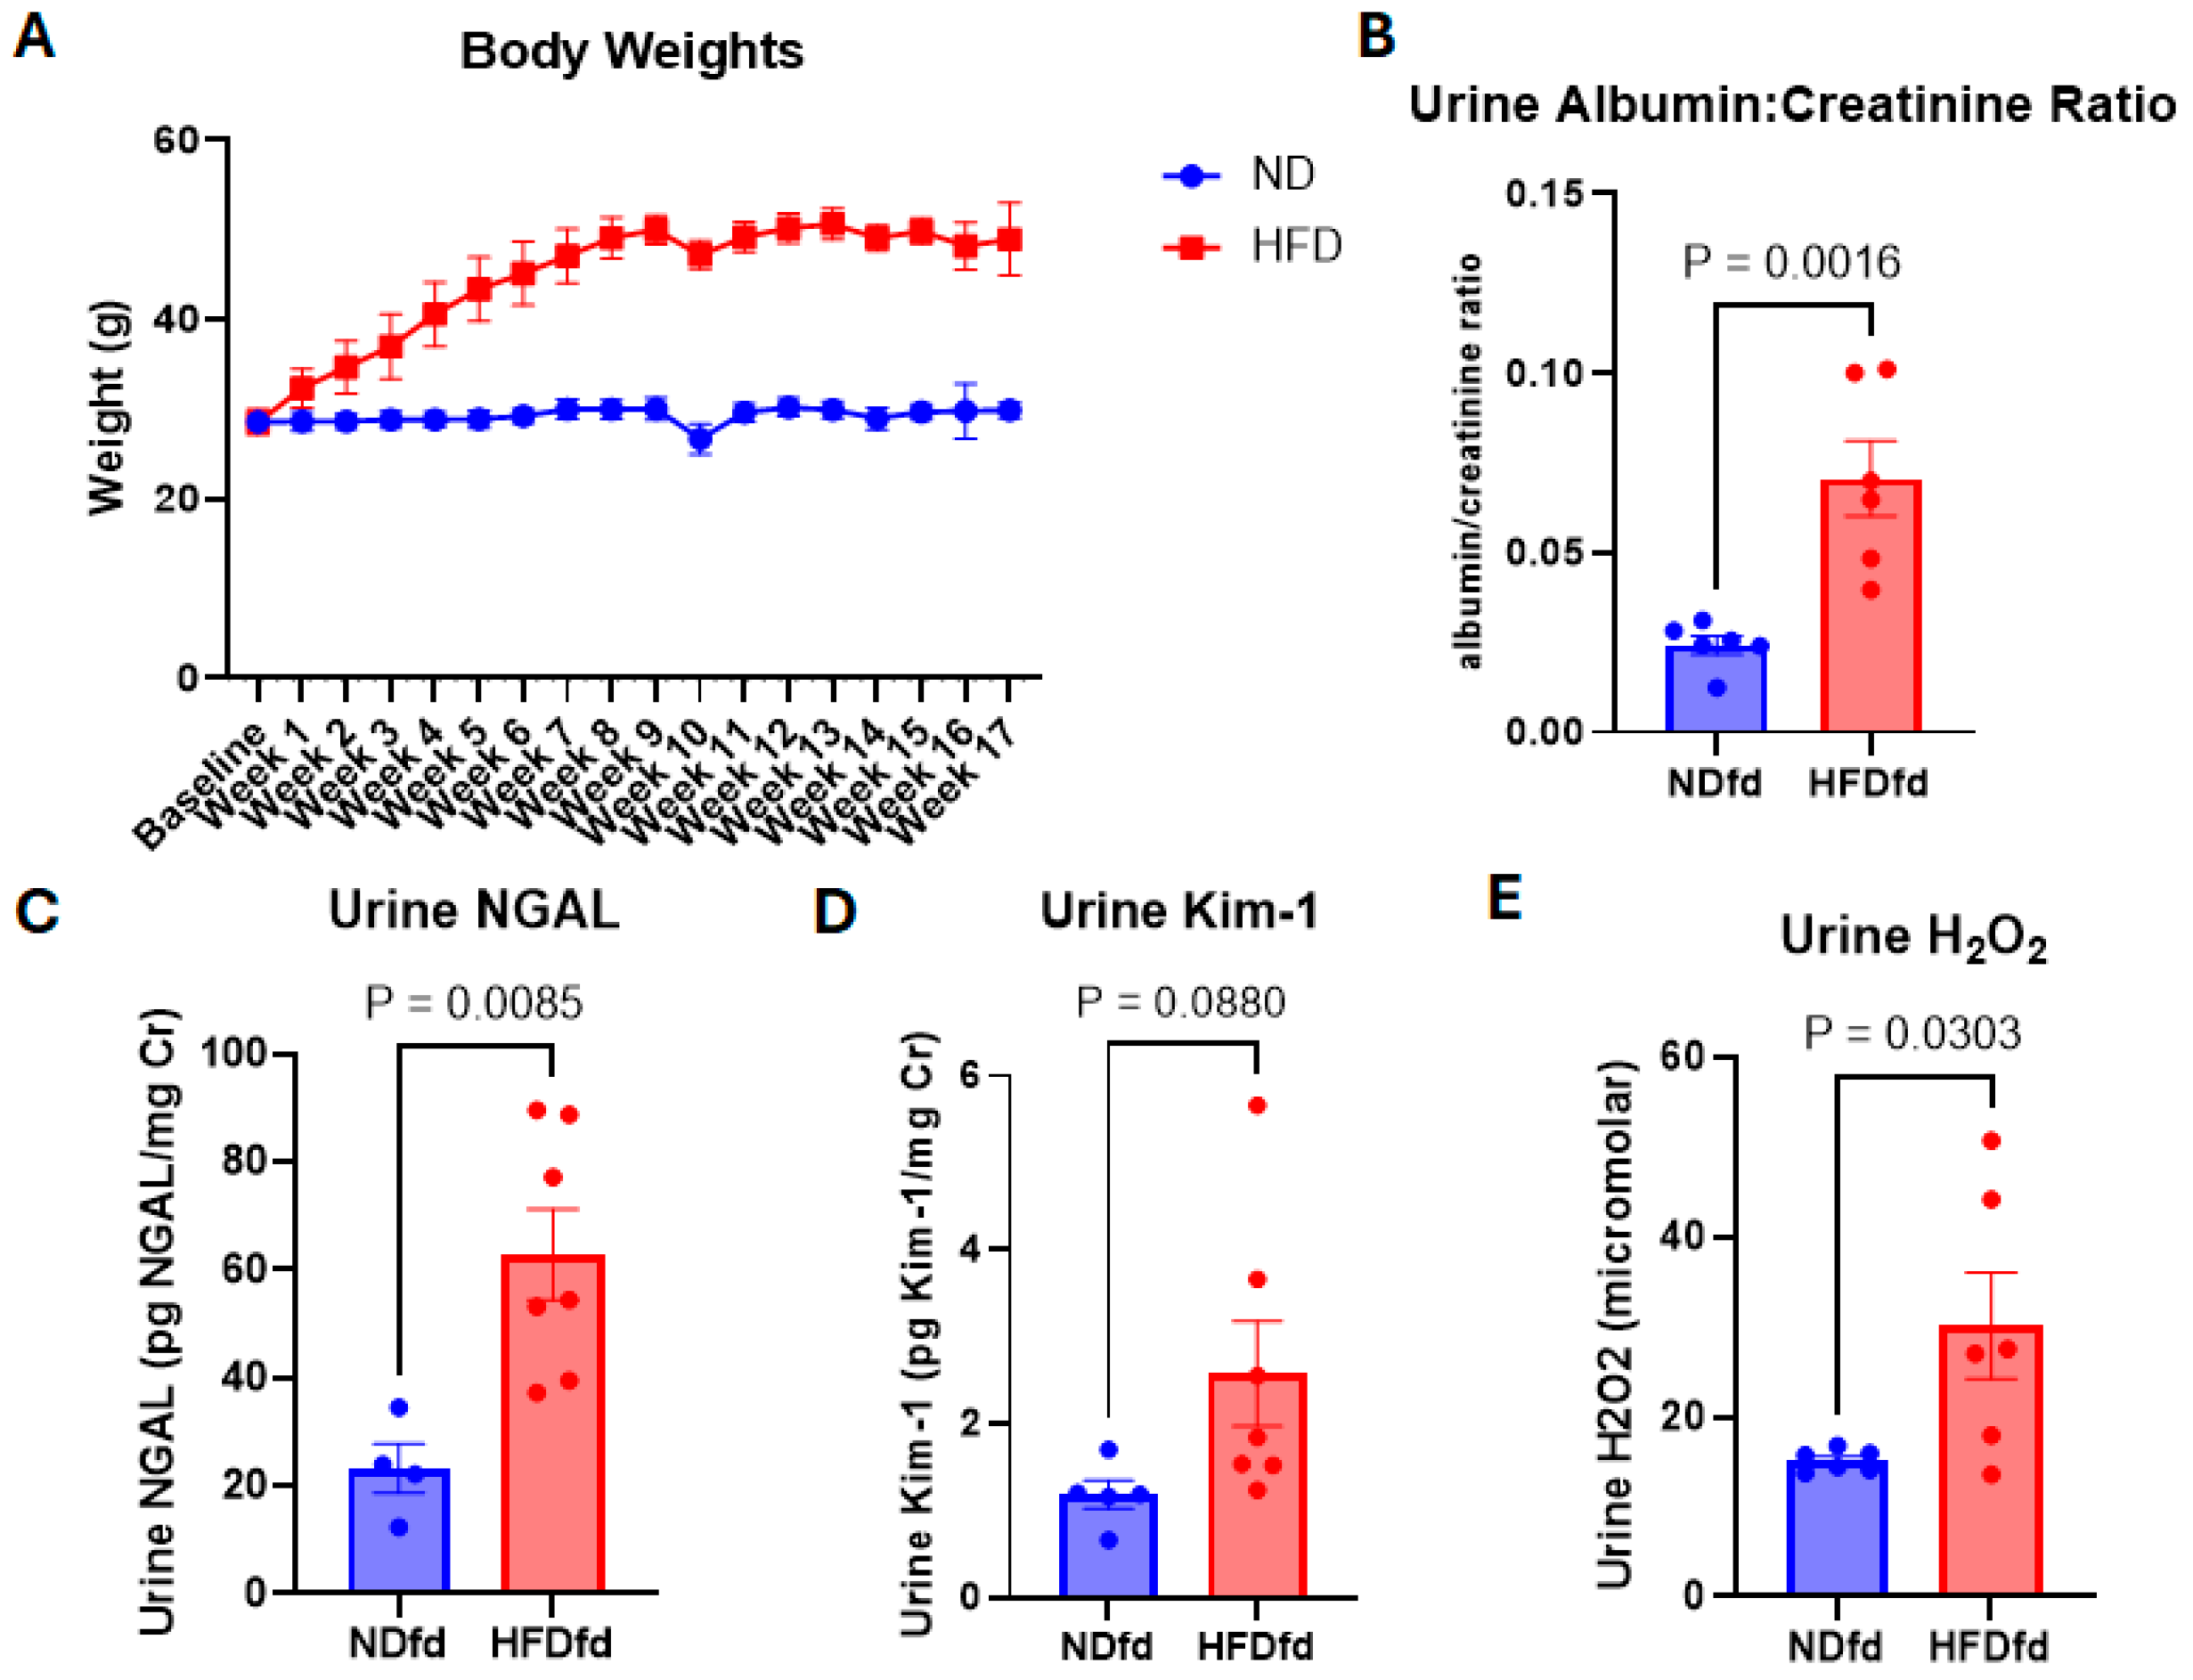
Starting weights were similar between mice on ND and mice on HFD with average starting weights of 28.6 ± 0.31 g and 28.59 ± 0.38 g, respectively. Mice on HFD had an average final weight of 48.99 ± 0.26 g compared to ND controls with an average final weight of 29.91 ± 0.07 g (p < 0.001) (Figure 1A). Urine obtained from the ad libitum fed groups after 10 weeks of diet was also used to assess for evidence of early kidney injury. Urine albumin:creatinine ratio (Figure 1B) was significantly higher in mice on HFD than in mice on ND (p = 0.0016). Urine NGAL and Kim-1 are established early markers of kidney injury in obesity-related kidney disease [13,14]. Urine NGAL (Figure 1C) increased nearly 3-fold in mice on HFD compared to ND controls (p = 0.0085) while urine Kim-1 (Figure 1D) trended upward more than 2-fold (p = 0.088). Urine H2O2 is a reliable marker of renal oxidative stress [13,15]. In this study, urine H2O2 (Figure 1E) increased 97% with HFD treatment compared to mice on ND (p = 0.0303). These findings show that markers consistent with early obesity-related kidney injury were increased in mice on HFD.
Figure 1.
Mouse body weight and urine injury markers in ND versus HFD fed mice. (A) Average weekly body weights of mice on ND versus HFD through 17 weeks on ND vs. HFD, (B) urine albumin:creatinine ratio in ad libitum ND vs. HFD fed mice after 10 weeks on diet, (C) urine NGAL normalized to urine creatinine concentration in ND vs. HFD fed mice after 10 weeks on diet, (D) urine Kim-1 normalized to urine creatinine concentration in ND vs. HFD mice after 10 weeks on diet, (E) urine H2O2 concentration in ND vs. HFD fed mice after 10 weeks on diet. Data presented as mean ± SEM. p values calculated by student t-test.
2.2. Obesity Attenuates Fasting-Induced Kidney Triglyceride Accumulation Independent of Circulating NEFA
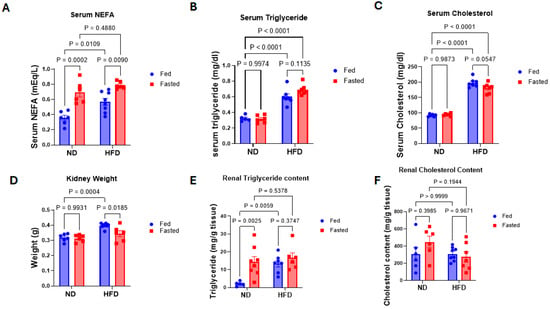
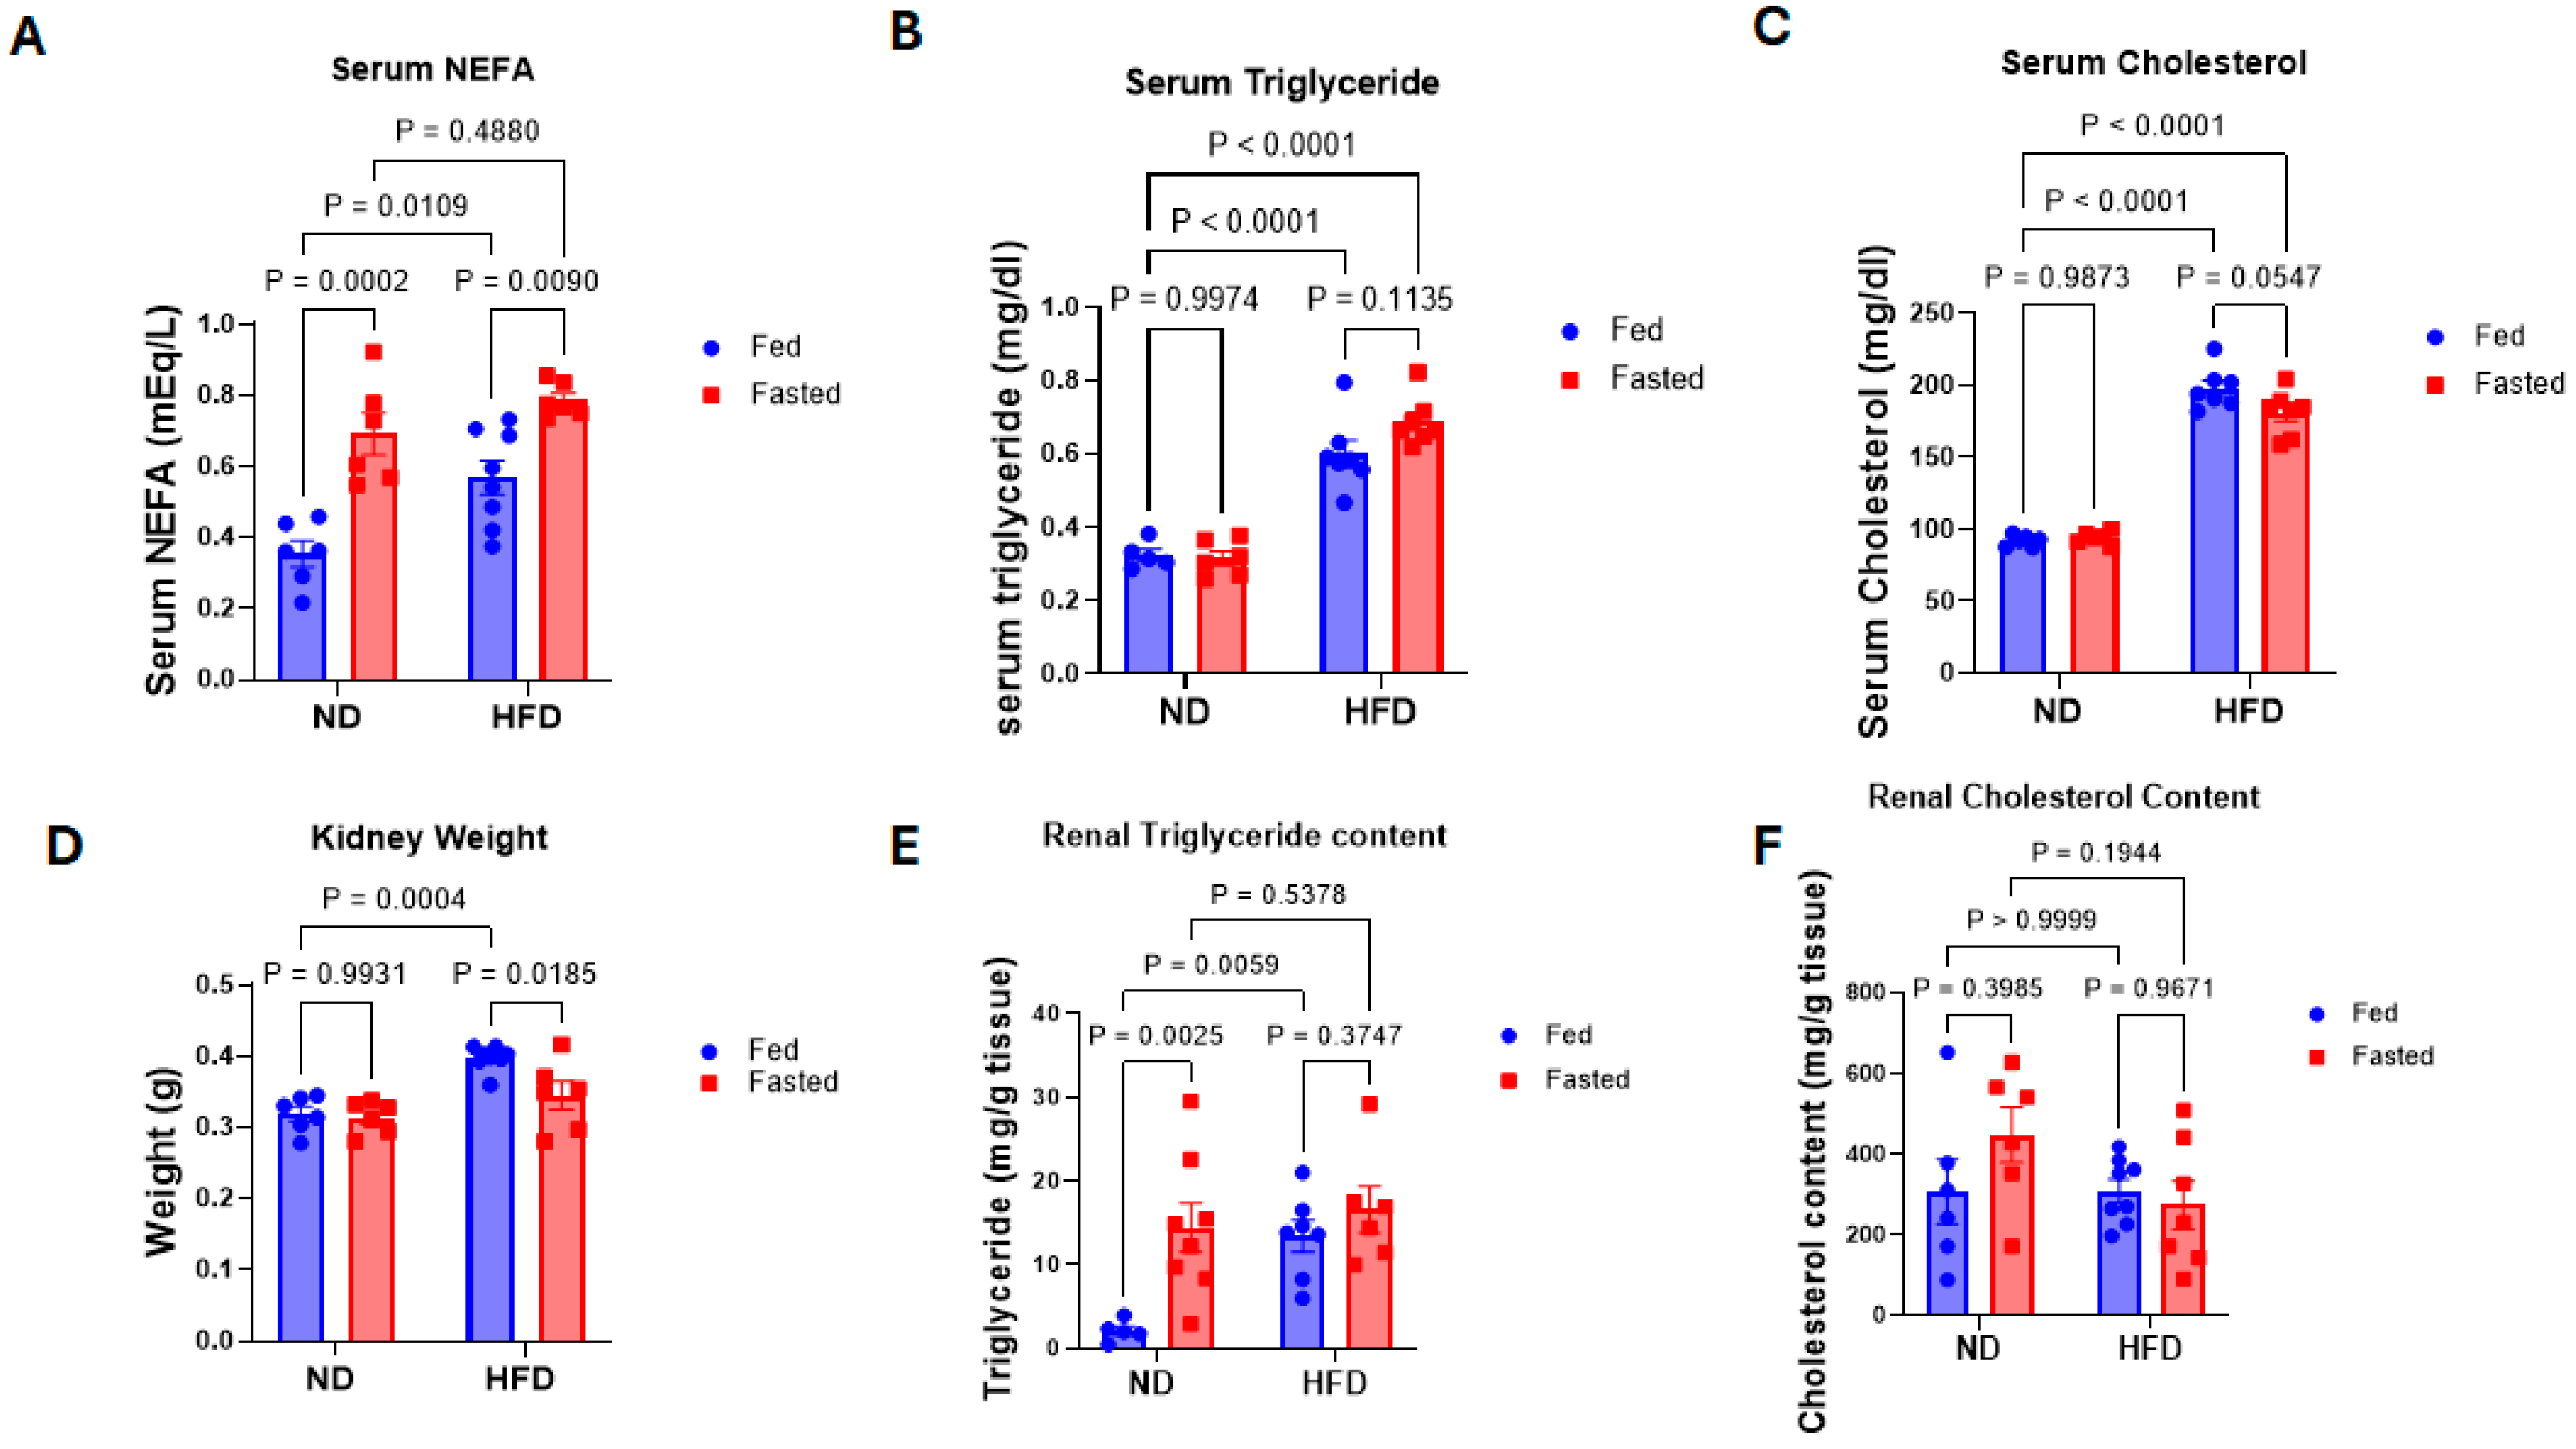
Following 17 weeks of ND or HFD feeding, mice in both diet groups underwent either a 16 h nocturnal fast or continued ad libitum feeding. Serum NEFA concentrations (Figure 2A) increased 60% in HFDfd mice compared to NDfd mice (p = 0.0109). Fasting significantly increased serum NEFA levels in mice on both ND (p = 0.0002) and HFD (p = 0.009) compared to their respective ad libitum controls. Serum triglyceride and cholesterol (Figure 2B,C) were both significantly increased in HFDfd mice compared to NDfd (p < 0.0001) but were not increased in NDfa compared to NDfd or HFDfa compared to HFDfd. Combined kidney weight (Figure 2D) increased 25% in HFDfd mice compared to NDfd controls (p = 0.0004). Kidney weight was unaffected by fasting in lean mice but decreased 24% in HFDfa mice compared to HFDfd mice (p = 0.0185). Kidney triglyceride content (Figure 2E) increased in NDfa compared to NDfd mice (p = 0.0025) and in HFDfd compared to NDfd mice (p = 0.0059). However, renal triglyceride content was not significantly different in HFDfa compared to HFDfd mice. Renal cholesterol (Figure 2F) was unaffected by either fasting or HFD.
Figure 2.
Serum and kidney lipid content fasting vs. fed in ND and HFD fed mice. Obtained after 17 weeks of diet treatment following either overnight ad libitum feeding or overnight 16 h fast. (A) Circulating serum NEFA concentration, (B) circulating serum triglyceride, (C) circulating serum cholesterol, (D) kidney weight at the time of euthanasia, (E) renal triglyceride content obtained from organic extraction normalized to kidney tissue weight, (F) renal cholesterol content obtained from organic extraction normalized to kidney tissue weight. Data presented as mean ± SEM. p values calculated by 2-way ANOVA.
2.3. Obesity Attenuates Fasting-Induced Upregulation of Fatty Acid Metabolism Pathways in the Kidney
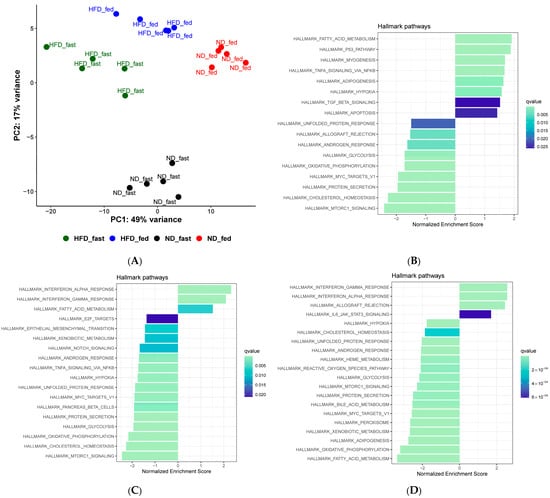
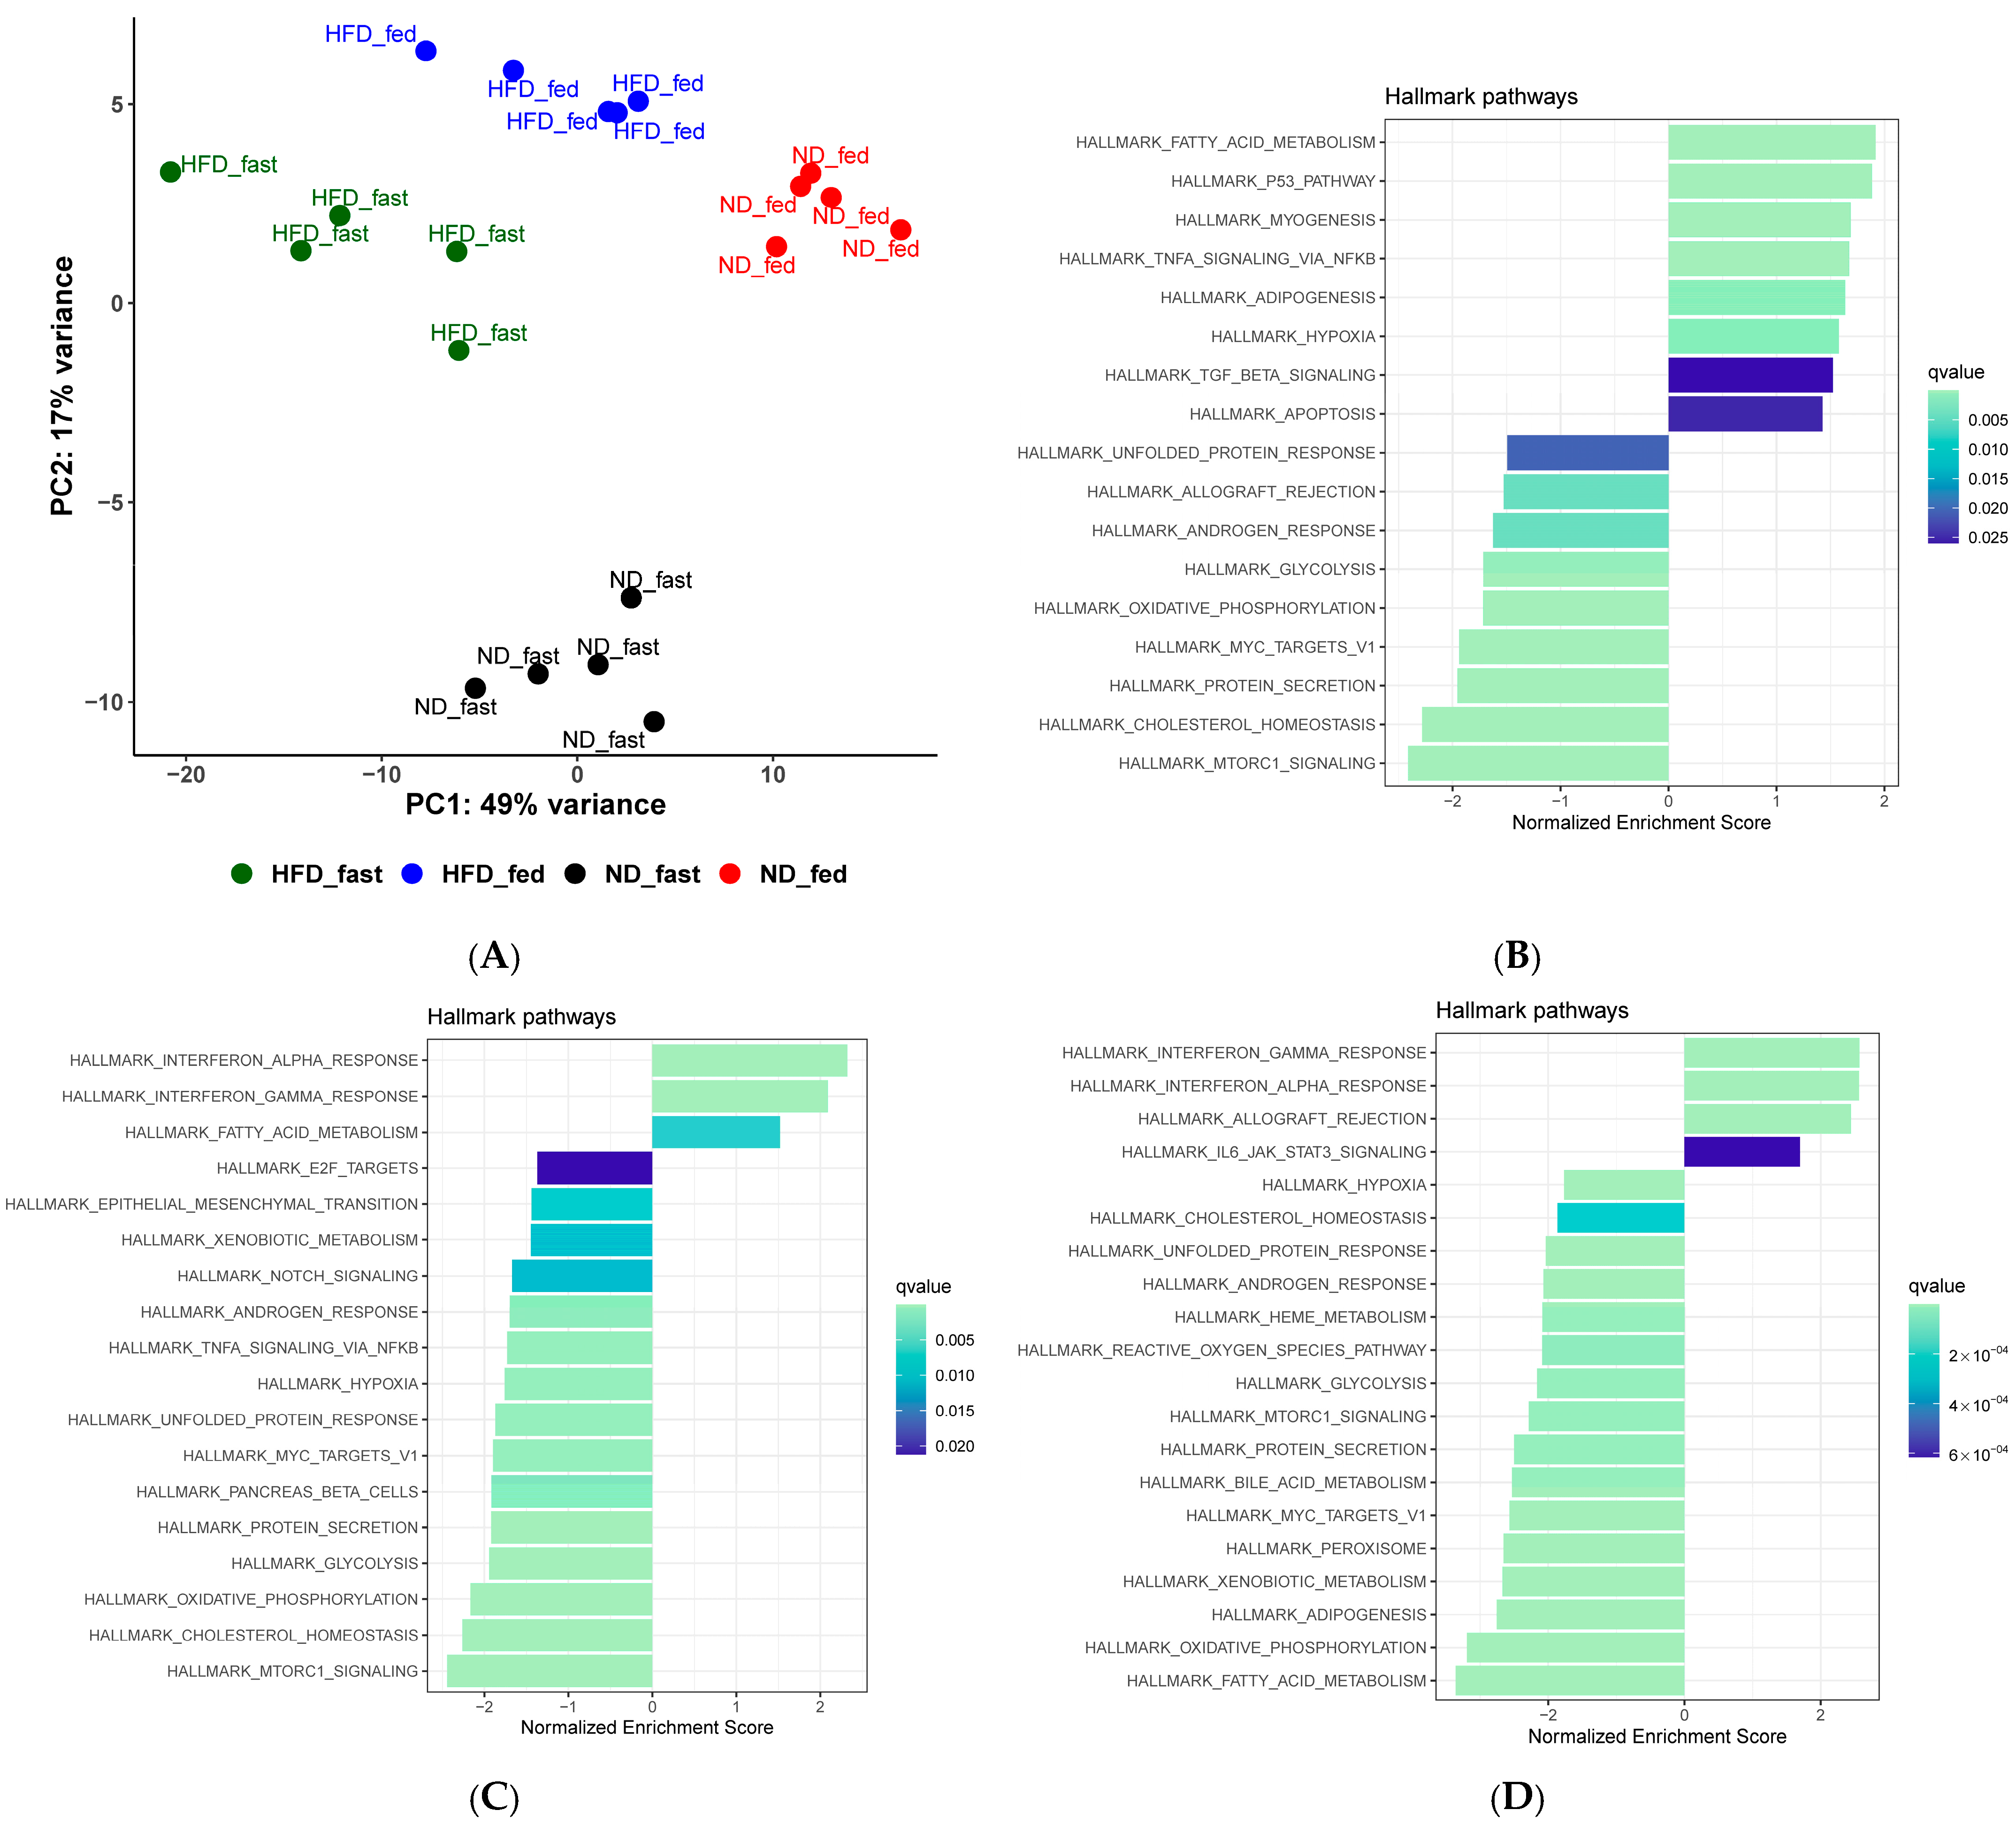
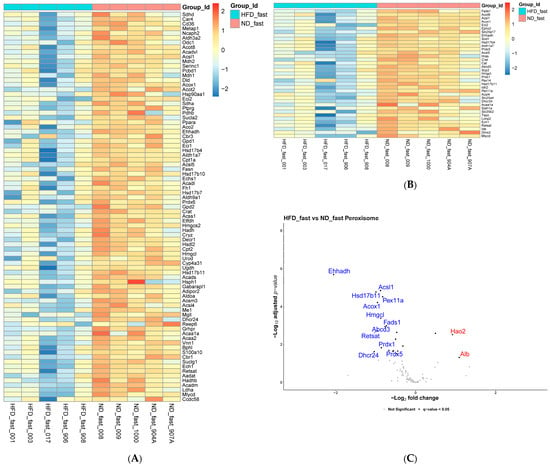
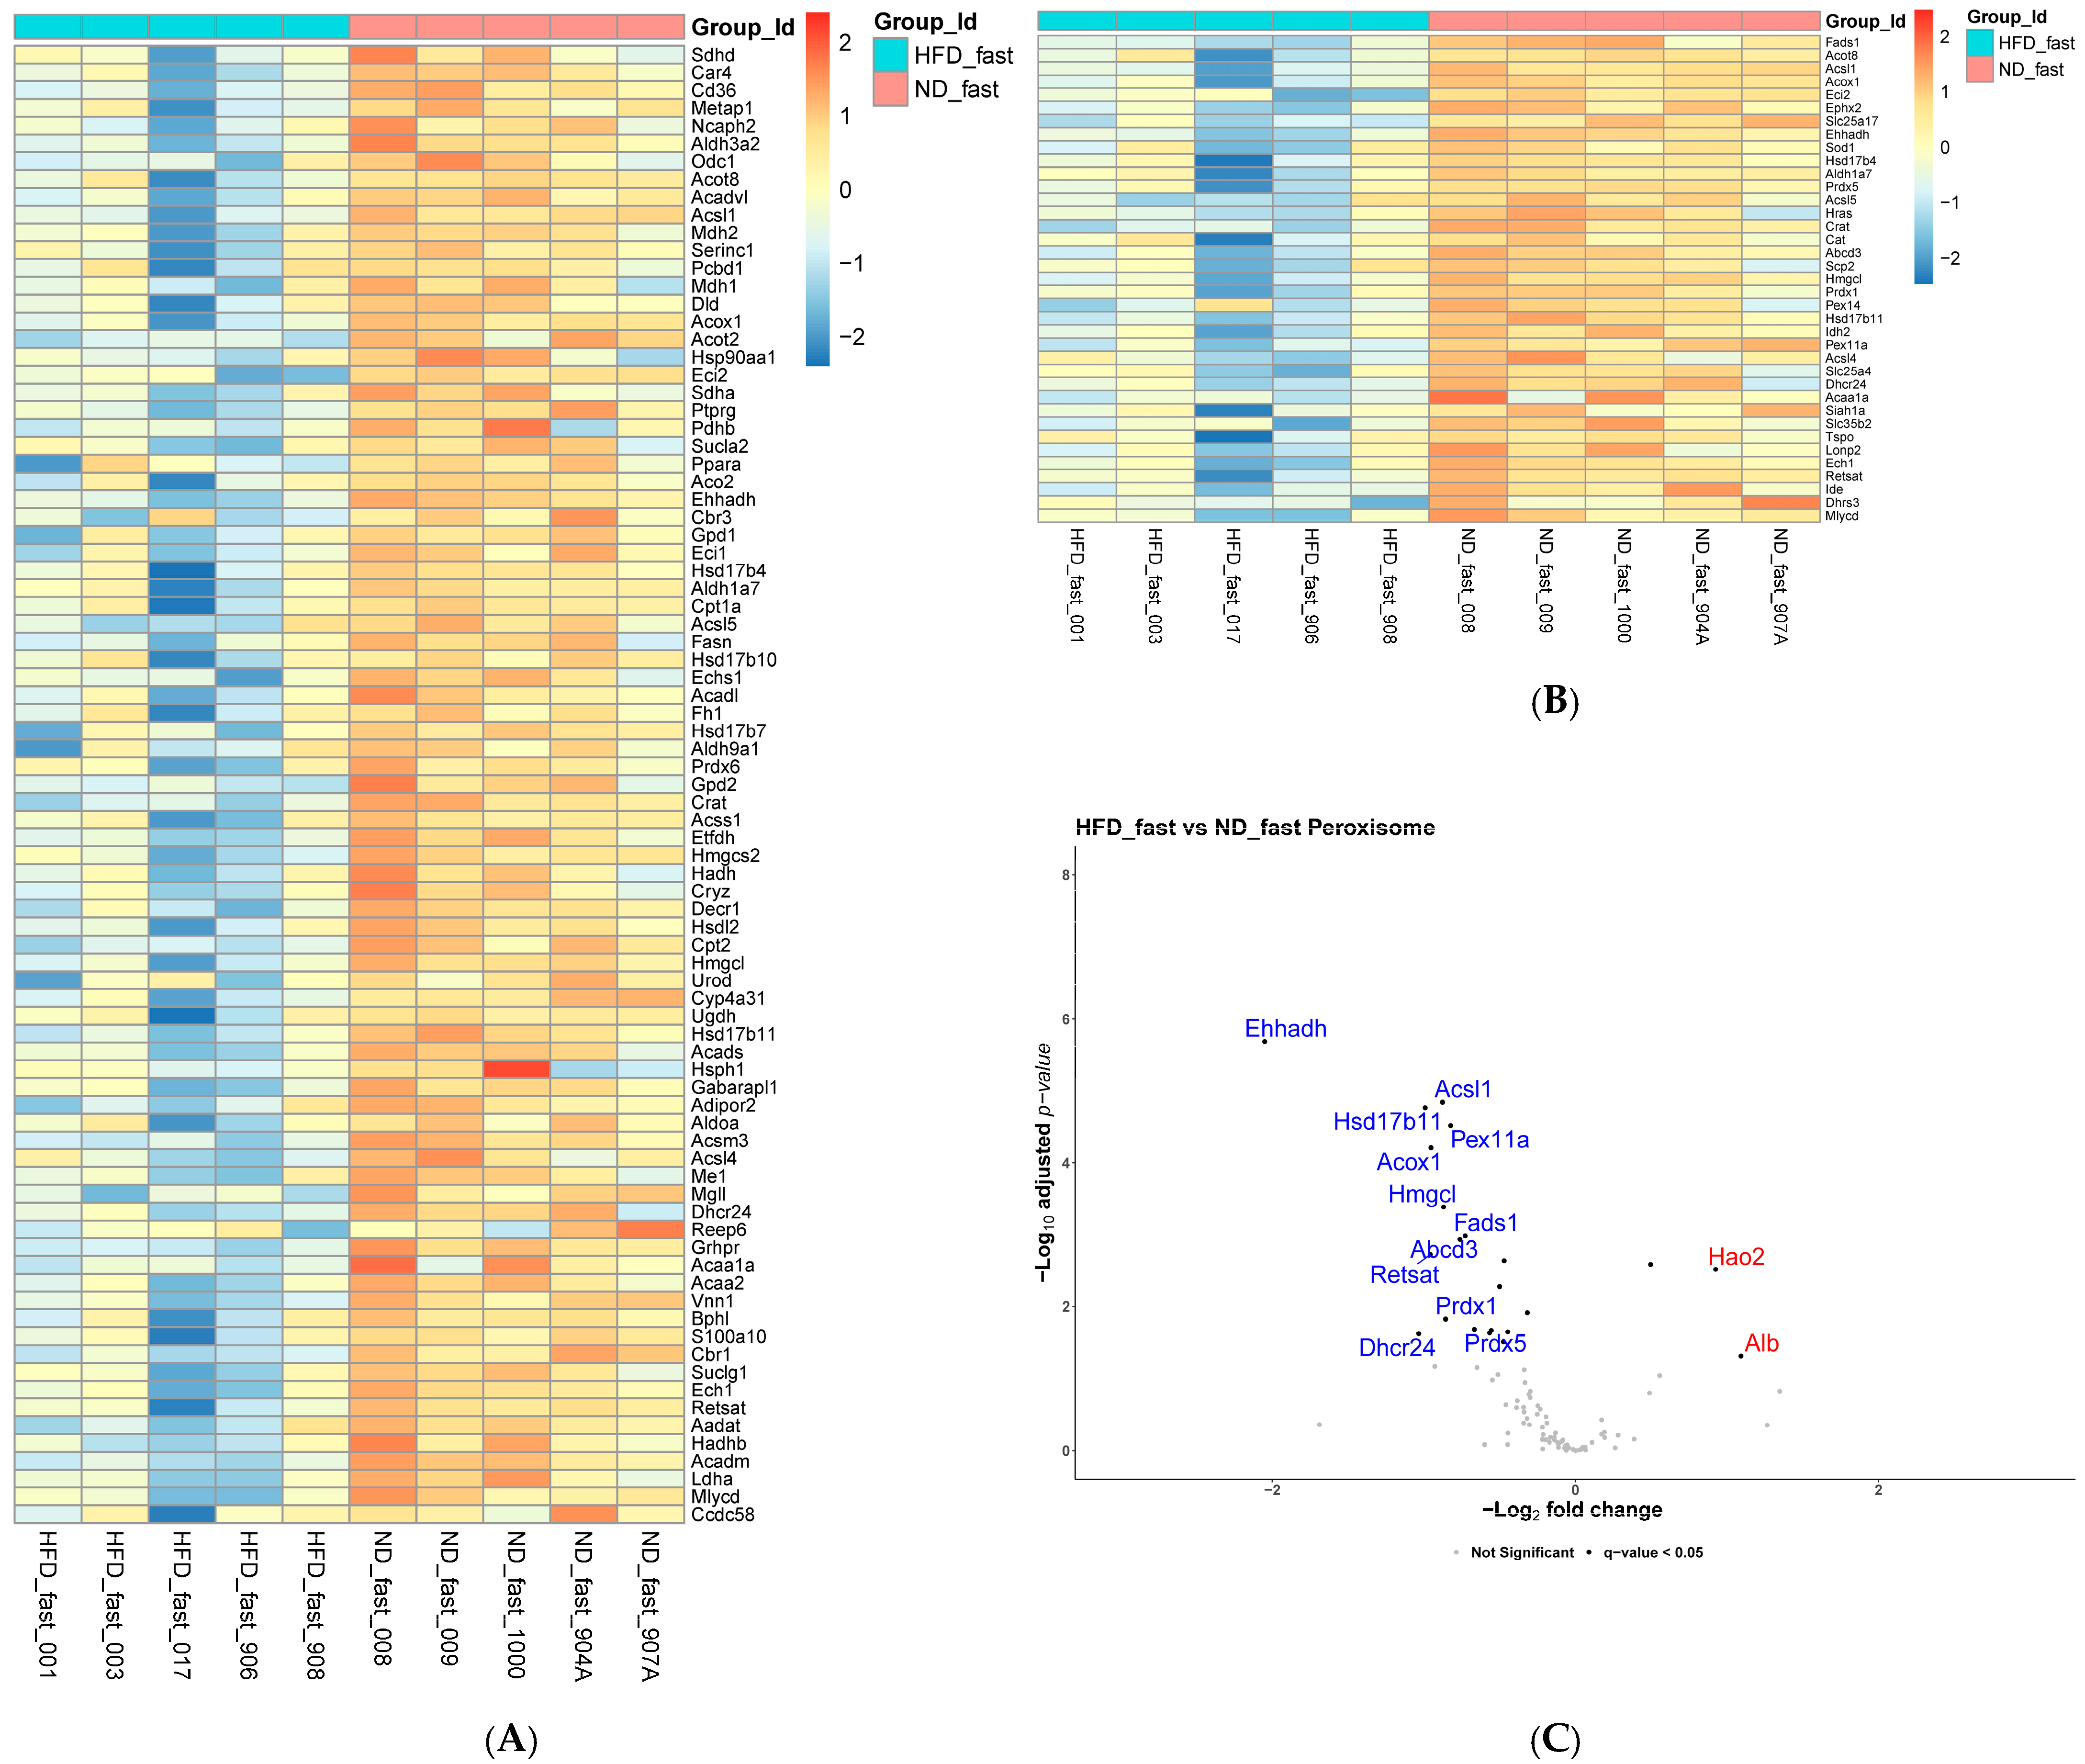
To investigate differences in the effect of fasting on kidney lipid metabolism between lean and obese mice, we conducted RNA-seq analysis on kidney tissue from all four groups of mice. PCA analysis (Figure 3A) demonstrated consistent clustering of each of the four treatment groups, indicating distinct patterns of gene expression for each set of conditions. Differential gene expression was performed using DESEq2 and genes were ranked before pathway analysis. Hallmark pathway analysis of these data further showed enrichment of fatty acid metabolism gene expression in mice on both ND and HFD (Figure 3B,C) compared to their respective fed controls. However, additional comparison of the gene expression between NDfa and HFDfa mice found that the fatty acid metabolism gene pathway was significantly more enriched in NDfa mice than in HFDfa mice (Figure 3D). To further characterize the differences in renal gene expression with fasting in lean compared to obese conditions, we next sought to determine which genes were responsible for the observed differences in lipid metabolism gene expression between these two groups. Pathway analysis had indicated that the Fatty Acid Metabolism and Peroxisome pathways were significantly more enriched in NDfa mice than in HFDfa mice. Figure 4 shows heat maps for the Hallmark Fatty Acid Metabolism pathway (A), Peroxisome pathway (B), and volcano plot of the Peroxisome pathway (C). Details of the significantly affected fatty acid oxidation genes are provided in Supplemental Table S6. Many of the most enriched fatty acid metabolism genes in the NDfa group were peroxisomal oxidation genes including Acox1 (log2foldchange −0.952, padj 6.183 × 10⁻⁵) and Ehhadh, (log2foldchange −2.049, padj 2.045 × 10⁻⁶), the enzymes responsible for the rate-limiting and subsequent two steps in peroxisomal fatty acid oxidation [16]. Similar analysis of the Peroxisome pathway (Figure 4B) further showed significantly greater expression of Acsl1 (log2foldchange −0.876, padj 1.429 × 10⁻⁵), Abcd3 (log2foldchange −0.761, padj 0.0011), and Pex11a in NDfa mice. Notably, expression of the rate-limiting enzyme for mitochondrial fatty acid oxidation, Cpt1a (log2foldchange −0.415, padj 0.119), was not significantly different between these two groups.
Figure 3.
PCA and pathway analysis from RNA sequencing of renal tissue. (A) PCA plot of RNA sequencing analysis of samples from all four treatment groups. (B) Hallmark pathway analysis on renal tissue comparing NDfa mice versus NDfd mice. Leftward trend indicates enrichment in NDfd and rightward trend indicates enrichment in NDfa. Color indicates q-value. (C) Hallmark pathway analysis on renal tissue comparing HFDfa versus HFDfd mice. Leftward trend indicates enrichment in HFDfd and rightward trend indicates enrichment in HFDfa. Color indicates q-value. (D) Hallmark pathway analysis on renal tissue comparing HFDfa versus NDfa mice. Leftward trend indicates enrichment in NDfa and rightward trend indicates enrichment in HFDfa. Color indicates q-value.
Figure 4.
Renal expression of fatty acid metabolism and peroxisomal genes in HFDfa versus NDfa mice. (A) Heat map of key enrichment genes in the hallmark fatty acid metabolism pathway for HFDfa versus NDfa mice. Color bar indicates degree of change in expression. (B) Heat map of key enrichment genes in hallmark peroxisome pathway for HFDfa versus NDfa mice. Color bar indicates degree of change in expression. (C) Volcano plot of genes from hallmark peroxisome pathway for HFDfa versus NDfa mice. Genes in blue and to the left are more enriched in NDfa mice and genes in red and to the right are more enriched in HFDfa mice. Highlighted genes had adjusted p-value < 0.05 and log2FoldChange > 0.58.
2.4. Obesity Prevented Fasting-Related Increases in Expression of Peroxisomal Fatty Acid Oxidation Genes
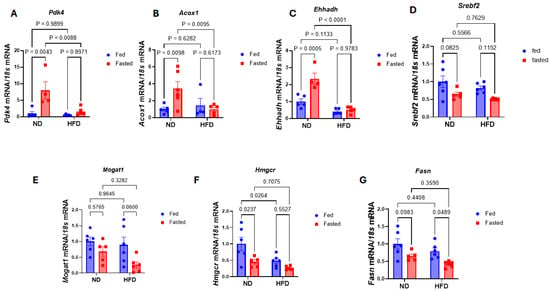
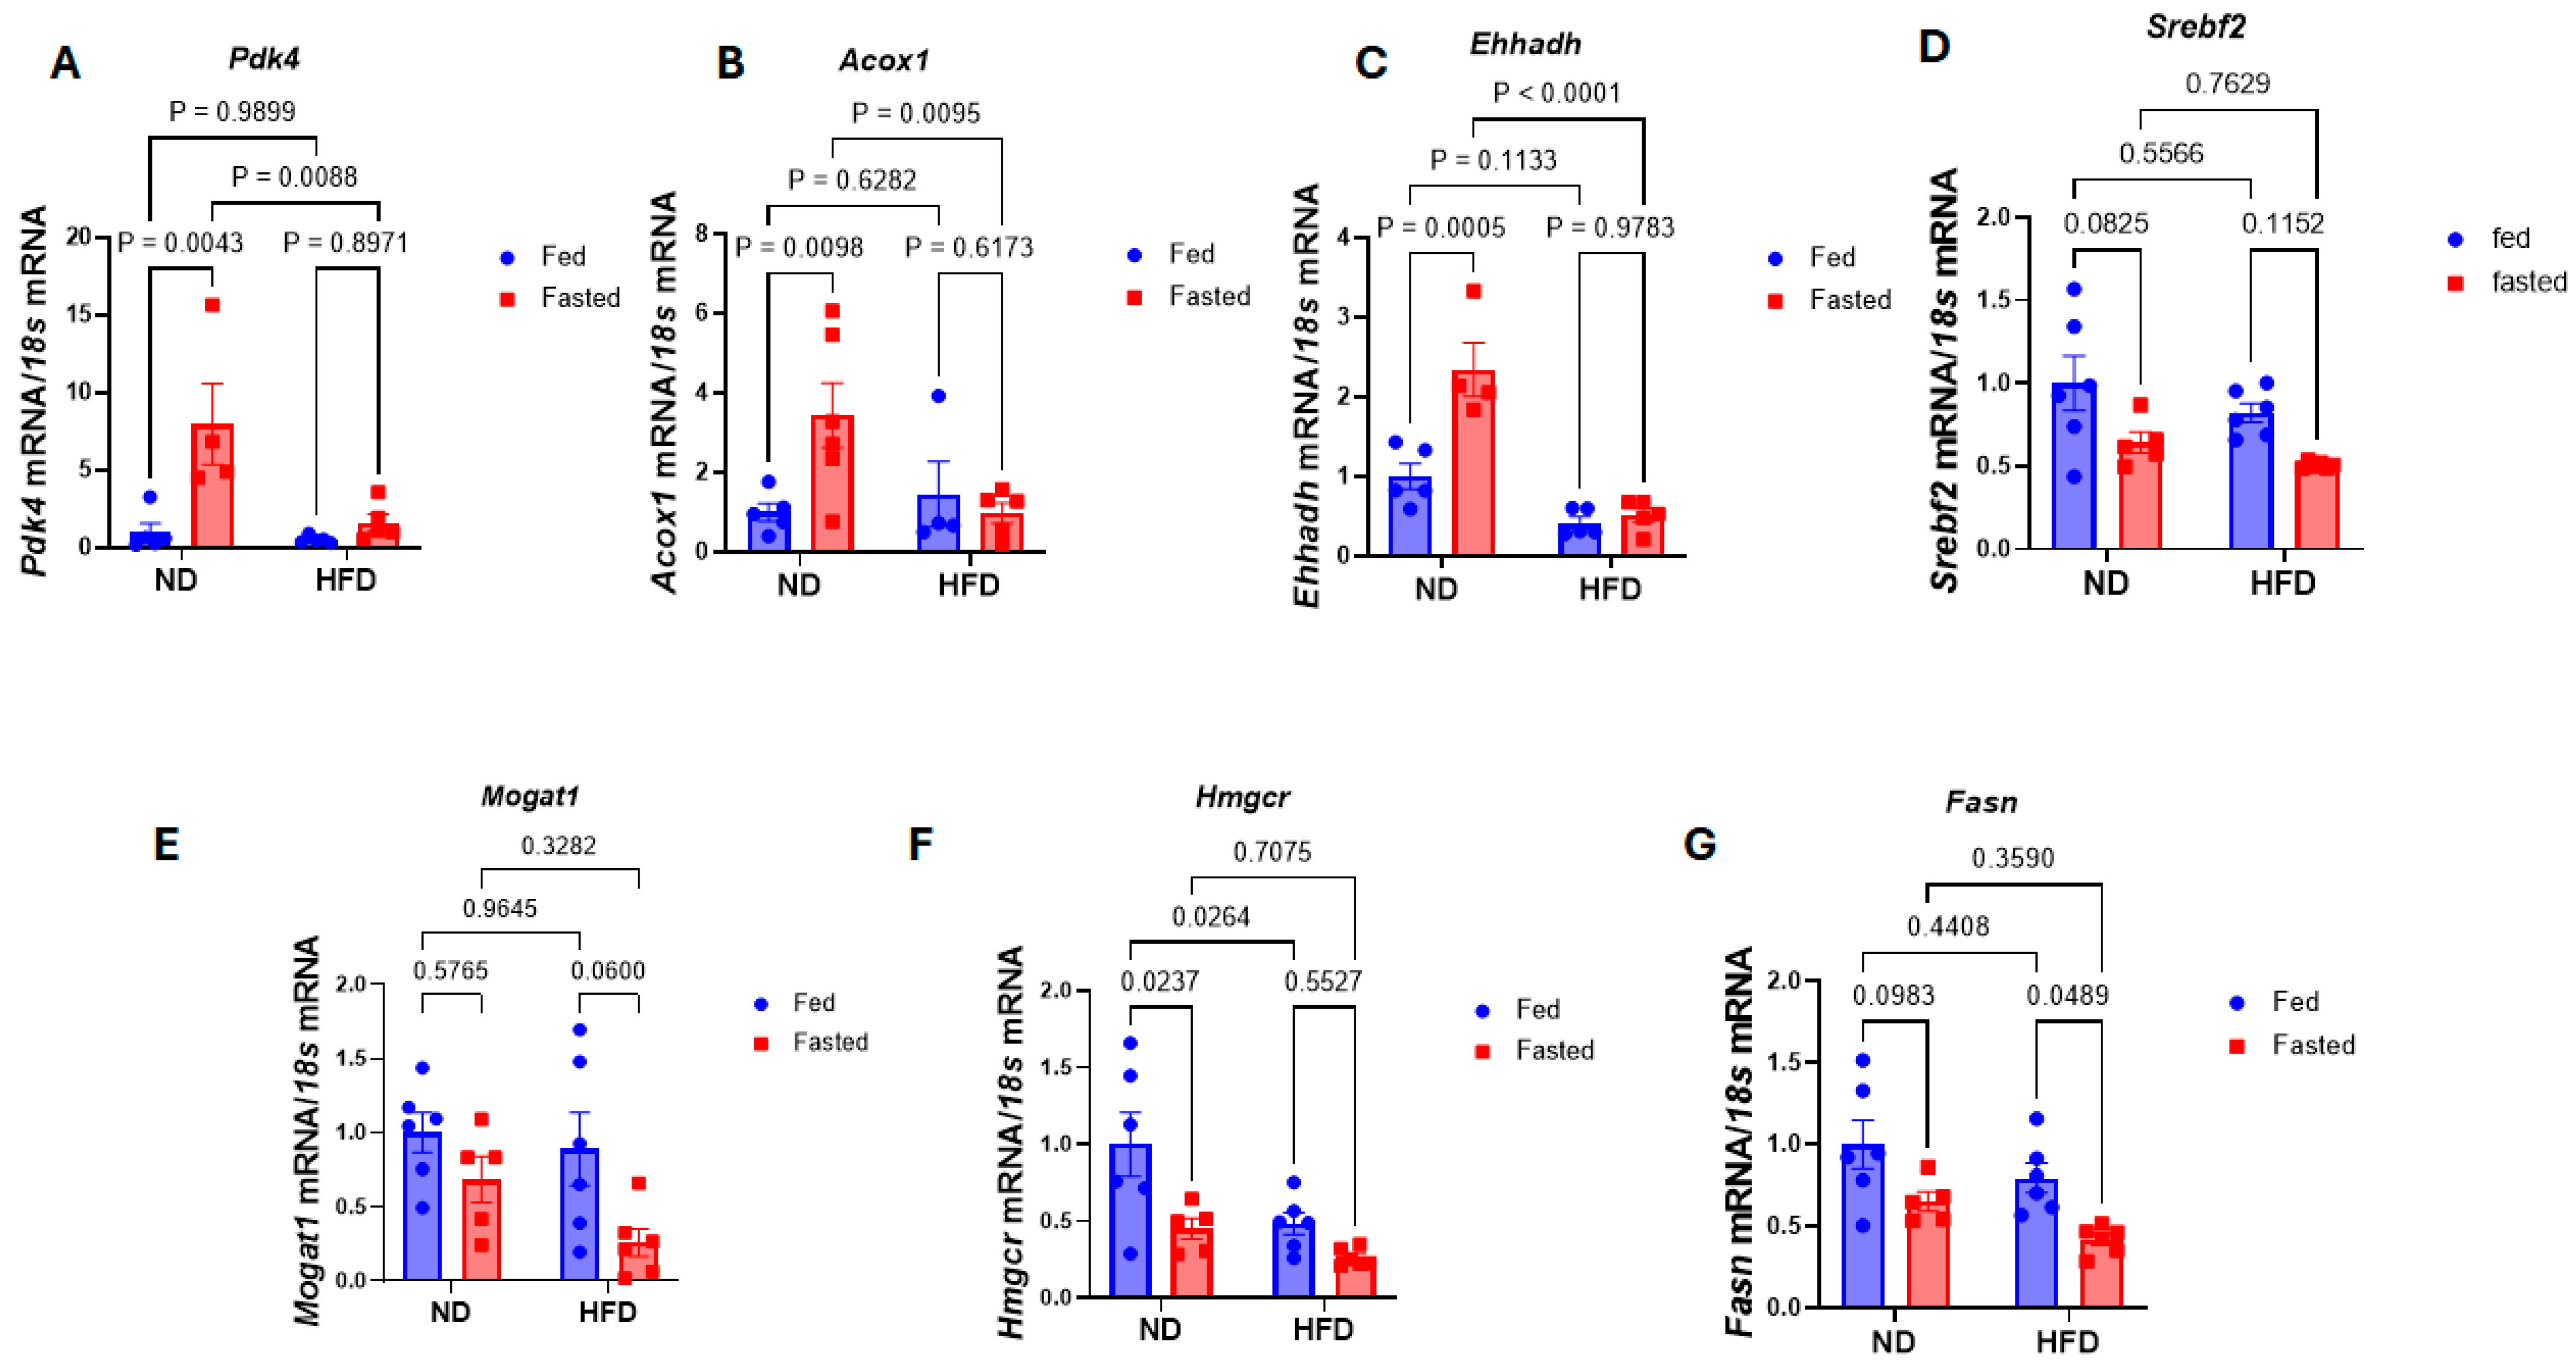
To confirm the results of our RNA-seq and better characterize changes in peroxisomal fatty acid oxidation, we measured expression of genes important to fatty acid oxidation and peroxisomal fatty acid oxidation by real-time quantitative PCR. Full 2-way ANOVA statistics are presented in Supplementary Table S3. RT-PCR demonstrated a significant 8-fold increase in Pdk4 expression in NDfa mice compared to NDfd (Figure 5A) (p = 0.0043). In contrast, Pdk4 expression in HFDfa mice compared to HFDfd was not statistically significant (p = 0.8971) (interaction p-value = 0.0227). Renal Acox1 expression (Figure 5B) increased over 3-fold in NDfa mice compared to NDfd mice (p = 0.0098), but there was no significant change in expression in HFDfa mice compared to HFDfd (p = 0.6173) or HFDfd mice compared to NDfd mice (p = 0.6282) (interaction p-value = 0.0325). Similar to Acox1, renal Ehhadh expression (Figure 5C) more than doubled in NDfa mice compared to NDfd (p = 0.0005), while there was almost no change in expression between the fasting and fed state in obese mice (p = 0.9783). HFDfd mice had only a nonsignificant decrease in Ehhadh expression compared to NDfd (p = 0.1133) (interaction p-value = 0.0027).
Figure 5.
Renal expression of key peroxisomal oxidation and lipogenic genes. (A–C) RT-PCR of oxidation related genes Pdk4, Acox1, and Ehhadh. (D–G) RT-PCR of lipogenesis related genes Srebf2, Mogat1, Hmgcr, Fasn. All mRNA expression is normalized to 18s mRNA and NDfd expression as control. Data presented as mean ± SEM. p values calculated by 2-way ANOVA.
To further attempt to explain the lack of change in renal triglyceride levels during fasting in mice on HFD, we also measured renal expression of genes involved in different facets of lipogenesis. We found that while there was a downward trend with fasting in the expression of several lipogenesis genes including Srebf2, Mogat1, Hmgcr, and Fasn (Figure 5D–G) under both lean and obese conditions, this often did not reach statistical significance aside from a decrease in Hmgcr in NDfa compared to NDfa (p = 0.0237 and a marginally significant decrease in Fasn in HFDfa compared to HFDfd (p = 0.0489).
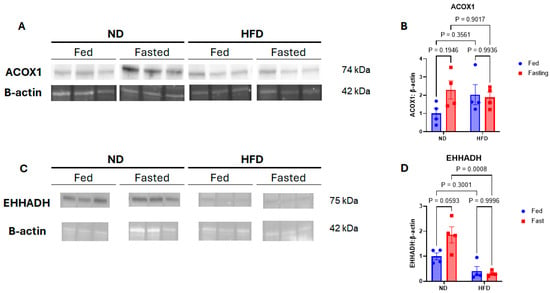
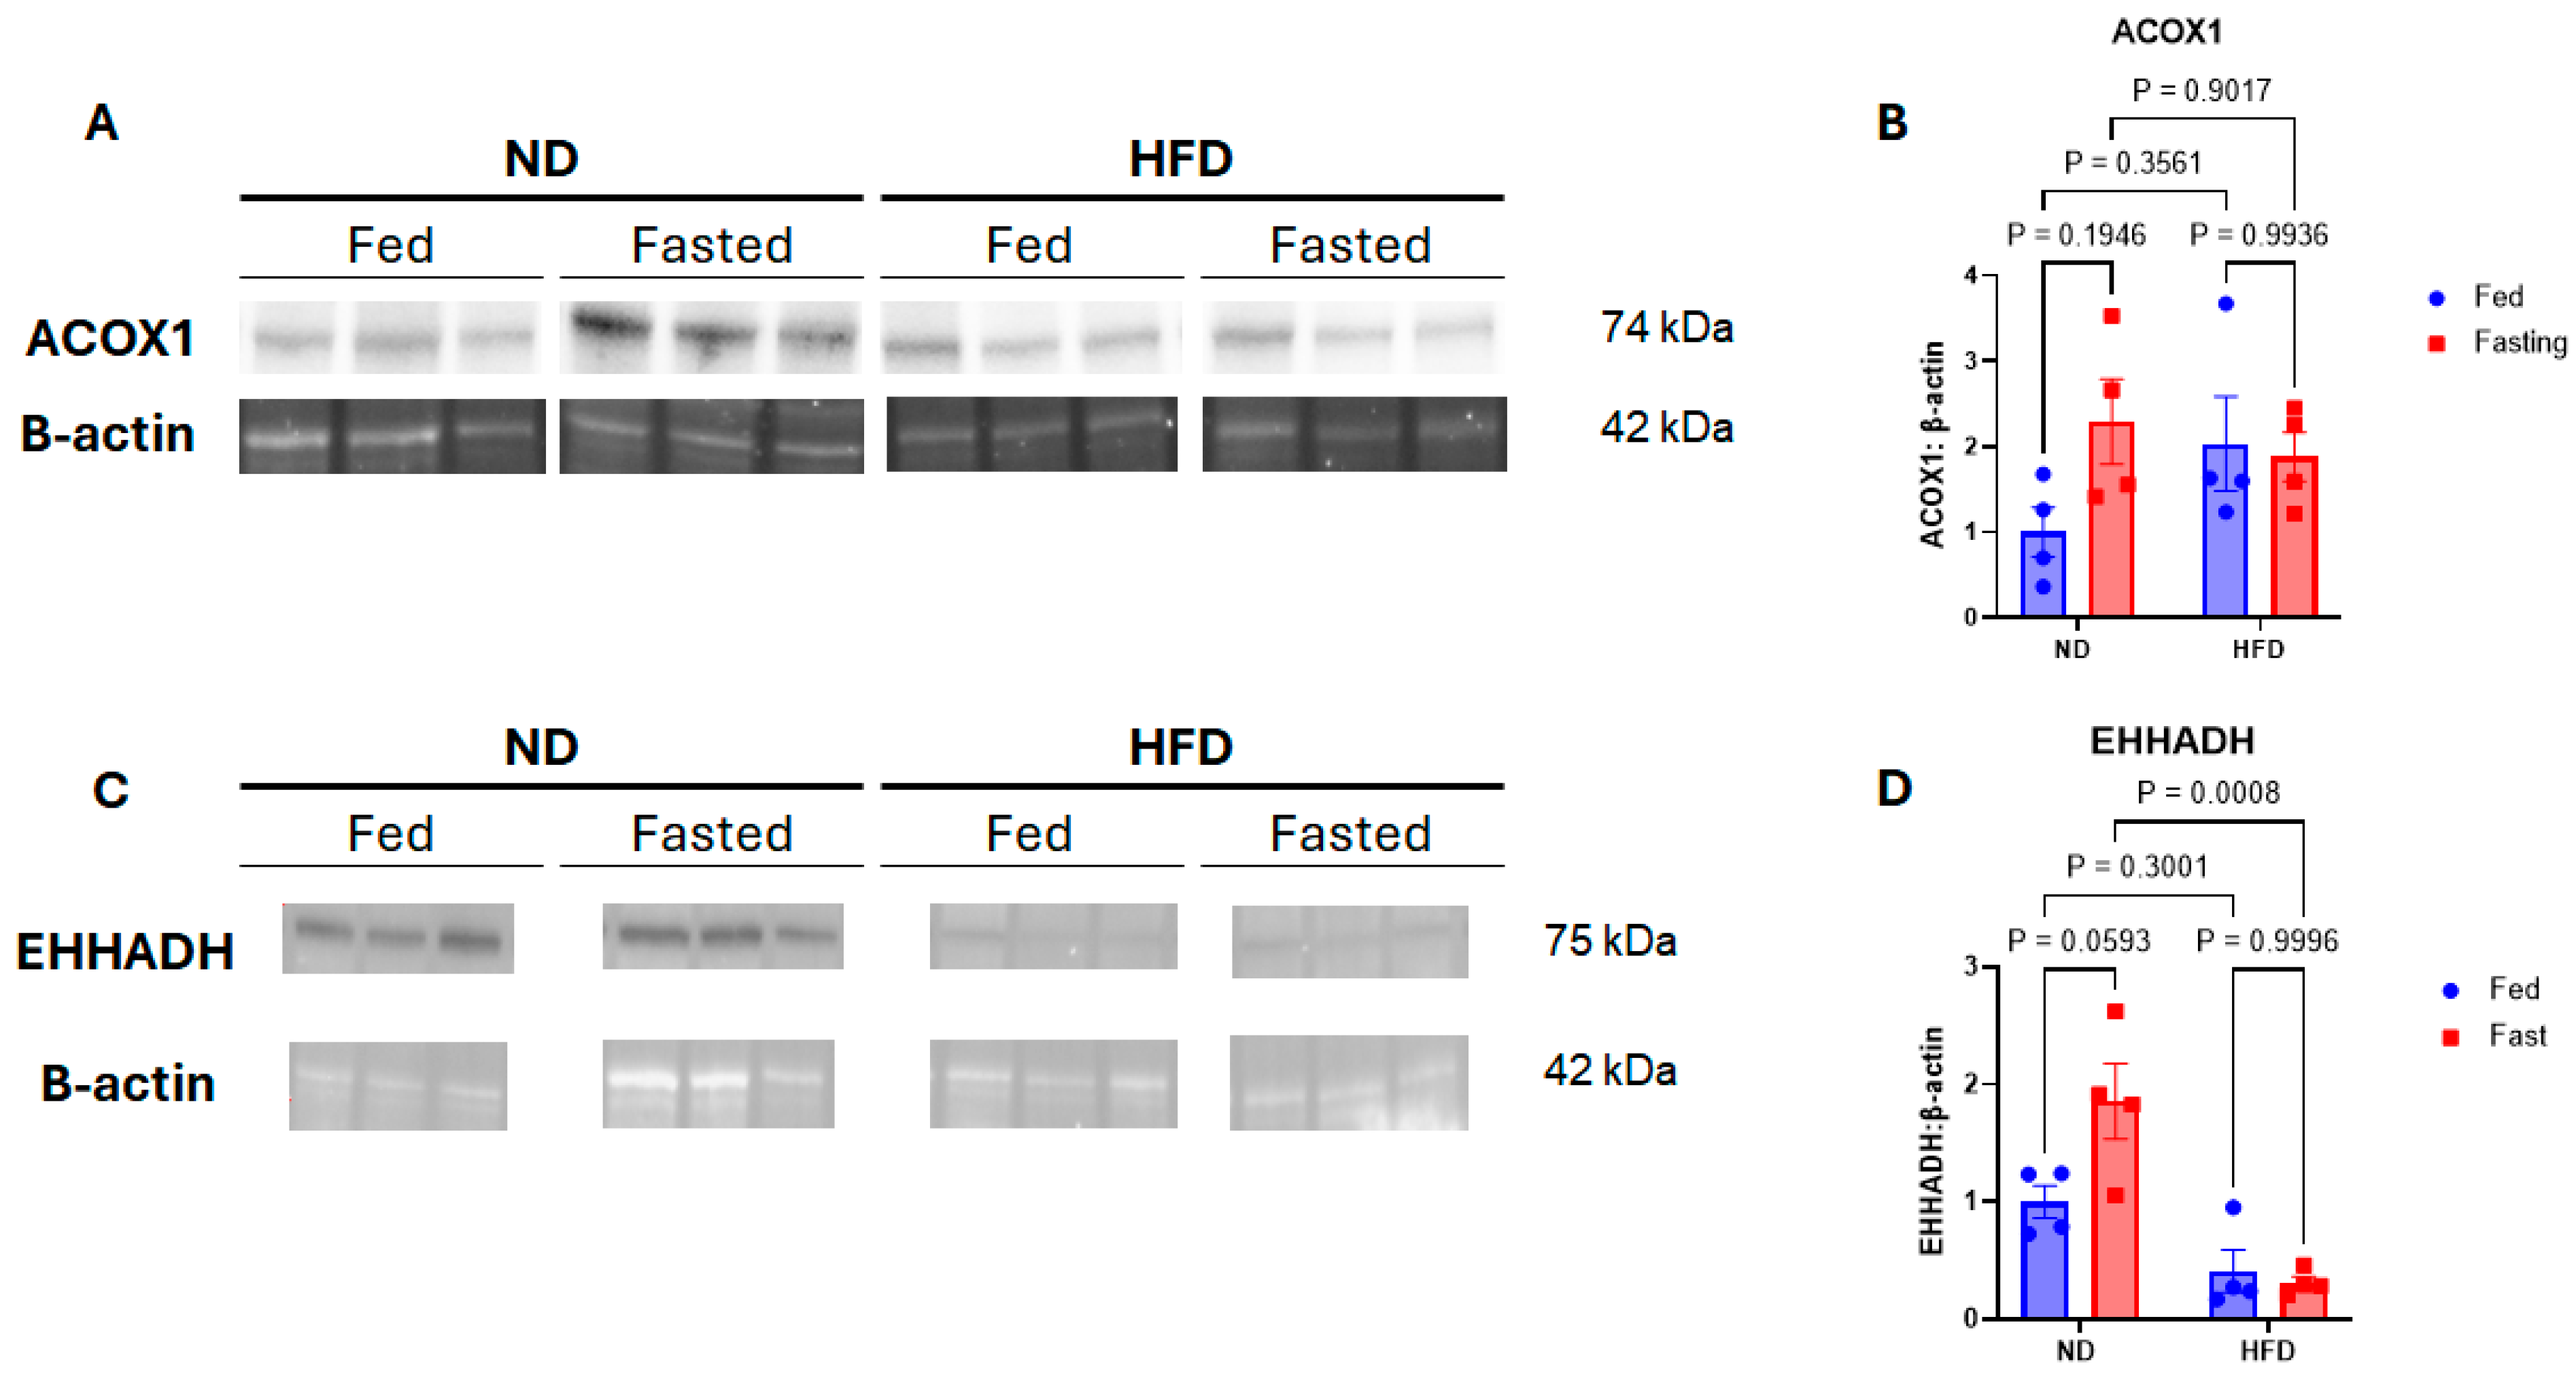
To complement our RNA data, we then measured protein expression of ACOX1 and EHHADH by Western blot (Figure 6). Full 2-way ANOVA statistics are presented in Supplementary Table S4. While ACOX1 expression had a nonsignificant increase of 129% (p = 0.1946) in NDfa compared to NDfd mice, HFDfa ACOX1 expression did not increase compared to HFDfd (p = 0.9936). EHHADH expression had a similar near-significant increase of 85% in NDfa mice compared to NDfd (p = 0.0593) while expression in HFDfa mice was not increased compared to HFDfd mice (p = 0.9996).
Figure 6.
Renal expression of key peroxisomal oxidation proteins. (A) Representative Western blot images of ACOX1 protein expression from kidney tissue. (B) Normalized quantitation of renal ACOX1 expression. (C) Representative Western blot images of EHHADH protein expression from kidney tissue. (D) Normalized quantitation of renal EHHADH expression. Data presented as mean ± SEM. p-values calculated by 2-way ANOVA.
3. Discussion
Ectopic lipid accumulation in the kidney during obesity results in lipotoxicity and contributes significantly to obesity-related kidney injury [6,10]. It is therefore important to better understand how renal lipid metabolism changes with obesity and works to promote toxic lipid accumulation. The current study demonstrates that the expression of lipid metabolism genes in the kidney responds differently to fasting during obesity compared to lean conditions. Specifically, obesity blunts the fasting-induced upregulation of peroxisomal fatty acid oxidation gene expression with implications for renal lipid accumulation.
While fasting increased circulating NEFA levels as anticipated in both lean and obese mice, renal triglyceride levels were significantly increased by fasting in lean mice only. This is notable given prior reports by Scerbo et al. suggesting that renal triglyceride accumulation in lean mice is directly dependent on circulating NEFA level [11]. The authors of that report had speculated that this was due to direct diffusion of lipid across kidney cell membranes. Triglyceride concentration is determined by the balance of lipid uptake and synthesis with storage and utilization. In terms of storage, one possible explanation for the findings in our experiment could be that the kidneys in the obese mice were already relatively saturated with lipid and so further increase in lipid content was not possible despite a relative increase in serum NEFA. Consistent with this idea, HFDfd mice had both higher circulating NEFA and kidney triglyceride levels than NDfd mice, indicating that the obese mice had a higher baseline kidney lipid level prior to fasting. However, Scerbo also found that stimulating lipolysis during fasting led to even higher kidney triglyceride levels beyond those caused by fasting, alone suggesting that the kidney does have an even higher capacity to store lipid. Evaluating this hypothesis, however, would require additional studies that were beyond the scope of this study.
Another possible explanation would be that kidney lipid uptake is not entirely dependent on circulating NEFA. It has been hypothesized that another source of renal cortical lipid accumulation in obesity is the reabsorption of albumin-bound fatty acid in the proximal tubule from kidney filtrate. Increased glomerular pressure causes glomerular hyperfiltration of albumin along with bound fatty acid that is then taken up via receptor-mediated endocytosis by renal proximal tubular epithelial cells [5,17]. Our group has also previously reported detection of urinary fatty acids during obesity [18]. It is therefore feasible that urinary excretion of fatty acids could help attenuate renal lipid accumulation with fasting in obese mice. In this study we did find that overall urinary albumin excretion was higher in obese mice, consistent with prior studies. However, our previous work did not find that this translates to a higher level of urinary fatty acid excretion in high-fat diet alone compared to normal diet fed mice.
In terms of synthesis, others have also found that fasting in lean mice reduces expression of various renal lipogenic enzymes while obesity has been reported to increase renal lipogenesis [8,11,19,20]. One recent publication has proposed that the anti-lipogenic effect of fasting is uniquely blunted by obesity in the kidney compared to other organ systems like the liver [12]. These investigators reported that whereas expression of cholesterol synthesis factor Srebf2 and fatty acid synthesis enzyme Fasn decreased during fasting in liver in both lean and obese mice, mice with obesity did not have a significant decrease in expression of these enzymes with fasting. In our current study, we measured changes in expression of genes responsible for the assembly of different lipid species including cholesterol (Hmgcr and Srebf2), fatty acids (Fasn), and triglyceride (Mogat1). Obesity did not appear to significantly change the downward trend in the expression of multiple key lipogenic genes with fasting though the overall effect was mild for lean and obese mice. While it is possible that reduced lipogenesis also helped to blunt the increase in renal lipid with fasting in the obese mice, it is not clear why this would be the case in only obese mice since lean mice appeared to have a similar pattern in lipogenic gene expression with fasting.
It is also interesting that renal cholesterol concentrations followed a different pattern from renal triglyceride. Mice on HFD had higher circulating cholesterol levels than mice on ND, but fasting did not significantly increase circulating cholesterol in mice on either diet. Marin-Medina et al. reported that the kidney in HFD fed mice accumulated lower levels of labeled circulating cholesterol than in mice on ND. This was notably in contrast to other organs such as the liver which had increased uptake [21]. This suggests that kidney cholesterol concentration is less influenced by circulating cholesterol levels in the setting of HFD or fasting. We also measured expression of both Hmgcr, the rate-limiting step in cholesterol synthesis and its regulator Srebf2 but the only statistically significant change we detected was a decrease in Hmgcr expression in NDfa mice compared to NDfd mice. However, we cannot make a definitive functional determination as to whether intrarenal cholesterol metabolism was affected based on the current study.
The other significant observation in this study was that obesity attenuated the fasting-induced upregulation of fatty acid oxidation gene expression in the kidney seen in lean mice. Fasting in lean mice has previously been shown to increase renal fatty acid oxidation [11]. This has important implications given that renal proximal tubule epithelial cells rely primarily on fatty acid oxidation for energy production [9,22]. Inhibition of fatty acid oxidation has also been implicated in obesity-related kidney injury and there are reports that stimulating renal fatty acid oxidation in the setting of obesity can reduce renal injury [23,24]. Our transcriptomic and quantitative PCR data indicate that, while fasting did increase overall renal fatty acid metabolism gene expression in both lean and obese mice, the activation of renal fatty acid oxidation gene expression by fasting was significantly more robust in lean mice than those with obesity. PDK4 regulates the intracellular switch between carbohydrate and fatty acid metabolism by inactivating the pyruvate dehydrogenase complex and was previously reported to have increased RNA transcription during fasting in lean mice [11,25]. Our current results show that fasting-induced increases in renal Pdk4 expression were blunted in mice with obesity. If fatty acid oxidation is beneficial in preventing renal toxicity, this further suggests that mice with obesity may lack this protective metabolic effect during periods of fasting.
Intriguingly, the current study also demonstrates that fasting-related upregulation of renal peroxisomal fatty acid oxidation genes in particular is reduced by obesity. Cpt1a is the rate-limiting step for mitochondrial fatty acid oxidation and transcriptomics did not indicate significant differences in Cpt1a expression between HFDfa and NDfa. Conversely, renal expression of several of the key genes for peroxisomal fatty acid oxidation including Acox1 and Ehhadh increased with fasting in mice on ND but was not significantly changed by fasting during obesity. Likewise, the expression of Acsl1 and Abcd3, critical for transport of very long and branched chain fatty acids to peroxisomes, was enriched in NDfa mice compared to HFDfa mice. The renal proximal tubule contains the highest density of peroxisomes aside from hepatocytes in the liver [26]. While peroxisomes do not directly produce ATP like mitochondria, they are uniquely responsible for the oxidation of very long chain fatty acids and impairment of peroxisomes is thought to lead to accumulation of toxic lipid species in the kidney [27,28]. Similarly, increased numbers of peroxisomes and upregulation of peroxisomal fatty acid oxidation have protective effects in other forms of renal injury such as ischemia–reperfusion or cisplatin toxicity [29,30].
Whether increasing peroxisomal fatty acid oxidation could be protective in the setting of obesity-related kidney injury is also unknown. Paradoxically, liver-specific ACOX1 knockout was recently shown to decrease hepatic steatosis while reducing systemic inflammation and insulin resistance [31,32]. However, the systemic benefits in this model were found to be dependent on changes in circulating very long chain fatty acids. While this is a feasible outcome of altered liver-specific peroxisome activity as the liver plays a major role in determining circulating lipid composition, the kidney is not known to be a significant source of circulating lipid. Additionally, improvement in steatosis with liver-specific Acox1 knockout was attributed to increased lipophagy. While it is believed that impaired lipophagy occurs in chronic kidney injury, recent evidence has shown that lipophagy is not essential to metabolic homeostasis in the proximal tubule during fasting [33]. At the same time, recent studies of mice with kidney specific impaired mitochondrial fatty acid oxidation in the renal proximal tubule in both lean and obese conditions suggest that peroxisomal fatty acid oxidation may provide a compensatory mechanism that may attenuate renal injury [34,35]. As the current study did not directly measure peroxisomal function, further mechanistic studies are needed to determine whether increased renal peroxisomal fatty acid oxidation is protective against obesity-related kidney injury.
One additional question posed by these results is whether the lost flexibility in renal metabolic gene expression observed in mice with obesity can be restored with repeated episodes of fasting. Caloric restriction leads to weight loss and improves renal outcomes in patients with obesity but such interventions can be difficult to sustain [36]. This has led to increased interest in alternative forms of dietary modification such as intermittent fasting and time-restricted feeding. Time-restricted feeding was recently shown to reduce obesity-related kidney injury while a separate study demonstrated that intermittent fasting attenuates ischemia-related renal injury [37,38]. Both of these studies further reported that these effects were largely independent of weight change. The underlying mechanisms behind these results remain unclear, raising the question of whether fatty acid oxidation is important to this effect. Dedicated mechanistic studies into the role of peroxisomal fatty acid oxidation in the kidney during repeated episodes of fasting are therefore needed.
Several limitations in the current study should be noted. First, this was primarily an observational physiologic study. While we therefore were able to identify prominent changes in gene expression and lipid accumulation, the mechanistic significance of these changes and their causal role in obesity-related kidney injury requires further investigation. In the same way, it is not possible from these results to fully differentiate effects of obesity from those of high-fat diet itself. Secondly, our lipid analysis was designed to detect only broad changes in major lipid categories such as cholesterol, triglycerides, or non-esterified fatty acids. Accumulation of specific lipid species such as ceramides, sphingolipids and oxidized phospholipids are known to contribute to obesity-related kidney injury [39,40,41]. Interestingly, Scerbo et al. also reported that acute fasting in lean mice led to a reduction in renal ceramide and glycosphingolipid despite the increase in renal triglyceride [11]. Future study is therefore needed to determine how fasting in obesity impacts not only overall lipid accumulation but also renal lipid composition. Thirdly, our study was designed to measure broad changes in gene expression and protein expression. Further functional studies are needed to determine whether these changes in expression lead to measurable differences in fatty acid oxidation. Similarly, the renal cortex is composed of multiple cell types and this study was not designed to determine which cell types contributed most to the observed changes in gene expression. Peroxisomes in the kidney are most abundant in proximal tubule cells which also make up a large proportion of the renal cortex [26]. However single-cell analysis would help to further clarify this question. Another limitation is that this study only included male animals whereas obesity and obesity-related kidney injury are not exclusive to males. This choice was made because of evidence that male C57BL/6 are more susceptible to diet-induced obesity and some of its complications and much of the data on obesity-related kidney dysfunction was generated in males of this strain [6,42]. Nonetheless, further study is warranted to understand whether females have the same response to fasting.
4. Methods
4.1. Animal Care and Use
All study protocols were approved by the University of Virginia Animal Care and Use Committee and were performed in accordance with the Public Health Service Policy on Humane Care and Use of Laboratory Animals and guidelines characterized by the NIH Guide for the Care and Use of Laboratory Animals and ARRIVE guidelines. This study utilized male C57BL/6J mice as they are an established model for studying obesity-related kidney injury and renal lipid accumulation [6,8]. All mice were bred at our institution from mice obtained from the Jackson Laboratory (Bar Harbor, ME, USA) and were 15 weeks of age at the start of experiments. Treatment groups consisted of 6 mice for the normal diet fed ad libitum (NDfd) and high-fat diet ad libitum (HFDfd) groups, 8 mice for ND fasting group (NDfa), and 7 for HFD fasting (HFDfa) group.
4.2. Mouse Diet Treatment and Fasting, Metabolic Assessment, and Organ Collection
All mice were group housed in standard ventilated cages on a 12 h. light-dark cycle with ad libitum access to water. All mice had ad libitum food access except during fasting periods as described below. Starting at 15 weeks of age, mice were fed either standard chow (12% fat) (ND) (Teklad, West Lafayette, IN, USA) or HFD (60% fat) (Research Diets, D12492, New Brunswick, NJ, USA) for a total of 17 weeks. Throughout the study, morning body weights were obtained for all mice on a weekly basis. Mice within each dietary group were randomly assigned to either an ad libitum feeding or overnight fasting group. This generated 4 treatment groups: ND fed (NDfd), ND fasting (NDfa), HFD fed (HFDfd), or HFD fasting (HFDfa). In the 10th week of the dietary period, the mice underwent overnight urine collection in metabolic cages to assess for markers of early kidney injury. For this, mice in the ad libitum feeding group were placed in individual metabolic cages. Urine was also collected and aliquots were stored at −80 °C until analysis. At the end of the 17-week diet treatment all mice were placed in individual metabolic cages for 16 h overnight. During this period fasting mice underwent a 16 h overnight fast while ad libitum-fed mice were simultaneously allowed to eat without restriction. Mice were weighed immediately before and after this period to measure any weight loss. In the morning following the final overnight fasting/feeding period, all mice were anesthetized with ketamine and xylazine and euthanized. Blood samples were obtained by cardiac puncture, allowed to coagulate for 15–30 min at room temperature, and then centrifuged at 2000 g for 10 min at 4 °C. Supernatant serum was then collected and frozen at −80 °C until analysis. Kidneys were immediately removed, weighed, decapsulated and sectioned into cortical and medullary components followed by snap freezing at −80 °C.
4.3. Measurement of Urinary Injury Markers
To demonstrate that mice on HFD were experiencing early obesity-related kidney injury, urinary injury markers were measured in urine samples obtained from the metabolic cage studies during the 10th week of dietary treatment. Urine albumin to creatinine ratio was calculated using urine albumin concentration measured with the Albuwell M Mouse Albumin ELISA kit (Exocell, Newton Square, PA, USA) and urine creatinine concentration measured with urine creatinine colorimetric kit (Cayman Chemical Company, Ann Arbor, MI, USA). Urine neutrophil gelatinase-associated lipocalin (NGAL) and kidney injury molecule-1 (Kim-1) were measured by Quantikine ELISA kit (R&D Systems, Minneapolis, MN, USA) and normalized to urine creatinine concentration obtained as noted above. Urine H2O2 was measured using AmplexTM Red Hydrogen Peroxide/Peroxidase Assay Kit (Invitrogen, Waltham, MA, USA).
4.4. Measurement of Serum and Kidney Lipid Content
Serum non-esterified fatty acid (NEFA), triglyceride, and cholesterol measurements were performed on serum samples obtained at the time of euthanasia using the WAKO NEFA kit (Fujifilm, Valhalla, NY, USA), Pointe Triglyceride assay (Horiba, Canton, MI, USA), and Stanbio LiquiColor Test (Stanbio, Boerne, TX, USA) respectively. To measure kidney lipid concentrations, kidney cortical tissue was homogenized in methanol in bead beater tubes and transferred to glass test tubes. Chloroform was then added followed by sonication in a sonicator bath. A 47 °C incubation was performed for 2 h followed by vortexing and sonication. Samples were then centrifuged at 4000 rpm, the supernatant was transferred to a clean glass tube and then dried in a speed vacuum concentrator for 8 h at 45 °C. Dried lipid was then reconstituted in 90% isopropanol with 10% triton-X. Extracted kidney lipid concentration was measured using the same triglyceride and cholesterol assays above and results were normalized to the weight of kidney tissue used in each extraction.
4.5. RT-PCR and RNA Sequencing
Thirty mg of renal cortex sample from each mouse was lysed in Trizol and RNA was isolated from these samples using the Direct-zol RNA miniprep kit (Zymo, Irving, AC, USA). Following RNA extraction, the RNA concentration was measured using a NanoDrop spectrophotometer (Thermo Fisher, Waltham, MA, USA) and quality was checked using the A260/A280 ratio and A260/A230 ratio. Reverse transcription was then carried out using an iScript cDNA synthesis kit (Bio-Rad, Hercules, CA, USA). Quantitative PCR was performed using SSO Advanced Universal SYBR Green Supermix (Bio-RAD) on a Bio-RAD CFX Connect Real-Time System using the manufacturer’s protocol. All reactions were performed in duplicate and normalized to 18s mRNA. Controls without reverse transcriptase were included for all samples to exclude the effect of genomic DNA. Relative expression was calculated using the ΔΔCT method. In this process, average CT values for the gene of interest and 18s were utilized. Statistical analysis was performed on log2 transformed expression values. Primer sequences and primer efficiencies are shown in Supplemental Data.
RNA sequencing was carried out by Novogene (Stockton, CA, USA) per their protocol. RNA species that contained poly-U were purified from total RNA using poly-T oligo-attached magnetic beads. After fragmentation, the first strand cDNA was synthesized using random hexamer primers followed by the second strand cDNA synthesis, A-tailing, adapter ligation, size selection, amplification, and purification. The library was checked with Qubit and real-time PCR for quantification and bioanalyzer for size distribution detection. After library quality control, different libraries were pooled based on the effective concentration and targeted data amount, then subjected to Illumina sequencing.
4.6. RNA Sequencing Analysis
Quality control RNA sequencing data were generated from five independent biological replicates per group. On average, we received 25 million (ranging from 21 to 34 million) paired-end reads (150 bases long read) for each of the replicates sufficient for gene level quantitation. Read quality was assessed using fastqc program https://www.bioinformatics.babraham.ac.uk/projects/fastqc/ (accessed 15 February 2025) and raw data quality report was generated using the MultiQC tool (1.27) [43]. Adaptor contamination observed in few samples were removed using the “cutadapt” program (5.2) [44].
Mapping and quantitation-The “splice aware” aligner ‘STAR’ [45] was used for mapping the reads. Prior to mapping, we constructed a mouse reference index based on the GRCm38 mouse genome reference (Mus_musculus.GRCm38.dna.primary assembly.fa & Mus_musculus.GRCm38.91.chr.gtf) and setting the sjdboverhang parameter to 149 to match the read length of our samples. Subsequently, we conducted read mapping and quantification and we had more than 95% of the reads mapping to mouse genome and transcriptome. Gene-based read counts were derived from the aligned reads, and subsequently, a count matrix was generated, serving as the input file for the analysis of differential gene expression.
Differential gene expression analysis (DGE): The DESeq2 package (1.50.2) [46] was used to conduct the differential gene expression analysis. Low-expressed genes (genes expressed only in a few replicates and having low counts) was excluded from the analysis before identifying differentially expressed genes. Data normalization, dispersion estimates, and model fitting (negative binomial) were carried out with the DESeq function. The log-transformed, normalized gene expression of the 500 most variable genes was used to perform an unsupervised principal component analysis. The differentially expressed genes were ranked based on the log2fold change and FDR corrected p-values more specifically based on “stat” column. Gene set enrichment analysis (GSEA) [47,48] was performed on ranked genes to identify significantly enriched biological pathways. Pathway analysis was performed using fgsea package (v1.36.2) in Bioconductor 3.23 within R 4.6 (https://bioconductor.org/packages/release/bioc/html/fgsea.html) (accessed 15 February 2025). The reference database for mouse pathway enrichment analysis comprised Hallmark gene sets from the msigdb (26.1) [47,49,50].
4.7. Western Blot
Renal cortex samples were homogenized in T-PER tissue protein reagent (Thermofisher, Thermofisher, Waltham, MA, USA) containing HALT protease inhibitor (Thermofisher). Homogenate was centrifuged for 10 min at 900× g and supernatant was used for analysis. BCA assay was performed on all samples to measure protein concentration. Running samples were prepared in Laemmli buffer and 30 μg of protein were used in all assays. Samples were first separated on by electrophoresis on a 10% Criterion TGX Stain-Free gel (Bio-Rad), then transferred to a low-fluorescence polyvinyldene difluoride membrane (Bio-Rad) by Trans-blot Turbo semidry Transfer System (Bio-Rad). Membranes were blocked in 5% milk in 1XTBST with 0.1% Tween for 1 h at room temperature before incubation with primary antibody overnight at 4 °C in 5% BSA with 1X TBST. The membrane was then incubated with secondary antibody in 5% milk and 1XTBST for one hour at room temperature. Immunoreactive bands were detected using a Chemidoc MP imager (Bio-Rad) and densitometric analysis was performed using Image Lab Software version 6.1.0 build 7 (Bio-Rad). Protein quantitation was normalized to β-actin. Antibodies utilized included anti-ACOX1 (1:1000, Abacm, EPR19038), anti-EHHADH (1:000,Proteintech, 87579-1-RR), and anti-actin hFAB rhodamine antibody (1:5000, Bio-Rad 12004163).
4.8. Statistical Analysis
All comparisons between multiple treatment groups were carried out using 2-way ANOVA with alpha of 0.05, and the two factors being diet and fasting status. A post hoc Tukey test was performed to determine statistical differences between groups in these multiple group comparisons. Full details of the 2-way ANOVA test results including p-values for each factor and factor interaction are included in the Supplemental Data. Comparisons between two treatment groups were performed using Student’s t-test. Data are expressed as mean ± standard error of the mean with p-values < 0.05 considered statistically significant.
5. Conclusions
In summary, obesity alters the response of kidney lipid metabolism gene expression to fasting in terms of fatty acid metabolism genes and particularly relating to peroxisomal fatty acid oxidation genes. This is significant as most of the emphasis on renal fatty acid oxidation in obesity to this point has focused on the role of the mitochondria. These results therefore highlight a need to better understand the role of peroxisomes in obesity-related kidney injury and whether this pathway has potential therapeutic implications for this common disease process.
Supplementary Materials
The following supporting information can be downloaded at: https://www.mdpi.com/article/10.3390/ijms272210107/s1.
Author Contributions
J.L.L.Q.B.—investigation, data curation, writing—original draft preparation, project administration, S.A.A.—investigation, A.L.B.—investigation, C.D.—investigation, data curation, project administration, G.V.K.—formal analysis, P.K.—formal analysis, T.E.H.—supervision, writing-review and editing, methodology, H.M.S.—supervision, writing—review and editing, S.A.C.—conceptualization, methodology, writing—review and editing, supervision, funding acquisition. All authors have read and agreed to the published version of the manuscript.
Funding
This study was supported in part by the National Institute of Diabetes and Digestive and Kidney Diseases of the National Institutes of Health under Award Number DK132463 to Silas Culver.
Institutional Review Board Statement
All mouse study protocols were approved by the University of Virginia Animal Care and Use Committee under protocol number 4587 and were conducted in accordance with the Public Health Service Policy on Humane Care and Use of Laboratory Animals and guidelines characterized by the NIH Guide for the Care and Use of Laboratory Animals and ARRIVE guidelines (Approval Code: protocol 4587, Approval Date: 14 October 2025).
Informed Consent Statement
Not applicable.
Data Availability Statement
Data for the RNA sequencing analysis in this study are available on NCBI Geo with accession number GSE349406. Raw data supporting the conclusions of this article will be made available by the authors on request.
Conflicts of Interest
The authors declare no conflicts of interest.
References
- Honeycutt, A.A.; Segel, J.E.; Zhuo, X.; Hoerger, T.J.; Imai, K.; Williams, D. Medical Costs of CKD in the Medicare Population. J. Am. Soc. Nephrol. 2013, 24, 1478–1483. [Google Scholar] [CrossRef] [Scilit]
- Golestaneh, L.; Alvarez, P.J.; Reaven, N.L.; Funk, S.E.; McGaughey, K.J.; Romero, A.; Brenner, M.S.; Onuigbo, M. All-Cause Costs Increase Exponentially with Increased Chronic Kidney Disease Stage. Am. J. Manag. Care 2017, 23, S163–S172. [Google Scholar]
- Hsu, C.; McCulloch, C.E.; Iribarren, C.; Darbinian, J.; Go, A.S. Body Mass Index and Risk for End-Stage Renal Disease. Ann. Intern. Med. 2006, 144, 21–28. [Google Scholar] [CrossRef] [Scilit]
- Iseki, K.; Ikemiya, Y.; Kinjo, K.; Inoue, T.; Iseki, C.; Takishita, S. Body Mass Index and the Risk of Development of End-Stage Renal Disease in a Screened Cohort. Kidney Int. 2004, 65, 1870–1876. [Google Scholar] [CrossRef] [Scilit]
- de Vries, A.P.J.; Ruggenenti, P.; Ruan, X.Z.; Praga, M.; Cruzado, J.M.; Bajema, I.M.; D’Agati, V.D.; Lamb, H.J.; Pongrac Barlovic, D.; Hojs, R.; et al. Fatty Kidney: Emerging Role of Ectopic Lipid in Obesity-Related Renal Disease. Lancet Diabetes Endocrinol. 2014, 2, 417–426. [Google Scholar] [CrossRef] [Scilit]
- Sun, Y.; Ge, X.; Li, X.; He, J.; Wei, X.; Du, J.; Sun, J.; Li, X.; Xun, Z.; Liu, W.; et al. High-Fat Diet Promotes Renal Injury by Inducing Oxidative Stress and Mitochondrial Dysfunction. Cell Death Dis. 2020, 11, 914. [Google Scholar] [CrossRef] [Scilit]
- Izquierdo-Lahuerta, A.; Martínez-García, C.; Medina-Gómez, G. Lipotoxicity as a Trigger Factor of Renal Disease. J. Nephrol. 2016, 29, 603–610. [Google Scholar] [CrossRef] [Scilit]
- Jiang, T.; Wang, Z.; Proctor, G.; Moskowitz, S.; Liebman, S.E.; Rogers, T.; Lucia, M.S.; Li, J.; Levi, M. Diet-Induced Obesity in C57BL/6J Mice Causes Increased Renal Lipid Accumulation and Glomerulosclerosis via a Sterol Regulatory Element-Binding Protein-1c-Dependent Pathway. J. Biol. Chem. 2005, 280, 32317–32325. [Google Scholar] [CrossRef] [Scilit]
- Jang, H.-S.; Noh, M.R.; Kim, J.; Padanilam, B.J. Defective Mitochondrial Fatty Acid Oxidation and Lipotoxicity in Kidney Diseases. Front. Med. 2020, 7, 65. [Google Scholar] [CrossRef] [Scilit]
- Ye, M.; Yang, M.; Dai, W.; Li, H.; Zhou, X.; Chen, Y.; He, L. Targeting Renal Proximal Tubule Cells in Obesity-Related Glomerulopathy. Pharmaceuticals 2023, 16, 1256. [Google Scholar] [CrossRef] [Scilit]
- Scerbo, D.; Son, N.-H.; Sirwi, A.; Zeng, L.; Sas, K.M.; Cifarelli, V.; Schoiswohl, G.; Huggins, L.-A.; Gumaste, N.; Hu, Y.; et al. Kidney Triglyceride Accumulation in the Fasted Mouse Is Dependent upon Serum Free Fatty Acids. J. Lipid Res. 2017, 58, 1132–1142, Erratum in J. Lipid Res. 2017, 58, 1933. [Google Scholar] [CrossRef] [Scilit]
- Kim, S.-J.; Kim, J.-E.; Kim, Y.-W.; Kim, J.-Y.; Park, S.-Y. Nutritional Regulation of Renal Lipogenic Factor Expression in Mice: Comparison to Regulation in the Liver and Skeletal Muscle. Am. J. Physiol. Ren. Physiol. 2017, 313, F887–F898. [Google Scholar] [CrossRef] [Scilit]
- Kwon, S.H. Changes in Kidney Function Markers after Bariatric Surgery in Morbidly Obese Patients. Kidney Res. Clin. Pract. 2020, 39, 115–117. [Google Scholar] [CrossRef] [Scilit]
- Ding, W.; Mak, R.H. Early Markers of Obesity-Related Renal Injury in Childhood. Pediatr. Nephrol. 2015, 30, 1–4. [Google Scholar] [CrossRef] [Scilit]
- Declèves, A.-E.; Zolkipli, Z.; Satriano, J.; Wang, L.; Nakayama, T.; Rogac, M.; Le, T.P.; Nortier, J.L.; Farquhar, M.G.; Naviaux, R.K.; et al. Regulation of Lipid Accumulation by AMP-Activated Kinase [Corrected] in High Fat Diet-Induced Kidney Injury. Kidney Int. 2014, 85, 611–623, Erratum in Kidney Int. 2017, 92, 769. [Google Scholar] [CrossRef] [Scilit]
- Camões, F.; Islinger, M.; Guimarães, S.C.; Kilaru, S.; Schuster, M.; Godinho, L.F.; Steinberg, G.; Schrader, M. New Insights into the Peroxisomal Protein Inventory: Acyl-CoA Oxidases and -Dehydrogenases Are an Ancient Feature of Peroxisomes. Biochim. Biophys. Acta 2015, 1853, 111–125. [Google Scholar] [CrossRef] [Scilit]
- Thomas, M.E.; Harris, K.P.G.; Walls, J.; Furness, P.N.; Brunskill, N.J. Fatty Acids Exacerbate Tubulointerstitial Injury in Protein-Overload Proteinuria. Am. J. Physiol.-Ren. Physiol. 2002, 283, F640–F647. [Google Scholar] [CrossRef] [Scilit]
- Culver, S.A.; Hargett, S.R.; Balugo, J.L.L.Q.; Gildea, J.J.; Harris, T.E.; Siragy, H.M. Nephron Specific ATP6AP2 Knockout Increases Urinary Excretion of Fatty Acids and Decreases Renal Cortical Megalin Expression. Sci. Rep. 2024, 14, 18724. [Google Scholar] [CrossRef] [Scilit]
- Kume, S.; Uzu, T.; Araki, S.; Sugimoto, T.; Isshiki, K.; Chin-Kanasaki, M.; Sakaguchi, M.; Kubota, N.; Terauchi, Y.; Kadowaki, T.; et al. Role of Altered Renal Lipid Metabolism in the Development of Renal Injury Induced by a High-Fat Diet. J. Am. Soc. Nephrol. 2007, 18, 2715–2723. [Google Scholar] [CrossRef] [Scilit]
- Marvyn, P.M.; Bradley, R.M.; Button, E.B.; Mardian, E.B.; Duncan, R.E. Fasting Upregulates Adipose Triglyceride Lipase and Hormone-Sensitive Lipase Levels and Phosphorylation in Mouse Kidney. Biochem. Cell Biol. 2015, 93, 262–267. [Google Scholar] [CrossRef] [Scilit]
- Marín-Medina, A.; Ruíz-Hidalgo, G.; Blé-Castillo, J.L.; Zetina-Esquivel, A.M.; Zamora, R.M.; Juárez-Rojop, I.E.; Díaz-Zagoya, J.C. Combined Effect of Diosgenin Along with Ezetimibe or Atorvastatin on the Fate of Labelled Bile Acid and Cholesterol in Hypercholesterolemic Rats. Int. J. Environ. Res. Public Health 2019, 16, 627. [Google Scholar] [CrossRef] [Scilit]
- Simon, N.; Hertig, A. Alteration of Fatty Acid Oxidation in Tubular Epithelial Cells: From Acute Kidney Injury to Renal Fibrogenesis. Front. Med. 2015, 2, 52. [Google Scholar] [CrossRef] [Scilit]
- Declèves, A.-E.; Mathew, A.V.; Cunard, R.; Sharma, K. AMPK Mediates the Initiation of Kidney Disease Induced by a High-Fat Diet. J. Am. Soc. Nephrol. 2011, 22, 1846–1855. [Google Scholar] [CrossRef] [Scilit]
- Martin, W.P.; Chuah, Y.H.D.; Abdelaal, M.; Pedersen, A.; Malmodin, D.; Abrahamsson, S.; Hutter, M.; Godson, C.; Brennan, E.P.; Fändriks, L.; et al. Medications Activating Tubular Fatty Acid Oxidation Enhance the Protective Effects of Roux-En-Y Gastric Bypass Surgery in a Rat Model of Early Diabetic Kidney Disease. Front. Endocrinol. 2021, 12, 757228. [Google Scholar] [CrossRef] [Scilit]
- Jeong, J.Y.; Jeoung, N.H.; Park, K.-G.; Lee, I.-K. Transcriptional Regulation of Pyruvate Dehydrogenase Kinase. Diabetes Metab. J. 2012, 36, 328–335. [Google Scholar] [CrossRef] [Scilit]
- Vasko, R. Peroxisomes and Kidney Injury. Antioxid. Redox Signal. 2016, 25, 217–231. [Google Scholar] [CrossRef] [Scilit]
- Demarquoy, J.; Le Borgne, F. Crosstalk between Mitochondria and Peroxisomes. World J. Biol. Chem. 2015, 6, 301–309. [Google Scholar] [CrossRef] [Scilit]
- Argyriou, C.; D’Agostino, M.D.; Braverman, N. Peroxisome Biogenesis Disorders. Transl. Sci. Rare Dis. 2016, 1, 111–144. [Google Scholar] [CrossRef] [Scilit]
- Chiba, T.; Peasley, K.D.; Cargill, K.R.; Maringer, K.V.; Bharathi, S.S.; Mukherjee, E.; Zhang, Y.; Holtz, A.; Basisty, N.; Yagobian, S.D.; et al. Sirtuin 5 Regulates Proximal Tubule Fatty Acid Oxidation to Protect against AKI. J. Am. Soc. Nephrol. 2019, 30, 2384–2398. [Google Scholar] [CrossRef] [Scilit]
- Negishi, K.; Noiri, E.; Sugaya, T.; Li, S.; Megyesi, J.; Nagothu, K.; Portilla, D. A Role of Liver Fatty Acid-Binding Protein in Cisplatin-Induced Acute Renal Failure. Kidney Int. 2007, 72, 348–358. [Google Scholar] [CrossRef] [Scilit]
- Lu, D.; He, A.; Tan, M.; Mrad, M.; El Daibani, A.; Hu, D.; Liu, X.; Kleiboeker, B.; Che, T.; Hsu, F.-F.; et al. Liver ACOX1 Regulates Levels of Circulating Lipids That Promote Metabolic Health through Adipose Remodeling. Nat. Commun. 2024, 15, 4214. [Google Scholar] [CrossRef] [Scilit]
- He, A.; Dean, J.M.; Lu, D.; Chen, Y.; Lodhi, I.J. Hepatic Peroxisomal β-Oxidation Suppresses Lipophagy via RPTOR Acetylation and MTOR Activation. Autophagy 2020, 16, 1727–1728. [Google Scholar] [CrossRef] [Scilit]
- Minami, S.; Yamamoto, T.; Takabatake, Y.; Takahashi, A.; Namba, T.; Matsuda, J.; Kimura, T.; Kaimori, J.-Y.; Matsui, I.; Hamano, T.; et al. Lipophagy Maintains Energy Homeostasis in the Kidney Proximal Tubule during Prolonged Starvation. Autophagy 2017, 13, 1629–1647. [Google Scholar] [CrossRef] [Scilit]
- Hammoud, S.; Ivanova, A.; Osaki, Y.; Funk, S.; Yang, H.; Viquez, O.; Delgado, R.; Lu, D.; Phillips Mignemi, M.; Tonello, J.; et al. Tubular CPT1A Deletion Minimally Affects Aging and Chronic Kidney Injury. JCI Insight 2024, 9, 171961, Erratum in JCI Insight 2024, 9, e181816. [Google Scholar] [CrossRef] [Scilit]
- Funk, S.D.; Kern, J.T.; Viquez, O.M.; Sulvaran-Guel, E.; Koenitzer, J.R.; Feola, K.C.; Blum, J.S.; Zent, R.; Humphreys, B.D.; Huen, S.C.; et al. Tubule-Specific Compensatory Responses to Cpt1a Deletion in Aged Mice. Kidney360 2025, 6, 707–719. [Google Scholar] [CrossRef] [Scilit]
- Serra, A.; Esteve, A.; Navarro-Díaz, M.; López, D.; Bancu, I.; Romero, R. Long-Term Normal Renal Function after Drastic Weight Reduction in Patients with Obesity-Related Glomerulopathy. Obes. Facts 2015, 8, 188–199. [Google Scholar] [CrossRef] [Scilit]
- Pati, P.; De Miguel, C.; Paul, J.R.; Zhang, D.; Colson, J.; Allan, J.M.; Edell, C.J.; Rhoads, M.K.; Dunaway, L.S.; Biswal, S.N.; et al. Time-Restricted Feeding Reduces Cardiovascular Disease Risk in Obese Mice. JCI Insight 2025, 10, e160257. [Google Scholar] [CrossRef] [Scilit]
- Jang, Y.; Kim, Y.S.; Kim, S.R.; Lee, D.W.; Lee, S.B.; Kim, I.Y. Intermittent Fasting Protects Against the Progression from Acute Kidney Injury to Chronic Kidney Disease. Antioxidants 2025, 14, 119. [Google Scholar] [CrossRef] [Scilit]
- Cheval, L.; Sampaio, J.L.; Poindessous, V.; Crambert, G.; Pallet, N. The Lipidome of the Kidney Tubules of Ob/Ob Mice Is Affected at the Infralesional Level. Cell Death Discov. 2025, 11, 521. [Google Scholar] [CrossRef] [Scilit]
- Li, N.; Li, G. Sphingolipid Signaling in Kidney Diseases. Am. J. Physiol. Ren. Physiol. 2025, 328, F431–F443. [Google Scholar] [CrossRef] [Scilit]
- Boini, K.M.; Zhang, C.; Xia, M.; Poklis, J.L.; Li, P.-L. Role of Sphingolipid Mediator Ceramide in Obesity and Renal Injury in Mice Fed a High-Fat Diet. J. Pharmacol. Exp. Ther. 2010, 334, 839–846. [Google Scholar] [CrossRef] [Scilit]
- Casimiro, I.; Stull, N.D.; Tersey, S.A.; Mirmira, R.G. Phenotypic Sexual Dimorphism in Response to Dietary Fat Manipulation in C57BL/6J Mice. J. Diabetes Its Complicat. 2021, 35, 107795. [Google Scholar] [CrossRef] [Scilit]
- Ewels, P.; Magnusson, M.; Lundin, S.; Käller, M. MultiQC: Summarize Analysis Results for Multiple Tools and Samples in a Single Report. Bioinformatics 2016, 32, 3047–3048. [Google Scholar] [CrossRef] [Scilit]
- Martin, M. Cutadapt Removes Adapter Sequences from High-Throughput Sequencing Reads. EMBnet. J. 2011, 17, 10. [Google Scholar] [CrossRef] [Scilit]
- Dobin, A.; Davis, C.A.; Schlesinger, F.; Drenkow, J.; Zaleski, C.; Jha, S.; Batut, P.; Chaisson, M.; Gingeras, T.R. STAR: Ultrafast Universal RNA-Seq Aligner. Bioinformatics 2013, 29, 15–21. [Google Scholar] [CrossRef] [Scilit]
- Love, M.I.; Huber, W.; Anders, S. Moderated Estimation of Fold Change and Dispersion for RNA-Seq Data with DESeq2. Genome Biol. 2014, 15, 550. [Google Scholar] [CrossRef] [Scilit]
- Liberzon, A.; Subramanian, A.; Pinchback, R.; Thorvaldsdóttir, H.; Tamayo, P.; Mesirov, J.P. Molecular Signatures Database (MSigDB) 3.0. Bioinformatics 2011, 27, 1739–1740. [Google Scholar] [CrossRef] [Scilit]
- Korotkevich, G.; Sukhov, V.; Budin, N.; Shpak, B.; Artyomov, M.N.; Sergushichev, A. Fast Gene Set Enrichment Analysis. bioRxiv 2021, 060012. [Google Scholar] [CrossRef] [Scilit]
- Liberzon, A. A Description of the Molecular Signatures Database (MSigDB) Web Site. Methods Mol. Biol. 2014, 1150, 153–160. [Google Scholar] [CrossRef] [Scilit]
- Liberzon, A.; Birger, C.; Thorvaldsdóttir, H.; Ghandi, M.; Mesirov, J.P.; Tamayo, P. The Molecular Signatures Database (MSigDB) Hallmark Gene Set Collection. Cell Syst. 2015, 1, 417–425. [Google Scholar] [CrossRef] [Scilit]
Disclaimer/Publisher’s Note: The statements, opinions and data contained in all publications are solely those of the individual author(s) and contributor(s) and not of MDPI and/or the editor(s). MDPI and/or the editor(s) disclaim responsibility for any injury to people or property resulting from any ideas, methods, instructions or products referred to in the content. |
© 2026 by the authors. Licensee MDPI, Basel, Switzerland. This article is an open access article distributed under the terms and conditions of the Creative Commons Attribution (CC BY) license.