


Abstract
Multiple sclerosis (MS) lacks minimally invasive biomarkers that reliably reflect disease-associated pathophysiological alterations, particularly during the progressive stage of the disease. Because blood platelets contribute to thrombo-inflammatory signalling and are the major vascular carriers of regulatory miRNA, we investigated whether platelet miRNA alterations are associated with platelet hyperreactivity in MS and whether these changes originate during thrombopoiesis by examining megakaryocytes. We analyzed platelets and megakaryocytes from MS patients and healthy controls by transmission electron microscopy, flow cytometry, ELISA, miRNA profiling based on microarrays, and Real-Time PCR validation. Logistic regression and bioinformatic analyses were used to evaluate the potential and biological relevance. MS platelets exhibited a hyperreactive phenotype, characterized by enhanced degranulation, microparticle release, P-selectin expression, and collagen-induced aggregation. GPVI levels were significantly elevated in platelets but remained unchanged in megakaryocytes. MiRNA profiling revealed widespread downregulation in platelets, while megakaryocytes showed selective upregulation of miR-223-3p. Following microarray screening, PCR validation of 10 selected miRNAs revealed widespread downregulation in platelets, while only miR-223-3p was significantly upregulated in megakaryocytes from MS patients. A two-miRNA model (let-7a-5p and miR-146a-5p) showed good internal discrimination (AUC = 0.89; sensitivity 89%; specificity 85%), but lower external performance (C-index = 0.66; sensitivity 50%; specificity 73%). MS is associated with a distinct platelet miRNA signature linked to acquired platelet hyperreactivity and vesiculation. Platelet-derived let-7a-5p and miR-146a-5p represent potential non-invasive biomarker candidates, although their diagnostic utility requires further validation in larger independent cohorts.
1. Introduction
Multiple sclerosis (MS) is a chronic autoimmune and neuroinflammatory disease of the central nervous system (CNS), characterized by disruption of the blood–brain barrier (BBB), infiltration of immune cells, demyelination, and progressive neurodegeneration. The clinical course of MS is heterogeneous, encompassing relapsing–remitting (RRMS) and progressive forms, including primary progressive (PPMS) and secondary progressive MS (SPMS), which differ in their patterns of disease activity, disability accumulation, and progression [1]. Although magnetic resonance imaging (MRI) and the detection of oligoclonal bands in cerebrospinal fluid are central to the diagnosis of MS, these approaches provide limited insight into the molecular mechanisms underlying disease progression [2]. Therefore, identifying minimally invasive molecular biomarkers that reflect systemic pathophysiological alterations associated with MS remains an unmet clinical need.
Growing evidence suggests that MS is not only a CNS-restricted disorder, but also involves systemic vascular and thrombo-inflammatory dysregulation, including altered interactions between circulating blood components and the neurovascular unit [3]. Platelets are increasingly recognized as active regulators of inflammation and vascular integrity, with functions that extend well beyond their traditional role in hemostasis. Through interactions with endothelial and immune cells, platelets can modulate leukocyte recruitment and contribute to BBB dysfunction, processes central to the pathophysiology of MS [4]. Despite increasing recognition of the role of platelets in neuroinflammation, studies specifically addressing platelet biology in MS remain extremely limited, highlighting this area as an emerging and underexplored research niche. Evidence of enhanced platelet activation in MS has been reported only in a few studies [5,6], including our investigations [7,8,9,10,11,12].
Platelet-derived microRNAs (miRNAs) have emerged as promising but largely unexplored biomarker candidates. Despite being anucleate, platelets retain a complex molecular machinery, including a rich repertoire of miRNAs that regulate gene expression post-transcriptionally. These small non-coding RNAs participate in vascular and immune signalling, while their expression profiles may reflect changes in platelet functional status [13]. Platelet-derived miRNAs can also be released within extracellular vesicles, facilitating intercellular communication and potentially modulating the endothelial and immune cell response. Thus, platelet miRNAs may serve not only as molecular indicators of disease-associated alterations but also as functional mediators of thrombo-inflammatory processes [14,15,16].
In the present study, our aim was to identify a platelet miRNA signature with potential utility as a non-invasive tool to discriminate patients with SPMS from healthy individuals. Therefore, we profiled miRNA expression in platelets and their precursor cells (megakaryocytes) of patients with MS and healthy controls using a two-stage approach combining microarray screening with Real-Time PCR validation. In parallel, we characterized platelet ultrastructure and activation status using transmission electron microscopy (TEM) and flow cytometry to investigate whether alterations in the miRNA profile are associated with platelet dysfunction. By integrating molecular, functional, and bioinformatic analyses, we identified an MS-associated platelet miRNA signature accompanied by a hyperreactive platelet phenotype. We further evaluated the discriminatory performance of selected miRNAs, supporting their potential role as a non-invasive biomarker for distinguishing SPMS patients from healthy individuals.
2. Results
2.1. Signatures of Intensified Platelet Vesiculation and Cargo Secretion in MS
The ultrastructural platelet morphology was qualitatively assessed in samples obtained from three MS patients and three control subjects. Representative micrographs were acquired from independent, non-overlapping fields of view at different magnifications to ensure a broader morphological assessment of the platelet populations. Samples from MS patients and healthy controls were analyzed, with 2 grids per sample and at least 10 fields of view and 10–30 platelets examined per donor. Images illustrating recurrent ultrastructural features observed in each study group were selected for presentation. All TEM image acquisition and morphological assessments were performed by the same investigator.
The blood platelets in the control group exhibited their characteristic discoid morphology with a well-preserved ultrastructure, consistent with a quiescent or minimally activated state. These cells displayed rounded to slightly oval profiles with intact plasma membranes (Figure 1A,B). The cytoplasm was densely packed with α-granules (α) and dense granules (δ) predominantly distributed within the central cytoplasmic region (Figure 1A,B). The open canalicular system (OCS) developed moderately, with relatively few membrane invaginations (Figure 1A,B), reflecting minimal secretory activity and retention of granule content.
Figure 1.
Ultrastructural changes in blood platelets from the control group (n = 3) (A,B) versus MS patients (n = 3) (C–F). Designated structures: α-granules (α), dense granules (δ), open canalicular system (OCS), mitochondria (Mt), pseudopodia (P.), and platelet-derived microparticles (PMPs). Cell ultrastructure was examined on a TEM JEM 1010 (JEOL Ltd., Tokyo, Japan) at 80 kV.
Platelets from MS patients exhibited pronounced ultrastructural alterations consistent with increased platelet activation and degranulation. The most noticeable change was a marked reduction in the abundance of α-granules (α) and dense granules (δ) compared to controls (Figure 1A–E). Lower-magnification TEM images that encompassed broader fields of view further revealed a reduced intracellular granule abundance in platelets from MS patients compared to healthy controls (Supplementary Figure S1). This degranulation created numerous organelle-free zones (electron-lucent regions) throughout the cytoplasm, consistent with release of the granule contents (Figure 1C–E). Cell morphology was highly irregular with multiple pseudopodia (P) (Figure 1C–E). The OCS appeared more prominent and structurally complex, suggesting increased membrane remodeling and elevated granule secretion (Figure 1C–E). Mitochondria (Mt) were occasionally observed near the cell periphery (Figure 1D,E). Numerous platelet-derived microparticles (PMPs) were observed in the extracellular space surrounding MS platelets (Figure 1C–F). These membrane-bound structures varied in size and often contained electron-dense material or showed multivesicular architecture (Figure 1C–F), suggesting enhanced membrane vesiculation. PMPs were seen budding from pseudopodial tips and freely distributed in the medium, demonstrating ongoing shedding from the platelet surface (Figure 1C–F). Extensive PMP formation, marked granule depletion, organelle-free zones, elaborate OCS, and numerous pseudopodia can demonstrate spontaneous platelet hyperactivation and excessive degranulation in MS patients, contrasting strongly with granule-rich and minimally activated controls.
2.2. MS Platelets Exhibit Heightened Sensitivity to Collagen with Increased Aggregation, Vesiculation, and P-Selectin Expression
Flow cytometric analysis revealed a markedly enhanced activation state and reactivity of circulating blood platelets in MS patients compared to controls in both resting conditions (non-stimulated) and collagen-stimulated conditions (Figure 2). Collagen was selected as a physiologically relevant platelet agonist that induces activation primarily through GPVI-mediated signalling. A relatively low concentration (1 µg/mL) was applied to assess platelet responsiveness while limiting the probability of maximal activation. This approach was particularly relevant given the involvement of GPVI signalling in platelet degranulation and extracellular vesicle release, including the release of platelet-associated miRNAs [17,18,19].
Figure 2.
The percentage of platelet aggregates (PAGs) (A), platelet-derived microparticles (PMPs) (B), and expression of P-selectin on platelets (C). Results are expressed as the percentage of the total platelet population, defined as 15,000 CD61-positive events. Measurements were performed under unstimulated conditions and after collagen stimulation (1 μg/mL), using standardized gating and acquisition settings. CD61-positive objects with log-scale FSC above 103.5 were classified as PAGs, whereas events with FSC below 102.2 were classified as PMPs. P-selectin expression on CD61/FITC-positive cells was assessed using CD62/PE fluorescence, and the percentage of CD61+CD62P+ platelets was calculated relative to the total platelet count (15,000 CD61+ events). Data were acquired using the Cube 6 cytometer and analyzed with CyView Software v.1.5.5.8 (Sysmex Partec, Görlitz, Germany). The central line represents the median, boxes indicate the Q1 and Q3, and whiskers denote the min. and max. values. Statistical analysis was performed using the Mann–Whitney U test; * p < 0.05, *** p < 0.001.
In the absence of exogenous stimulation, MS platelets exhibited a markedly activated phenotype, characterized by an approximately 2-fold increase in platelet aggregates (PAGs) (12.8% vs. 6.6%; p < 0.0001) (Figure 2A), a more than 3-fold increase in the number of platelet-derived microparticles (PMPs) (12.4% vs. 4.0%; p < 0.0001) (Figure 2B), and more than 10-fold increase in the level of P-selectin–positive platelets (6.2% vs. 0.5%; p < 0.0001) relative to controls (Figure 2C).
Upon collagen stimulation, this hyperreactive profile persisted. The number of PAGs remained approximately twice as high in the MS group as in controls (22.4% vs. 10.9%; p < 0.0001) (Figure 2A), and PMP release remained almost 2-fold higher (11.3% vs. 5.8%; p < 0.0001) (Figure 2B). Although collagen robustly induced P-selectin expression in both groups, MS platelets still displayed significantly elevated surface levels (24.0% vs. 19.7%; p = 0.019) (Figure 2C).
These findings indicate a constitutive and agonist-amplified platelet hyperreactivity in MS, underscoring a potentially underappreciated contribution of platelet dysregulation to vascular and inflammatory pathology associated with MS. Flow cytometry-based evaluation of platelet activation and reactivity in MS patients and controls is summarized in Table 1, while the corresponding gating strategy is presented in Supplementary Figure S2.
Table 1.
Flow cytometric assessment of platelet activation and collagen reactivity in MS patients and controls.
2.3. Increased GPVI Expression Drives a Pro-Adhesive Phenotype in MS Platelets
To explore the molecular basis of this pro-adhesive phenotype, we quantified the expression of glycoprotein VI (GPVI), a major platelet collagen receptor. To investigate whether alterations in platelet GPVI levels are also present in their precursor cells, or emerge later through epigenetic or maturation-related changes in circulating platelets, we examined GPVI expression in both platelets and megakaryocytes from MS patients and the control group.
ELISA analysis demonstrated a higher concentration of GPVI in platelet lysates from MS patients compared to controls, while no significant differences were observed in megakaryocytes (Figure 3). The mean platelet GPVI concentration in MS was 1.65-fold higher than in controls (6.75 ± 4.32 ng/mL vs. 4.09 ± 2.13 ng/mL, respectively; p = 0.0086). In contrast, GPVI concentrations in megakaryocytes did not differ significantly between MS patients and controls (2.50 ± 1.58 ng/mL vs. 2.40 ± 1.37 ng/mL, respectively) (Figure 3).
Figure 3.
GPVI concentrations (ng/mL) in platelets and megakaryocytes from MS patients (n = 26) and the control group (n = 26). Data are presented as median with Q1 and Q3 (whiskers denote the min. and max. values). Statistical analysis was performed using the Mann–Whitney U test; ** p < 0.01.
These findings indicate that elevated platelet GPVI levels in MS are not accompanied by corresponding changes in megakaryocytes, suggesting that platelet-associated alterations may arise independently of detectable differences in their precursor cells. Increased GPVI levels may contribute to the enhanced collagen responsiveness observed in platelets from MS patients.
2.4. Microarray-Based Screening Analysis of the Platelet and Megakaryocyte miRNome
Given the role of PMPs as carriers of miRNA, we hypothesized that altered miRNA expression may contribute to platelet hyperreactivity and serve as a potential biomarker of platelet activation. To investigate this, we performed microarray-based screening of miRNA profiles in platelets and their precursor cells, megakaryocytes, to identify differentially expressed miRNAs for subsequent RT-qPCR validation.
Microarray analysis revealed substantial dysregulation of miRNA expression in platelets and megakaryocytes from MS patients compared to controls. It was performed as an exploratory screening approach using a moderated t-test with Benjamini–Hochberg correction for multiple comparisons (FDR-adjusted p-value < 0.05 and FC ≥ 2). In platelets, 130 miRNAs increased significantly and 67 decreased significantly in MS compared to controls. In megakaryocytes, 124 miRNAs showed increased expression, and 77 showed decreased expression in MS compared to the control group. Differential expression across all identified miRNAs from blood platelets and megakaryocytes is presented on characteristic volcano plots, displaying –log(corrected p-value) against log2(fold change) (Figure 4). The complete list of identified miRNAs is provided in Supplementary Tables S1 and S3.
Figure 4.
Volcano plots depicting the relationship between the negative logarithm of the FDR-adjusted p-value (Benjamini–Hochberg correction; Y-axis) and the FC logarithm (FC; X-axis) in miRNA expression profiles obtained from microarray analysis in blood platelets (A) and megakaryocytes (B), comparing MS patients with the control group. MiRNAs exhibiting a fold change greater than two (|FC| > 2) are highlighted in blue (downregulated) and red (upregulated), while grey points represent non-significant transcripts (FDR-adjusted p > 0.05). Green squares indicate selected differentially expressed miRNAs subjected to further validation by Real-Time PCR.The plots were generated using the GeneSpring software (version 14.9.1; Agilent Technologies, Santa Clara, CA, USA).
Among the miRNAs identified by microarray screening, only 10 met all the predefined selection criteria, including significantly altered expression in platelets and megakaryocytes of MS patients compared to controls (Benjamini–Hochberg-adjusted p < 0.05 and FC ≥ 2) and well-documented functional relevance to platelet biology (Table 2). The primary biological criterion was the previously documented involvement of these miRNAs in processes directly related to the platelet functional parameters investigated in our study, particularly GPVI-mediated platelet activation, collagen-dependent adhesion, and platelet-derived microparticle release. These mechanisms may contribute to the improved prothrombotic platelet phenotype observed in progressive MS. Thus, the combined application of statistical and biological criteria resulted in the identification of 10 miRNAs that met all selection requirements and were subsequently subjected to Real-Time PCR validation.
Table 2.
Differentially expressed miRNAs selected for Real-Time PCR validation based on platelet and megakaryocyte microarray profiling. Blue downward arrows (↓) indicate downregulated miRNAs, whereas red upward arrows (↑) indicate upregulated miRNAs relative to the control group.
2.5. Real-Time PCR miRNA Analysis
The expression profiles of the 10 miRNAs selected from the initial microarray screening were subsequently validated using Real-Time PCR in blood platelets and megakaryocytes from MS patients and healthy controls.
In blood platelets, all examined miRNAs except 223-3p showed substantially lower −ΔCt values in the MS group compared to controls, corresponding to markedly reduced expression, with the greatest decrease observed for let-7a-5p (approximately 19-fold). Adjustment for sex, age, BMI, and platelet count yielded effect sizes comparable to those obtained in unadjusted analyses, with statistical significance maintained for all miRNAs except miR-16-5p (Figure 5A).
Figure 5.
Expression of miRNAs (let-7a-5p, let-7i-5p, 15b-5p, 16-5p, 107, 126-3p, 142-3p, 146a-5p, 223-3p) measured by Real-Time PCR in platelets (A) and megakaryocytes (B) in the MS group (n = 26) and the control group (n = 26)—colourless bars. The results are expressed as median −ΔCt (with Q1 and Q3; whiskers min. and max. values) relative to the median value of the exogenous control (cel-miR-39-3p) and the endogenous control (miR-191-5p). Statistical analysis was performed using the Mann–Whitney U test (corrected p-value), * p < 0.05; ** p < 0.01; *** p < 0.0001.
Unlike platelets, most of the miRNAs examined showed no statistically significant differences in megakaryocyte expression between MS patients and healthy controls. The only exception was miR-223-3p, which exhibited approximately 10-fold higher expression in the MS group in both unadjusted and covariate-adjusted analyses. Additionally, miR-126-3p showed a borderline increase in expression (Figure 5B).
Table 3 summarises the miRNA expression profiles in platelets and megakaryocytes from MS patients and controls. Data are presented as mean −ΔCt values and corresponding FC.
Table 3.
Expression profiles of platelet- and megakaryocyte-selected 10 miRNAs in MS patients and controls measured by Real-Time PCR.
2.6. Intercorrelation and Exploratory Factor Analysis (EFA)
The miRNAs examined exhibited significant intercorrelations in both cell types, as illustrated by the correlation matrices (Figure 6A). Kaiser–Meyer–Olkin (KMO) measure indicated acceptable sampling for blood platelet data (KMO = 0.72; Bartlett’s χ2(45) = 328.5, p < 0.0001) and lower adequacy for megakaryocyte data (KMO = 0.64; χ2 (45) = 144.1, p < 0.0001).
Figure 6.
Inter-miRNA correlation structure (A) and exploratory factor analysis (EFA) of expression profiles (B) in platelets and megakaryocytes. The color gradient in the correlation matrix represents the strength and direction of correlations, ranging from green (negative correlations) through yellow (weak or near-zero correlations) to orange (strong positive correlations). Red values indicate statistically significant correlations.
Two factors accounted for 60.6% and 50.0% of the total variance in platelets and megakaryocytes, respectively. The factor-loading plots (Figure 6B) revealed a more concentrated distribution of miRNA loading along Factor 1 in megakaryocytes, whereas platelet miRNAs were more widely dispersed across both factors. Although the platelet dataset showed greater suitability for factor analysis, as indicated by its higher KMO value, megakaryocyte miRNAs exhibited a more uniform distribution of factor loadings. In platelets, miR-16-5p, let-7a-5p, and let-7i-5p showed relatively stronger loadings on Factor 2, while the remaining miRNAs loaded predominantly on Factor 1; in megakaryocytes, most miRNAs showed relatively greater loadings on Factor 1, with only miR-15b-5p and miR-21-5p shifting toward Factor 2. MiR-223-3p exhibited a distinct loading pattern in both cell types.
2.7. Logistic Regression Analysis
The expression of let-7a-5p and miR-146a-5p in platelets was examined as potential predictive values to differentiate MS patients from controls. Not only were the two miRNAs significantly downregulated in MS patients, but they were also insignificantly intercorrelated in patients and controls: r = 0.11, p = 0.60 and r = 0.28, p = 0.17, respectively; this means both could be efficiently included in the model (Table 4).
Table 4.
Multivariable logistic regression analysis of platelet let-7a-5p and miR-146a-5p expression in MS patients.
A bivariate logistic regression model with platelet let-7a-5p and miR-146-5p could explain at least half of the variance in the classification of subjects between patients with MS and controls (Cox-Snell R2 = 0.50, Nagelkerke R2 = 0.67). It reached satisfactory sensitivity and specificity even in an internal validation dataset of 89% and 85%, respectively; both miRNAs contributed significantly to the prediction (Figure 7). In an external validation sample of 22 MS patients and 22 controls with variable platelet count (mean ± SD 399.9 ± 155.9, min. 121, max. 623 [×103/μL]), the model presented only moderate performance (Harrell’s C-index = 0.66), as it could not distinguish MS patients (sensitivity = 0.50) but was somewhat efficient in recognizing healthy people (specificity = 0.73). These findings indicate limited discriminatory performance in the external cohort, particularly due to low sensitivity, and highlight the need for further model optimization and validation.
Figure 7.
ROC curve for logistic model based on platelet-derived let-7a-5p together with miR-146a-5p differentiating MS patients from healthy controls. The internal validation of the model was performed with a 10-fold cross-validation technique. The cut-off point was proposed to be 0.482 based on the maximization of Youden’s index. The sensitivity and specificity of the internally validated model, as well as AUC with 95% CI, and the tests for AUC differences from 0.5 are displayed.
2.8. KEGG Analysis with Gene Ontology (GO)
The most strongly enriched pathways are those related to neurodegeneration, including “Pathways of neurodegeneration—multiple diseases,” Alzheimer’s disease, amyotrophic lateral sclerosis, Huntington’s disease, and Parkinson’s disease. These exploratory findings suggest that the predicted target genes of the analyzed miRNAs may be associated with molecular pathways involved in neurodegenerative processes. Highly enriched pathways also include MAPK signalling, endocytosis, and thermogenesis. The middle portion of the plot shows pathways involved in cellular signalling and stress responses, such as “Chemical carcinogenesis—reactive oxygen species,” Rap1 signalling, focal adhesion, protein processing in the endoplasmic reticulum, Wnt signalling, and mTOR signalling. The enrichment of these pathways suggests potential associations with biological processes involved in cell survival, adhesion, responses to oxidative stress, and cellular homeostasis. Pathways with lower gene ratios and smaller counts, located at the bottom of the figure, include those related to immune and inflammatory responses, as well as hormonal regulation, for example, tumor necrosis factor (TNF), transforming growth factor β (TGF-β), neurotrophins, viral oncogene homolog erythroblastic leukemia (ErbB), and sphingolipid signalling pathways. In general, this exploratory pathway enrichment analysis identified potential associations between the predicted target genes of the examined miRNAs and biological processes related to neurodegeneration, oxidative stress, and intracellular signalling. Although these findings provide a preliminary framework to understand the possible biological relevance of the identified miRNA expression changes, they do not establish direct regulatory interactions or functional alterations in the corresponding pathways (Figure 8).
Figure 8.
Kyoto Encyclopedia of Genes and Genomes (KEGG) pathway enrichment analysis of all study miRNAs displayed as a bubble plot. The Y-axis lists the biological pathways, while the X-axis shows the gene ratio, representing the proportion of genes associated with each pathway relative to the total number of genes analyzed. The size of the bubble reflects the number of genes assigned to each pathway (count), and the color of the bubble indicates the statistical significance after multiple-testing correction (p-adjust). The plot was generated using RStudio.
Furthermore, as part of this exploratory analysis, we identified a subset of genes commonly targeted by the analyzed miRNAs (validated by Real-Time PCR), defined as genes predicted to be regulated by at least five distinct miRNAs. The data set was curated using miRDB (https://mirdb.org accessed on 1 October 2026) (Table 5).
Table 5.
Overlapping mRNA targets of ≥5 miRNAs validated by Real-Time PCR and annotated using miRDB.
As part of the exploratory bioinformatic analysis, comprehensive lists of predicted mRNA targets for the 10 analyzed miRNAs were generated and annotated using Ensembl (https://www.ensembl.org/index.html accessed on 9 July 2026) and Gene Ontology (GO) (https://geneontology.org accessed on 15 July 2026) to identify candidates with potential biological relevance. From the resulting pool of predicted target genes, a subset was selected based on available literature and curated biological databases indicating possible associations with neuroinflammation, BBB dysfunction, and neurodegenerative processes implicated in MS. Subsequently, these candidate genes were prioritized based on their potential relevance to the selected pathophysiological processes.
To further explore potential functional associations among the predicted targets, protein–protein interaction (PPI) network analysis was performed using the STRING database (https://string-db.org accessed on 30 May 2026). This analysis focused on the predicted target genes of let-7a-5p and miR-146a-5p, the two miRNAs selected based on logistic regression and receiver operating characteristic (ROC) curve analyses (Figure 9, Table 6).
Figure 9.
Protein–protein interaction (PPI) network of mRNA targets of two selected miRNAs, let-7a-5p and miR-146a-5p, associated with MS pathomechanisms, generated using the STRING database (https://string-db.org accessed on 30 May 2026).
Table 6.
Predicted target genes of let-7a-5p and miR-146a-5p and their functional relevance in MS pathophysiology using STRING database (https://string-db.org on 30 May 2026).
3. Discussion
Monitoring the progression of MS remains a major clinical challenge due to its complex pathophysiology and progressive neuroaxonal damage, often leading to irreversible disability. Current diagnostic approaches do not fully capture the dynamic nature of the disease, highlighting the need for sensitive, minimally invasive biomarkers that reflect underlying pathological processes and support patient stratification [20].
Here, we provide evidence of a distinct platelet miRNA signature potentially capable of distinguishing patients with MS patients from healthy controls, highlighting its potential as a minimally non-invasive biomarker. Importantly, this molecular signature is accompanied by functional alterations consistent with increased platelet reactivity, including collagen responsiveness (Figure 2A–C) and elevated GPVI expression (Figure 3). Complementary TEM observations revealed more pronounced platelet vesiculation and a higher occurrence of apparently empty granules in MS samples, suggesting enhanced degranulation (Figure 1C–F). Although changes in platelet shape, including pseudopodia formation, were observed in both groups and may partially reflect preanalytical activation associated with blood collection and platelet isolation, the elongated pseudopodia observed in MS samples, particularly platelets exhibiting signs of degranulation and membrane fragmentation, may indicate more advanced activation-associated alterations. These ultrastructural features were also evident in the lower-magnification overview images provided in Supplementary Figure S2. Although TEM analysis was performed on a limited number of samples (n = 3 per group), these preliminary observations complement the functional findings and warrant further quantitative validation in larger cohorts. Together, these findings suggest a biologically plausible association between platelet miRNA dysregulation and altered platelet function, providing a basis for further investigation of platelet-associated molecular pathomechanisms in MS.
Previous studies have demonstrated the relevance of platelet miRNAs in neurodegenerative and inflammatory disorders, providing a reason to investigate their expression in MS. Gámez-Valero et al. identified disease-associated alterations in platelet miRNA profiles in patients with Alzheimer’s disease and Lewy body dementia, including differential expression of miR-142-3p and miR-146a-5p [14]. Furthermore, miR-223 and miR-146a-5p have been linked to platelet activation and inflammatory signalling [21], while miR-223, miR-126, miR-21, and miR-146a-5p have been identified in platelet-derived extracellular vesicles [22]. These findings support the biological rationale for selecting these miRNAs for further investigation and provide a basis for interpreting the expression changes identified in our microarray analysis.
The initial microarray screening identified widespread alterations in miRNA expression profiles in platelets and megakaryocytes of MS patients. Based on predefined statistical and biological criteria, only 10 miRNAs were selected for subsequent Real-Time PCR validation, and the following discussion focuses exclusively on the expression results obtained by Real-Time PCR (Table 2).
Our Real-Time PCR validation demonstrates a significant alteration in the expression of 10 selected miRNAs in blood platelets from MS patients, with all analyzed miRNAs, except miR-223-3p, showing significantly lower levels compared to controls, reaching up to a 19-fold decrease for let-7a-5p (Figure 5A, Table 3). In contrast, among the same 10 miRNAs analyzed in megakaryocytes, only miR-223-3p showed a significant increase in expression, while the remaining miRNAs did not differ significantly between MS patients and controls (Figure 5B, Table 3). Crucially, this pattern remained largely unchanged after adjustment for possible confounders, including sex, age, BMI, and platelet count, with statistical significance retained for all miRNAs except miR-16-5p in platelets (Table 3), indicating a stable and biologically significant miRNA signature associated with MS.
The downregulation of validated miRNAs we have just observed in MS platelets suggests a change in post-transcriptional regulatory control, which may contribute to the platelet hyperreactive phenotype, which we have demonstrated in our previous studies [7,8,9,10,11,12]. Here, this interpretation is strongly supported by our ultrastructural and flow cytometric findings. This study provides the first evidence that MS platelets, distinct from the secretory phenotype characterized by enhanced degranulation (Figure 1C–F) and increased PMPs generation (Figure 2B), also have a different miRNA profile of their cargo (Figure 4A).
PMPs constitute an additional biologically active surface (approximately 100 times higher procoagulant activity than activated platelets). In particular, PMPs act as nanoscale signalling units that disseminate platelet-derived molecular cargo, including miRNAs, proteins, and lipids [23]. Due to the transfer of miRNAs to other cell types, platelet activation could regulate gene expression in endothelial and microglial sites of BBB injury. Through the expression of adhesion molecules and procoagulant factors, PMPs can recruit leukocytes, facilitate platelet–immune aggregates, and contribute to endothelial dysfunction [24]. PMPs preferentially localise to sites of vascular injury and to compromised BBB regions and interact with endothelial cells, thus promoting permeability changes and inflammatory signalling [25]. Although the platelet miRNome remains markedly underexplored in the context of MS, circulating miRNAs have been the subject of sustained research over many years as prospective diagnostic biomarkers for the disease.
Our PCR validation confirmed that let-7a-5p was one of the most markedly downregulated miRNAs in platelets from MS patients. The available literature indicates that let-7a plays a regulatory role in microglial inflammatory responses and neuronal survival. Its downregulation promotes proinflammatory microglial activation, while increased expression favours an anti-inflammatory phenotype, reduces apoptosis and nitric oxide synthase (iNOS)-mediated nitric oxide production, and enhances BDNF expression. These neuroprotective effects may involve modulation of TLR/NF-κB and sirtuin 1 (SIRT1)-dependent signalling pathways [26]. A significant reduction in let-7i-5p expression was also detected in platelets from MS patients (Figure 5A, Table 3). Evidence from the literature suggests that the let-7 family contributes to immune homeostasis by regulating Th17 differentiation and migration, as demonstrated in the EAE, an animal MS model [27]. However, the findings regarding let-7i expression in MS remain inconsistent. Kimura et al. (2018) reported an increase in exosomal let-7i expression associated with impaired Treg induction [28], while a more recent study based on an extracellular vesicle identified a nonsignificant decreasing trend in let-7i-5p expression [29]. Taken together, let-7i seems to be a good candidate for further research, with documented involvement in the pathogenesis of MS, probably by regulating the dynamic balance of the Treg/Th17 axis critical for immune homeostasis.
MiR-15b-5p regulates growth factor-associated signaling pathways, including vascular endothelial growth factor A (VEGFA), fibroblast growth factor 2 (FGF-2), insulin-like growth factor 1 receptor (IGF1R), and the phosphoinositide 3-kinase/protein kinase B (PI3K/AKT) pathways, and has been implicated in platelet-derived growth factor (PDGF)-mediated vascular remodeling [30,31,32,33]. In our study, expression of miR-15b-5p in platelets from MS patients coincided with increased surface GPVI expression (Figure 3), enhanced platelet aggregation, P-selectin expression, and platelet-derived microparticle release (Figure 2A–C). Given the involvement of GPVI-mediated platelet activation in thrombo-inflammatory responses and vascular injury, the downregulation of miR-15b-5p may contribute to the prothrombotic platelet phenotype observed in MS by altering PDGF-dependent signaling and platelet-vascular interactions [34,35]. However, the proposed mechanistic relationship requires experimental validation.
Available evidence indicates that the biological activity of miR-126 arises from its coordinated regulation of multiple target proteins that govern angiogenesis and vascular integrity. In particular, miR-126 is highly expressed in platelets and endothelial cells and serves as a key regulator of vascular homeostasis [36]. Our demonstrated decreased expression of miR-126-3p in platelets in MS also supports the loss of control over the mechanisms of integrity of the vascular wall. Another miRNA involved in vascular hemostasis is miR-142-3p. Bao et al. (2018) demonstrated that PMP-mediated transfer of miR-142-3p induces aberrant endothelial proliferation through Bcl-2-associated transcriptional pathways, contributing to vascular dysfunction [37]. Although our studies showed reduced levels of platelet miR-142-3p, a marked increase in the percentage of PMPs generated by MS platelets may enhance horizontal transfer of miR-142-3p, thus amplifying endothelial changes. Our chosen miR-146a-5p is a well-known negative regulator of inflammation, acting through suppression of the IRAK1/TRAF6/NF-κB signalling axis. Its anti-inflammatory role has been widely confirmed in both cells of the innate immune system and platelets, where it limits excessive activation [38]. Therefore, the observed reduction in the expression of miR-146a-5p in platelets from MS patients may promote a pro-inflammatory phenotype, which is determined by enhanced NF-κB signalling and increased release of inflammatory mediators.
MiR-223 represents a key platelet miRNA with a well-established role in regulating platelet reactivity, primarily through modulation of P2Y12 receptor-dependent signalling pathways [39]. Its involvement in ADP-mediated activation and its incorporation into PMPs position miR-223 as a regulator and effector of platelet-driven inflammatory and thrombotic responses. Beyond platelets, miR-223 can be transferred to endothelial cells through PMPs, where it exerts post-transcriptional control over genes involved in vascular integrity and endothelial activation, linking platelet activation with vascular and immune dysregulation [40].
Our recent studies have focused on extracellular vesicle (EV)-derived miRNAs as potential minimally invasive biomarkers for disease stratification. Plasma-derived EVs isolated from patients with stable RRMS, SPMS, and healthy controls were profiled with RNA sequencing and validated by Real-Time PCR. This approach identified a distinct set of EV-associated miRNAs, including miR-760, miR-98-5p, miR-301a-3p, and miR-223-3p, that significantly differed between RRMS and SPMS phenotypes [41]. In the present study, we further demonstrate that miR-223 is selectively altered at the megakaryocyte level (Figure 5B, Table 3), indicating that its dysregulation may originate during thrombopoiesis and reflect disease-specific reprogramming of platelet precursors in MS.
Platelet-derived miRNAs profiling in MS remains unexplored in sufficient detail, despite increasing evidence supporting platelet transcriptomics and circulating miRNAs as biomarker sources. Previous studies demonstrated a high diagnostic performance of platelet RNA signatures in MS (AUC ~0.89), confirming the biological relevance of platelets in disease-related processes [42]. In parallel, other studies have applied ROC analysis to circulating miRNAs, indicating their utility in determining response to fingolimod in MS patients; however, these analyses were primarily based on plasma, serum, or peripheral blood mononuclear cells rather than platelets [43].
Although the two-miRNA model showed good discrimination during internal validation (AUC = 0.89; sensitivity, 89%; specificity, 85%), its performance decreased substantially in the external cohort (Harrell’s C-index = 0.66; sensitivity, 50%; specificity, 73%) (Figure 7), limiting its current diagnostic utility. Such reductions are frequently reported for clinical prediction models, including molecular classifiers [44,45]. In our study, the considerable variability in platelet counts among MS patients in the external cohort (121–623 × 103/µL) may reflect biological heterogeneity relevant to miRNA expression. Differences in other patient characteristics may also have contributed to the reduced performance. Another possible explanation is overfitting in the development cohort. However, the final logistic regression model included only two predictors, corresponding to 13 events per predictor, meeting the conventional threshold of 10 [46]. Nevertheless, this criterion and the use of 10-fold cross-validation cannot fully exclude overfitting, particularly when predictors are selected from a larger set of candidates [47]. Importantly, independent external validation and transparent reporting of its results represent a strength of our study, providing a more realistic assessment of the model’s generalizability. Further optimization and validation in larger, more heterogeneous cohorts are therefore required before clinical application. Logistic regression modelling with miRNAs therefore represents a novel approach. Given the active role of platelets in neuroinflammation and BBB interactions, their miRNA cargo may provide disease-specific signals that are not captured by other biofluids. This supports the rationale for using platelet let-7a and miR-146a-5p as candidates for MS biomarkers.
Exploratory analyses using KEGG and miRDB identified potential molecular pathways and regulatory interactions associated with the miRNAs investigated in our study.
KEGG pathway enrichment analysis (Figure 8) suggested potential associations with neurodegenerative processes, including mitochondrial dysfunction, oxidative stress, and impaired proteostasis, as well as MAPK, mTOR, and inflammatory signalling pathways [48,49,50,51,52,53,54,55]. Complementary miRDB analysis (Table 6) identified shared predicted miRNA targets involved in miRNA biogenesis (DICER1, AGO1, AGO4), intracellular signaling (PI3K/AKT, cAMP/PKA, TGF-β), cytoskeletal organization, vesicular transport, and circadian regulation (CLOCK) [56,57,58,59].
Our in silico analysis revealed that let-7a-5p and miR-146a-5p are the only two miRNAs with high potential to discriminate MS from healthy controls, as demonstrated by logistic regression analysis. In MS, platelet-derived let-7a and miR-146a-5p were consistently negatively regulated and did not show significant intercorrelation (Figure 7, Table 4), indicating their independent contribution to disease-associated molecular alterations and supporting their joint inclusion as complementary biomarkers. A bivariate logistic model incorporating both miRNAs demonstrated strong discriminative capacity in the discovery cohort, explaining a substantial proportion of variance and achieving high sensitivity and specificity upon internal validation (Table 4).
Next, computational PPI network analysis of the predicted let-7a-5p and miR-146a-5p target genes (Figure 9, Table 6) identified potential protein interaction networks associated with key pathways relevant to MS pathophysiology. The PPI network included proteins associated with immune regulation (IL6, RORC, IRAK1), BBB integrity and vascular function (COL4A1, PDGFRB), myelination (GALC, LINGO1), oxidative stress (NOX4, GPX6), synaptic transmission (GRIA3, SYT1), and epigenetic regulation (EHMT2) (Figure 9, Table 6). These associations suggest potential molecular pathways for future investigation rather than confirmed mechanisms of MS pathophysiology. All proposed associations between the analyzed miRNAs, the predicted target genes, and the pathological processes related to MS remain hypothetical. Therefore, these findings should be considered hypothesized and may help prioritize molecular targets for future experimental validation.
Nevertheless, the present study has certain limitations that need to be addressed in future research. Despite the inclusion of an independent external validation cohort, the reduced sensitivity observed during validation highlights the need for more studies in larger and more diverse populations. Moreover, the cross-sectional design precludes the assessment of temporal changes in miRNA expression during MS progression. Given the limited disease specificity of platelet-associated miRNAs, prospective longitudinal studies are warranted to establish their potential clinical utility as MS biomarkers. Furthermore, it remains unclear at what stage of MS these alterations emerge and how they evolve throughout the course of the disease, highlighting the need for longitudinal studies involving different MS phenotypes to establish their potential clinical relevance. It should also be noted that computational approaches facilitate the identification of potential miRNA regulatory networks and candidate biomarkers by predicting molecular interactions and disease-associated pathways [60]; however, their reliability is limited by database quality, false-positive predictions, and insufficient cell-specific information. In our study, the predicted interactions remain hypothetical and do not confirm functional gene regulation or the transfer of platelet-derived miRNAs to recipient cells. Therefore, these findings should be considered hypothesis-generating and require independent experimental clinical validation to establish their biological relevance and potential biomarker utility in MS.
4. Materials and Methods
4.1. Flow Cytometry
The levels of specific markers of platelet activation, including platelet aggregate (PAG) formation, platelet microparticles (PMPs), and P-selectin (CD62P), were evaluated using flow cytometry, as previously described [9,10,11]. All blood samples were processed within 30 min of collection. Briefly, fresh whole blood samples, both untreated and activated with Chrono-Par® Collagen (at final concentration 1 µg/mL, 10 min, 37 °C) (Chrono-log Corp.Havertown, PA, USA), were labelled with mouse anti-human CD61/FITC (clone RUU-PL7F12) alone or in combination with anti-human CD62P/PE (clone AC1.2) antibodies (Becton Dickinson, Franklin Lakes, NJ, USA) for 30 min in the dark at room temperature (RT), followed by fixation in 1% CellFIX solution (Becton Dickinson, Franklin Lakes, NJ, USA) for 15 min at RT. All samples from patients with MS and healthy volunteers were processed using the same standardized staining, fixation, and acquisition procedures to minimize preanalytical and analytical variability between groups. Gates for PE and FITC fluorescence were set based on the fluorescence of unstained controls. Fluorescence-minus-one (FMO) controls were used to establish the boundary between positive and negative platelets. CD61-positive objects with a forward scatter (FSC) parameter on a log scale above 103.5 were classified as PAGs, while those below 102.2 were classified as PMPs. Surface expression of P-selectin on CD61/FITC-positive cells was assessed using the fluorescence of CD62/PE. The percentage of CD61+CD62P+ platelets was calculated relative to the total platelet population in each sample (15,000 CD61+ events). The flow cytometric gating strategy, including representative histograms illustrating the identification and characterization of platelet populations, is provided in the Supplementary Figures S2 and S3. The compensation procedure was performed using the VersaComp Antibody Capture Bead Kit (Beckman Coulter, Brea, CA, USA) as recommended by the manufacturer. Analyses were performed using Cube 6 Flow Cytometry (Sysmex Partec, Görlitz, Germany) with CyView software v.1.5.5.8 (Sysmex Partec, Görlitz, Germany).
4.2. Blood Platelet Isolation and Leukocyte/Erythrocyte Depletion
Platelet-rich plasma (PRP) was obtained by collecting fresh whole blood samples from subjects using an S-Monovette® CPDA-1 (Sarstedt, Nümbrecht, Germany) system, followed by immediate centrifugation at 235× g for 12 min at RT as previously described [9,10,11]. The top layer of PRP was carefully collected and transferred to a fresh tube. To prevent spontaneous platelet activation during processing, prostaglandin E1 (PGE1) (Sigma-Aldrich, St. Louis, MO, USA) was added to achieve a final concentration of 300 nM. To remove erythrocyte and leukocyte contamination, PRP was purified using nano-sized MicroBeads conjugated with monoclonal human antibodies specific to CD235a (erythrocyte marker) and CD45 (leukocyte marker) (Miltenyi Biotec, Bergisch Gladbach, Germany). The efficiency of erythrocyte/leukocyte depletion was confirmed using flow cytometry, employing anti-CD235a/FITC-conjugated (clone GA-R2 (HIR2)) and anti-CD45/PE-conjugated antibodies (clone HI30) to target platelet and leukocyte surface markers, respectively. Microscopic analysis further confirmed the absence of erythrocyte/leukocyte contamination, consistent with flow cytometry findings. Platelet concentration was spectrophotometrically determined and adjusted to a final concentration of 2 × 10⁸ platelets/mL using modified Tyrode’s buffer (pH 7.4) containing 134 mM NaCl, 12 mM NaHCO3, 2.9 mM KCl, 0.4 mM Na2HPO4·12H2O, 1 mM MgCl2·6H2O, 10 mM HEPES, 5 mM glucose, and deionized water (all from Sigma-Aldrich). Finally, blood platelet suspension was divided into two equal portions; in one part, RNAlaterTM stabilisation (Thermo Fisher Scientific) was added, and in the second part, cell lysis buffer (Thermo Fisher Scientific, Waltham, MA, USA) was added. Then they were immediately frozen (−80 °C) for further transcriptomic and proteomic analysis.
4.3. Transmission Electron Microscopy (TEM)
Based on our previously described protocol [11], blood platelet samples were fixed immediately after isolation, within 30 min of blood collection, in 2.5% glutaraldehyde in 0.1 M PBS (pH 7.4) for 3 h at 4 °C, centrifuged (1743× g, 10 min), and embedded in 2% agar. After PBS rinsing, samples were postfixed in 1% osmium tetroxide (2 h, 4 °C), dehydrated in graded ethanol, and stained overnight with uranyl acetate in 50% ethanol. Following dehydration and propylene oxide treatment, samples were embedded in Epon–Spurr resin and polymerized (37–72 °C). The same standardized isolation and fixation procedures were consistently applied to all samples from patients with MS and healthy volunteers to minimize preanalytical variability and potential ex vivo platelet activation. All reagents were purchased from Polysciences, Inc. (Warrington, PA). Ultrathin sections (60–70 nm) were prepared using an Ultra Cut E ultramicrotome (Reichert Jung, Germany, Vienna, Austria), contrasted with uranyl acetate and lead citrate, and examined with a JEM 1010 transmission electron microscope (JEOL Ltd., Tokyo, Japan) at 80 kV. Images were digitized using a Perfection V700 PHOTO scanner (Epson, Suwa, Japan).
4.4. Megakaryocyte Isolation
Megakaryocytes were isolated from whole blood through a two-stage process as previously described [9,10]. Initially, peripheral blood mononuclear cells (PBMCs) were separated by gradient centrifugation. Fresh whole blood was layered onto Histopaque®-1077 (Sigma-Aldrich, St. Louis, MO, USA) in a 1:1 ratio and centrifuged at 635× g for 30 min at RT. The resulting PBMC fraction was carefully collected, washed twice with PBS (pH 7.4) (Sigma-Aldrich), and centrifuged at 400× g for 12 min at RT. The PBMC pellet was resuspended in reaction buffer (pH 7.4) containing 2 mM ethylenediaminetetraacetic acid (EDTA) (Sigma-Aldrich, St. Louis, MO, USA) and 0.5% bovine serum albumin (BSA) (Sigma-Aldrich, St. Louis, MO, USA). In the second stage, CD61-positive megakaryocytes were magnetically labeled using anti-CD61 microbeads (Miltenyi Biotec, Bergisch Gladbach, Germany) and isolated from the PBMC suspension via magnetic separation. The cell suspension was applied to a MACS® column under the influence of a magnetic field, which captured the CD61-positive cells while allowing CD61-negative cells to flow through. The positively selected megakaryocyte fraction was eluted with reaction buffer by applying negative pressure with the column plunger. Megakaryocyte numbers were quantified using a Cube6 flow cytometer (Sysmex Partec GmbH, Görlitz, Germany) by labeling with anti-CD61/FITC-conjugated (clone RUU-PL7F12) and anti-CD42/PE-conjugated (clone HIP1) antibodies (Becton Dickinson, Franklin Lakes, NJ, USA). The purity of the megakaryocyte suspension was assessed cytometrically using antibodies against leukocyte/erythrocyte antigens: anti-CD45/PE-conjugated (clone HI30) and anti-CD235a/FITC-conjugated (clone GA-R2/HIR2) (Becton Dickinson, Franklin Lakes, NJ, USA). Finally, megakaryocyte suspension was divided into two equal portions; in one part, the RNAlaterTM stabilization (Thermo Fisher Scientific, Waltham, MA, USA) was added, and in the second part, the cell lysis buffer (Thermo Fisher Scientific, Waltham, MA, USA) was added. Then, they were immediately frozen (−80 °C) for further transcriptomic and proteomic analysis.
4.5. Enzyme-Linked Immunosorbent Assay (ELISA)
First, the total protein concentration was determined using the RC DC™ Protein Assay (Bio-Rad, Hercules, CA, USA) method with a bovine serum albumin (BSA) standard curve. Each sample was adjusted to a uniform concentration, specifically 2 μg/μL for blood platelets and 1 μg/μL for megakaryocytes. The expression level of the GPVI receptor in blood platelets and megakaryocytes was quantified using a commercial Human GP6 (Glycoprotein VI Platelet) ELISA kit (Elabscience, Wuhan, China), according to the manufacturer’s instructions. Briefly, standards and samples (100 μL) were added to the wells and incubated for 90 min at 37 °C. After removing the liquid, 100 μL of biotinylated detection antibody was added and incubated for 1 h at 37 °C. The wells were washed three times and then incubated with 100 μL of HRP (horseradish peroxidase) conjugate for 30 min at 37 °C. Following five washing cycles, 90 μL of substrate solution was added and incubated for 15 min at 37 °C. Absorbance was recorded at 450 nm using a SPECTROstar Nano microplate reader (BMG Labtech, Ortenberg, Germany). GPVI concentrations were calculated from a standard calibration curve and expressed as ng/mL.
4.6. RNA Isolation and RT-PCR
Before RNA isolation, a spike-in control cel-miR-39 (Norgen Biotek Corp., Thorold, ON, Canada) was added at a final concentration of 10 pM. Total RNA extraction from frozen (at −80 °C) blood platelets and megakaryocytes suspended in RNAlaterTM solution was performed using the ISOLATE II RNA Mini Kit (Bioline, London, UK), following the manufacturer’s instructions. RNA purity was assessed using a spectrophotometer Synergy HIT on the Take3™ microvolume plate (Agilent Technologies, Santa Clara, CA, USA); RNA integrity was examined on TapeStation 2200 using High-Sensitivity RNA ScreenTape (Agilent Technologies, Santa Clara, CA, USA), while concentration was measured using a Qubit 3.0 Fluorometer (Thermo Fisher Scientific, Waltham, MA, USA). All total RNA samples were stored at −80 °C until further use. For reverse transcription PCR (RT-PCR), the Maxima First Strand cDNA Synthesis Kit (Thermo Fisher Scientific, Waltham, MA, USA) was employed according to the manufacturer’s protocol. The resulting cDNA libraries were also stored at −80 °C until they were analysed by Real-Time PCR.
4.7. Microarray Analysis
Microarray analysis utilised the Microarray SurePrint G3 Human miRNA r21 Array Kit (Agilent Technologies, Santa Clara, CA, USA), designed for high-throughput processing with optimal sequence discrimination and sensitivity. The microarray slides featured 2549 human miRNAs sourced from miRBase Database Release 21.0, employing SurePrint inkjet technology to synthesise 40- to 60-mer oligonucleotides directly on the slide in an array format. Approximately 15,000 printed probes were distributed randomly across the slide to ensure complete coverage of all miRNAs in the tested samples. Total RNA samples stored at −80 °C were transported on dry ice to the Institute of Biology of Jan Kochanowski University in Kielce, Poland, for processing. The experimental protocol included several critical steps: preparation of spike-in solutions for the generation of fluorescently labelled miRNA, and sample dephosphorylation, denaturation, ligation, and drying procedures. Following these steps, microarray slides were placed in a SureHyb chamber cover and incubated in an oven rotated at 55 °C for 24 h at 20 rpm. After hybridisation, the slides were washed and scanned. To prevent post-wash complications, slides were immediately placed in ozone-barrier slide covers. Scanning was conducted using the SureScan Agilent G2565C scanner with Feature Extraction software v. 10.10.1.1 (Agilent Technologies, Santa Clara, CA, USA), utilising grid number 070156_D_F_20141006.
4.8. Real-Time PCR
The validation analysis of the gene expression for ten selected miRNA molecules was made using TaqMan® probes (Life Technologies, Carlsbad, CA, USA) (Table 7). Quantitative data were normalized to the level of cel-miR-39-3p (exogenous control) and 191-5p (endogenous control). The selection of miR-191-5p as an endogenous reference was supported by previous studies that used this miRNA as an internal control in human platelet samples, including research involving patients with acute coronary syndrome [61] and investigations of miRNA expression in stored human platelets [62]. To account for both endogenous miRNA abundance and technical variability, cel-miR-39-3p was also included as an exogenous spike-in control. The combined reference Ct was calculated as the median of the Ct values obtained for miR-191-5p and cel-miR-39-3p and subsequently used for normalisation of target miRNA expression. Real-time PCR was performed in a CFX96™ Real-Time PCR Detection System Thermal Cycler (Bio-Rad, Hercules, CA, USA) using a TaqMan Universal Master Mix II, no UNG (Life Technologies, Carlsbad, CA, USA). All steps were performed according to the manufacturer’s protocol, including an initial polymerase activation at 95 °C for 20 s, followed by 40 cycles of denaturation at 95 °C for 3 s and extension at 60 °C for 30 s. Equation −ΔCt (ΔCt = Ct target gene—Ct means of two control genes) was used to calculate the relative expression of studied miRNAs.
Table 7.
Characteristics of the miRNA assays used in the study.
4.9. Data Analysis
Real-Time PCR data that were missing, likely in a random pattern (two cases for platelets and four cases for megakaryocytes), were imputed using the multiple imputation by chained equations method using R software v. 4.4.1 with package mice v. 3.17.0 (R Foundation for Statistical Computing, Vienna, Austria). Microarray data analysis was performed using GeneSpring GX software v. 14.9.1; (Agilent Technologies, Santa Clara, CA, USA), following the manufacturer’s protocol throughout all stages of the experiment. Real-Time PCR data were presented and treated as −ΔCt to keep the distribution close to normal (the higher the value, the higher the miRNA expression), and FC was reported. Descriptive statistics included mean with standard deviation for continuous variables, median with 1st (Q1) and 3rd (Q3) quartiles for ordinal variables, and number with frequency for categorical variables. The differences between two means of variables with distributions close to normal were tested with Student’s t-test, while variables that were highly skewed were tested with the Mann–Whitney U test. Benjamini and Hocheberg (B-H) correction for multiple testing was applied for microarray analysis to control the false discovery rate at 0.05. For covariate-adjusted fold changes in miRNA expression, sex, age, BMI, and platelet count were used linearly linked to the outcome with the use of general linear modelling. Exploratory factor analysis (EFA) of residualised values was used to examine intercorrelations among miRNAs tested. Factors were extracted using the principal component method with orthogonal varimax rotation. Pearson’s r and Spearman’s rho, together with exploration factor analysis, were used to present correlation matrices and examine the collinearity of miRNA and platelet parameters. Logistic regression was used to evaluate the discriminative properties of selected miRNA between MS patients and controls. To assess the goodness of fit, the Hosmer–Lemeshow chi-squared test was performed. The receiver operating characteristic (ROC) curve analysis was applied to evaluate model performance in the total cohort and after internal validation using 10-fold cross-validation. Areas under the ROC curves (AUCs) with 95% confidence intervals (CIs) were estimated. A cut-off point was proposed based on the maximization of Youden’s index. Harrell’s C-index, together with sensitivity and specificity measures, was reported for external validation of the predictive model. KEGG pathway enrichment analyses were performed to determine the biological significance of associated proteins, while a bubble plot was generated using RStudio v. 4.6.0 (Boston, MA, USA). In each analysis, p-values below 0.05 were considered statistically significant. The analysis was performed using STATISTICA v. 13.3 software(StatSoft, Tulsa, OK, US). Graphs and plots were prepared using GraphPad software v. 8.0.1 (GraphPad Inc., San Diego, CA, USA), MS Excel (Microsoft Corporation, Redmond, WA, USA), or STATISTICA v. 13.3 (StatSoft, Tulsa, OK, USA), while STRING v. 12.5 ( https://string-db.org accessed on 20 May 2026) was used to generate protein–protein interactions (PPIs).
5. Conclusions
This study identifies platelet-derived miRNAs as a previously unrecognized mechanistically relevant layer of MS biology. Coordinated downregulation of key regulatory miRNAs, particularly let-7a-5p and miR-146a-5p, may have functional relevance in the pathophysiology of MS. In silico analyses demonstrated that these miRNAs are linked to numerous target genes involved in several biological pathways that are central to the development and progression of MS, including neuroinflammation, BBB dysfunction, immune regulation, and neurodegenerative processes. Although the two-miRNA signature showed good discriminatory performance during internal validation, its reduced performance in the external cohort, particularly its low sensitivity, indicates that further optimization and validation are required before clinical application. Together, these findings position platelets as active amplifiers of MS pathophysiology and a source of robust, functionally informative biomarkers.
6. Patents
Blood samples from MS patients and control subjects were collected in Sarstedt® citrate phosphate dextrose adenine-1 tubes (CPDA-1) (Nümbrecht, Germany) under fasting conditions in the morning hours. The samples were stored under identical conditions following a standardized protocol. The clinical and anthropometric characteristics of the control group and MS patients are presented in Table 8.
The study included 26 MS patients (18 females and 8 males) with an age of 52 ± 12 years. The patients were diagnosed with MS according to the revised McDonald criteria and using magnetic resonance imaging (MRI). The secondary progressive (SP) course of MS (inactive with progression) was defined according to Lublin et al. [63]. MS patients did not receive any immunomodulators or hormones. Participants were enrolled in the study after completing a medical questionnaire and providing consent. The inclusion criteria included individuals aged 40 to 65 years, with an Expanded Disability Status Scale (EDSS) score ranging from 4 to 7, a modified Rankin scale (mRS) score ranging from 2 to 4, and a disease duration of 15–30 years.
Exclusion criteria included treatment with medications known to affect platelet count, activation, or function, including antiplatelet agents, nonsteroidal anti-inflammatory drugs (NSAIDs), selective serotonin reuptake inhibitors (SSRIs), serotonin–norepinephrine reuptake inhibitors (SNRIs), anticoagulants, and systemic corticosteroids. Other exclusion criteria comprised neurological comorbidities, depression or other psychiatric disorders, those receiving disease-modifying therapy (DMT) (i.e., interferon-β, glatiramer acetate, or natalizumab), immunomodulatory or immunostimulatory treatment, and recent infection within four weeks before blood collection.
Control blood samples were collected from 26 healthy volunteers at the Laboratory Diagnostics Centre in Lodz, Poland. The control group was matched by age (47 ± 13) and gender (14 females and 12 males). In the control group, acute or chronic comorbidities were not allowed. Consequently, control subjects had no history or clinical evidence of neurological, autoimmune, inflammatory, hormonal, hematologic, cardiovascular, or coagulation disorders and did not receive any pharmacological treatment or dietary supplementation affecting platelet or immune function. Each volunteer in the control group was tested, including hematological and biochemical tests, to confirm their health status.
Table 8.
Clinical characteristics of the control group and MS patients.
To assess model robustness under biologically heterogeneous conditions, an independent external validation cohort consisting of 22 MS patients and 22 control subjects (Table 9), selected according to the same inclusion and exclusion criteria but not included in the initial model development, was used exclusively for external validation of the classification model. The MS subgroup within this cohort exhibited substantially greater variability in platelet counts than the primary cohort; therefore, a corresponding external control subset was also included to enable comparisons between patients with MS and healthy individuals.
Table 9.
Clinical characteristics of the independent external ROC validation cohort characterized by heterogeneous platelet counts in the MS group.
Supplementary Materials
The following supporting information can be downloaded at https://www.mdpi.com/article/10.3390/ijms27219914/s1.
Author Contributions
Conceptualization, A.D. and J.S.; methodology, A.D., M.A. and J.S.; validation, A.D. and J.S.; formal analysis, A.D. and M.S.K.; investigation, A.D., M.S.K. and S.M.; resources, E.M.; data curation, A.D. and M.S.K.; writing—original draft preparation, A.D., M.S.K., M.A., S.M. and J.S.; writing—review and editing, A.D., E.M. and J.S.; visualization, A.D. and M.S.K.; supervision, J.S.; project administration, A.D. and J.S.; funding acquisition, J.S. All authors have read and agreed to the published version of the manuscript.
Funding
This research was funded by the Polish National Science Centre, grant number UMO-2016/21/B/NZ4/00543.
Institutional Review Board Statement
The study was conducted in accordance with the Declaration of Helsinki and was approved by the Bioethics Committee of the University of Lodz, Poland, with resolution No. 15/KBBN-UŁ/II/2016 (approved on 10 November 2016).
Informed Consent Statement
Informed consent was obtained from all subjects involved in the study.
Data Availability Statement
The data generated in this study have been deposited in the University of Lodz Repository and are publicly available under Creative Commons 4.0 at the following link: http://hdl.handle.net/11089/59570.
Acknowledgments
The authors would like to express their sincere gratitude to Sława Glińska and Łucja Balcerzak from the Laboratory of Microscopic Imaging and Specialized Biological Techniques (for their valuable assistance in preparing the TEM micrographs). We also extend our gratitude to Michał Arabski’s research team from the Institute of Biology, Division of Medical Biology at Jan Kochanowski University, for their support during the implementation of the method.
Conflicts of Interest
The authors declare no conflicts of interest.
Abbreviations
The following abbreviations are used in this manuscript:
| ADL | Activity of daily living |
| AKT | Protein kinase B |
| ATP | Adenosine triphosphate |
| AUC | Area under the curve |
| BBB | Blood–brain barrier |
| BDI | Beck Depression Inventory |
| BDNF | Brain-derived neurotrophic factor |
| B-H | Benjamini–Hochberg |
| BMI | Body mass index |
| CCL19 | C-C motif chemokine ligand 19 |
| CI | Confidence interval |
| CNS | Central nervous system |
| CPDA-1 | Citrate phosphate dextrose adenine-1 |
| CSF2 | Granulocyte–macrophage colony-stimulating factor |
| CSF3 | Granulocyte colony-stimulating factor |
| DAG | Diacylglycerol |
| DMTs | Disease-modifying therapies |
| DNA | Deoxyribonucleic acid |
| ECM | Extracellular matrix |
| EDSS | Expanded Disability Status Scale |
| EDTA | Ethylenediaminetetraacetic acid |
| ELISA | Enzyme-linked immunosorbent assay |
| ErbB | Erythroblastic leukemia viral oncogene homolog |
| EVs | Extracellular vesicles |
| FC | Fold change |
| FGF-2 | Fibroblast growth factor 2 |
| FMO | Fluorescence-minus-one |
| FSC | Forward scatter |
| GABA | Gamma-aminobutyric acid |
| GO | Gene ontology |
| GPVI | Glycoprotein VI |
| H2O2 | Hydrogen peroxide |
| H3K9 | Histone H3 lysine 9 |
| IGF1R | Insulin-like growth factor 1 receptor |
| IL | Interleukin |
| IL1R | Interleukin-1 receptor |
| IL6 | Interleukin-6 |
| iNOS | Inducible nitric oxide synthase |
| IP3 | Inositol 1,4,5-trisphosphate |
| JAK | Janus kinase |
| JAK–STAT | Janus kinase–signal transducer and activator of transcription |
| KEGG | Kyoto Encyclopedia of Genes and Genomes |
| MAPK | Mitogen-activated protein kinase |
| MDD | Mean disease duration |
| miRNA | Micro RNA |
| MMSE | Mini-Mental State Examination |
| MoCA | Montreal Cognitive Assessment |
| mRNA | Messenger RNA |
| MRI | Magnetic resonance imaging |
| mRS | Modified Rankin Scale |
| MS | Multiple sclerosis |
| Mt | Mitochondria |
| NF-κB | Nuclear factor kappa B |
| NO | Nitric oxide |
| NOS | Nitric oxide synthase |
| NSAID | Nonsteroidal anti-inflammatory drugs |
| OCS | Open canalicular system |
| oxLDL | Oxidized low-density lipoprotein |
| P | Pseudopodia |
| PAGs | Platelet aggregates |
| PBMCs | Peripheral blood mononuclear cells |
| PDGF | Platelet-derived growth factor |
| PGE1 | Prostaglandin E1 |
| PI3K | Phosphoinositide 3-kinase |
| PI3K/AKT | Phosphoinositide 3-kinase/protein kinase B |
| PMPs | Platelet microparticles |
| PPI | Protein–protein interaction |
| PRP | Platelet-rich plasma |
| PPMS | Primary progressive multiple sclerosis |
| Q | Quartile |
| RGD | Arginine-glycine-aspartate |
| RISC | RNA-induced silencing complex |
| RNA | Ribonucleic acid |
| ROC | Receiver operating characteristic |
| ROS | Reactive oxygen species |
| RRMS | Relapsing–remitting multiple sclerosis |
| RT | Room temperature |
| RT-PCR | Reverse transcription polymerase chain reaction |
| SD | Standard deviation |
| Ser/Thr | Serine/threonine |
| SIRT1 | Sirtuin 1 |
| SPMS | Secondary progressive multiple sclerosis |
| SSRIs | Selective serotonin reuptake inhibitors |
| STAT | Signal transducer and activator of transcription |
| TCR | T-cell receptor |
| TEM | Transmission electron microscopy |
| TGF-β | Transforming growth factor beta |
| TGFB1 | Transforming growth factor beta 1 |
| Th17 | T helper 17 |
| TLR | Toll-like receptor |
| TNF | Tumor necrosis factor |
| TNFRSF | Tumor necrosis factor receptor superfamily |
| VEGFA | Vascular endothelial growth factor A |
| VSMCs | Vascular smooth muscle cells |
References
- Papiri, G.; D’Andreamatteo, G.; Cacchiò, G.; Alia, S.; Silvestrini, M.; Paci, C.; Luzzi, S.; Vignini, A. Multiple Sclerosis: Inflammatory and Neuroglial Aspects. Curr. Issues Mol. Biol. 2023, 45, 1443–1470. [Google Scholar] [CrossRef] [Scilit] [PubMed]
- Di Filippo, M.; Gaetani, L.; Centonze, D.; Hegen, H.; Kuhle, J.; Teunissen, C.E.; Tintoré, M.; Villar, L.M.; Willemse, E.A.J.; Zetterberg, H.; et al. Fluid biomarkers in multiple sclerosis: From current to future applications. Lancet Reg. Health Eur. 2024, 44, 101009. [Google Scholar] [CrossRef] [Scilit] [PubMed]
- El-Taibany, A.A.; Heydarian, P.; Porada, D.A.; Seeds, M.C.; Atala, A. Multiple sclerosis: Etiology in the context of neurovascular unit and immune system involvement and advancements with in vitro blood-brain barrier models. Front. Immunol. 2025, 16, 1595276. [Google Scholar] [CrossRef] [Scilit] [PubMed]
- Mehdi-Alamdarlou, S.; Ahmadi, F.; Shahbazi, M.A.; Azadi, A.; Ashrafi, H. Platelets and platelet-derived vesicles as an innovative cellular and subcellular platform for managing multiple sclerosis. Mol. Biol. Rep. 2023, 50, 4675–4686. [Google Scholar] [CrossRef] [Scilit] [PubMed]
- Sheremata, W.A.; Jy, W.; Horstman, L.L.; Ahn, Y.S.; Alexander, J.S.; Minagar, A. Evidence of platelet activation in multiple sclerosis. J. Neuroinflammation 2008, 5, 27. [Google Scholar] [CrossRef] [Scilit] [PubMed]
- Starossom, S.C.; Veremeyko, T.; Yung, A.W.; Dukhinova, M.; Au, C.; Lau, A.Y.; Weiner, H.L.; Ponomarev, E.D. Platelets Play Differential Role During the Initiation and Progression of Autoimmune Neuroinflammation. Circ. Res. 2015, 117, 779–792. [Google Scholar] [CrossRef] [Scilit] [PubMed]
- Morel, A.; Rywaniak, J.; Bijak, M.; Miller, E.; Niwald, M.; Saluk, J. Flow cytometric analysis reveals the high levels of platelet activation parameters in circulation of multiple sclerosis patients. Mol. Cell Biochem. 2017, 430, 69–80. [Google Scholar] [CrossRef] [Scilit] [PubMed]
- Bijak, M.; Olejnik, A.; Rokita, B.; Morel, A.; Dziedzic, A.; Miller, E.; Saluk-Bijak, J. Increased level of fibrinogen chains in the proteome of blood platelets in secondary progressive multiple sclerosis patients. J. Cell Mol. Med. 2019, 23, 3476–3482. [Google Scholar] [CrossRef] [Scilit] [PubMed]
- Dziedzic, A.; Miller, E.; Bijak, M.; Przyslo, L.; Saluk-Bijak, J. Increased Pro-Thrombotic Platelet Activity Associated with Thrombin/PAR1-Dependent Pathway Disorder in Patients with Secondary Progressive Multiple Sclerosis. Int. J. Mol. Sci. 2020, 21, 7722. [Google Scholar] [CrossRef] [Scilit] [PubMed]
- Dziedzic, A.; Miller, E.; Saluk-Bijak, J.; Niwald, M.; Bijak, M. The Molecular Aspects of Disturbed Platelet Activation through ADP/P2Y(12) Pathway in Multiple Sclerosis. Int. J. Mol. Sci. 2021, 22, 6572. [Google Scholar] [CrossRef] [Scilit] [PubMed]
- Dziedzic, A.; Michlewska, S.; Jóźwiak, P.; Dębski, J.; Karbownik, M.S.; Łaczmański, Ł.; Kujawa, D.; Glińska, S.; Miller, E.; Niwald, M.; et al. Quantitative and structural changes of blood platelet cytoskeleton proteins in multiple sclerosis (MS). J. Autoimmun. 2024, 145, 103204. [Google Scholar] [CrossRef] [Scilit] [PubMed]
- Maciak, K.; Dziedzic, A.; Szymański, J.; Studzian, M.; Redlicka, J.; Miller, E.; Michlewska, S.; Jóźwiak, P.; Saluk, J. Human B-cells can form Hetero-aggregates with Blood Platelets: A Novel Insight into Adaptive Immunity Regulation in Multiple Sclerosis. J. Mol. Biol. 2025, 437, 168885. [Google Scholar] [CrossRef] [Scilit] [PubMed]
- Krammer, T.L.; Zeibig, S.; Schrottmaier, W.C.; Pirabe, A.; Goebel, S.; Diendorfer, A.B.; Holthoff, H.P.; Assinger, A.; Hackl, M. Comprehensive Characterization of Platelet-Enriched MicroRNAs as Biomarkers of Platelet Activation. Cells 2022, 11, 1254. [Google Scholar] [CrossRef] [Scilit] [PubMed]
- Gámez-Valero, A.; Campdelacreu, J.; Vilas, D.; Ispierto, L.; Gascón-Bayarri, J.; Reñé, R.; Álvarez, R.; Armengol, M.P.; Borràs, F.E.; Beyer, K. Platelet miRNA Biosignature Discriminates between Dementia with Lewy Bodies and Alzheimer’s Disease. Biomedicines 2021, 9, 1272. [Google Scholar] [CrossRef] [Scilit] [PubMed]
- Arnaldo, L.; Mena, J.; Serradell, M.; Gaig, C.; Adamuz, D.; Vilas, D.; Samaniego, D.; Ispierto, L.; Montini, A.; Mayà, G.; et al. Platelet miRNAs as early biomarkers for progression of idiopathic REM sleep behavior disorder to a synucleinopathy. Sci. Rep. 2025, 15, 12136. [Google Scholar] [CrossRef] [Scilit] [PubMed]
- Ünal, Y.; Akbaş, D.; Özdemir, Ç.; Edgünlü, T. Dysregulated MicroRNAs in Parkinson’s Disease: Pathogenic Mechanisms and Biomarker Potential. Int. J. Mol. Sci. 2026, 27, 930. [Google Scholar] [CrossRef] [Scilit] [PubMed]
- Ollivier, V.; Syvannarath, V.; Gros, A.; Butt, A.; Loyau, S.; Jandrot-Perrus, M.; Ho-Tin-Noé, B. Collagen can selectively trigger a platelet secretory phenotype via glycoprotein VI. PLoS ONE 2014, 9, e104712. [Google Scholar] [CrossRef] [Scilit] [PubMed]
- Jiang, P.; Loyau, S.; Tchitchinadze, M.; Ropers, J.; Jondeau, G.; Jandrot-Perrus, M. Inhibition of Glycoprotein VI Clustering by Collagen as a Mechanism of Inhibiting Collagen-Induced Platelet Responses: The Example of Losartan. PLoS ONE 2015, 10, e0128744. [Google Scholar] [CrossRef] [Scilit] [PubMed]
- Ambrose, A.R.; Alsahli, M.A.; Kurmani, S.A.; Goodall, A.H. Comparison of the release of microRNAs and extracellular vesicles from platelets in response to different agonists. Platelets 2018, 29, 446–454. [Google Scholar] [CrossRef] [Scilit] [PubMed]
- Jakimovski, D.; Bittner, S.; Zivadinov, R.; Morrow, S.A.; Benedict, R.H.; Zipp, F.; Weinstock-Guttman, B. Multiple sclerosis. Lancet 2024, 403, 183–202. [Google Scholar] [CrossRef] [Scilit] [PubMed]
- Van der Auwera, S.; Ameling, S.; Wiechert, A.; Friedrich, N.; Nauck, M.; Völzke, H.; Bröker, B.M.; Grabe, H.J.; Völker, U. Circulating miRNAs and inflammatory markers—Associations between miRNAs and cytokine levels point to miRNA-mediated sCD40L release from platelets. Cytokine 2025, 194, 157012. [Google Scholar] [CrossRef] [Scilit] [PubMed]
- Najdaghi, S.; Davani, D.N.; Fouladseresht, H.; Ebrahimi, N.; Sullman, M.J.M.; Moradi, M.; Eskandari, N. The Role of Extracellular Vesicles and Microparticles in Central Nervous System Disorders: Mechanisms, Biomarkers, and Therapeutic Potential. Cell Mol. Neurobiol. 2024, 44, 82. [Google Scholar] [CrossRef] [Scilit] [PubMed]
- Sinauridze, E.I.; Kireev, D.A.; Popenko, N.Y.; Pichugin, A.V.; Panteleev, M.A.; Krymskaya, O.V.; Ataullakhanov, F.I. Platelet microparticle membranes have 50- to 100-fold higher specific procoagulant activity than activated platelets. Thromb. Haemost. 2007, 97, 425–434. [Google Scholar] [CrossRef] [Scilit]
- Reddy, E.C.; Rand, M.L. Procoagulant Phosphatidylserine-Exposing Platelets in vitro and in vivo. Front. Cardiovasc. Med. 2020, 7, 15. [Google Scholar] [CrossRef] [Scilit] [PubMed]
- Espinosa-Parrilla, Y.; Gonzalez-Billault, C.; Fuentes, E.; Palomo, I.; Alarcón, M. Decoding the Role of Platelets and Related MicroRNAs in Aging and Neurodegenerative Disorders. Front. Aging Neurosci. 2019, 11, 151. [Google Scholar] [CrossRef] [Scilit] [PubMed]
- Cho, K.J.; Song, J.; Oh, Y.; Lee, J.E. MicroRNA-Let-7a regulates the function of microglia in inflammation. Mol. Cell Neurosci. 2015, 68, 167–176. [Google Scholar] [CrossRef] [Scilit] [PubMed]
- Angelou, C.C.; Wells, A.C.; Vijayaraghavan, J.; Dougan, C.E.; Lawlor, R.; Iverson, E.; Lazarevic, V.; Kimura, M.Y.; Peyton, S.R.; Minter, L.M.; et al. Differentiation of Pathogenic Th17 Cells Is Negatively Regulated by Let-7 MicroRNAs in a Mouse Model of Multiple Sclerosis. Front. Immunol. 2019, 10, 3125. [Google Scholar] [CrossRef] [Scilit] [PubMed]
- Kimura, K.; Hohjoh, H.; Fukuoka, M.; Sato, W.; Oki, S.; Tomi, C.; Yamaguchi, H.; Kondo, T.; Takahashi, R.; Yamamura, T. Circulating exosomes suppress the induction of regulatory T cells via let-7i in multiple sclerosis. Nat. Commun. 2018, 9, 17. [Google Scholar] [CrossRef] [Scilit] [PubMed]
- Teekaput, C.; Thiankhaw, K.; Tanprawate, S.; Apaijai, N.; Suparan, K.; Kumfu, S.; Chattipakorn, N.; Chattipakorn, S.C. Alterations in the Expression of Let-7i, miR-21-5p, and miR-30b-5p in Plasma-Derived Extracellular Vesicles as the Possible Prognostic Markers in Central Demyelinating Diseases. Mol. Neurobiol. 2025, 63, 267. [Google Scholar] [CrossRef] [Scilit] [PubMed]
- Yang, Y.; Liu, Y.; Li, Y.; Chen, Z.; Xiong, Y.; Zhou, T.; Tao, W.; Xu, F.; Yang, H.; Ylä-Herttuala, S.; et al. MicroRNA-15b Targets VEGF and Inhibits Angiogenesis in Proliferative Diabetic Retinopathy. J. Clin. Endocrinol. Metab. 2020, 105, 3404–3415. [Google Scholar] [CrossRef] [Scilit] [PubMed]
- Sun, Y.; Gao, Y.; Song, T.; Yu, C.; Nie, Z.; Wang, X. MicroRNA-15b participates in the development of peripheral arterial disease by modulating the growth of vascular smooth muscle cells. Exp. Ther. Med. 2019, 18, 77–84. [Google Scholar] [CrossRef] [Scilit] [PubMed]
- Kim, S.; Kang, H. miR-15b induced by platelet-derived growth factor signaling is required for vascular smooth muscle cell proliferation. BMB Rep. 2013, 46, 550–554. [Google Scholar] [CrossRef] [Scilit] [PubMed]
- Di Tolla, M.F.; Romano, S.; Vassetti, P.; Perugini, D.; Filoso, I.; Cabaro, S.; Ferraro, G.; Oriente, F.; Perruolo, G.; Arvonio, F.; et al. Platelet-Derived Growth Factor as Biomarker of Clinical Outcome for Autologous Platelet Concentrate Therapy in Grade I Knee Osteoarthritis. Biologics 2025, 19, 137–147. [Google Scholar] [CrossRef] [Scilit] [PubMed]
- Göb, V.; Zimmermann, L.; Hemmen, K.; Haarmann, A.; Heinze, K.G.; Schuhmann, M.K.; Stegner, D. Platelet-Derived PDGF-A Disrupts Blood-Brain Barrier Integrity in Ischemic Stroke-Brief Report. Arterioscler. Thromb. Vasc. Biol. 2025, 45, 1166–1174. [Google Scholar] [CrossRef] [Scilit] [PubMed]
- Fa, J.; Chen, Y.; Pan, W.; Zhang, J.; Cheng, W.; Da, X.; Zhao, Y.; Chen, L.; Ma, H.; Huang, J.; et al. Polymeric anti-platelet carriers for the precision-targeting of age-related cardiovascular and cerebrovascular diseases. Mater. Today Bio 2026, 37, 102920. [Google Scholar] [CrossRef] [Scilit] [PubMed]
- Wang, S.; Aurora, A.B.; Johnson, B.A.; Qi, X.; McAnally, J.; Hill, J.A.; Richardson, J.A.; Bassel-Duby, R.; Olson, E.N. The endothelial-specific microRNA miR-126 governs vascular integrity and angiogenesis. Dev. Cell 2008, 15, 261–271. [Google Scholar] [CrossRef] [Scilit] [PubMed]
- Bao, H.; Chen, Y.X.; Huang, K.; Zhuang, F.; Bao, M.; Han, Y.; Chen, X.H.; Shi, Q.; Yao, Q.P.; Qi, Y.X. Platelet-derived microparticles promote endothelial cell proliferation in hypertension via miR-142-3p. FASEB J. 2018, 32, 3912–3923. [Google Scholar] [CrossRef] [Scilit] [PubMed]
- Taganov, K.D.; Boldin, M.P.; Chang, K.J.; Baltimore, D. NF-kappaB-dependent induction of microRNA miR-146, an inhibitor targeted to signaling proteins of innate immune responses. Proc. Natl. Acad. Sci. USA 2006, 103, 12481–12486. [Google Scholar] [CrossRef] [Scilit] [PubMed]
- Shi, R.; Zhou, X.; Ji, W.J.; Zhang, Y.Y.; Ma, Y.Q.; Zhang, J.Q.; Li, Y.M. The Emerging Role of miR-223 in Platelet Reactivity: Implications in Antiplatelet Therapy. Biomed. Res. Int. 2015, 2015, 981841. [Google Scholar] [CrossRef] [Scilit] [PubMed]
- Shi, R.; Ge, L.; Zhou, X.; Ji, W.J.; Lu, R.Y.; Zhang, Y.Y.; Zeng, S.; Liu, X.; Zhao, J.H.; Zhang, W.C.; et al. Decreased platelet miR-223 expression is associated with high on-clopidogrel platelet reactivity. Thromb. Res. 2013, 131, 508–513. [Google Scholar] [CrossRef] [Scilit] [PubMed]
- Wasilewska, K.; Dziedzic, A.; Anandan, S.; Miller, E.; Łaczmański, Ł.; Zajdel, R.; Michlewska, S.; Kujawa, D.; Gancarek, M.; Raczkowska, J.; et al. Extracellular vesicle-derived miR-760 as a novel promising candidate biomarker differentiating stable RRMS from SPMS. Sci. Rep. 2026, 16, 5208. [Google Scholar] [CrossRef] [Scilit] [PubMed]
- Sol, N.; Leurs, C.E.; Veld, S.G.I.; Strijbis, E.M.; Vancura, A.; Schweiger, M.W.; Teunissen, C.E.; Mateen, F.J.; Tannous, B.A.; Best, M.G.; et al. Blood platelet RNA enables the detection of multiple sclerosis. Mult. Scler. J. Exp. Transl. Clin. 2020, 6, 2055217320946784. [Google Scholar] [CrossRef] [Scilit] [PubMed]
- Eftekharian, M.M.; Komaki, A.; Mazdeh, M.; Arsang-Jang, S.; Taheri, M.; Ghafouri-Fard, S. Expression Profile of Selected MicroRNAs in the Peripheral Blood of Multiple Sclerosis Patients: A Multivariate Statistical Analysis with ROC Curve to Find New Biomarkers for Fingolimod. J. Mol. Neurosci. 2019, 68, 153–161. [Google Scholar] [CrossRef] [Scilit] [PubMed]
- Wessler, B.S.; Nelson, J.; Park, J.G.; McGinnes, H.; Gulati, G.; Brazil, R.; Van Calster, B.; van Klaveren, D.; Venema, E.; Steyerberg, E.; et al. External Validations of Cardiovascular Clinical Prediction Models: A Large-Scale Review of the Literature. Circ. Cardiovasc. Qual. Outcomes 2021, 14, e007858. [Google Scholar] [CrossRef] [Scilit] [PubMed]
- Castaldi, P.J.; Dahabreh, I.J.; Ioannidis, J.P. An empirical assessment of validation practices for molecular classifiers. Brief. Bioinform. 2011, 12, 189–202. [Google Scholar] [CrossRef] [Scilit] [PubMed]
- Peduzzi, P.; Concato, J.; Kemper, E.; Holford, T.R.; Feinstein, A.R. A simulation study of the number of events per variable in logistic regression analysis. J. Clin. Epidemiol. 1996, 49, 1373–1379. [Google Scholar] [CrossRef] [Scilit] [PubMed]
- van Smeden, M.; Moons, K.G.; de Groot, J.A.; Collins, G.S.; Altman, D.G.; Eijkemans, M.J.; Reitsma, J.B. Sample size for binary logistic prediction models: Beyond events per variable criteria. Stat. Methods Med. Res. 2019, 28, 2455–2474. [Google Scholar] [CrossRef] [Scilit] [PubMed]
- Höhn, A.; Tramutola, A.; Cascella, R. Proteostasis Failure in Neurodegenerative Diseases: Focus on Oxidative Stress. Oxid. Med. Cell Longev. 2020, 2020, 5497046. [Google Scholar] [CrossRef] [Scilit] [PubMed]
- Yang, H.M. Mitochondrial Dysfunction in Neurodegenerative Diseases. Cells 2025, 14, 276. [Google Scholar] [CrossRef] [Scilit] [PubMed]
- Holland, S.; Scholich, K. Regulation of neuronal functions by the E3-ubiquitinligase protein associated with MYC (MYCBP2). Commun. Integr. Biol. 2011, 4, 513–515. [Google Scholar] [CrossRef] [Scilit] [PubMed]
- Kim, S.G.; Lee, S.; Kim, Y.; Park, J.; Woo, D.; Kim, D.; Li, Y.; Shin, W.; Kang, H.; Yook, C.; et al. Tanc2-mediated mTOR inhibition balances mTORC1/2 signaling in the developing mouse brain and human neurons. Nat. Commun. 2021, 12, 2695, Correction in Nat Commun. 2022, 13, 6544. https://doi.org/10.1038/s41467-022-33972-9. [Google Scholar] [CrossRef] [Scilit] [PubMed]
- Maghbooli, Z.; Sayahpour, F.A.; Varzandi, T.; Masoumi, M.R.; Sahraian, M.A. The interplay between endoplasmic reticulum stress and inflammation in multiple sclerosis. Sci. Rep. 2025, 15, 22916. [Google Scholar] [CrossRef] [Scilit] [PubMed]
- Kataria, H.; Hart, C.G.; Alizadeh, A.; Cossoy, M.; Kaushik, D.K.; Bernstein, C.N.; Marrie, R.A.; Yong, V.W.; Karimi-Abdolrezaee, S. Neuregulin-1 beta 1 is implicated in pathogenesis of multiple sclerosis. Brain 2021, 144, 162–185. [Google Scholar] [CrossRef] [Scilit] [PubMed]
- Meyers, E.A.; Kessler, J.A. TGF-β Family Signaling in Neural and Neuronal Differentiation, Development, and Function. Cold Spring Harb. Perspect. Biol. 2017, 9, a022244. [Google Scholar] [CrossRef] [Scilit] [PubMed]
- Güner, F.; Rothhammer, V. Neurotrophic factors in multiple sclerosis. Front. Immunol. 2025, 16, 1654603. [Google Scholar] [CrossRef] [Scilit] [PubMed]
- Ebner, S.; Dunbar, M.; McKinnon, R.D. Distinct roles for PI3K in proliferation and survival of oligodendrocyte progenitor cells. J. Neurosci. Res. 2000, 62, 336–345. [Google Scholar] [CrossRef] [PubMed]
- Guevara, C.; Vicencio, S.C.; Pizarro, I.S.; Villavicencio-Tejo, F.; Quintanilla, R.A.; Astudillo, P.; Ampuero, E.; Varas, R.; Orellana, J.A.; Ortiz, F.C. Evidence for TGF-β1/Nrf2 Signaling Crosstalk in a Cuprizone Model of Multiple Sclerosis. Antioxidants 2024, 13, 914. [Google Scholar] [CrossRef] [Scilit] [PubMed]
- Narine, M.; Azmi, M.A.; Umali, M.; Volz, A.; Colognato, H. The AMPK activator metformin improves recovery from demyelination by shifting oligodendrocyte bioenergetics and accelerating OPC differentiation. Front. Cell Neurosci. 2023, 17, 1254303. [Google Scholar] [CrossRef] [Scilit] [PubMed]
- Namgyal, D.; Lim, C.S. Circadian Rhythm Dysfunction in Neurodegenerative Diseases: A Bidirectional Perspective and Therapeutic Potential. Nat. Sci. Sleep. 2025, 17, 2969–2989. [Google Scholar] [CrossRef] [Scilit] [PubMed]
- Mikheeva, E.V.; Aulova, K.S.; Nevinsky, G.A.; Timofeeva, A.M. In Silico Analysis of MiRNA Regulatory Networks to Identify Potential Biomarkers for the Clinical Course of Viral Infections. Int. J. Mol. Sci. 2025, 26, 10100. [Google Scholar] [CrossRef] [Scilit] [PubMed]
- Szelenberger, R.; Karbownik, M.S.; Kacprzak, M.; Synowiec, E.; Michlewska, S.; Bijak, M.; Zielińska, M.; Olender, A.; Saluk-Bijak, J. Dysregulation in the Expression of Platelet Surface Receptors in Acute Coronary Syndrome Patients—Emphasis on P2Y12. Biology 2022, 11, 644. [Google Scholar] [CrossRef] [Scilit] [PubMed]
- Maués, J.H.; Moreira-Nunes, C.D.; Burbano, R.M. Computational Identification and Characterization of New microRNAs in Human Platelets Stored in a Blood Bank. Biomolecules 2020, 10, 1173. [Google Scholar] [CrossRef] [Scilit] [PubMed]
- Lublin, F.D.; Reingold, S.C.; Cohen, J.A.; Cutter, G.R.; Sørensen, P.S.; Thompson, A.J.; Wolinsky, J.S.; Balcer, L.J.; Banwell, B.; Barkhof, F.; et al. Defining the clinical course of multiple sclerosis: The 2013 revisions. Neurology 2014, 83, 278–286. [Google Scholar] [CrossRef] [Scilit] [PubMed]
- Nuttall, F.Q. Body Mass Index: Obesity, BMI, and Health: A Critical Review. Nutr. Today 2015, 50, 117–128. [Google Scholar] [CrossRef] [Scilit] [PubMed]
- Kurtzke, J.F. Rating neurologic impairment in multiple sclerosis: An expanded disability status scale (EDSS). Neurology 1983, 33, 1444–1452. [Google Scholar] [CrossRef] [Scilit] [PubMed]
- Cadavid, D.; Cohen, J.A.; Freedman, M.S.; Goldman, M.D.; Hartung, H.P.; Havrdova, E.; Jeffery, D.; Kapoor, R.; Miller, A.; Sellebjerg, F.; et al. The EDSS-Plus, an improved endpoint for disability progression in secondary progressive multiple sclerosis. Mult. Scler. 2017, 23, 94–105. [Google Scholar] [CrossRef] [Scilit] [PubMed]
- Alanazi, A.M.; Al-Rashoud, J.R.; Aljahani, J.M.; Alotaibi, A.F.; Althubaiti, A.M.; Kojan, S.M.; Aljumah, M.A.; Abulaban, A.A. Exploring the outcome of multiple sclerosis among Saudi adult patients. A single-centered cross-sectional study at King Abdulaziz Medical City in Riyadh, Saudi Arabia. Neurosciences 2019, 24, 168–175. [Google Scholar] [CrossRef] [Scilit] [PubMed]
- Beck, A.T.; Steer, R.A.; Ball, R.; Ranieri, W. Comparison of Beck Depression Inventories -IA and -II in psychiatric outpatients. J. Pers. Assess. 1996, 67, 588–597. [Google Scholar] [CrossRef] [Scilit] [PubMed]
- Beatty, W.W.; Goodkin, D.E. Screening for cognitive impairment in multiple sclerosis. An evaluation of the Mini-Mental State Examination. Arch. Neurol. 1990, 47, 297–301. [Google Scholar] [CrossRef] [Scilit] [PubMed]
- Nasreddine, Z.S.; Phillips, N.A.; Bédirian, V.; Charbonneau, S.; Whitehead, V.; Collin, I.; Cummings, J.L.; Chertkow, H. The Montreal Cognitive Assessment, MoCA: A brief screening tool for mild cognitive impairment. J. Am. Geriatr. Soc. 2005, 53, 695–699, Corrigendum in J. Am. Geriatr. Soc. 2019, 67, 1991. https://doi.org/10.1111/jgs.15925. [Google Scholar] [CrossRef] [Scilit] [PubMed]
- Pashmdarfard, M.; Azad, A. Assessment tools to evaluate Activities of Daily Living (ADL) and Instrumental Activities of Daily Living (IADL) in older adults: A systematic review. Med. J. Islam. Repub. Iran. 2020, 34, 33. [Google Scholar] [CrossRef] [Scilit] [PubMed]
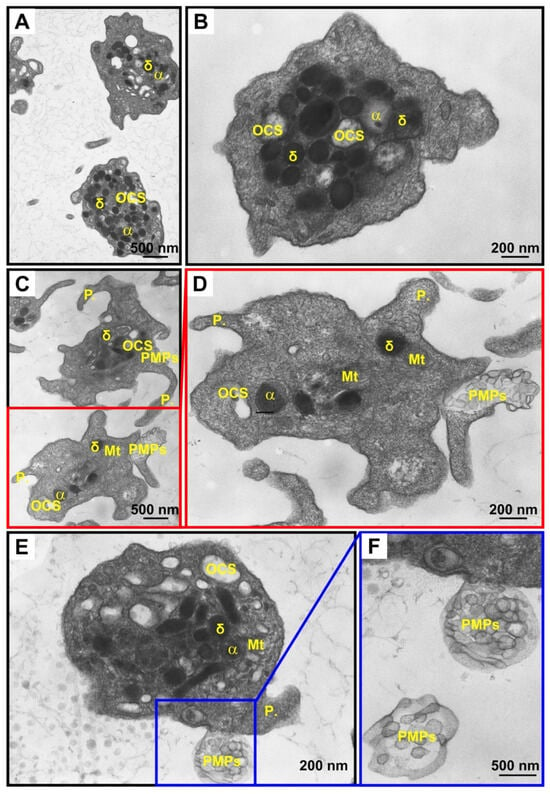
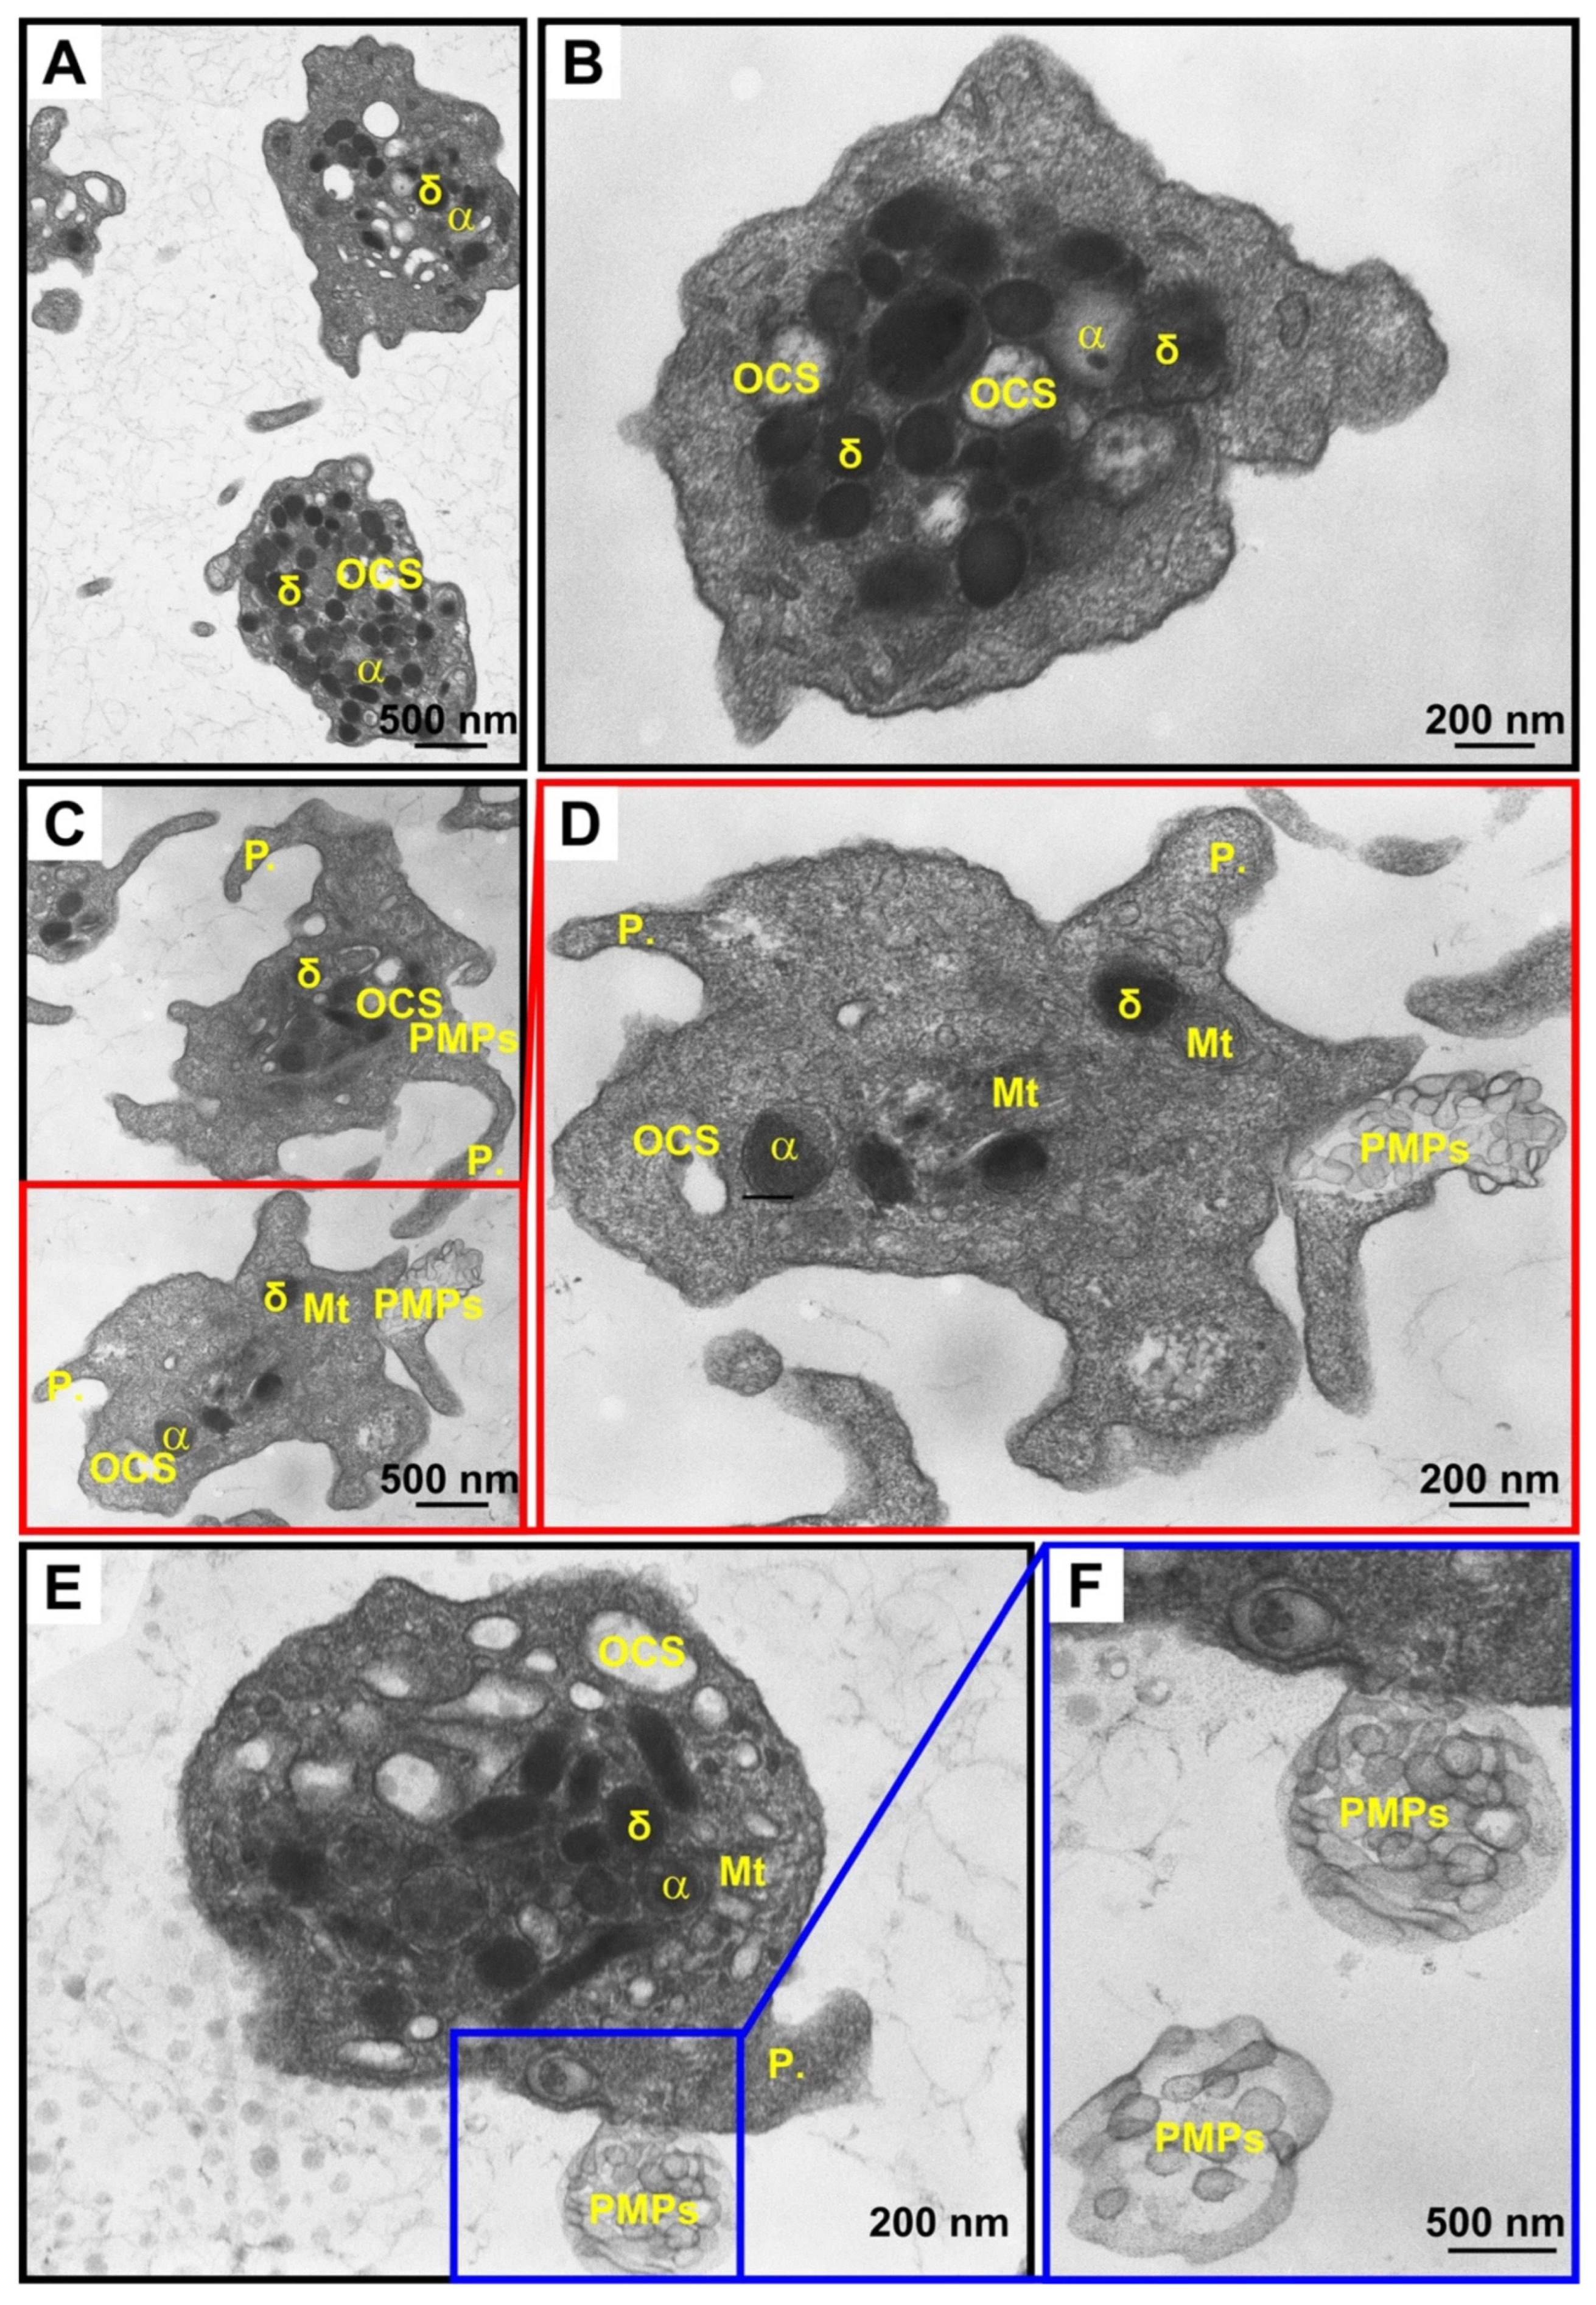
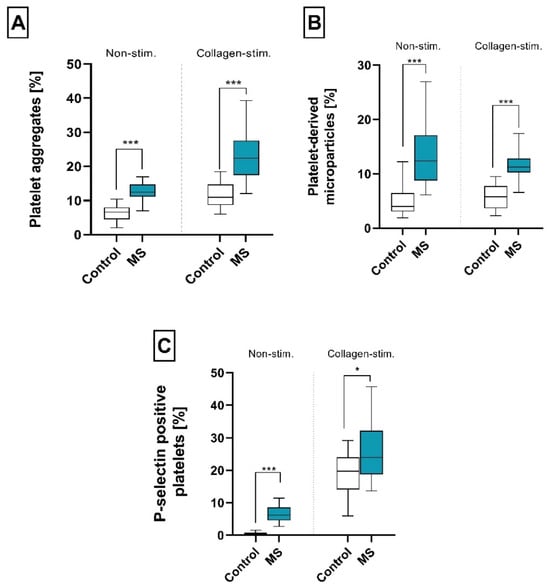
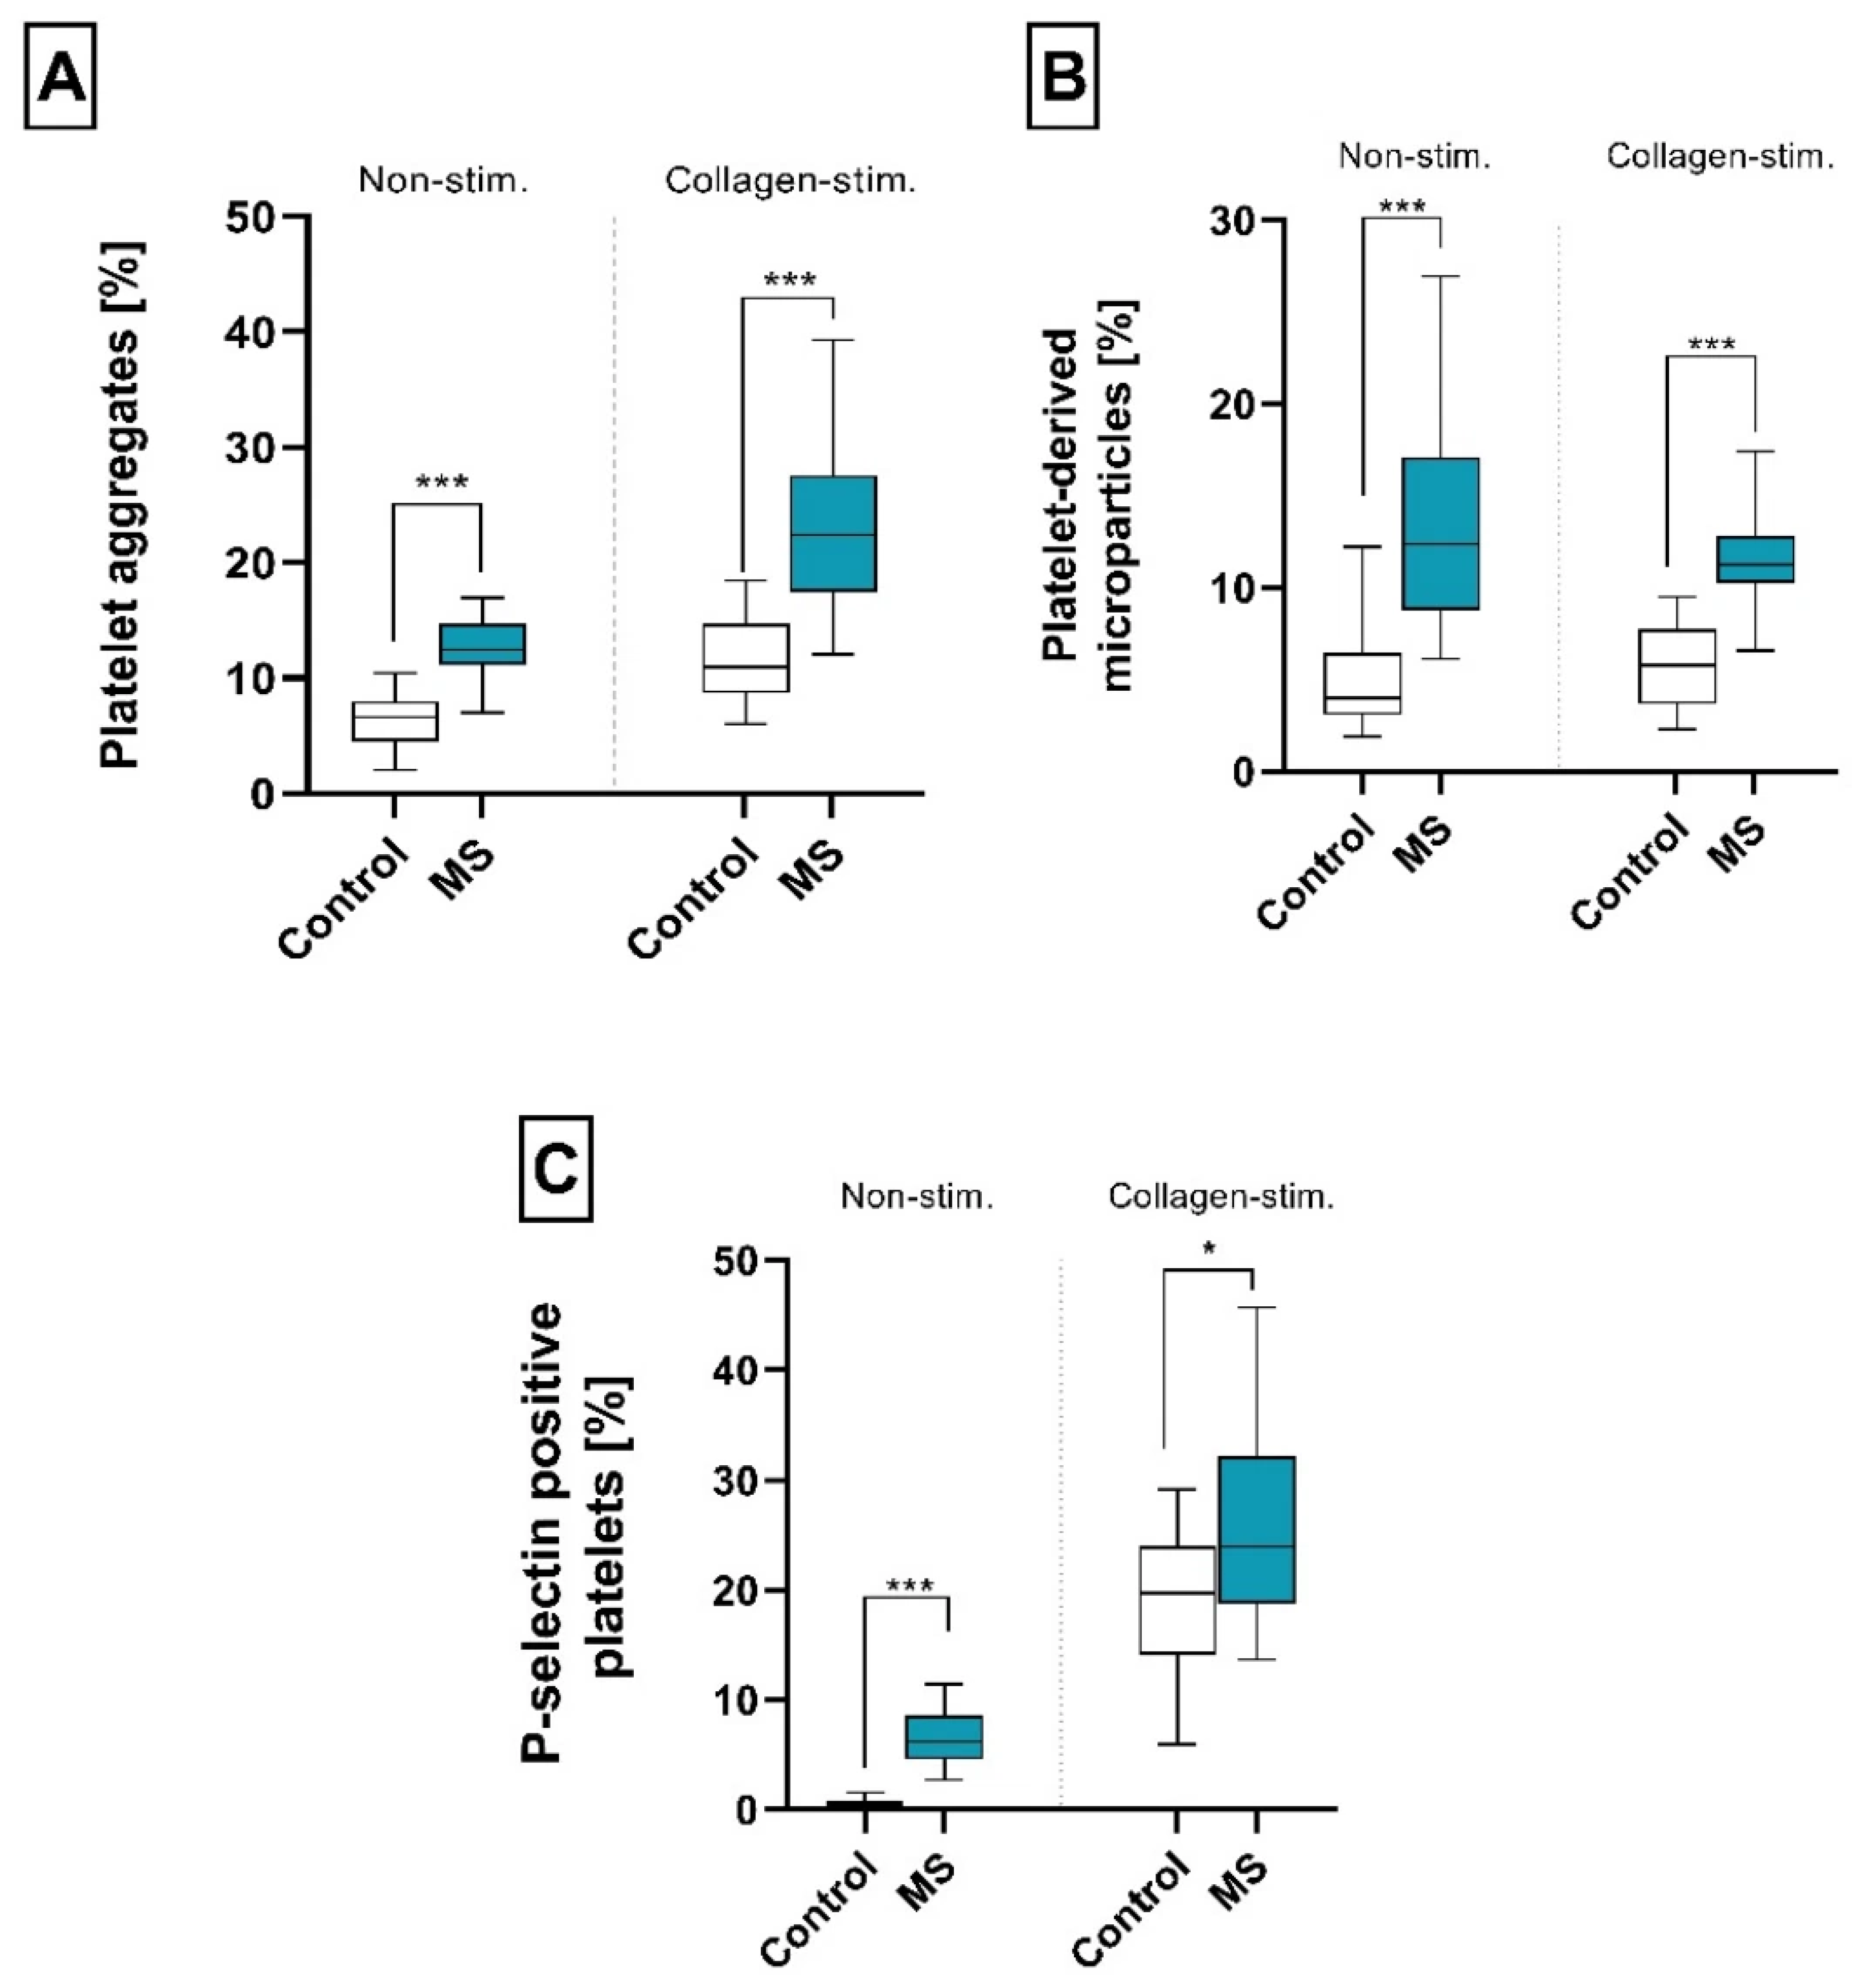
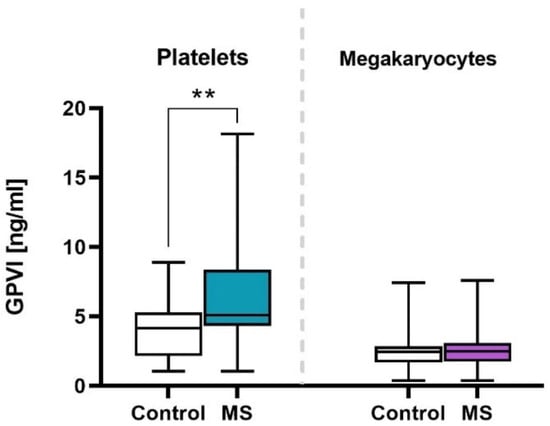
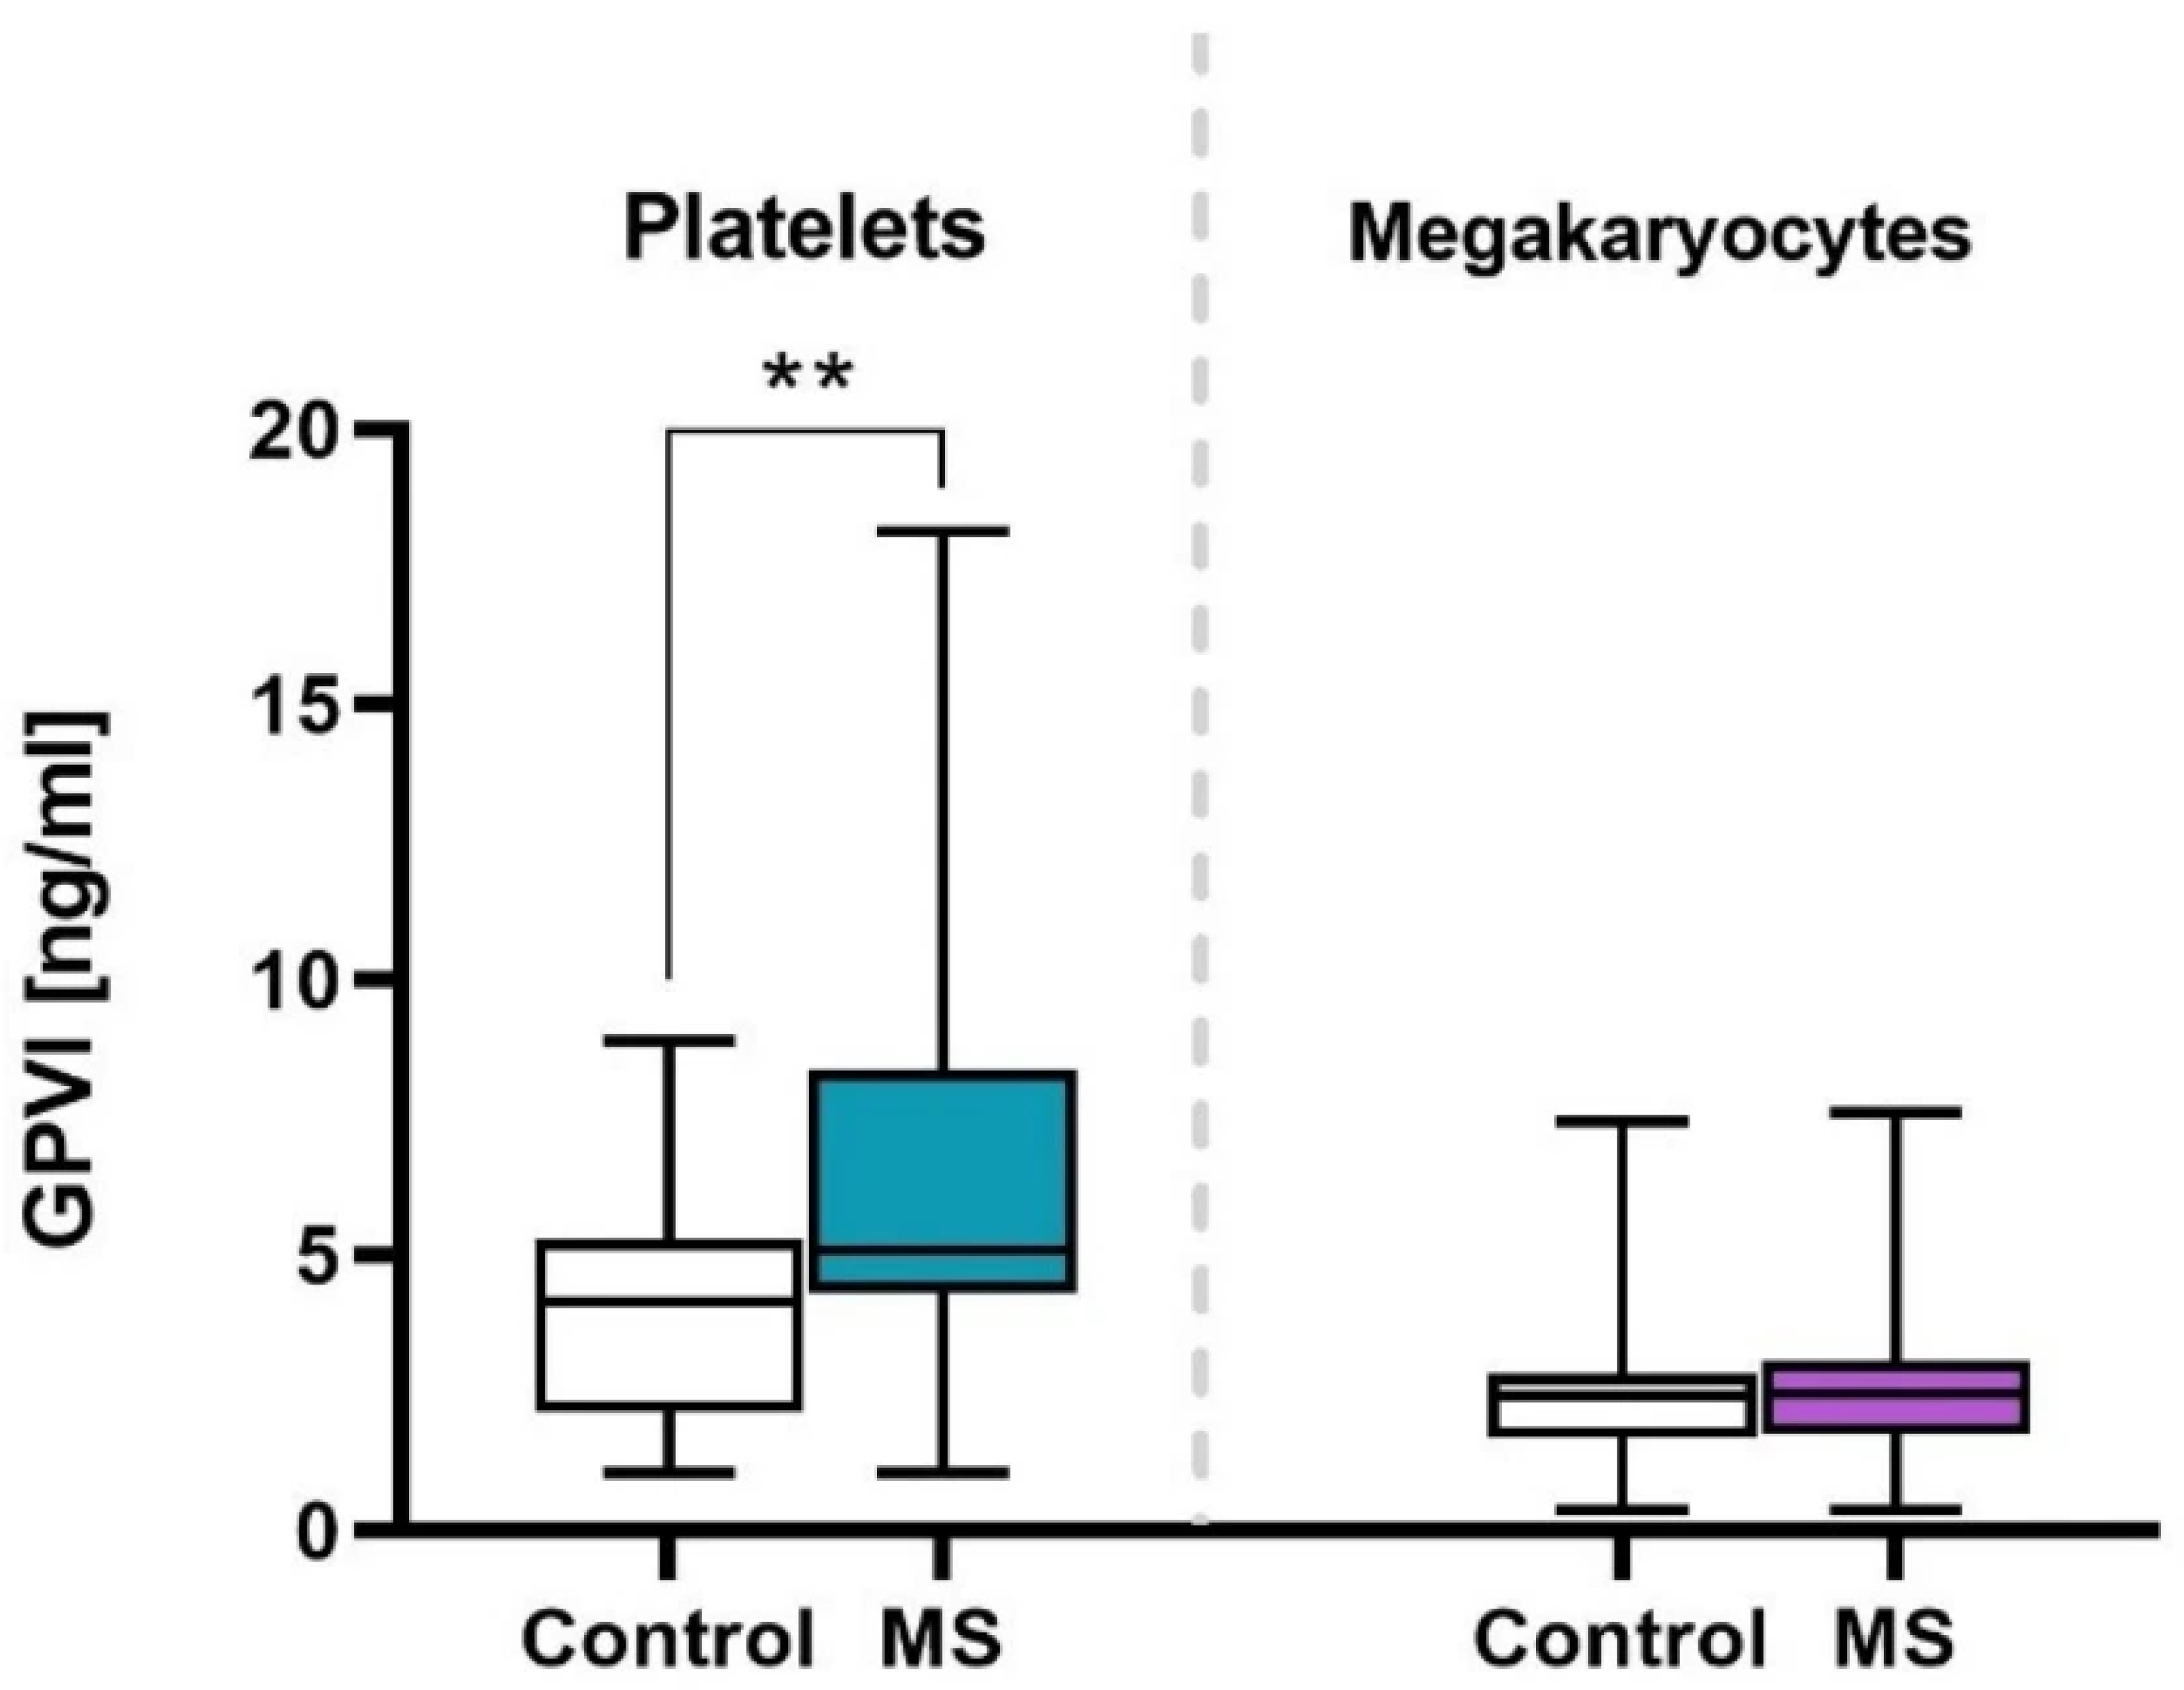
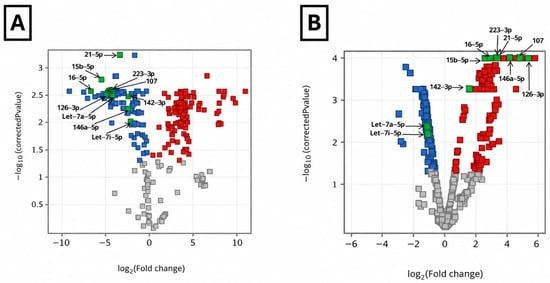
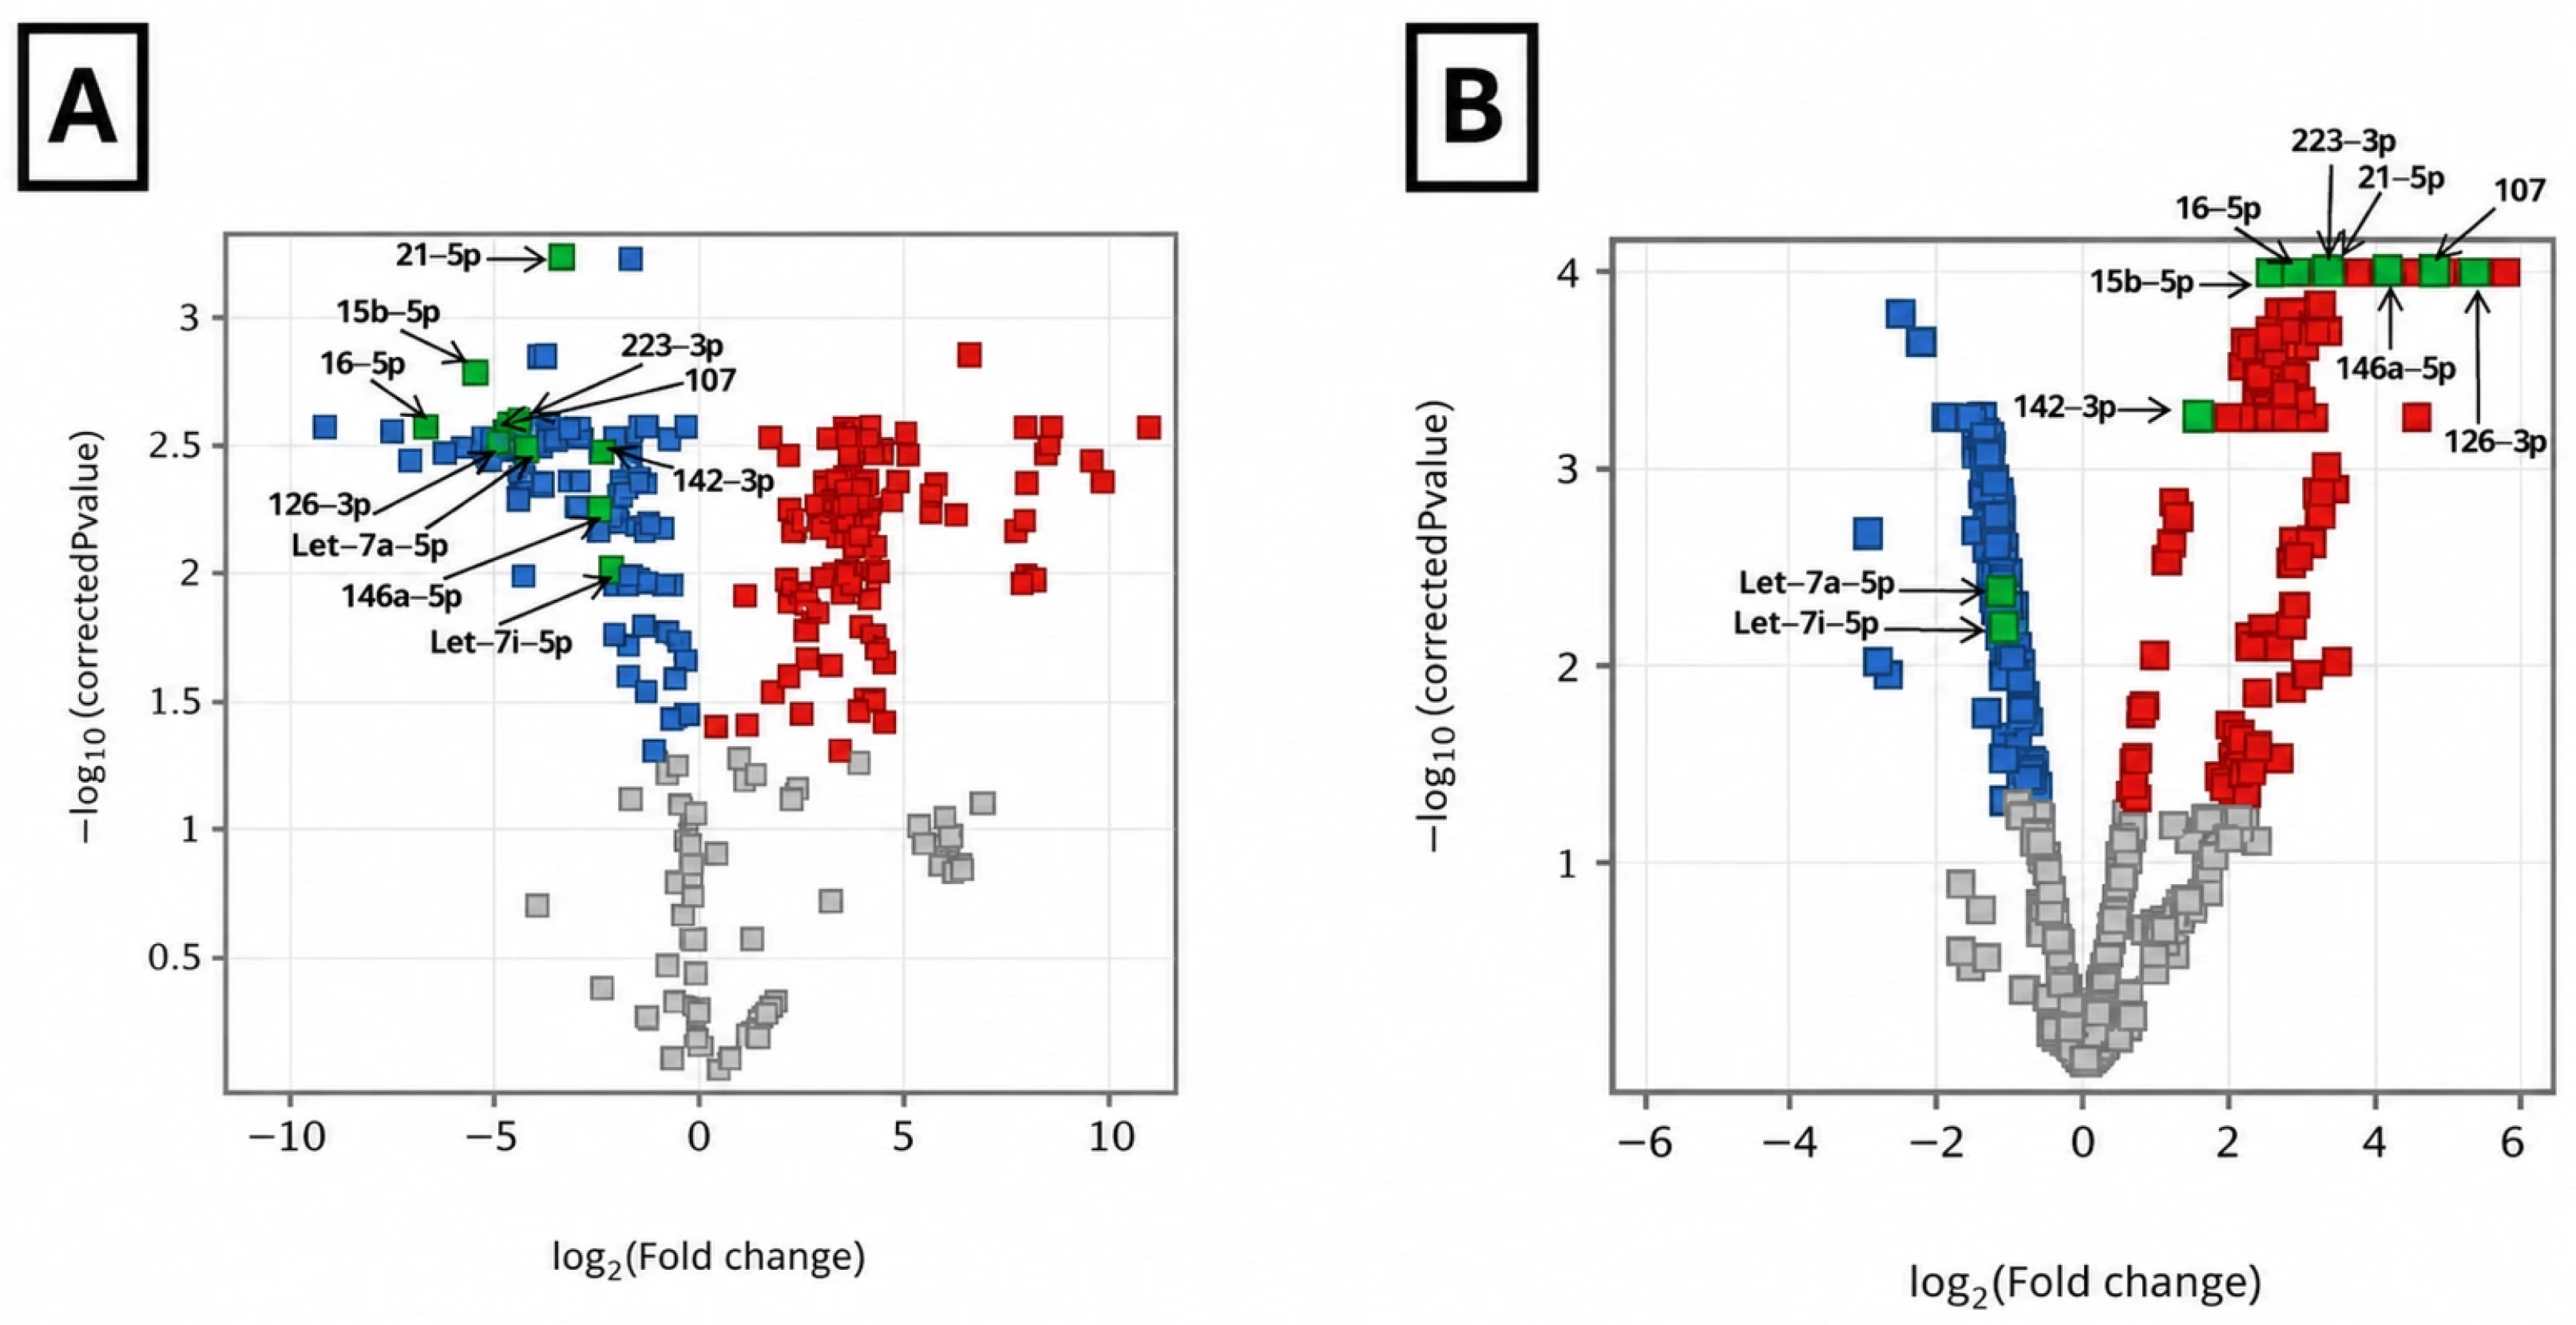
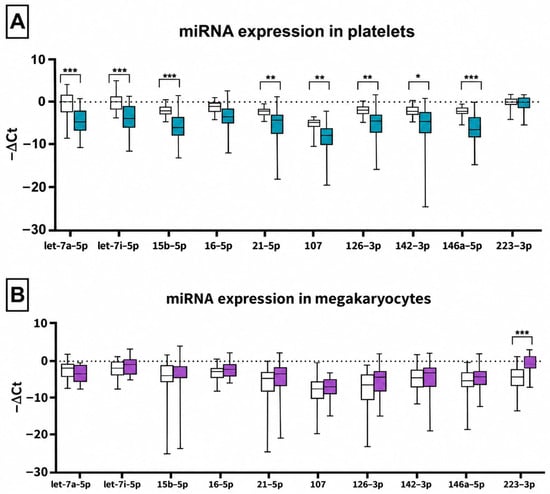
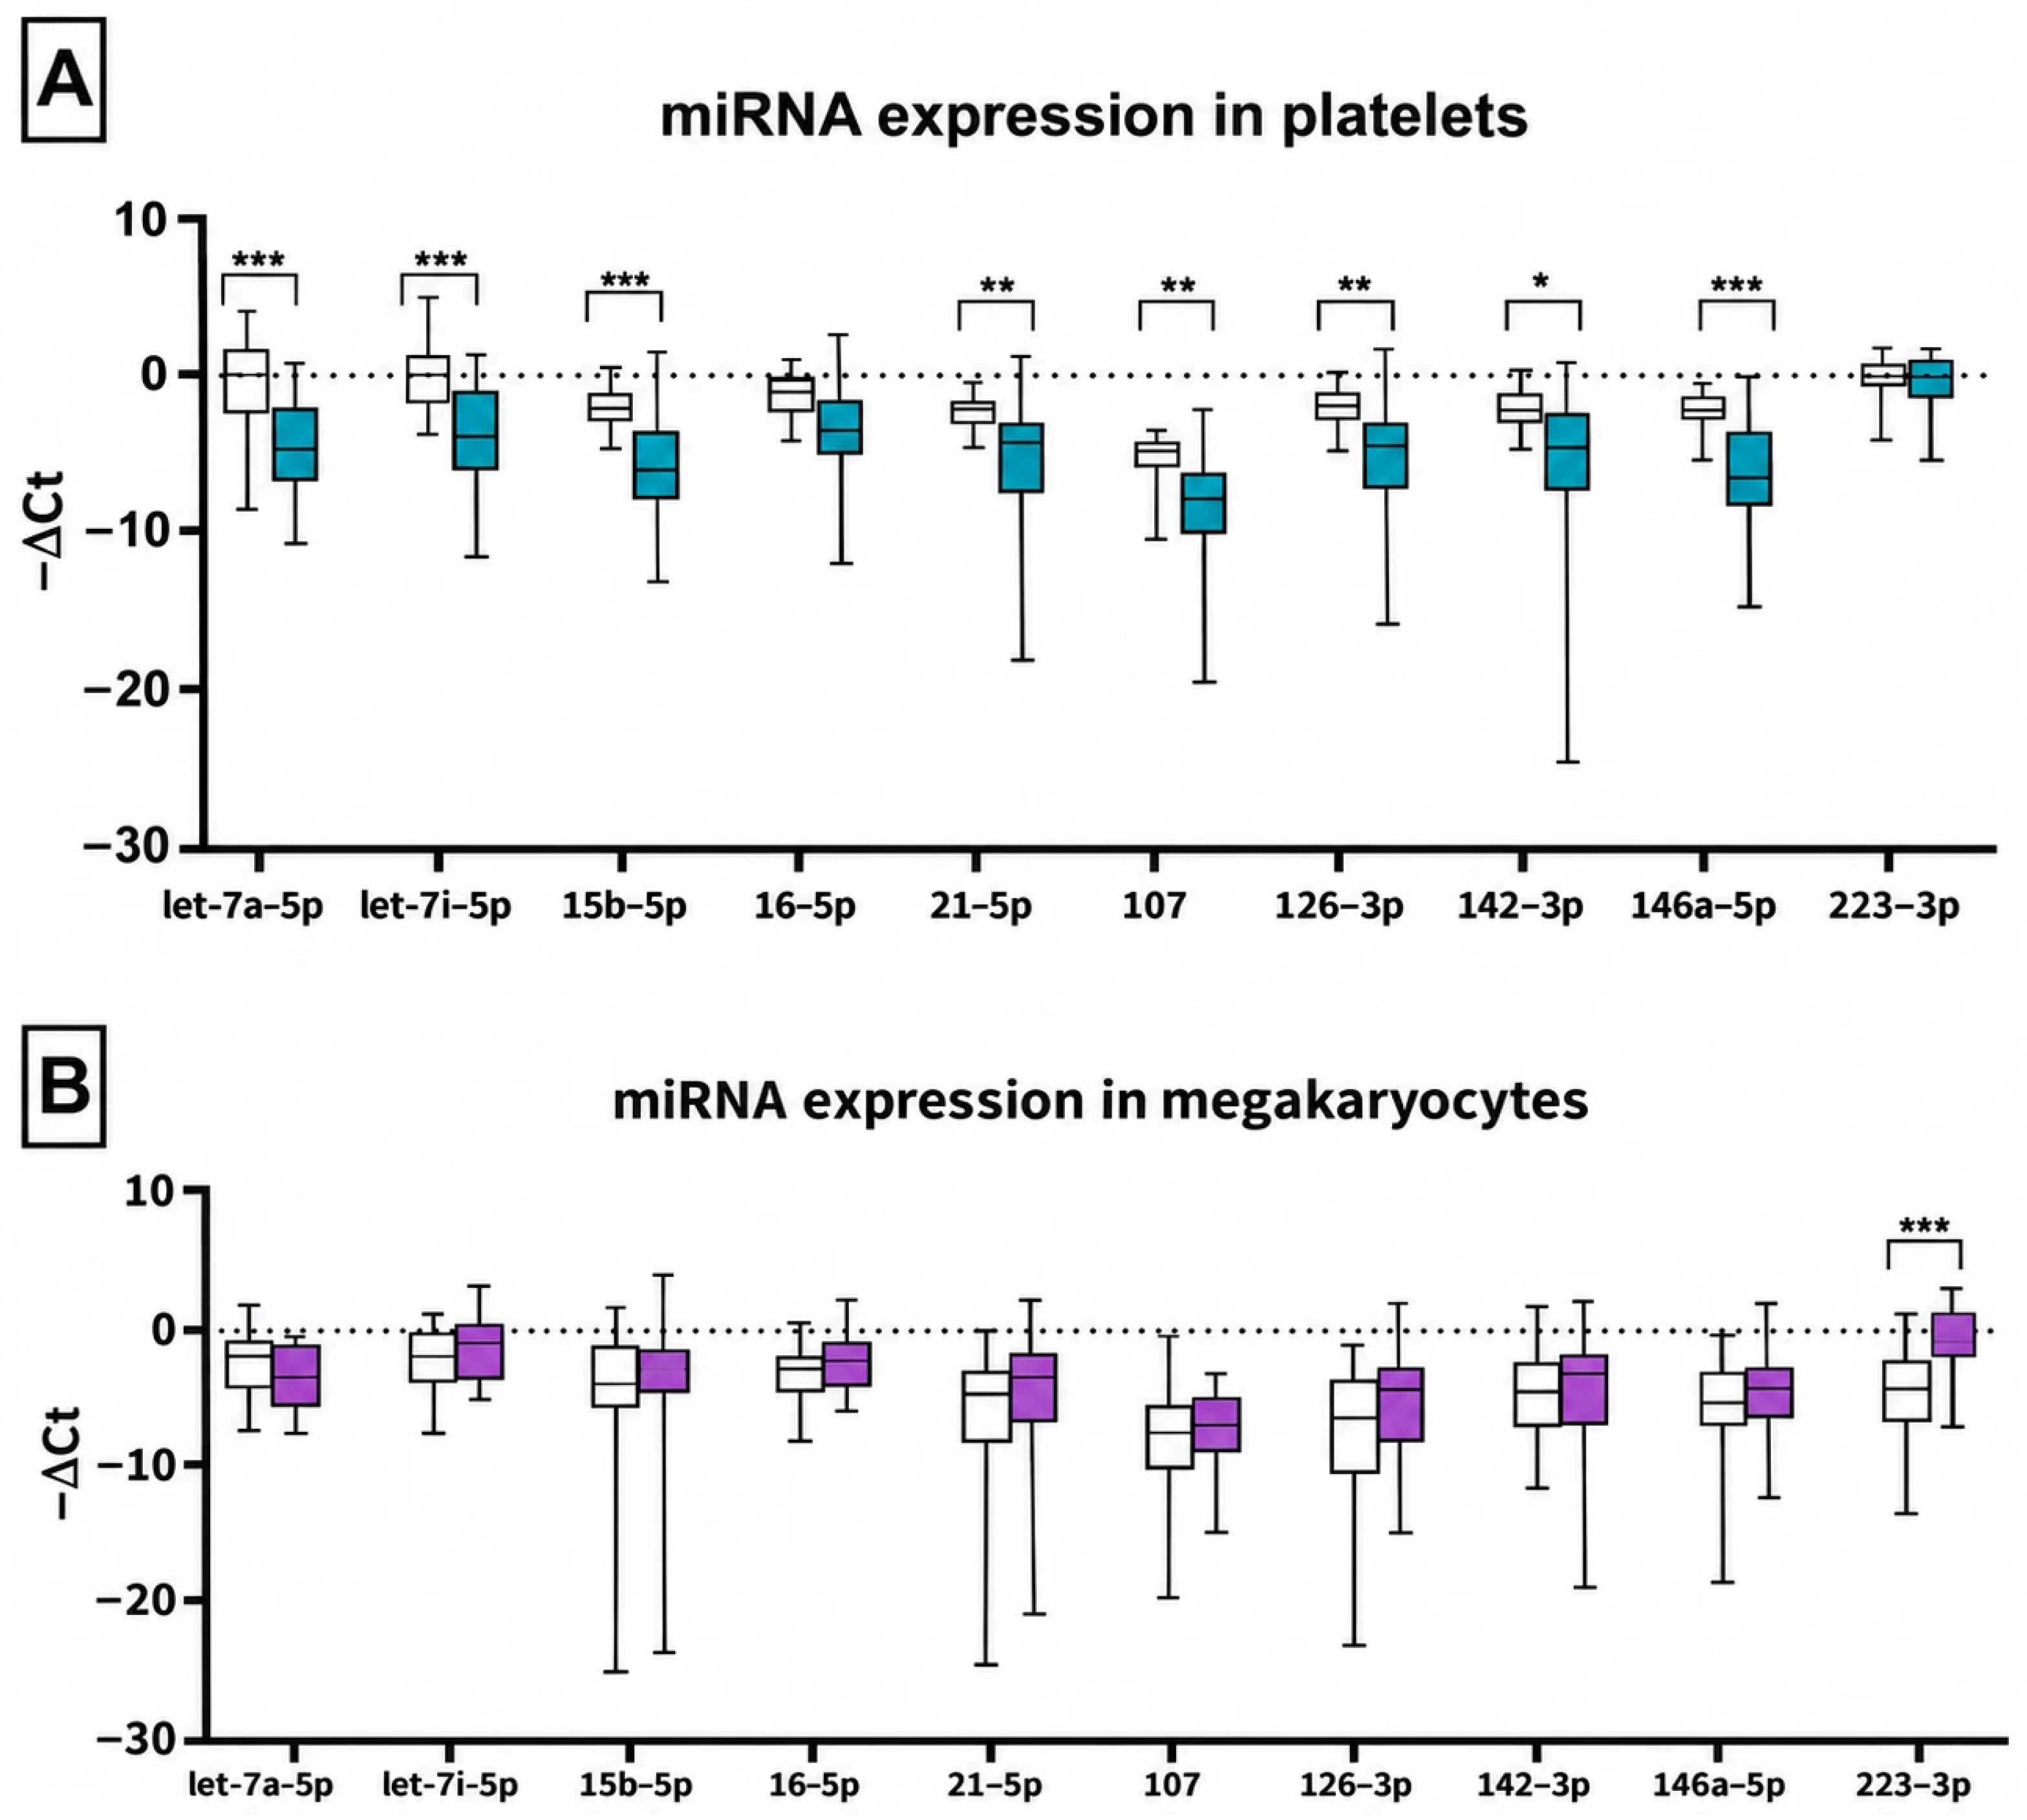
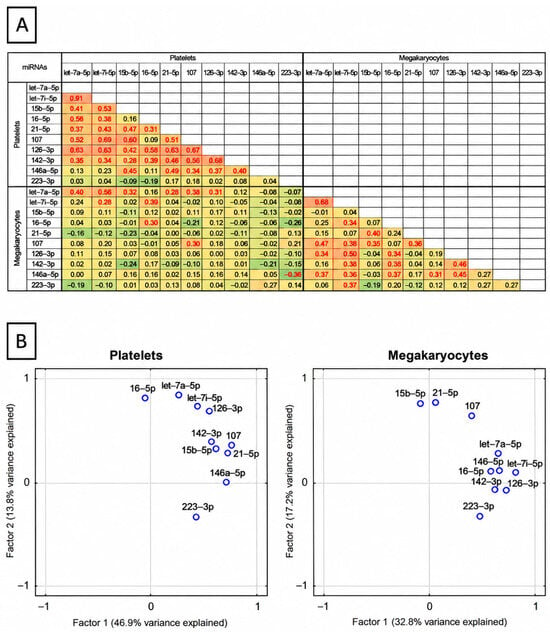
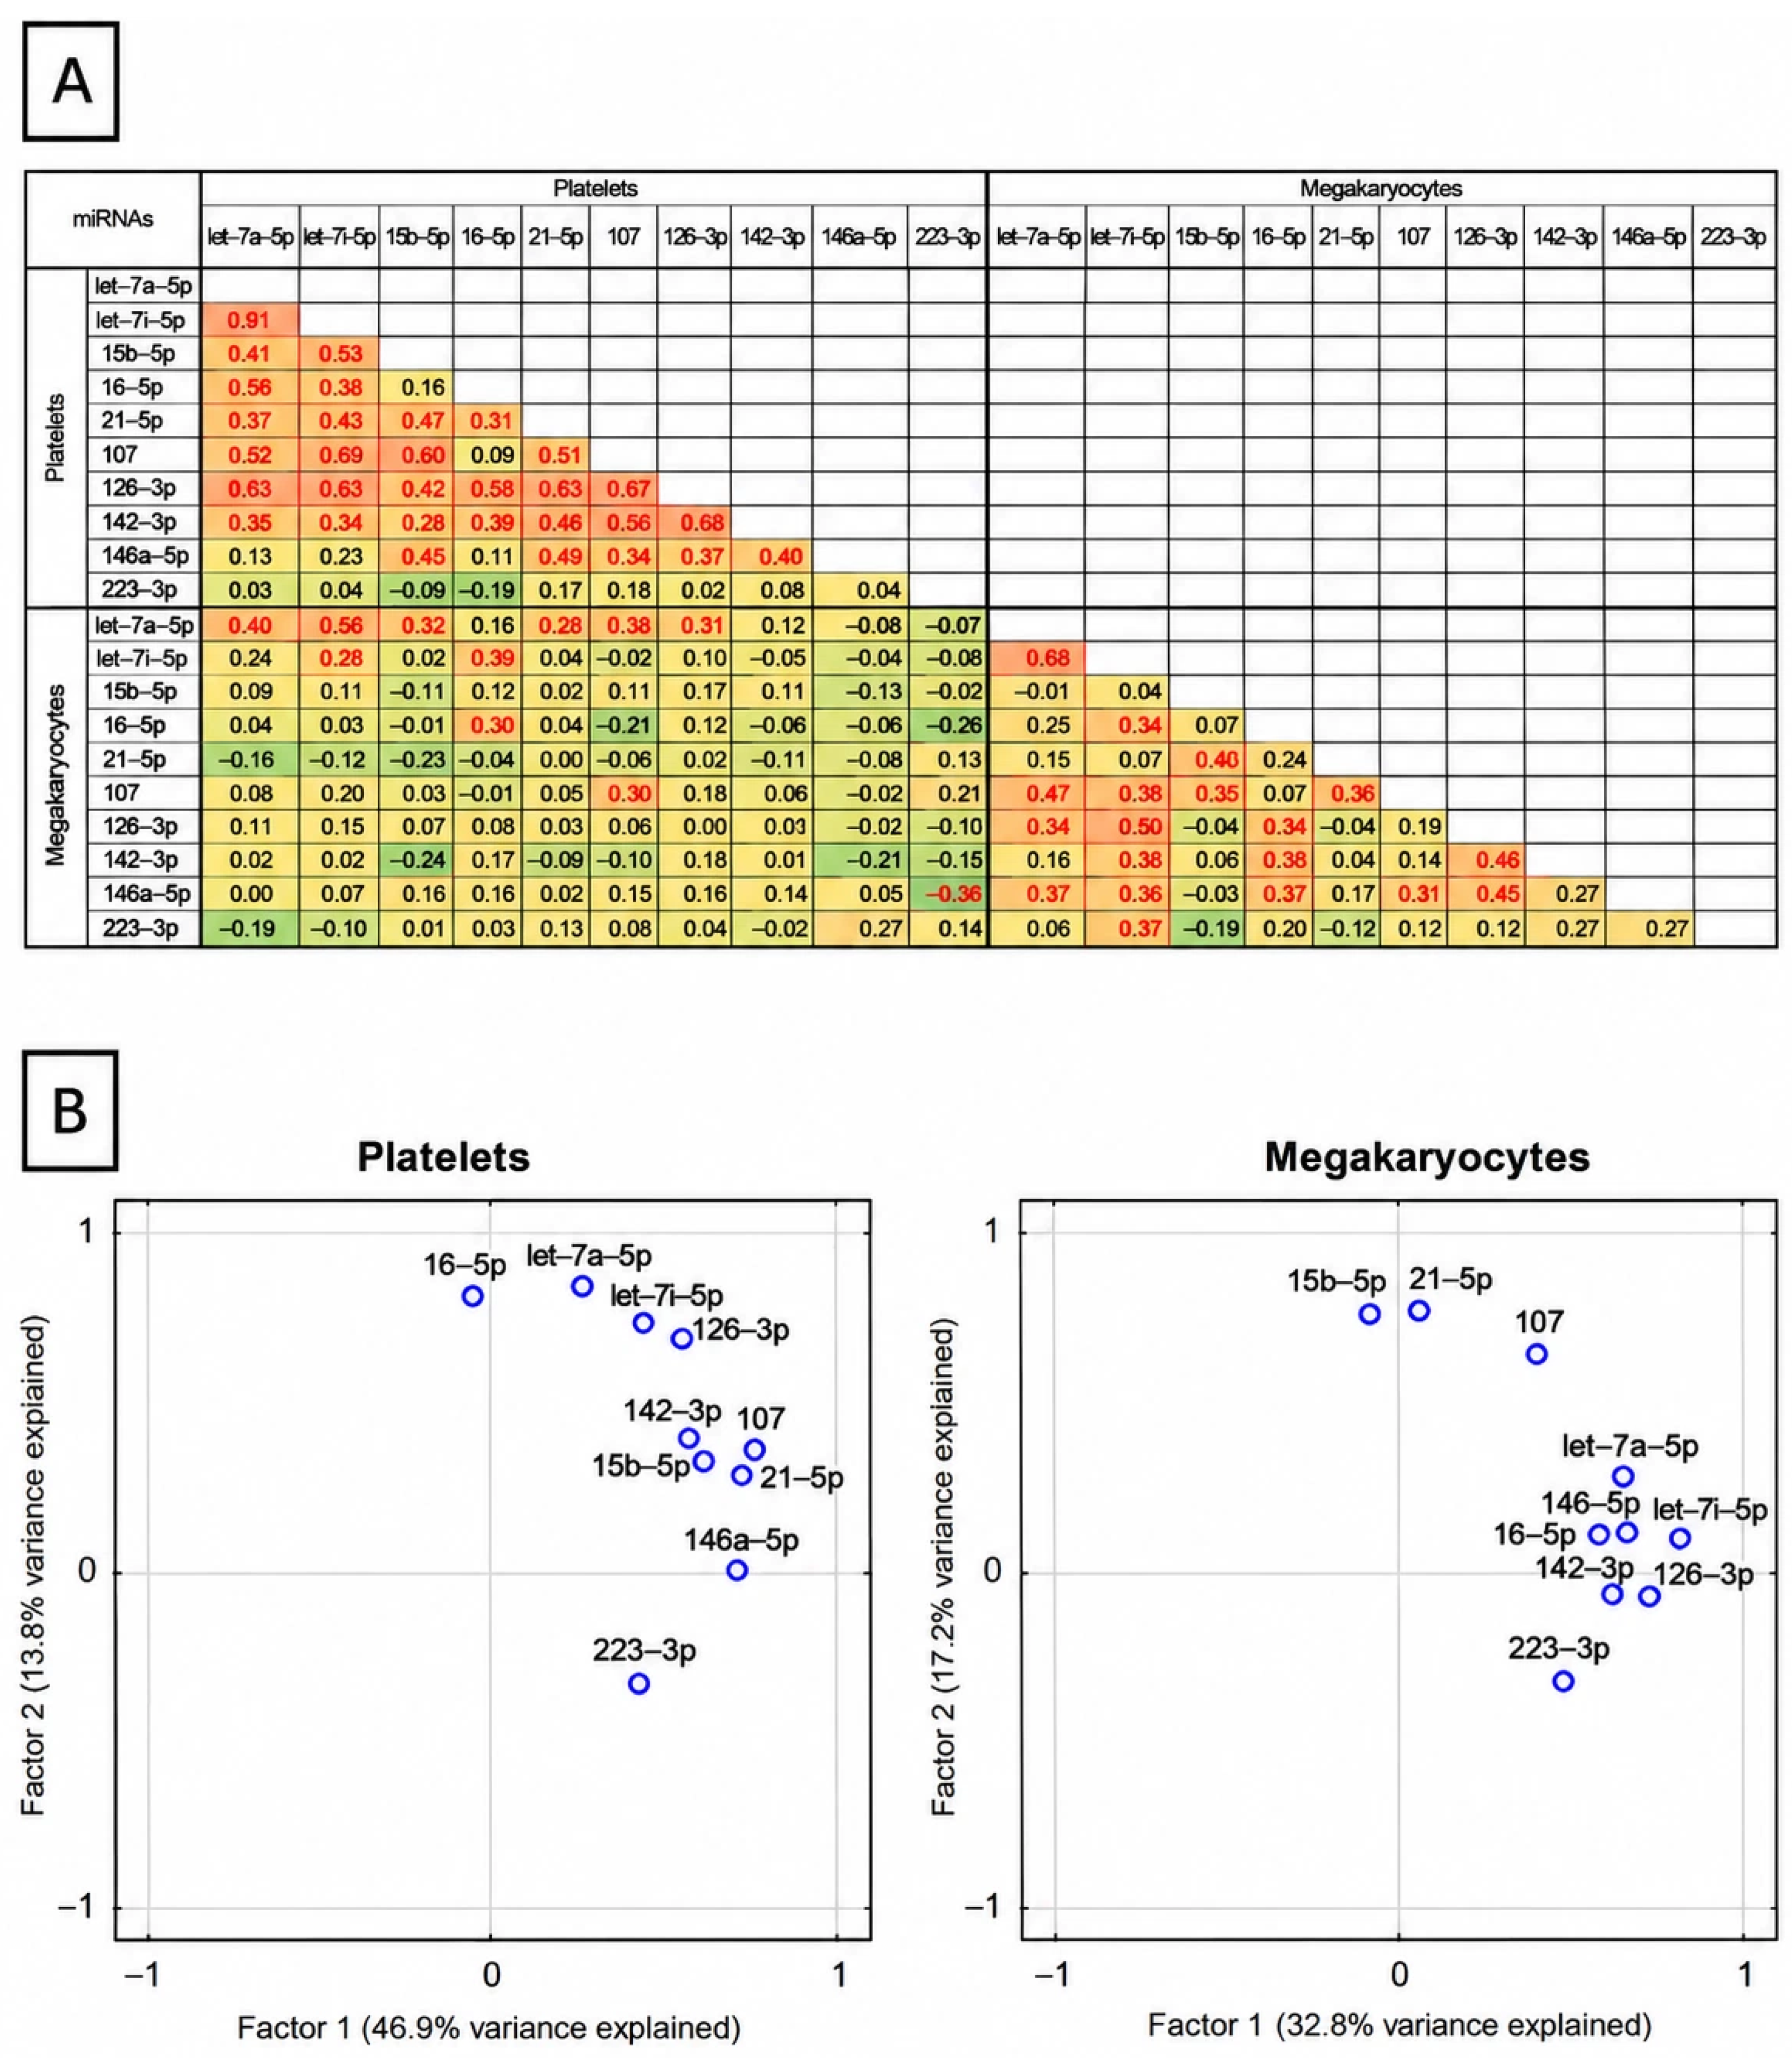
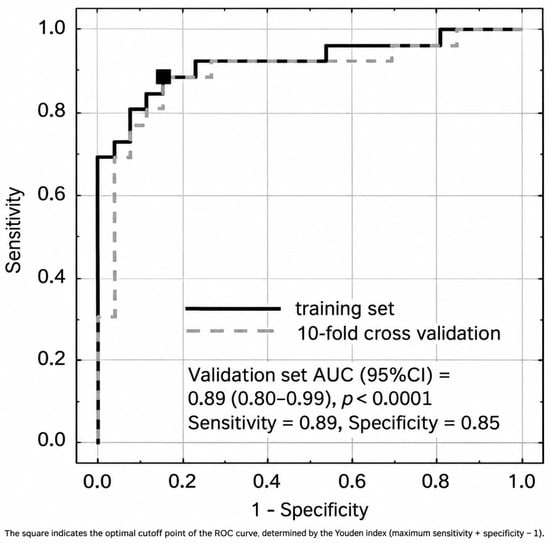
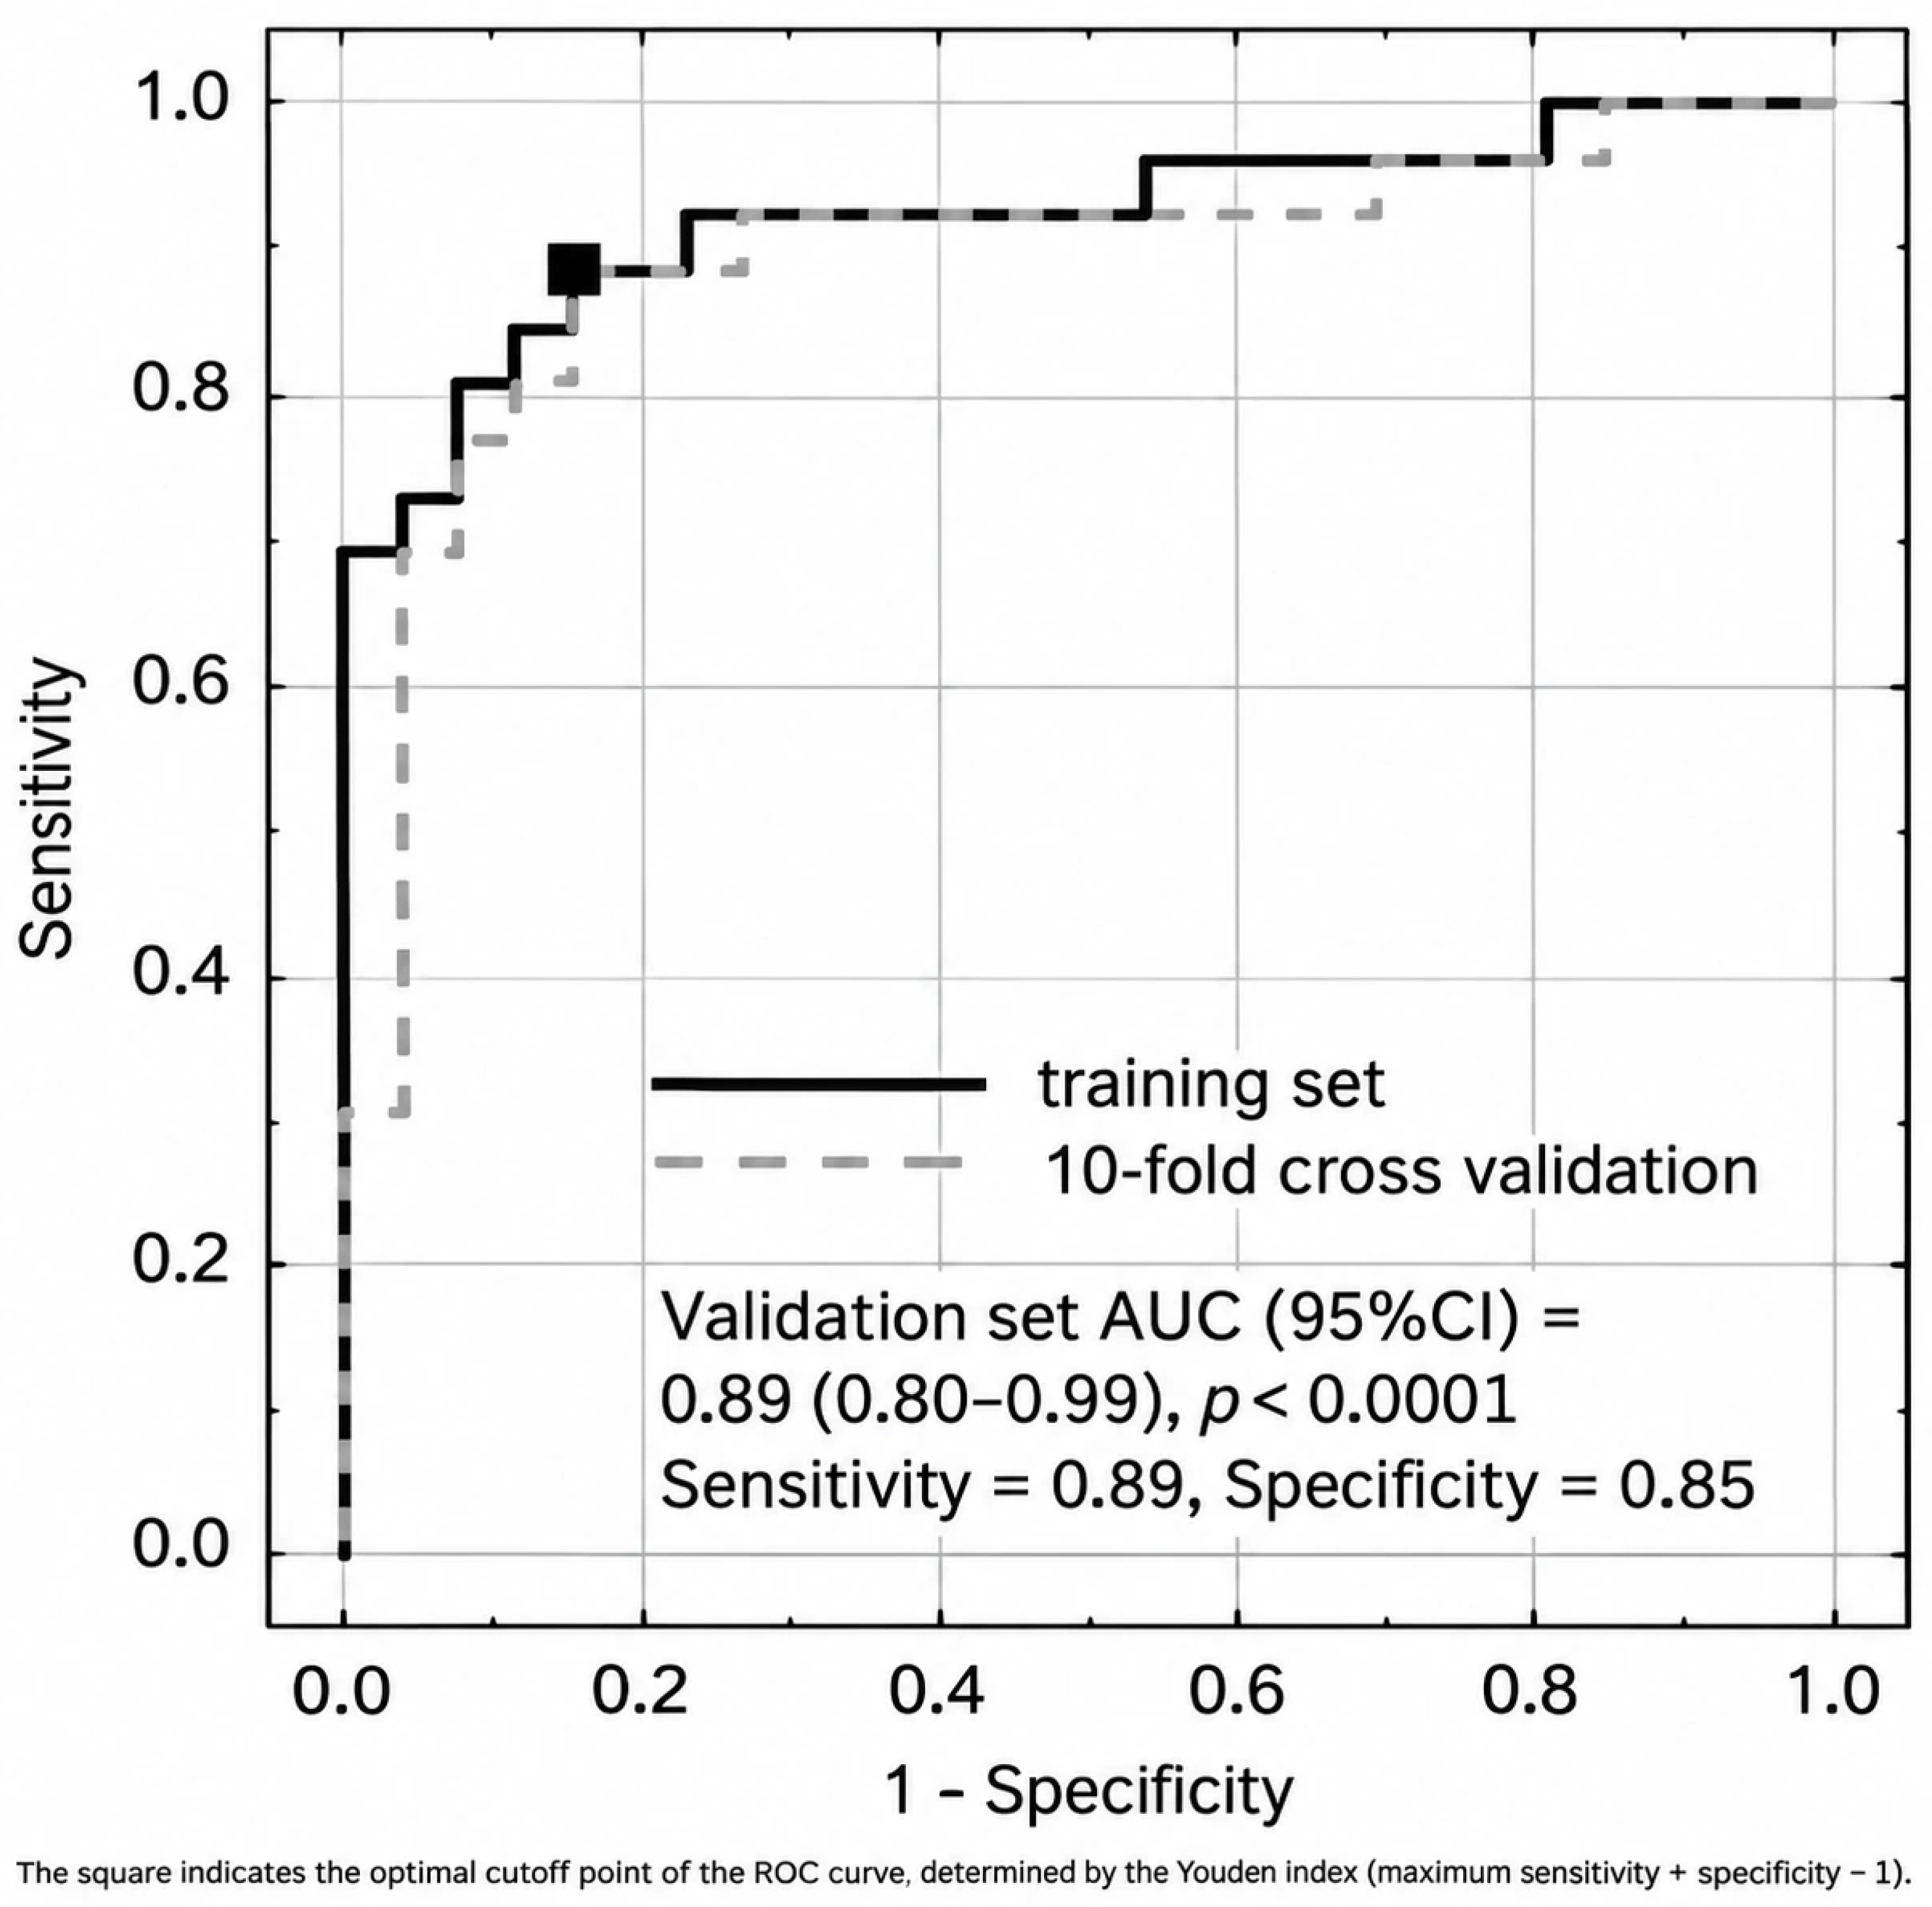
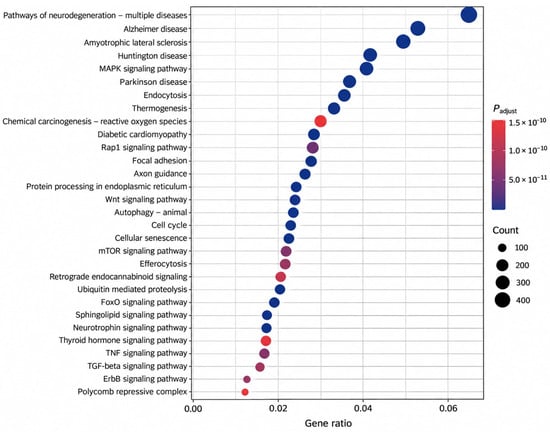
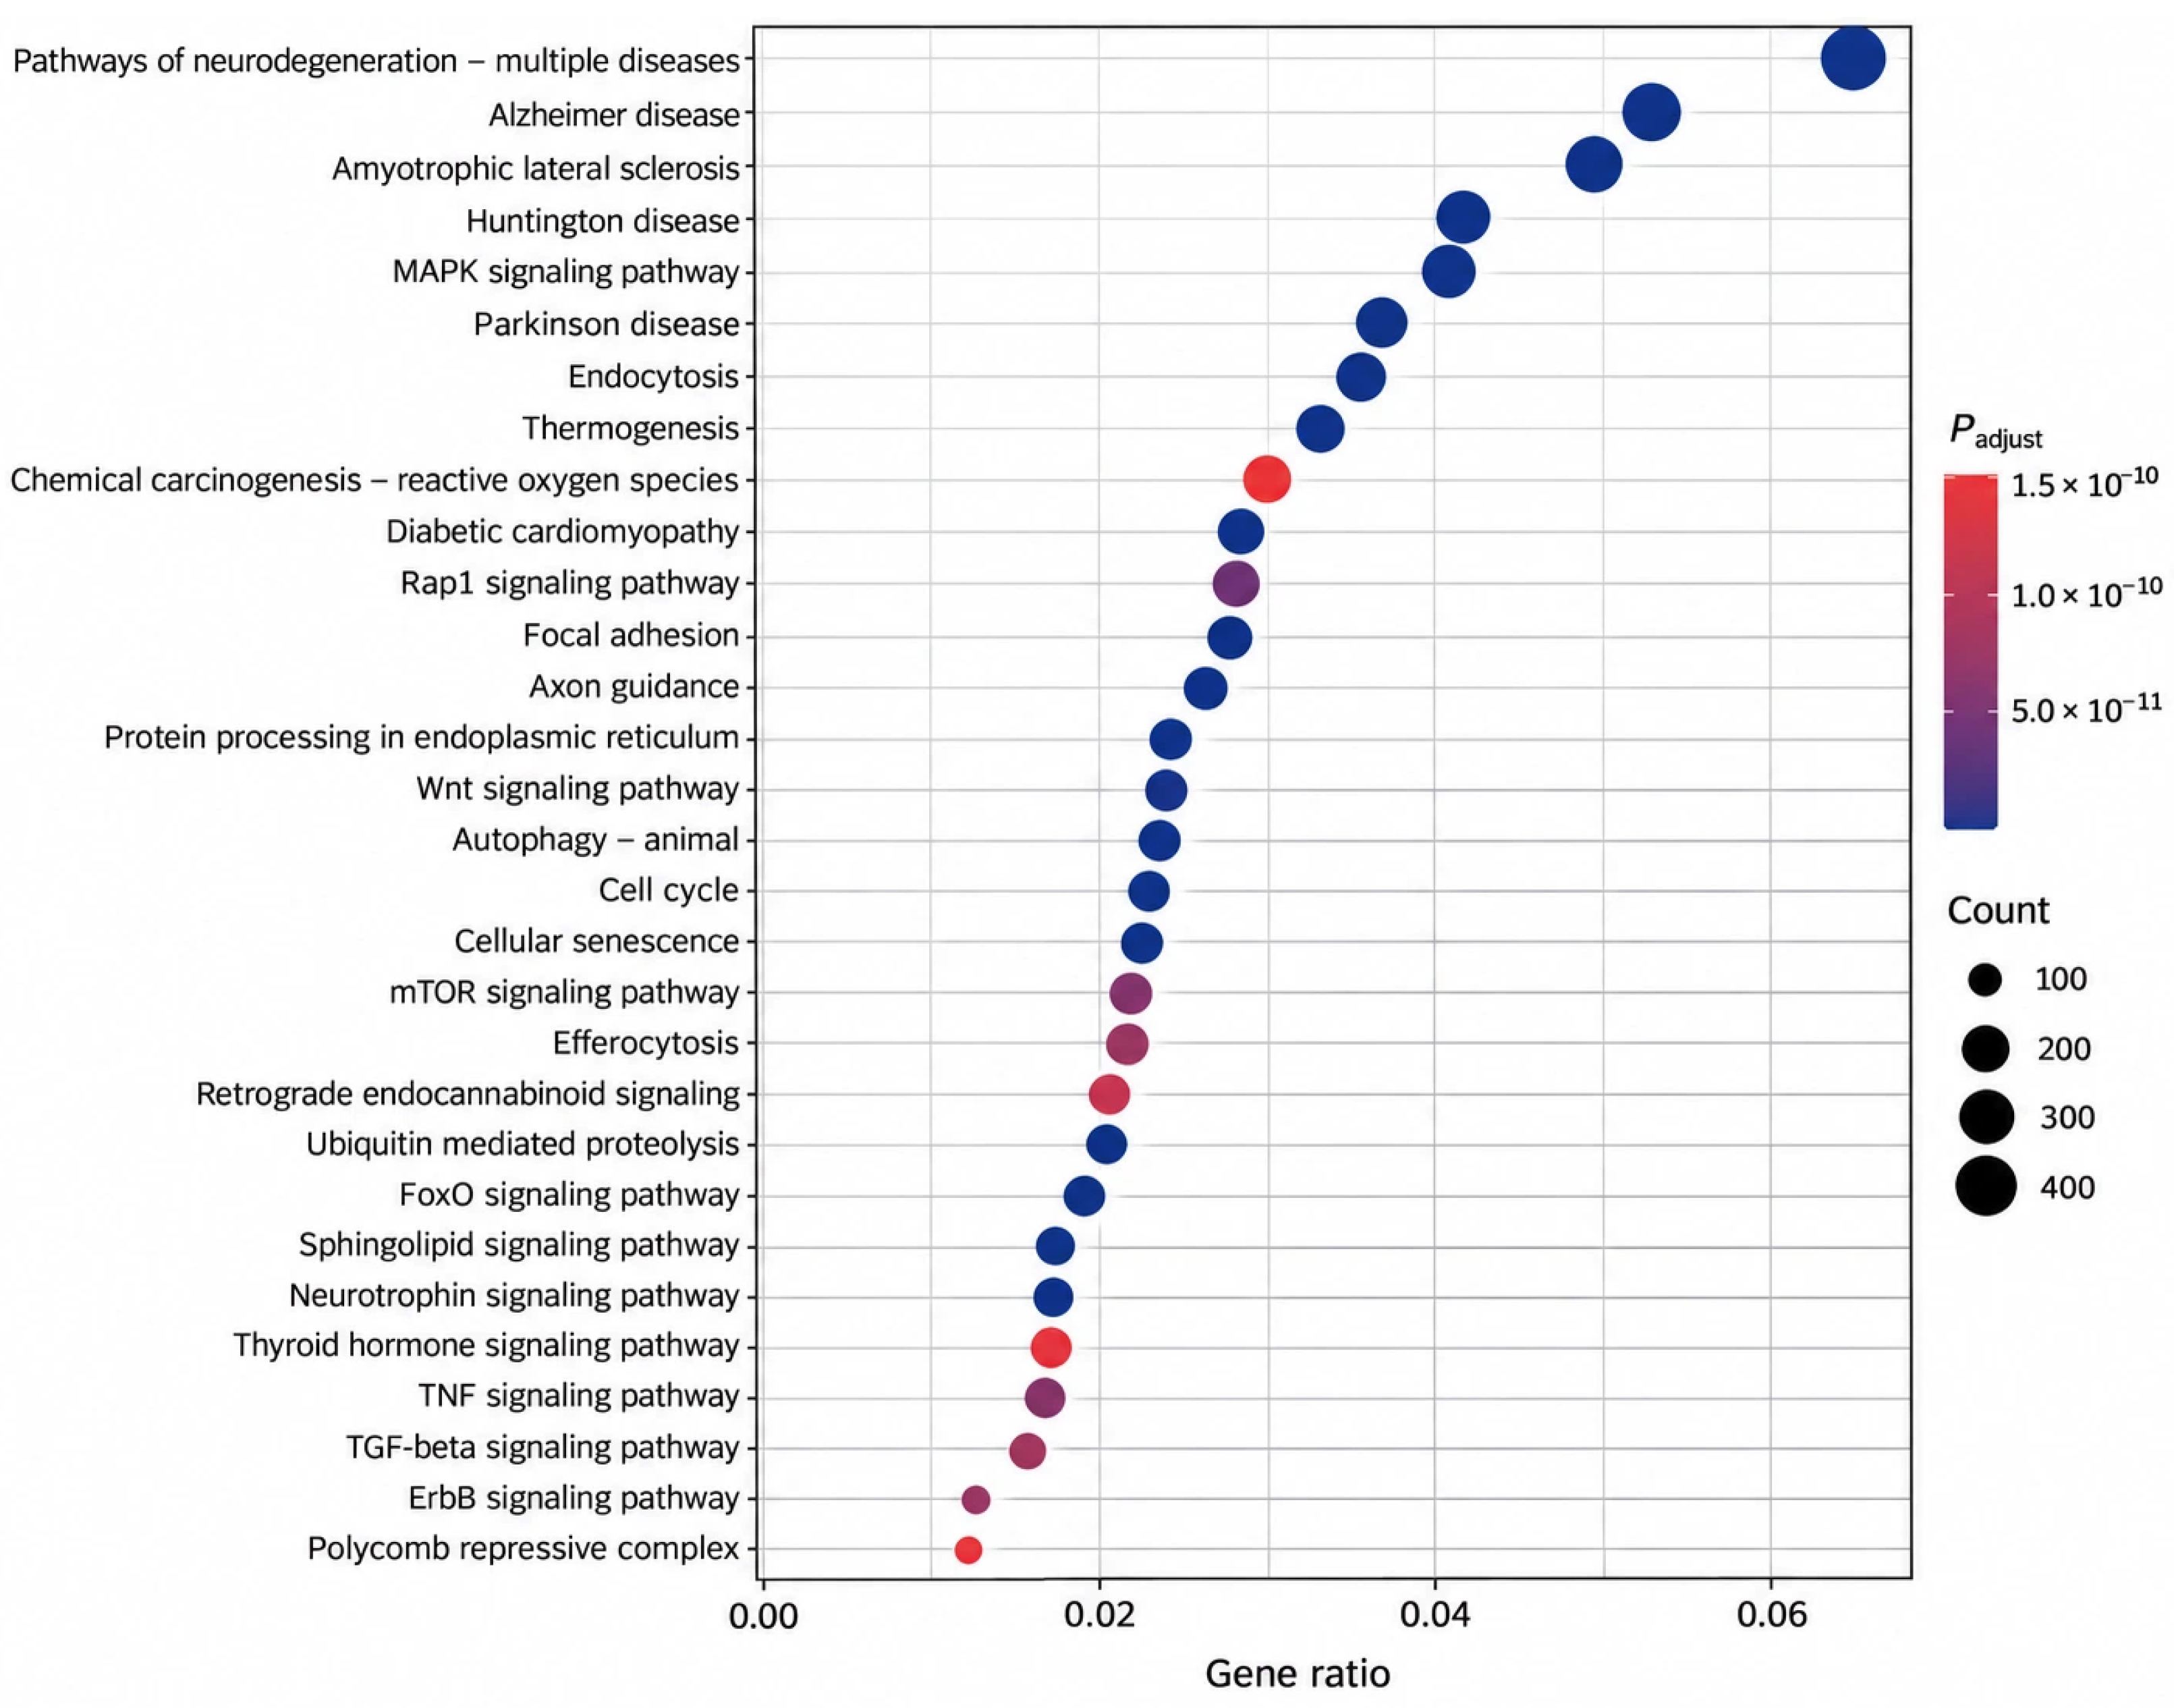
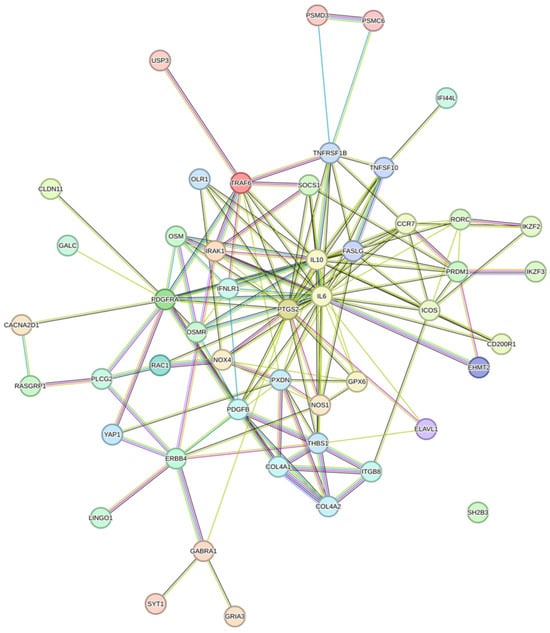
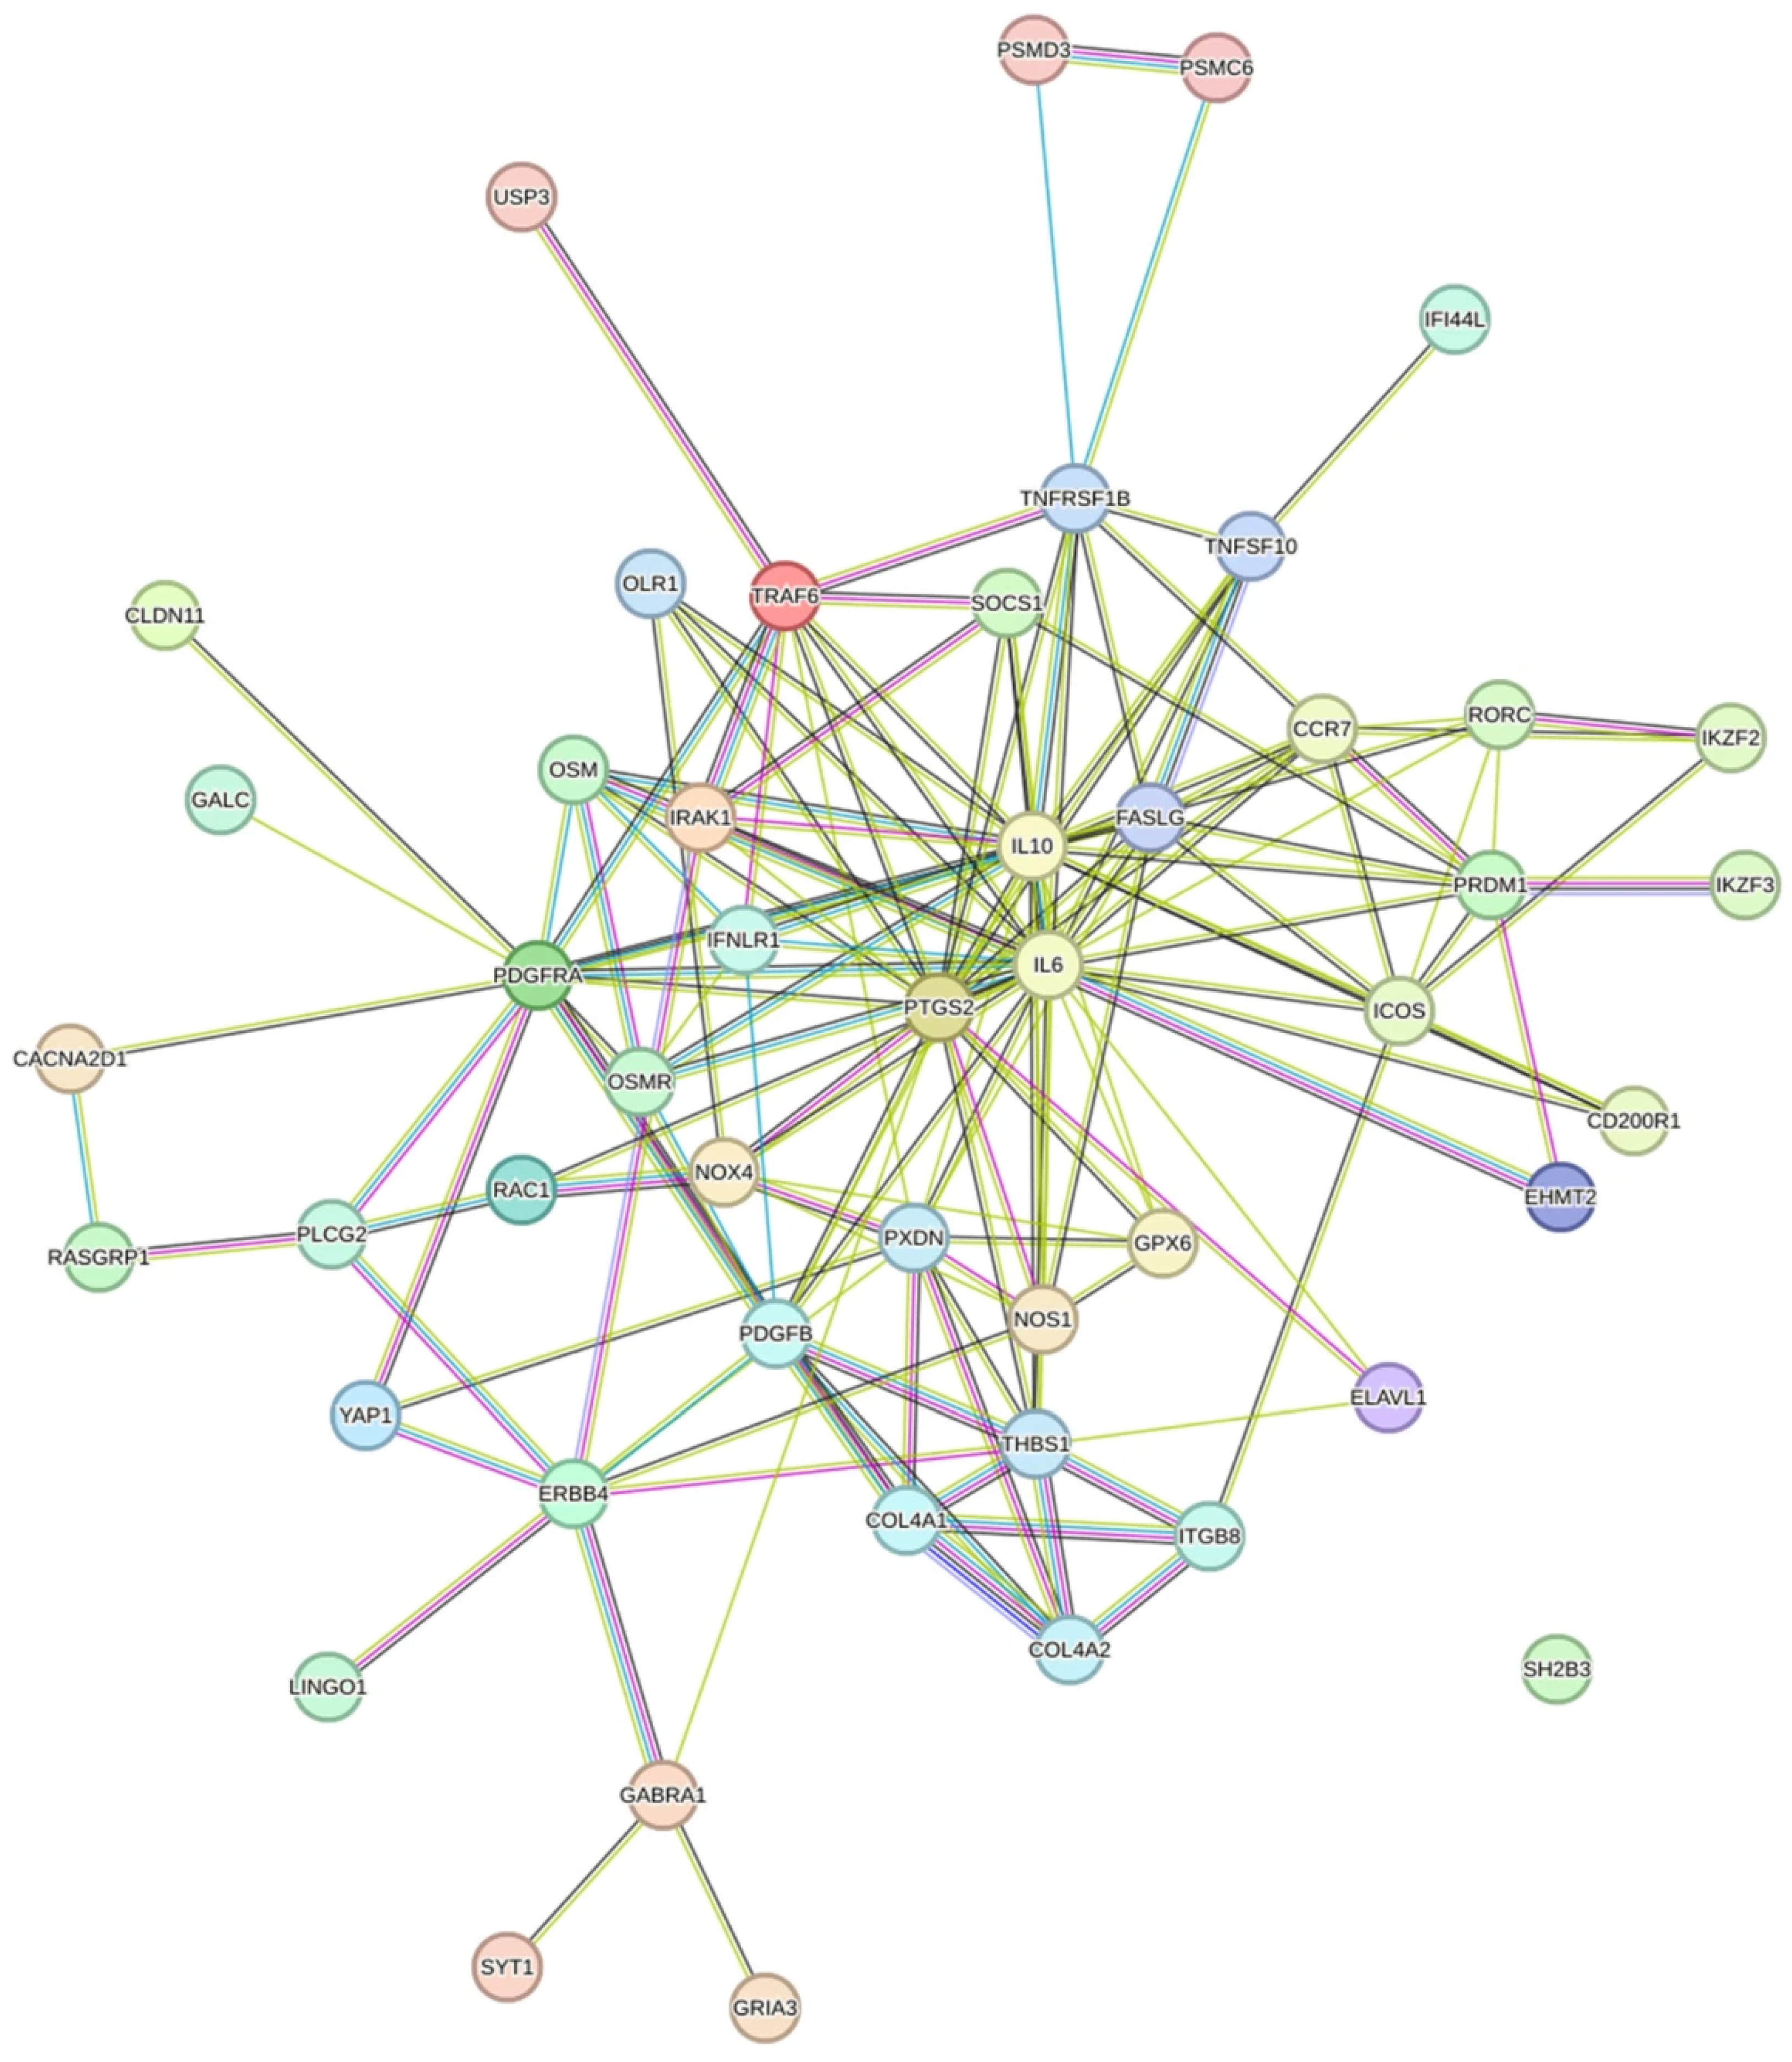

Disclaimer/Publisher’s Note: The statements, opinions and data contained in all publications are solely those of the individual author(s) and contributor(s) and not of MDPI and/or the editor(s). MDPI and/or the editor(s) disclaim responsibility for any injury to people or property resulting from any ideas, methods, instructions or products referred to in the content. |
© 2026 by the authors. Licensee MDPI, Basel, Switzerland. This article is an open access article distributed under the terms and conditions of the Creative Commons Attribution (CC BY) license.