


Highlights
What are the main findings?
- A multi-tissue meta-analysis of four transcriptomic datasets identified 2520 meta-DEGs, with enrichment analyses highlighting lipid metabolism-related pathways and processes, including PPAR signaling.
- Functional validation showed that FABP3 promotes proliferative activity, lipid droplet accumulation, and the expression of lipogenic differentiation markers in primary chicken preadipocytes and hepatocytes.
What are the implications of the main findings?
- These findings highlight FABP3 as a candidate molecular regulator for further investigation of lipid deposition and its regulation in chickens.
- The results support a role for PPAR signaling in FABP3-mediated lipid deposition in chicken adipocytes and hepatocytes, providing a mechanistic basis for further investigation.
Abstract
Excessive deposition of abdominal fat in broilers compromises feed efficiency, carcass yield, processing efficiency, and inflates production costs. Because this trait is governed by multi-tissue crosstalk coupling hepatic lipid synthesis to adipose lipid storage, its coordinated regulation has seldom been addressed. We combined three abdominal fat transcriptomic datasets (GSE42980, GSE49121, GSE104039) with one hepatic dataset (GSE104038), obtaining 2520 meta-differentially expressed genes (meta-DEGs). Functional enrichment revealed a prominent enrichment of lipid-metabolism terms, including peroxisome proliferator-activated receptor (PPAR) signaling. Fatty acid-binding protein 3 (FABP3) appeared repeatedly within the Gene Ontology (GO), Kyoto Encyclopedia of Genes and Genomes (KEGG) and gene set enrichment analysis (GSEA) lipid-metabolism categories and was therefore taken forward for functional work. Overexpressing FABP3 enhanced proliferation, lipid accumulation and lipogenic marker expression, whereas knockdown reversed these effects. In both adipocytes and hepatocytes, FABP3 raised peroxisome proliferator-activated receptor gamma (PPARγ) and fatty acid-binding protein 4 (FABP4) at mRNA and protein levels. Pharmacological intervention showed that the PPARγ antagonist GW9662 suppressed the pro-lipogenic action of FABP3 overexpression, while the PPARα agonist GW7647 reinstated lipid accumulation in FABP3-silenced cells, indicating a reliance on PPAR-pathway activity. FABP3 therefore drives lipid deposition in adipocytes and hepatocytes via PPAR signaling, offering a framework for how the liver and abdominal adipose tissue jointly govern abdominal fat deposition in broilers.
1. Introduction
Modern commercial broilers are the product of many generations of selective breeding aimed at fast growth and better production performance, yet such intense selection often brings greater fat deposition in its wake [1]. Excessive abdominal fat lowers feed efficiency and pushes up production costs [2], and it also impairs reproductive performance [3]. Understanding how abdominal fat is deposited in broilers is therefore a prerequisite for keeping excess fat accumulation in check.
Over the past decade, RNA sequencing (RNA-Seq) and microarray profiling have repeatedly been used to pin down the genes and pathways that control abdominal fat deposition in broilers. Microarray work identified 230 significantly differentially expressed genes (DEGs) that separate fat from lean broilers and assigned them to lipid and energy metabolism pathways [4]. An RNA-Seq comparison of the same contrast returned 286 significant DEGs, among which genes of lipid synthesis were upregulated, while those driving triglyceride hydrolysis were downregulated [5]. Profiling abdominal fat from broilers at 3, 4, 5 and 6 weeks of age by gene microarray likewise uncovered DEGs that distinguish fat from lean birds at each of the four growth stages [6]. Most of these studies examined a single adipose depot, even though abdominal fat deposition is a complex process governed by crosstalk among several tissues, the liver being the principal site of lipid synthesis and abdominal adipose tissue the principal site of storage [7]. How the two tissues coordinate this process has attracted little attention. Because datasets differ, the key genes reported by different groups are often inconsistent, which is why a cross-tissue, multi-dataset integration strategy is valuable for exposing conserved regulators. Meta-analysis integrates multiple independent datasets to effectively improve statistical power and identify more robust conclusions [8]. For example, a meta-analysis of 28 studies clarified the immunosuppressive effects of heat stress [9], whereas another study combining five transcriptomic datasets identified key genes underlying woody breast syndrome [10]. These findings indicate that meta-analysis of multiple datasets is a powerful strategy to identify key genes and reveal conserved molecular mechanisms.
Fatty acid-binding proteins (FABPs) form a family of lipid-binding proteins with characteristic tissue-specific expression patterns whose principal job is to bind and transport hydrophobic fatty acids [11]. One family member, fatty acid-binding protein 3 (FABP3), plays an important part in lipid metabolism in adipose and liver tissue alike. Overexpressing FABP3 in mouse preadipocytes markedly accelerates adipocyte differentiation and raises adipogenic genes, such as glycerol-3-phosphate dehydrogenase and peroxisome proliferator-activated receptor gamma (PPARγ) [12]. RNA-Seq analysis has shown FABP3 to be significantly upregulated in fat relative to lean broilers [13]. The signaling cascades downstream of FABP3 remain undefined, and what FABP3 knockdown does during adipogenesis has never been examined in poultry.
The present work therefore set out to integrate three abdominal fat transcriptomic series (GSE42980, GSE49121, GSE104039) with the liver series GSE104038 in one meta-analysis, so as to identify meta-differentially expressed genes (meta-DEGs) linked to abdominal fat deposition across hepatic and adipose tissue. Gene Ontology (GO), Kyoto Encyclopedia of Genes and Genomes (KEGG), gene set enrichment analysis (GSEA) and protein–protein interaction (PPI) network analyses were then applied to the meta-DEGs to screen for key lipid metabolism-related genes. The specific aims of this study were to identify conserved lipid-metabolism genes shared by hepatic and adipose transcriptomes of broilers differing in abdominal fatness, and to determine, in primary chicken preadipocytes and hepatocytes, whether the prioritized candidate FABP3 regulates cell proliferation, adipogenic differentiation and lipid deposition, and whether these effects depend on peroxisome proliferator-activated receptor (PPAR) signaling pathway activity. By pairing multi-tissue omics with molecular validation, this work lays a foundation for clarifying how abdominal fat deposition is coordinated between hepatic and adipose tissues in broilers.
2. Results
2.1. Differential Expression Analyses
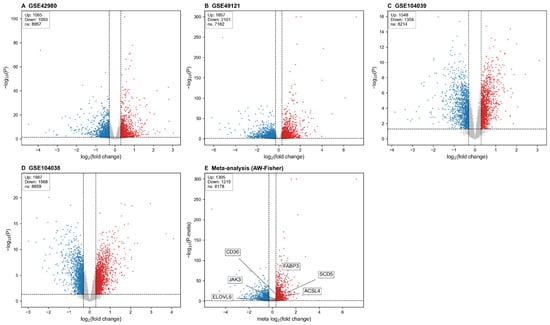
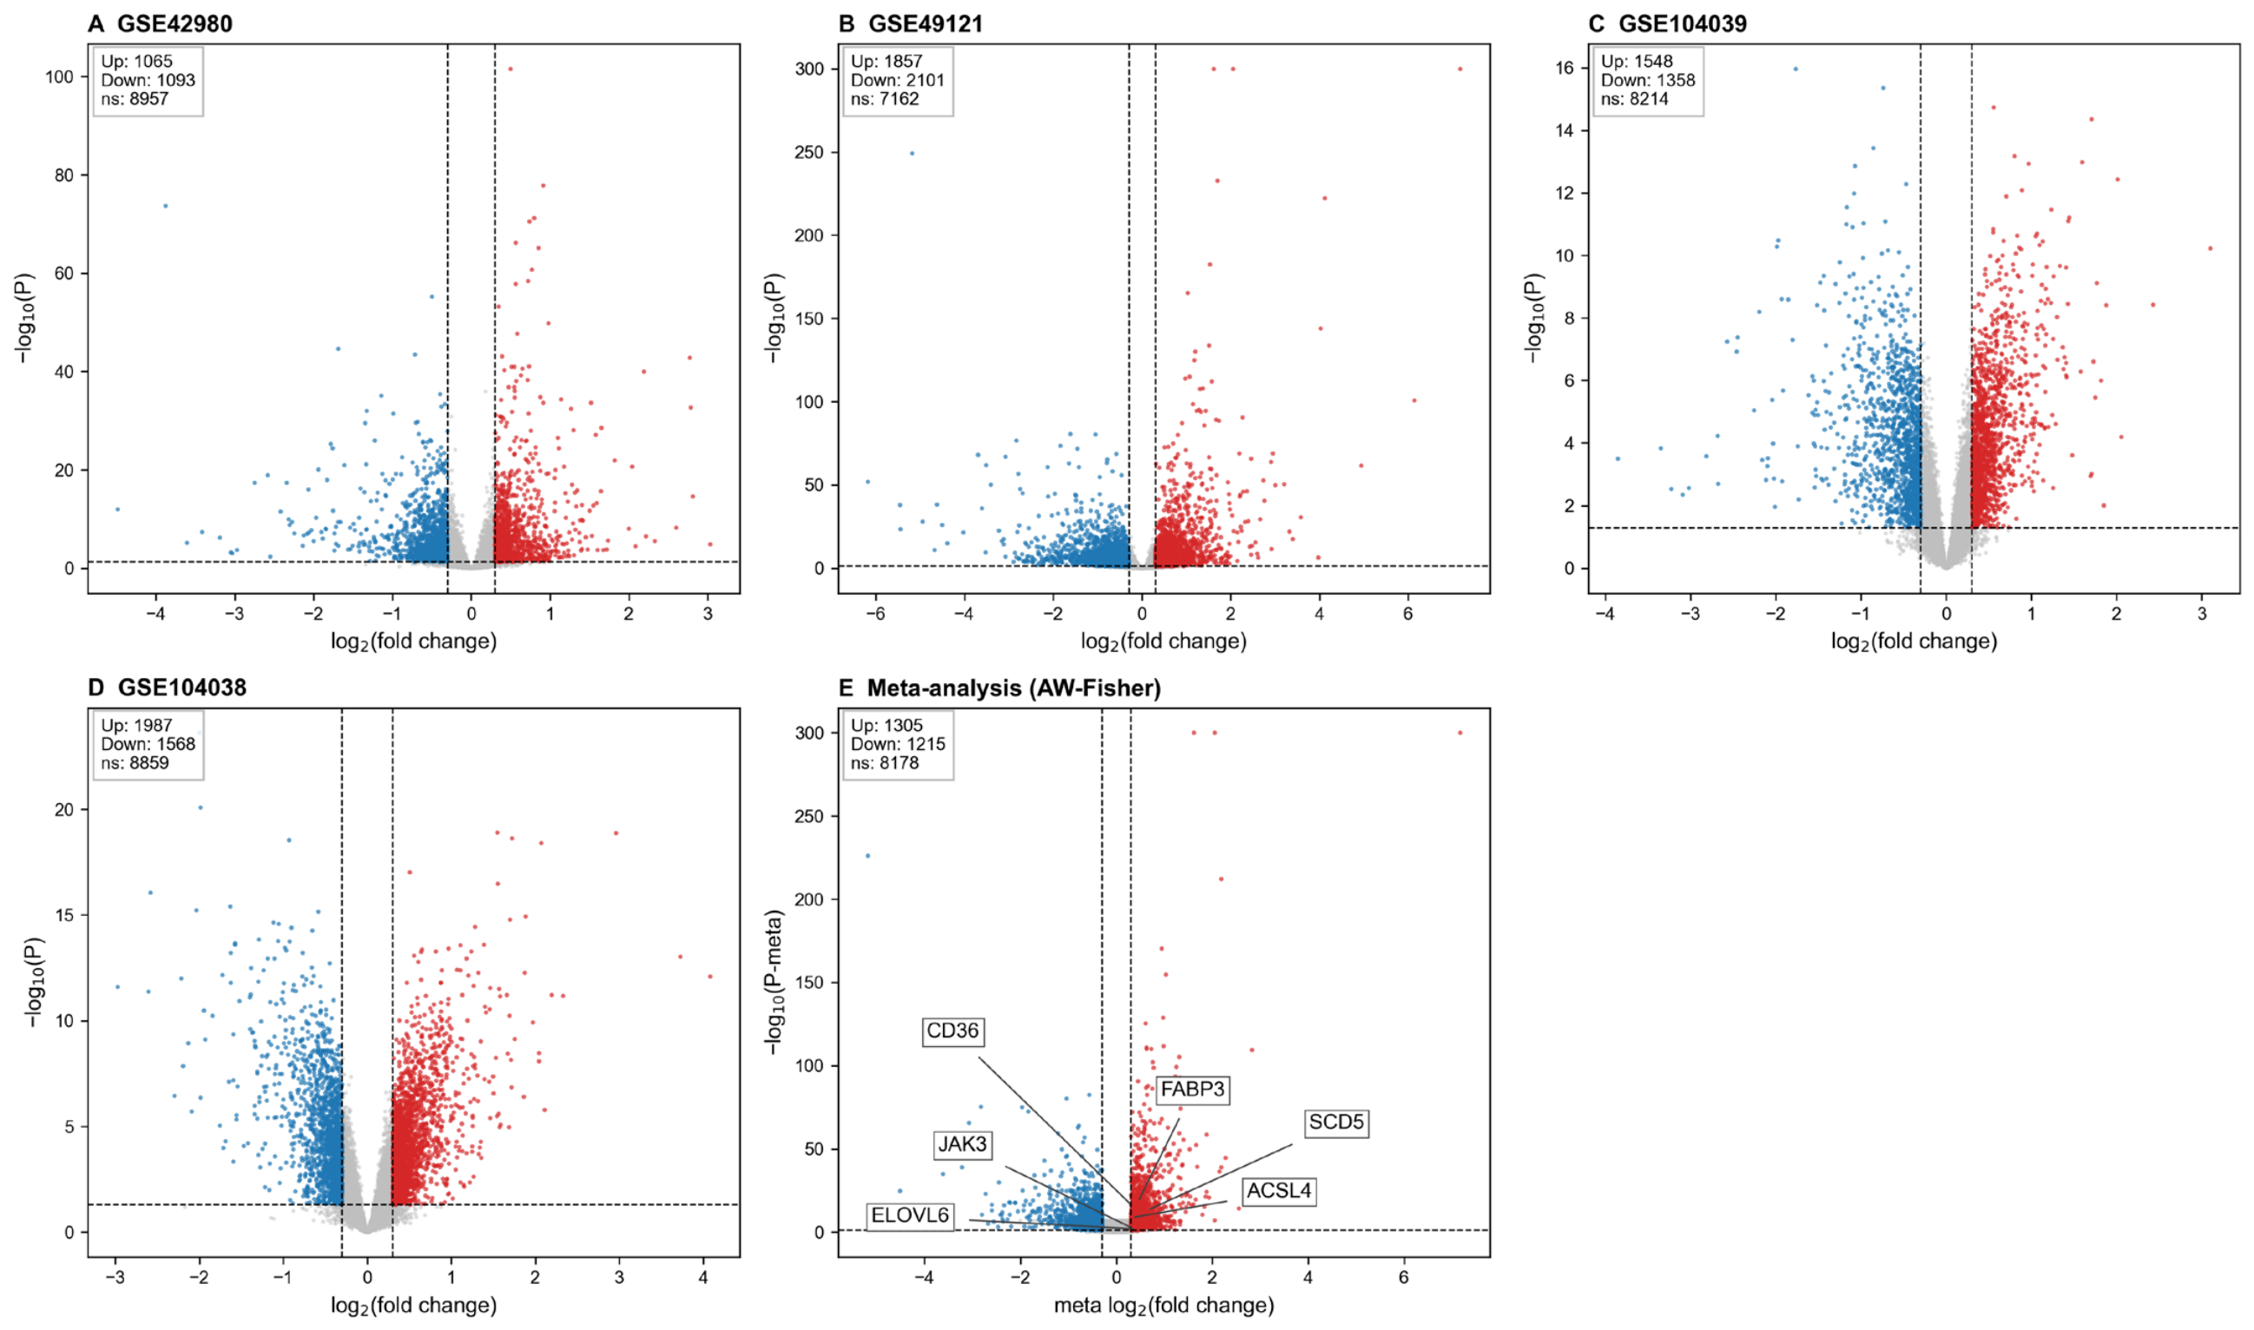
Differential expression was first assessed separately in each dataset, with DESeq2 applied to RNA-Seq datasets and limma to microarray datasets, applying uniform per-dataset criteria of p < 0.05 and |log2fold change (FC)| ≥ 0.3. In GSE42980, 2158 DEGs were identified between the fat and lean groups (Figure 1A); in GSE49121, 3958 DEGs were identified (Figure 1B); in GSE104039, 2906 DEGs were identified (Figure 1C); and in GSE104038, 3555 DEGs were identified (Figure 1D). To identify candidate genes, we performed a meta-analysis on the 10,698 genes shared across the four datasets, which comprised 66 fat and 65 lean transcriptomic samples, including 85 abdominal fat and 46 liver samples. There were 2520 significant meta-DEGs identified between the fat-line/ high-fiber and high-fat diet (HF) and lean-line/ standard high-starch (LF) groups (Supporting Information, Table S1). Within the meta-DEGs 1305 genes had higher expression in fat-line/HF groups relative to lean-line/LF groups; FABP3, stearoyl-CoA desaturase (SCD), proline-rich membrane anchor 1 (PRIMA1), and insulin-like growth factor-binding protein 2 (IGFBP2) were representative. A further 1215 genes showed lower expression, including enoyl-CoA hydratase and 3-hydroxyacyl CoA dehydrogenase (EHHADH), extracellular fatty acid-binding protein (EXFABP), and aconitate decarboxylase 1 (ACOD1) (Figure 1E, Supporting Information, Table S1). Of the 2520 meta-DEGs, 2512 (99.7%) also passed Benjamini–Hochberg false discovery rate (FDR) < 0.05, indicating that the meta-DEG list was robust to FDR correction.
Figure 1.
Volcano plots for the individual datasets and for the meta-analysis. (A–D): volcano plots for GSE42980, GSE49121, GSE104039 and GSE104038, respectively. (E): volcano plot of the meta-differentially expressed genes(meta-DEGs) returned by meta-analysis of the four datasets. Panels (A–D) present each dataset analysed on its own: red dots mark genes with log2 fold change (FC) ≥ 0.3 and p < 0.05, blue dots mark genes with log2FC ≤ −0.3 and p < 0.05, and gray dots denote genes that are not significantly differentially expressed (|log2FC| < 0.3 or p ≥ 0.05). In panel (E), significantly upregulated genes (log2FC ≥ 0.3 and p-Meta < 0.05) are red, significantly downregulated genes (log2FC ≤ −0.3 and p-Meta < 0.05) are blue, and gray dots denote genes that are not significantly differentially expressed or that fail the direction-consistency test (|log2FC| < 0.3 or p-Meta ≥ 0.05 or Direction_Consistent = False). Dashed horizontal lines represent the significance thresholds (p = 0.05 for (A–D); p-Meta = 0.05 for (E)); dashed vertical lines represent the fold-change thresholds (log2FC = ±0.3).
2.2. Kyoto Encyclopedia of Genes and Genomes (KEGG), Gene Ontology (GO) and Protein–Protein Interaction (PPI) Analyses of the Meta-Differentially Expressed Genes(Meta-DEGs)
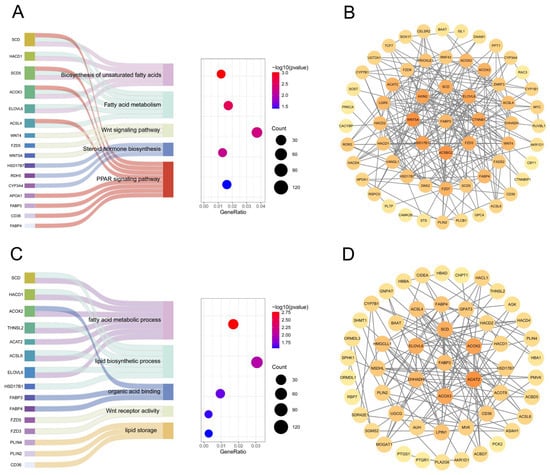
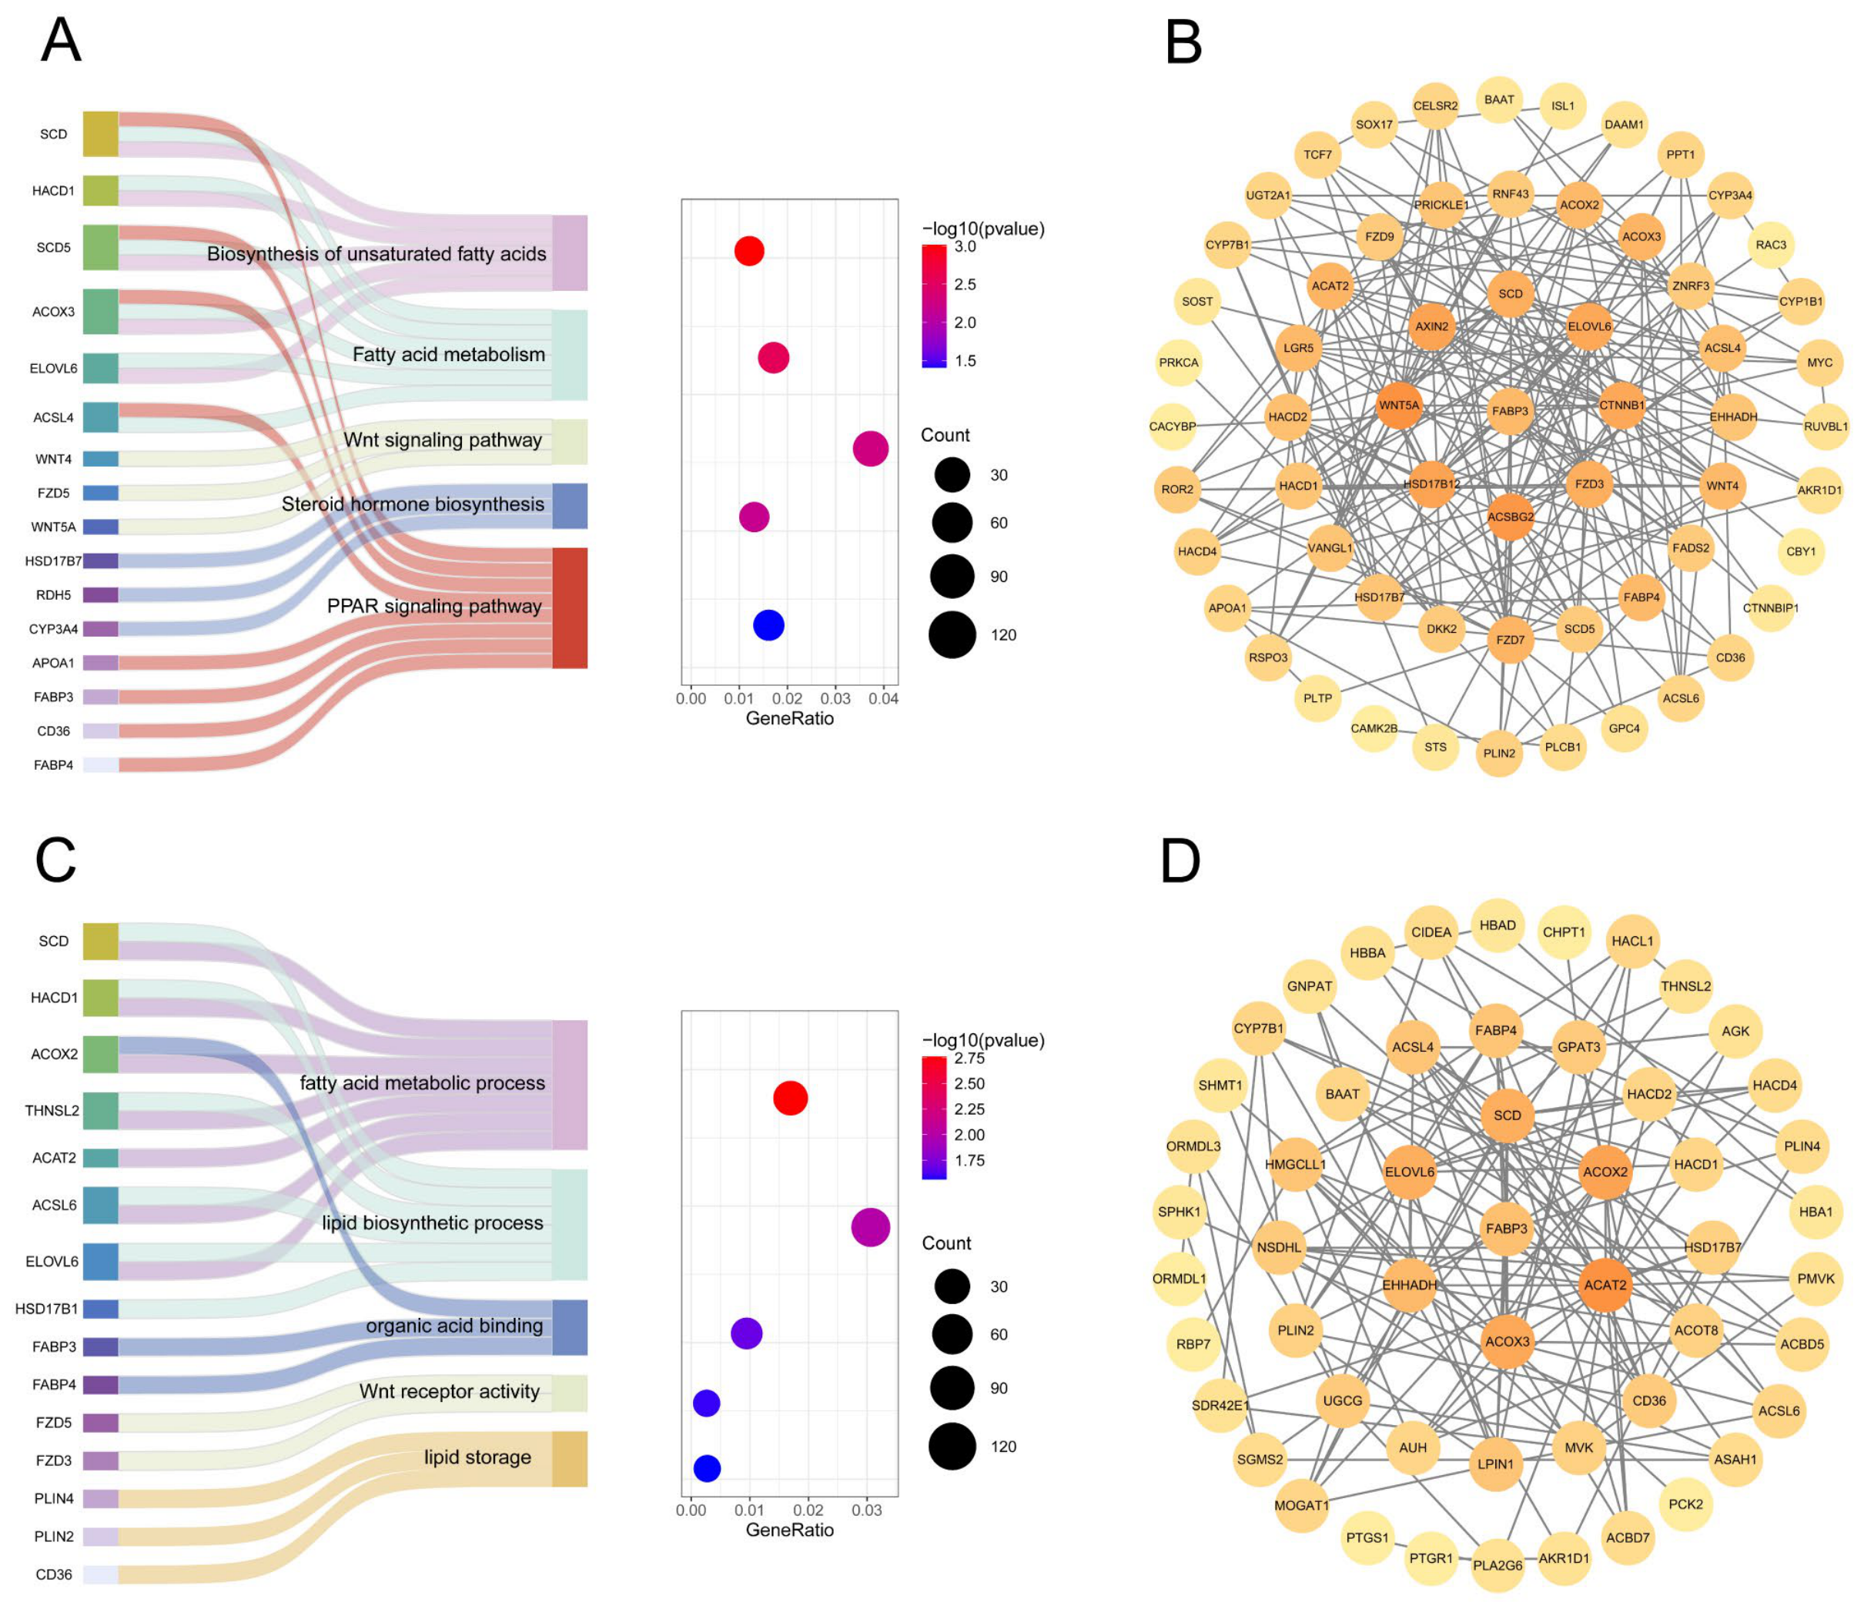
According to the KEGG database, 32 pathways reached significance among the meta-DEGs (Supporting Information, Table S2), and five of them are related to lipid metabolism: the PPAR signaling pathway, fatty acid metabolism, biosynthesis of unsaturated fatty acids, the Wnt signaling pathway and steroid hormone biosynthesis. Within these five pathways, SCD, FABP3, stearoyl-CoA desaturase 5 (SCD5), Wnt family member 5A (WNT5A) and EHHADH were identified (Figure 2A). A PPI network of the meta-DEGs contained in these five lipid metabolism pathways was then constructed (Figure 2B).
Figure 2.
Kyoto Encyclopedia of Genes and Genomes (KEGG) and Gene Ontology (GO) enrichment with the associated meta-DEG protein–protein interaction (PPI) network. (A): KEGG enrichment. The left-hand Sankey diagram connects genes with the pathways they belong to. These pathways are then arranged along the vertical axis of the bubble diagram on the right, whose horizontal axis reports how strongly the meta-DEGs are enriched in each pathway. Bubble color carries the enrichment significance, with deeper red meaning greater significance. (B): PPI network construction based on KEGG-enriched pathways. Nodes with darker colors indicate more significant genes. (C): GO enrichment, displayed in the same two-panel format: genes are linked to their pathways by the Sankey diagram on the left, and the bubble diagram on the right again sets out those pathways vertically against the enrichment level horizontally, with color encoding significance as before. (D): PPI network construction based on GO-enriched pathways. Nodes with darker colors indicate more significant genes.
In the GO analysis, 349 terms were significantly enriched among the meta-DEGs, comprising 254 Biological Process (BP), 35 Cellular Component (CC) and 60 Molecular Function (MF) terms (Supporting Information, Table S3). Within the BP terms, lipid biosynthetic process and fatty acid metabolic process were enriched. The CC terms included lysosome and vacuole, and organic acid binding together with extracellular matrix binding stood out among the MF terms. Of the 349 GO terms, 18 were related to lipid metabolism, and the genes they contained included acyl-CoA oxidase 2 (ACOX2), FABP3, SCD, 3-hydroxyacyl-CoA dehydratase 1 (HACD1), lipin 1 (LPIN1), solute carrier family 38 member 1 (SLC38A1) and fatty acid-binding protein 4 (FABP4). The five-lipid metabolism-related GO terms were displayed as a Sankey bubble diagram (Figure 2C), and a PPI network was built from the meta-DEGs contained in those five terms (Figure 2D).
2.3. Gene Set Enrichment Analysis (GSEA) and PPI of the Meta-DEGs
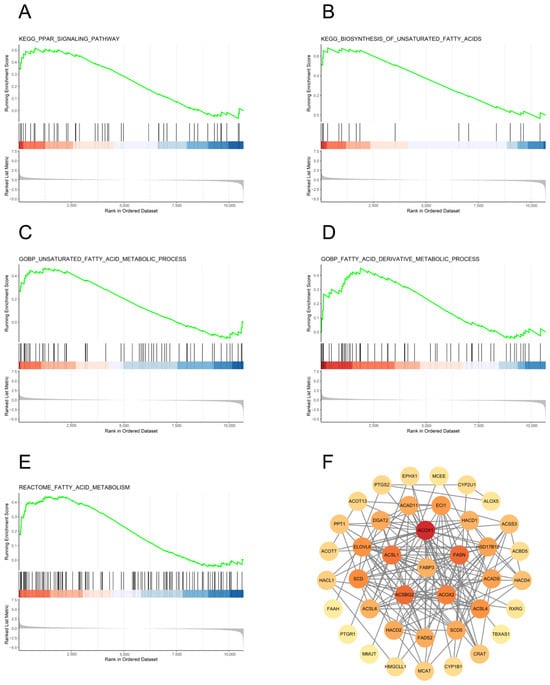
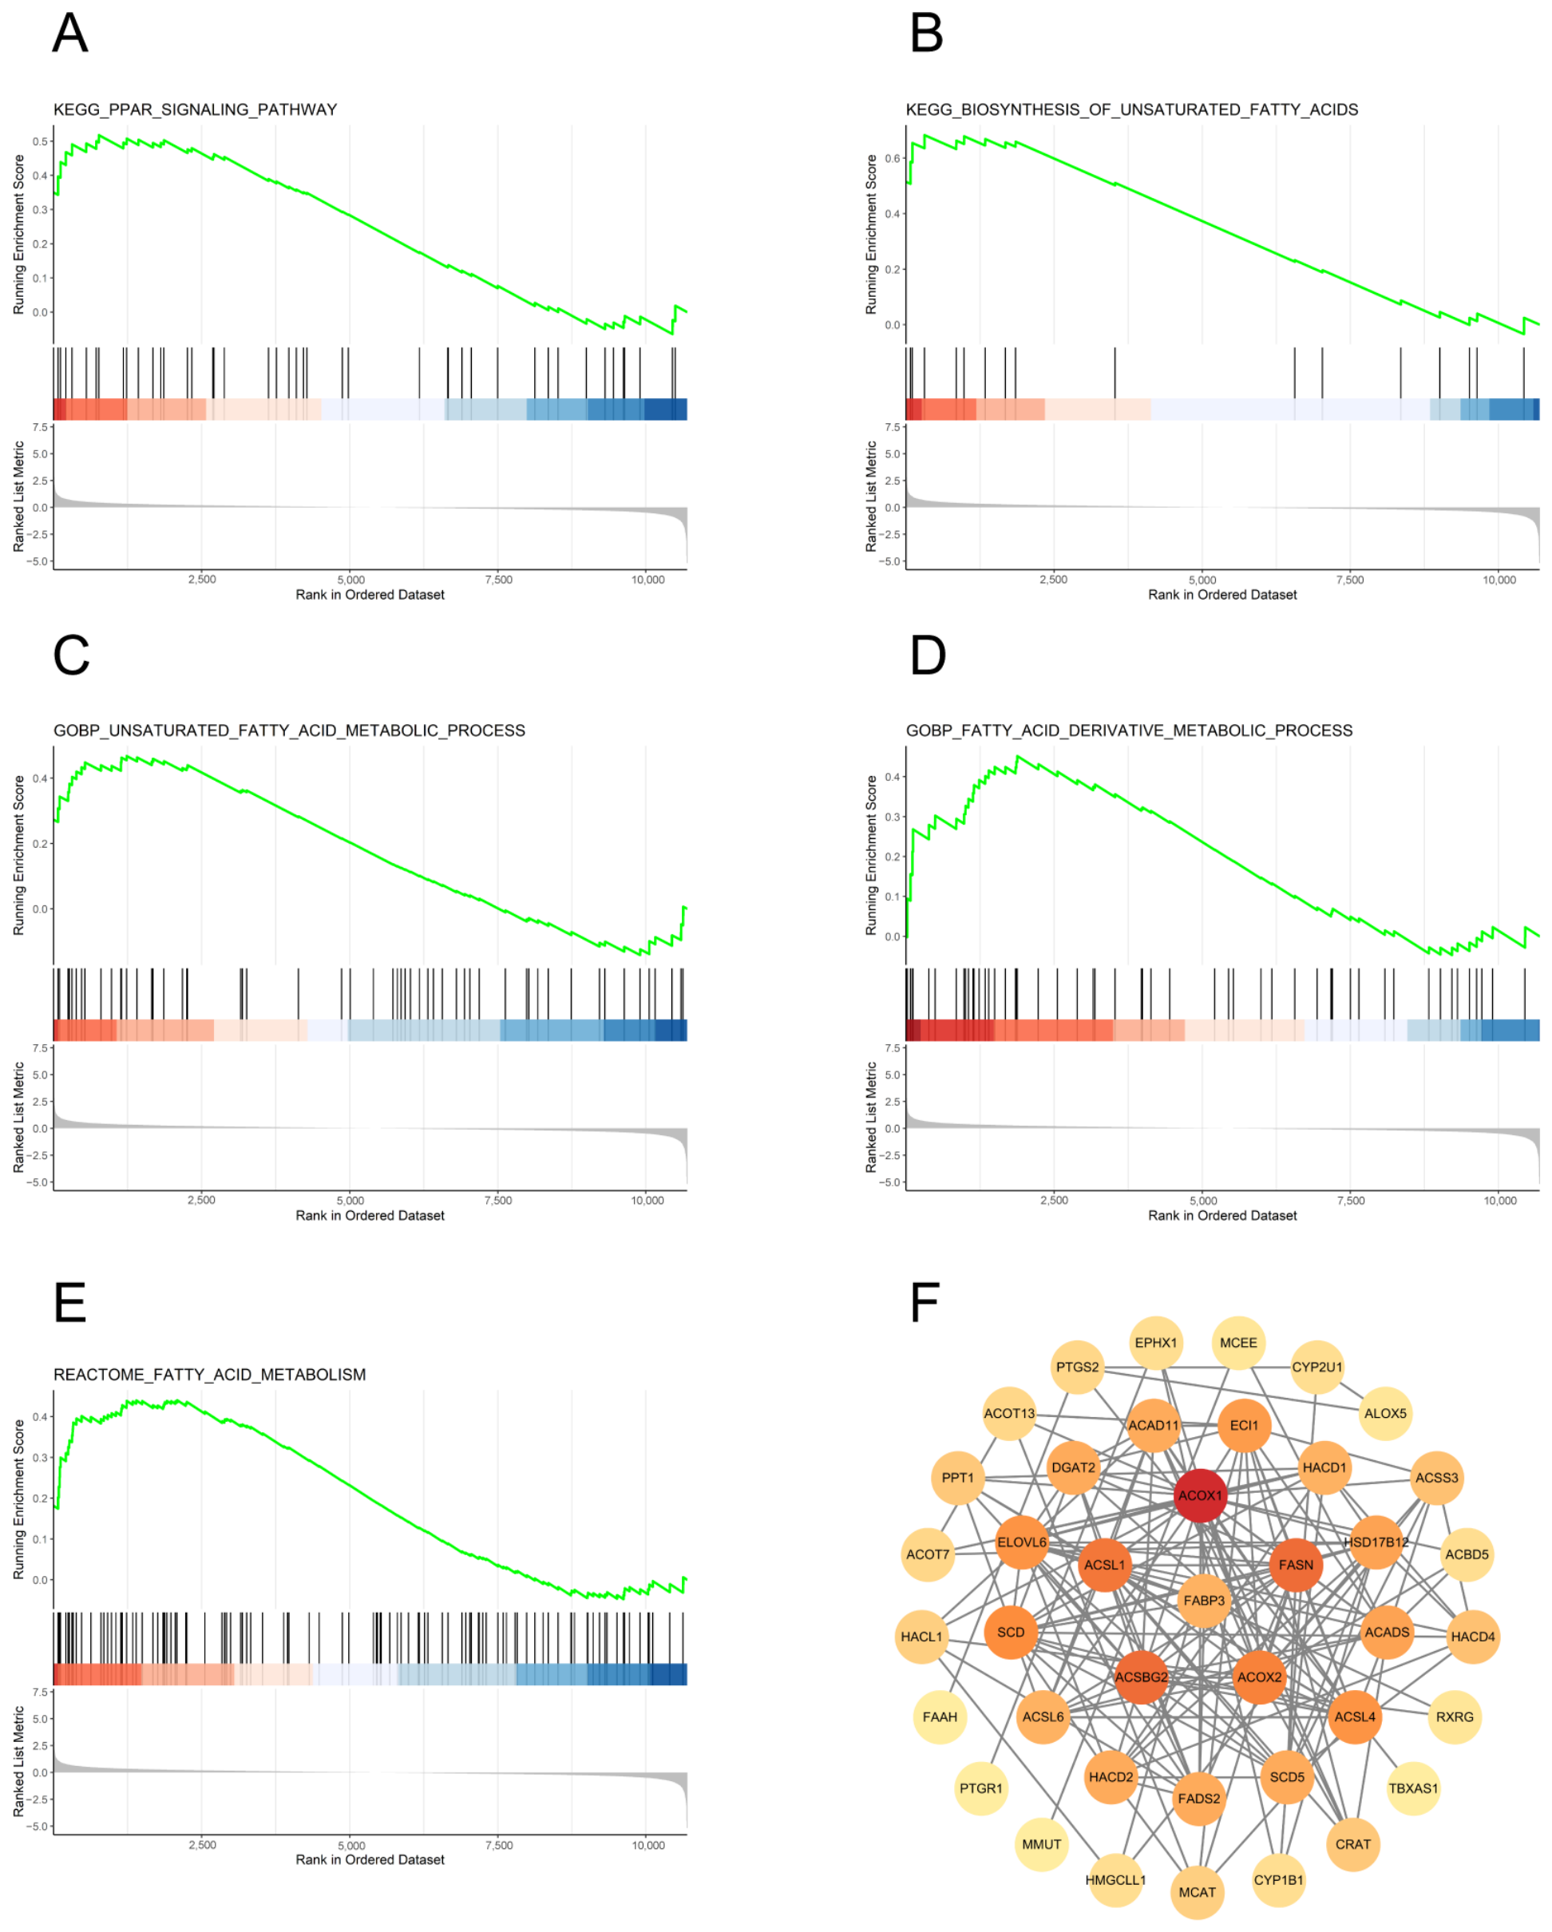
GSEA returned 372 significantly enriched gene sets, 19 of which are associated with lipid metabolism (Supporting Information, Table S4). The five gene sets with the lowest p-values—‘fatty acid metabolism’, ‘PPAR signaling pathway’, ‘biosynthesis of unsaturated fatty acids’, ‘unsaturated fatty acid metabolic process’ and ‘fatty acid derivative metabolic process’—were visualized (Figure 3A–E), and genes of interest, such as acyl-CoA synthetase long-chain family member 4 (ACSL4) and FABP3 were identified. A PPI network built from the meta-DEGs of these five gene sets is shown in Figure 3F.
Figure 3.
Enrichment of the five foremost lipid metabolism gene sets and the PPI network derived from them. (A–E): gene set enrichment analysis (GSEA) plots for the five gene sets most strongly upregulated in relation to lipid metabolism. Genes are colored in red for upregulation and blue for downregulation. (F): PPI network built from the GSEA-enriched pathways, showing how significant the participating lipid-metabolism genes are. Darker nodes mark greater significance.
2.4. Consistency, Heterogeneity and Sensitivity of Fatty Acid-Binding Protein 3 (FABP3) Expression Across Datasets
To describe how FABP3 behaves across the four datasets, its log2FC was computed for every individual comparison (Supporting Information, Table S6). Upregulation in the fat-line/HF groups was seen consistently: log2FC = +0.60 (GSE42980), +0.46 (GSE49121), +0.33 (GSE104039) and +0.44 (GSE104038). The corresponding back-calculated SEs were 0.0846, 0.0927, 0.0827 and 0.1879. Heterogeneity between datasets was moderate and did not reach significance (Cochran’s Q = 5.43, df = 3, p = 0.14; I2 = 44.76%; τ2 = 0.008) (Supporting Information, Table S7), indicating that the differences among datasets, while present, were too small to be statistically meaningful and left the consistency of FABP3 upregulation intact. Pooling under a fixed-effect model afforded log2FC = +0.46 (95% CI: 0.37–0.55; p = 1.2 × 10⁻²¹); under a random-effects (DerSimonian–Laird) model, the pooled log2FC was again +0.46 (95% CI: 0.33–0.59; p = 1.3 × 10⁻¹¹), confirming that FABP3 is robustly and significantly upregulated. In the Supporting Information, Figure S1 presents the forest plot of FABP3 across the four datasets. In the leave-one-out sensitivity analysis, dropping any single dataset left pooled log2FC values between +0.39 and +0.53, and restricting the analysis to adipose tissue (that is, omitting the hepatic series GSE104038) yielded a pooled log2FC of +0.46 (95% CI 0.30–0.62) (Supporting Information, Table S8).
These results demonstrate that no single dataset or tissue drove the pooled estimate. To prioritize among the recurrently enriched lipid-metabolism genes, we applied three additional criteria: presence in all four datasets with an adaptive weight of 1, nominal significance (p < 0.05) in every dataset, and consistent direction of change across datasets. Eleven meta-DEGs were recurrently enriched across KEGG, GO and GSEA, including FABP3, SCD, ACSL4, ELOVL6, ACOX2, HACD1 and HACD2. Of these, only FABP3, HACD2 and ACSL4 satisfied all three criteria. Among the three shortlisted genes, FABP3 showed the strongest combined evidence (AW-Fisher p = 3.2 × 10⁻¹⁹; HACD2, 5.5 × 10⁻¹⁹; ACSL4, 1.5 × 10⁻⁹), occupied a central fatty-acid transport/chaperone node upstream of PPAR signaling, and lacked prior functional characterization in poultry. These criteria are detailed in the Supporting Information, Table S6, and explain why FABP3 was selected over SCD and other candidates.
2.5. FABP3 Stimulates Proliferation of Primary Chicken Preadipocytes
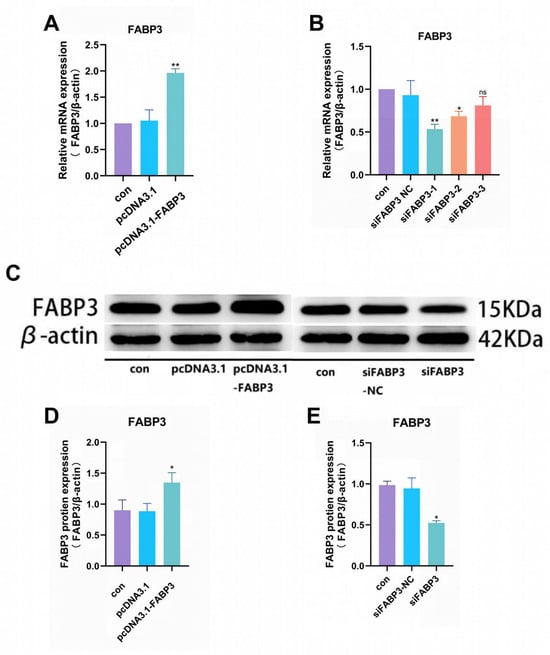
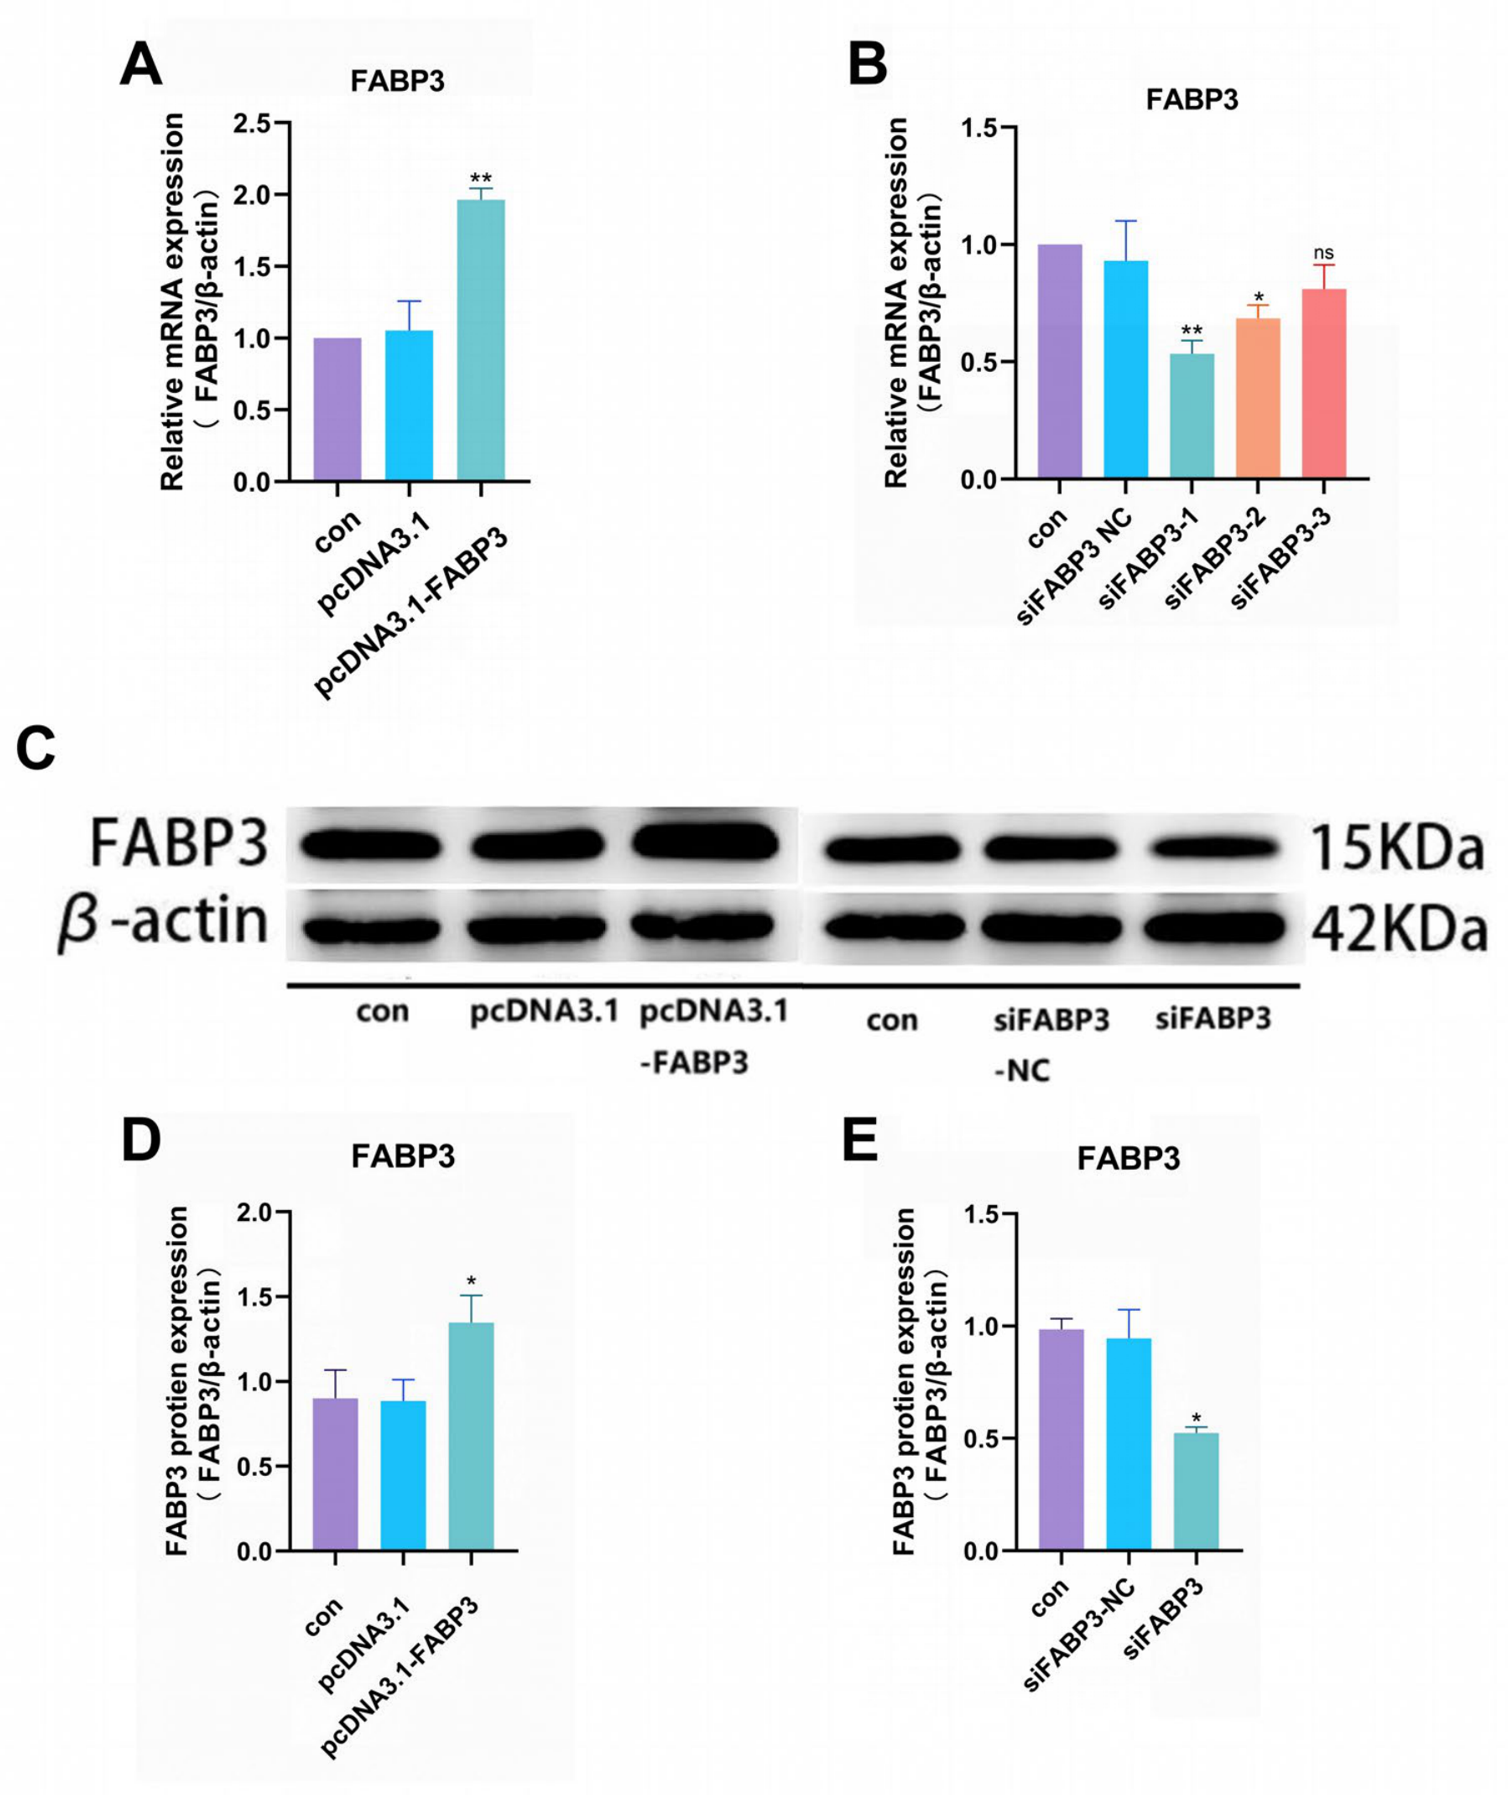
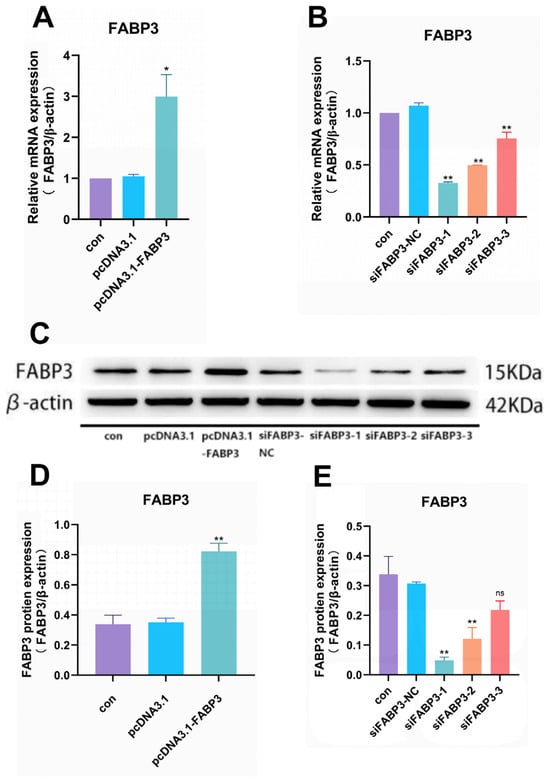
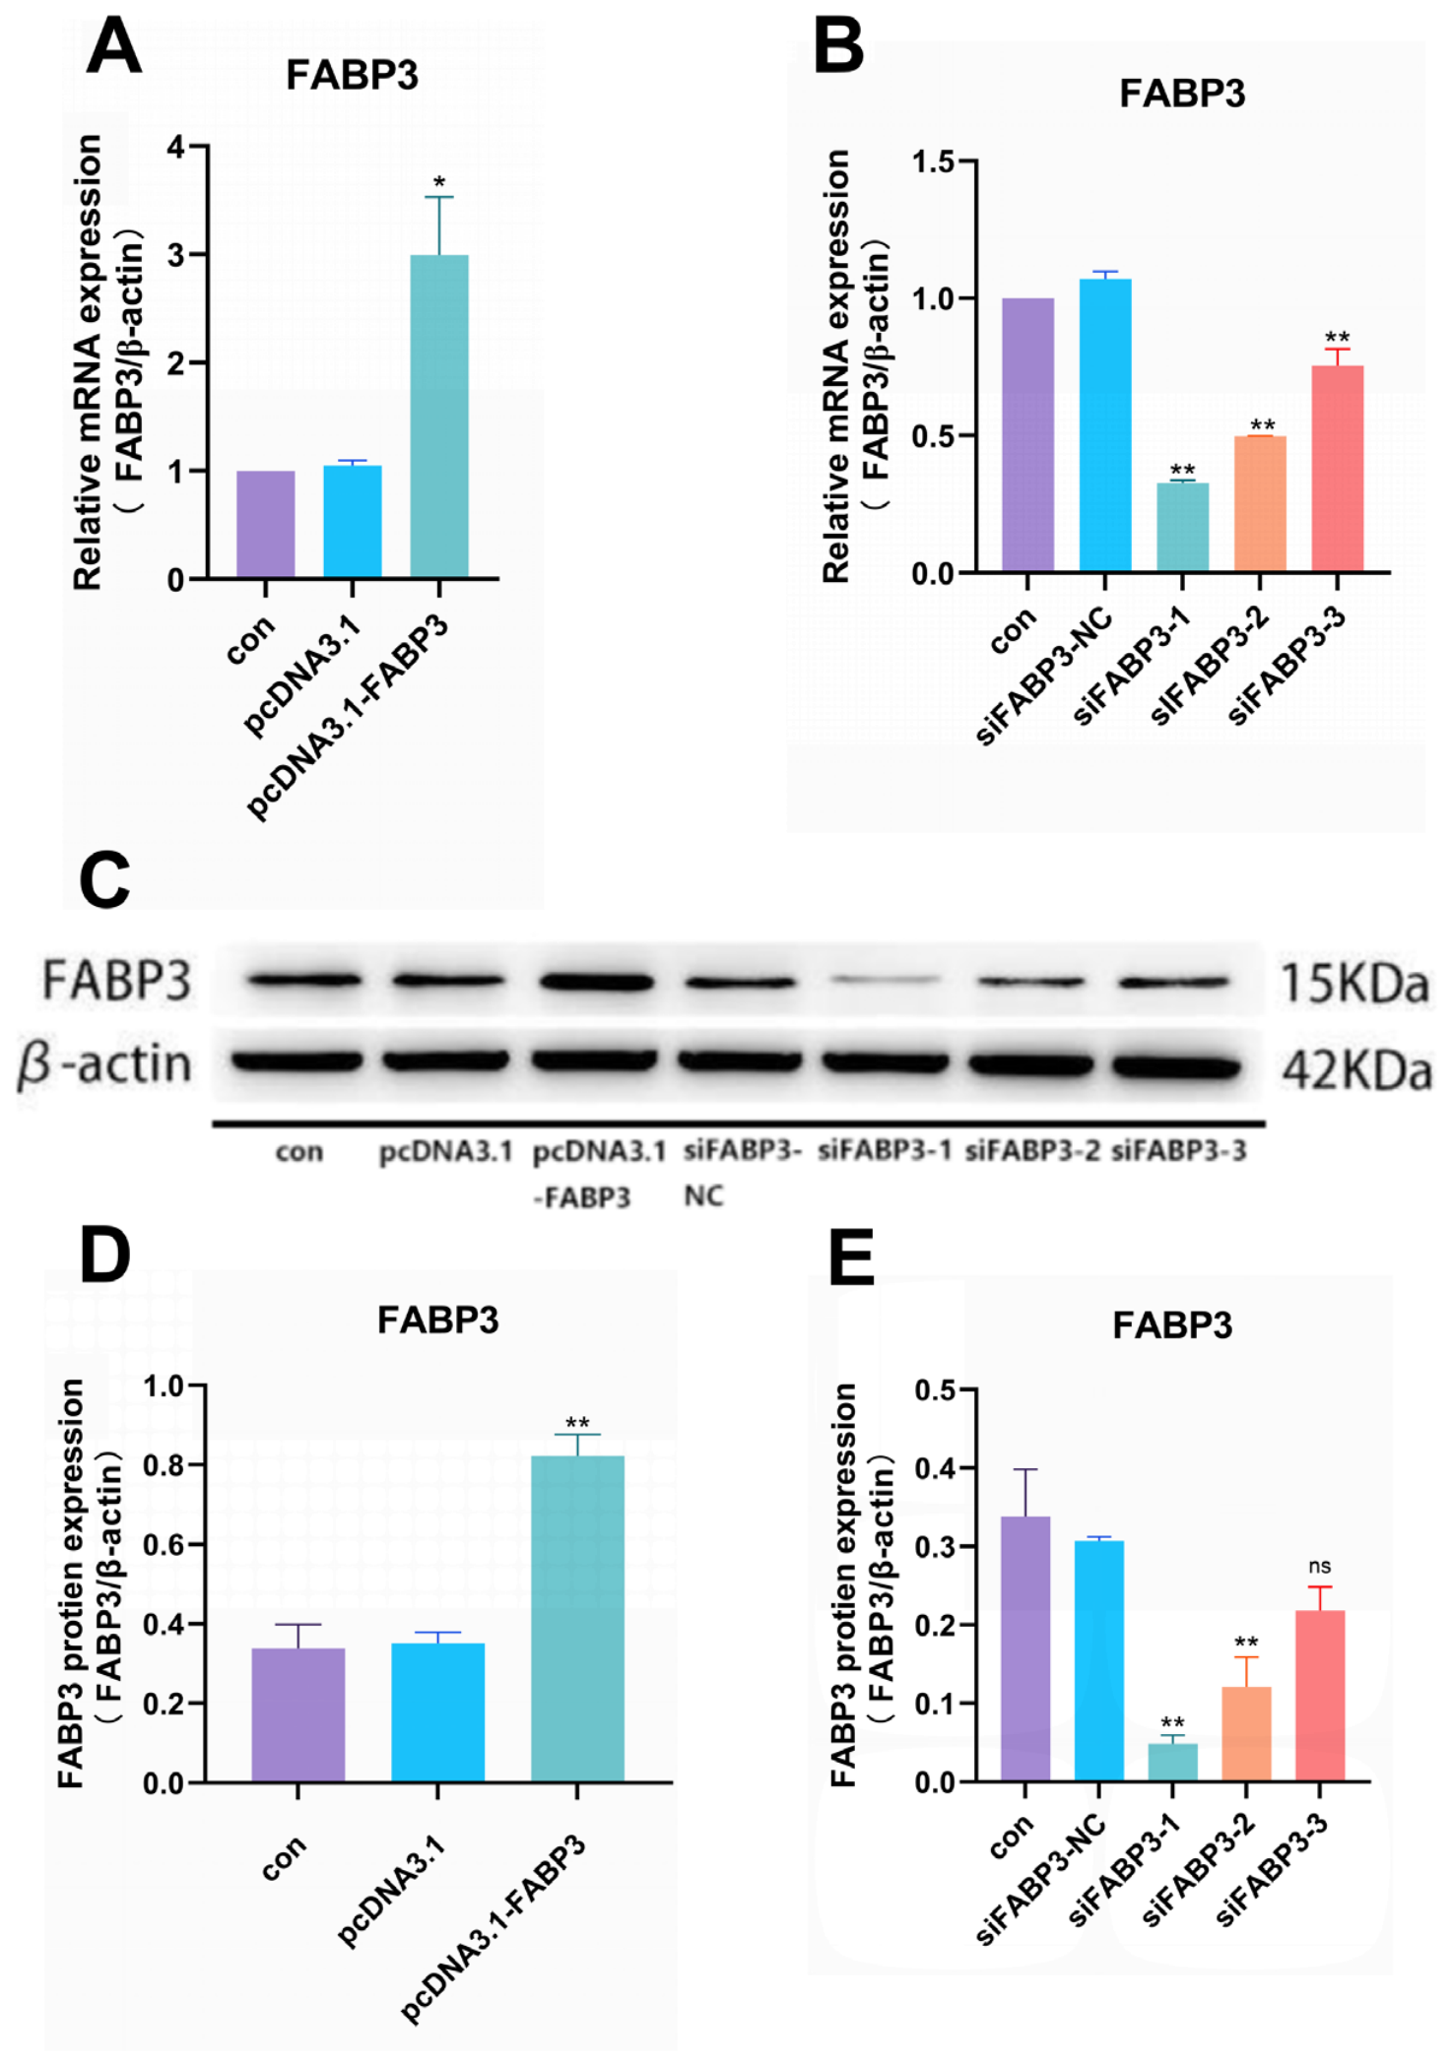
qPCR showed that cells receiving pcDNA3.1-FABP3 contained markedly more FABP3 transcript than the control (con) or empty overexpression vector (pcDNA3.1) cells (p < 0.01; Figure 4A). Conversely, FABP3 mRNA fell below con and siFABP3-NC levels in each of the three knockdown groups, the reduction reaching significance for siFABP3-1 (p < 0.01) and siFABP3-2 (p < 0.05) but not for siFABP3-3 (ns; Figure 4B).
Figure 4.
FABP3 transfection efficiency in primary chicken preadipocytes. (A): FABP3 mRNA quantified in FABP3-overexpressing cells, expressed relative to β-actin. (B): FABP3 mRNA quantified in FABP3-silenced cells, expressed relative to β-actin. (C): detection of FABP3 protein by Western blot (WB). (D): FABP3 protein quantified in FABP3-overexpressing cells, normalized to the β-actin (42 kDa) loading control. (E): FABP3 protein quantified in FABP3-silenced cells, likewise normalized to β-actin. Three replicates were run per experiment (n = 3). Asterisks: * p < 0.05, ** p < 0.01; ns, not significant.
Western blotting reproduced this pattern at the protein level: FABP3 abundance rose in pcDNA3.1-FABP3-transfected cells relative to con and pcDNA3.1 (p < 0.05; Figure 4C,D), and fell in siFABP3 cells compared with con and siFABP3-NC (p < 0.05; Figure 4C,E). The siFABP3-1 exhibited the highest knockdown efficiency among the three screened siRNA sequences, and was therefore used for all subsequent loss-of-function experiments, including the pathway-intervention assays. These results confirmed the successful establishment of siFABP3 and pcDNA3.1-FABP3 models, providing a foundation for subsequent experiments.
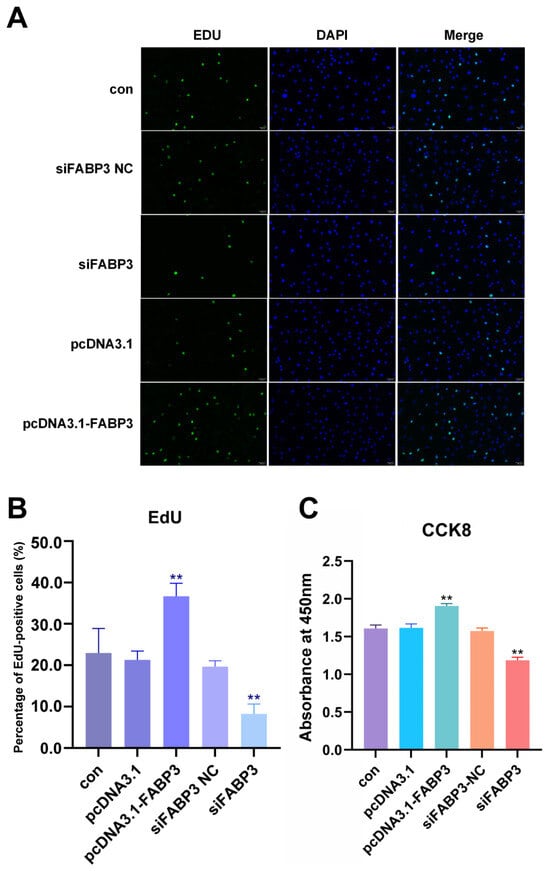
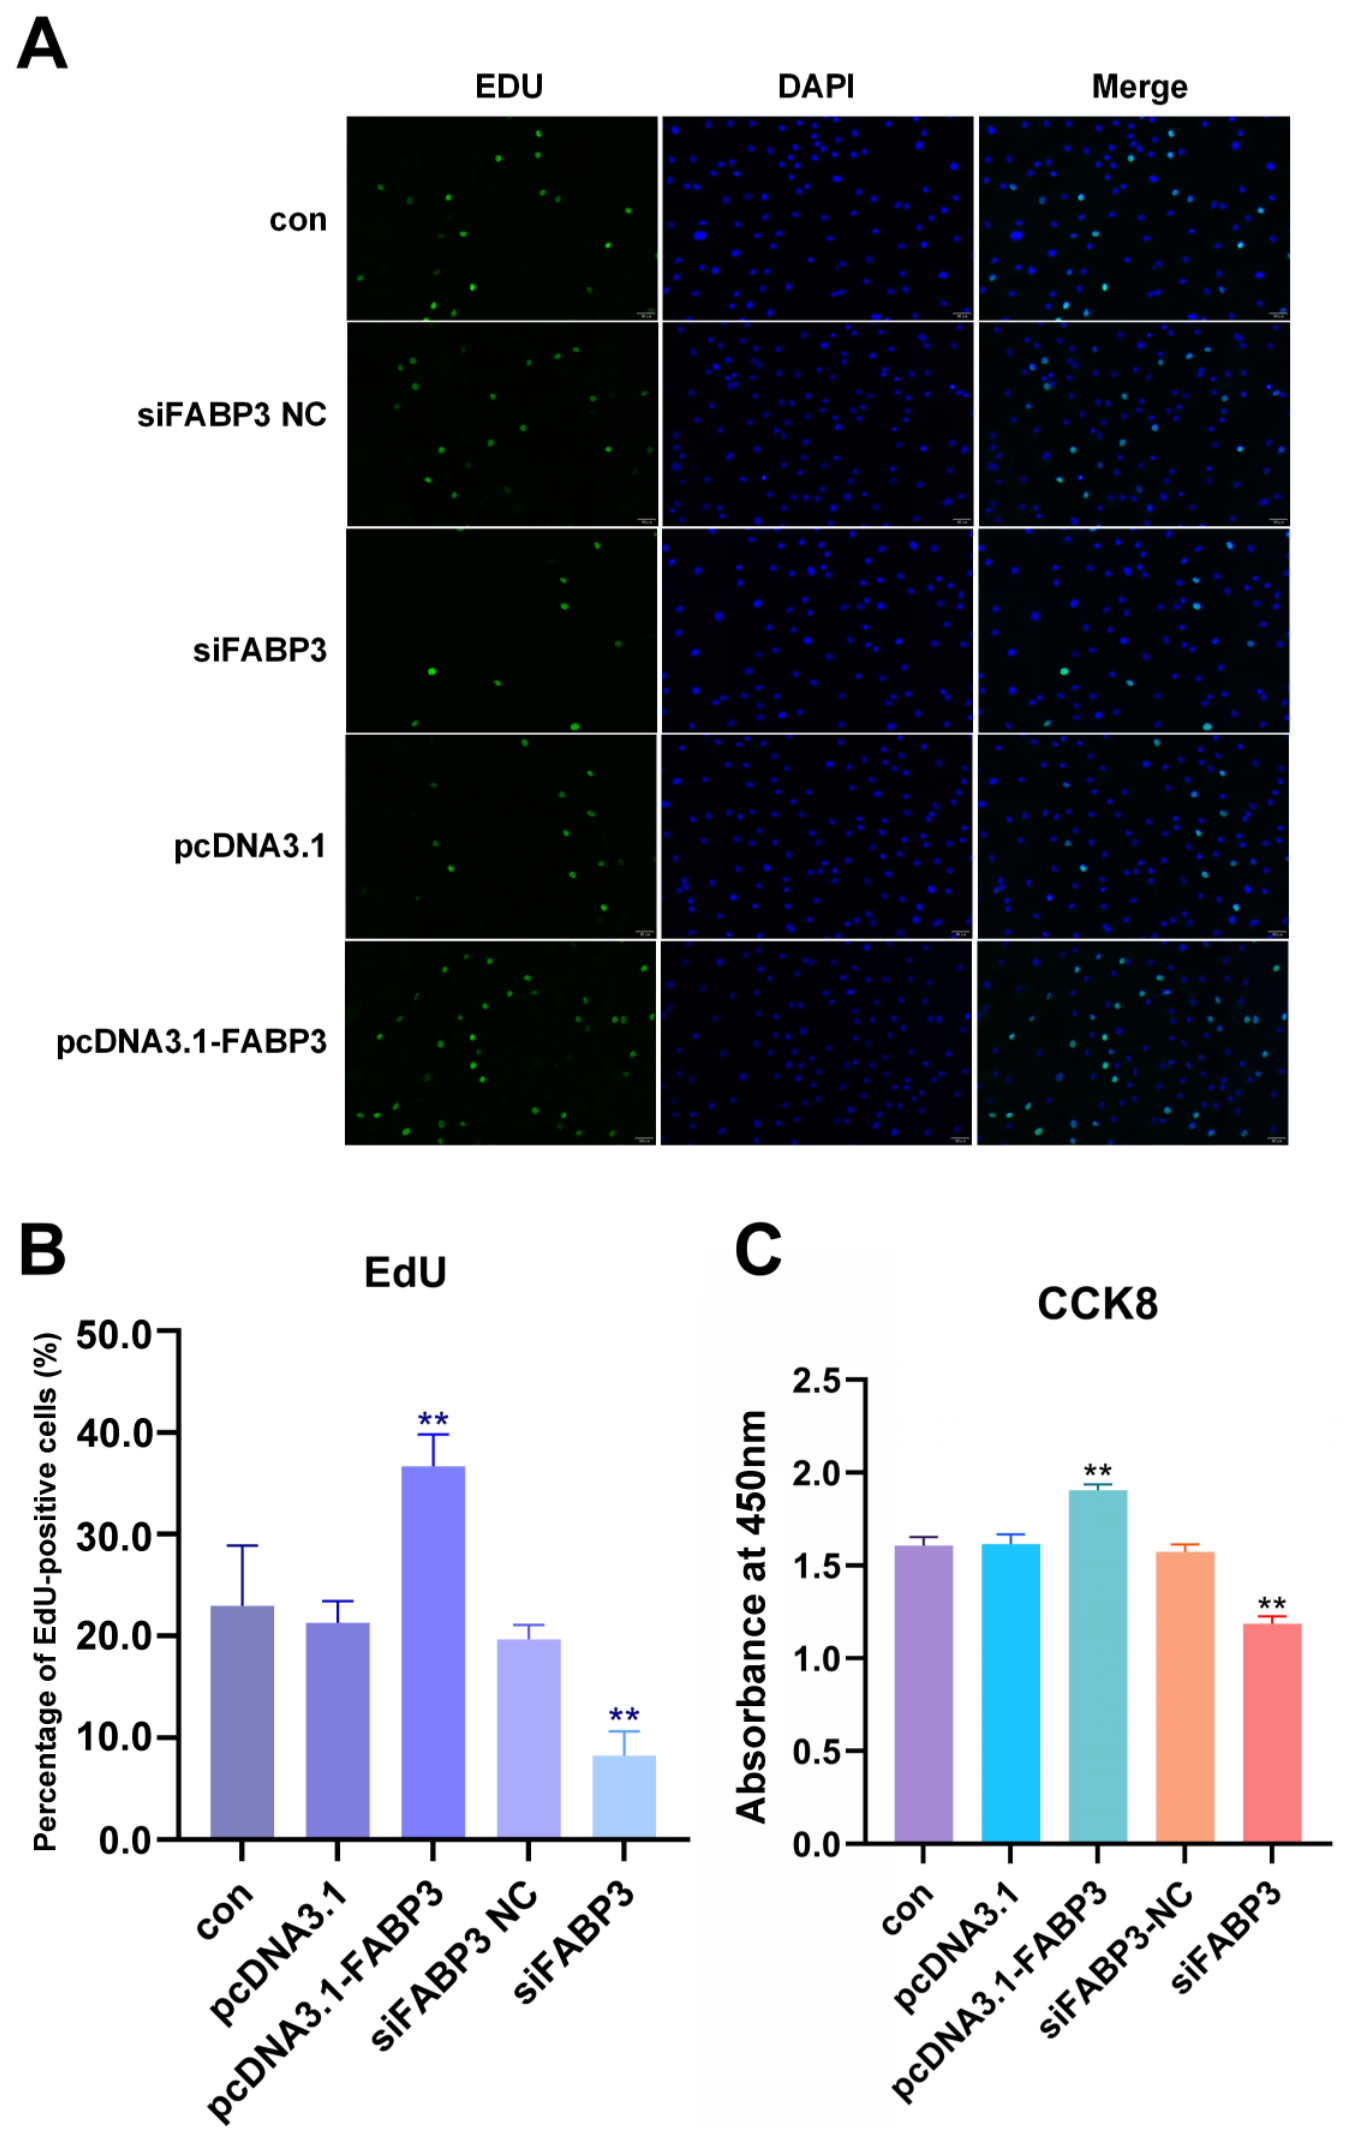
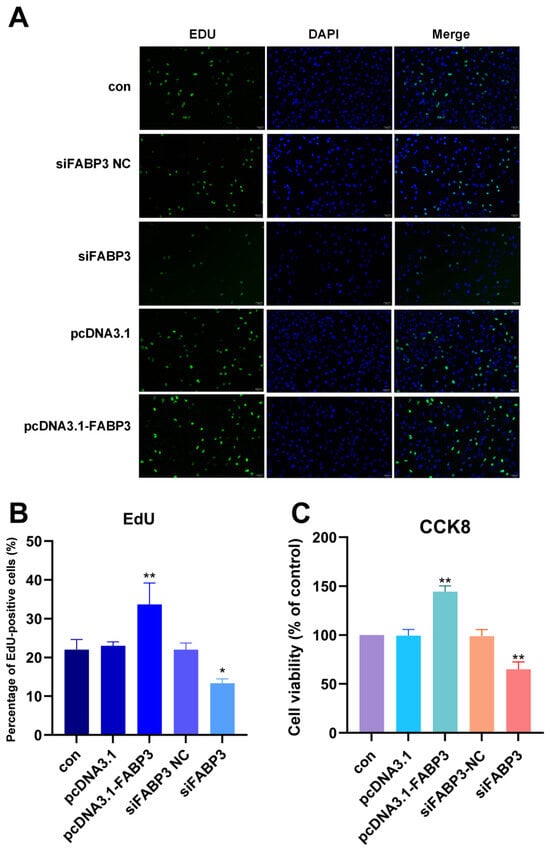
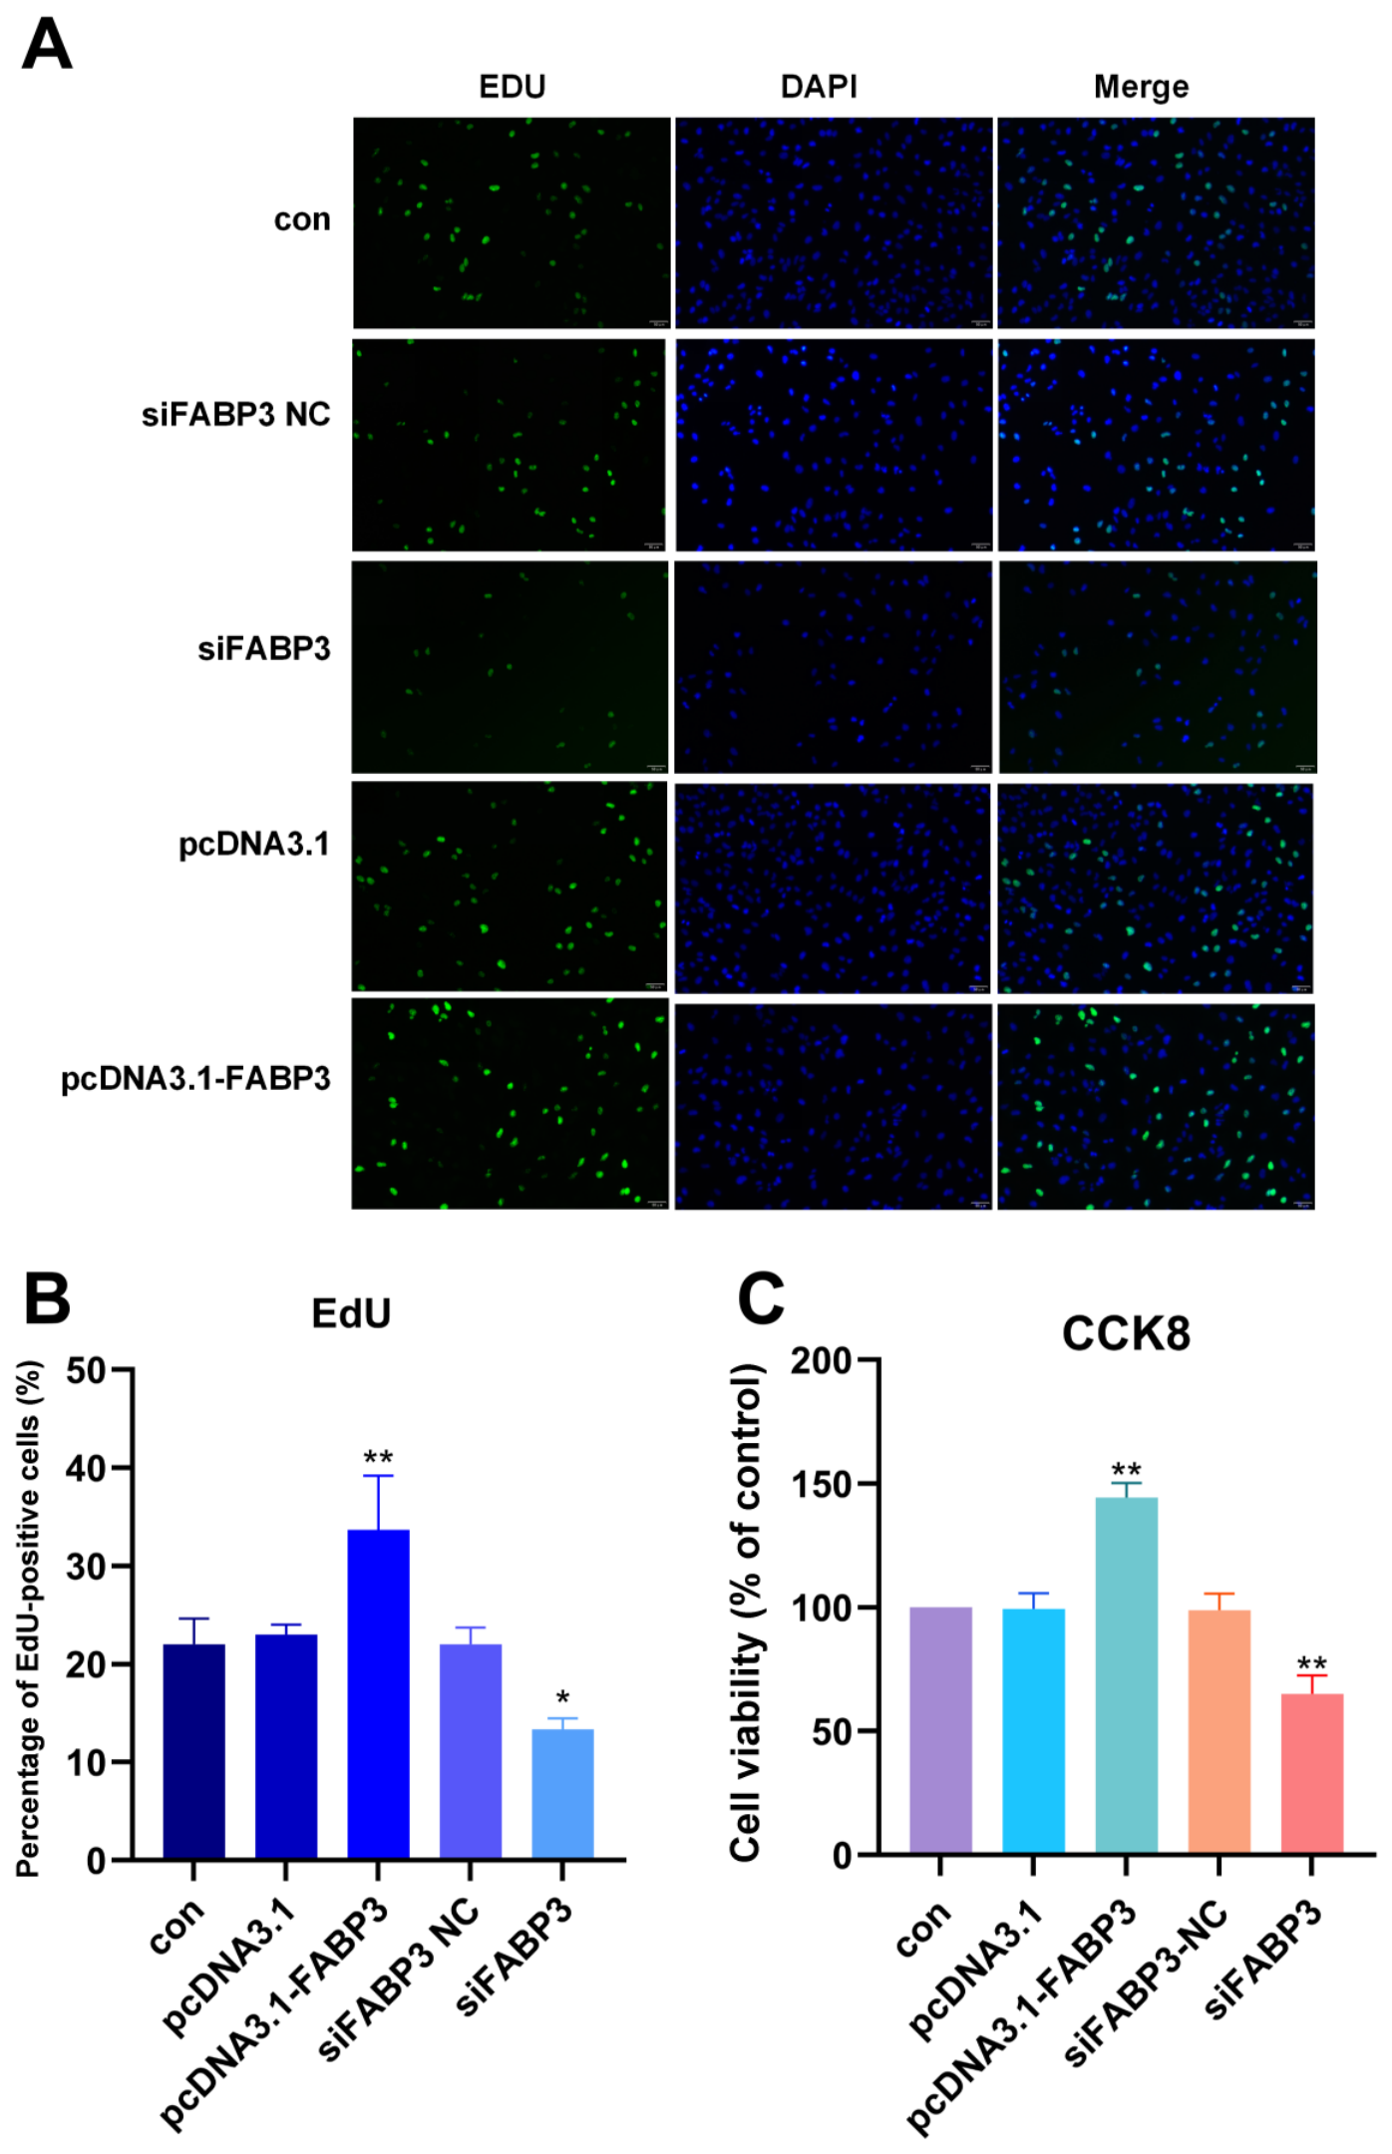
EdU labeling identified a larger proportion of proliferating cells after FABP3 overexpression than in either the con or the pcDNA3.1 group, whereas siFABP3 reduced that proportion below the levels seen in con and siFABP3-NC cells (p < 0.01 for both comparisons; Figure 5A,B). Consistent with this, the CCK-8 assay recorded higher viability at 72 h in pcDNA3.1-FABP3 cells (blank-corrected absorbance above 1.8) and lower viability in siFABP3 cells, each relative to its own controls (p < 0.01 in both cases; Figure 5C).
Figure 5.
FABP3 and the proliferation of primary chicken preadipocytes. (A): EdU/DAPI immunofluorescence staining of primary chicken preadipocytes, with proliferating nuclei clearly labeled (scale bar = 50 μm). (B): percentage of EdU-positive cells (%). (C): proliferative activity of primary chicken preadipocytes at 72 h measured by the CCK-8 assay and expressed as absorbance (OD450). The dataset rests on three biological replicates (n = 3). CCK-8 readings were averaged across the six technical wells of each group within a replicate before statistical analysis. EdU positivity came from three randomly chosen fields per coverslip. Significance: ** p < 0.01.
2.6. FABP3 Promotes Adipogenesis in Chicken Adipocytes
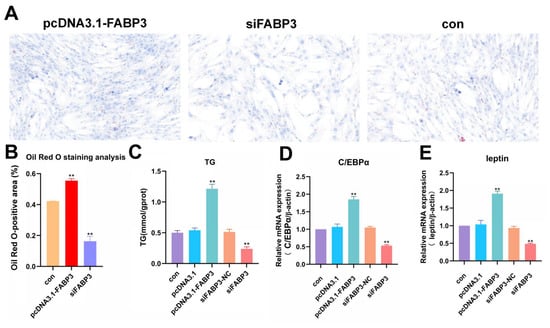
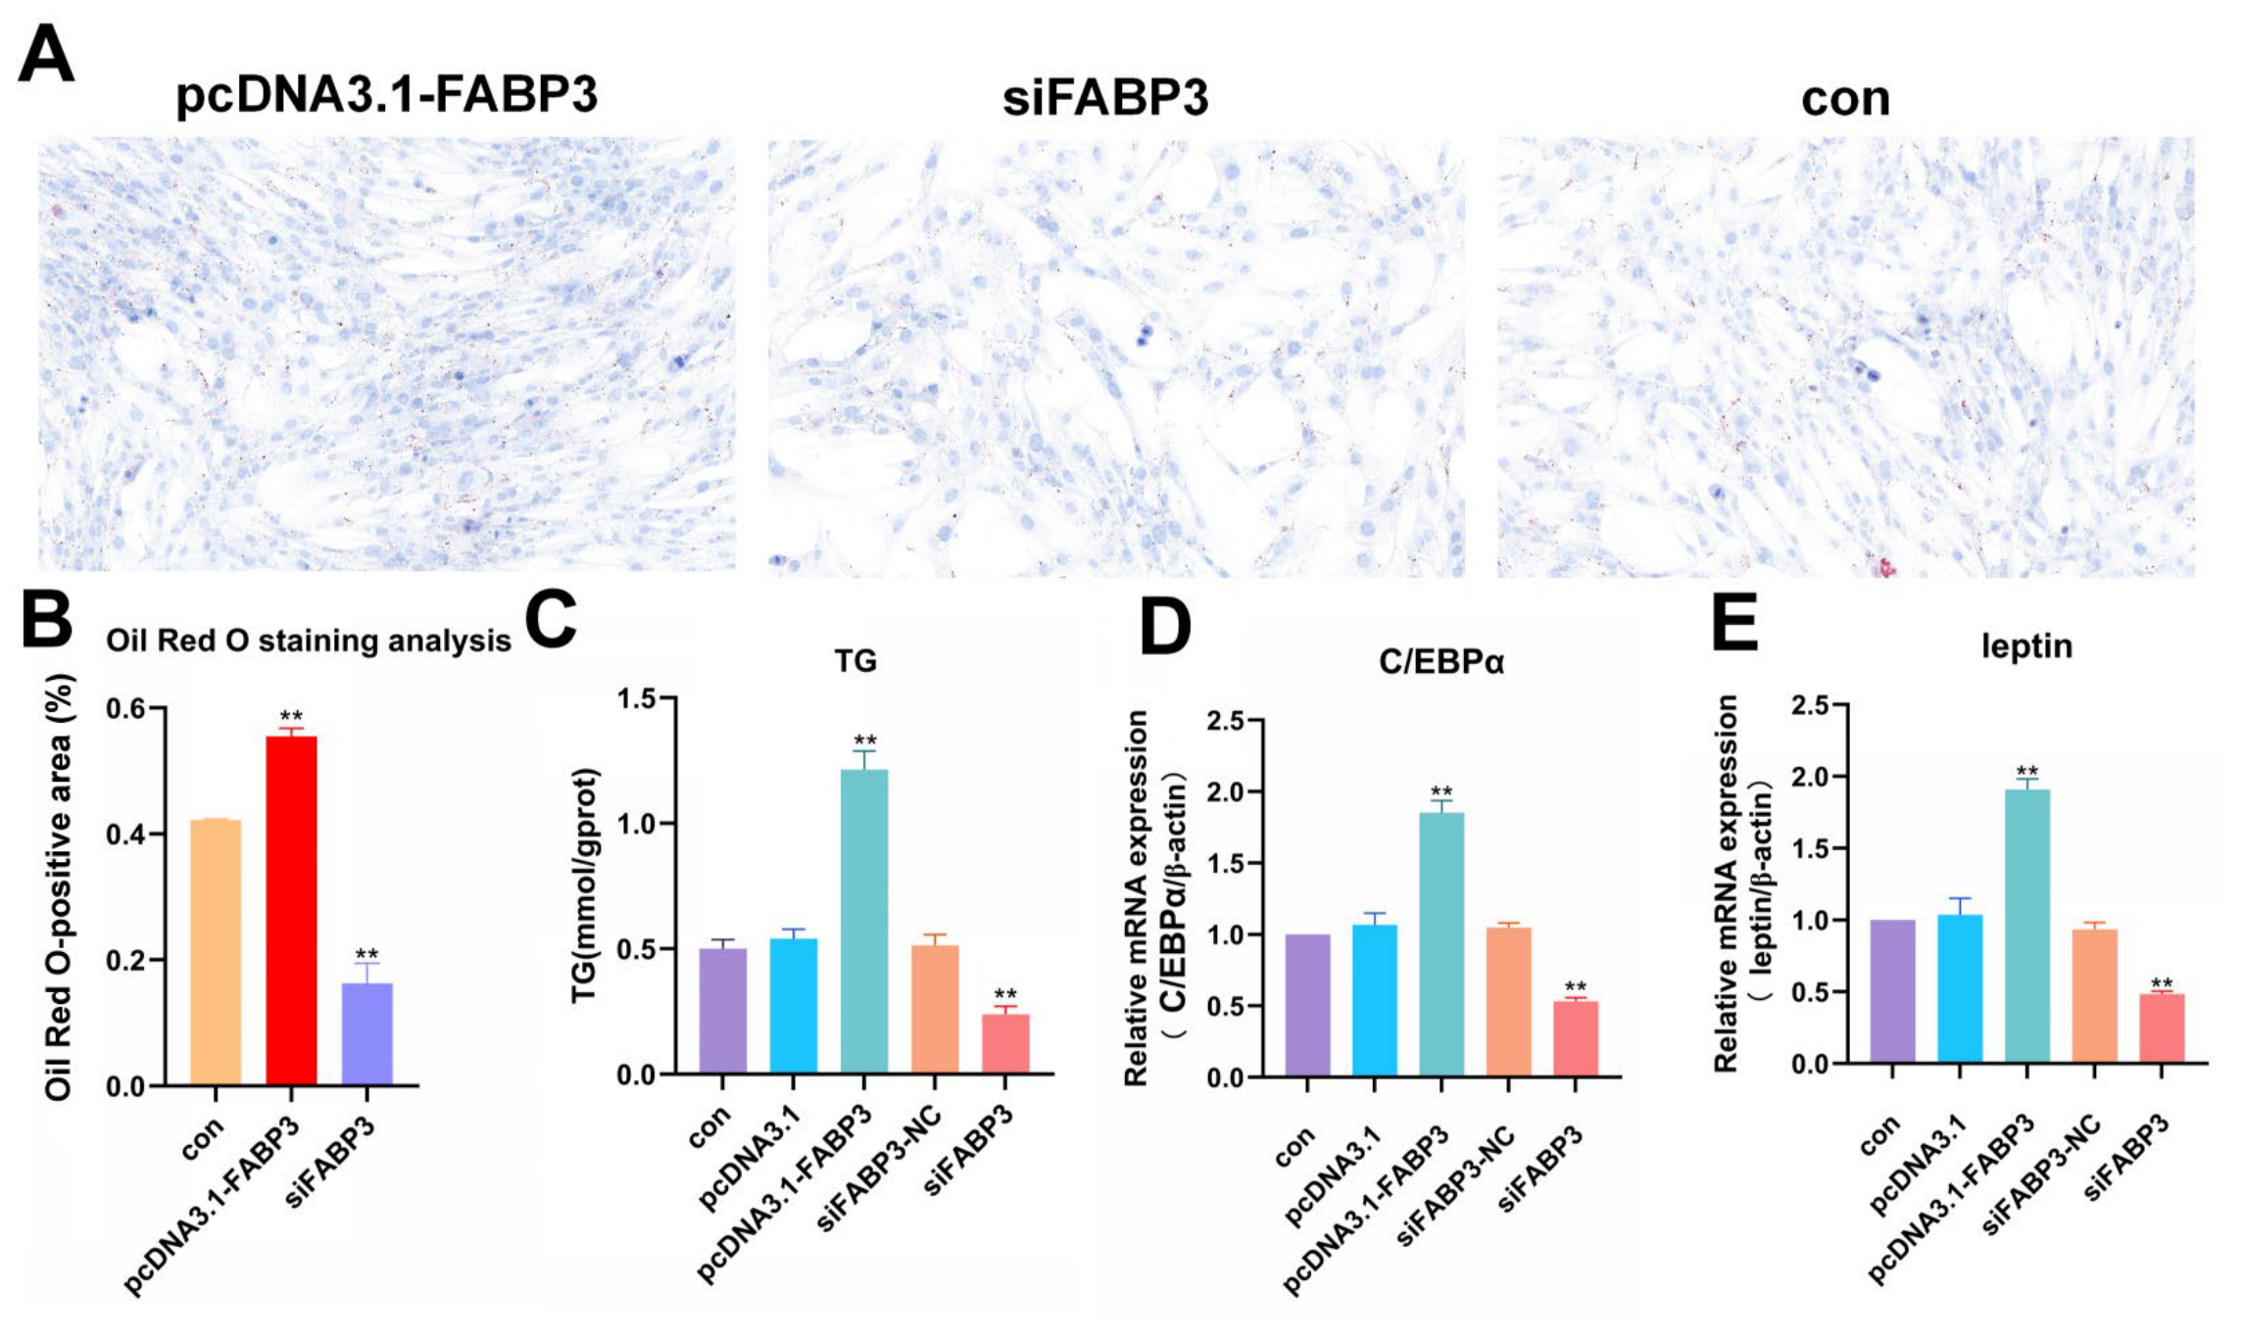
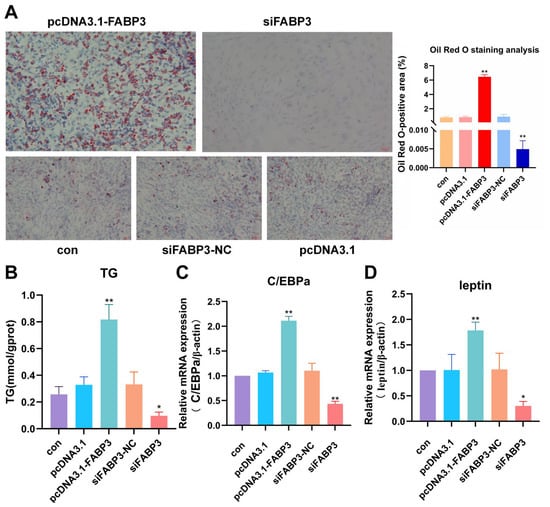
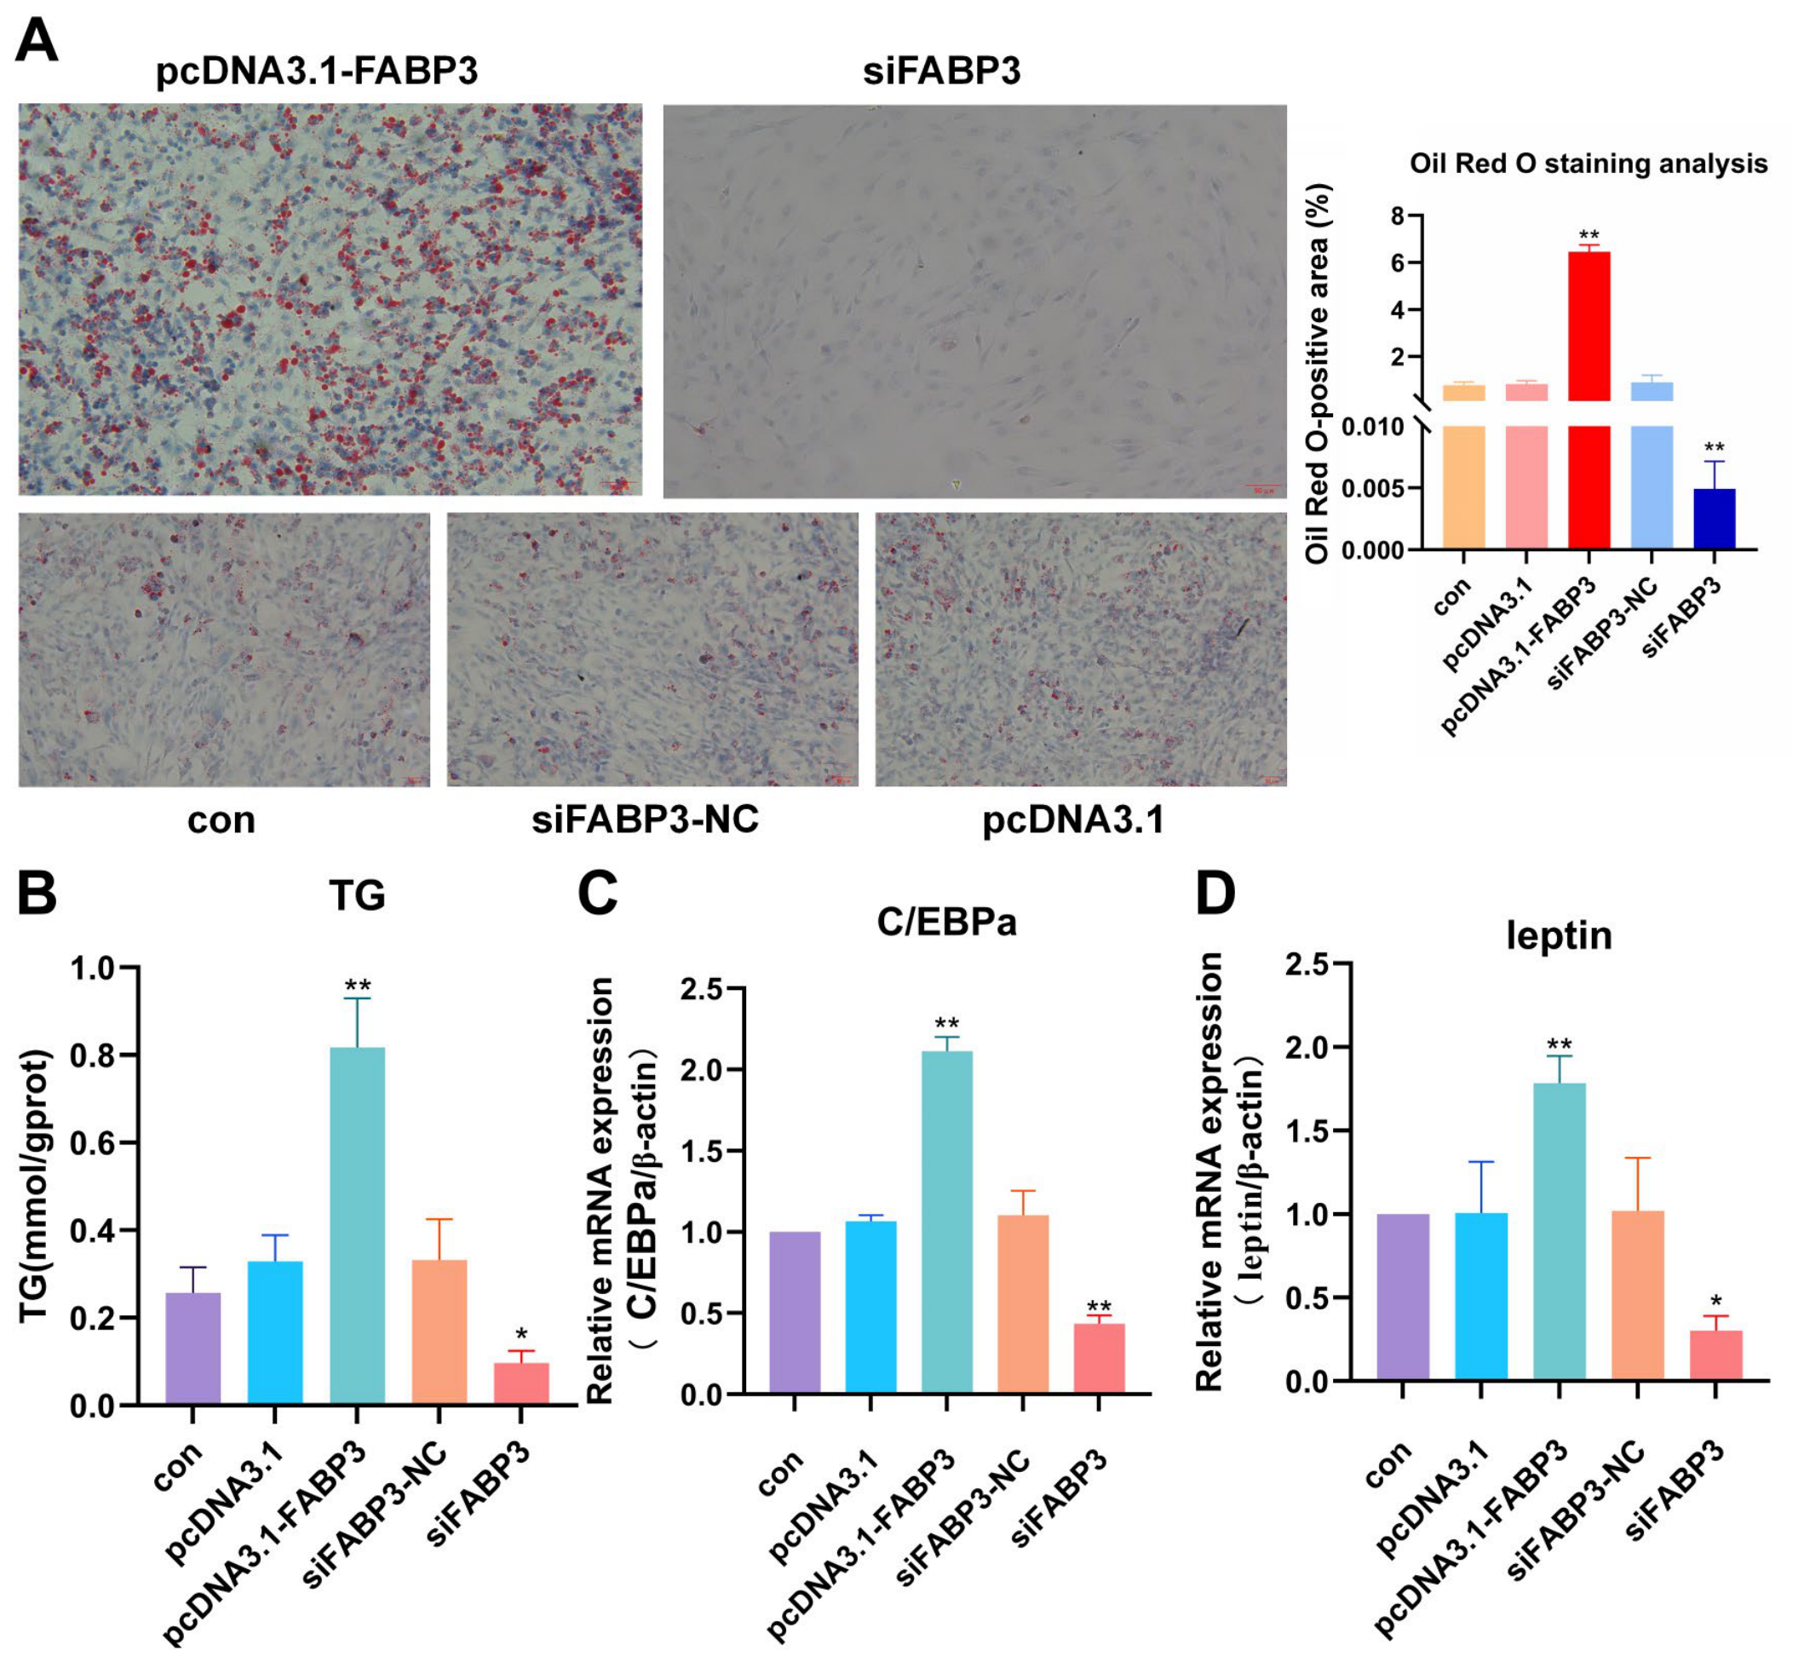
At 96 h of differentiation, Oil Red O staining covered a significantly greater stained area in pcDNA3.1-FABP3 cells than in con cells, while siFABP3 cells stained far less intensely than con cells at the same time point (p < 0.01 for both; Figure 6A,B). Intracellular triglyceride (TG) content followed the same trajectory, rising above con and pcDNA3.1 levels upon FABP3 overexpression (p < 0.01; Figure 6C) and falling below con and siFABP3-NC levels after silencing (p < 0.01; Figure 6C). Transcripts of the adipogenic markers C/EBPα and leptin were likewise elevated by overexpression and depressed by silencing (p < 0.01 throughout; Figure 6D,E).
Figure 6.
Effect of FABP3 on lipid accumulation in primary chicken adipocytes. (A): Oil Red O-stained images showing intracellular lipid droplet accumulation. (B): quantification of Oil Red O staining (% Oil Red O-positive area). (C): measurement of TG content. (D): abundance of the adipogenic transcription factor C/EBPα mRNA, expressed relative to β-actin. (E): leptin mRNA abundance, likewise normalized to β-actin. Three biological replicates underlie the data (n = 3). Probability values are ** p < 0.01.
2.7. FABP3 Promotes Lipid Accumulation via the Peroxisome Proliferator-Activated Receptor (PPAR) Signaling in Primary Chicken Adipocytes
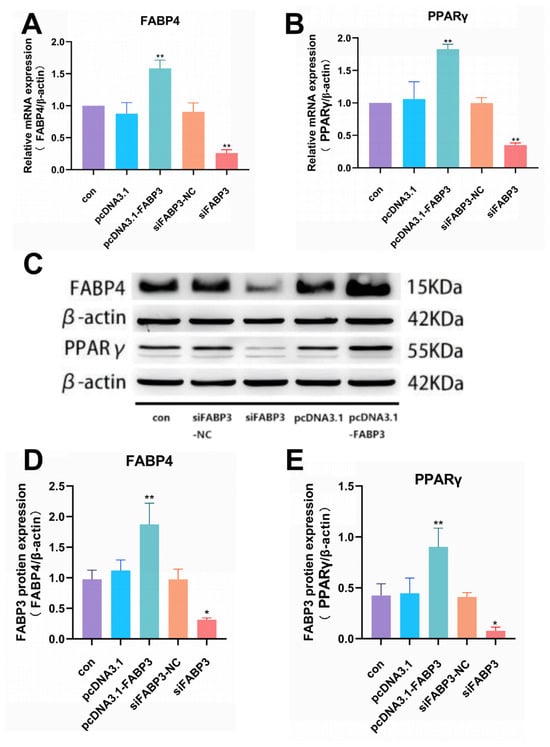
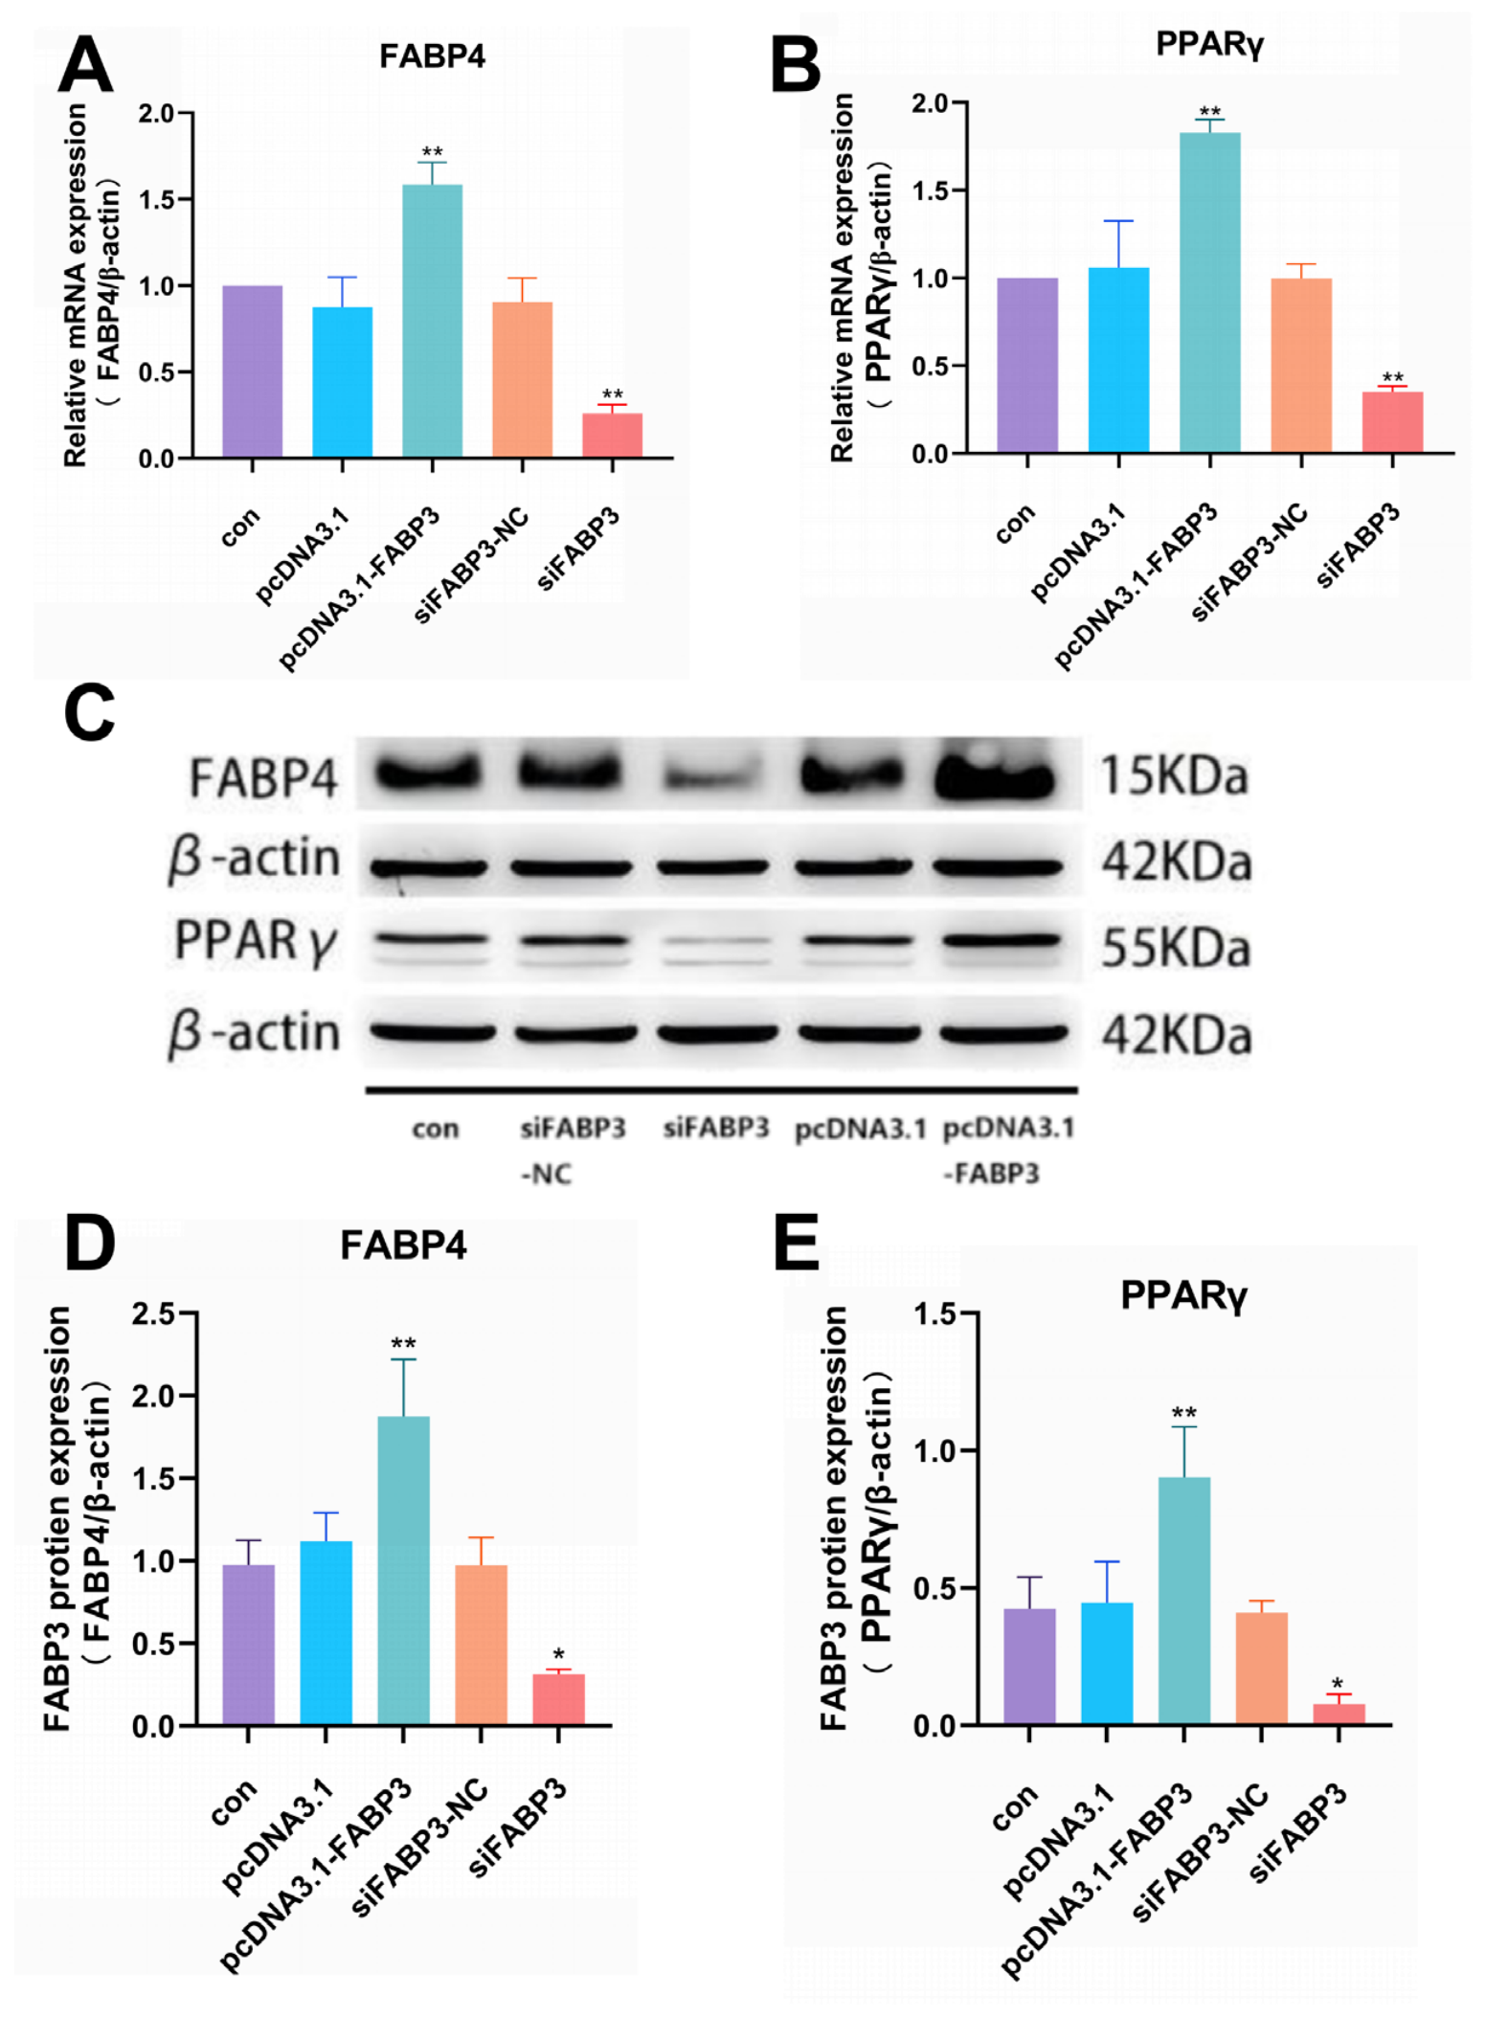
FABP4 and PPARγ transcripts both rose after FABP3 overexpression, the former by p < 0.01 and the latter by p < 0.05 (Figure 7A,B); silencing reversed this, with FABP4 (p < 0.01) and PPARγ (p < 0.05) falling below their control levels (Figure 7A,B). Western blots showed the same direction of change: PPARγ and FABP4 protein were both elevated by pcDNA3.1-FABP3 (p < 0.01 each; Figure 7C–E) and both suppressed by siFABP3 (p < 0.05 each; Figure 7C–E).
Figure 7.
FABP4 and PPARγ expression in primary chicken adipocytes as affected by FABP3. (A): FABP4 mRNA abundance relative to β-actin. (B): PPARγ mRNA abundance relative to β-actin. (C): WB detection of PPARγ and FABP4 protein. (D): relative FABP4 protein level; the β-actin (42 kDa) band provided the loading control. (E): relative PPARγ protein level, with the same loading control. The data come from three independent biological replicates (n = 3). Significance levels are * p < 0.05; ** p < 0.01.
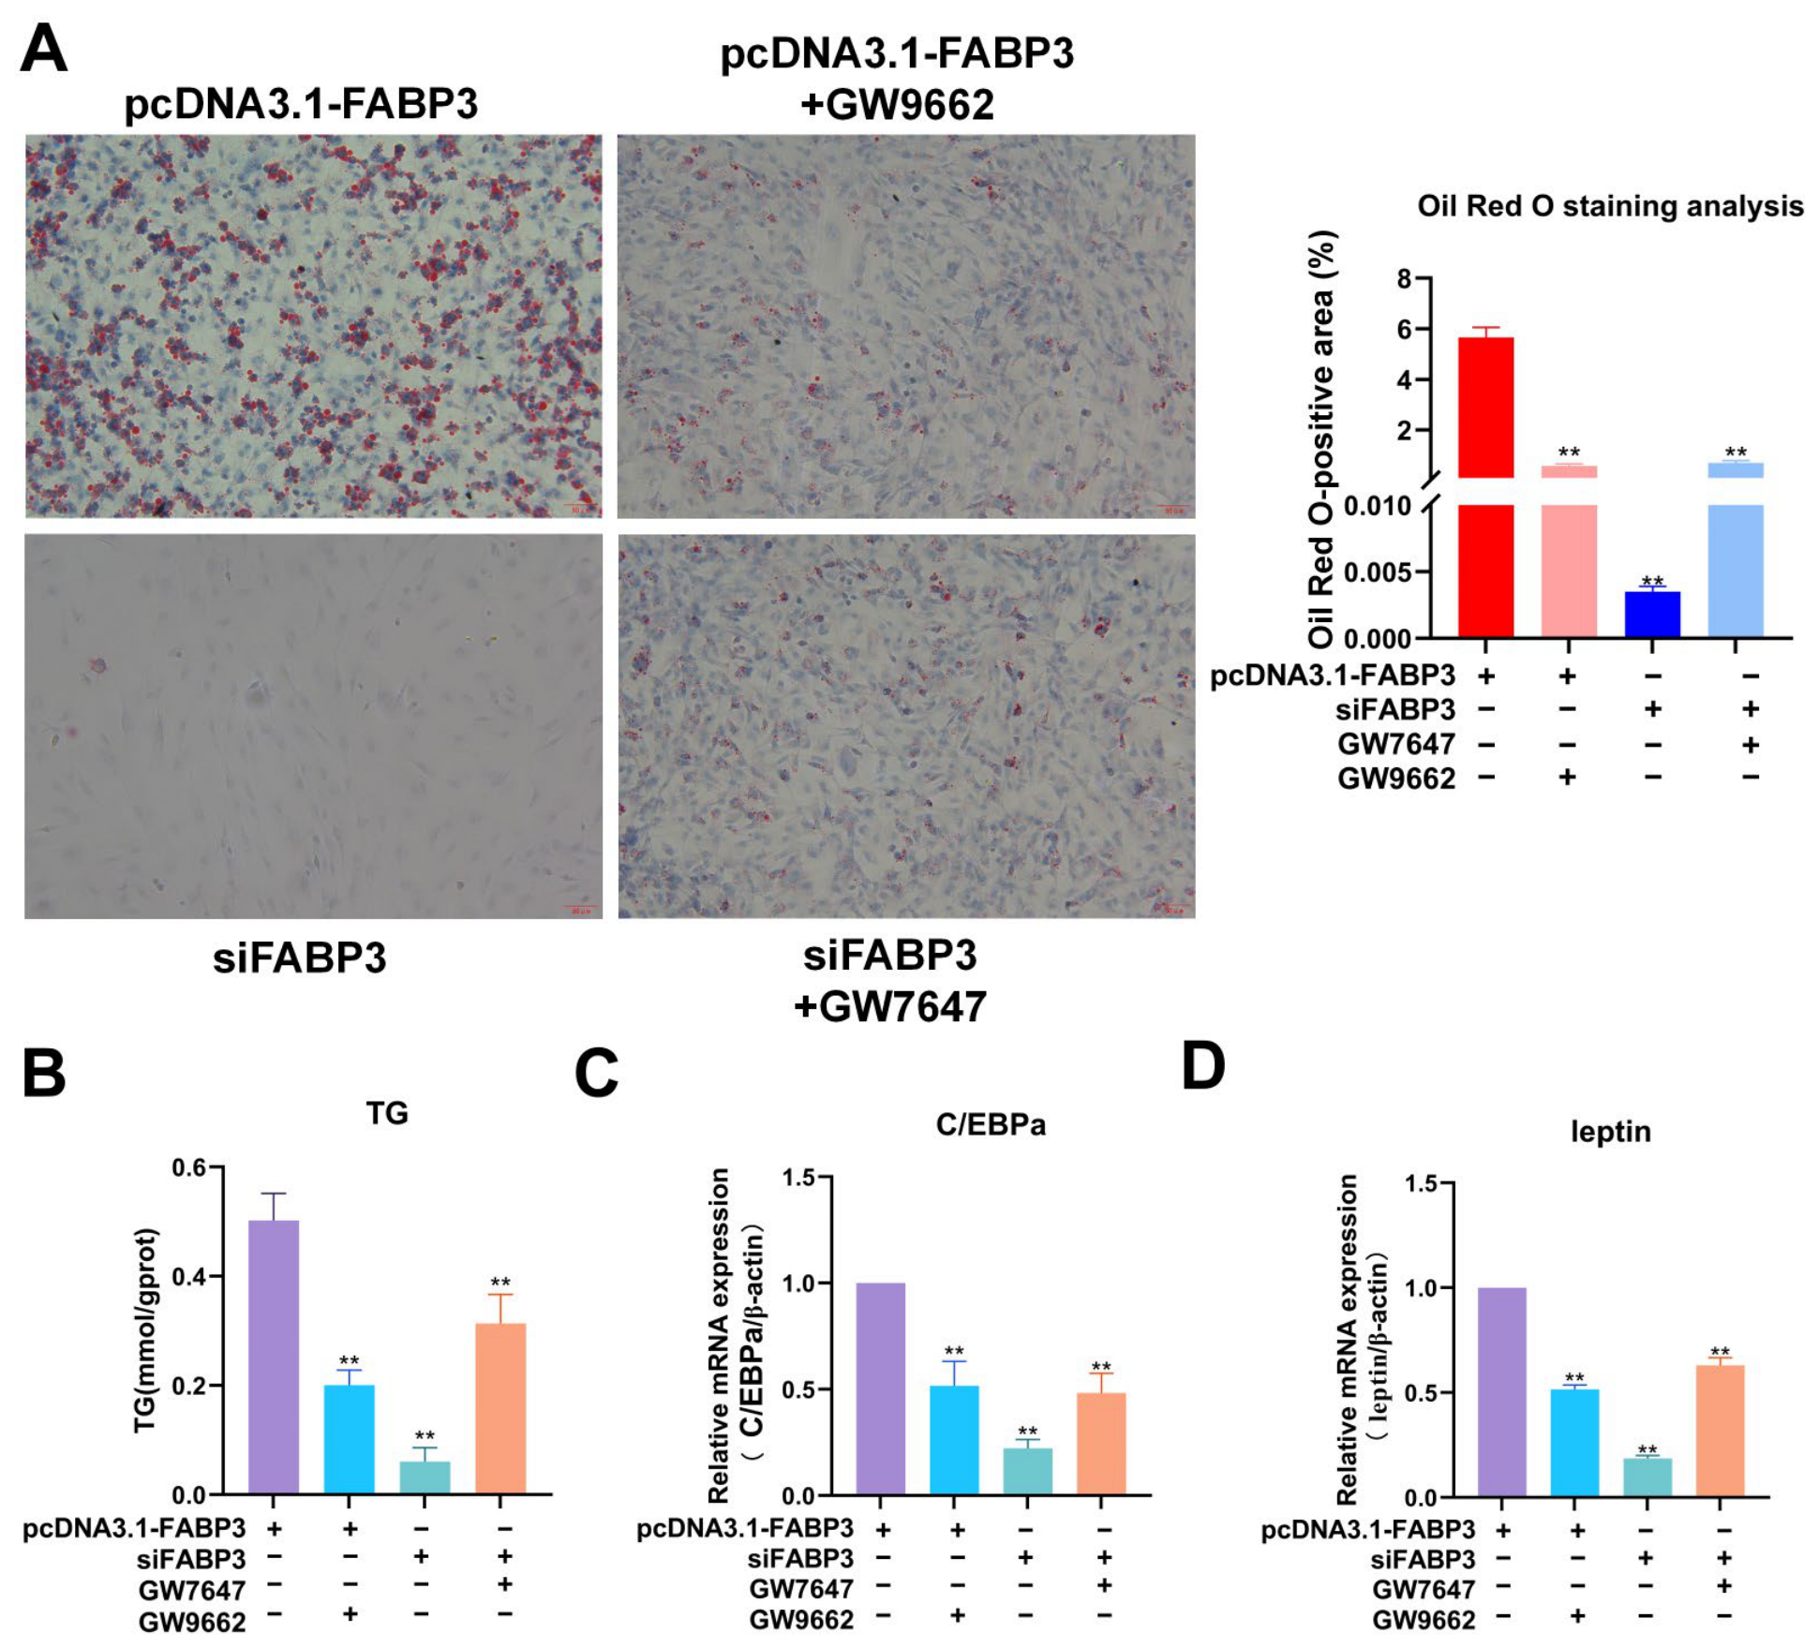
Adding the PPARγ antagonist GW9662 to FABP3-overexpressing cultures curtailed the lipid-positive area at 96 h (p < 0.01; Figure 8A), whereas the PPARα agonist GW7647 enlarged it in FABP3-silenced cultures at the same endpoint (p < 0.01; Figure 8A). GW9662 likewise lowered C/EBPα and leptin transcripts (p < 0.01) and triglyceride (TG) content (p < 0.05) in the overexpression background (Figure 8B–D); conversely, GW7647 raised C/EBPα and leptin mRNA (p < 0.01) and TG content (p < 0.05) in the knockdown background (Figure 8B–D).
Figure 8.
Effect of FABP3 on PPAR signaling pathway intervention-mediated lipid accumulation in primary chicken adipocytes. (A): Oil Red O-stained images of intracellular lipid droplet accumulation at 96 h together with quantification (% Oil Red O-positive area). (B): TG content. (C): C/EBPα mRNA relative to β-actin. (D): leptin mRNA relative to β-actin. Four treatments are compared: pcDNA3.1-FABP3, pcDNA3.1-FABP3 + PPARγ antagonist (GW9662), siFABP3 and siFABP3 + PPARα agonist (GW7647). Three biological replicates were analysed (n = 3). Significance is coded by asterisks: * p < 0.05; ** p < 0.01.
2.8. FABP3 Promotes Proliferation of Primary Chicken Hepatocytes
Transfection of hepatocytes with pcDNA3.1-FABP3 lifted FABP3 mRNA above the control and pcDNA3.1 levels (p < 0.05; Figure 9A), while siFABP3-1, siFABP3-2 and siFABP3-3 each lowered it (p < 0.01; Figure 9B). Protein analysis agreed: FABP3 abundance increased after overexpression (p < 0.01; Figure 9C,D) and decreased after knockdown, significantly so for siFABP3-1 and siFABP3-2 (both p < 0.01) but not for siFABP3-3 (ns; Figure 9C,E). As in preadipocytes, siFABP3-1 proved the most effective duplex in primary chicken hepatocytes.
Figure 9.
FABP3 Transfection Efficiency in primary chicken hepatocytes. (A): FABP3 mRNA in the con, pcDNA3.1 and pcDNA3.1-FABP3 groups, expressed relative to the reference gene β-actin. (B): FABP3 mRNA in the con, siFABP3NC and siFABP3 groups, again relative to β-actin. (C): WB detection of FABP3 protein across the overexpression control, pcDNA3.1, pcDNA3.1-FABP3, interference control, siFABP3NC and siFABP3 groups. (D): FABP3 protein in the con, pcDNA3.1 and pcDNA3.1-FABP3 groups, with β-actin as reference. (E): FABP3 protein in the con, siFABP3NC and siFABP3 groups, β-actin again serving as reference. Three replicates per group were used (n = 3). Significance is shown as * p < 0.05, ** p < 0.01; ns, non-significant.
Hepatocyte proliferation behaved similarly: the fraction of EdU-positive nuclei expanded after FABP3 overexpression versus con and pcDNA3.1 (p < 0.01; Figure 10A,B) and contracted after silencing versus con and siFABP3-NC (p < 0.05; Figure 10A,B). CCK-8 measurements at 72 h corroborated the proliferative effect, with pcDNA3.1-FABP3 cells exceeding (p < 0.01) and siFABP3 cells trailing (p < 0.01) their respective controls (Figure 10C), together indicating that FABP3 boosts proliferation and viability in both primary chicken preadipocytes and hepatocytes.
Figure 10.
Effects of FABP3 on the proliferation of chicken primary hepatocytes. (A): EdU/DAPI immunofluorescence staining of chicken primary hepatocytes from each group, showing proliferation (scale bar = 50 μm). (B): EdU-positive cell percentage (%). (C): cell viability of chicken primary hepatocytes in each group at 72 h, measured by CCK-8 and cell viability being expressed as a percentage of the con group. The experiment comprised three biological replicates (n = 3). Within each replicate, CCK-8 values were averaged over the six technical wells per group, and EdU counts over three random fields per coverslip, before statistical analysis. Asterisks mark * p < 0.05; ** p < 0.01.
2.9. FABP3 Promotes Lipid Deposition in Primary Chicken Hepatocytes
In differentiating hepatocytes, the Oil Red O-positive area at 96 h was enlarged by FABP3 overexpression and reduced by silencing, each relative to its corresponding controls (p < 0.01 in both cases; Figure 11A). TG accumulation paralleled the staining data, increasing in pcDNA3.1-FABP3 cells (p < 0.01 versus con and pcDNA3.1) and decreasing in siFABP3 cells (p < 0.05 versus con and siFABP3-NC; Figure 11B). The mRNA expression levels of key lipogenic genes C/EBPα and leptin were significantly higher in the pcDNA3.1-FABP3 than in the con and pcDNA3.1 groups, with both p < 0.01 (Figure 11C,D). Conversely, compared with the con and siFABP3-NC groups, the siFABP3 exhibited significantly lower mRNA expression levels of C/EBPα and leptin, with p < 0.01 for C/EBPα, and p < 0.05 for leptin (Figure 11C,D). These results demonstrated that FABP3 has a consistent facilitatory effect on lipid deposition in hepatocytes and adipocytes.
Figure 11.
Effect of FABP3 on lipid deposition in primary chicken hepatocytes. (A): representative Oil Red O-stained images with quantification of the percentage of Oil Red O-positive area in each group. (B): TG content, the abscissa listing the treatment groups (con, pcDNA3.1, pcDNA3.1-FABP3, siFABP3-NC, siFABP3) and the ordinate providing TG content (mmol/gprot). (C): C/EBPα mRNA normalized to the reference β-actin. (D): leptin mRNA normalized to the reference β-actin. Each group was tested in three biological replicates (n = 3). Asterisks indicate * p < 0.05, ** p < 0.01.
2.10. FABP3 Promotes Lipid Deposition in Primary Chicken Hepatocytes via PPAR Signaling
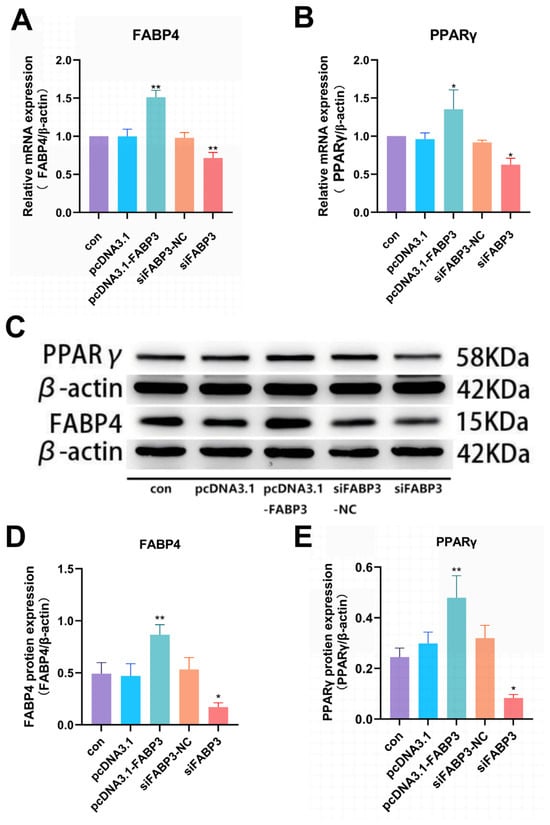
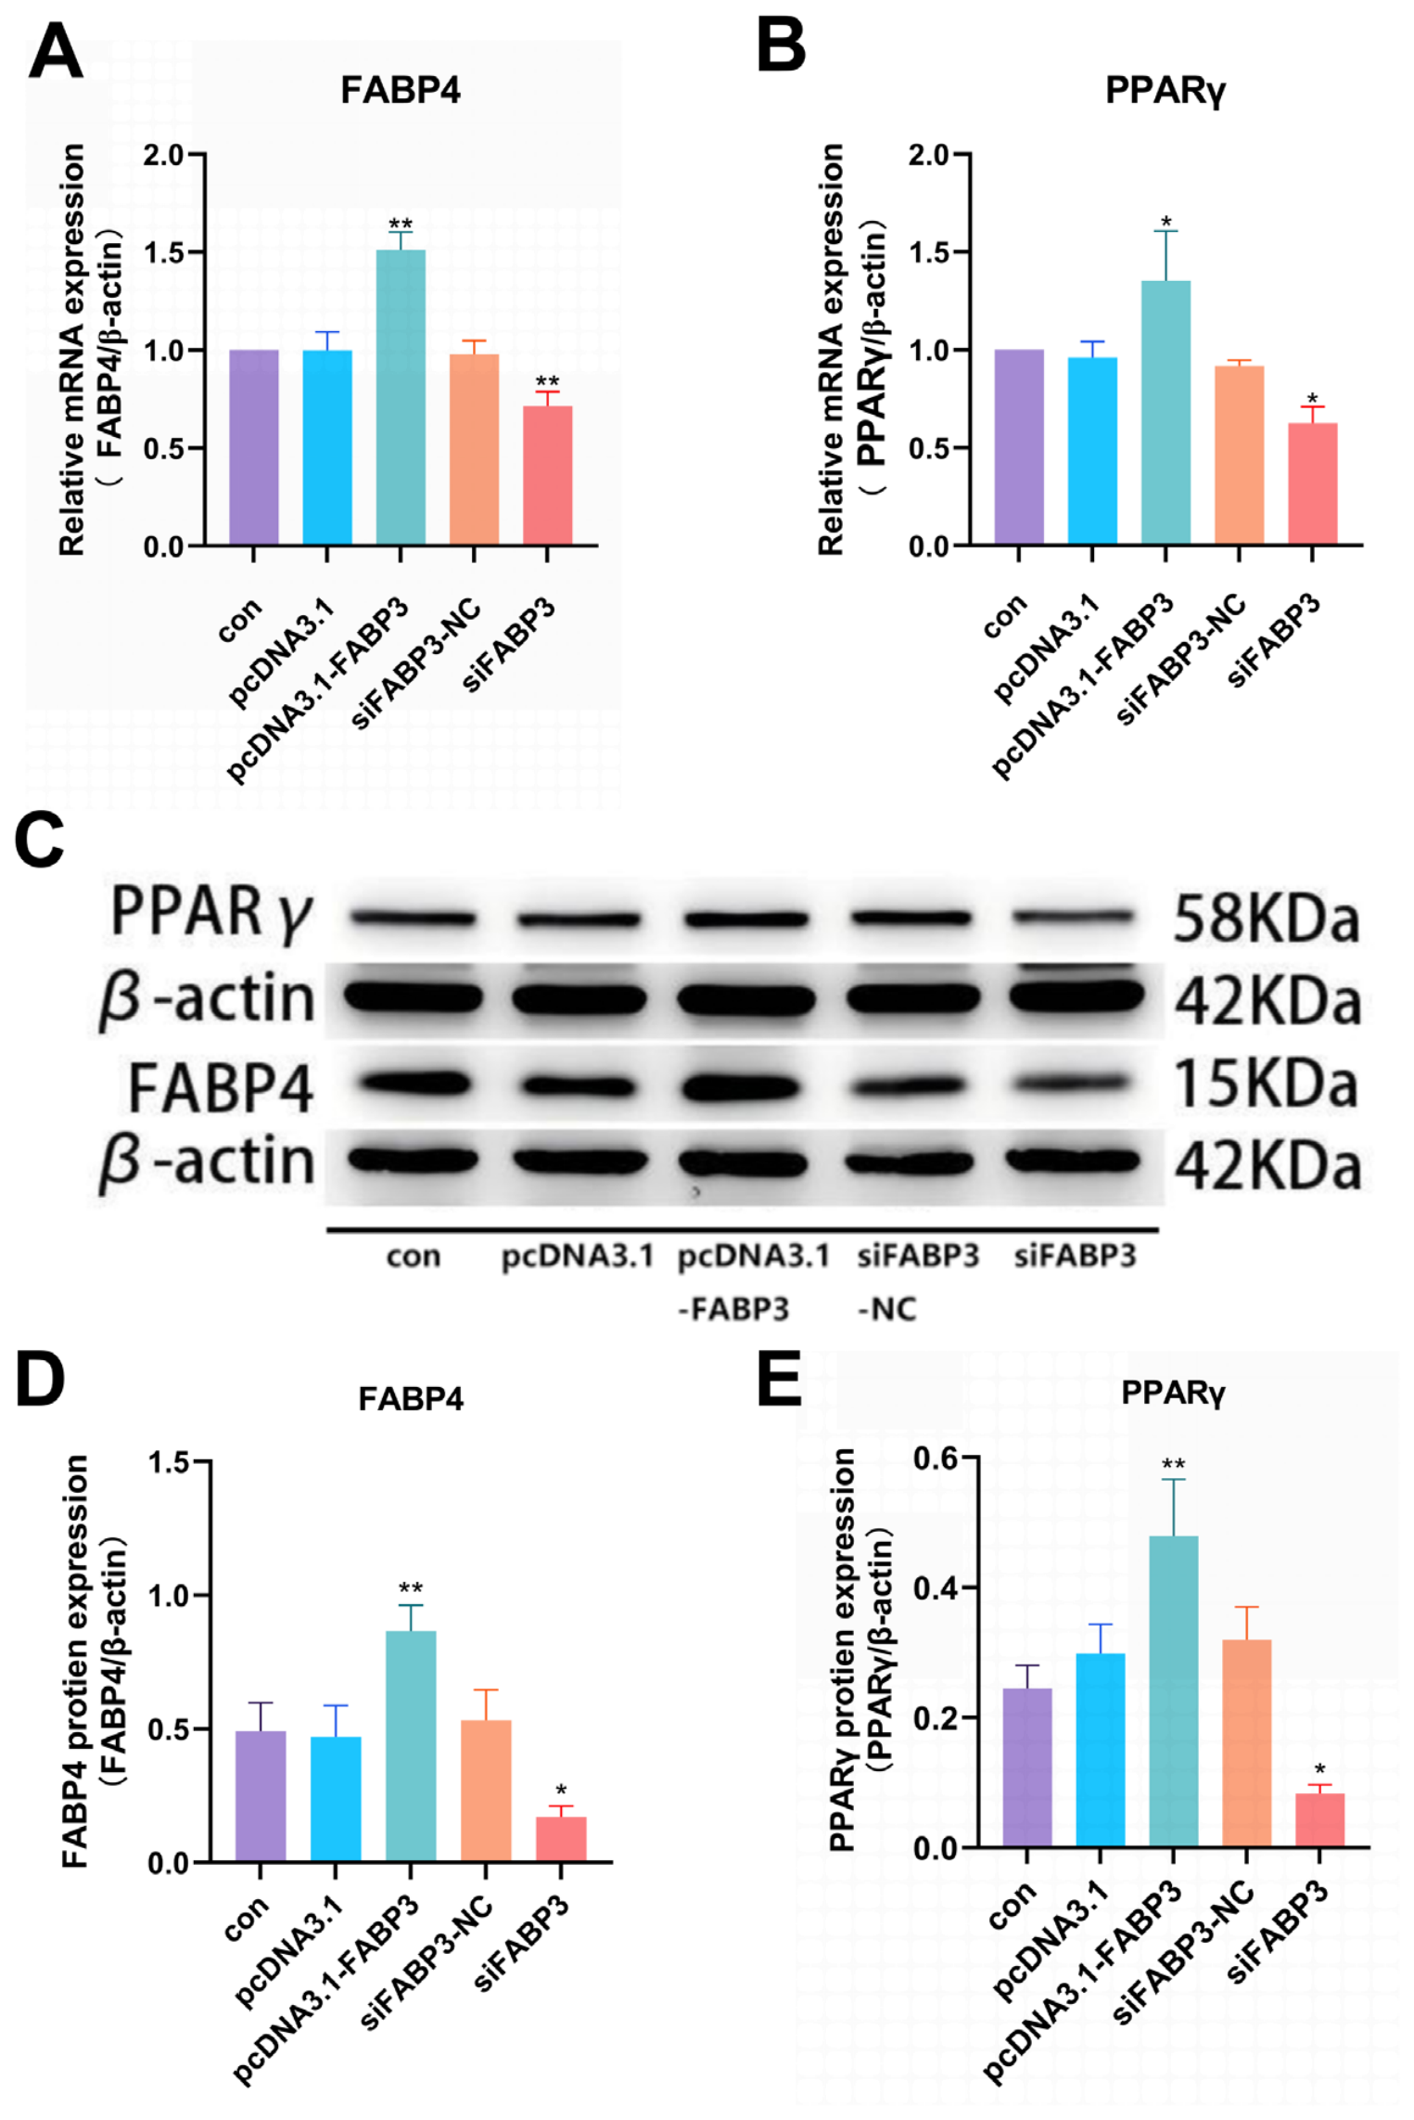
Within hepatocytes, FABP3 overexpression lifted FABP4 and PPARγ mRNA above con and pcDNA3.1 levels (both p < 0.01; Figure 12A,B), and knockdown depressed both transcripts below con and siFABP3-NC levels (both p < 0.01; Figure 12A,B). At the protein level, pcDNA3.1-FABP3 increased PPARγ and FABP4 (both p < 0.01; Figure 12C–E), while siFABP3 diminished them (both p < 0.05; Figure 12C–E), establishing that FABP3 drives PPARγ and FABP4 expression in chicken adipocytes and hepatocytes alike.
Figure 12.
FABP4 and PPARγ expression in hepatocytes as affected by FABP3. (A): FABP4 mRNA in chicken primary hepatocytes, expressed relative to the reference β-actin. (B): PPARγ mRNA in chicken primary hepatocytes, likewise relative to β-actin. (C): WB analysis of FABP4 and PPARγ protein in chicken primary hepatocytes, β-actin (42 kDa) serving as the internal reference. (D): relative FABP4 protein in chicken primary hepatocytes, with β-actin as reference. (E): relative PPARγ protein in chicken primary hepatocytes, again with β-actin as reference. Three biological replicates were run (n = 3). Asterisks in all panels: * p < 0.05, ** p < 0.01.
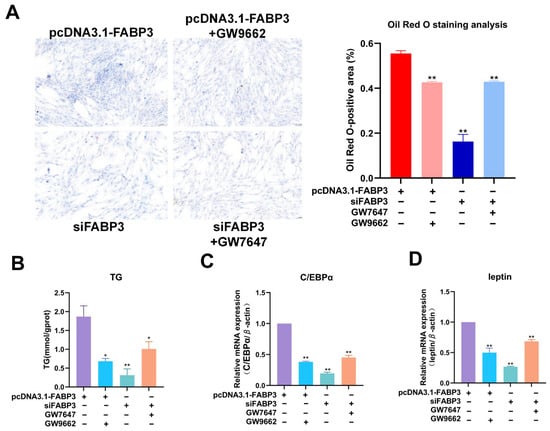
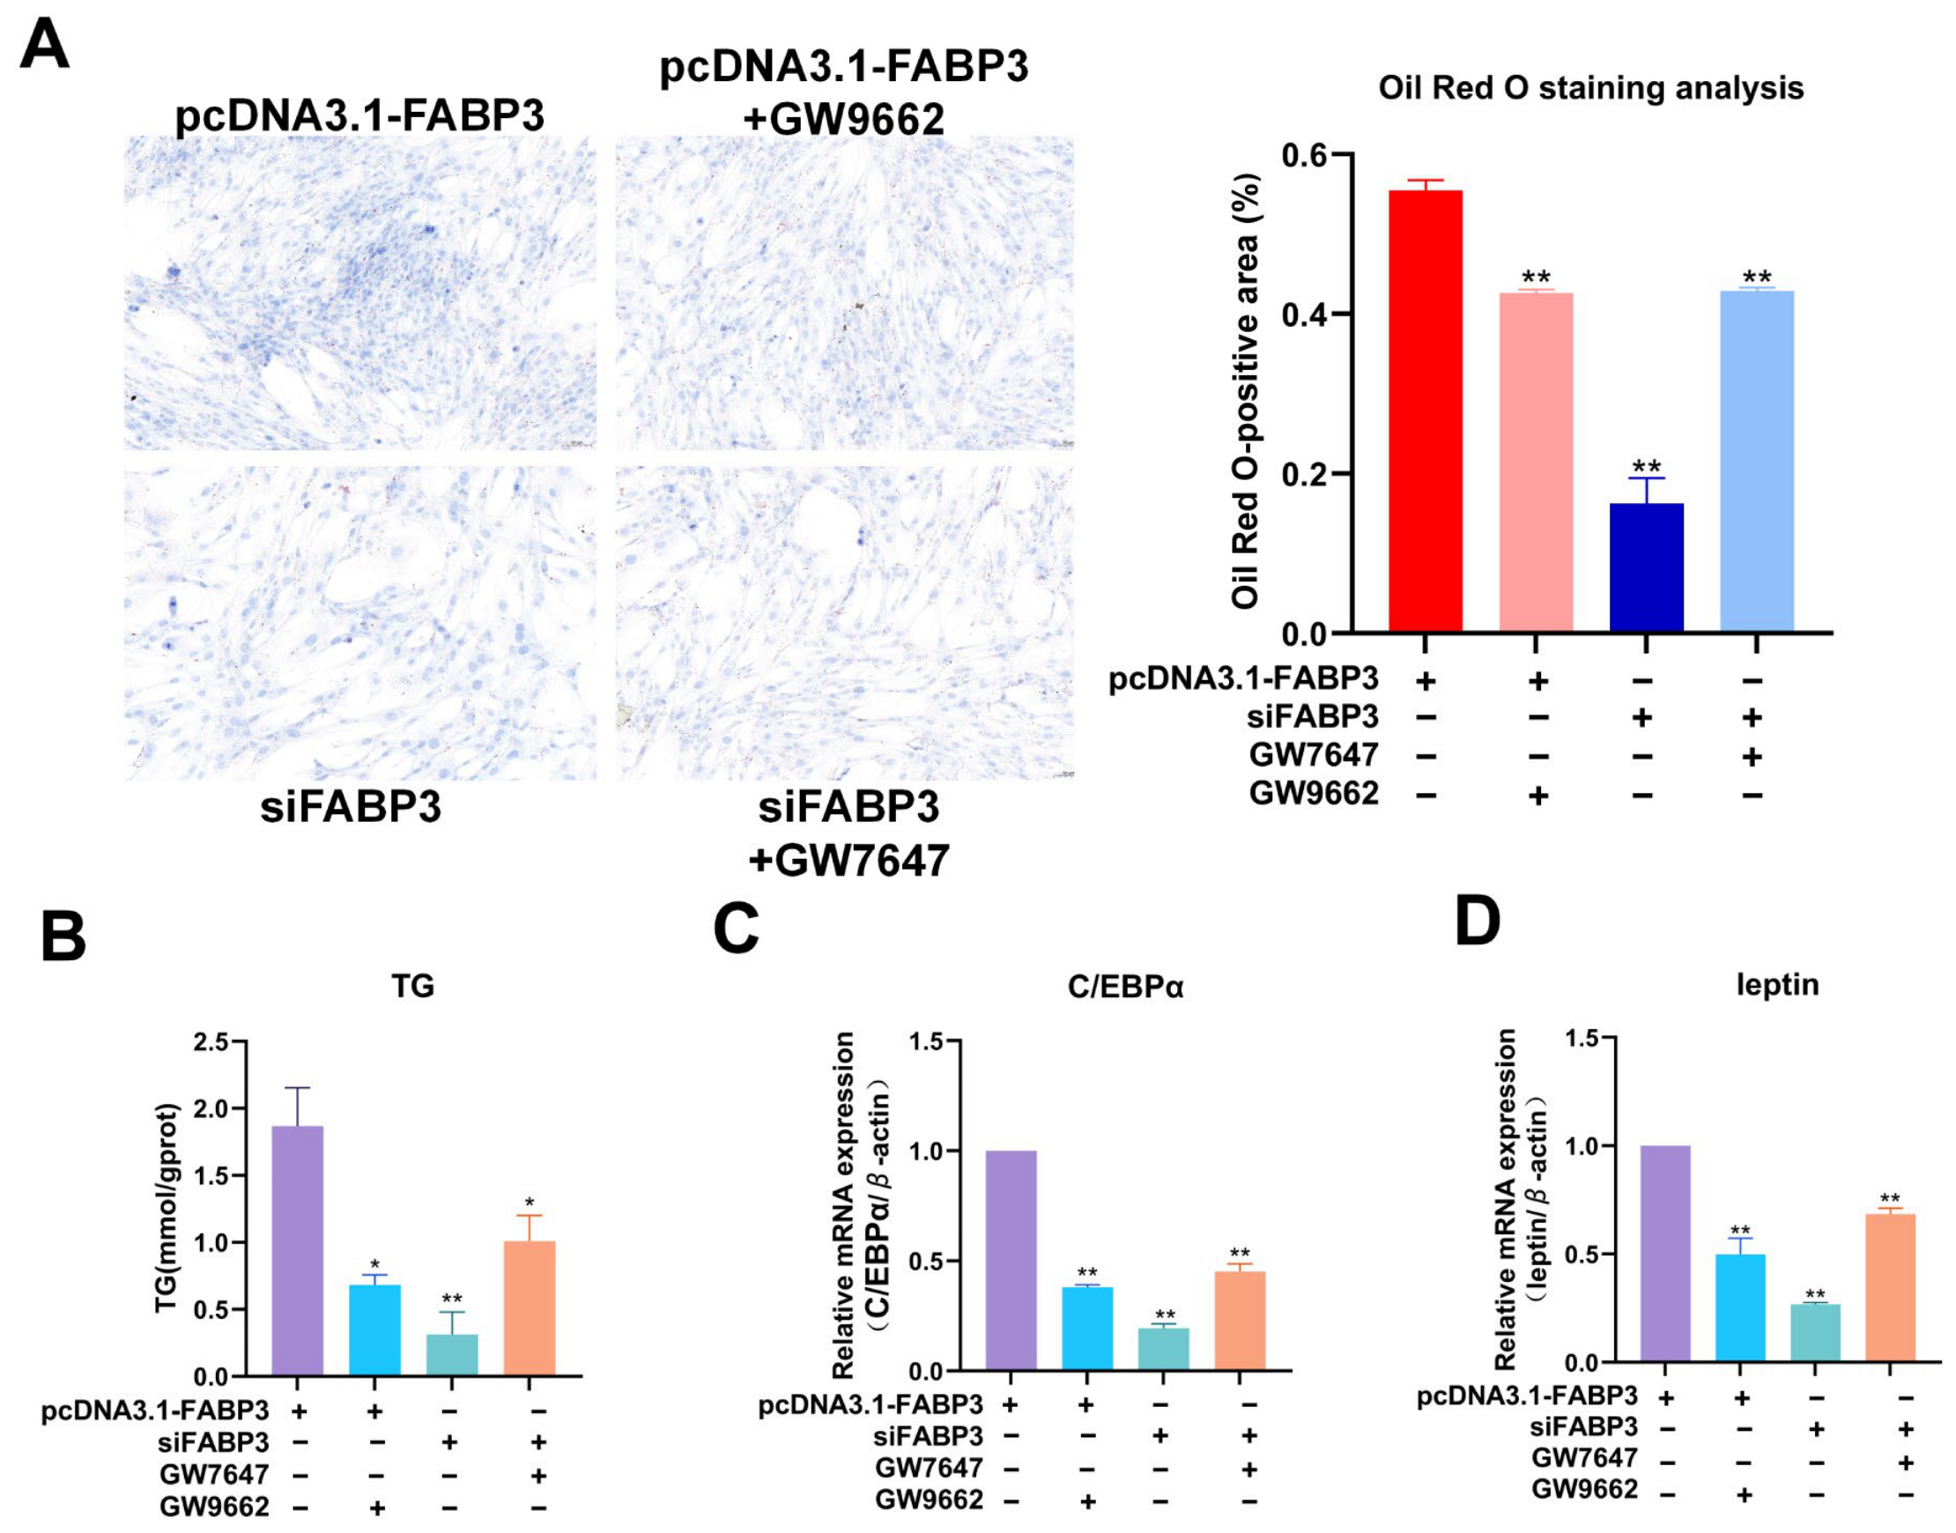
Pharmacological manipulation reproduced the adipocyte findings in hepatocytes. GW9662 trimmed the lipid-positive area of FABP3-overexpressing cells, and GW7647 expanded it in FABP3-silenced cells (p < 0.01 for each; Figure 13A). GW9662 also attenuated C/EBPα and leptin mRNA (both p < 0.01) and TG content (p < 0.01) under overexpression, whereas GW7647 augmented all three readouts (C/EBPα and leptin, both p < 0.01; TG, p < 0.01) under silencing (Figure 13B–D). FABP3 therefore modulates lipid deposition in broiler adipocytes and hepatocytes by acting on PPAR signaling.
Figure 13.
Effect of FABP3 on PPAR signaling pathway intervention-mediated lipid deposition in chicken primary hepatocytes. (A): Oil Red O staining of broiler hepatocytes after GW9662 or GW7647 treatment; the stained area (% Oil Red O-positive) is quantified. (B): intracellular TG content in broiler hepatocytes following exposure to GW9662 or GW7647. (C,D): C/EBPα and leptin mRNA (each normalized to β-actin) in broiler hepatocytes after GW9662 or GW7647 treatment. Significance is denoted as ** p < 0.01.
3. Discussion
Abdominal fat deposition is a complex metabolic process driven by multi-tissue crosstalk, in which the liver dominates lipid synthesis and abdominal adipose tissue regulates lipid storage [7]. Rather than being independently controlled by a single gene or pathway, abdominal fat deposition results from synergistic interactions within the fatty acid metabolism regulatory network, which centers on the exogenous uptake, activation, transport, and directed accumulation of fatty acids [7]. The regulatory efficiency of each process collectively determines the level of abdominal fat deposition [7]. Fatty acids released by the hydrolysis of triglycerides are taken up through CD36 molecule-mediated transport [14]. Fatty acids undergo chain elongation and desaturation catalyzed by ELOVL fatty acid elongase 6 (ELOVL6), SCD and SCD5, yielding fatty acids suited for storage in adipose tissue [15]. FABP3 takes part in fatty acid transport and promotes expression of lipid metabolism-related genes such as PPARγ [16]. In white adipose tissue (WAT), obesity persistently switches on intracellular JAK signaling, and sustained JAK activity interferes with insulin action, aggravating both obesity and insulin resistance [17]. JAK3, a member of the JAK kinase family, governs several metabolic processes, including fat accumulation, energy expenditure and insulin sensitivity [18]. Long-chain acyl-CoAs (LCACoAs) generated during fatty acid metabolism also disrupt the insulin signaling pathway [19], and ACSL4, an ACSL family member, catalyzes the conversion of long-chain fatty acids to LCACoAs [20]. In the present meta-analysis, mRNA levels of CD36, ELOVL6, SCD, SCD5, ACSL4 and JAK3 differed between the fat-line/HF and lean-line/LF groups; all six were significantly upregulated in fat tissue and were significantly enriched in lipid metabolism-related pathways. FABP3 in turn was significantly enriched in lipid metabolism-relevant GO terms, KEGG pathways and GSEA gene sets, marking it as a potential key regulator of this process.
As one of the core members of the fatty acid-binding protein family, FABP3 is extensively involved in the intracellular uptake, transport, metabolism and signal transduction of fatty acids, serving as a key molecule in the regulatory network of lipid metabolism [21]. Previous studies have preliminarily explored the lipid metabolic regulatory function of FABP3 in mammalian cell models. FABP3 acts not merely as a simple lipid transporter, but may also promote lipid droplet accumulation by upregulating PPARγ expression [16], which provides an important theoretical reference for subsequent functional research on FABP3 in livestock and poultry. FABP3 exhibits a highly correlated expression pattern with lipogenic marker genes, such as PPARγ in porcine adipocytes [22], implying its regulatory role in adipogenesis. FABP3 overexpression can markedly facilitate lipid droplet formation in 3T3-L1 cells [12], indicating that this gene exerts a positive regulatory effect on lipid droplet biogenesis. Research in chickens has largely centered on preadipocyte differentiation and lipid droplet deposition, and whether FABP3 takes part in coordinating abdominal fat deposition between the liver and abdominal adipose tissue has not been reported. In the present study, FABP3 exerted a consistent positive influence on the proliferation and survival of broiler preadipocytes and hepatocytes, indicating that it modulates these processes in both cell types and so supplies a cellular basis for lipid metabolism in the liver and abdominal adipose tissue. FABP3 raised intracellular triglyceride content and lipid droplet formation in hepatocytes and adipocytes alike, upregulated lipogenic genes such as C/EBPα and leptin, and promoted the lipid accumulation and differentiation of preadipocytes. That FABP3 is pro-lipogenic in both hepatic and adipose tissue fits the physiology of broilers, in which the liver dominates lipid synthesis and abdominal adipose tissue handles lipid storage, and it further clarifies how FABP3 regulates abdominal fat deposition in this species.
Lipid metabolism is governed chiefly by the PPAR signaling pathway, and blocking it markedly suppresses lipogenesis [23], while activating it in chickens strongly promotes adipogenesis [24]. In mammals, FABP3 has been proposed to carry fatty acid ligands into the nucleus, where they bind PPARγ and switch on the PPAR pathway to regulate lipid metabolism [25]; whether FABP3 and the PPAR pathway are directly linked in chickens is, however, still unresolved. Here, in line with the mammalian reports, FABP3 raised the expression of PPARγ and FABP4. Because FABP4 is a classical downstream target of PPARγ [26], its altered expression lends further weight to a regulatory action of FABP3 on the PPAR signaling pathway, raising the possibility that FABP3 drives downstream lipid-metabolism genes by boosting PPARγ expression and, in that way, shapes abdominal fat deposition. The inhibition and agonist-rescue experiments confirmed that the PPAR signaling pathway is an essential mediator of FABP3-induced lipid deposition. It should be noted, though, that the two pharmacological agents act on different PPAR isoforms: GW9662 acts as a covalent antagonist of PPARγ [23,27], whereas GW7647 is a subtype-selective PPARα agonist [28]. The two arms thus demonstrate pathway-level dependency from opposite directions—antagonism blocks the overexpression phenotype and activation restores the silenced phenotype—but on their own they do not establish PPARγ-specific signaling. Resolving isoform-specific engagement will require a PPARγ agonist (rosiglitazone or ciglitazone) as the rescue arm together with profiling of PPARα/PPARδ expression.
How FABP3 and PPAR activation are mechanistically connected likewise calls for cautious reading. The evidence reported here, including the concurrent increase in PPARγ and FABP4 following FABP3 overexpression and pharmacological intervention at the pathway level, is associative rather than proof of direct activation. Three possibilities have been put forward on the basis of mammalian work: fatty acid ligands may be escorted into the nucleus by FABP3, and there act as activators of PPARγ [25]; intracellular fatty acid pools may be remodeled, with a secondary influence on PPARγ transcription [21]; or FABP3 and PPARγ may engage in direct protein–protein contact, as proposed for other members of the FABP family [26]. Each of these remains untested in the present system. Establishing which mode operates would require dedicated experiments. These could include a luciferase reporter driven by a PPAR response element, a broader panel of PPARγ targets extending beyond FABP4, such as FASN, SCD, CD36, PLIN1 and ACC, or profiling of fatty acid composition.
The consistent upregulation of FABP3 across all four datasets, together with moderate and non-significant heterogeneity and robust leave-one-out sensitivity, supports FABP3 as a conserved component of the lipogenic response rather than a line-, diet- or platform-specific marker. This is concordant with the gain- and loss-of-function results showing that FABP3 is sufficient and necessary, in a PPAR-pathway-dependent manner, for lipid accumulation in primary broiler adipocytes and hepatocytes.
Studies in model organisms have shown that PPARγ and C/EBPα mutually induce each other and that PPARγ activation upregulates the core lipogenic genes FABP4 and leptin [27,28]. Based on this, leptin was used here as a terminal differentiation/lipogenic marker. The avian leptin gene, although recently identified and unusually GC-rich, is conserved among poultry species [29]. In the present study, overexpressing FABP3 also raised the levels of these key lipogenic genes markedly. The resulting cascade of expression changes ultimately drove proliferation of broiler preadipocytes and hepatocytes together with lipid droplet accumulation and TG synthesis in both cell types. Taken together, we propose that FABP3 raises the expression of lipid accumulation-related genes and elevates TG levels in adipocytes and hepatocytes via PPAR signaling, thereby enhancing abdominal lipid storage—which may be the mechanism behind the effect of FABP3 on abdominal fat deposition phenotypes in broilers.
This study has several limitations that should be acknowledged. Every functional assay described above was carried out in vitro with primary cells. Because all functional experiments were performed in vitro in primary cells, no whole-animal validation was included, and a causative contribution of FABP3 to abdominal fat deposition in the intact bird cannot be claimed. The evidence that FABP3 engages PPAR signaling is indirect and correlative rather than a demonstration of direct activation: the co-upregulation of PPARγ and FABP4 upon FABP3 overexpression and the pathway-level pharmacological intervention do not establish direct activation, and because the PPARα agonist and PPARγ antagonist used in the intervention experiments target different isoforms and no direct activation assay (e.g., PPRE-driven reporter) was performed, PPARγ-specific signaling remains unresolved. The Oil Red O panels in Figure 6A,B did not separately show the pcDNA3.1 and siFABP3-NC controls because the original images were not archived and newly isolated cells did not maintain stable differentiation. However, parallel TG and qPCR analyses included all five groups, and the empty vector and si-NC did not differ from con, so the core conclusion is not affected. Additionally, primary cells were prepared from commercial white-feathered broilers of unspecified breed/strain, so the extent to which the conclusions generalize across genetic backgrounds remains to be determined. Formal purity assessment of primary preadipocytes and hepatocytes was not performed. Flow cytometry for PDGFRα/PREF1 and albumin secretion or CYP3A activity would have been required to exclude contamination with stromal cells or Kupffer cells. Leptin was used as a lipogenic marker, but its biology in birds is atypical. Additional hepatocyte-relevant markers such as SREBP1c, FASN and ACC should be included in future studies. Finally, the meta-analysis integrated datasets generated on different platforms, in different tissues and under different designs (genetic lines and dietary intervention); the AW–Fisher combined p-values are nominal, heterogeneity diagnostics were computed in full for the selected candidate but not genome-wide for the complete meta-DEG list, and the per-dataset standard errors used in the heterogeneity analysis were back-calculated from the per-dataset test statistics rather than taken from complete archived standard-error tables. However, 2512 of the 2520 meta-DEGs also pass Benjamini–Hochberg FDR < 0.05, so the meta-DEG list is essentially unchanged by FDR correction. These limitations do not affect the cell-level conclusions but define the boundaries within which they should be interpreted.
4. Materials and Methods
4.1. Dataset Collection
To minimize the interference of non-genetic factors and ensure statistical power of the analysis results, we established the following inclusion criteria to screen transcriptomic datasets from the NCBI Gene Expression Omnibus (GEO) database: (1) datasets had to be published gene expression profiles of chicken (Gallus gallus, domestic broiler) generated using microarray technologies or RNA-Seq; (2) the study design had to include comparable samples from fat and lean groups; (3) all broilers had to be male to control for the potential effect of sex on fat metabolism. Based on these criteria, GSE42980, GSE49121, GSE104038 and GSE104039 were selected for meta-analysis. The species, tissue, design, platform, age and sex information of each dataset is summarized in the Supporting Information, Table S5. The fat line (FL) and lean line (LL) used in GSE42980 were generated by seven generations of divergent selection on abdominal fatness at comparable feed intake and body weight and differed in abdominal fat percentage (AFP) by 2.8-fold at 7 weeks of age [30,31]. This dataset provides RNA-Seq profiles of abdominal fat from 7-week-old males (12 FL, 12 LL) sequenced on an Illumina HiSeq 2000 (https://pubmed.ncbi.nlm.nih.gov/26445145) (accessed on 14 May 2020). GSE49121 was derived from broilers subjected to 30 generations of divergent selection for high (HG) or low (LG) growth, the two lines differing 19.6-fold in AFP and 3.2-fold in body weight at 7 weeks [32]. It provides abdominal fat RNA-Seq data from 7-week-old males (8 HG, 8 LG) (https://www.ncbi.nlm.nih.gov/pubmed/28814270) (accessed on 14 May 2020). GSE104039 is an abdominal fat microarray dataset using an Agilent custom 8 × 60 K chicken gene expression microarray, with males from fat and lean lines cross-classified by diet. The contrast deposited and analysed here compares the HF diet with the LF diet (23 HF, 22 LF). GSE104038 is the liver tissue microarray dataset collected from the same experiment (23 HF, 23 LF) (https://www.ncbi.nlm.nih.gov/pubmed/29514634) (accessed on 22 May 2020) [33]. For both microarray series, probes surviving the filtering steps were mapped to gene symbols, and the resulting symbol lists are provided in the Supporting Information, Tables S9 and S10.
4.2. Sequencing Data Preprocessing
Raw reads from GSE42980 and GSE49121 were quality-controlled with fastp (v0.19.7) [34] under its default parameters and workflow. The surviving high-quality reads were then aligned to the chicken reference genome (GCF_016699485.2_bGalGal1.mat.broiler.GRCg7b) with HISAT2 (v2.2.0) [35], again using default parameters. The genome sequence and its annotation file (GCF_016699485.2_bGalGal1.mat.broiler.GRCg7b_genomic.gtf.gz) were obtained from the NCBI genome assembly website (https://ftp.ncbi.nlm.nih.gov/genomes/all/GCF/016/699/485/GCF_016699485.2_bGalGal1.mat.broiler.GRCg7b/) (accessed on 9 October 2025). Postalignment quality was subsequently evaluated using Qualimap (v2.2.2d) [36], and per-gene read counts were quantified using featureCounts (v2.0.1) [37] guided by the same annotation. The two microarray series (GSE104039 and GSE104038), both profiled on Agilent custom 8 × 60 K chicken arrays [33], were processed in R (v4.0.5) with the limma package (v3.60.5) [38]. This workflow applied background correction, quantile normalization and collapsed probes to gene-level expression values, yielding normalized matrices for downstream analyses.
4.3. Meta-Analysis of Differentially Expressed Genes (DEGs)
Within each dataset, differential expression was fitted using the algorithm appropriate to its platform: limma (v3.60.5) [38] served the microarray datasets GSE104039 and GSE104038, whereas DESeq2 (v1.36.0) [39], run with default settings, handled the RNA-Seq datasets GSE42980 and GSE49121. Dataset-level p-values from the four contrasts were then synthesized into one consolidated statistic per gene with the adaptively weighted Fisher’s method [40]. A gene was declared a significant meta-DEG when its combined p-Meta fell below 0.05 and, in addition, its |log2FC| reached at least 0.3, it was detected in all four datasets, its direction of change agreed across the contributing datasets, and complete statistics were available everywhere. Because the combined p-values are nominal, Benjamini–Hochberg FDR values were additionally computed across all 10,698 tested genes.
4.4. Enrichment Analysis of the Meta-DEGs
Functional annotation of the meta-DEGs was carried out in R with clusterProfiler (v4.12.6) [41], querying both the GO and the KEGG resources to clarify how these genes might participate in abdominal fat deposition in broilers. Terms and pathways attaining a p-value ≤ 0.05 were treated as statistically significant.
4.5. GSEA
GSEA of the meta-DEGs was conducted with the clusterProfiler package (v4.12.6) [41] in R. A gene set was retained as significantly enriched when |Normalized Enrichment Score (NES)| ≥ 1.5 together with p < 0.05. The significantly enriched sets were then plotted to further illustrate their expression patterns.
4.6. PPI Network Construction
A PPI network covering the meta-DEGs of the enriched pathways was assembled from the Search Tool for the Retrieval of Interacting Genes database (v12.0) (https://string-db.org/) (accessed on 24 January 2026), with the search organism restricted to “Gallus gallus”. Interactions with a confidence score above 0.4 were retained, and nodes lacking any connection were hidden. Cytoscape (v3.10.0) [42] served to visualize and interrogate the network, and hub genes were ranked with its built-in Network Analyzer tool, node degree being taken as the indicator of a node’s centrality and functional importance.
4.7. Cross-Dataset Assessment of FABP3 Expression, Heterogeneity and Sensitivity
For the selected candidate gene FABP3, per-dataset log2FC and p-values were extracted from the differential expression results of the four datasets. Per-dataset standard errors (SE) were back-calculated using the formula SE = |log2FC|/z, where z = Φ−1(1 − p/2), which exactly inverts the Wald tests of DESeq2 and closely approximates the moderated-t tests of limma when residual degrees of freedom are ≥40. For each dataset, the weight was defined as wi = 1/SEi2. Fixed-effect pooled log2FC was calculated as the inverse-variance weighted mean [43], with pooled SE = (Σwi)(−1/2) and 95% confidence interval (CI) = pooled log2FC ± 1.96 × pooled SE. Between-dataset heterogeneity was quantified using Cochran’s Q [44] (chi-square distribution with k − 1 degrees of freedom), I2 = max(0, (Q − df)/Q) × 100% [45], and τ2 using the DerSimonian–Laird estimator [46]. Random-effects pooled log2FC was computed with weights wi* = 1/(SEi2 + τ2), and the corresponding 95% CI was derived. A forest plot was generated using the metafor package (v4.1.1) in R [47]. Leave-one-out sensitivity analyses were performed by iteratively excluding one dataset and recalculating the random-effects pooled log2FC [48]. In addition, an adipose-only analysis excluding the hepatic dataset (GSE104038) was conducted to confirm that tissue differences did not drive the pooled estimate.
4.8. Animal Welfare
All procedures involving animals conform to the ARRIVE guidelines (Animal Research: Reporting of In Vivo Experiments) and follow the Guidance on the operation of the Animals (Scientific Procedures) Act 1986, together with EU Directive 2010/63 on the protection of animals used for scientific purposes. The Animal Ethics Committee of Northeast Agricultural University approved the experimental protocol (Approval No.: NEAUEC20230209), and every effort was made to relieve animal suffering.
4.9. Primary Chicken Preadipocyte Isolation and Culture
Donor birds of this age were chosen because preadipocytes obtained before rapid abdominal fat accretion begins still possess strong proliferative and adipogenic capacity [49]. Abdominal fat tissue was harvested from male 2–3-week-old commercial white-feathered broilers provided by Lanxi Yijia Agriculture and Animal Husbandry Co., Ltd., (Lanxi, Heilongjiang, China)., rinsed with sterile PBS (Biosharp, Labgic Technology Co., Ltd., Beijing, China) and dissected to remove blood vessels and fascia. For each biological replicate, preadipocytes were isolated from 5 donor broilers, and three independent replicates were performed, using a total of 15 donor broilers. Minced tissue was digested with 0.2% type I collagenase (Sigma-Aldrich, Inc., St. Louis, MO, USA) at 37 °C for 60 min under continuous oscillation, with mixing every 5 min [50]. Culture medium was added to halt the reaction, and the digest was passed successively through 100-mesh and 600-mesh screens before a 10 min at 2000× g on a refrigerated centrifuge (Heal Force Bio-meditech Holdings Limited, Shanghai, China). The pellet was then treated with red blood cell lysis solution for 10 min; after one further centrifugation, it was washed 1–2 times in culture medium, and the resulting suspension was plated at 1 × 10⁵ cells/cm2 and kept at 37 °C under 5% CO2. Purity was inferred from the fibroblast-like morphology of the differentiating cells and from the uniform cytoplasmic lipid filling observed after induction.
4.10. Primary Chicken Hepatocyte Isolation and Culture
Livers were collected from 3-week-old male commercial white-feathered broilers supplied by Lanxi Yijia Agriculture and Animal Husbandry Co., Ltd (Lanxi, Heilongjiang, China). [51], with one donor per biological replicate and three replicates in total (3 donors). Donors were fasted for 3–6 h with water freely available, anesthetized by intraperitoneal injection of 50 mg/kg sodium pentobarbital, and given 1500–2000 IU/kg heparin sodium through the wing vein. Perfusion solutions A, B and C, along with prewarmed basal medium containing 10% FBS and antibiotics, were prepared in advance. After supine fixation, abdominal disinfection and laparotomy, a cannula was placed in the portal vein, and the inferior vena cava acted as the outflow channel. Solution A was delivered at 20–30 mL/min for 10–15 min until the liver blanched; after a brief rinse with Solution B, collagenase-containing Solution C was recirculated at 15–20 mL/min for 15–20 min until the organ softened and showed surface cracks. The digested liver was dispersed in cold serum-containing medium, sieved through 100- and 200-mesh filters, and pelleted by low-speed centrifugation at 4 °C and 50× g, followed by 2–3 cycles of washing. Hepatocyte identity was confirmed by the typical polygonal morphology and uniform albumin-positive staining expected of primary chicken hepatocytes.
4.11. Transfection of Primary Chicken Preadipocytes and Hepatocytes and Induction of Differentiation
Preadipocytes and hepatocytes were plated in 12-well plates (1 × 10⁵ cells/well) and transfected at 50–60% confluence with the FABP3 overexpression vector (pcDNA3.1-FABP3), small interfering RNA (siRNA) or their matched negative controls using Lipo6000™ (Beyotime Biotechnology, Shanghai, China); qPCR and WB analysis verified the transfection efficiency. Where indicated, the PPARγ antagonist GW9662 (Dalian Meilun Biotechnology Co., Ltd., Dalian, Liaoning, China) or the PPARα agonist GW7647 (Dalian Meilun Biotechnology Co., Ltd., Dalian, Liaoning, China) was administered 2 h before delivery of the FABP3 overexpression vector and siRNA, respectively. Differentiation was initiated 24 h after transfection by switching to differentiation medium supplemented with 200 μmol/L oleic acid (Wuhan Yuansheng Biotechnology Co., Ltd., Wuhan, Hubei, China) [49]. The sequences of siFABP3 and pcDNA3.1-FABP3 are listed in Table 1.
Table 1.
Primer, siFABP3 and pcDNA3.1-FABP3 sequences.
4.12. CCK-8 Viability Assay
For viability measurements, transfected cells were transferred to 96-well plates (5 × 10⁴ cells/well, 100 μL/well). After 72 h of culture, each well received 10 μL of CCK-8 reagent (Dalian Meilun Biotechnology Co., Ltd., Dalian, Liaoning, China) and plates were held at 37 °C under 5% CO2 for 3 h [52] before absorbance readings at 450 nm on a microplate reader. Viability was assessed with CCK-8. It is presented either as blank-corrected absorbance at 450 nm, that is, OD450 (sample) − OD450 (blank); or normalized to the control group as (OD_sample − OD_blank)/(OD_control − OD_blank) × 100%. Cell viability was expressed in these two forms as specified in the corresponding figure legends. Six technical wells per group were averaged within each biological replicate prior to statistical analysis.
4.13. EdU Proliferation Assay
A parallel set of transfected cells grown on coverslips in 24-well plates (3 × 10⁵ cells/well) was used for EdU labeling. EdU working solution (Beyotime Biotechnology, Shanghai, China) was applied for 2 h at 48 h after plasmid transfection or 72 h after siRNA transfection [52]. Cells were then fixed in 4% paraformaldehyde(Wuhan Boerfu Biotechnology Co., Ltd., Wuhan, Hubei, China) for 15 min and processed through the Click reaction. Labeled cells were examined under a fluorescence microscope (Nikon Corporation, Tokyo, Japan; excitation 495 nm, emission 519 nm). The proliferation index was defined as the number of EdU-positive nuclei divided by the total number of DAPI-stained nuclei per field, expressed as a percentage. Three random fields per coverslip were scored and averaged to yield a single value per biological replicate, and all experiments were repeated three times with cells from different donor broilers.
4.14. RNA Extraction and qPCR
Total RNA was isolated with a total RNA extraction kit (Beijing Solarbio Science & Technology Co., Ltd., Beijing, China), and RNA concentration and purity were read on a microvolume spectrophotometer (Shanghai Jiapeng Technology Co., Ltd., Shanghai, China). cDNA was then generated by reverse transcription. Each 20 μL qPCR reaction contained 10 μL PerfectStart® Green qPCR SuperMix(TransGen Biotech Co., Ltd., Beijing, China), 1 μL each of forward and reverse primer, 2 μL cDNA and nuclease-free water to volume. Amplification started at 94 °C for 2 min and proceeded through 45 cycles of 94 °C for 5 s and 60 °C for 30 s, followed by melting-curve analysis from 65 to 95 °C with 0.5 °C increments every 5 s. β-actin served as the reference gene, and relative expression of each target was computed with the 2−∆∆CT method [53]. The primer sequences used for qPCR are given in Table 1.
4.15. Western Blotting
Samples were lysed on ice for 15 min in Radio-Immunoprecipitation Assay (RIPA) lysis buffer(Wuhan Boerfu Biotechnology Co., Ltd., Wuhan, Hubei, China) supplemented with protease and phosphatase inhibitors (Dalian Meilun Biotechnology Co., Ltd., Dalian, Liaoning 116600, China), and protein amounts were quantified with the Bicinchoninic acid (BCA) assay. Proteins were resolved on 12% SDS-polyacrylamide gels and blotted onto polyvinylidene fluoride membranes (MilliporeSigma, Burlington, MA, USA) [54]. After blocking in 5% bovine serum albumin(Dalian Meilun Biotechnology Co., Ltd., Dalian, Liaoning, China) for 60 min at 37 °C, membranes were probed overnight at 4 °C under gentle shaking with the primary antibodies anti-FABP3, anti-FABP4, anti-PPARγ (Proteintech Group, Inc., Rosemont, IL, USA) and anti-β-actin (ABclonal Technology Co., Ltd., Wuhan, Hubei, China), and then exposed to horseradish peroxidase-labeled secondary antibodies (Jackson ImmunoResearch Laboratories, Inc., West Grove, PA, USA) for 1 h at room temperature. Chemiluminescent reagent revealed the bands, whose relative gray values were quantified in Image-Pro Plus 6.0 software (Media Cybernetics, Inc., Rockville, MD, USA).
4.16. Oil Red O Staining
Cells were collected at 24, 48, 72 and 96 h after the induction of differentiation and fixed in 4% paraformaldehyde for 15 min. Oil Red O working solution was applied in the dark for 8 to 10 min, after which excess dye was removed with 75% isopropanol (Sinopharm Chemical Reagent Co., Ltd., Shanghai, China), and the samples were rinsed in distilled water. Nuclei were counterstained with hematoxylin for 3–5 min, followed by differentiation, bluing and mounting, and the preparations were imaged under a light microscope (Nikon Corporation, Tokyo, Japan). For quantification, retained dye was eluted in 100% isopropanol for 10 min, and absorbance was read at 510 nm on a microplate reader (Molecular Devices, LLC, San Jose, CA, USA) [55]. In parallel, image-based quantification in Image-Pro Plus 6.0 applied a uniform red-channel threshold to all images within an experiment, and results are reported as the percentage of Oil Red O-positive area relative to the total field area.
4.17. Triglyceride Quantification
Cell lysates were assayed for TG concentration through enzymatic conversion to quinoneimine in the presence of peroxidase, and values were interpolated from a standard curve built with known TG standards. Protein content of an identical lysate aliquot was measured with a BCA Protein Assay Kit (Beijing Solarbio Science & Technology Co., Ltd., Beijing, China) for normalization, so that the final TG content was expressed as the ratio of TG concentration to protein concentration [56].
4.18. Statistics
Reliability and reproducibility were safeguarded by running every cell-culture experiment three times independently, each biological replicate deriving from a separate cell preparation; technical replicates were averaged within each biological replicate before analysis. GraphPad Prism 11.0 served for data visualization and statistical analysis. Multiple treatment groups were compared against the control group (con) with one-way analysis of variance (one-way ANOVA) followed by Dunnett’s post hoc test. The predefined pairwise contrasts—pcDNA3.1-FABP3 versus pcDNA3.1-FABP3 + GW9662 and siFABP3 versus siFABP3 + GW7647—were assessed with unpaired two-tailed Student’s t tests. All measurement data are expressed as mean ± standard error of the mean (mean ± SEM), and p < 0.05 was taken as the threshold for statistical significance.
5. Conclusions
By meta-analysing abdominal fat and liver transcriptomic datasets, the present work identified 2520 meta-DEGs, significantly enriched in lipid metabolism pathways such as PPAR signaling. FABP3 recurred in the GO, KEGG and GSEA analyses and was therefore selected for in vitro functional validation. FABP3 enhanced the proliferation and survival of primary broiler preadipocytes and hepatocytes, raised triglyceride content and lipid droplet formation in both cell types, raised the lipogenic markers C/EBPα and leptin, and drove both lipid accumulation and preadipocyte differentiation. It also upregulated PPARγ and FABP4, and the pathway perturbation experiments demonstrated that the pro-lipogenic action of FABP3 depends on PPAR signaling pathway activity. These results place FABP3 as a candidate regulator of lipid deposition in broiler liver and abdominal adipose tissue and provide a starting point for dissecting the liver-adipose axis that governs abdominal fat deposition.
Supplementary Materials
The following supporting information can be downloaded at: https://www.mdpi.com/article/10.3390/ijms27219413/s1.
Author Contributions
H.Y.: Conceptualization, Methodology, Investigation, Formal analysis, Funding acquisition, Writing—review & editing, Supervision. Y.Z.: Software, Formal analysis, Visualization, Investigation, Writing—original draft, Writing—review & editing. K.J.: Software, Formal analysis, Investigation, Data curation, Writing—review & editing. Y.L.: Conceptualization, Methodology, Investigation, Formal analysis, Writing—original draft, Writing—review & editing. J.L.: Software, Data curation, Writing—review & editing. R.Z.: Conceptualization, Writing—review & editing, Supervision. All authors have read and agreed to the published version of the manuscript.
Funding
This research was funded by the Open project of State Key Laboratory of Animal Biotech Breeding (Grant No. 2026SKLAB6-30).
Institutional Review Board Statement
The animal study protocol was approved by the Animal Ethics Committee of Northeast Agricultural University (Approval No. NEAUEC20230209; approval date: 9 January 2023).
Informed Consent Statement
Not applicable.
Data Availability Statement
The datasets GSE42980, GSE49121, GSE104039, and GSE104038 analyzed in this study are publicly available in the NCBI Gene Expression Omnibus (GEO) database (https://www.ncbi.nlm.nih.gov/geo/, accessed on 14 May 2020).
Acknowledgments
The authors would like to express their sincere gratitude to all individuals and institutions that contributed to this research.
Conflicts of Interest
The authors declare no conflicts of interest.
Abbreviations
| DEGs | differentially expressed genes |
| RNA-Seq | RNA sequencing |
| FABP3 | fatty acid-binding protein 3 |
| GSEA | Gene set enrichment analysis |
| KEGG | Kyoto Encyclopedia of Genes and Genomes |
| GO | Gene Ontology |
| CCK-8 | cell counting kit-8 |
| TG | triglyceride |
| C/EBPα | CCAAT/enhancer-binding protein α |
| qPCR | quantitative real-time polymerase chain reaction |
| WB | Western blot |
| LPL | lipoprotein lipase |
| PPI | protein–protein interaction |
| BP | biological process |
| CC | cellular component |
| MF | molecular function |
| ACACA | acetyl-CoA carboxylase alpha |
| ELOVL6 | ELOVL fatty acid elongase 6 |
| PPAR | peroxisome proliferator-activated receptor |
| FASN | fatty acid synthase |
| SCD | stearoyl-CoA desaturase |
| FDR | false discovery rate (adjusted p-value) |
| SEM | standard error of the mean |
| PPARγ | peroxisome proliferator-activated receptor gamma |
| FABP4 | fatty acid-binding protein 4 |
| FABP | fatty acid-binding proteins |
| FL | fat line |
| LL | lean line |
| AFP | abdominal fat percentage |
| HG | high growth |
| LG | low growth |
| SiRNA | small interfering RNA |
| SCD5 | stearoyl-CoA desaturase 5 |
| RIPA | radio-immunoprecipitation assay |
| NC | negative control |
| EDU | 5-Ethynyl-2′-deoxyuridine |
| log2FC | log2(fold change) |
References
- Nones, K.; Ledur, M.C.; Ruy, D.C.; Baron, E.E.; Melo, C.M.R.; Moura, A.S.A.M.T.; Zanella, E.L.; Burt, D.W.; Coutinho, L.L. Mapping QTLs on chicken chromosome 1 for performance and carcass traits in a broiler x layer cross. Anim. Genet. 2006, 37, 95–100. [Google Scholar] [CrossRef] [Scilit] [PubMed]
- Zhang, H.; Hu, X.; Wang, Z.; Zhang, Y.; Wang, S.; Wang, N.; Ma, L.; Leng, L.; Wang, S.; Wang, Q.; et al. Selection Signature Analysis Implicates the PC1/PCSK1 Region for Chicken Abdominal Fat Content. PLoS ONE 2012, 7, e40736. [Google Scholar] [CrossRef] [Scilit] [PubMed]
- Xing, J.; Kang, L.; Jiang, Y. Effect of dietary betaine supplementation on lipogenesis gene expression and CpG methylation of lipoprotein lipase gene in broilers. Mol. Biol. Rep. 2011, 38, 1975–1981. [Google Scholar] [CrossRef] [Scilit] [PubMed]
- Wang, H.-B.; Li, H.; Wang, Q.-G.; Zhang, X.-Y.; Wang, S.-Z.; Wang, Y.-X.; Wang, X.-P. Profiling of chicken adipose tissue gene expression by genome array. BMC Genom. 2007, 8, 193. [Google Scholar] [CrossRef] [Scilit] [PubMed]
- Zhuo, Z.; Lamont, S.J.; Lee, W.R.; Abasht, B. RNA-Seq Analysis of Abdominal Fat Reveals Differences between Modern Commercial Broiler Chickens with High and Low Feed Efficiencies. PLoS ONE 2015, 10, e0135810. [Google Scholar] [CrossRef] [Scilit] [PubMed]
- Hausman, G.J.; Barb, C.R.; Fairchild, B.D.; Gamble, J.; Lee-Rutherford, L. Gene expression profiling in adipose tissue from growing broiler chickens. Adipocyte 2014, 3, 297–303. [Google Scholar] [CrossRef] [Scilit] [PubMed]
- Morigny, P.; Boucher, J.; Arner, P.; Langin, D. Lipid and glucose metabolism in white adipocytes: Pathways, dysfunction and therapeutics. Nat. Rev. Endocrinol. 2021, 17, 276–295. [Google Scholar] [CrossRef] [Scilit] [PubMed]
- Vijayakumar, P.; Bakyaraj, S.; Singaravadivelan, A.; Vasanthakumar, T.; Suresh, R. Meta-analysis of mammary RNA seq datasets reveals the molecular understanding of bovine lactation biology. Genome 2019, 62, 489–501. [Google Scholar] [CrossRef] [Scilit] [PubMed]
- Siddiqui, S.H.; Khan, M.; Kang, D.; Choi, H.W.; Shim, K. Meta-Analysis and Systematic Review of the Thermal Stress Response: Gallus gallus domesticus Show Low Immune Responses During Heat Stress. Front. Physiol. 2022, 13, 809648. [Google Scholar] [CrossRef] [Scilit] [PubMed]
- Zhang, X.; Xing, T.; Zhao, L.; Zhang, L.; Gao, F. Transcriptomic meta-analysis and exploration of differentially expressed gene functions in wooden breast myopathy of broilers. Poult. Sci. 2024, 103, 104047. [Google Scholar] [CrossRef] [Scilit] [PubMed]
- Li, B.; Hao, J.; Zeng, J.; Sauter, E.R. SnapShot: FABP Functions. Cell 2020, 182, 1066–1066.e1061. [Google Scholar] [CrossRef] [Scilit] [PubMed]
- Yi, B.; Wang, J.; Wang, S.; Yuan, D.; Sun, J.; Li, Z.; Mao, Y.; Hou, Q.; Liu, W. Overexpression of Banna mini-pig inbred line fatty acid binding protein 3 promotes adipogenesis in 3T3-L1 preadipocytes. Cell Biol. Int. 2014, 38, 918–923. [Google Scholar] [CrossRef] [Scilit] [PubMed]
- Cui, X.; Abouelezz, K.; Jiang, Z.; Gou, Z.; Wang, Y.; Jiang, S. Effects of metabolic energy intervention on lipid content and liver transcriptome in finisher yellow-feathered chickens. Ital. J. Anim. Sci. 2022, 21, 1362–1370. [Google Scholar] [CrossRef] [Scilit]
- Li, Y.; Huang, X.; Yang, G.; Xu, K.; Yin, Y.; Brecchia, G.; Yin, J. CD36 favours fat sensing and transport to govern lipid metabolism. Prog. Lipid Res. 2022, 88, 101193. [Google Scholar] [CrossRef] [Scilit] [PubMed]
- Guillou, H.; Zadravec, D.; Martin, P.G.P.; Jacobsson, A. The key roles of elongases and desaturases in mammalian fatty acid metabolism: Insights from transgenic mice. Prog. Lipid Res. 2010, 49, 186–199. [Google Scholar] [CrossRef] [Scilit] [PubMed]
- Liang, M.-Y.; Hou, X.-M.; Qu, B.; Zhang, N.; Li, N.; Cui, Y.-J.; Li, Q.-Z.; Gao, X.-J. Functional analysis of FABP3 in the milk fat synthesis signaling pathway of dairy cow mammary epithelial cells. Vitr. Cell. Dev. Biol.—Anim. 2014, 50, 865–873. [Google Scholar] [CrossRef] [Scilit] [PubMed]
- Wunderlich, C.M.; Hövelmeyer, N.; Wunderlich, F.T. Mechanisms of chronic JAK-STAT3-SOCS3 signaling in obesity. JAK-STAT 2013, 2, e23878. [Google Scholar] [CrossRef] [Scilit] [PubMed]
- Dodington, D.W.; Desai, H.R.; Woo, M. JAK/STAT—Emerging Players in Metabolism. Trends Endocrinol. Metab. 2018, 29, 55–65. [Google Scholar] [CrossRef] [Scilit] [PubMed]
- Kojta, I.; Chacińska, M.; Błachnio-Zabielska, A. Obesity, Bioactive Lipids, and Adipose Tissue Inflammation in Insulin Resistance. Nutrients 2020, 12, 1305. [Google Scholar] [CrossRef] [Scilit] [PubMed]
- Kuwata, H.; Hara, S. Role of acyl-CoA synthetase ACSL4 in arachidonic acid metabolism. Prostaglandins Other Lipid Mediat. 2019, 144, 106363. [Google Scholar] [CrossRef] [Scilit] [PubMed]
- Tsukahara, R.; Haniu, H.; Matsuda, Y.; Tsukahara, T. Heart-type fatty-acid-binding protein (FABP3) is a lysophosphatidic acid-binding protein in human coronary artery endothelial cells. FEBS Open Bio 2014, 4, 947–951. [Google Scholar] [CrossRef] [Scilit] [PubMed]
- Samulin, J.; Berget, I.; Lien, S.; Sundvold, H. Differential gene expression of fatty acid binding proteins during porcine adipogenesis. Comp. Biochem. Physiol. Part B Biochem. Mol. Biol. 2008, 151, 147–152. [Google Scholar] [CrossRef] [Scilit] [PubMed]
- Jing, Y.; Mu, F.; Xing, X.; Huang, J.; Lou, M.; Xu, H.; Ning, B.; Lou, Y.; Gao, Z.; Luo, H.; et al. Knockout and Restoration Reveal Differential Functional Roles of PPARγ1 and PPARγ2 in Chicken Adipogenesis. J. Agric. Food Chem. 2022, 70, 14959–14973. [Google Scholar] [CrossRef] [Scilit] [PubMed]
- Mu, F.; Jing, Y.; Ning, B.; Huang, J.; Cui, T.; Guo, Y.; You, X.; Yan, X.; Li, H.; Wang, N. Peroxisome proliferator-activated receptor γ isoforms differentially regulate preadipocyte proliferation, apoptosis, and differentiation in chickens. Poult. Sci. 2020, 99, 6410–6421. [Google Scholar] [CrossRef] [Scilit] [PubMed]
- Storch, J.; Corsico, B. The Multifunctional Family of Mammalian Fatty Acid–Binding Proteins. Annu. Rev. Nutr. 2023, 43, 25–54. [Google Scholar] [CrossRef] [Scilit] [PubMed]
- Garin-Shkolnik, T.; Rudich, A.; Hotamisligil, G.S.; Rubinstein, M. FABP4 Attenuates PPARγ and Adipogenesis and Is Inversely Correlated With PPARγ in Adipose Tissues. Diabetes 2014, 63, 900–911. [Google Scholar] [CrossRef] [Scilit] [PubMed]
- Madsen, M.S.; Siersbæk, R.; Boergesen, M.; Nielsen, R.; Mandrup, S. Peroxisome Proliferator-Activated Receptor γ and C/EBPα Synergistically Activate Key Metabolic Adipocyte Genes by Assisted Loading. Mol. Cell. Biol. 2014, 34, 939–954. [Google Scholar] [CrossRef] [Scilit] [PubMed]
- Zhang, Y.; Dallner, O.S.; Nakadai, T.; Fayzikhodjaeva, G.; Lu, Y.-H.; Lazar, M.A.; Roeder, R.G.; Friedman, J.M. A noncanonical PPARγ/RXRα-binding sequence regulates leptin expression in response to changes in adipose tissue mass. Proc. Natl. Acad. Sci. USA 2018, 115, E6039–E6047. [Google Scholar] [CrossRef] [Scilit] [PubMed]
- Seroussi, E.; Cinnamon, Y.; Yosefi, S.; Genin, O.; Smith, J.G.; Rafati, N.; Bornelöv, S.; Andersson, L.; Friedman-Einat, M. Identification of the Long-Sought Leptin in Chicken and Duck: Expression Pattern of the Highly GC-Rich Avian leptin Fits an Autocrine/Paracrine Rather Than Endocrine Function. Endocrinology 2016, 157, 737–751. [Google Scholar] [CrossRef] [Scilit] [PubMed]
- Resnyk, C.W.; Chen, C.; Huang, H.; Wu, C.H.; Simon, J.; Le Bihan-Duval, E.; Duclos, M.J.; Cogburn, L.A. RNA-Seq Analysis of Abdominal Fat in Genetically Fat and Lean Chickens Highlights a Divergence in Expression of Genes Controlling Adiposity, Hemostasis, and Lipid Metabolism. PLoS ONE 2015, 10, e0139549. [Google Scholar] [CrossRef] [Scilit] [PubMed]
- Resnyk, C.W.; Carré, W.; Wang, X.; Porter, T.E.; Simon, J.; Le Bihan-Duval, E.; Duclos, M.J.; Aggrey, S.E.; Cogburn, L.A. Transcriptional analysis of abdominal fat in genetically fat and lean chickens reveals adipokines, lipogenic genes and a link between hemostasis and leanness. BMC Genom. 2013, 14, 557. [Google Scholar] [CrossRef] [Scilit] [PubMed]
- Resnyk, C.W.; Carré, W.; Wang, X.; Porter, T.E.; Simon, J.; Le Bihan-Duval, E.; Duclos, M.J.; Aggrey, S.E.; Cogburn, L.A. Transcriptional analysis of abdominal fat in chickens divergently selected on bodyweight at two ages reveals novel mechanisms controlling adiposity: Validating visceral adipose tissue as a dynamic endocrine and metabolic organ. BMC Genom. 2017, 18, 626. [Google Scholar] [CrossRef] [Scilit] [PubMed]
- Desert, C.; Baéza, E.; Aite, M.; Boutin, M.; Le Cam, A.; Montfort, J.; Houee-Bigot, M.; Blum, Y.; Roux, P.F.; Hennequet-Antier, C.; et al. Multi-tissue transcriptomic study reveals the main role of liver in the chicken adaptive response to a switch in dietary energy source through the transcriptional regulation of lipogenesis. BMC Genom. 2018, 19, 187. [Google Scholar] [CrossRef] [Scilit] [PubMed]
- Chen, S.; Zhou, Y.; Chen, Y.; Gu, J. fastp: An ultra-fast all-in-one FASTQ preprocessor. Bioinformatics 2018, 34, i884–i890. [Google Scholar] [CrossRef] [Scilit] [PubMed]
- Kim, D.; Langmead, B.; Salzberg, S.L. HISAT: A fast spliced aligner with low memory requirements. Nat. Methods 2015, 12, 357–360. [Google Scholar] [CrossRef] [Scilit] [PubMed]
- García-Alcalde, F.; Okonechnikov, K.; Carbonell, J.; Cruz, L.M.; Götz, S.; Tarazona, S.; Dopazo, J.; Meyer, T.F.; Conesa, A. Qualimap: Evaluating next-generation sequencing alignment data. Bioinformatics 2012, 28, 2678–2679. [Google Scholar] [CrossRef] [Scilit] [PubMed]
- Liao, Y.; Smyth, G.K.; Shi, W. featureCounts: An efficient general purpose program for assigning sequence reads to genomic features. Bioinformatics 2014, 30, 923–930. [Google Scholar] [CrossRef] [Scilit] [PubMed]
- Ritchie, M.E.; Phipson, B.; Wu, D.; Hu, Y.; Law, C.W.; Shi, W.; Smyth, G.K. limma powers differential expression analyses for RNA-sequencing and microarray studies. Nucleic Acids Res. 2015, 43, e47. [Google Scholar] [CrossRef] [Scilit] [PubMed]
- Love, M.I.; Huber, W.; Anders, S. Moderated estimation of fold change and dispersion for RNA-seq data with DESeq2. Genome Biol. 2014, 15, 550. [Google Scholar] [CrossRef] [Scilit] [PubMed]
- Huo, Z.; Tang, S.; Park, Y.; Tseng, G. p-value evaluation, variability index and biomarker categorization for adaptively weighted Fisher’s meta-analysis method in omics applications. Bioinformatics 2020, 36, 524–532. [Google Scholar] [CrossRef] [Scilit] [PubMed]
- Yu, G.; Wang, L.-G.; Han, Y.; He, Q.-Y. clusterProfiler: An R Package for Comparing Biological Themes Among Gene Clusters. OMICS J. Integr. Biol. 2012, 16, 284–287. [Google Scholar] [CrossRef] [Scilit] [PubMed]
- Shannon, P.; Markiel, A.; Ozier, O.; Baliga, N.S.; Wang, J.T.; Ramage, D.; Amin, N.; Schwikowski, B.; Ideker, T. Cytoscape: A Software Environment for Integrated Models of Biomolecular Interaction Networks. Genome Res. 2003, 13, 2498–2504. [Google Scholar] [CrossRef] [Scilit] [PubMed]
- Marín-Martínez, F.; Sánchez-Meca, J. Weighting by Inverse Variance or by Sample Size in Random-Effects Meta-Analysis. Educ. Psychol. Meas. 2010, 70, 56–73. [Google Scholar] [CrossRef] [Scilit]
- Cochran, W.G. The Combination of Estimates from Different Experiments. Biometrics 1954, 10, 101–129. [Google Scholar] [CrossRef] [Scilit] [PubMed]
- Higgins, J.P.T.; Thompson, S.G. Quantifying heterogeneity in a meta-analysis. Stat. Med. 2002, 21, 1539–1558. [Google Scholar] [CrossRef] [Scilit] [PubMed]
- DerSimonian, R.; Laird, N. Meta-analysis in clinical trials. Control. Clin. Trials 1986, 7, 177–188. [Google Scholar] [CrossRef] [Scilit] [PubMed]
- Viechtbauer, W. Conducting Meta-Analyses in R with the metafor Package. J. Stat. Softw. 2010, 36, 1–48. [Google Scholar] [CrossRef] [Scilit]
- Patsopoulos, N.A.; Evangelou, E.; Ioannidis, J.P. Sensitivity of between-study heterogeneity in meta-analysis: Proposed metrics and empirical evaluation. Int. J. Epidemiol. 2008, 37, 1148–1157. [Google Scholar] [CrossRef] [Scilit] [PubMed]
- Liu, X.; Qin, K.; Wang, C.; Sun, X.; Li, Y.; Liu, Y.; Yang, X. Butyric acid reduced lipid deposition in immortalized chicken preadipocyte by inhibiting cell proliferation and differentiation. Poult. Sci. 2024, 103, 104171. [Google Scholar] [CrossRef] [Scilit] [PubMed]
- Yuan, P.; Li, H.; Zhang, H.; Fan, S.; Dai, Y.; Jia, J.; Shen, J.; Zhang, Y.; Li, H.; Sun, G.; et al. miR-200b-3p affects the proliferation and differentiation of chicken preadipocytes by modulating SESN1 expression through competition with CircADGRF5. Poult. Sci. 2025, 104, 105068. [Google Scholar] [CrossRef] [Scilit] [PubMed]
- Hou, D.-X.; Kunitake, T.; Kusuda, J.; Fujii, M. Primary Culture of Chicken Hepatocytes as an in Vitro Model for Determining the Influence of Dioxin. Biosci. Biotechnol. Biochem. 2001, 65, 218–221. [Google Scholar] [CrossRef] [Scilit] [PubMed]
- Lin, Z.; Tang, Y.; Li, Z.; Li, J.; Yu, C.; Yang, C.; Liu, L.; Wang, Y.; Liu, Y. miR-24-3p Dominates the Proliferation and Differentiation of Chicken Intramuscular Preadipocytes by Blocking ANXA6 Expression. Genes 2022, 13, 635. [Google Scholar] [CrossRef] [Scilit] [PubMed]
- Zhai, G.; Pang, Y.; Zou, Y.; Wang, X.; Liu, J.; Zhang, Q.; Cao, Z.; Wang, N.; Li, H.; Wang, Y. Effects of PLIN1 Gene Knockout on the Proliferation, Apoptosis, Differentiation and Lipolysis of Chicken Preadipocytes. Animals 2023, 13, 92. [Google Scholar] [CrossRef] [Scilit] [PubMed]
- Chen, H.; Liu, C.; Chen, C.; Su, Z.; Shu, J.; Zhang, M.; Li, H.; Cheng, B. Bone morphogenetic protein 4 regulates immortalized chicken preadipocyte proliferation by promoting G1/S cell cycle progression. FEBS Open Bio 2019, 9, 1109–1118. [Google Scholar] [CrossRef] [Scilit] [PubMed]
- Ramírez-Zacarías, J.L.; Castro-Muñozledo, F.; Kuri-Harcuch, W. Quantitation of adipose conversion and triglycerides by staining intracytoplasmic lipids with oil red O. Histochemistry 1992, 97, 493–497. [Google Scholar] [CrossRef] [Scilit] [PubMed]
- Cui, Q.; Wu, G.; Chen, Q.; Feng, Y.; Shang, F.; Ni, M.; Li, S. Transcriptome analysis reveals the regulatory role of the FTO gene in bovine preadipocyte differentiation. Genomics 2026, 118, 111233. [Google Scholar] [CrossRef] [Scilit] [PubMed]

Disclaimer/Publisher’s Note: The statements, opinions and data contained in all publications are solely those of the individual author(s) and contributor(s) and not of MDPI and/or the editor(s). MDPI and/or the editor(s) disclaim responsibility for any injury to people or property resulting from any ideas, methods, instructions or products referred to in the content. |
© 2026 by the authors. Licensee MDPI, Basel, Switzerland. This article is an open access article distributed under the terms and conditions of the Creative Commons Attribution (CC BY) license.