


Abstract
Traditional evolutionary analysis has relied primarily on one-dimensional (1D) sequencing data, but recent advances in three-dimensional (3D) genomics allow for deeper investigation of how genome architecture shapes evolutionary divergence. In this study, we analyze conserved and species-specific topologically associating domain (TAD) boundaries across multiple Oryza species to uncover both structural and functional evolutionary insights. Here, we characterize boundary conservation at different levels, from highly conserved to species-unique. We apply TCBF, a relatively novel and underutilized tool for TAD boundary conservation analysis, alongside a suite of complementary analyses, including gene ontology, RNA-seq, sequence conservation, and epigenetic profiling. Our approach not only validates canonical evolutionary relationships reflected in sequence data but also novel patterns unique to 3D genome organization. Most notably, our study uncovers strong associations between highly conserved TAD boundaries and RNA metabolism-related genes, as well as other genetic and epigenetic signatures, and a contrasting absence in minimally conserved boundaries. To our knowledge, we created the first phylogenetic reconstruction derived from topological domain data in plants, which demonstrated a strong similarity between 3D and 1D genomic evolutionary relationships. Overall, our work presents an approach that integrates the 3D genome structure into evolutionary genomics, addressing a critical and underexplored dimension of comparative plant genomics.
1. Introduction
Three-dimensional (3D) genomics aim to understand the structure, function, and heterogeneity of genomes by analyzing factors that shape higher-order chromatin organization. Nuclear DNA is compacted into chromatin, a complex of DNA and histone proteins, which undergo selective, location-specific activation to direct transcriptional activity. Cell-type-specific chromatin states, shaped by and shaping dynamic transcription, have become a powerful framework for mechanistic and translational research, with growing focus on the three-dimensional organization of the genome. 3D genomics aims to expand our understanding of genomic organizations beyond traditional one-dimensional (1D) sequence-driven research by recognizing that all genetic material has spatial properties. In recent years, the field of 3D genomics has expanded rapidly, with an increasing amount of research performed in an interspecies and comparative context [1], following the adoption and modernization of spatial genomic assays, including Chromosome Conformation Capture (3C), such as Hi-C [2] and Micro-C [3], ChIP-seq (Chromatin Immunoprecipitation Sequencing) [4], and ChromEMT [5].
Advancements in 3D genomics have, and will continue to, catalyze significant developments across scientific, biomedical, and agricultural disciplines. These include the identification of enhancer–promoter loops that govern transcriptional activity and reflect dynamic chromatin state and compartmentalization [6], and the discovery of topologically associating domains (TADs) and their role in core gene-regulatory architecture [7,8]. TADs, ubiquitous 3D-genomic domains pervasive across genomic landscapes, facilitate frequent self-interactions between DNA sequences [7,8]. These domains, typically ranging from kilobase- to megabase-sized regions, depending on the species, serve as organizational units that constrain interactions between genes and coordinated cis-regulatory elements, and help elucidate observations of linearly distant genetic interactions, which, in reality, are spatially proximal [7,8]. Each TAD is flanked by two TAD boundaries, which are genomic fragments that act as demarcators of interaction activity, preventing inter-TAD regulatory communication networks and enhancing intra-TAD chromatin contacts [9]. In mammalian cells, TAD boundaries are defined by the interaction between cohesin and CTCF, two proteins consequently vital for the formation of 3D genomic topologies [6,9]. Yet, it has been widely shown that CTCF, or any functional homolog, is absent in plants, albeit with the presence of various cohesin sub-units [10,11,12,13,14,15,16]. As such, mechanisms aiding in TAD boundary formation remain elusive in plants, and while potential boundary proteins have been identified, none have been strongly confirmed [11,12,17]. Current research is both focused on the formation of these boundaries, and on the transcriptional and epigenetic profiles of inter/intra-TAD regions in plants to better understand their phenotypic effects [11,12,17].
In addition to TADs’ critical role in maintaining both genomic organization and stability through pervasive transcriptional regulation across organisms [18,19], TADs and their boundaries are currently being investigated as a tool to understand evolutionary relationships more thoroughly [20,21,22]. Similar to mammalian species, the extent of TAD conservation appears to vary considerably across plant species. Only 8.23% of foxtail millet TADs were conserved in sorghum, with similarly low conservation reported between sorghum and maize [23]. At the species level, approximately 25% of TADs were conserved between Brassica rapa and Brassica oleracea [24], whereas 40–48% were conserved between two poplar species [25]. However, differences in Hi-C map resolution and criteria used to define TAD conservation across these studies limit direct comparisons and preclude a general estimate of the extent of TAD conservation across plants. Such investigations are vital as they allow for the understanding of natural mechanisms of the adaptations of certain plant species to environmental changes, enabling researchers to record, manipulate, and replicate specific molecular, cellular, and anatomical biomarkers associated with beneficial phenotypes for plant improvement. Some target traits for improvement include crop yield, drought and cold tolerance, plant vigor, flowering time, pest and herbicide resistance, and nutritional content [26]. Initial studies in plant species, based on limited yet persuading evidence from Arabidopsis [27,28,29], suggested that plant species lack TADs entirely; this assumption was disproven to apply to all plants after strong evidence of TAD presence in numerous other plant species arose [19,23,30,31,32], although the original conclusion still holds for Arabidopsis [33]. Recent findings [19] dictate clear 3D-genomic-based evolutionary relationships between certain rice species and suggest key correlations between functional characteristics, such as structural variations, histone modifications, and epigenetic profiles, and conserved TADs. Studies also indicate varying epigenetic signatures near or on plant TAD boundaries [19,34], and a scarcity of chromatin looping in TAD boundary domains, but rather between CpG islands [23], all of which are akin to conventional findings associated with mammalian TAD boundaries [20]. While 3D-genomic-based research has concentrated largely on the mammalian/drosophila genome and has recently begun advancing into plant research, applications in plants and non-mammalian organisms remain limited, leaving the 3D architecture of numerous genomes comparatively understudied due to limited integration of advanced spatial genomic methods.
Our study aims to characterize the functional and structural landscape of TAD boundaries across multiple Oryza genomes, to compare their interspecific conservation, and to provide insight into evolutionary relationships among rice species through the lens of 3D genome architecture. Previous research has investigated TAD conservation across various plant species, with several studies reporting moderate levels of interspecific conservation [19,23,24,25,30,31]; however, these efforts often rely on disparate methodologies, distinct organisms, and inconsistent definitions of what constitutes a conserved TAD. Only a few studies [19,35] have tentatively explored plant evolutionary patterns shaped by TAD boundary abundance, but failed to distinguish levels of TAD boundary conservation, focusing primarily on the TADs themselves. Collectively, these limitations prevent prior work from generating clear, inference-driven conclusions about evolutionary interrelationships or from establishing a coherent, 3D-genomics-based evolutionary framework for plant species. Here, we analyze TAD boundary conservation across multiple Asian domesticated rice (Oryza sativa) landraces, including Azucena (tropical japonica), Nipponbare (temperate japonica), and IR64 (indica), and two closely related wild species, O. rufipogon and O. meridionalis. While both are wild species, O. rufipogon retains greater geographic (Asian) and genetic similarity to the domesticated cultivars, having diverged by approximately 0.30 Mya, whereas O. meridionalis is uniquely Australasian and diverged considerably earlier, at approximately 2.41 Mya [36]. We apply a novel and underutilized tool for boundary conservation detection that can be applied to the nuclear genome of any species with accurate genomic information [35], and unprecedentedly, allows for the direct comparison of TAD boundaries interspecifically without the need for any coordinate-based genomic conversions (liftOver). LiftOver-based methods, including the study conducted by Kurbidaeva et al. 2025 [19], define conserved TADs and TAD boundaries based on the translation of their coordinates between species with the liftOver tool. This tool relies on the pairwise genome alignments between the species, which experiences inaccuracies stemming from complex structural variants and ambiguous mapping. TCBF incorporates synteny block analysis and graph clustering into its pipeline, increasing accuracy of interspecies comparisons of TAD boundaries. In addition, the approach used by Kurbidaeva et al. 2025 [19] first determines conservation at the TAD level and subsequently defines fixed-width boundary regions flanking those of conserved TADs, instead of analyzing the TAD boundary sequences directly. Thus, conserved boundaries are often used as proxies for conserved TADs, although this may introduce computational artifacts that do not fully reflect biological reality. Results from the tool were then used for further qualitative and quantitative analyses, including those involving structural, functional, and evolutionary objectives (Figure S1). We then synthesized our findings to generate a clear, unprecedented 3D-genomic-based phylogenetic tree that reflects the evolutionary trajectories shaped by 3D genome architecture in our selected wild and domesticated rice cultivars, and used it for comparison with canonical one-dimensional evolutionary reconstructions (Figure S1).
2. Results
2.1. Interspecific Conservation of Rice TAD Boundaries
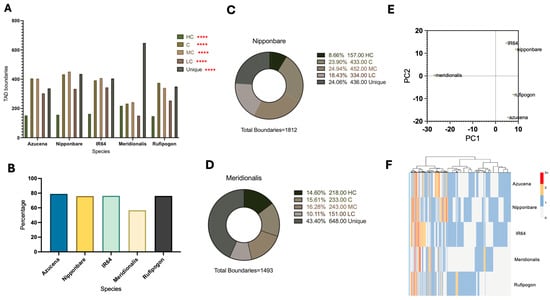
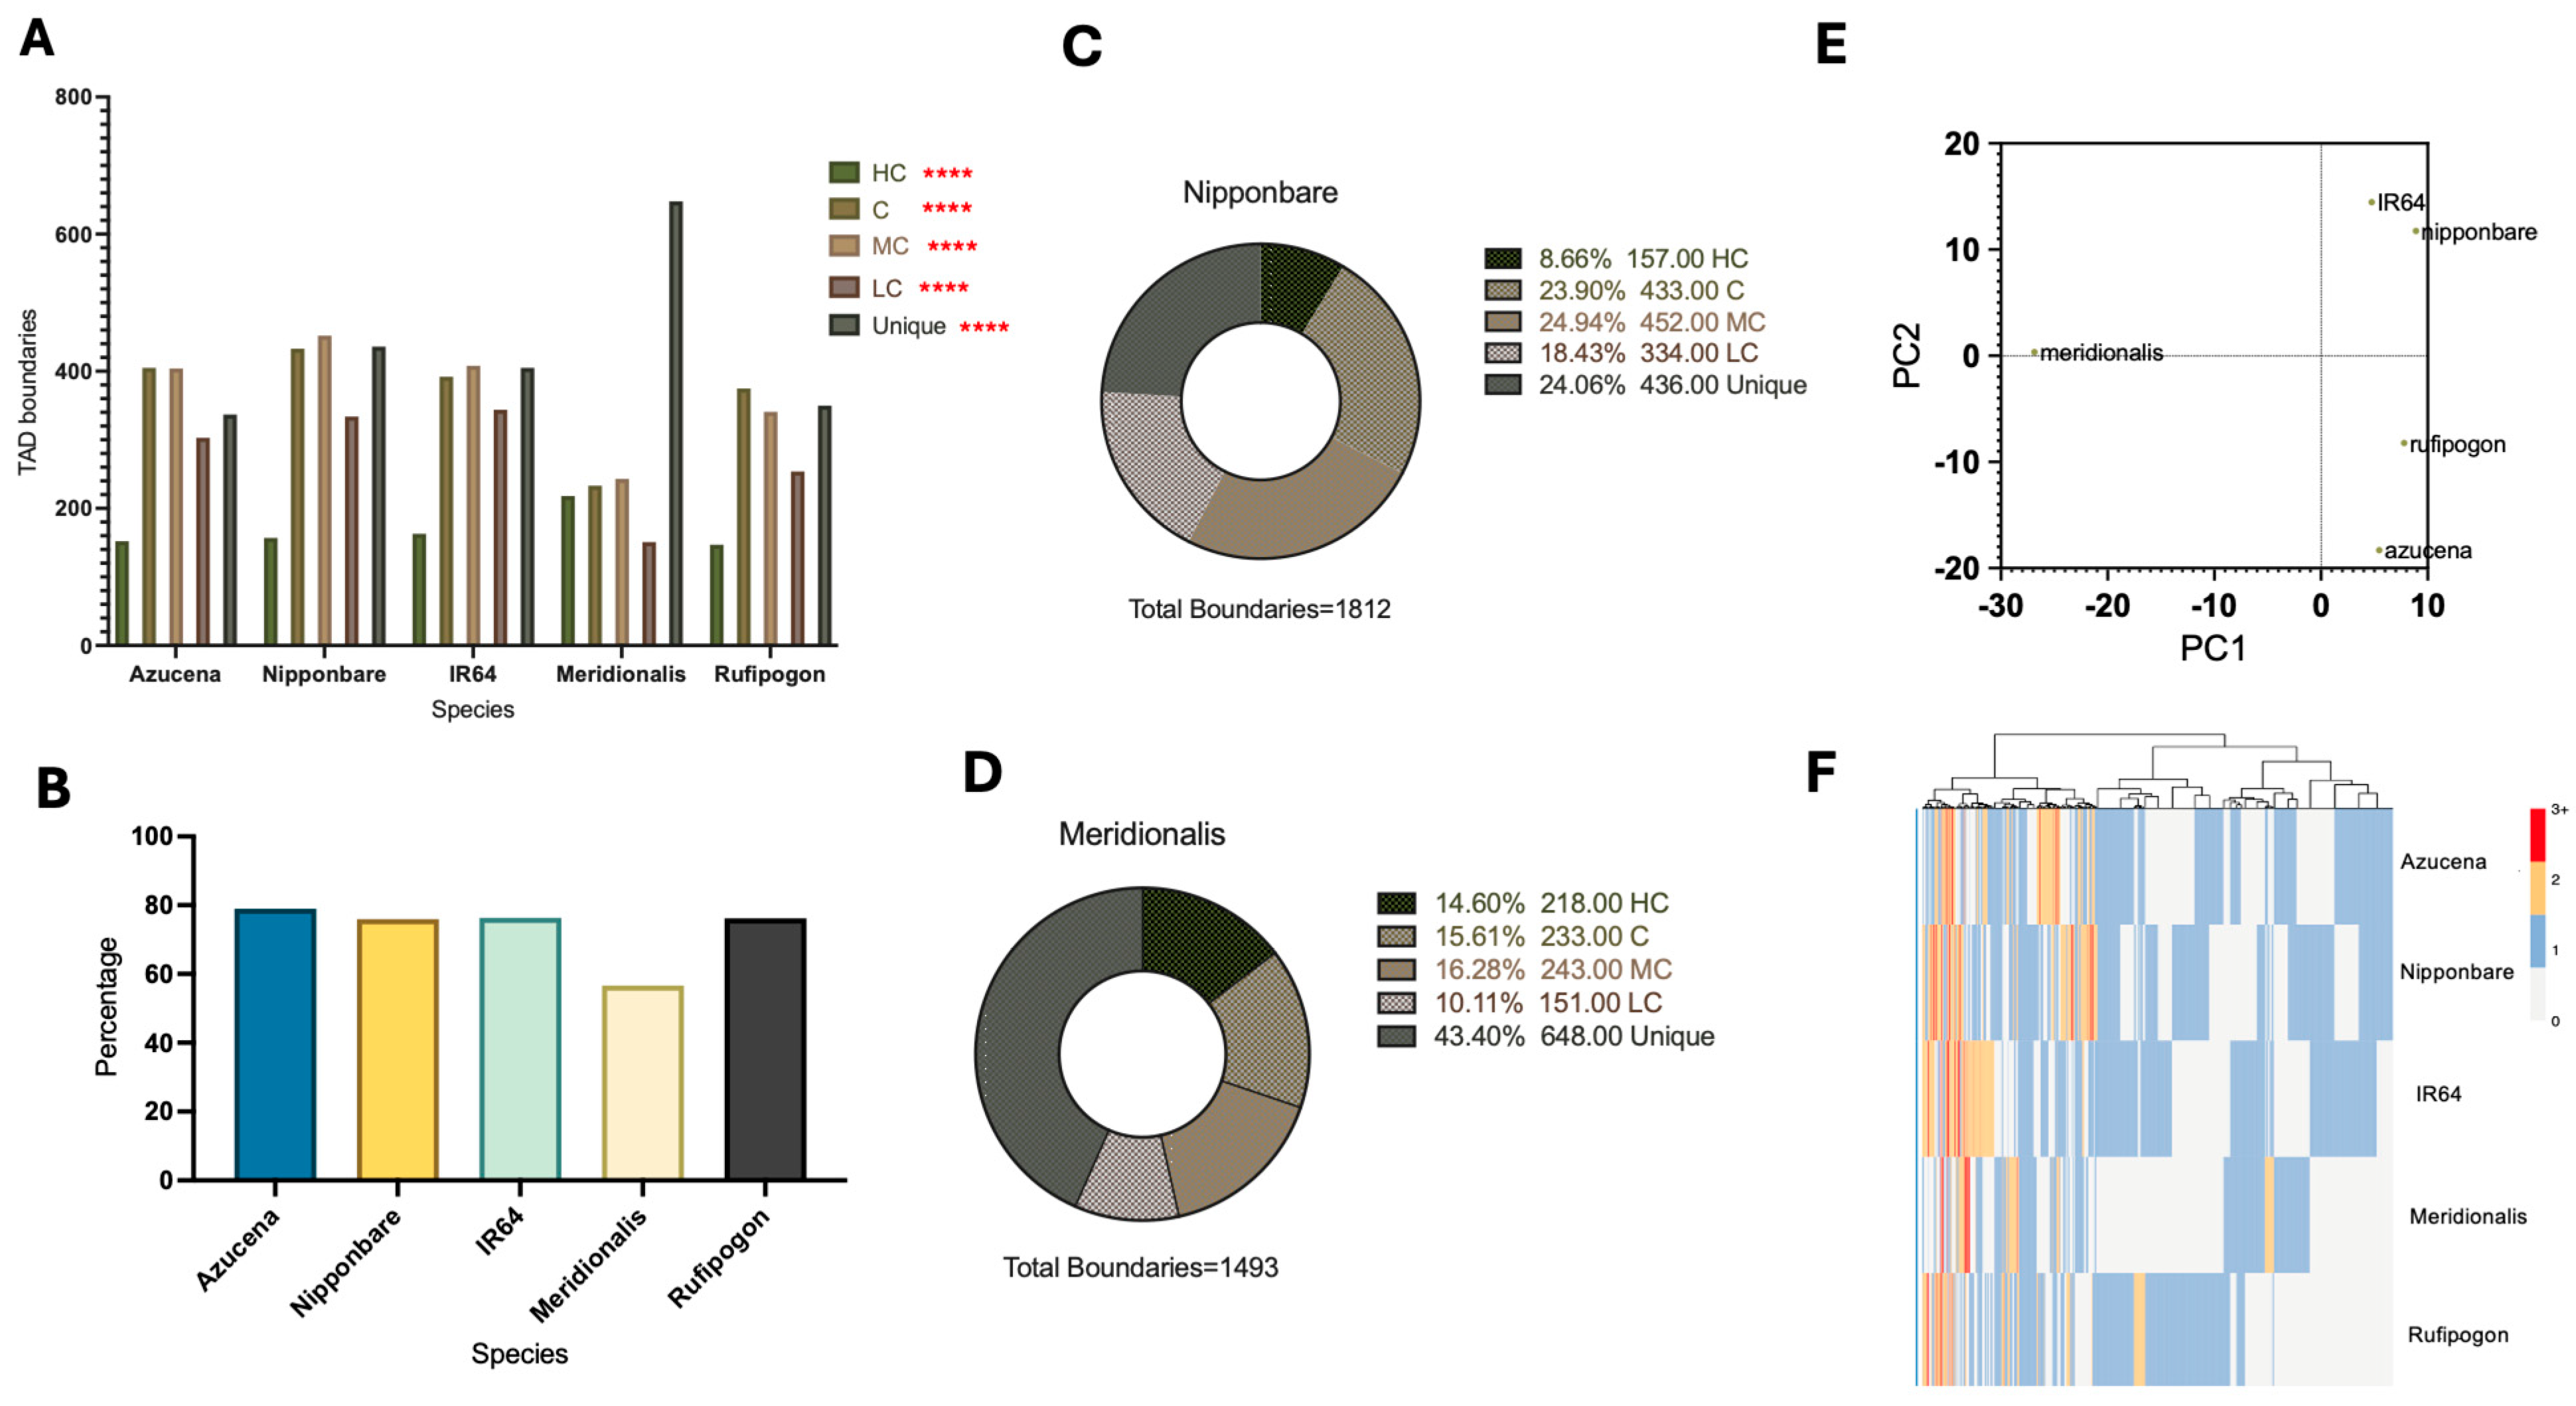
The TCBF tool was used to identify conserved TAD boundary domains across five selected wild and domesticated O. sativa genomes and to classify boundaries according to their degree of conservation (Figure 1A). Across all genomes, conserved (C) and moderately conserved (MC) boundaries represented the most abundant conservation classes, with both particularly enriched in the Nipponbare reference genome and differing by no more than approximately ±50 boundaries among Azucena, IR64, and O. rufipogon. Unique boundaries were similarly abundant across these four genomes, with C, MC, and Unique boundary counts consistently exceeding 200. In contrast, HC boundaries were substantially less abundant than the other non-unique conservation categories in all genomes except O. meridionalis, while LC boundaries consistently represented either the least or second least abundant conservation class. Across multiple metrics, O. meridionalis exhibited a markedly distinct conservation profile compared to the other cultivars. Relative to the Nipponbare reference genome, both HC and Unique boundaries were enriched, with Unique boundaries increasing by 19.32% of the total TAD boundary landscape (Figure 1C,D). Correspondingly, O. meridionalis possessed the lowest overall proportion of conserved TAD boundaries among all analyzed genomes, whereas Azucena displayed the highest level of conservation by a slight margin (Figure 1B). Differences in conservation category distributions were statistically significant across all five genomes (Figure 1A). Principal component analysis (PCA) further highlighted the distinct genomic architecture of O. meridionalis (Figure 1E). On PC1, O. meridionalis formed a pronounced outlier, whereas the remaining genomes clustered closely together. In contrast, PC2 separated the genomes into two distinct groups, with Nipponbare clustering with IR64 and Azucena clustering with O. rufipogon, while O. meridionalis occupied an intermediate position almost precisely between the two clusters. A three-dimensional PCA plot incorporating PC3 demonstrated that the apparent clustering along PC2 was sensitive to the inclusion of additional principal-component variation, with Nipponbare shifting toward O. rufipogon and Azucena toward IR64, while O. meridionalis retained an almost unchanged PC2 position (Figure S3). None of the PCA axes demonstrate Nipponbare–Azucena clustering. Heatmap clustering further emphasized the statistically significant divergence of the O. meridionalis genome (p < 2.2 × 10⁻¹⁶), revealing two extensive regions lacking conserved TAD boundaries within the TCBF conservation matrix, indicative of localized depletion of 3D genome conservation (Figure 1F). A comparable, though less pronounced, region was also observed in O. rufipogon at corresponding genomic positions. In contrast, Nipponbare and Azucena exhibited a more continuous distribution of conserved boundaries throughout their genomes, with relatively few regions devoid of conservation. Our results indicate highly statistically significant (p < 0.0001) relationships between O. meridionalis and all other rice cultivars, as well as between O. rufipogon and Nipponbare and Azucena. The data from Figure 1 support an evolutionary and statistically significant divergence in 3D genome conservation in the O. meridionalis genome, supported by the quantity and clustering of both conserved and unique TAD boundaries.
Figure 1.
(A) Quantity of TAD boundaries stratified across selected rice species and conservation levels. Significance of Fisher’s exact tests depicted as **** p < 0.0001. (B) Percentage of Nipponbare TAD boundaries conserved by level against total boundaries present in the Nipponbare genome. Each conservation level is represented by a unique color. (C) Percentage of O. meridionalis TAD boundaries conserved by level against total boundaries present in the O. meridionalis genome. (D) Principal component analysis (PCA) of species-specific TAD boundary conservation group profiles. Each point represents a species. The first two principal components (PC1 and PC2) are shown, collectively explaining ~50% of the total variance. (E) Bar plot depicting the proportion of total conserved boundaries (accumulation of HC, C, MC, and LC) to total boundaries for each species. (F) Heatmap of phylogenomic profiles across selected rice species. Hierarchical clustering was performed based on species-specific distributions of TAD boundary conservation groups. Color intensity represents the number of TAD boundaries within each group for each species. Statistical significance was determined by Kruskal–Wallis testing (p < 0.0001). Categorical pairwise significance (determined by FDR-adjusted post-hoc Dunn’s multiple comparison tests) is reported in-text.
2.2. TCBF Performance and TAD Boundary Group Creation
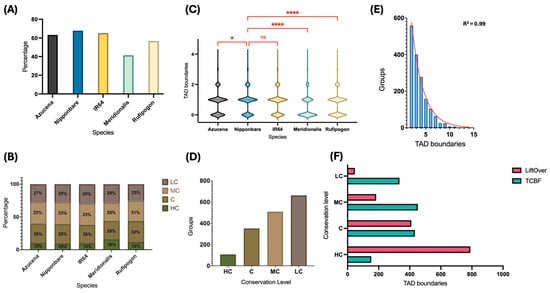
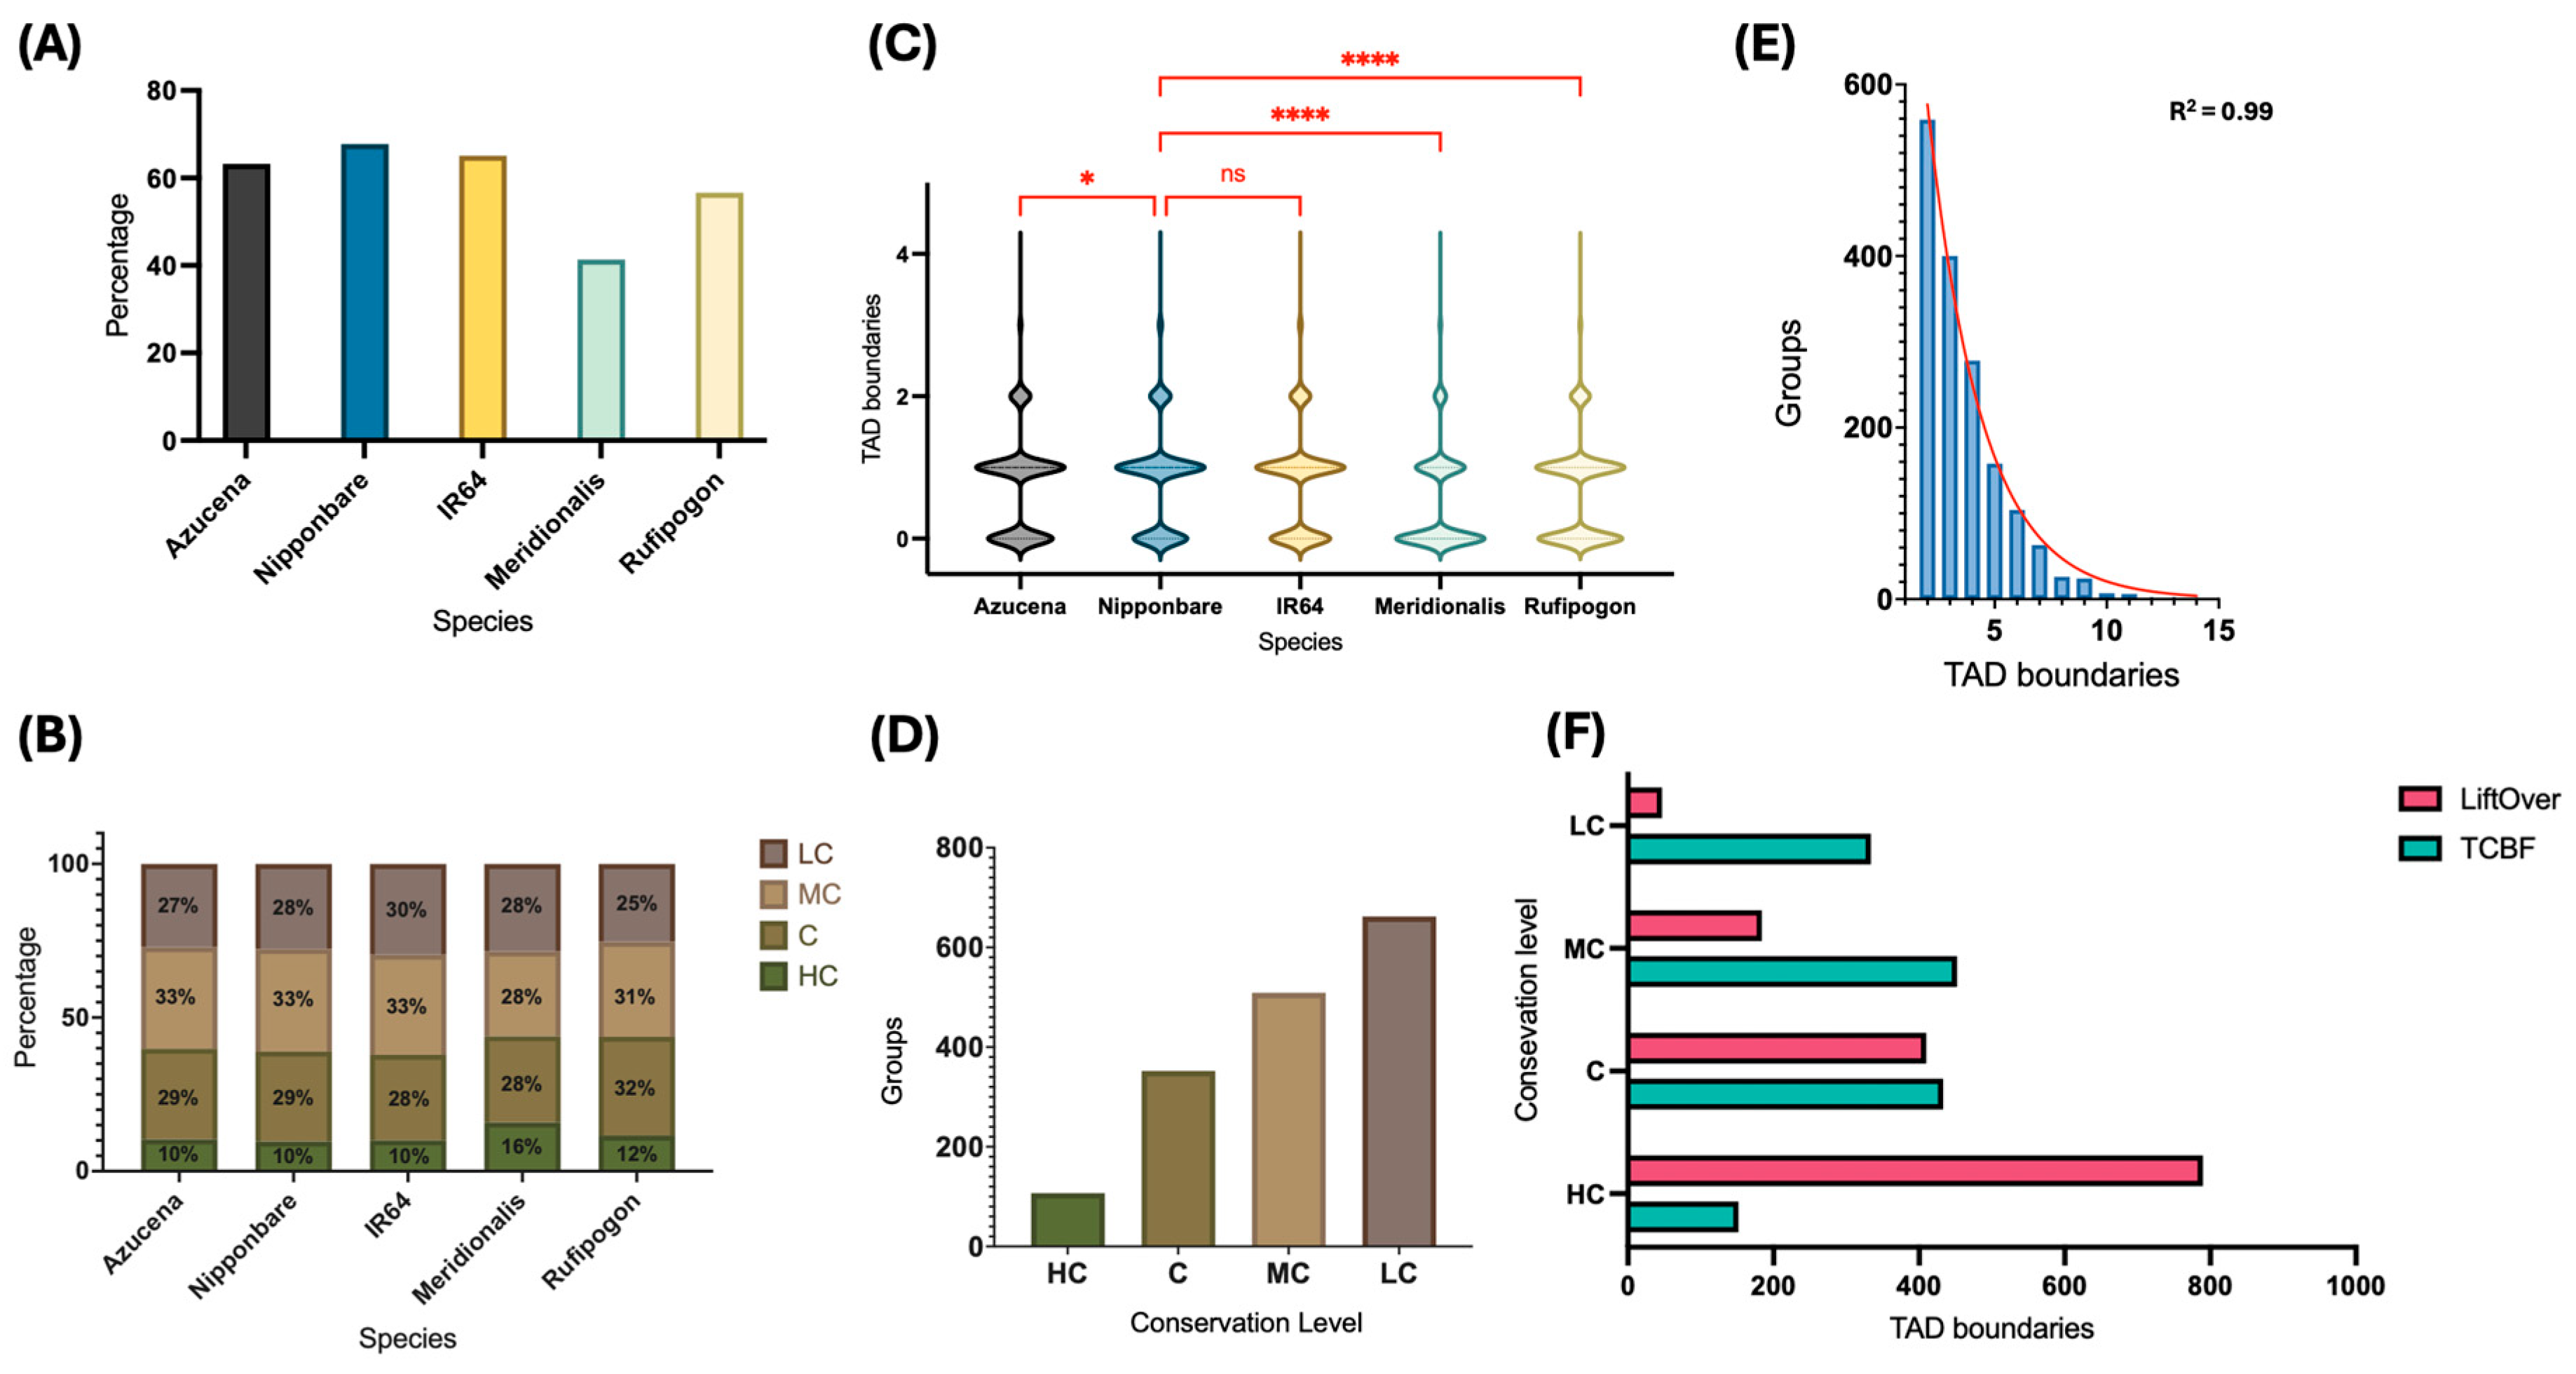
The TCBF algorithm identifies evolutionarily conserved TAD boundary groups by clustering homologous TAD boundaries across the selected genomes according to their genomic positions and conservation. Across all 1630 identified TAD boundary groups, no species contributed more than three TAD boundaries to a single group, with the vast majority of groups containing only a single boundary per species rather than multiple conserved boundaries, indicating that interspecific conservation is overwhelmingly represented by one-to-one boundary relationships rather than complex multiplexed structures (Figure 2C). Species representation across TAD boundary groups was non-uniform and broadly reflected the evolutionary patterns observed previously. O. meridionalis was represented in fewer than 50% of all TAD boundary groups, the lowest proportion among the five analyzed genomes, whereas the Nipponbare reference genome was represented in nearly 70% of all groups (Figure 2A). Among the boundary groups in which each species was present, O. meridionalis exhibited a greater proportion of HC groups (16%) than the remaining genomes (10–12%), consistent with its distinct conservation landscape identified in the preceding analyses (Figure 2B). In contrast, the relative distributions of the remaining conservation categories were broadly similar among the other genomes. The internal composition of TAD boundary groups also differed statistically significantly for O. meridionalis. Groups lacking O. meridionalis boundaries were substantially more prevalent, whereas groups containing one or more O. meridionalis boundaries occurred less frequently, representing the opposite trend observed for the remaining four genomes (Figure 2C). The overall structure of TAD boundary groups followed highly consistent trends. The number of boundary groups decreased progressively with the increasing conservation level, demonstrating an inverse relationship between group abundance and conservation strength (Figure 2D). Likewise, the distribution of cumulative TAD boundary counts per group was strongly right-skewed (Figure 2E). Finally, TCBF-derived boundary counts were compared with those reported by Kurbidaeva et al. 2025 [19], which were generated using a LiftOver-based approach. TCBF identified greater numbers of LC-, MC-, and C-classified boundaries, whereas the LiftOver methodology identified substantially higher numbers of C and HC boundaries (Figure 2F). Although the complete boundary sets showed 100% genomic overlap, with a minimum overlap threshold set to 1 bp (unpublished data), conservation-category-specific concordance between TCBF and the previous LiftOver-based approach was substantially lower (Table S4). These differences likely reflect the distinct units of conservation assessed by the two frameworks: TCBF directly compares TAD boundaries across species, whereas the previous approach derives boundary classifications from the conservation status of their associated TADs. Figure 2, overall, denotes evolutionary trends effectively analogous to those aforementioned, highlighting that boundary-specific relationships are indeed apparent in both species- and conservation level-specific analyses, and demonstrating O. meridionalis as a divergent Oryza cultivar in 3D genomic terms.
Figure 2.
(A) Species’ presence across all TAD boundary groups represented by the proportion of TAD boundary groups containing the given species to total TAD boundary groups (n = 1630). (B) Conservation-level breakdown (by percentage) of TAD boundary groups containing a given species. (C) Violin plots showing the distribution of the number of TAD boundaries across TAD boundary groups per species. Significance of pairwise Welch’s t-tests depicted as ns p ≥ 0.05; * p < 0.05; **** p < 0.0001. Statistical significance was assessed using pairwise Welch’s t-tests comparing each species with Nipponbare (reference). (D) Bar plot depicting the quantity of TAD boundary groups associated with each conservation category (excluding Unique). (E) Histogram of total sizes of TAD boundary groups, based on the total accumulation of TAD boundaries present in the group across all species. A non-linear regression was created (plotted in R) to show statistical fit of data (R2 = 0.99). (F) Comparison of TAD boundary data between tool leveraged here (TCBF) and the canonical method (LiftOver) depicted by a horizontal bar plot representing the total quantity of TAD boundaries per conservation category output between methods.
2.3. Chromosomal Distribution of TAD Boundary Conservation
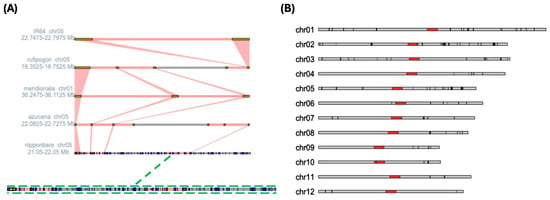
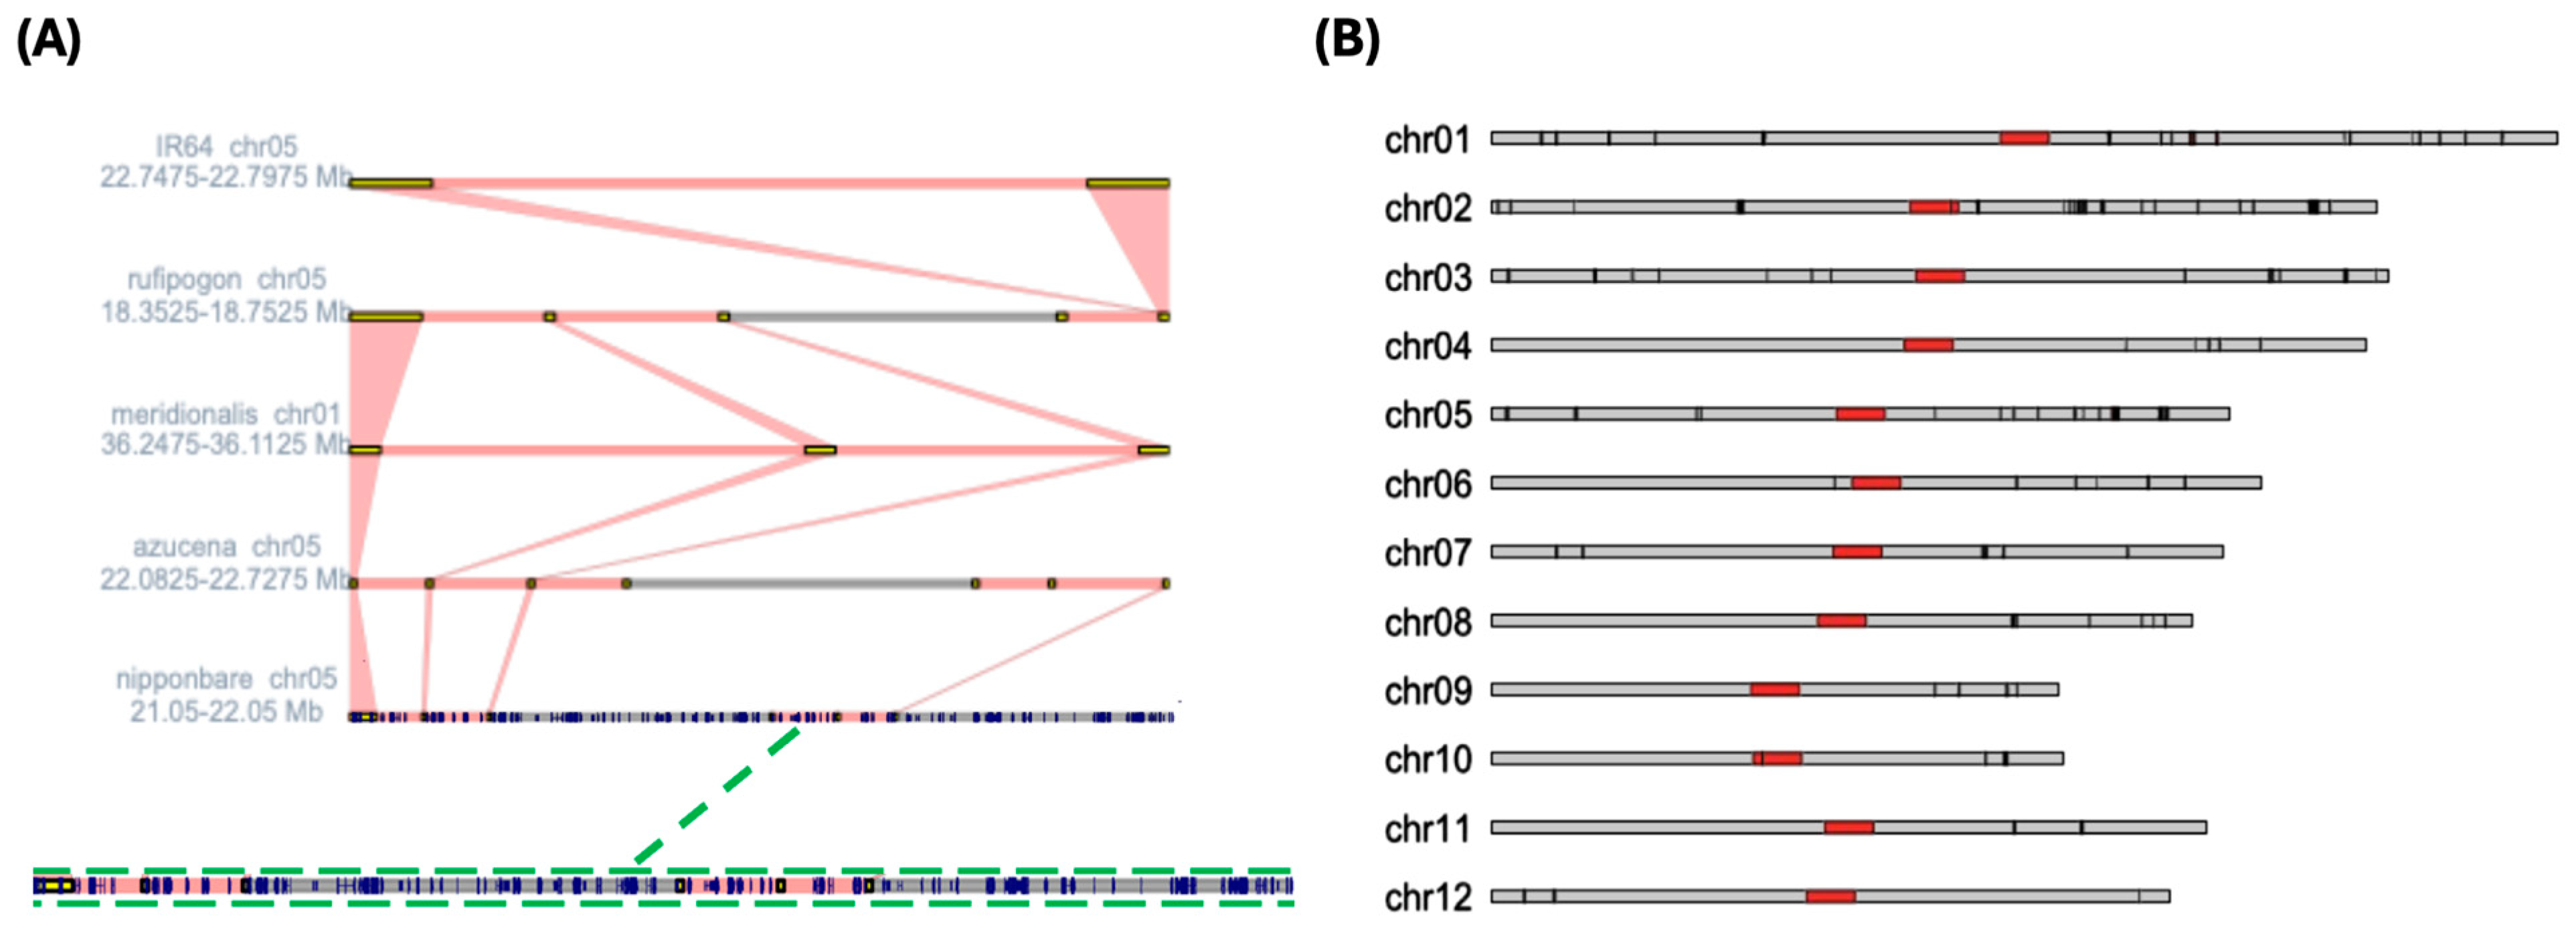
Alongside quantitative analyses based on relative conservation scores, we visualized TAD boundary conservation within chromosomal context at both local and genome-wide scales. Synteny mapping, as described by He et al. 2023 [35], enables detailed visualization of cross-species relationships within a 1-Mb genomic window but is not readily suited to genome-wide comparisons. Within the selected region, TAD boundaries present on the O. meridionalis track are frequently aligned with boundaries across multiple other genomes, visually recapitulating our definition of highly conserved (HC) TAD boundaries (Figure 3A). This pattern is consistent with the previously observed enrichment of HC boundaries in O. meridionalis. Boundaries in O. meridionalis also appeared broader than those in the other rice genomes within this window; however, this localized visualization is insufficient to support conclusions regarding genome-wide differences in TAD boundary size. The gene map overlaid on the Nipponbare track further revealed an apparent scarcity of genes within conserved TAD boundaries despite substantial gene density across the surrounding 1-Mb region, suggesting a potential inverse relationship between highly conserved TAD boundary localization and gene distribution (Figure 3A). We next examined whether TAD boundary conservation was associated with chromosomal position at the genome-wide scale. Although no clear differences in HC boundary localization were observed across broad chromosomal regions, such as chromosome arms or telomeric regions, HC TAD boundaries were notably depleted from centromeric regions across the 12 Nipponbare chromosomes (Figure 3B). The same pattern, albeit less evident, was present when examining the chromosomal localization of all conserved Nipponbare boundaries, not only those of the highest conservation (Figure S4). HC boundary density also appeared to vary with chromosome identity, with a partial trend across chromosome number (Figure 3B). Together, these patterns suggest that TAD boundary conservation may reflect the functional maintenance of genomic architecture.
Figure 3.
(A) Synteny relationship mapping of conserved TAD boundaries across respective 1 MB regions in each selected genome. Genes located within the displayed Nipponbare region are overlaid as blue segments. (B) Ideogram visualizing HC TAD boundary chromosomal localization for the Nipponbare genome. Black bars represent highly conserved TAD boundaries. Red regions denote centromeric sections of each chromosome.
2.4. Functional Significance of Conserved TAD Boundaries
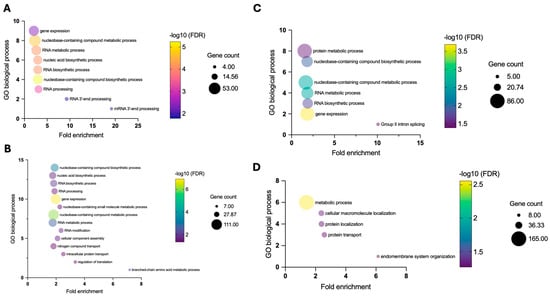
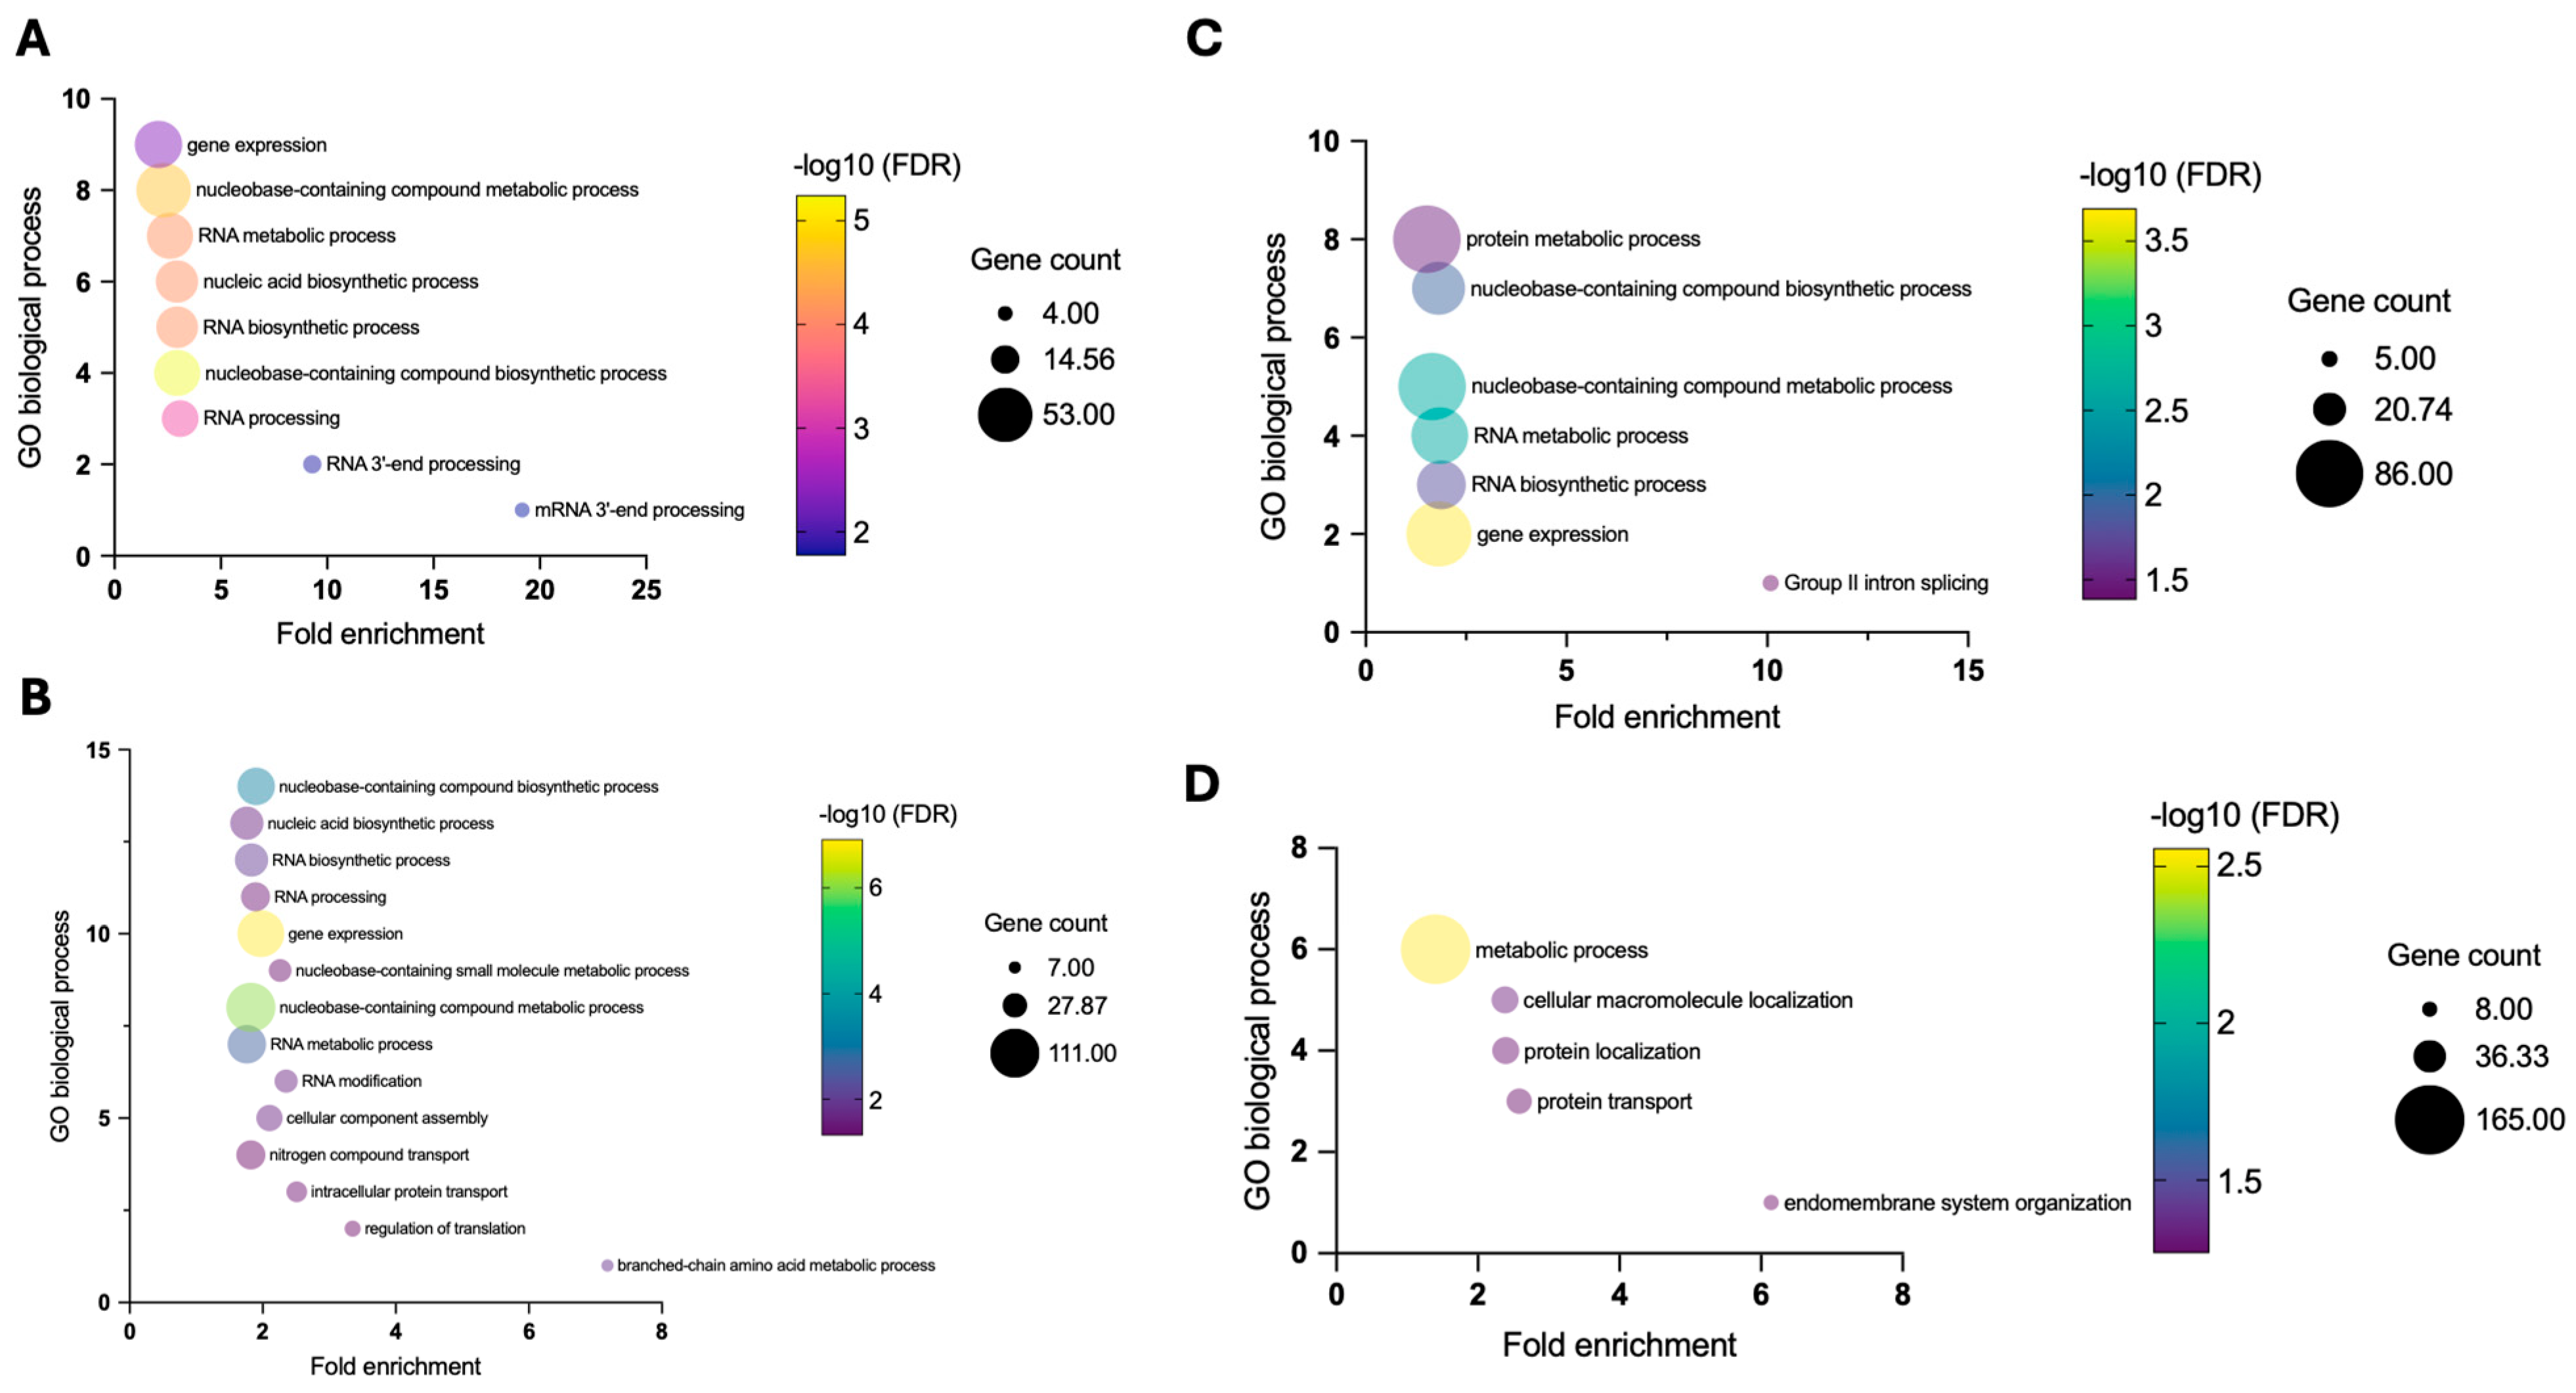
To better understand the functional dynamics associated with TAD boundary conservation across rice species, we examined whether specific biological processes were enriched in conserved boundaries. We first performed Gene Ontology (GO) enrichment analysis with PANTHER in the Nipponbare genome for genes overlapping with TAD boundaries across conservation categories (Figure 4). Our results revealed a striking relationship between boundary conservation and the enrichment of RNA metabolism-associated genes. HC boundaries exhibited nine enriched GO Biological Process (BP) terms (Figure 4A), all of which were related to RNA metabolism, processing, or gene expression, whereas LC boundaries exhibited only four enriched GO-BP terms, none of which were associated with RNA-related processes (Figure 4D). C and MC boundaries displayed intermediate patterns, forming a progressive decline in RNA-associated enrichment with decreasing boundary conservation (Figure 4B,C). This pattern provides evidence of a functional association between evolutionary TAD boundary conservation and RNA metabolism-associated gene enrichment. Fold enrichment was particularly pronounced among GO terms associated with HC boundaries, reaching nearly 20-fold for mRNA 3′-end processing, with enrichment strength similarly declining across conservation categories. Notably, neither the total number of enriched GO terms nor the cumulative gene counts represented across enriched GO terms followed a similar conservation-dependent pattern; rather, the observed trend was specific to RNA-associated processes (Table S3). Additional GO enrichment of genes present within all conserved TAD boundaries revealed similar conservation patterns of RNA-associated terms in PANTHER, as well as g:Profiler and clusterProfiler (Figures S5 and S6).
Figure 4.
Gene Ontology (GO) biological process (BP) enrichment analysis from PANTHER of genes associated with (A) highly conserved, (B) conserved, (C) moderately conserved, and (D) least conserved TAD boundaries in the Nipponbare reference genome. Fold enrichment (observed proportion/expected proportion) is plotted for significantly enriched GO terms, ordered from lowest to highest fold enrichment. Bubble color represents the −log10-transformed FDR-adjusted p-value, while bubble size corresponds to the number of genes associated with each GO term.
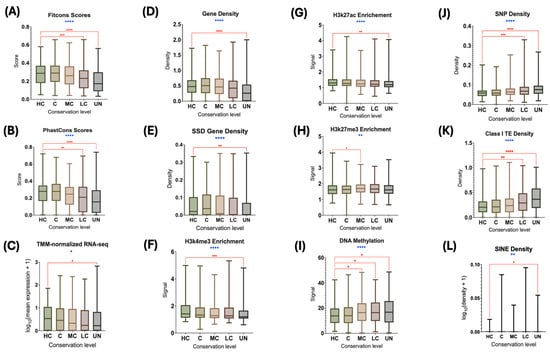
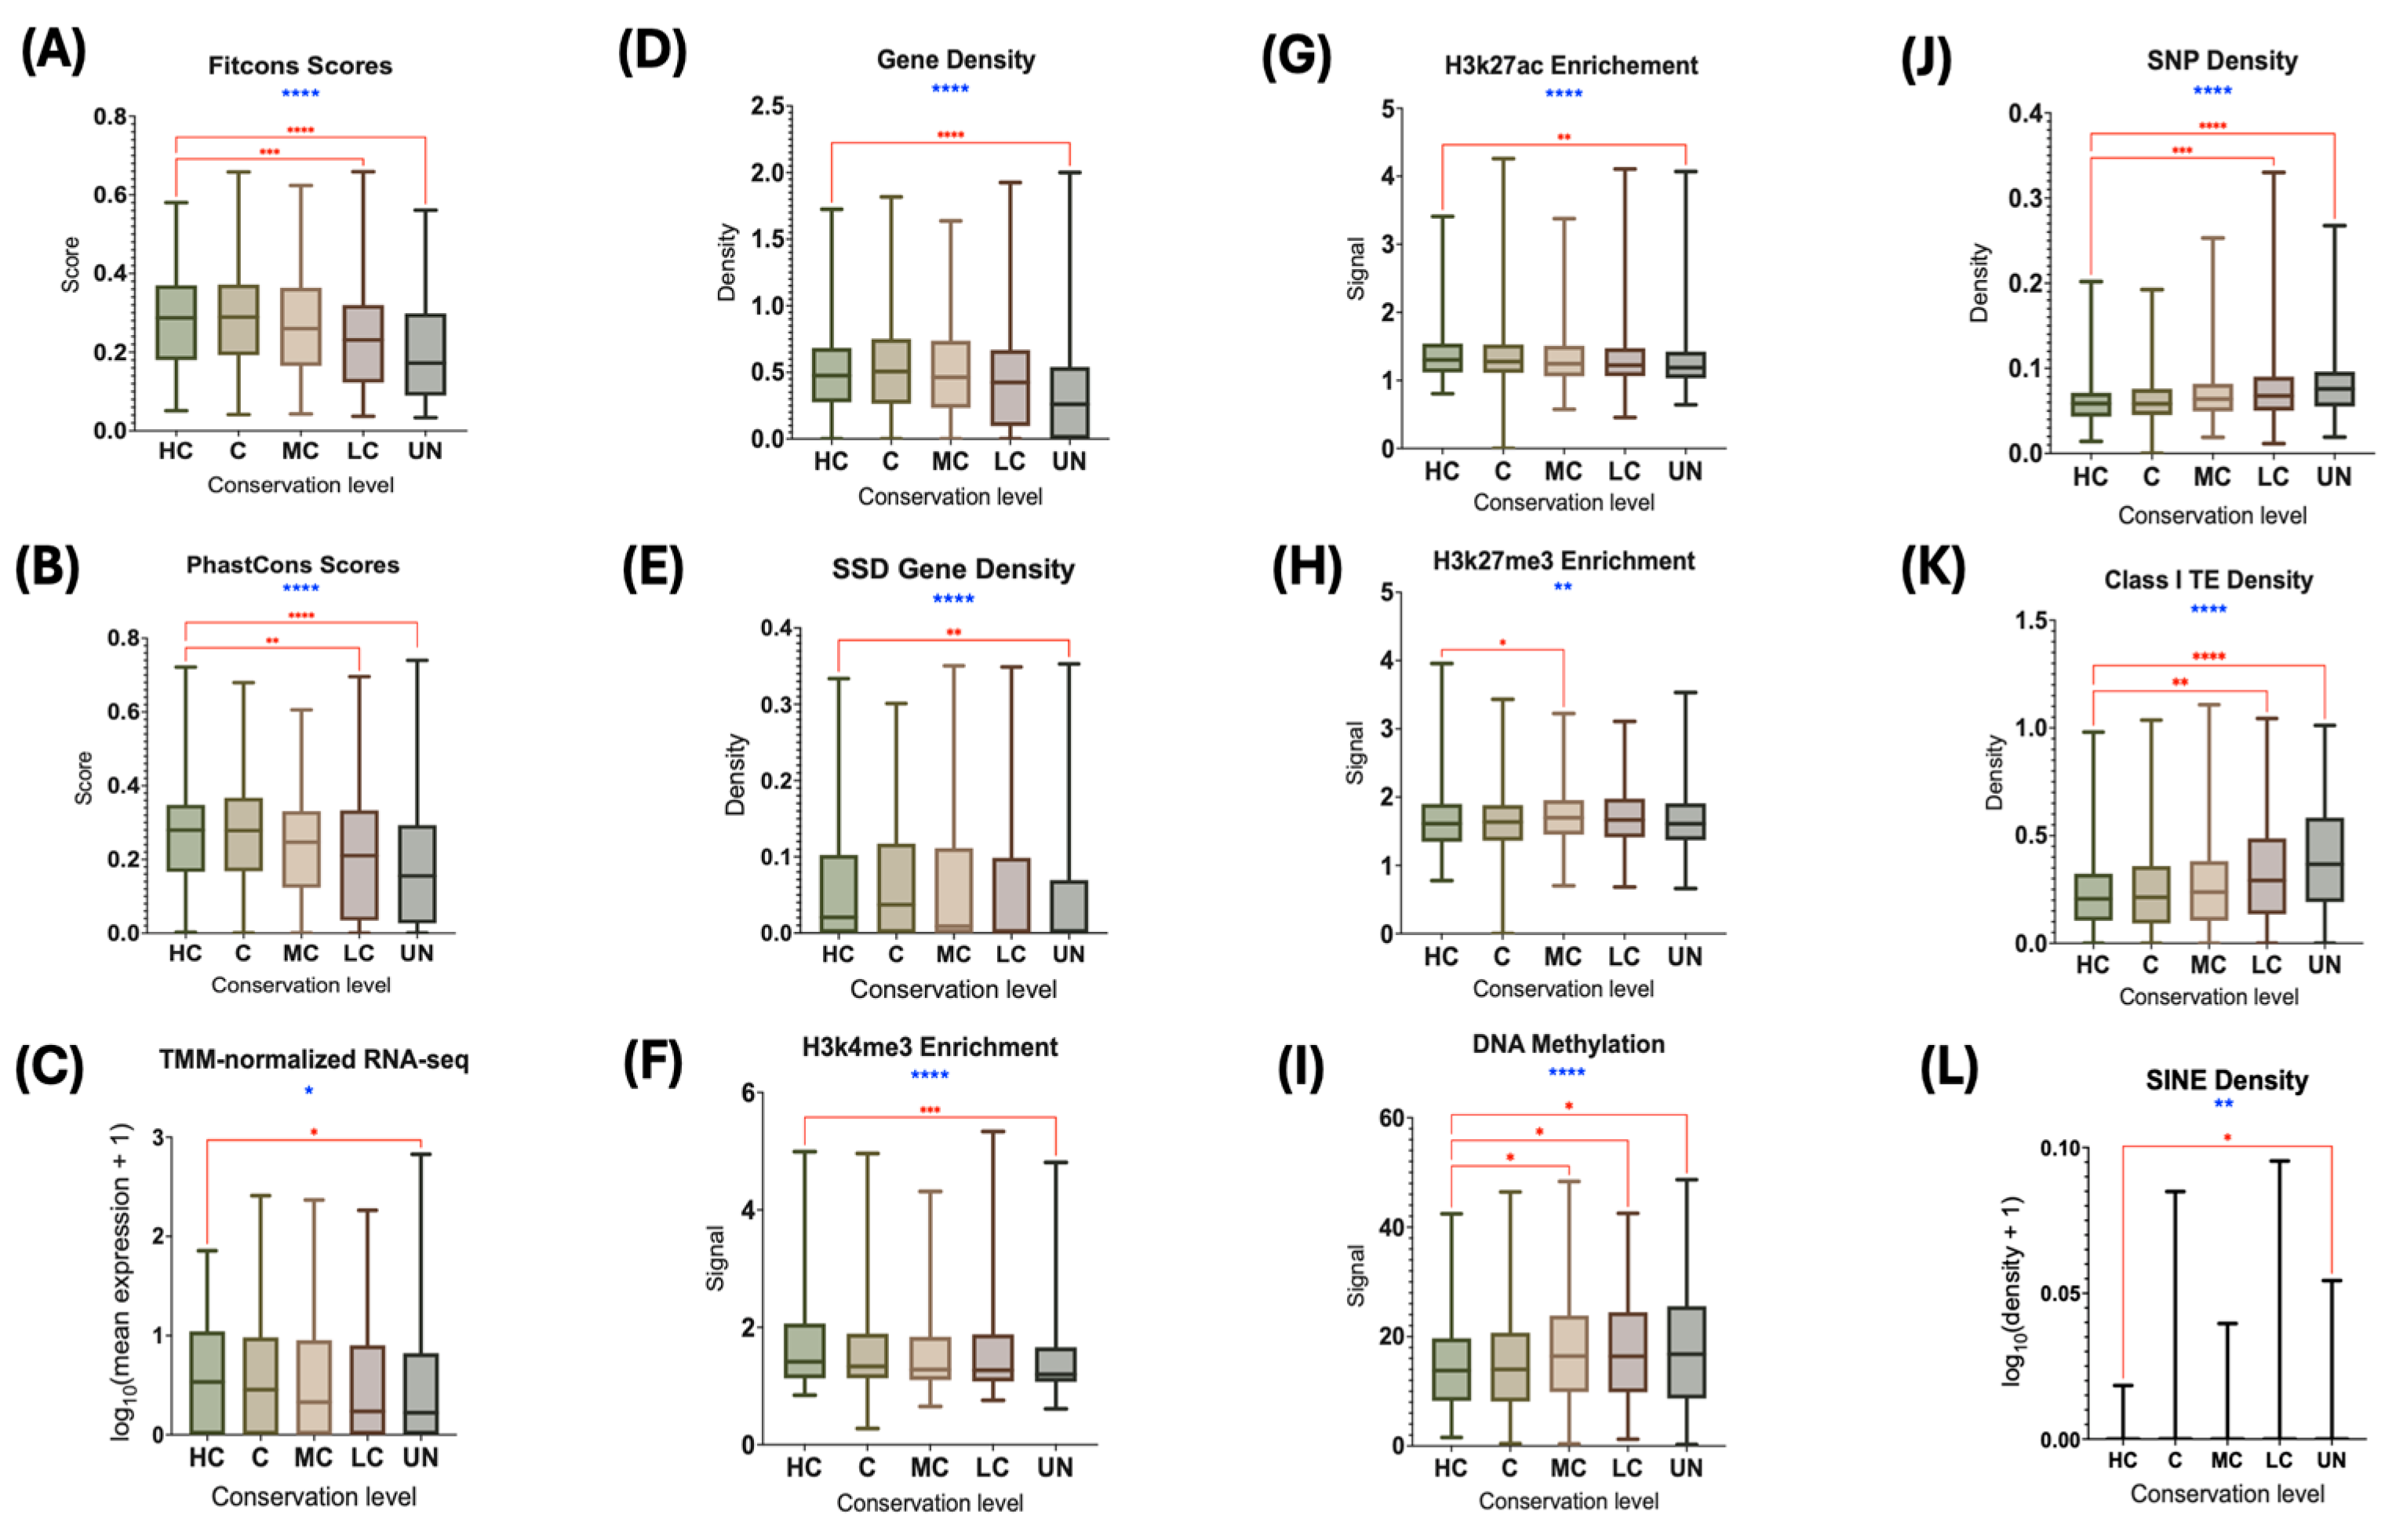
We next examined more than 20 genomic and epigenomic features across the Nipponbare genome and quantified their signals within TAD boundary regions of varying conservation levels and geographic origins (Figure 5 and Figure 6). Twelve features differed statistically significantly across conservation categories (Figure 5). Several features exhibited broad conservation-dependent patterns. Fitcons scores, PhastCons scores, gene density, gene expression, H3K27ac enrichment, and H3K4me3 enrichment (Figure 5A–D,F,G) generally exhibited higher values among more highly conserved boundaries and lower values among LC and UN boundaries, although the strength and consistency of this pattern varied across metrics. Fitcons and PhastCons scores showed particularly pronounced decreases toward lower conservation categories, while gene density and gene expression similarly exhibited lower median values in UN boundaries. H3K27ac and H3K4me3 enrichment displayed more modest differences across categories. Conversely, DNA methylation, SNP density, and Class I transposable element density (Figure 5I–K) generally increased toward lower conservation categories, with the highest median values observed among LC or UN boundaries. H3K27me3 enrichment (Figure 5H) was elevated in intermediate-to-low conservation categories, particularly MC and LC, but did not exhibit a consistent monotonic relationship with conservation. SSD gene density and SINE density also differed significantly across conservation categories (Figure 5E,L), although neither exhibited a clear monotonic relationship with conservation. Pairwise comparisons most frequently identified significant differences between HC boundaries and LC or UN boundaries. Together, these results demonstrate that multiple genomic and epigenomic features vary systematically across TAD boundary conservation categories.
Figure 5.
Category 1 analysis. Functional, structural, and epigenetic features measured across TAD boundaries in all conservation categories of the Nipponbare reference genome: (A) Fitcons score; (B) PhastCons score; (C) gene expression (TMM-normalized RNA-seq); (D) gene density; (E) small-scale duplication (SSD) density; (F) histone H3 lysine 4 trimethylation (H3K4me3) enrichment; (G) histone H3 lysine 27 acetylation (H3K27ac) enrichment; (H) histone H3 lysine 27 trimethylation (H3K27me3) enrichment; (I) DNA methylation; (J) SNP density; (K) retrotransposon (Class I transposon) density; and (L) short interspersed nuclear element (SINE) density. Overall statistical significance was assessed using the Kruskal–Wallis test (blue asterisks), followed by FDR-adjusted post-hoc Dunn’s multiple comparisons test between the highly conserved (HC) category and each remaining conservation category (red bars and asterisks). Only statistically significant pairwise comparisons are shown. Significance is depicted as * p < 0.05; ** p < 0.01; *** p < 0.001; **** p < 0.0001.
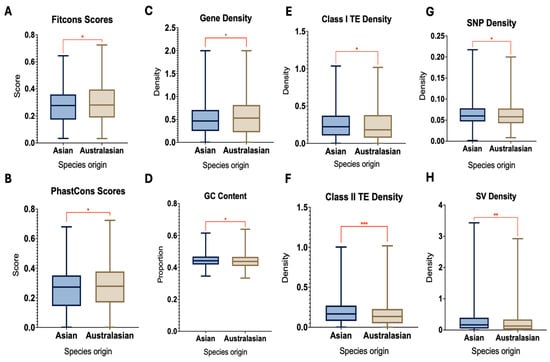
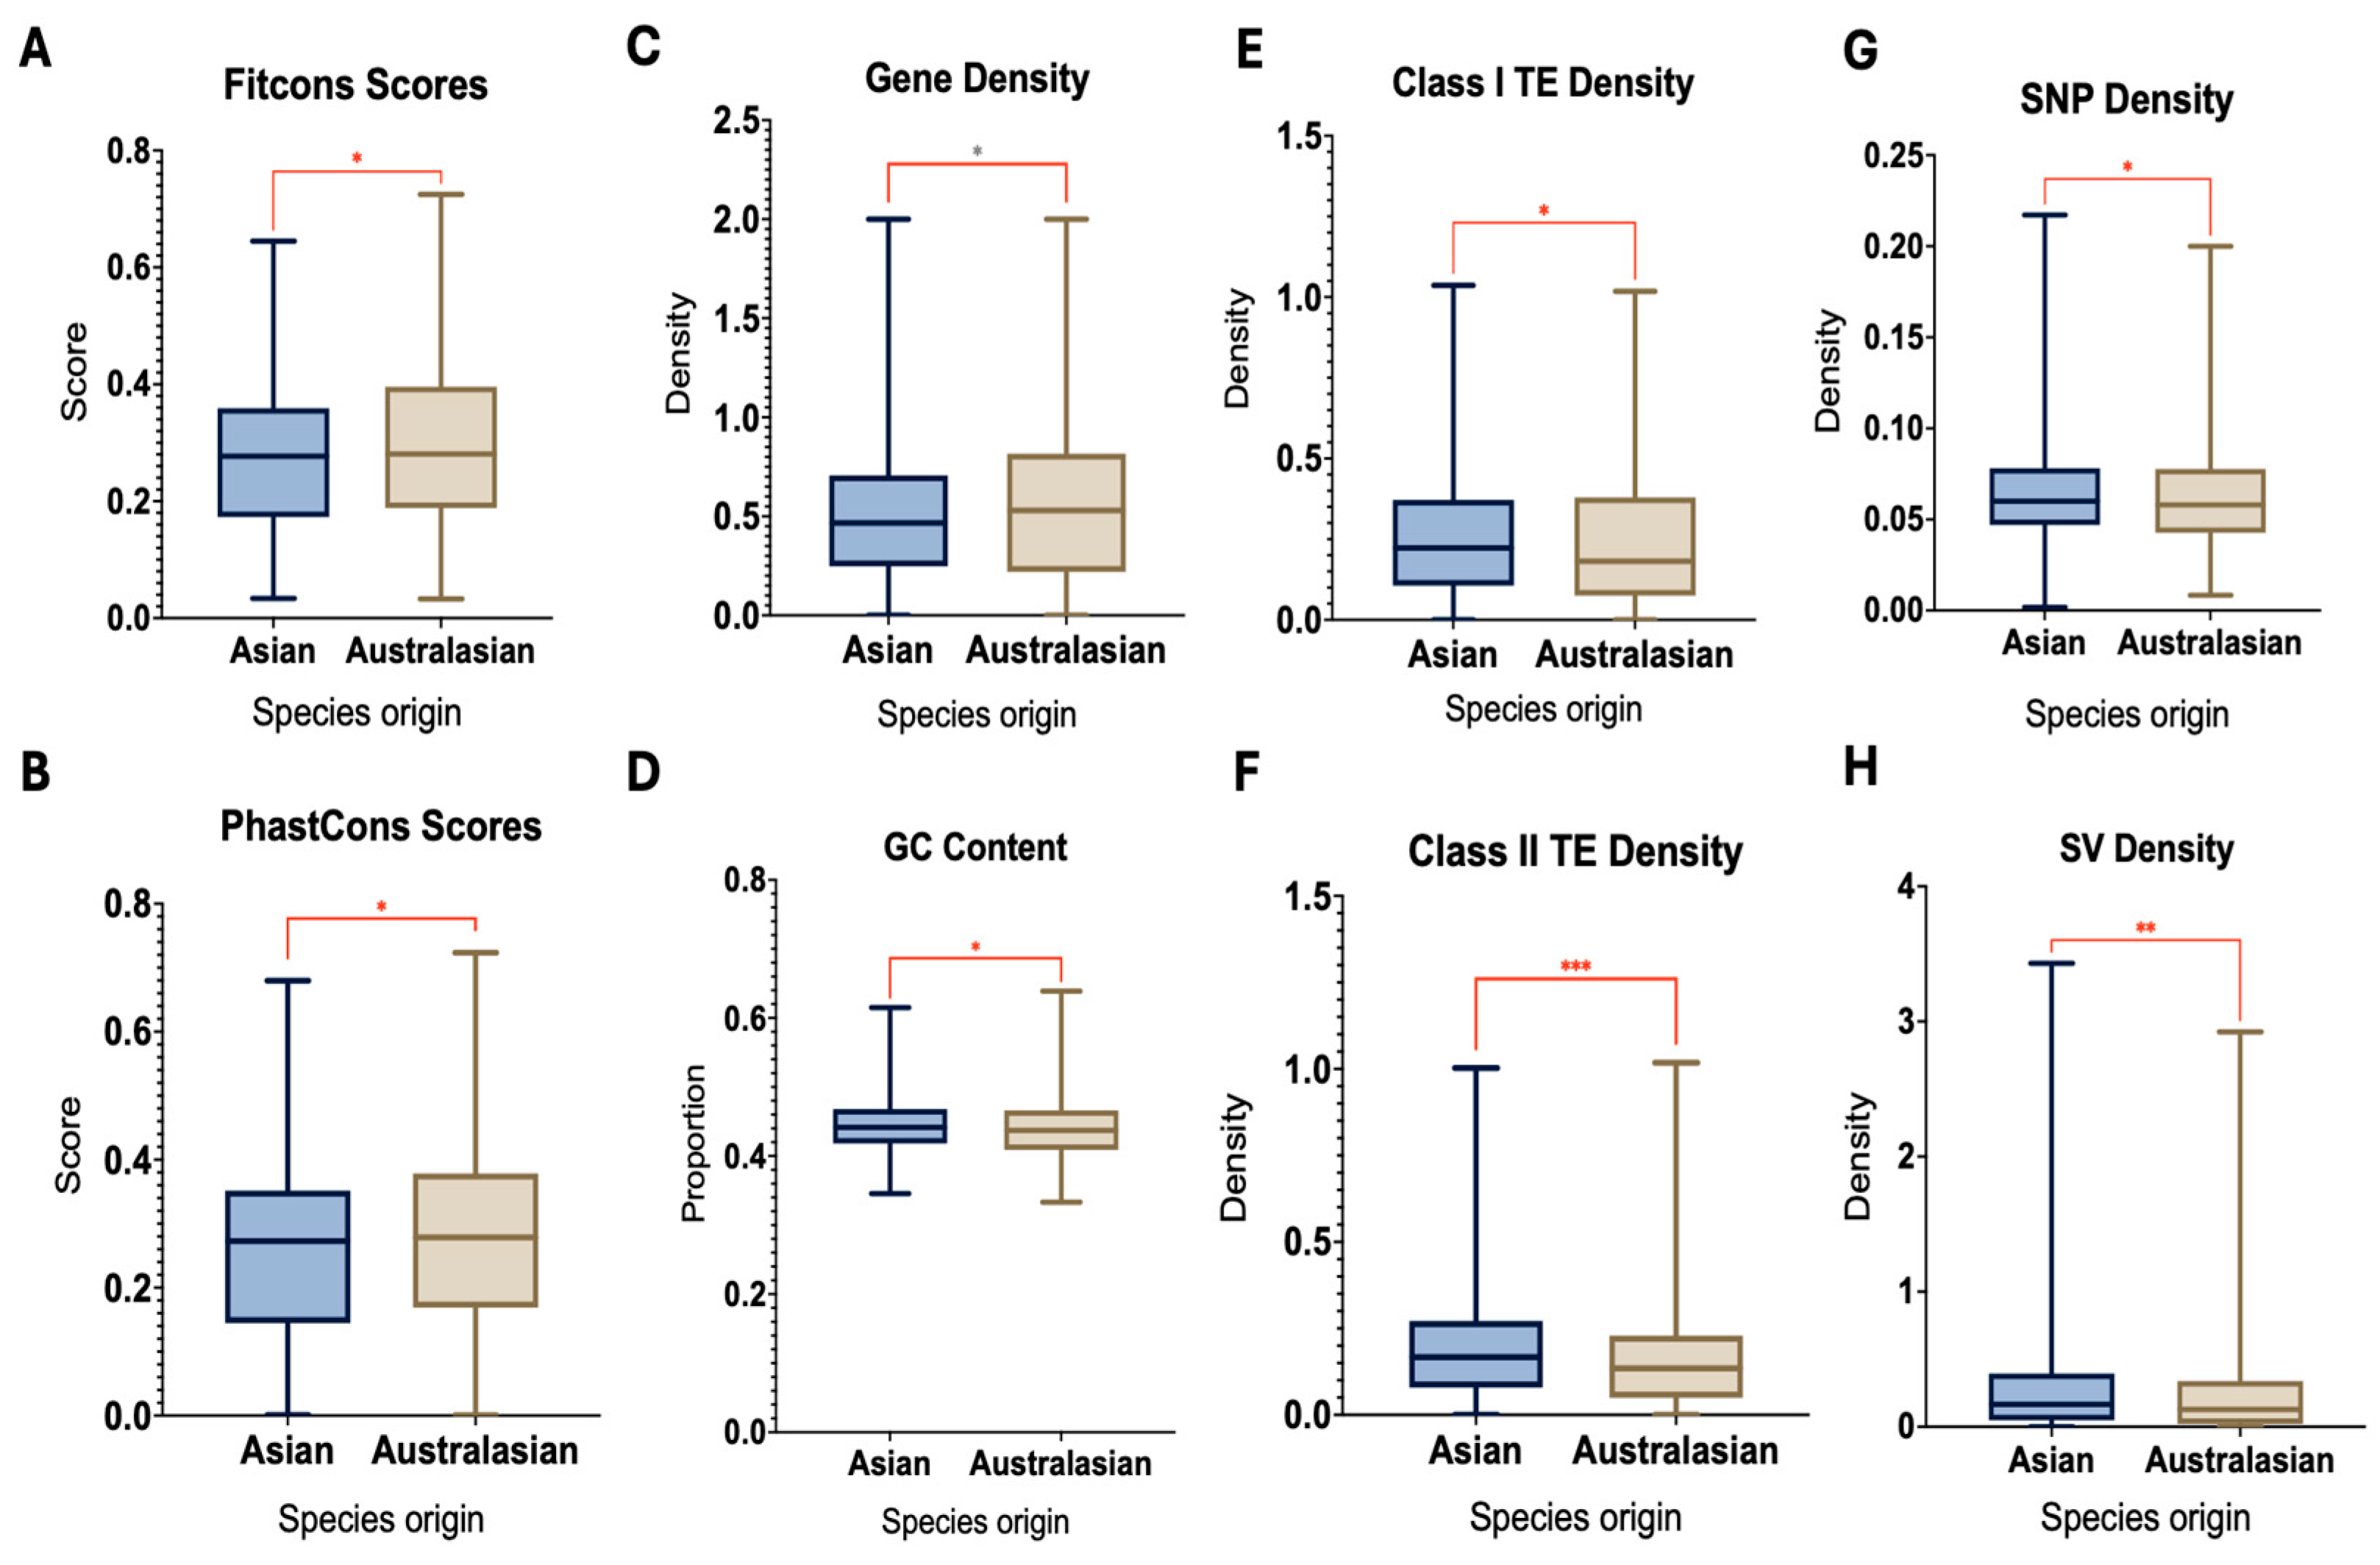
Figure 6.
Category 2 analysis. Functional, structural, and epigenetic features measured across TAD boundaries between Asian (Nipponbare, Azucena, IR64, O. rufipogon) and Australasian (O. meridionalis) rice genomes: (A) Fitcons score; (B) PhastCons score; (C) gene density; (D) GC content; (E) retrotransposon (class I transposon) density; (F) DNA transposon (class 2 transposon) density; (G) SNP density; and (H) SV density. Statistical significance of Wilcoxon’s rank sum tests (red bars and asterisks) is depicted as * p < 0.05; ** p < 0.01; *** p < 0.001.
Due to the previously observed result that O. meridionalis is 3D-genomically distinct from the other rice species studied here, we next aimed to juxtapose boundaries conserved across all rice species except O. meridionalis with boundaries unique to O. meridionalis across functional metrics. This allowed us to examine whether functional evolution was associated with species origin, as O. meridionalis is the sole Australasian rice species included in this study (Figure 6). Analyzing the same functional metrics, only eight were found to be statistically significant. Fitcons scores, PhastCons scores, and gene density (Figure 6A–C) were among the few metrics with higher values in O. meridionalis than in the Asian rice species, whereas retrotransposon (Class I TE), DNA transposon (Class II TE), SNP, and SV densities were higher in the Asian rice species than in the Australasian species (Figure 6E–H). GC content, although its median was slightly higher in the Asian species, was largely indistinguishable between groups but nevertheless exhibited a statistically significant difference (Figure 6D). These results demonstrate that multiple genomic features vary significantly with the evolutionary origin of TAD boundaries.
2.5. Phylogenetic and 3D-Genomic Relationships Among Rice Species
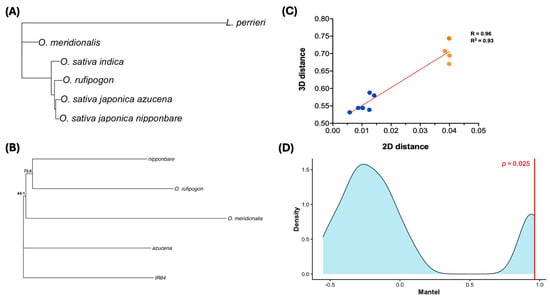
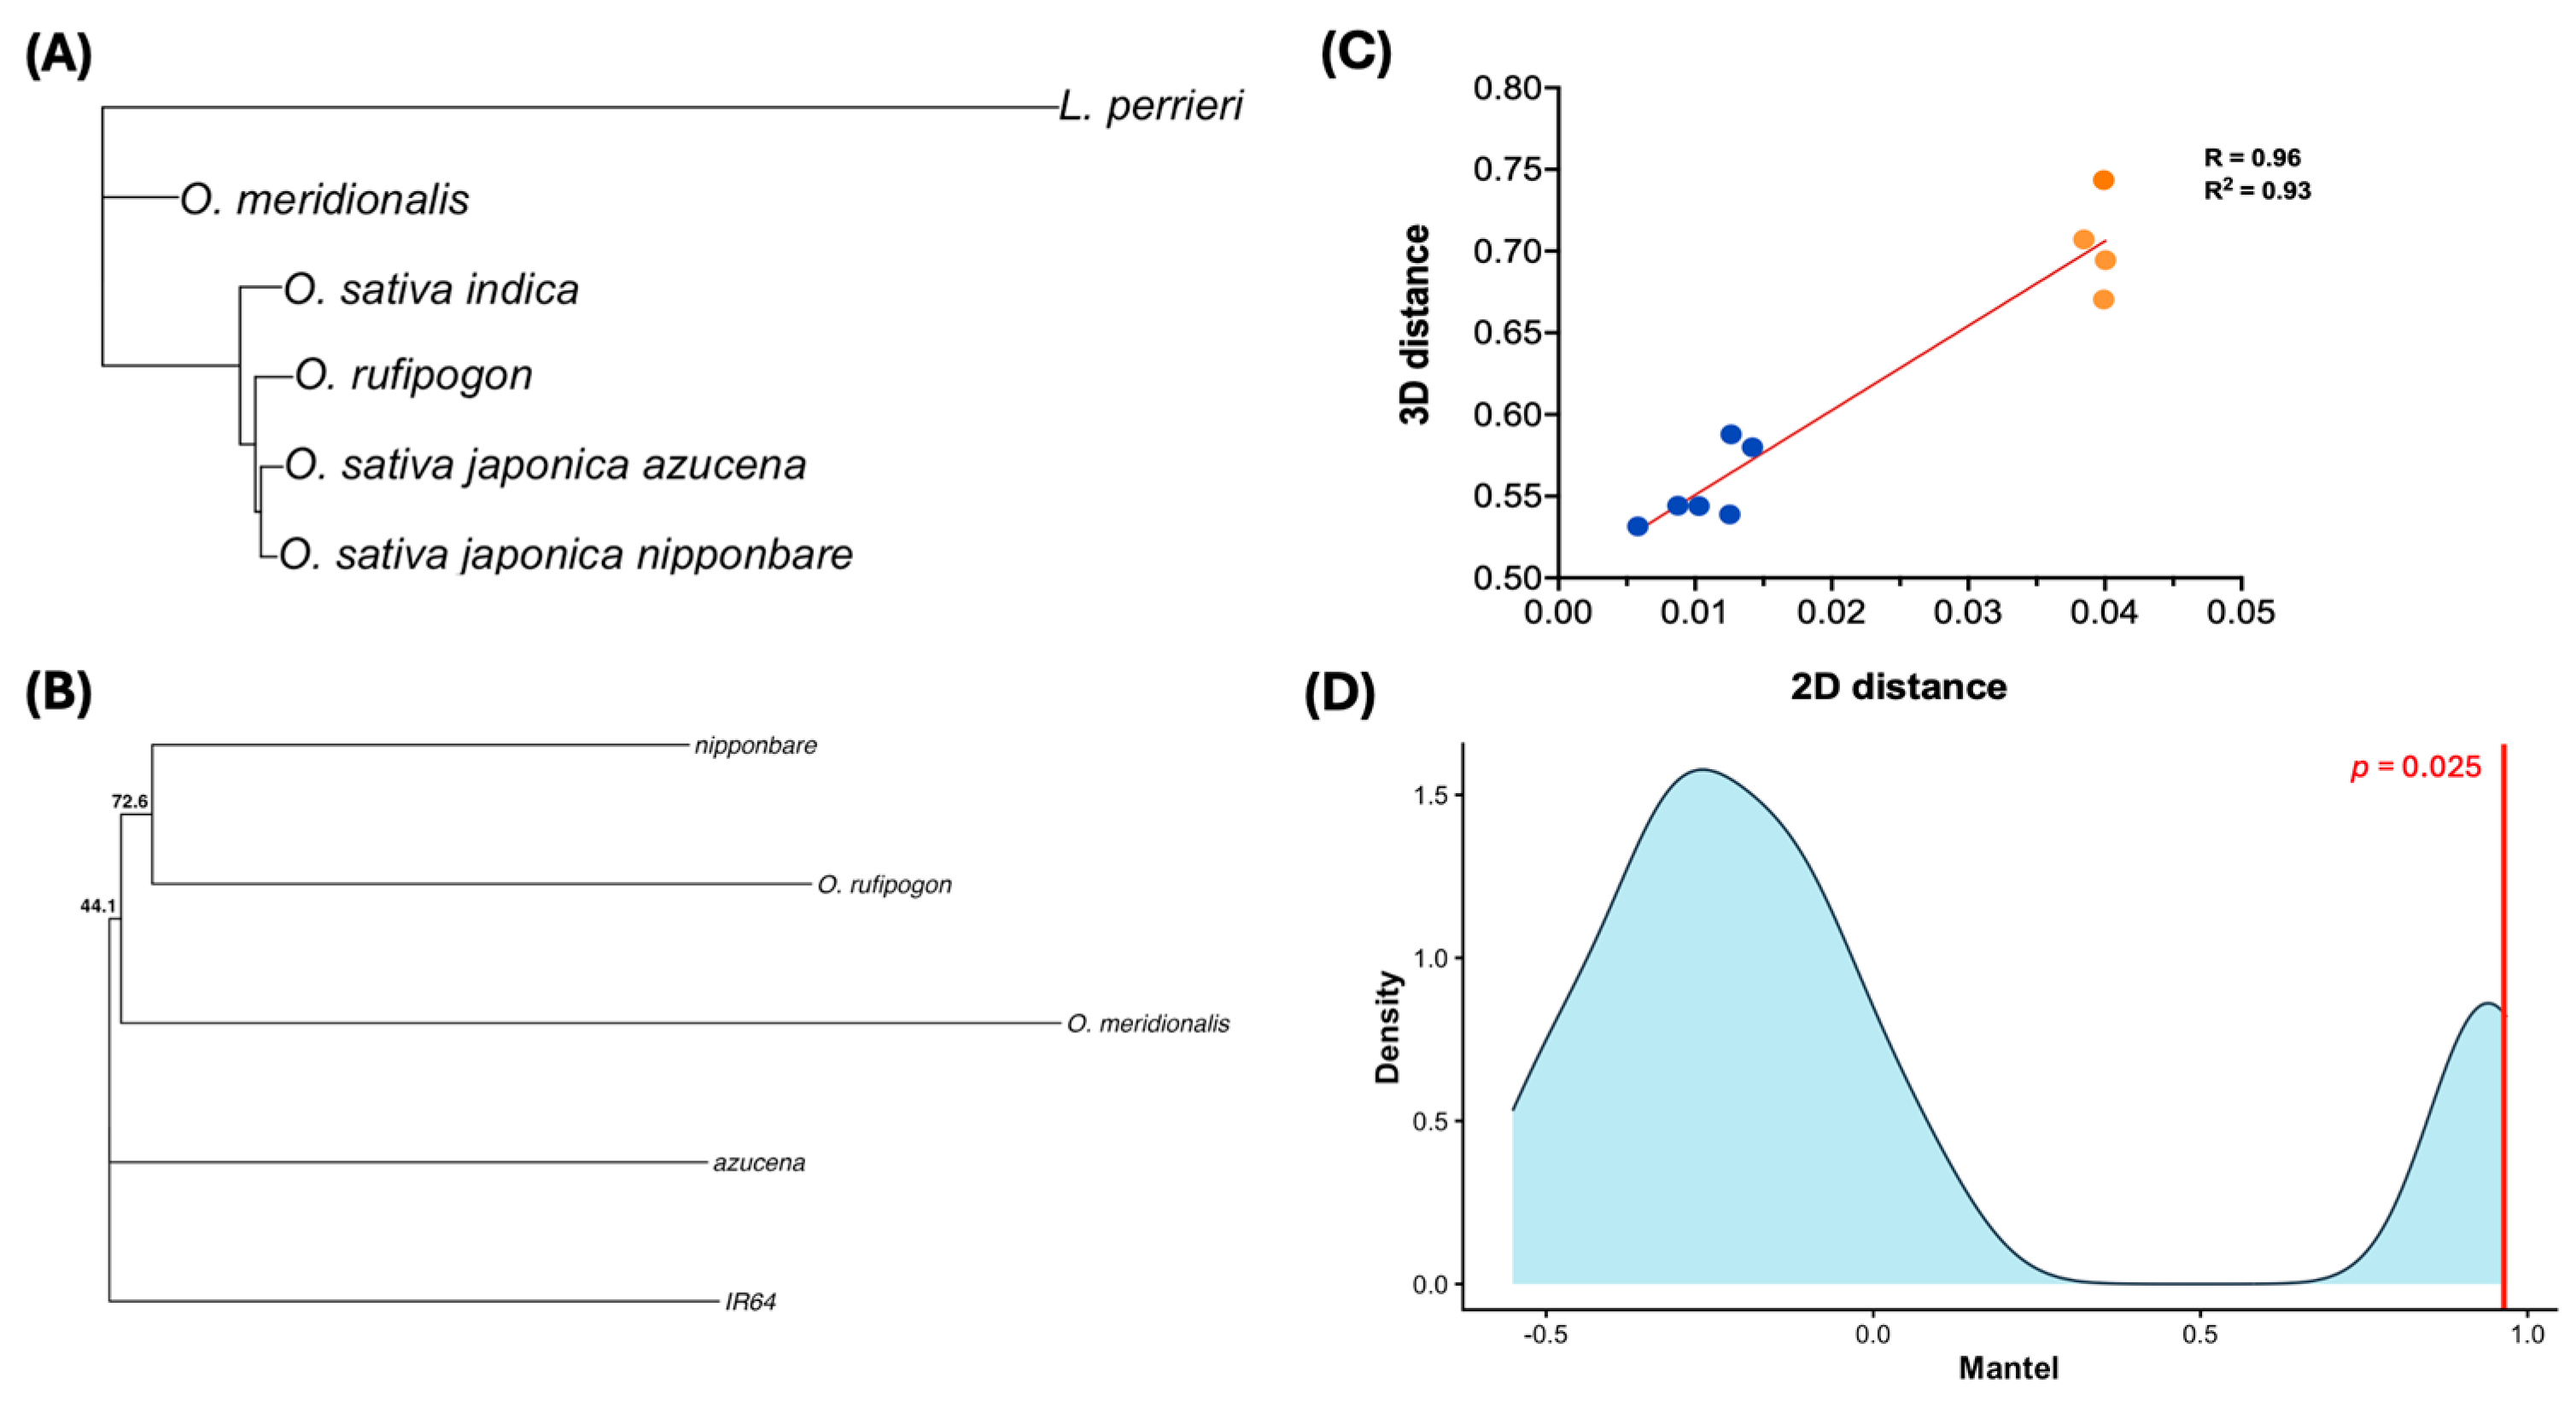
To better understand the evolutionary relationships between Oryza genomes derived from TAD boundary conservation, we used phylogenetic and statistical approaches to compare 1D- and 3D-genomic relationships (Figure 7). A 1D genomic phylogenetic tree representing canonical evolutionary relationships among rice species, with L. perrieri as the outgroup, was constructed using genome-wide nucleotide sequence similarity (Figure 7A). As shown, O. meridionalis was positioned on a separate clade from the other rice species, while Azucena and Nipponbare exhibited the greatest genetic similarity, followed by O. rufipogon and IR64. Using TAD boundary conservation data, we constructed a phylogenetic tree from an adapted Jaccard distance matrix (see Materials and Methods) to visualize evolutionary relationships based on 3D-genomic architecture (Figure 7B). As expected, O. meridionalis remained the most divergent species, branching earliest from the root, while the remaining four species separated into two pairs. Interestingly, Nipponbare clustered with O. rufipogon, whereas Azucena clustered with IR64, a topology that did not fully recapitulate previously observed evolutionary relationships [36,37]. Despite these topological differences, pairwise evolutionary and TAD boundary distances exhibited a strong positive relationship (R = 0.96, R2 = 0.93; Figure 7C). A Mantel test using Pearson correlation further supported this relationship, yielding a statistically significant Mantel correlation (r = 0.96, p = 0.025; Figure 7D). The permutation distribution was largely centered on negative correlation values, with its largest peak at approximately −0.25, whereas the observed Mantel statistic of 0.96 fell at the upper extreme of the distribution. Together, these phylogenetic and statistical results demonstrate a strong association between evolutionary divergence at the nucleotide-sequence level and divergence in TAD boundary organization.
Figure 7.
(A) Phylogenetic tree of the selected rice genomes constructed using genome-wide nucleotide similarity estimated from MASH distances. The wild relative of Oryza sativa, Leersia perrieri (L. perrieri), was included as the outgroup. Bootstrap analysis was performed to assess support for the inferred phylogenetic topology. (B) Phylogenetic tree of the selected rice genomes constructed using Jaccard distances as a proxy for three-dimensional genomic distance based on TAD boundary presence/absence similarity. Bootstrap analysis was performed with 1000 replicates (n = 5). The percentages 72.6% and 44.1% are the corresponding support values for the Nipponbare–O. Rufipogon and O. meridionalis clades, respectively. (C) Correlation between evolutionary distances derived from panel (A) and three-dimensional genomic distances derived from panel (B) for all pairwise species comparisons (n = 10). Orange data points represent pairwise comparisions including O. meridionalis on at least one axis, where blue data points map pairwise comparisons that do not include O. meridionalis. Linear regression analysis was performed and graphed (red line) to assess statistical significance (R = 0.96, R2 = 0.93). (D) Mantel test permutation density plot comparing pairwise evolutionary and three-dimensional genomic distance matrices (Panel (C)). The vertical red line indicates the observed Pearson correlation coefficient (r = 0.96), while the corresponding p-value (p = 0.025) is reported on the plot.
3. Discussion
Our study aimed to assess the evolutionary divergence of five rice cultivars, three domesticated and two wild, through analysis of the functional, structural, and evolutionary conservation of their 3D genomic architecture, specifically TAD boundaries. Previous studies have pursued similar aims in mapping the 3D genome architecture of common rice cultivars, often examining pheno- and genotypic effects resulting from targeted mutagenesis [19,34,38,39,40,41]. Only Kurbidaeva et al. 2025 [19] has specifically incorporated a prominent evolutionary lens, an analytical focus on TAD boundaries as a genomic biomarker, or comprehensive statistical treatment of 3D genomic temporal trajectories, all of which we sought to accomplish here.
Our findings indicate a broadly similar TAD boundary conservation landscape among rice cultivars with similar 1D evolutionary histories, particularly Nipponbare, Azucena, and IR64 (indica), whereas the two wild landraces, O. rufipogon and, especially, O. meridionalis, show pronounced dissimilarities. O. meridionalis exhibited a marked decrease in conserved TAD boundary quantity, structural composition, and chromosomal distribution, accompanied by a larger amount of unique boundaries. Notably, O. meridionalis also reported the highest proportion of HC boundaries of any genome studied. Unique O. meridionalis TAD boundaries, representing the Australasian lineage, showed higher median FitCons and PhastCons scores than boundaries conserved among the four Asian cultivars. Together, we interpret these results as evidence for elevated retention of ancestral-like TAD boundary features in O. meridionalis, consistent with its position as the sister lineage to the other AA-genome Oryza species analyzed and its early divergence during the rapid radiation of the AA clade [36,37]. This retention of ancestral genomic characteristics may account for both its elevated HC boundary count and higher evolutionary conservation scores, despite an overall lower rate of cross-species boundary sharing. Our results also reveal a positive relationship between the TAD boundary conservation level and RNA metabolism-associated gene content in Nipponbare, suggesting that boundaries are conserved because they are functionally important: conserved boundaries disproportionately harbor housekeeping genes essential to growth, survival, and reproduction. This interpretation is reinforced by the inverse trend in mutagenesis-associated and heterochromatin-associated markers, including DNA methylation (which reduces chromatin accessibility), SNP density, repressive histone modifications, and TE density, all of which decline with an increasing conservation level, while evolutionary constraint scores, gene density, and gene expression track conservation levels progress in the same direction as the GO enrichment signal. Finally, while the 1D- and 3D-genomic phylogenetic topologies differ visually, their statistical correlation is strong, suggesting that 3D genomic evolution, modeled here as TAD boundary conservation, can act as a meaningful predictor of, or complement to, conventional nucleotide- or gene-based evolutionary metrics.
Our functional characterization of conserved TAD boundaries in Nipponbare closely parallels findings from Kurbidaeva et al. 2025 [19], the source study for our Micro-C data, which similarly reported that rice TAD boundaries show high transcriptional activity, low methylation levels, low transposable element content, and increased gene density. Our conservation-stratified analysis extends this observation by showing that these functional signatures are not uniform across all TAD boundaries, but instead scale directly with the degree of cross-species conservation, a distinction not resolved in the original study. Our finding that 3D-genomic distance closely tracks 1D sequence divergence is also consistent with Kurbidaeva et al.’s broader conclusion that global 3D genome evolution closely tracks sequence evolution in Oryza, lending independent support to that claim using a distinct boundary-conservation-based method (TCBF) rather than a direct topological comparison [19,35].
Our results also parallel informative differences and recent findings in mammalian systems. A comparative Hi-C/ChIP-seq study across four primate and four rodent species found that only 14% of human TAD boundaries were shared across all eight species (termed “ultraconserved”), while 15% were species-specific; ultraconserved boundaries showed stronger insulation strength, CTCF binding, and enrichment of older retrotransposons relative to species-specific boundaries [20]. The direction of the TE relationship in that study is worth flagging against our own: whereas we found that overall Class I TE density declines with increasing conservation level, the mammalian study associated ultraconserved boundaries with enrichment for specifically old, decayed retrotransposons rather than high overall TE burden. Together, this suggests a shared underlying principle: conserved boundaries tend to accumulate ancient, “domesticated” repetitive elements rather than young, potentially destabilizing ones, even though rice lacks the CTCF-based mechanism believed to anchor mammalian TAD boundaries. This raises the possibility that structurally analogous evolutionary pressures act on TAD boundaries across kingdoms via convergent, rather than homologous, mechanisms. Additionally, the histone modifications we found most strongly associated with conservation level (H3K4me3, H3K27me3) match the two markers that the TCBF developers themselves identified, using a deep neural network, as the key predictive features of TAD boundary formation [42], reinforcing that our conservation signal likely detects a biologically grounded phenomenon rather than a methodological artifact.
To our knowledge, this study represents the first application of a dedicated, tiered TAD boundary conservation framework (HC/C/MC/LC/Unique) to a multi-species plant system, and the first construction of a phylogenetic tree derived purely from TAD data in any plant genus. While prior work, including Kurbidaeva et al. 2025 [19], has established that rice TADs are functional genomic units and that global 3D genome divergence tracks sequence divergence, no previous plant study has stratified boundaries by conservation depth and tested each stratum against independent functional, epigenetic, and evolutionary metrics simultaneously. This tiered approach allowed us to detect a conservation-dependent functional gradient that a binary conserved/unconserved framework would likely have obscured, and to identify the distinct evolutionary signature of O. meridionalis with a level of resolution not previously available for wild Oryza relatives. Beyond its immediate findings, this work offers a template for using 3D genome architecture as a tractable, generalizable biomarker in comparative and evolutionary plant genomics, one that does not require species-specific CTCF-based frameworks, given its apparent absence in plants [20,43,44,45]. Because TAD boundaries in our analysis were preferentially associated with housekeeping and RNA-processing gene content, boundary conservation profiling may offer breeders a complementary lens for identifying regulatory regions under strong purifying selection, which are less likely to tolerate disruption during trait introgression or genome editing. As 3D genomic technologies become more accessible and cost-effective, this conservation-tiered framework could be extended to additional wild rice relatives or other domesticated crop lineages to help distinguish functionally constrained regulatory architecture from more evolutionarily flexible regions of the genome.
Several limitations warrant consideration. GO enrichment analysis was restricted to the Nipponbare reference genome because it is the only genome in this study with sufficiently complete, cross-validated functional annotation, drawing on RAP-DB, Oryzabase, and g:Profiler’s GMT resources, to construct a reliable background gene set; the remaining four genomes lack comparably mature annotation, and enrichment analysis performed against an incomplete or inconsistent background risks producing unreliable or spurious results. Future work incorporating improved annotation for Azucena, IR64, O. rufipogon, and O. meridionalis would allow this functional analysis to be extended across all five genomes. Second, our TCBF-derived conservation calls diverged substantially from those generated by the liftOver-based approach used in Kurbidaeva et al. 2025 [19], with TCBF identifying more LC/MC boundaries and liftOver identifying more C/HC boundaries. Because the two methods differ fundamentally in how they anchor cross-species homology (synteny-and-sequence-based clustering versus direct coordinate lift-over), only raw boundary counts were directly comparable in this study, and conservation-category assignments should not be treated as interchangeable across methods. Additionally, our 3D-genomic phylogeny was constructed solely from presence/absence (Jaccard) data across five taxa. Given the small number of taxa and the binary nature of the data, the resulting bootstrap support values should be interpreted cautiously. While the inferred relationships are broadly consistent with other analyses presented in this study, the phylogeny should be considered supportive rather than definitive evidence of evolutionary relationships. Future methodological work extending 3D-genomic conservation-based distance matrices from non-binarized data, implying that higher boundary content indicates increased evolutionary retention, would strengthen confidence in 3D-genomic phylogenetic topologies of this kind. Finally, a tool that correspondingly assesses cross-species TAD conservation, rather than their boundaries, would further strengthen evolutionary patterns and conclusions determined here and other studies with similar goals.
4. Materials and Methods
4.1. Primary Data Sourcing
Micro-C chromatin conformation datasets for the five Oryza genomes were retrieved from NCBI (GEO accession: PRJNA1121389) [19]. TADs were analyzed using HiCExplorer (v.3.7.2) through the established Dovetail Genomics (Scotts Valley, CA, USA) pipeline [46]. Full experimental procedures and associated metadata are described in the work of Kurbidaeva et al. 2025 [19]. Genome FASTA assemblies, gene annotation files (in GFF format), and gene structure files (in GTF format) for Azucena, IR64, O. meridionalis, and O. rufipogon were obtained from Ensembl Plants (v114), while the Nipponbare (reference genome) sequence (Os-Nipponbare-Reference-IRGSP-1.0), gene annotation file, and gene structure file were downloaded from RAP-DB.
4.2. Conserved TAD Boundary Detection
To quantify and analyze interspecific TAD boundary conservation across our five rice genomes, we employed a nascent, command-line-based bioinformatic tool, TCBF (Topologically associating domain Conservative Boundary Finder), following the protocols established by He et al. 2023 [35]. TCBF requires three input files per species for pre-processing: a FASTA sequence, a gene annotation file, and corresponding TAD coordinates. Coordinates may be obtained from any 3C-based assay; however, Hi-C or an equivalent, high-throughput method is preferred for higher-resolution boundary detection. TCBF allows user-defined TAD boundary minimum lengths to reduce spurious alignments, which allows the tool to remove and filter any TAD boundary not meeting the allocated size, which we set at 5000 base pairs (bp) to match the resolution of the original Micro-C dataset [19,35]. An adapted version of the TCBF workflow is available schematically (Figure S2). Output from TCBF provides conserved TAD boundaries across our five species, divided into specific conservation groups, which are arranged sequentially by orthogroup size (2 ≤ n ≤ 14), where n reflects the total number of conserved boundaries present in a conserved group (Table S1). Boundary coordinates are provided concomitantly (Table S2). Conservation categories are determined based on the number of species present in a given TAD boundary group: (highly conserved (HC) = 5 species, conserved (C) = 4 species, moderately conserved (MC) = 3 species, and least conserved (LC) = 2 species). Conservation categories apply to both the group itself, and the boundaries associated with it. Unique (UN) boundaries were defined as those present in a species’ genome yet not featured in any TAD boundary group. Conserved boundary data were plotted on a heatmap based on code provided by He et al. 2023 [35]; statistical significance was confirmed by Kruskal–Wallis test. Statistical significance for all other visualizations of TAD boundary conservation data obtained from TCBF was determined by chi-squared tests of independence, Fisher’s exact tests, or pairwise Welch’s t-tests.
4.3. Boundary Synteny and Ideogram Generation
We used the TCBF tool for collinear synteny plot generation based on input FASTA sequences and output unique and conserved TAD boundary coordinates. We visualized a 1 Mb sector of chromosome 5. The Nipponbare gene map (Assembly accession ID: GCF_001433935.1) from the UCSC Genome Browser [47] was overlaid onto the synteny track.
The R package karyoploteR was utilized for ideogram generation, as well as manually mapped highly conserved TAD boundary coordinates represented as small black regions. Centromeric regions were incorporated into the plot using previously reported coordinates [48,49].
4.4. GO Enrichment
We aimed to assess whether TAD boundaries, characterized by their conservation level, are differentially enriched for various functional categories. To maximize robustness, we employed three Gene Ontology (GO) tools: g:Profiler [50], clusterProfiler [51], and pantherDB [52]. All enrichment analyses were only performed for the reference genome (Nipponbare), but were performed across all conservation levels. Across all three platforms, we ran enrichment analyses for three ontologies: biological process (BP), molecular function (MF), and cellular component (CC). BEDTools was used to identify genes located within conserved TAD boundary regions based on the Nipponbare GFF file and conserved TAD boundary coordinates, which were already segregated into conservation levels. For g:Profiler, we downloaded and implemented the R package gprofiler2, in which we utilized the g:GOST function (with Benjamini–Hochberg FDR correction) for enrichment analysis and the gostplot function for Manhattan plot generation. For clusterProfiler, we utilized the enrichGO function (with Benjamini–Hochberg FDR correction) for our GO enrichment analyses. For pantherDB, we performed Fisher’s Exact PANTHER overrepresentation tests (with FDR correction) for each of our GO enrichment analyses and plotted using custom code. For all three GO platforms, we iterated two background gene sets: the total dataset of genes featured in all Nipponbare TAD boundaries and the total dataset of genes in the entire Nipponbare genome; both datasets were generated using BEDTools. We determined that the latter yielded more robust and statistically sound results compared to the former due to the increased sample size (n ≈ 33,000, n ≈ 10,500) and as such, should be used for all downstream analyses to maximize statistical rigor. Our background gene set was compiled of data from three sources: the Nipponbare GFF file from RAP-DB, a Nipponbare GFF file from Oryzabase, and the Oryza sativa japonica GMT file from g:Profiler; any duplicate genes across sources were removed. Enriched GO terms were filtered for redundancy and/or cellular specificity in all visualizations. The raw GO results are also provided for our PANTHER-based analyses (Table S3).
4.5. Functional Profiling
Functional genomics datasets for the Nipponbare genome, generated by the Purugganan Lab and used for downstream computational analyses, included: RNAPII mapping (PRO-seq), DNA methylation, Fitcons scoring, PhastCons scoring, histone modifications [H3K27ac, H3K27me3, H3K4me3], gene density, GC content, SNP density, SV breakpoint density, transposable element (TE) densities (including all retrotransposons, LTR TEs [Ty3-gypsy, Ty1-copia], non-LTR TEs [LINES, SINES], and DNA transposons), small-scale duplication (SSD) genes, whole-genome duplication (WGD) genes, and gene expression (RNA-seq) [19,53,54,55]. ATAC-seq data was extracted from NCBI (GEO accession: GSE144564) [56]. Functional analyses were performed for two different categorical frameworks: conservation levels (Category 1) and geographic origin (Category 2). For Category 1, we used pybedtools v.0.9.1, a Python wrapper for BEDTools [57] to analyze the enrichment of genetic and epigenetic features between TAD-associated conservation groups, to determine if any differential functional units exist between boundary conservation levels (including unique boundary conditions). Category 2 was designed to foreground the pronounced divergence of O. meridionalis by contrasting boundaries unique to O. meridionalis against boundaries conserved across all three O. sativa cultivars and O. rufipogon, which are more closely related at the 1D sequence level and originate from Asian, compared to the Australasian background of O. meridionalis [58]. Because all functional profiles are referenced to the Nipponbare coordinates, we used UCSC’s liftOver to map non-Nipponbare boundaries. We obtained chain files for pairs of repeat-masked genomes from Kurbidaeva et al. 2025 [19], which were generated using custom scripts based on the UCSC pipeline [47]. We then lifted over the genomic coordinates of our conserved Azucena, IR64, and O. rufipogon, and unique O. meridionalis TAD boundaries in Category 2 to the target (Nipponbare) genome with the liftOver tool. The minimum base overlap ratio was set at 0.20 [19], and percentages of successfully mapped and unmapped TAD boundaries across cultivars are provided (Table S5). For Category 1, Kruskal–Wallis tests were performed to determine overall statistical significance for each profile; metrics with significant p-values were then subject to FDR-adjusted Dunn’s multiple comparisons tests. For Category 2, Wilcoxon’s rank sum tests were performed for all pairwise comparisons between the groups, and metrics with insignificant p-values were excluded from further analyses.
4.6. Phylogeny and Multidimensional Evolutionary Comparisons
We generated phylogenetic trajectories using both one-dimensional sequence information and 3D chromatin architecture, allowing us to assess whether evolutionary distances inferred from genome structure align with those derived from the nucleotide sequence. For the sequence-based analysis, Mash, a command-line tool for a fast whole-genome comparison, was used to compute pairwise distances across all genomes [59]. Mash distances were computed using default parameters (k = 21, s = 1000), which estimate whole-genome similarity via MinHash-derived k-mer overlaps. The resulting 5 × 5 distance matrix was then used with the ape package in R to construct a neighbor-joining (NJ) phylogenetic tree.
To complement this, we sought to generate the first 3D genomic phylogeny, constructed entirely from chromatin topological information. TAD boundary conservation data from TCBF were binarized to indicate the presence (1) or absence (0) of conserved boundaries across genomes; this analysis disregarded the presence of multiple boundaries belonging to one species in a given conserved TAD boundary group, meaning that any boundary count greater than 0 was equally converted to a digit of 1 in the binary table. Pairwise Jaccard similarities (J) were calculated using the vegan package and subsequently converted to Jaccard distances (1 − J). A custom implementation using ape enabled NJ tree construction directly from this Jaccard-derived distance matrix. A resampling-based stability analysis was initially performed; however, with only five taxa, the permutation space was limited to 5! = 120 unique arrangements. This restricted the number of independent resamples available for robust support estimation and produced insufficiently stable branch-support values. To statistically compare the evolutionary patterns derived from the 1D and 3D analyses, a Mantel test using Pearson correlation was performed with the vegan package in R. In addition, both a density-versus-Mantel correlation plot and a Pearson correlation scatter plot were generated to visualize the relationship between the two distance matrices.
4.7. Statistical Analysis
All statistical analyses were performed in base R (v.4.5.1). Non-parametric statistical tests were used where appropriate, and significance was defined as p ≤ 0.05 unless otherwise noted.
4.8. Code Availability
Custom code used for data processing (TCBF) and analysis, statistical testing, and visualization in this study is publicly available on GitHub at ogeyman/TCBF_TAD-boundaries_rice_project (https://github.com/ogeyman/TCBF_TAD-boundaries_rice_project, accessed on 1 October 2026).
5. Conclusions
Here, we present the first three-dimensional genomic phylogeny constructed from TAD boundary conservation data, establishing a novel framework for evolutionary inference in plants that operate independently of, yet are strongly correlated with, canonical nucleotide-based approaches (Figure 7). This concordance validates 3D genome architecture as a biologically meaningful axis of evolutionary divergence, while the topological differences we observed between the 1D- and 3D-derived trees, most notably the discordant clustering of Nipponbare, O. rufipogon, Azucena, and IR64, suggest that TAD boundary evolution may capture regulatory or structural signal not fully explained by sequence divergence alone. O. meridionalis emerged as a consistent outlier across every level of analysis: it possessed the lowest proportion of conserved boundaries, the highest fraction of unique boundaries, and formed a distinct cluster in both PCA and phylogenetic reconstructions, reinforcing its status as the most 3D-genomically divergent species in our dataset and underscoring TAD architecture as a marker of deeper evolutionary separation between Asian and Australasian rice lineages. Beyond structural conservation, we identify a clear functional gradient: highly conserved TAD boundaries are consistently and specifically enriched for RNA metabolism and processing genes, with this enrichment declining in a stepwise fashion through conserved, moderately conserved, and least conserved categories. This pattern, paired with the parallel decline in FitCons and PhastCons scores, active histone markers, and gene density alongside conservation strength, suggests that evolutionary constraint on TAD boundaries is not incidental but reflects functional pressure to preserve regulatory architecture surrounding a specific, biologically coherent gene set. Collectively, these findings demonstrate that TAD boundary conservation is a tractable, biologically informative, and evolutionarily interpretable feature of plant genomes, one that can be systematically compared across species using accessible computational tools such as TCBF. As spatial genomic datasets become increasingly available for non-model and agriculturally important species, the framework established here offers a template for incorporating three-dimensional genome architecture into comparative and applied plant genomics, with particular relevance for identifying conserved regulatory elements that might otherwise be overlooked by sequence-based approaches alone.
Supplementary Materials
The following supporting information can be downloaded at https://www.mdpi.com/article/10.3390/ijms27208979/s1.
Author Contributions
Conceptualization, O.G. and A.K.; Methodology, O.G. and A.K.; Software, O.G. and A.K.; Validation, O.G. and A.K.; Formal Analysis, O.G.; Investigation, O.G.; Writing—Original Draft Preparation, O.G.; Writing—Review and Editing, O.G. and A.K.; Visualization, O.G.; Supervision, A.K. All authors have read and agreed to the published version of the manuscript.
Funding
This work was supported by grants from the Zegar Family Foundation (no. A16-0051–004) and the National Science Foundation Plant Genome Research Program (no. IOS-1546218).
Institutional Review Board Statement
Not applicable.
Informed Consent Statement
Not applicable.
Data Availability Statement
The publicly available datasets analyzed in this study are accessible through the repositories and accession numbers specified in the Materials and Methods section. The primary TAD boundary conservation datasets generated in this study and used for downstream analyses are provided as Supplementary Material. Additional processed data are available from the corresponding author.
Acknowledgments
We would like to acknowledge the instrumental support, funding and mentorship from Michael Purugganan, as well as the Purugganan Lab in its entirety. We would also like to acknowledge the scientific guidance and conceptual oversight from Nadine Bou Rached. The wild rice accessions used in this study were distributed from the National Institute of Genetics supported by the National Bioresource Project, MEXT, Japan.
Conflicts of Interest
The authors declare no conflicts of interest.
References
- Nuriddinov, M.; Fishman, V. C-InterSecture—A computational tool for interspecies comparison of genome architecture. Bioinformatics 2019, 35, 4912–4921. [Google Scholar] [CrossRef] [Scilit] [PubMed]
- Pal, K.; Forcato, M.; Ferrari, F. Hi-C analysis: From data generation to integration. Biophys. Rev. 2019, 11, 67–78. [Google Scholar] [CrossRef] [Scilit] [PubMed]
- Active Motif. IMPROVING the Resolution of Hi-C Assays with Micro-C. Active Motif Blog (2023). Available online: https://www.activemotif.com/blog-micro-c (accessed on 30 August 2026).
- Park, P.J. ChIP–seq: Advantages and challenges of a maturing technology. Nat. Rev. Genet. 2009, 10, 669–680. [Google Scholar] [CrossRef] [Scilit] [PubMed]
- Ou, H.D.; Phan, S.; Deerinck, T.J.; Thor, A.; Ellisman, M.H.; O’shea, C.C. ChromEMT: Visualizing 3D chromatin structure and compaction in interphase and mitotic cells. Science 2017, 357, eaag0025. [Google Scholar] [CrossRef] [Scilit] [PubMed]
- Rajderkar, S.; Barozzi, I.; Zhu, Y.; Hu, R.; Zhang, Y.; Li, B.; Caro, A.A.; Fukuda-Yuzawa, Y.; Kelman, G.; Akeza, A.; et al. Topologically associating domain boundaries are required for normal genome function. Commun. Biol. 2023, 6, 435. [Google Scholar] [CrossRef] [Scilit] [PubMed]
- Dixon, J.R.; Selvaraj, S.; Yue, F.; Kim, A.; Li, Y.; Shen, Y.; Hu, M.; Liu, J.S.; Ren, B. Topological domains in mammalian genomes identified by analysis of chromatin interactions. Nature 2012, 485, 376–380. [Google Scholar] [CrossRef] [Scilit] [PubMed]
- Eser, U.; Chandler-Brown, D.; Ay, F.; Straight, A.F.; Duan, Z.; Noble, W.S.; Skotheim, J.M. Form and function of topologically associating genomic domains in budding yeast. Proc. Natl. Acad. Sci. USA 2017, 114, E3061–E3070, Erratum in Proc. Natl. Acad. Sci. USA 2017, 114, E8801. https://doi.org/10.1073/pnas.1716156114. [Google Scholar] [CrossRef] [Scilit] [PubMed]
- Chen, B.; Ren, C.; Ouyang, Z.; Xu, J.; Xu, K.; Li, Y.; Guo, H.; Bai, X.; Tian, M.; Xu, X.; et al. Stratifying TAD boundaries pinpoints focal genomic regions of regulation, damage, and repair. Brief. Bioinform. 2024, 25, bbae306. [Google Scholar] [CrossRef] [Scilit] [PubMed]
- Ong, C.T.; Corces, V.G. CTCF: An architectural protein bridging genome topology and function. Nat. Rev. Genet. 2014, 15, 234–246. [Google Scholar] [CrossRef] [Scilit] [PubMed]
- Dong, P.; Tu, X.; Liang, Z.; Kang, B.-H.; Zhong, S. Plant and animal chromatin three-dimensional organization: Similar structures but different functions. J. Exp. Bot. 2020, 71, 5119–5128. [Google Scholar] [CrossRef] [Scilit] [PubMed]
- Pei, L.; Li, G.; Lindsey, K.; Zhang, X.; Wang, M. Plant 3D genomics: The exploration and application of chromatin organization. New Phytol. 2021, 230, 1772–1786. [Google Scholar] [CrossRef] [Scilit] [PubMed]
- Sun, X.; Zhang, J.; Cao, C. CTCF and its partners: Shaper of 3D genome during development. Genes 2022, 13, 1383. [Google Scholar] [CrossRef] [Scilit] [PubMed]
- Wang, H.; Xu, W.; Sun, Y.; Lian, Q.; Wang, C.; Yu, C.; He, C.; Wang, J.; Ma, H.; Copenhaver, G.P.; et al. The cohesin loader SCC2 contains a PHD finger that is required for meiosis in land plants. PLoS Genet. 2020, 16, e1008849. [Google Scholar] [CrossRef] [Scilit] [PubMed]
- Zhao, Y.; Ren, L.; Zhao, T.; You, H.; Miao, Y.; Liu, H.; Cao, L.; Wang, B.; Shen, Y.; Li, Y.; et al. SCC3 is an axial element essential for homologous chromosome pairing and synapsis. eLife 2024, 13, RP94180. [Google Scholar] [CrossRef] [PubMed]
- Singh, D.-K.; Mahlandt, A.; Durand, S.; Jolivet, S.; Walkemeier, B.; Taochy, C.; Solier, V.; Derkacheva, M.; Siddiqi, I.; Cromer, L.; et al. Cohesin and its regulation promote monopolar kinetochore orientation at meiosis I in Arabidopsis. Curr. Biol. 2026, 36, 1994–2007.e3. [Google Scholar] [CrossRef] [Scilit] [PubMed]
- Kurbidaeva, A.; Purugganan, M.D. Insulators in plants: Progress and open questions. Genes 2021, 12, 1422. [Google Scholar] [CrossRef] [Scilit] [PubMed]
- Batut, P.J.; Bing, X.Y.; Sisco, Z.; Raimundo, J.; Levo, M.; Levine, M.S. Genome organization controls transcriptional dynamics during development. Science 2022, 375, 566–570. [Google Scholar] [CrossRef] [Scilit] [PubMed]
- Kurbidaeva, A.; Gupta, S.; Zaidem, M.; Castanera, R.; Sato, Y.; Joly-Lopez, Z.; Casacuberta, J.M.; Purugganan, M.D. Topologically associating domains and the evolution of three-dimensional genome architecture in rice. Plant J. 2025, 122, e70139. [Google Scholar] [CrossRef] [Scilit] [PubMed]
- Okhovat, M.; VanCampen, J.; Nevonen, K.A.; Harshman, L.; Li, W.; Layman, C.E.; Ward, S.; Herrera, J.; Wells, J.; Sheng, R.R.; et al. TAD evolutionary and functional characterization reveals diversity in mammalian TAD boundary properties and function. Nat. Commun. 2023, 14, 8111. [Google Scholar] [CrossRef] [Scilit] [PubMed]
- Torosin, N.S.; Golla, T.R.; A Lawlor, M.; Cao, W.; Ellison, C.E. Mode and tempo of 3D genome evolution in Drosophila. Mol. Biol. Evol. 2022, 39, msac216. [Google Scholar] [CrossRef] [Scilit] [PubMed]
- Che, Y.; Bush, S.J.; Lin, H.; Li, M.; Yang, X.; Xie, Q.; Liu, Y.; Meng, D.; Ye, K. The evolution of high-order genome architecture revealed from 1000 species. Cell 2026, 189, 2897–2913. [Google Scholar] [CrossRef] [Scilit] [PubMed]
- Dong, P.; Tu, X.; Chu, P.-Y.; Lü, P.; Zhu, N.; Grierson, D.; Du, B.; Li, P.; Zhong, S. 3D chromatin architecture of large plant genomes determined by local A/B compartments. Mol. Plant 2017, 10, 1497–1509. [Google Scholar] [CrossRef] [Scilit] [PubMed]
- Xie, T.; Zhang, F.-G.; Zhang, H.-Y.; Wang, X.-T.; Hu, J.-H.; Wu, X.-M. Biased gene retention during diploidization in Brassica linked to three-dimensional genome organization. Nat. Plants 2019, 5, 822–832. [Google Scholar] [CrossRef] [Scilit] [PubMed]
- Zhang, L.; Zhao, J.; Bi, H.; Yang, X.; Zhang, Z.; Su, Y.; Li, Z.; Zhang, L.; Sanderson, B.J.; Liu, J.; et al. Bioinformatic analysis of chromatin organization and biased expression of duplicated genes between two poplars with a common whole-genome duplication. Hortic. Res. 2021, 8, 62. [Google Scholar] [CrossRef] [Scilit] [PubMed]
- Sedeek, K.E.M.; Mahas, A.; Mahfouz, M. Plant genome engineering for targeted improvement of crop traits. Front. Plant Sci. 2019, 10, 114. [Google Scholar] [CrossRef] [Scilit] [PubMed]
- Göbel, A.-M.; Zhou, S.; Wang, Z.; Tzourtzou, S.; Himmelbach, A.; Zheng, S.; Pradillo, M.; Liu, C.; Jiang, H. Mutations of PDS5 genes enhance TAD-like domain formation in Arabidopsis thaliana. Nat. Commun. 2024, 15, 9308. [Google Scholar] [CrossRef] [Scilit] [PubMed]
- Feng, S.; Cokus, S.J.; Schubert, V.; Zhai, J.; Pellegrini, M.; Jacobsen, S.E. Genome-wide Hi-C analyses in wild-type and mutants reveal high-resolution chromatin interactions in Arabidopsis. Mol. Cell 2014, 55, 694–707. [Google Scholar] [CrossRef] [Scilit] [PubMed]
- Wang, C.; Liu, C.; Roqueiro, D.; Grimm, D.; Schwab, R.; Becker, C.; Lanz, C.; Weigel, D. Genome-wide analysis of local chromatin packing in Arabidopsis thaliana. Genome Res. 2015, 25, 246–256. [Google Scholar] [CrossRef] [Scilit] [PubMed]
- Wang, M.; Wang, P.; Lin, M.; Ye, Z.; Li, G.; Tu, L.; Shen, C.; Li, J.; Yang, Q.; Zhang, X. Evolutionary dynamics of 3D genome architecture following polyploidization in cotton. Nat. Plants 2018, 4, 90–97. [Google Scholar] [CrossRef] [Scilit] [PubMed]
- Junaid, A.; Singh, B.; Bhatia, S. Evolutionary insights into 3D genome organization and epigenetic landscape of Vigna mungo. Life Sci. Alliance 2024, 7, e202302074. [Google Scholar] [CrossRef] [Scilit] [PubMed]
- Li, X.; Wang, J.; Yu, Y.; Li, G.; Wang, J.; Li, C.; Zeng, Z.; Li, N.; Zhang, Z.; Dong, Q.; et al. Genomic rearrangements and evolutionary changes in 3D chromatin topologies in the cotton tribe (Gossypieae). BMC Biol. 2023, 21, 56. [Google Scholar] [CrossRef] [Scilit] [PubMed]
- Liu, C.; Cheng, Y.J.; Wang, J.W.; Weigel, D. Prominent topologically associated domains differentiate global chromatin packing in rice from Arabidopsis. Nat. Plants 2017, 3, 742–748. [Google Scholar] [CrossRef] [Scilit] [PubMed]
- Dong, Q.; Li, N.; Li, X.; Yuan, Z.; Xie, D.; Wang, X.; Li, J.; Yu, Y.; Wang, J.; Ding, B.; et al. Genome-wide Hi-C analysis reveals extensive hierarchical chromatin interactions in rice. Plant J. 2018, 94, 1141–1156. [Google Scholar] [CrossRef] [Scilit] [PubMed]
- He, X.; Huang, X.; Long, Y.; Liu, Z.; Chang, X.; Zhang, X.; Wang, M. Tcbf: A novel user-friendly tool for pan-3D genome analysis of topologically associating domain in eukaryotic organisms. Bioinformatics 2023, 39, btad576. [Google Scholar] [CrossRef] [Scilit] [PubMed]
- Stein, J.C.; Yu, Y.; Copetti, D.; Zwickl, D.J.; Zhang, L.; Zhang, C.; Chougule, K.; Gao, D.; Iwata, A.; Goicoechea, J.L.; et al. Genomes of 13 domesticated and wild rice relatives highlight genetic conservation, turnover and innovation across the genus Oryza. Nat. Genet. 2018, 50, 285–296, Erratum in Nat. Genet. 2018, 50, 1618. https://doi.org/10.1038/s41588-018-0261-2. [Google Scholar] [CrossRef] [Scilit] [PubMed]
- Long, W.; He, Q.; Wang, Y.; Wang, Y.; Wang, J.; Yuan, Z.; Wang, M.; Chen, W.; Luo, L.; Luo, L.; et al. Genome evolution and diversity of wild and cultivated rice species. Nat. Commun. 2024, 15, 9994. [Google Scholar] [CrossRef] [Scilit] [PubMed]
- Almeida-Silva, F.; Van de Peer, Y. Whole-genome duplications and the long-term evolution of gene regulatory networks in angiosperms. Mol. Biol. Evol. 2023, 40, msad141. [Google Scholar] [CrossRef] [Scilit] [PubMed]
- Golicz, A.A.; Bhalla, P.L.; Edwards, D.; Singh, M.B. Rice 3D chromatin structure correlates with sequence variation and meiotic recombination rate. Commun. Biol. 2020, 3, 235. [Google Scholar] [CrossRef] [Scilit] [PubMed]
- Luan, S.; Gao, R.; Chen, G.; Liu, C.; Li, D.; Xue, Z.; Zhang, Y.; Li, Y.; Ding, C.; Liu, B.; et al. Haplotype-resolved 3D genome maps reveal RNAPII-mediated allelic regulation in hybrid rice. aBIOTECH 2026, 7, 100080. [Google Scholar] [CrossRef] [Scilit] [PubMed]
- Nützmann, H.-W.; Doerr, D.; Ramírez-Colmenero, A.; Sotelo-Fonseca, J.E.; Wegel, E.; Di Stefano, M.; Wingett, S.W.; Fraser, P.; Hurst, L.; Fernandez-Valverde, S.L.; et al. Active and repressed biosynthetic gene clusters have spatially distinct chromosome states. Proc. Natl. Acad. Sci. USA 2020, 117, 13800–13809. [Google Scholar] [CrossRef] [Scilit] [PubMed]
- Bai, X.; Tang, X.; Wang, Y.; Yue, S.; Xu, X.; Hu, P.; Xu, J.; Li, Y.; Wang, J.; Tao, H.; et al. The hierarchical folding dynamics of topologically associating domains during early embryo development. BMC Biol. 2025, 23, 175. [Google Scholar] [CrossRef] [Scilit] [PubMed]
- Tourdot, E.; Grob, S. Three-dimensional chromatin architecture in plants—General features and novelties. Eur. J. Cell Biol. 2023, 102, 151344. [Google Scholar] [CrossRef] [Scilit] [PubMed]
- Rudan, M.V.; Barrington, C.; Henderson, S.; Ernst, C.; Odom, D.T.; Tanay, A.; Hadjur, S. Comparative Hi-C reveals that CTCF underlies evolution of chromosomal domain architecture. Cell Rep. 2015, 10, 1297–1309. [Google Scholar] [CrossRef] [Scilit] [PubMed]
- Kentepozidou, E.; Aitken, S.J.; Feig, C.; Stefflova, K.; Ibarra-Soria, X.; Odom, D.T.; Roller, M.; Flicek, P. Clustered CTCF binding is an evolutionary mechanism to maintain topologically associating domains. Genome Biol. 2020, 21, 5. [Google Scholar] [CrossRef] [Scilit] [PubMed]
- Ramírez, F.; Bhardwaj, V.; Arrigoni, L.; Lam, K.C.; Grüning, B.A.; Villaveces, J.; Habermann, B.; Akhtar, A.; Manke, T. High-resolution TADs reveal DNA sequences underlying genome organization in flies. Nat. Commun. 2018, 9, 189. [Google Scholar] [CrossRef] [Scilit] [PubMed]
- Casper, J.; Speir, M.L.; Raney, B.J.; Perez, G.; Nassar, L.R.; Lee, C.M.; Hinrichs, A.S.; Gonzalez, J.N.; Fischer, C.; Diekhans, M.; et al. The UCSC Genome Browser database: 2026 update. Nucleic Acids Res. 2026, 54, D1331–D1335. [Google Scholar] [CrossRef] [Scilit] [PubMed]
- Shang, L.; He, W.; Wang, T.; Yang, Y.; Xu, Q.; Zhao, X.; Yang, L.; Zhang, H.; Li, X.; Lv, Y.; et al. A complete assembly of the rice Nipponbare reference genome. Mol. Plant 2023, 16, 1232–1236. [Google Scholar] [CrossRef] [Scilit] [PubMed]
- Xie, L.; Huang, Y.; Huang, W.; Shang, L.; Sun, Y.; Chen, Q.; Bi, S.; Suo, M.; Zhang, S.; Yang, C.; et al. Genetic diversity and evolution of rice centromeres. Nat. Genet. 2025, 57, 2808–2818. [Google Scholar] [CrossRef] [Scilit] [PubMed]
- Reimand, J.; Kull, M.; Peterson, H.; Hansen, J.; Vilo, J. g:Profiler—A web-based toolset for functional profiling of gene lists from large-scale experiments. Nucleic Acids Res. 2007, 35, W193–W200. [Google Scholar] [CrossRef] [Scilit] [PubMed]
- Yu, G.; Wang, L.-G.; Han, Y.; He, Q.-Y. clusterProfiler: An R package for comparing biological themes among gene clusters. OMICS 2012, 16, 284–287. [Google Scholar] [CrossRef] [Scilit] [PubMed]
- Mi, H.; Muruganujan, A.; Casagrande, J.T.; Thomas, P.D. Large-scale gene function analysis with the PANTHER classification system. Nat. Protoc. 2013, 8, 1551–1566. [Google Scholar] [CrossRef] [Scilit] [PubMed]
- Joly-Lopez, Z.; Platts, A.E.; Gulko, B.; Choi, J.Y.; Groen, S.C.; Zhong, X.; Siepel, A.; Purugganan, M.D. An inferred fitness consequence map of the rice genome. Nat. Plants 2020, 6, 119–130. [Google Scholar] [CrossRef] [Scilit] [PubMed]
- Ou, S.; Su, W.; Liao, Y.; Chougule, K.; Agda, J.R.A.; Hellinga, A.J.; Lugo, C.S.B.; Elliott, T.A.; Ware, D.; Peterson, T.; et al. Benchmarking transposable element annotation methods for creation of a streamlined, comprehensive pipeline. Genome Biol. 2019, 20, 275. [Google Scholar] [CrossRef] [Scilit] [PubMed]
- O’Donnell, S.; Fischer, G. MUM&Co: Accurate detection of all SV types through whole-genome alignment. Bioinformatics 2020, 36, 3242–3243. [Google Scholar] [CrossRef] [Scilit] [PubMed]
- Liang, Z.; Zhang, Q.; Ji, C.; Hu, G.; Zhang, P.; Wang, Y.; Yang, L.; Gu, X. Reorganization of the 3D chromatin architecture of rice genomes during heat stress. BMC Biol. 2021, 19, 53. [Google Scholar] [CrossRef] [Scilit] [PubMed]
- Dale, R.K.; Pedersen, B.S.; Quinlan, A.R. Pybedtools: A flexible Python library for manipulating genomic datasets and annotations. Bioinformatics 2011, 27, 3423–3424. [Google Scholar] [CrossRef] [Scilit] [PubMed]
- Moner, A.M.; Furtado, A.; Chivers, I.; Fox, G.; Crayn, D.; Henry, R.J. Diversity and evolution of rice progenitors in Australia. Ecol. Evol. 2018, 8, 4360–4366. [Google Scholar] [CrossRef] [Scilit] [PubMed]
- Ondov, B.D.; Treangen, T.J.; Melsted, P.; Mallonee, A.B.; Bergman, N.H.; Koren, S.; Phillippy, A.M. Mash: Fast genome and metagenome distance estimation using MinHash. Genome Biol. 2016, 17, 132. [Google Scholar] [CrossRef] [Scilit] [PubMed]
Disclaimer/Publisher’s Note: The statements, opinions and data contained in all publications are solely those of the individual author(s) and contributor(s) and not of MDPI and/or the editor(s). MDPI and/or the editor(s) disclaim responsibility for any injury to people or property resulting from any ideas, methods, instructions or products referred to in the content. |
© 2026 by the authors. Licensee MDPI, Basel, Switzerland. This article is an open access article distributed under the terms and conditions of the Creative Commons Attribution (CC BY) license.