


Abstract
European cornelian cherry (Cornus mas L.) has attracted considerable scientific interest due to its rich composition of bioactive compounds and associated health-promoting properties. The present study evaluated the phenolic composition, antioxidant activity, and cytotoxic effects of fruit extracts from three cultivars (‘Schonbrunner Gourmet-Dirndl’, ‘Jolico’, and ‘Variegata’) and three clones (P227, P419, and P420), with particular attention to the potential relationship between phenolic composition and cytotoxic activity. Qualitative and quantitative analysis of phenolic compounds was performed using ultra-high-performance liquid chromatography coupled with electrospray ionization tandem mass spectrometry (UHPLC-ESI-MS/MS), which identified 14 compounds, including phenolic acids, flavonols, flavones, and flavanones. Major compounds included chlorogenic acid (244.02 µg/g DW), rutin (46.16 µg/g DW), and protocatechuic acid (40.69 µg/g DW). The characterized phenolic profile, together with high in vitro antioxidant capacity determined by ABTS and CUPRAC assays, confirms the strong antioxidant potential and functional relevance of cornelian cherry fruits. Although all tested cultivars and clones exhibited comparable cytotoxic activity, cultivar ‘Jolico’ demonstrated the most pronounced effect, particularly against melanoma IGR39 cells. Overall, the results demonstrate that cornelian cherry fruits are a rich source of phenolic compounds and exhibit in vitro antioxidant and cytotoxic activities. These findings support further investigation of C. mas fruits as a potential source of bioactive compounds for food and health-related research.
1. Introduction
Cornus mas L., commonly known as European cornelian cherry, is a species belonging to the family Cornaceae Bercht. ex J. Presl and the genus Cornus L. [1]. According to World Flora Online, the genus Cornus currently comprises approximately 57 accepted species [2]. Species of the genus Cornus are widely distributed throughout the Northern Hemisphere [3]. Most species occur as shrubs or small trees, although the genus also includes herbaceous forms and geographically isolated taxa [1]. Members of this genus exhibit considerable morphological diversity. Based on inflorescence morphology, fruit characteristics, and other diagnostic traits, they are traditionally classified into four main clades: blue- or white-fruited dogwoods, cornelian cherries, large-bracted dogwoods, and dwarf dogwoods [4,5].
C. mas produces an annual yield of edible drupes valued for their characteristic sweet-tart flavor and nutritional value [6,7]. European cornelian cherry fruits are rich in diverse bioactive compounds, particularly flavonoids, phenolic acids, tannins, iridoids, triterpenic compounds, carotenoids, organic acids, vitamins, and minerals [8,9,10,11,12,13]. Among flavonoids, quercetin and kaempferol derivatives predominate, including quercetin 3-O-glucuronide, rutin, quercetin 3-O-galactoside, quercetin-3-O-rutinoside, catechin, epicatechin, and procyanidin B2 [8,10]. Anthocyanins such as cyanidin 3-O-galactoside, cyanidin 3-O-glucoside, pelargonidin derivatives, and delphinidin glycosides have also been identified as major compounds in the fruits [12,13,14]. The principal phenolic acids reported in C. mas fruits include chlorogenic, gallic, ellagic, neochlorogenic, caffeic, protocatechuic, ferulic, and p-coumaric acids [7,9,12,15]. In addition, characteristic iridoids of the genus Cornus, including loganin, loganic acid, sweroside, and cornuside, have been identified in fruit extracts and juices [12,16,17,18,19,20]. Carotenoids such as β-carotene, lutein, neoxanthin, and β-cryptoxanthin, together with organic acids including malic, citric, tartaric, and succinic acids, further contribute to the phytochemical profile of the species [21,22].
A broad range of biological activities has been reported for C. mas [4]. Its fruit extracts have shown strong in vitro antioxidant activity in DPPH, FRAP, and ABTS assays, which was closely associated with their total phenolic and anthocyanin contents [15,16,22,23,24,25]. Antidiabetic effects of C. mas have been demonstrated in animal studies and clinical trials, where fruit extracts reduced blood glucose and lipid levels while improving insulin secretion and glucose tolerance [26,27,28,29,30]. The fruits also exhibited hypolipidemic, anti-inflammatory, antibacterial, anticoagulant, and anticancer properties [4]. Available toxicity studies suggest that C. mas fruit consumption is generally safe and does not produce significant adverse effects in either animal or human models [1,31,32]. However, further studies evaluating long-term consumption and higher doses are still needed.
C. mas fruits were selected for this study due to their high content of phenolic compounds and their growing recognition as a promising source of natural bioactive substances. Although the phenolic composition and biological activities of C. mas fruits have been investigated, information on the relationship between phenolic composition and cytotoxic effects across different cultivars and clones remains limited. Therefore, the aim of this study was to characterize the phenolic composition of fruits from different C. mas cultivars and clones using UHPLC-ESI-MS/MS, evaluate their in vitro antioxidant and cytotoxic activities, and explore the potential relationship between individual phenolic compounds and cytotoxic effects against selected cancer cell lines.
2. Materials and Methods
2.1. Plant Material
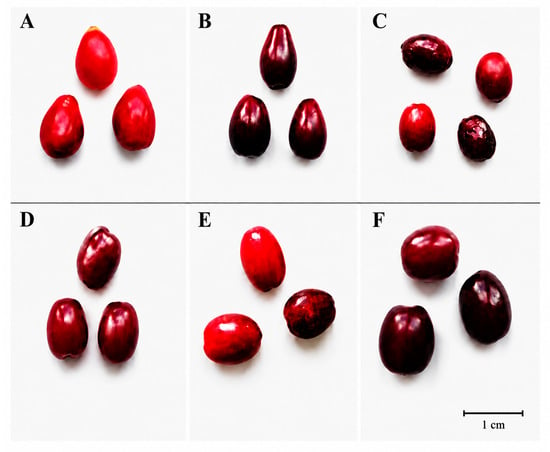
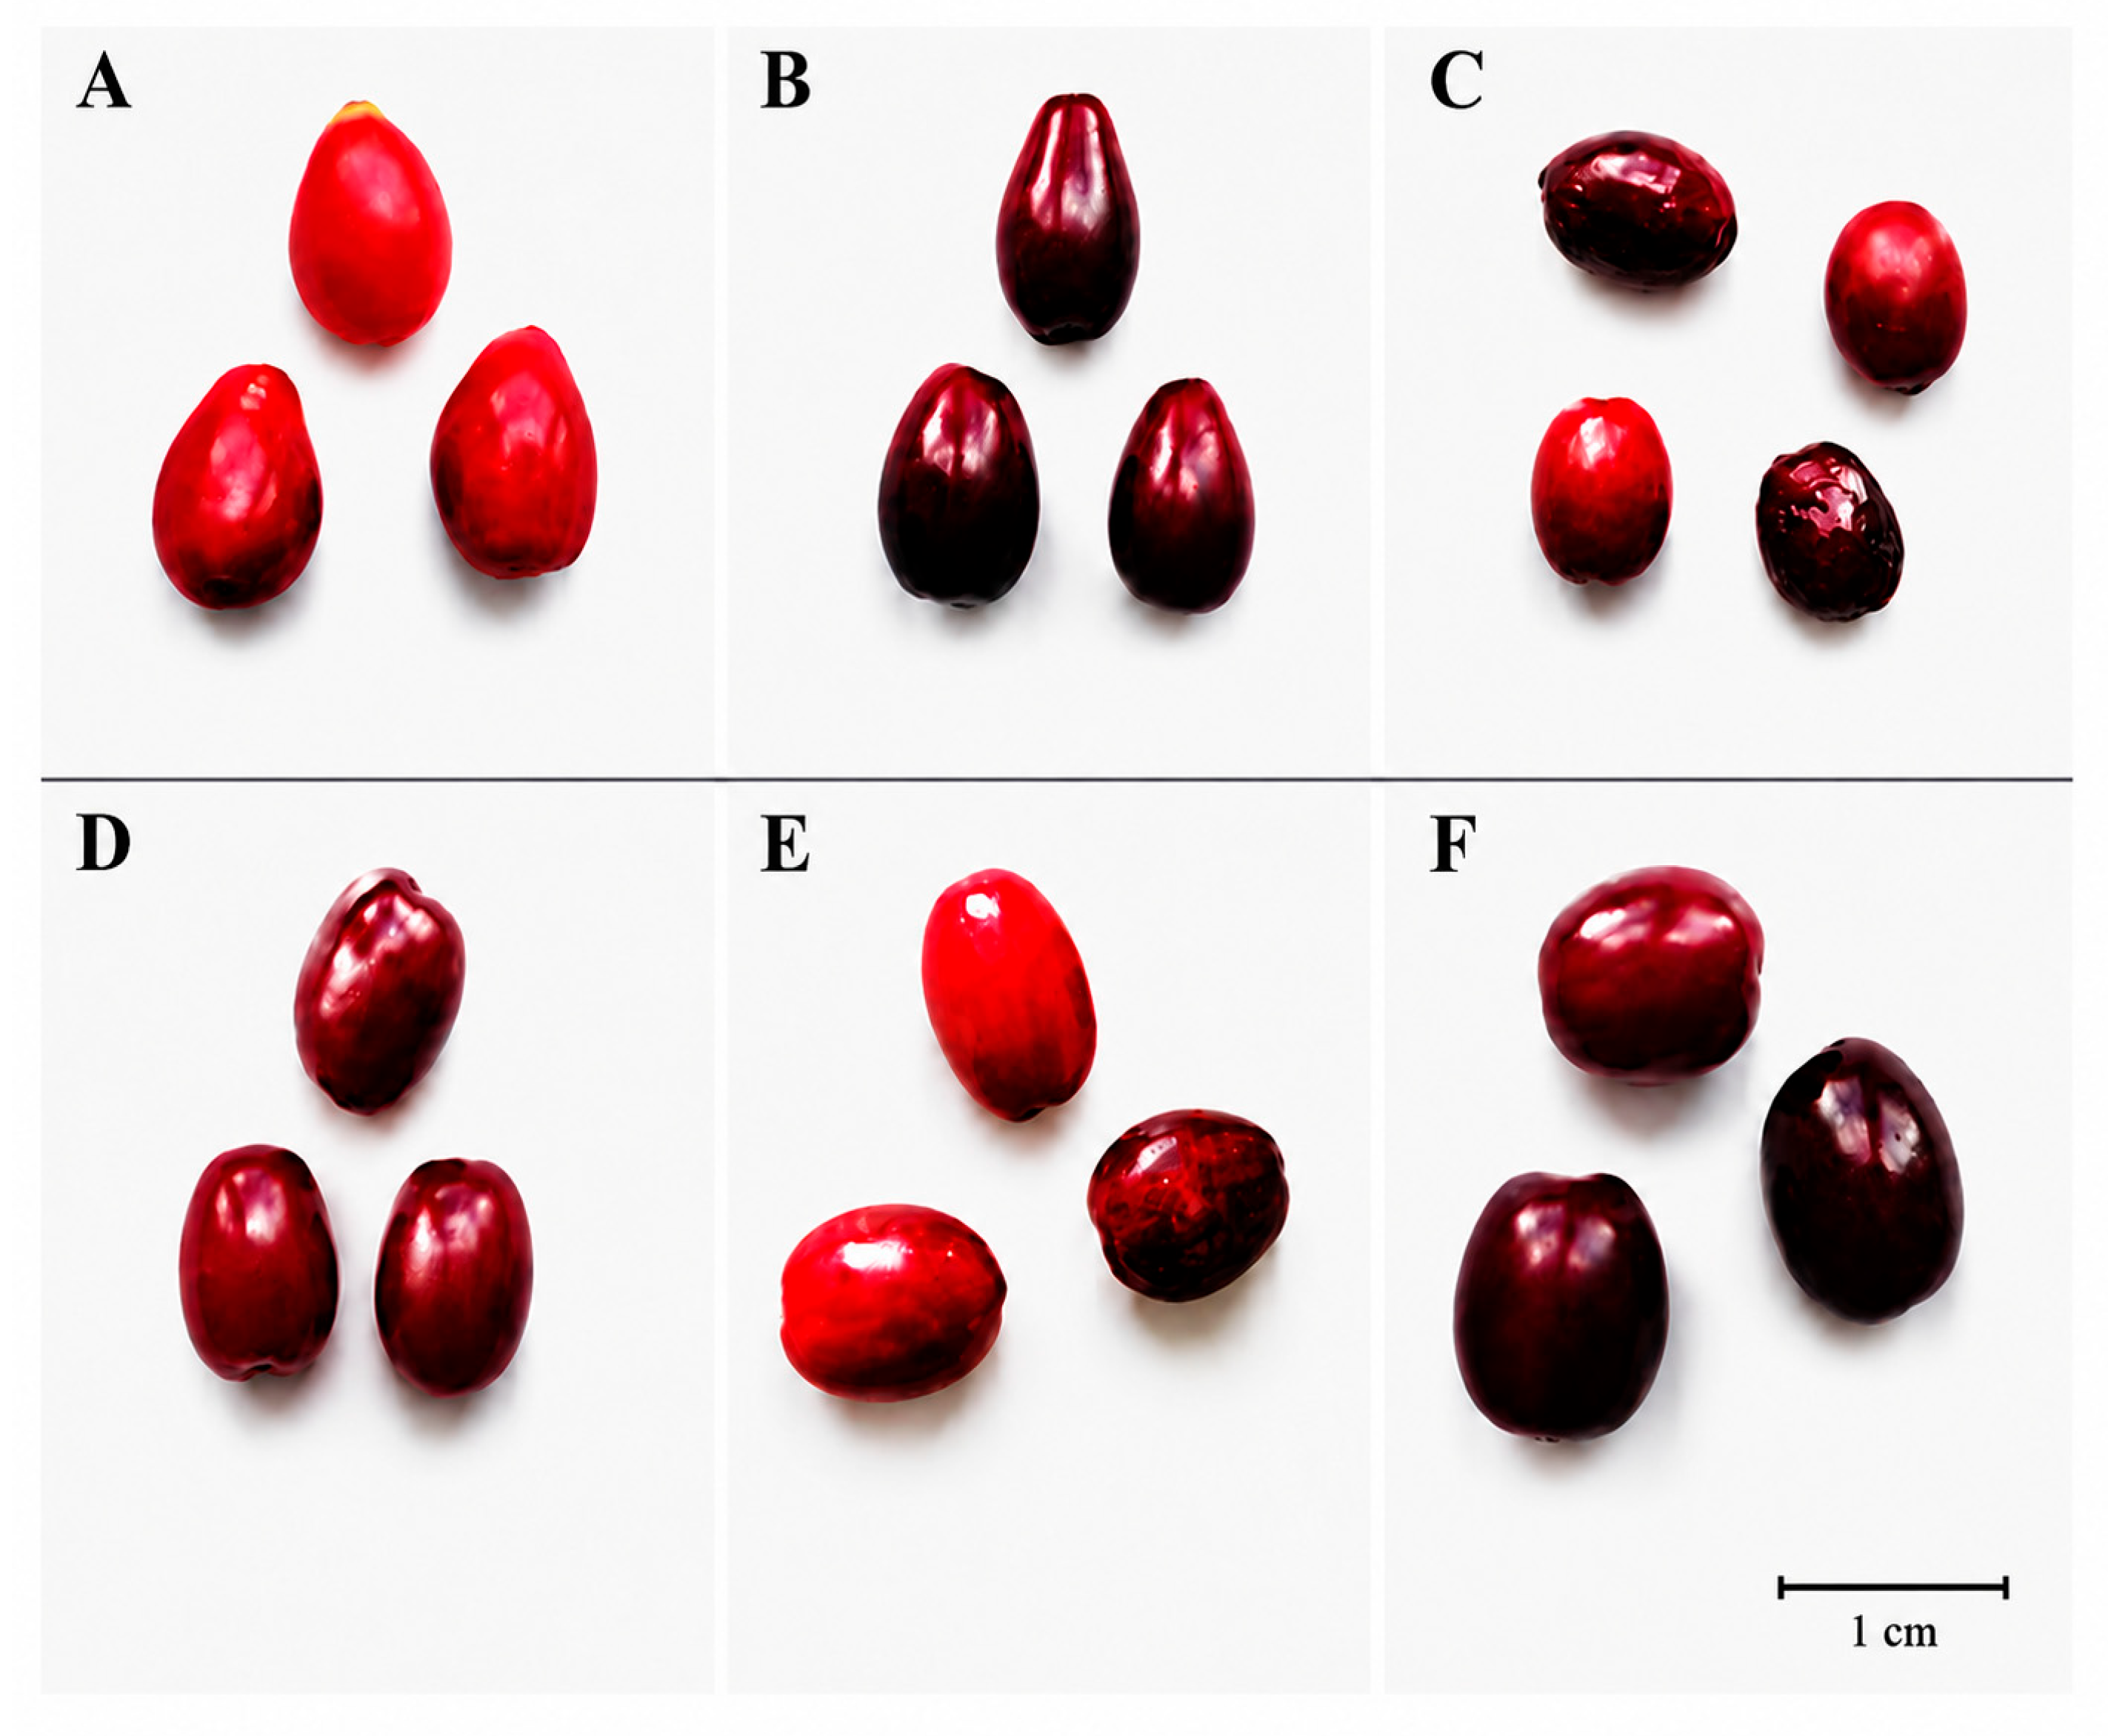
Three Cornus mas L. cultivars (‘Schonbrunner Gourmet-Dirndl’, ‘Jolico’, and ‘Variegata’), and three clones (P227, P419, and P420) were selected from the genetic resource collection of the Botanical Garden at Vytautas Magnus University (VMU). This collection is located in the Kaunas region (central Lithuania), at WGS84 coordinates 54.87054° N, 23.91620° E, and an altitude of 76 m above sea level. The average annual temperature is +6.9 °C, the average annual precipitation is 700 mm, and the mean temperature is +18.0 °C in July and −3.8 °C in January. Fresh fruits (drupes) were sampled from three randomly selected bushes of each cultivar during August–September at the full ripening stage. The ripening stage was determined by visually evaluating the fruit for red coloration and the seeds for a brown hue. Three replicates of 0.3 kg of fresh fruit were prepared for each cultivar and clone. After collection, the fruit samples were placed in plastic bags, stored at −25 °C, and subsequently lyophilized using a Zirbus lyophilizer (Zirbus Technology GmbH, Bad Grund, Germany) at 0.01 mbar and a condenser temperature of −85 °C. Characteristics of C. mas fruits are presented in Figure 1 and Table 1.
Figure 1.
Morphological variability of C. mas cultivars and clones (A)—‘Schonbrunner Gourmet-Dirndl’, (B)—‘Jolico’, (C)—‘Variegata’, (D)—P227, (E)—P419, (F)—P420.
Table 1.
Characteristics of C. mas accessions investigated in the present study.
The lyophilized material was ground into powder and stored in tightly closed containers in a dark, dry place. Prior to analysis, moisture content was determined following González-Burgos et al. [33]. Approximately 1.0 g of the milled sample was dried using a moisture analyzer (Precisa HA 300, Precisa Instruments AG, Dietikon, Switzerland) at 105 °C. All results were expressed on a dry weight (DW) basis.
2.2. Materials
All solvents, reagents, and standards used were of analytical grade. Ethanol (96%) was obtained from AB Vilniaus Degtinė (Vilnius, Lithuania). Folin–Ciocalteu reagent, acetic acid, hydrochloric acid, sodium carbonate, gallic acid monohydrate, ABTS (2,2′-azino-bis(3-ethylbenzothiazoline-6-sulfonic acid)), Trolox ((+)-6-hydroxy-2,5,7,8-tetramethylchroman-2-carboxylic acid), copper(II) chloride dihydrate, potassium persulfate, sodium acetate, neocuproine, ammonium acetate, chlorogenic acid, ferulic acid, p-coumaric acid, protocatechuic acid, rutin, hyperoside, isoquercitrin, quercetin, phloridzin, isorhamnetin-3-O-rutinoside, kaempferol-3-O-glucoside, isorhamnetin-3-O-glucoside, luteolin-7-O-glucoside, naringenin, and 2-propanol were purchased from Sigma–Aldrich (Buchs, Switzerland). Distilled water was purified using a Milli-Q system (Millipore, Bedford, MA, USA).
Dulbecco’s Modified Eagle’s GlutaMAX medium, 10,000 U/mL penicillin and 10 mg/mL streptomycin solution (100×), and fetal bovine serum were purchased from Gibco, Carlsbad, CA, USA. 3-(4,5-Dimethylthiazol-2-yl)-2,5-diphenyltetrazolium bromide (MTT) was obtained from Sigma-Aldrich (Buchs, Switzerland).
2.3. Preparation of Fruit Extracts
The preparation of C. mas fruit extracts was carried out according to Česonienė et al. [34], with minor modifications. Briefly, 2.5 g of lyophilized powder was extracted with 40 mL of 70% ethanol. The samples were subjected to ultrasonic extraction in an Elmasonic P ultrasonic bath (Elma Schmidbauer GmbH, Singen, Germany) for 10 min, followed by centrifugation in a Biofuge centrifuge (Heraeus Instruments, Hanau, German) at 8500 rpm for 2 min.
The resulting liquid extracts were used for the determination of total phenolic content, total flavonoid content, and antioxidant activity. For cytotoxicity assays, a separate portion of the filtered extracts was concentrated using a rotary evaporator to remove the ethanol and subsequently lyophilized to obtain dry extracts. Prior to analysis, the liquid extracts were additionally filtered through 0.22 µm pore-size membrane filters (Carl Roth GmbH, Karlsruhe, Germany). All extraction procedures were performed in triplicate for each sample.
2.4. Evaluation of Bioactive Compounds
The total phenolic content (TPC) was determined using the Folin–Ciocalteu assay according to Bobinaitė et al. [35], with a modification in the volume of the extract used. The working Folin–Ciocalteu reagent was prepared by diluting the stock reagent with purified water (1:10, v/v). For the test solution, 0.2 mL of the ethanolic extract of lyophilized C. mas fruits were diluted with 4 mL of purified water. Then, 0.2 mL of the diluted extract was mixed with 5 mL of 10% Folin–Ciocalteu reagent and 4 mL of 7.5% sodium carbonate solution. For the reference solution, 0.2 mL of purified water was mixed with 5 mL of 10% Folin–Ciocalteu reagent and 4 mL of 7.5% sodium carbonate solution. The mixtures were incubated in the dark at room temperature for 60 min, and the absorbance was measured at 765 nm using a 10 mm optical path length. A gallic acid calibration curve was constructed over the concentration range of 0.25–4 mg/mL, with the regression equation y = 0.2136x + 0.0291 and R2 = 0.9998. The results were expressed as mg gallic acid equivalents per gram of dry weight (mg GAE/g DW).
The total flavonoid content (TFC) was determined using the method described by Urbonavičiūtė et al. [36], with modifications involving the proportional reduction in reagent volumes and modification of the time of hexamethylenetetramine solution addition. For the test solution, 1 mL of the ethanolic extract of lyophilized C. mas fruit samples was mixed with 2 mL of 96.3% (v/v) ethanol, 0.1 mL of 30% (v/v) aqueous acetic acid, 0.3 mL of 10% aluminum chloride solution, and 1.2 mL of purified water. The mixture was incubated in the dark at room temperature for 30 min. Subsequently, 0.4 mL of 5% hexamethylenetetramine solution was added and thoroughly mixed. For the reference solution, 1 mL of the ethanolic extract was mixed with 2 mL of 96.3% ethanol, 0.1 mL of 30% aqueous acetic acid, and 1.9 mL of purified water. The samples were then incubated in the dark at room temperature for an additional 30 min. Absorbance was measured at 407 nm using a 10 mm optical path length. A rutin calibration curve was constructed over the concentration range of 0.0625–1 mg/mL, with the regression equation y = 2.0744x + 0.0852 and R2 = 0.9947. The results were expressed as mg rutin equivalents per gram of dry weight (mg RE/g DW).
2.5. Determination of Antioxidant Activity
2.5.1. In Vitro Antiradical Activity by the ABTS Assay
The in vitro antiradical activity of ethanolic extracts of lyophilized C. mas fruit samples was determined using the ABTS radical cation scavenging assay described by Re et al. [37], with modifications according to Liaudanskas et al. [38]. The modifications involved the volume of the extract used for analysis, the incubation time of the reaction mixture, and the initial absorbance of the working ABTS•+ solution. For preparation of the ABTS•+ working solution, a 2 mmol/L ABTS stock solution was prepared by dissolving 0.0548 g of ABTS (2,2′-azino-bis-(3-ethylbenzothiazoline-6-sulfonic acid)) in 50 mL of purified water, followed by the addition of 0.0095 g of potassium persulfate. The prepared ABTS stock solution was kept in the dark for 16 h to allow the oxidation–reduction reaction and formation of ABTS•+. The working ABTS•+ solution was prepared by diluting the stock solution with purified water until an absorbance of 0.8 at 734 nm was reached, measured using a 10 mm optical path length. For the assay, 10 μL of the ethanolic extract of lyophilized C. mas fruit samples was mixed with 3 mL of the working ABTS•+ solution. The reaction mixture was incubated in the dark for 30 min. Subsequently, the absorbance was measured at 734 nm using a 10 mm optical path length. Purified water was used as the reference solution. A Trolox calibration curve was constructed using standard solutions in the concentration range of 400–8000 μmol/L, with the regression equation y = 0.00009x − 0.0081 and R2 = 0.9989.
2.5.2. In Vitro Antioxidant Capacity by the CUPRAC Assay
The in vitro reducing activity of ethanolic extracts of lyophilized C. mas fruit samples was determined using the CUPRAC assay described by Apak et al. [39]. The working CUPRAC solution was freshly prepared by mixing solutions A, B, and C in a 1:1:1 ratio. Solution A consisted of 10 mmol/L copper(II) chloride solution, prepared by dissolving 0.085 g of copper(II) chloride dihydrate in purified water in a 50 mL volumetric flask. Solution B consisted of 1 mmol/L ammonium acetate solution, prepared by dissolving 0.0038 g of ammonium acetate in purified water in a 50 mL volumetric flask. Solution C consisted of 7.5 mmol/L neocuproine solution in ethanol, prepared by dissolving 0.078 g of neocuproine in 96% (v/v) ethanol in a 50 mL volumetric flask. For the assay, 10 μL of the ethanolic extract of lyophilized C. mas fruit samples was mixed with 3 mL of freshly prepared working CUPRAC solution. The reaction mixture was incubated in the dark for 30 min, after which the absorbance was measured at 450 nm using a 10 mm optical path length. The working CUPRAC solution without the addition of the ethanolic extract was used as the reference solution. A Trolox calibration curve was constructed using standard solutions in the concentration range of 400–24,000 μmol/L, with the regression equation y = 0.00005x + 0.0039 and R2 = 0.9993.
2.5.3. Calculation of Antioxidant Activity
The antioxidant activity of the ethanolic extracts of C. mas fruit samples was calculated using the Trolox calibration curves. The calibration curve equations and corresponding coefficients of determination (R2) are provided in the descriptions of the individual assays. The results were expressed as μmol Trolox equivalents per gram of dry weight (μmol TE/g DW). Trolox equivalents (TE) represent the amount of Trolox exhibiting antioxidant activity equivalent to that of the plant material under the specified assay conditions.
2.6. Qualitative and Quantitative Analysis of Phenolic Compounds in C. mas Fruit Samples
The qualitative and quantitative analysis of phenolic compounds was performed using ultra-high-performance liquid chromatography coupled with triple quadrupole electrospray ionization tandem mass spectrometry (UHPLC-ESI-MS/MS). The analytical procedure was performed according to Gonzalez-Burgos et al. [33] using a Waters ACQUITY UPLC® H-Class system (Waters, Milford, MA, USA) coupled with a Xevo TQD mass spectrometer (Waters, Milford, MA, USA). The separation of the target analytes was achieved using a YMC Triart C18 analytical column (100 Å, 100 × 2.0 mm, particle size 1.9 μm; YMC, Co., Ltd., Kyoto, Japan) equipped with a guard column, maintained at a constant temperature of 40 °C. The mobile phase consisted of 0.1% formic acid in water (A) and acetonitrile (B). The flow rate was 0.5 mL/min, and the injection volume was 1 μL. A 10 min gradient elution program was applied as follows: 0–1 min, 95% A; 1–5 min, A decreased to 70%; 5–7 min, A decreased to 50%; 7–7.5 min, A decreased to 0%; 7.5–8 min, 0% A was maintained for column washing; 8–8.1 min, the initial conditions of 95% A were restored; and 8.1–10 min, the column was re-equilibrated under the initial mobile-phase conditions. The mass spectrometer was operated in negative electrospray ionization mode. The capillary voltage was 2000 V, the ion source temperature was 150 °C, the desolvation temperature was 400 °C, the desolvation gas flow rate was 700 L/h, and the cone gas flow rate was 20 L/h. The collision energy and cone voltage were optimized individually for each analyte. Phenolic compounds were analyzed in multiple reaction monitoring (MRM) mode. Chromatographic peaks were identified based on the retention times of the analytes and corresponding reference standards, as well as the mass spectra obtained for the reference standards and analytes using the mass spectrometric detector. Quantification was performed based on the relationship between the analyte peak area and its concentration in the sample solution using the corresponding calibration equations. The mass spectrometric conditions for the analyzed phenolic compounds are summarized in Table 2.
Table 2.
Mass spectrometry parameters for the analysis of phenolic compounds.
2.7. Determination of Cytotoxicity by MTT Assay
The effect of extracts on cancer cell viability was determined using the MTT assay, as described earlier by Liaudanskas et al. [40]. Briefly, the human triple-negative breast cancer MDA-MB231, melanoma IGR39, colorectal cancer HCT116 cell lines and human foreskin fibroblasts (HF, CRL-4001) were obtained from the American Type Culture Collection (ATCC, Manassas, VA, USA). Cells were cultured in Dulbecco’s Modified Eagle’s GlutaMAX medium supplemented with 10,000 U/mL penicillin, 10 mg/mL streptomycin, and 10% fetal bovine serum. All cell lines were cultivated at 37 °C temperature, in a humidified atmosphere with 5% CO2, and used until passage 20. The cells were plated into the 96-well plate at a concentration of 5000 cells/well of MDA-MB231 cells, 4000 cells/well of IGR39 cells, 3000 fibroblasts/well, 8000 cells/well of HCT116 cells, and incubated for 24 h in the incubator.
For initial screening, the extracts were dissolved in the culture medium at a concentration of 4 mg/mL and added to the 96-well plates in triplicate; thus, the final concentration of extracts was 2 mg/mL. The untreated control was cells treated with only medium supplemented with antibiotics and serum, which was also used in all wells with extract dilutions. The positive (blank) control was empty wells with only medium (without any cells) to imitate the conditions when all the cells were killed. Cell-free wells containing culture medium were included to establish the background signal corresponding to the absence of cells. This signal was used as the lower reference point (0% viability) for the normalization of cell viability measurements.
After 72 h of incubation, 20 μL of 5 mg/mL MTT dye (Sigma-Aldrich) was added to each well. Following incubation for 3 h, the medium was discharged, and the formazan crystals were dissolved in 2-propanol (Sigma-Aldrich). The absorbance was measured with a multidetection microplate reader, Multiscan Go (Thermo Fisher Scientific Oy, Vantaa, Finland), at 570 and 630 nm. Background-corrected absorbance was obtained by subtracting the absorbance at 630 nm from that at 570 nm for each sample.
The relative cell viability was calculated using the formula:
where
- Atest—corrected absorbance of a tested extract;
- Ablank—corrected absorbance of a blank control;
- Anegative—corrected absorbance of a negative control.
For dose–response determination, the same MTT assay procedure was used, with serial double dilutions of extracts added to the plates, ranging from 4 to 0.125 mg/mL. The untreated control was cells treated with medium containing 0.5% DMSO, which was also used in all wells with extract dilutions. The EC50 values (the concentration of tested extract that results in a 50% reduction in the metabolic activity of cells) were calculated using the Hill equation.
2.8. Statistical Analysis and SI Calculation
Statistical analysis was conducted using Microsoft Office Excel 2016 (Microsoft, Redmond, WA, USA) and SPSS Statistics 30 (IBM, Armonk, NY, USA). All experiments were performed in triplicate, and the results are presented as mean ± standard deviation (SD). Correlations were assessed using the Pearson correlation test. To determine statistical significance, a one-way analysis of variance (ANOVA) with the Tukey post hoc test was employed. The differences were considered statistically significant at p < 0.05.
EC50 values were log10-transformed prior to statistical analysis to reduce distributional skewness and improve their suitability for parametric testing. For each compound, differences between cell lines were evaluated using one-way repeated-measures ANOVA, followed by Dunnett’s multiple comparisons test to compare each cancer cell line with human fibroblasts. The three independent experiments were treated as matched measurements. A p-value < 0.05 was considered statistically significant.
Selectivity index (SI) values were calculated for each independent experiment as the ratio of EC50 in cancer cells to EC50 in human fibroblasts. SI values were log10-transformed prior to statistical analysis. A one-sample Student’s t-test was performed for each compound and cancer cell line to determine whether the mean log10 (SI) differed significantly from zero (corresponding to SI = 1). No correction for multiple comparisons was applied, as each compound was evaluated as a separate research objective. A p-value < 0.05 was considered statistically significant.
3. Results and Discussion
3.1. Determination of Total Phenolic and Flavonoid Content
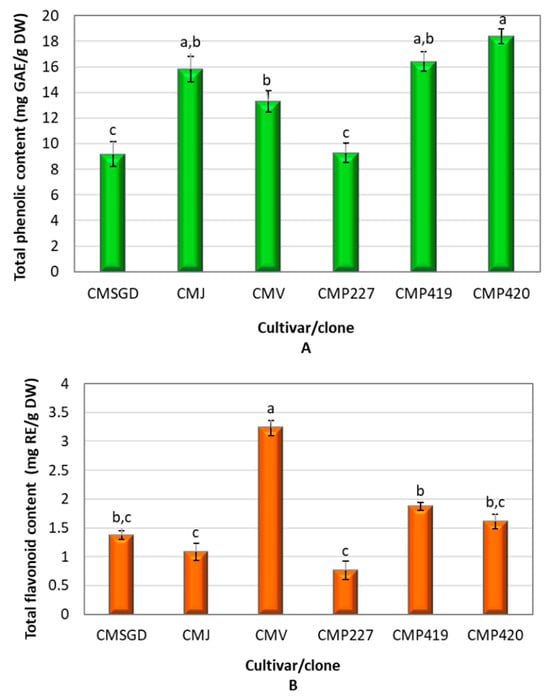
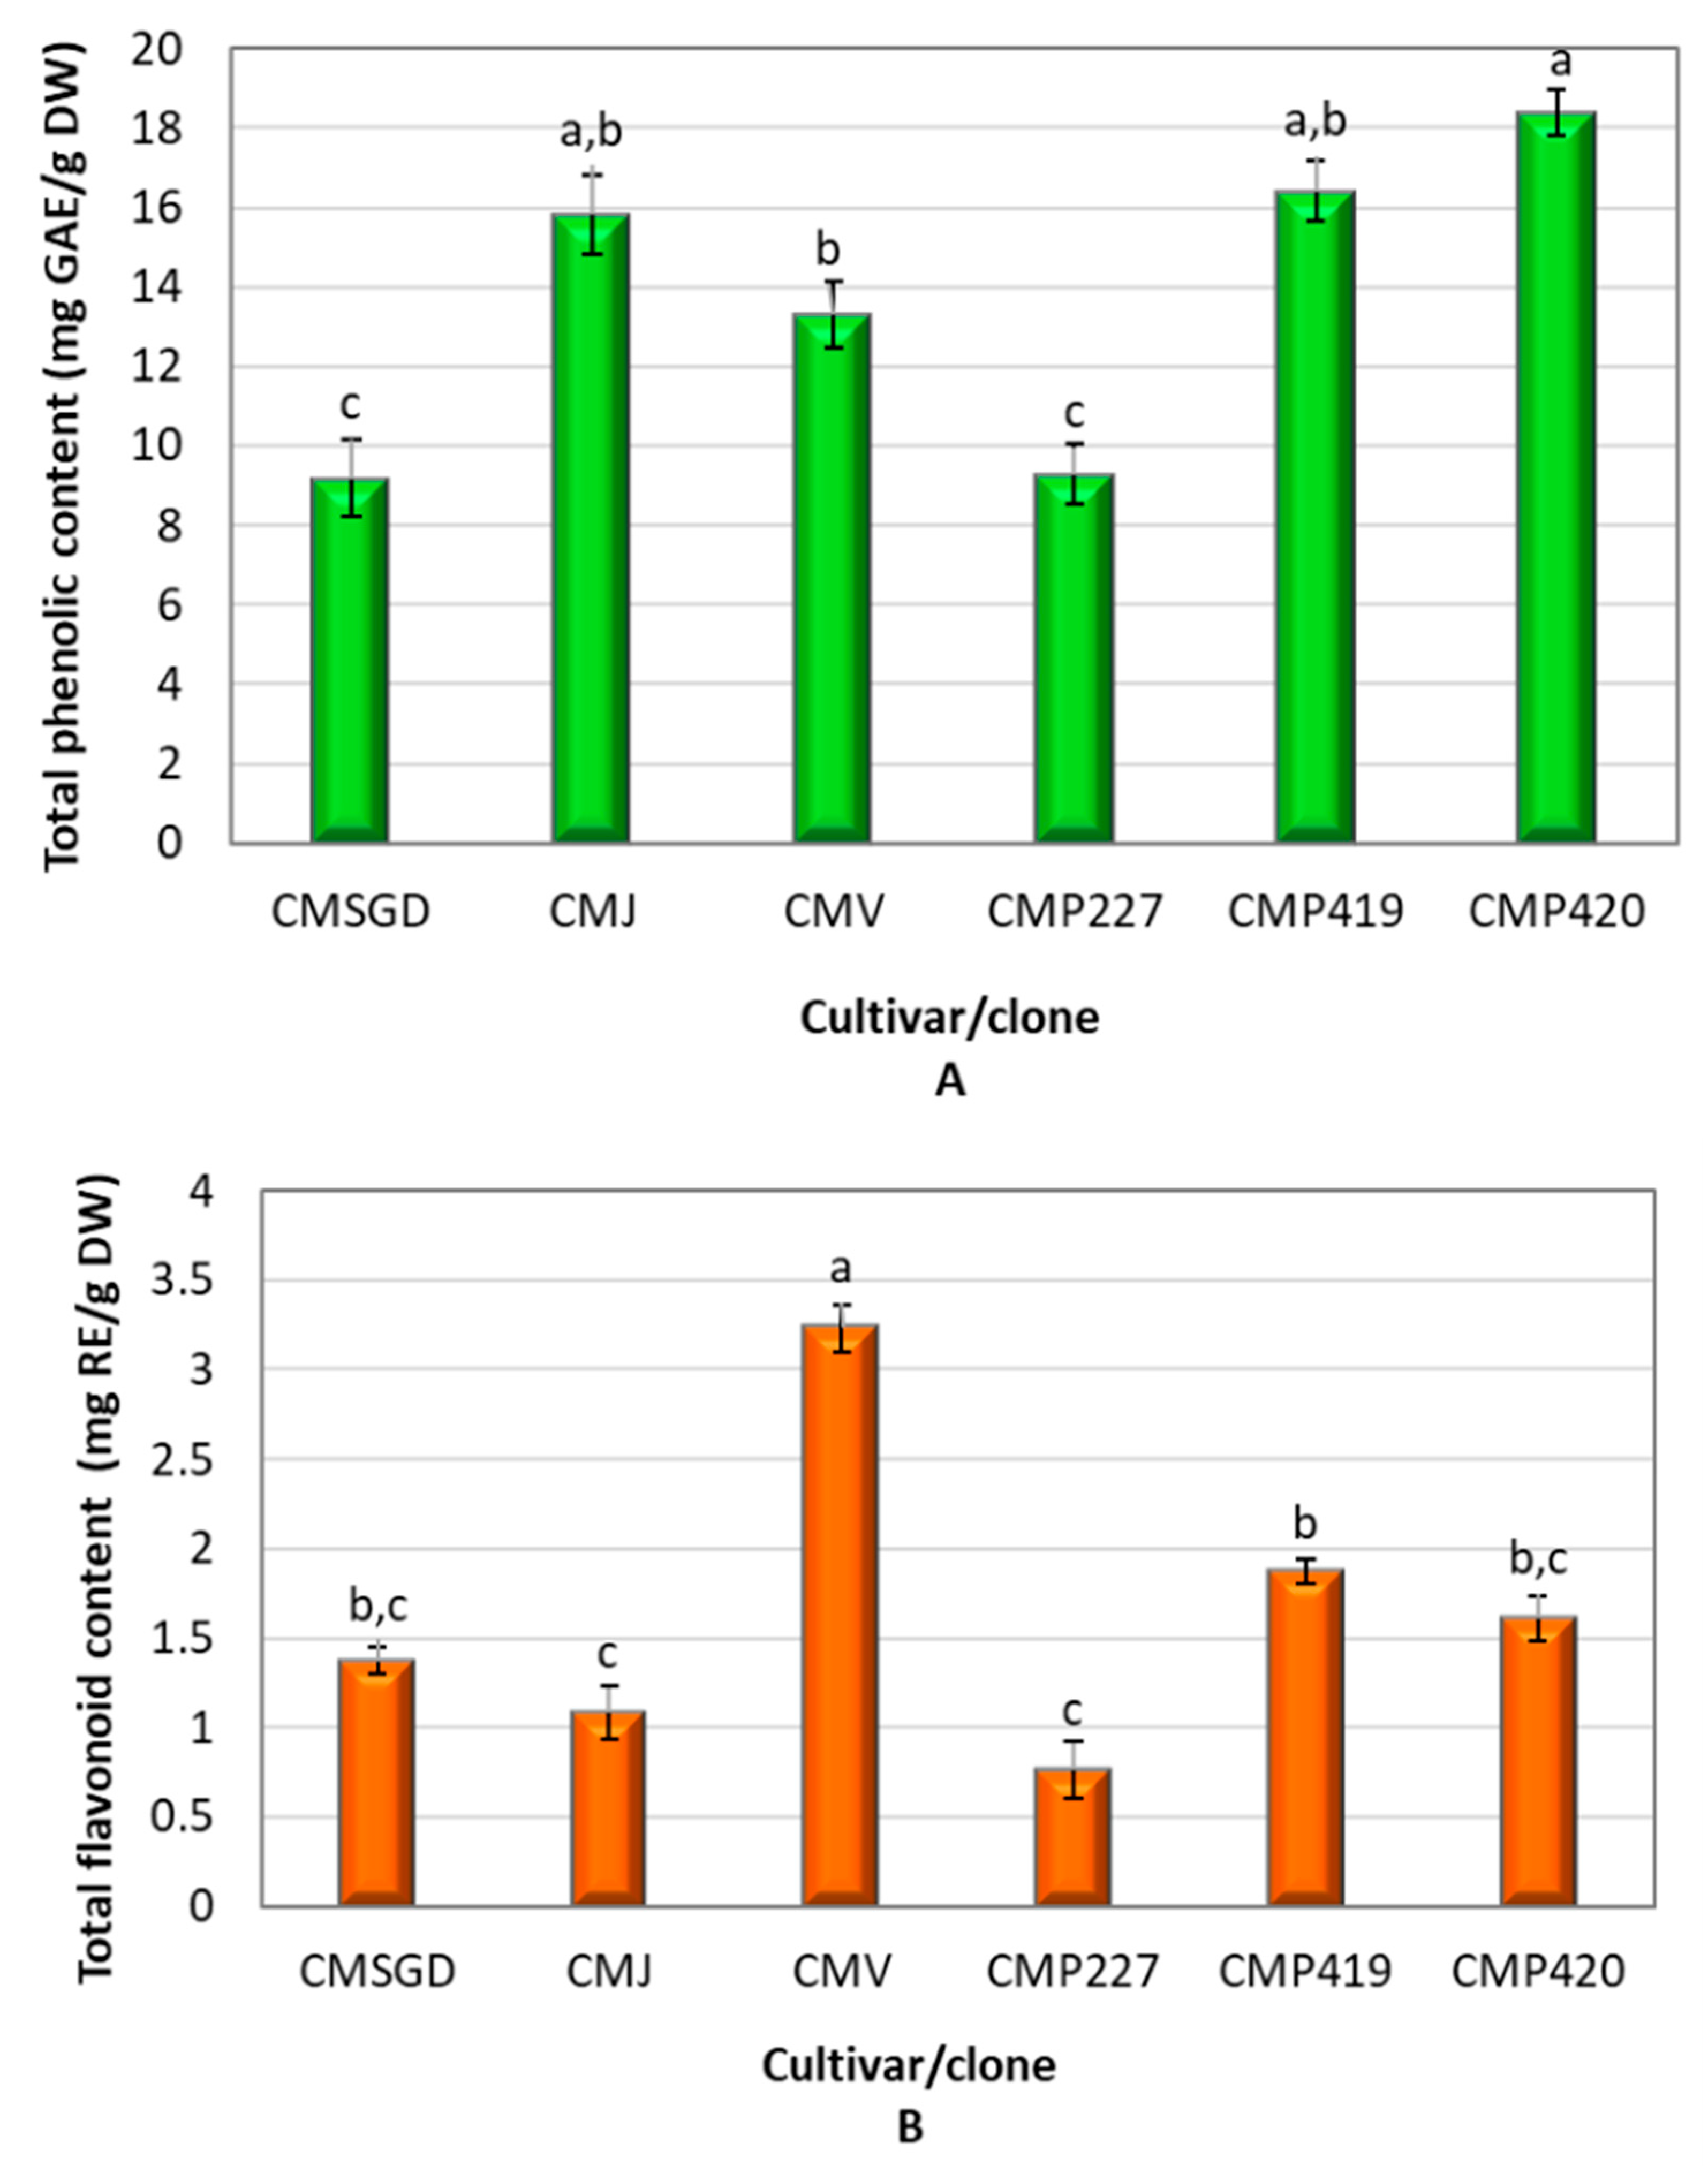
The total phenolic content (TPC) in C. mas fruit cultivars and clones is shown in Figure 2A. The average TPC of the analyzed fruit samples was 13.73 mg GAE/g DW. The highest TPC values were observed in fruits of wild clone P420 (18.38 ± 0.55 mg GAE/g DW) and P419 (16.41 ± 0.75 mg GAE/g DW), as well as in the cultivar ‘Jolico’ (15.83 ± 1.00 mg GAE/g DW). The lowest TPC was found in the fruits of wild clone P227 (9.28 ± 0.75 mg GAE/g DW) (p < 0.05). The coefficient of variation was 5.92%.
Figure 2.
Total phenolic (mg GAE/g DW) (A) and flavonoid (mg RE/g DW) (B) contents in fruit samples of C. mas. CMSGD—‘Schonbrunner Gourmet-Dirndl’; CMJ—‘Jolico’; CMV—‘Variegata’; CMP227—wild clone P227; CMP419—wild clone P419; CMP420—wild clone P420. GAE, gallic acid equivalents; RE, rutin equivalents; DW, dry weight. Difference letters between cultivars and clones were considered statistically significant using one-way ANOVA and Tukey’s HSD test (p < 0.05).
Previous studies have demonstrated substantial variation in the total phenolic content of C. mas fruits. Cosmulescu et al. reported TPC values ranging from 187.61 to 411.78 mg GAE/100 g among Romanian cornelian cherry genotypes, while Skender et al. reported considerably higher values, ranging from 1421.20 to 7974.79 mg GAE/100 g in genotypes from Bosnia and Herzegovina. Kucharska et al. also observed significant differences among Polish cultivars, with TPC values ranging from 262 to 464 mg GAE/100 g [5,41,42]. The variability observed among these studies, as well as among the cultivars and clones investigated in the present study, may be related, at least in part, to differences in genetic background, which may influence the accumulation of phenolic compounds. In the present study, the higher TPC observed in clones P420 and P419 compared with P227 may therefore reflect differences in their genetic background.
However, direct comparison of TPC values among studies should be made with caution because methodological differences can substantially influence the measured values. The studies cited above differ in extraction procedures, solvent composition, extraction time, analytical conditions, and the expression of results. In particular, the present study used lyophilized fruit material extracted with 70% ethanol, and the results were expressed on a dry-weight basis, whereas some previous studies reported values on a fresh-weight basis. In addition, the Folin–Ciocalteu assay is not specific exclusively to phenolic compounds, and differences in extraction efficiency and the composition of co-extracted substances may affect the measured TPC. Therefore, the differences between the present results and previously reported values should not be interpreted solely as differences in the intrinsic phenolic richness of the investigated C. mas cultivars and clones.
Figure 2B shows the variation in total flavonoid content (TFC) in C. mas fruits. The average TFC in fruit samples was 1.65 mg RE/g DW. The highest TFC values were observed in fruits of the cultivar ‘Variegata’ (3.22 ± 0.13 mg RE/g DW), which differed significantly from those of the cultivars ‘Schonbrunner Gourmet-Dirndl’, ‘Jolico’, and the wild clones P227, P419, and P420 (p < 0.05). The lowest TFC amount found in fruits of clone P227 (0.76 ± 0.15 mg RE/g DW). The coefficient of variation was 7.24%. Previous studies have also reported considerable variation in the flavonoid content of C. mas fruits. Hassanpour et al. reported differences in fruit characteristics among Iranian C. mas genotypes [21], while Cosmulescu et al. observed variation in total flavonoid content among Romanian genotypes [41]. The relatively high TFC observed in the cultivar ‘Variegata’ in the present study, together with the markedly lower value in clone P227, suggests that genetic background may contribute to differences in flavonoid accumulation. Such differences may reflect variation in the capacity of individual cultivars and clones to accumulate flavonoid compounds. Interestingly, the pattern of TFC variation was not identical to that observed for TPC, indicating that differences in total phenolic content cannot be explained solely by changes in flavonoid accumulation.
3.2. Qualitative and Quantitative Analysis of Phenolic Compounds
Phenolic compounds in fruit extracts from different C. mas cultivars and clones were identified and quantified using UHPLC-ESI-MS/MS analysis. As presented in Table 3, a total of fourteen phenolic compounds were identified, including four phenolic acids, eight flavonols, one flavone, and one flavanone. The identified phenolic acids included chlorogenic acid, p-coumaric acid, ferulic acid, and protocatechuic acid, with chlorogenic acid being the predominant compound. The highest concentration of chlorogenic acid (244.02 ± 9.13 µg/g) was determined in fruits of the C. mas clone P227, while the lowest level (26.79 ± 3.15 µg/g) was found in the cultivar ‘Schonbrunner Gourmet-Dirndl’. Overall, chlorogenic acid accounted for approximately 45.91% of the total quantified phenolic acids in the fruit samples. The coefficient of variation for this compound was low, at 2.63%. Protocatechuic acid accounted for approximately 12.88% of the total quantified polyphenols in the C. mas fruit samples, with a coefficient variation of 5.10%. The contents of p-coumaric acid and ferulic acid were the lowest among the phenolic acids detected in the C. mas fruit samples. Together, these two acids accounted for only about 2.92% of the total individual polyphenols in the samples. According to various studies, thirteen phenolic acids have been identified in the fruits of C. mas [1]. Our results are consistent with those reported by Lidiková et al., who identified chlorogenic acid as one of the major phenolic acids in C. mas fruits and documented significant variation among cultivars. However, the chlorogenic acid concentrations reported in their study (6.65–36.60 µg/g) were more than five times lower than those determined in the present study [43]. Scientific studies have confirmed that the quantitative and qualitative composition of phenolic acids depends not only on plant cultivar but also on the origin of the plant. Pomianek et al. analyzed the phytochemical composition of fruits from three Ukrainian-origin C. mas cultivars (‘Jantarnyj’, ‘Korralowyj Marka’, and ‘Władimirskij’) and reported loganic acid as the predominant bioactive compound in the fruit extracts. In comparison, chlorogenic acid was present at substantially lower concentrations, highlighting differences in the phytochemical profiles reported for C. mas fruits [44]. These differences may be attributed to variations in genotype, environmental and growing conditions, fruit maturity time, as well as differences in extraction procedures and analytical methodologies [45,46,47,48]. In the present study, the substantial variation in chlorogenic acid content among the investigated cultivars and clones may partly reflect genotype-related differences. In addition, differences in extraction and analytical procedures between studies may affect the recovery and quantification of individual phenolic compounds. The predominance of particular compounds may therefore vary considerably among C. mas cultivars, reflecting differences in their metabolic profiles.
Table 3.
Phenolic compound concentrations (µg/g DW) in the fruits of different C. mas cultivars and clones.
Seven flavonols (rutin, hyperoside, isoquercitrin, quercetin, isorhamnetin-3-O-rutinoside, kaempferol-3-O-glucoside, isorhamnetin-3-O-glucoside)and one dihydrochalcone (phloridzin) were identified in the C. mas fruit samples. Among the fruit samples from different cultivars and clones, rutin was identified as the predominant compound. It constituted approximately 13.23 % of the total quantified phenolic compounds in the fruit samples. On average, the amount of rutin in the fruit samples was 25.60 µg/g, with a coefficient of variation of 7.49%. The highest amount of rutin was determined in clone P420 (46.16 ± 3.64 µg/g). This value differed significantly from those of cultivars ‘Schonbrunner Gourmet-Dirndl’, ‘Jolico’, ‘Variegata’, and clones P227 and P419 (p < 0.05). The lowest amounts of the identified flavonol group compounds were found to be isorhamnetin-3-O-glucoside and isorhamnetin-3-O-rutinoside, 0.72 µg/g and 0.91 µg/g, respectively.
Various flavonols have been reported in C. mas fruits, with quercetin and its derivatives, kaempferol glycosides, myricetin, myricetin 3-O-galactoside, and aromadendrin being the most abundant [8,10,14,15,18,41]. These compounds are recognized for their strong antioxidant activity and potential health-promoting effects [1].
Luteolin-7-O-glucoside was the only compound identified within the flavone group. It accounted for approximately 3.52 % of the total quantified phenolic compounds in the fruit samples. The coefficient of variation for luteolin-7-O-glucoside was 9.79 %. On average, the luteolin-7-O-glucoside content in the fruit samples was 8.18 µg/g. The highest amount of luteolin-7-O-glucoside was determined in C. mas clone P227 (25.06 ± 2.65 µg/g), while the lowest amount was found in ‘Variegata’ fruit samples (3.35 ± 1.01 µg/g).
Naringenin was the sole compound identified within the flavanone class. On average, the naringenin content in the fruit samples was 1.42 µg/g. The highest amount of naringenin was determined in C. mas cultivar ‘Schonbrunner Gourmet-Dirndl’ (5.52 ± 0.85 µg/g), whereas the lowest level was observed in clone P420 fruit samples (0.48 ± 0.06 µg/g). The coefficient of variation for naringenin was very high, at 17.58%.
3.3. Evaluation of the Antioxidant Activity of C. mas Fruits
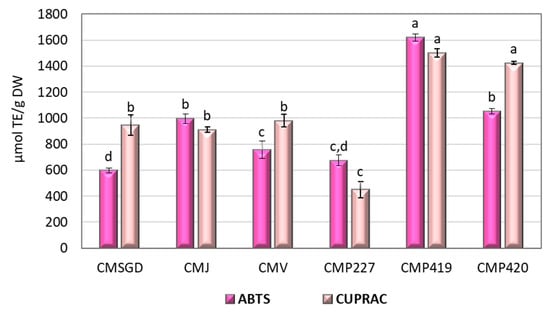
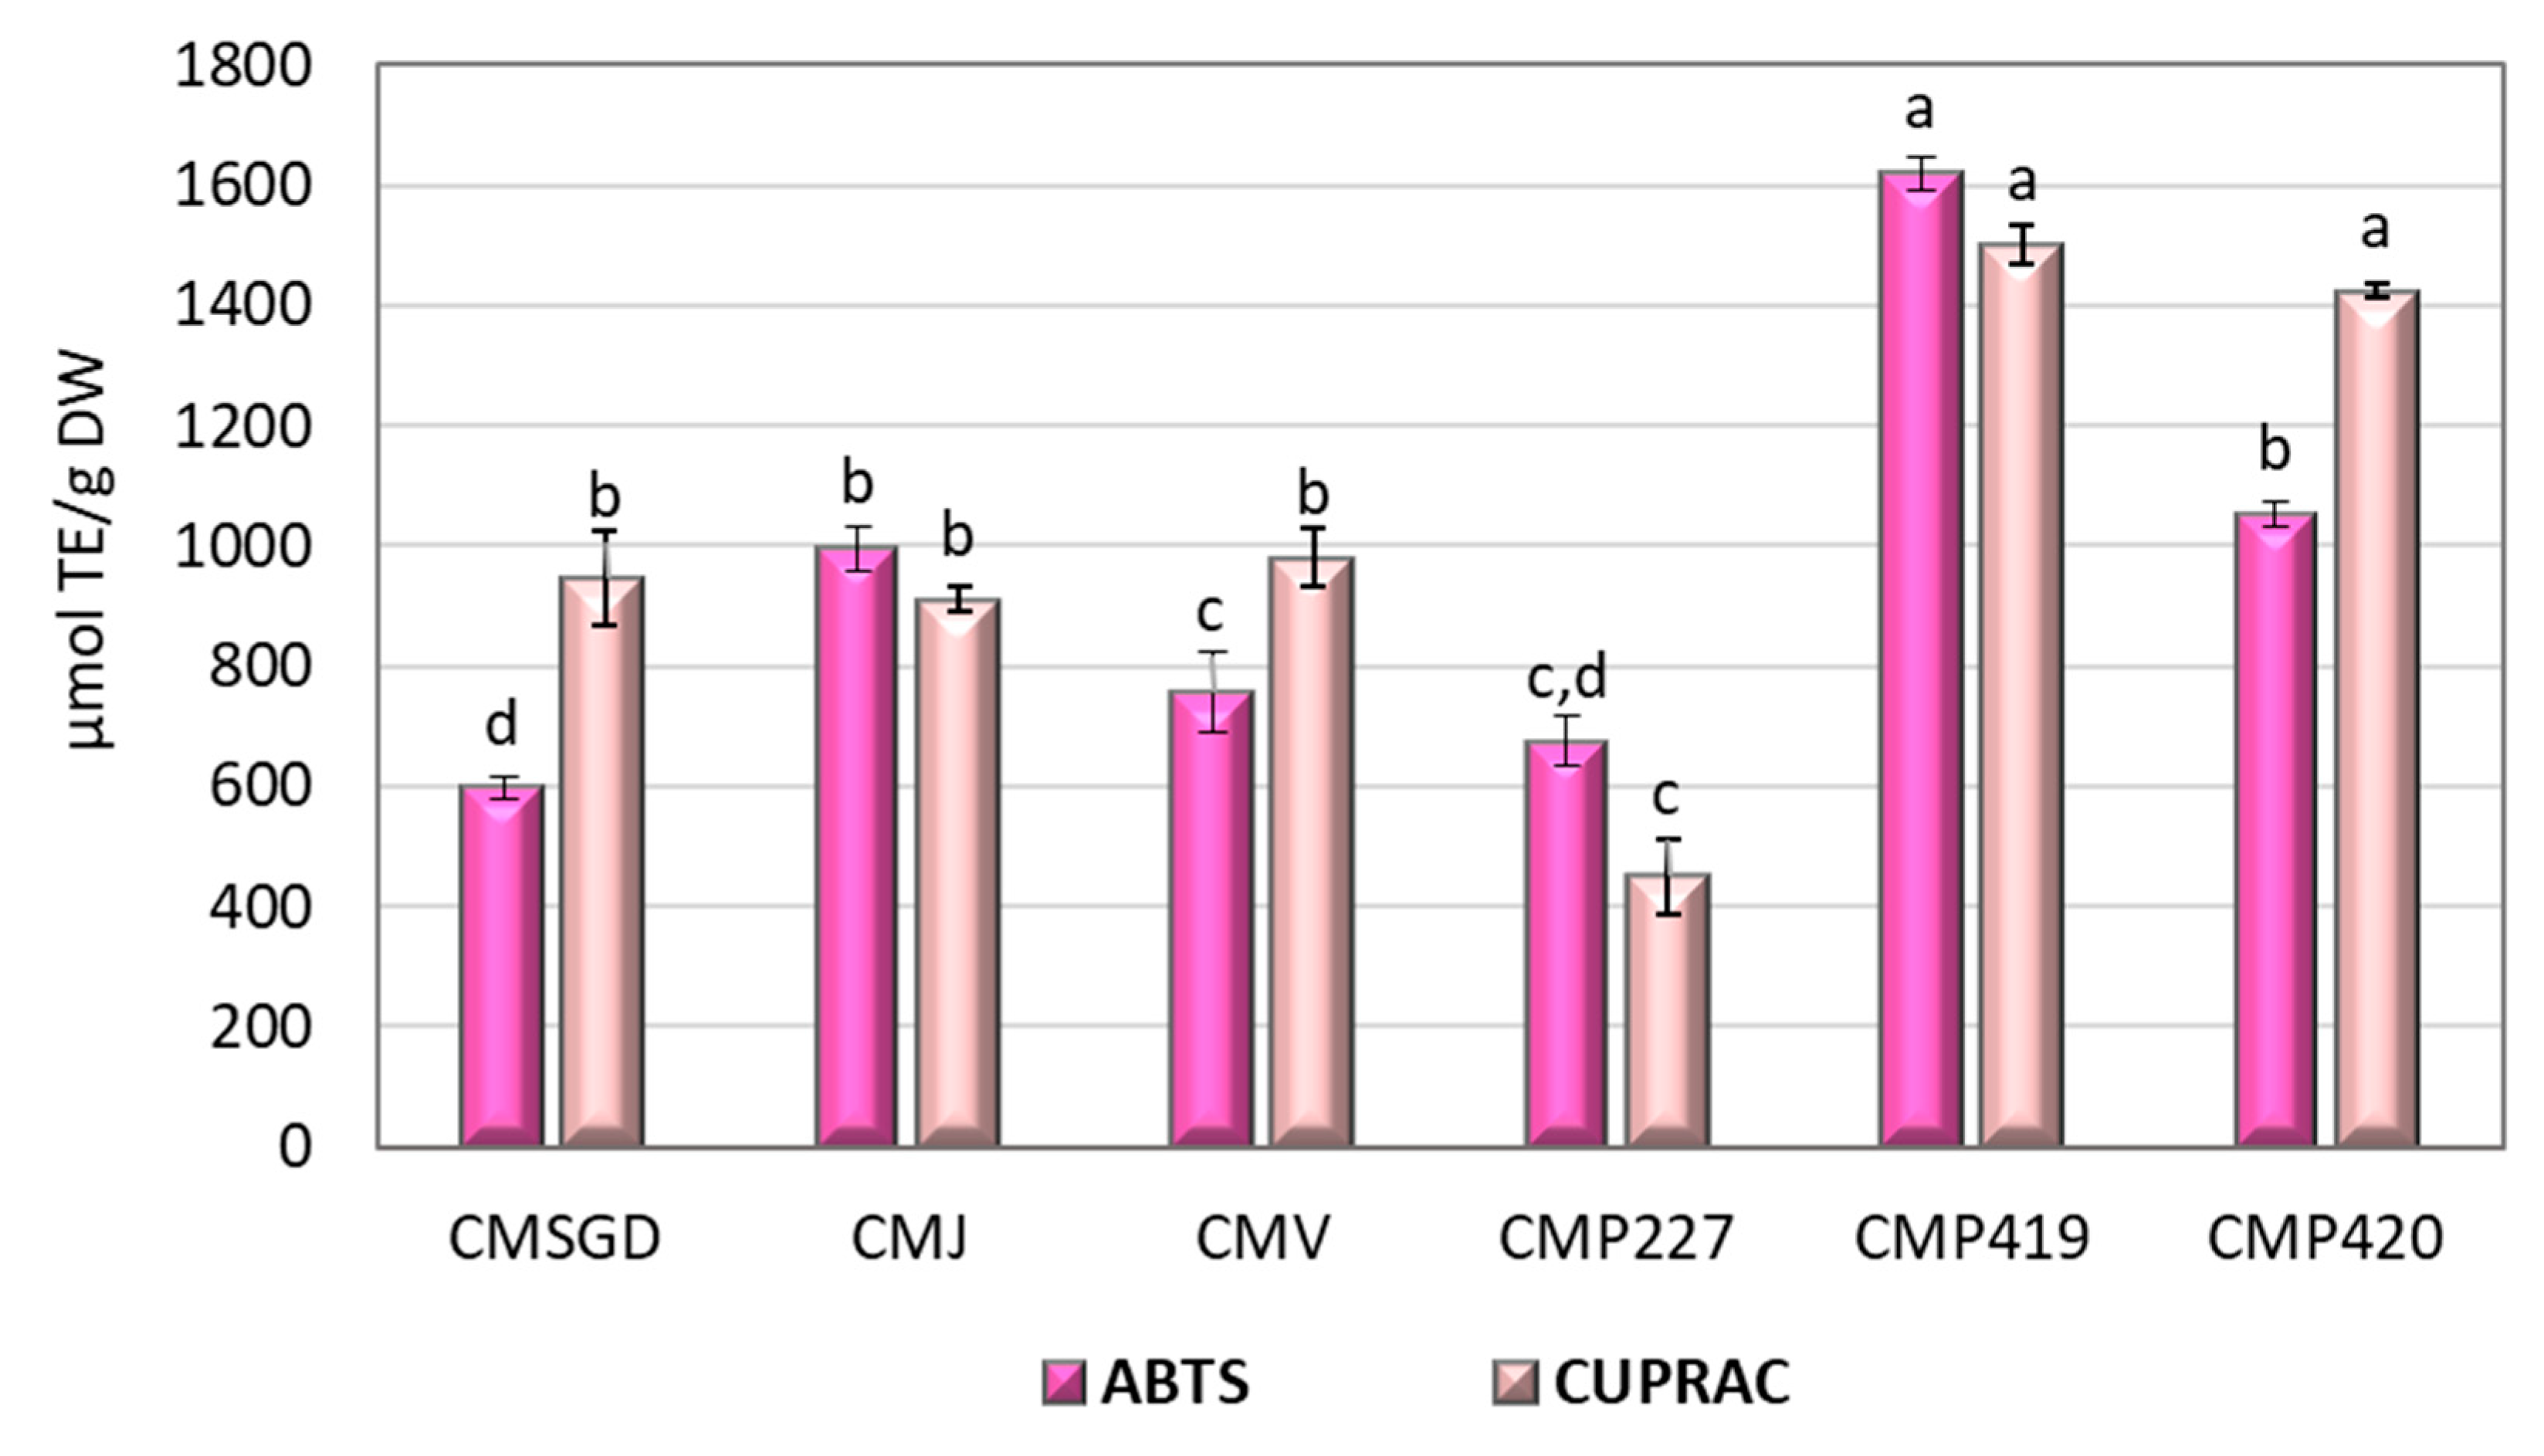
The antioxidant activity of C. mas fruits was determined using two assays: ABTS and CUPRAC. The results are presented in Figure 3. The average ABTS assay result for C. mas fruit extracts collected from different cultivars and clones was 949.82 µmol TE/g. Fruit samples of clone P419 exhibited the highest antioxidant activity in both assays, with ABTS and CUPRAC values of 1620.51 ± 27.25 µmol TE/g and 1501.21 ± 32.47 µmol TE/g, respectively. The lowest radical scavenging activity was observed in fruit samples of cultivar ‘Schonbrunner Gourmet-Dirndl’ (597.54 ± 19.71 µmol TE/g). The coefficient of variation in the scavenging activity of C. mas fruit samples from different cultivars and clones was 3.73%.
Figure 3.
Variation in in vitro antioxidant activity (µmol TE/g) of C. mas cultivars and clones. CMSGD—‘Schonbrunner Gourmet-Dirndl’; CMJ—‘Jolico’; CMV—‘Variegata’; CMP227—wild clone P227; CMP419—wild clone P419; CMP420—wild clone P420. Difference letters between cultivars and clones were considered statistically significant using one-way ANOVA and Tukey’s HSD test (p < 0.05).
The average CUPRAC assay result for C. mas fruit extracts from different cultivars and clones was 1035.61 µmol TE/g. Fruit samples from clones P419 (1501.21 ± 32.47 µmol TE/g) and P420 (1239.53 ± 13.56 µmol TE/g) exhibited the highest reducing activity and differed significantly from those of the cultivars ‘Schonbrunner Gourmet-Dirndl’ (945.75 ± 80.12 µmol TE/g), ‘Jolico’ (911.13 ± 20.74 µmol TE/g), ‘Variegata’ (980.66 ± 49.26 µmol TE/g), and clone P227 (450.37 ± 22.51 µmol TE/g) (p < 0.05). The lowest reducing activity was observed in the fruit samples of clone P227 (450.37 ± 22.51 µmol TE/g). The coefficient of variation in the reducing activity of C. mas fruit samples collected from different habitats was 4.16%.
Previous studies have demonstrated that C. mas fruits possess strong antioxidant activity, mainly due to their high content of phenolic compounds and other bioactive constituents. Pomianek et al. demonstrated that cornelian cherry extracts may serve as promising antioxidant and cytoprotective agents [44]. In our study, C. mas fruits exhibited significant antioxidant activity in vitro, as evidenced by the results of the ABTS and CUPRAC assays, correlating strongly with the identified phenolic compounds. Previous studies have demonstrated that C. mas fruits and their juice possess stronger antioxidant activity than many commonly consumed fruit products. This high antioxidant potential has been attributed to their rich composition of phenolic compounds, vitamins, and other biologically active constituents [6,49]. Klymenko et al. reported variation in the antioxidant activity of C. mas cultivars, with DPPH, ABTS, and FRAP values ranging from 5.94 to 16.56, 13.56 to 33.96, and 8.45 to 22.49 µmol TE/g, respectively [50]. Similar genotype-dependent differences were observed in the present study. However, variations in antioxidant activity may be influenced not only by genotype but also by the assay employed, as different methods are based on distinct reaction mechanisms.
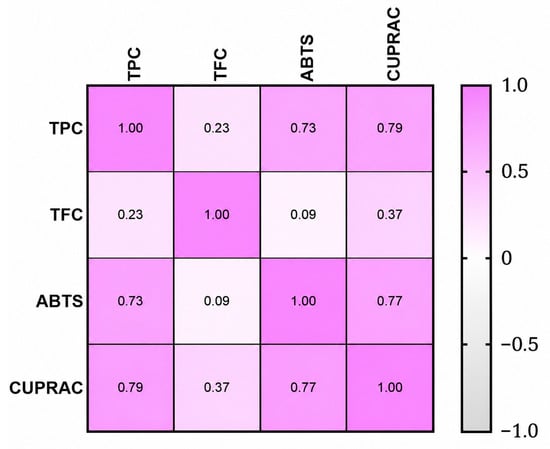
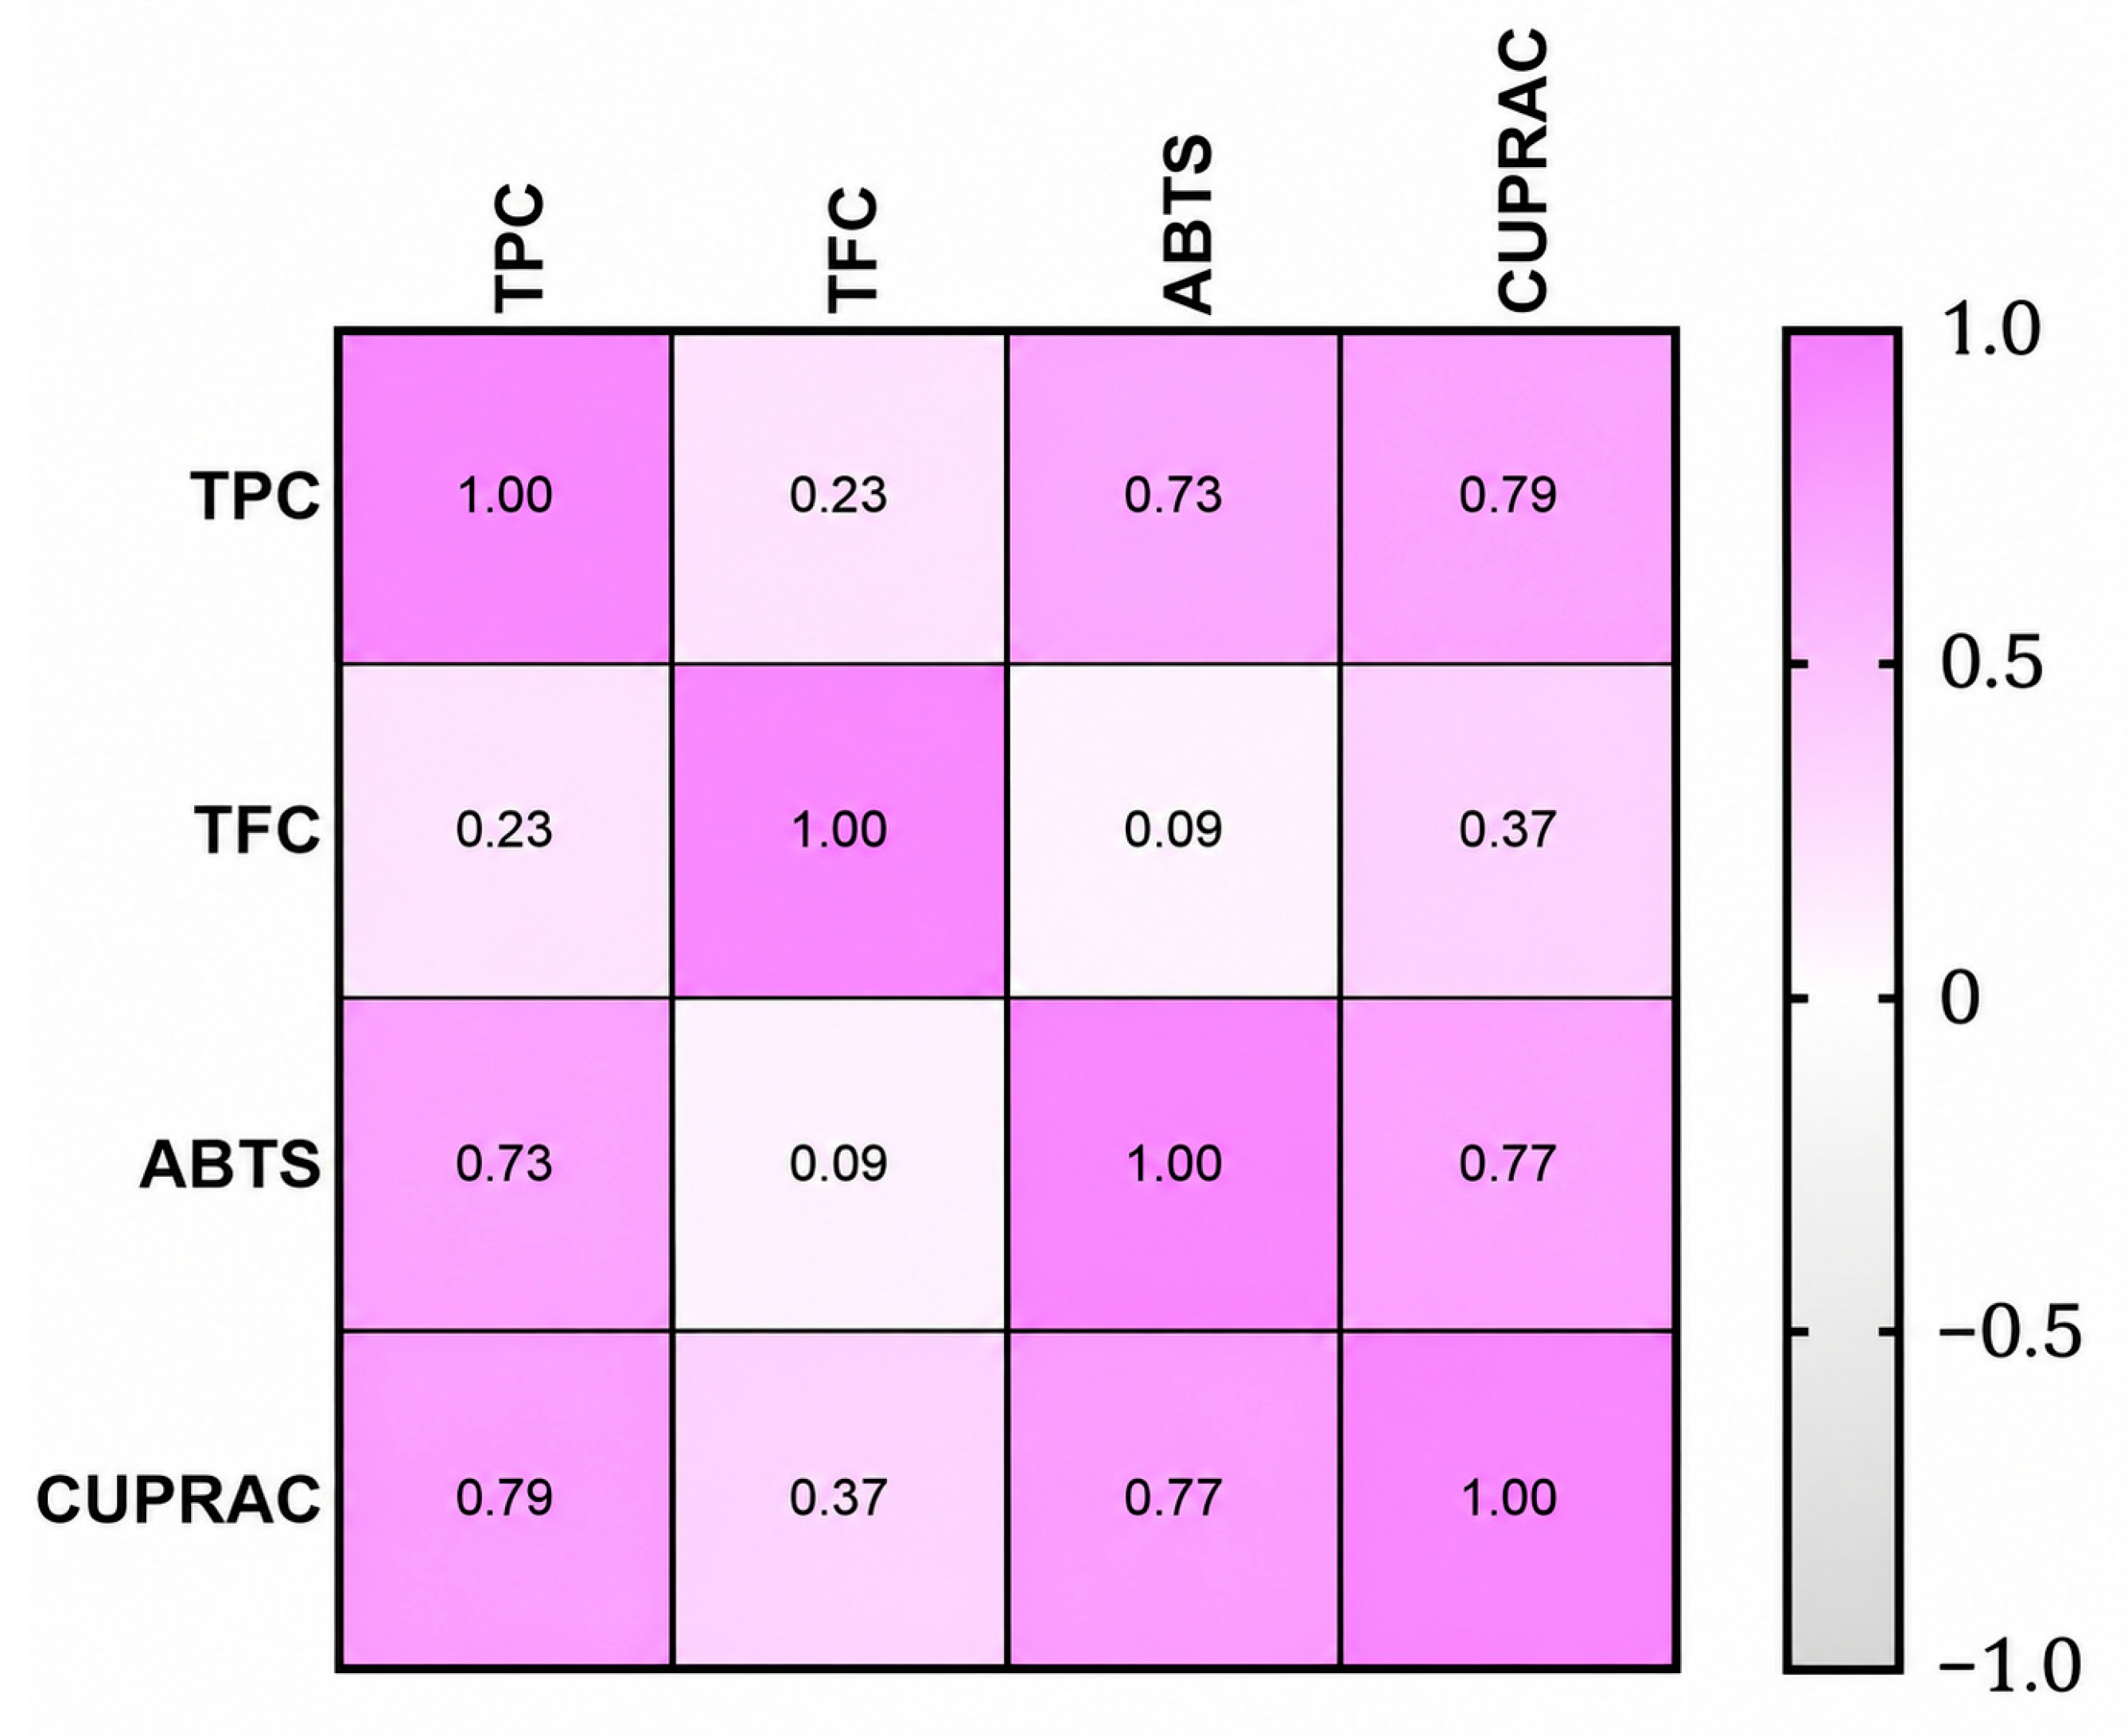
The relationships between in vitro antioxidant activity and the biochemical composition of different C. mas fruit cultivar and clone extracts were assessed using Pearson’s correlation analysis (Figure 4). The results indicated predominantly positive correlations among the parameters investigated, with notable variation in their strength.
Figure 4.
Pearson correlation coefficients between the tested bioactivities and in vitro antioxidant activity of C. mas fruit extracts, calculated from average values (p < 0.05). Total phenolic content (TPC), total flavonoid content (TFC), ABTS radical cation scavenging assay (ABTS), and cupric ion reducing antioxidant capacity assay (CUPRAC).
Total phenolic content (TPC) showed positive correlations with both ABTS radical scavenging activity (r = 0.73) and CUPRAC reducing capacity (r = 0.79), suggesting that variation in TPC was associated with differences in antioxidant activity among the investigated cultivars and clones. Furthermore, a strong correlation was observed between the ABTS and CUPRAC assays (r = 0.77), suggesting high consistency between these methods in assessing the antioxidant potential of C. mas extracts.
In contrast, total flavonoid content (TFC) exhibited weak to moderate correlations with the other measured parameters. The relationship between TFC and ABTS was negligible (r = 0.09), while correlations with TPC (r = 0.23) and CUPRAC (r = 0.37) were low, indicating a comparatively minor contribution of flavonoids to the overall antioxidant capacity. This may be attributed to differences in flavonoid structure, reactivity, or relative abundance within the phenolic profile of C. mas fruits.
3.4. Principal Component Analysis of Phenolic Composition and Antioxidant Activity
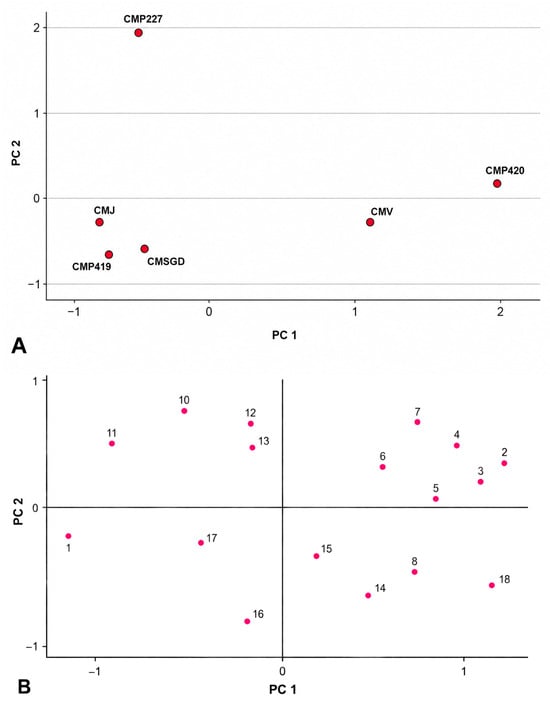
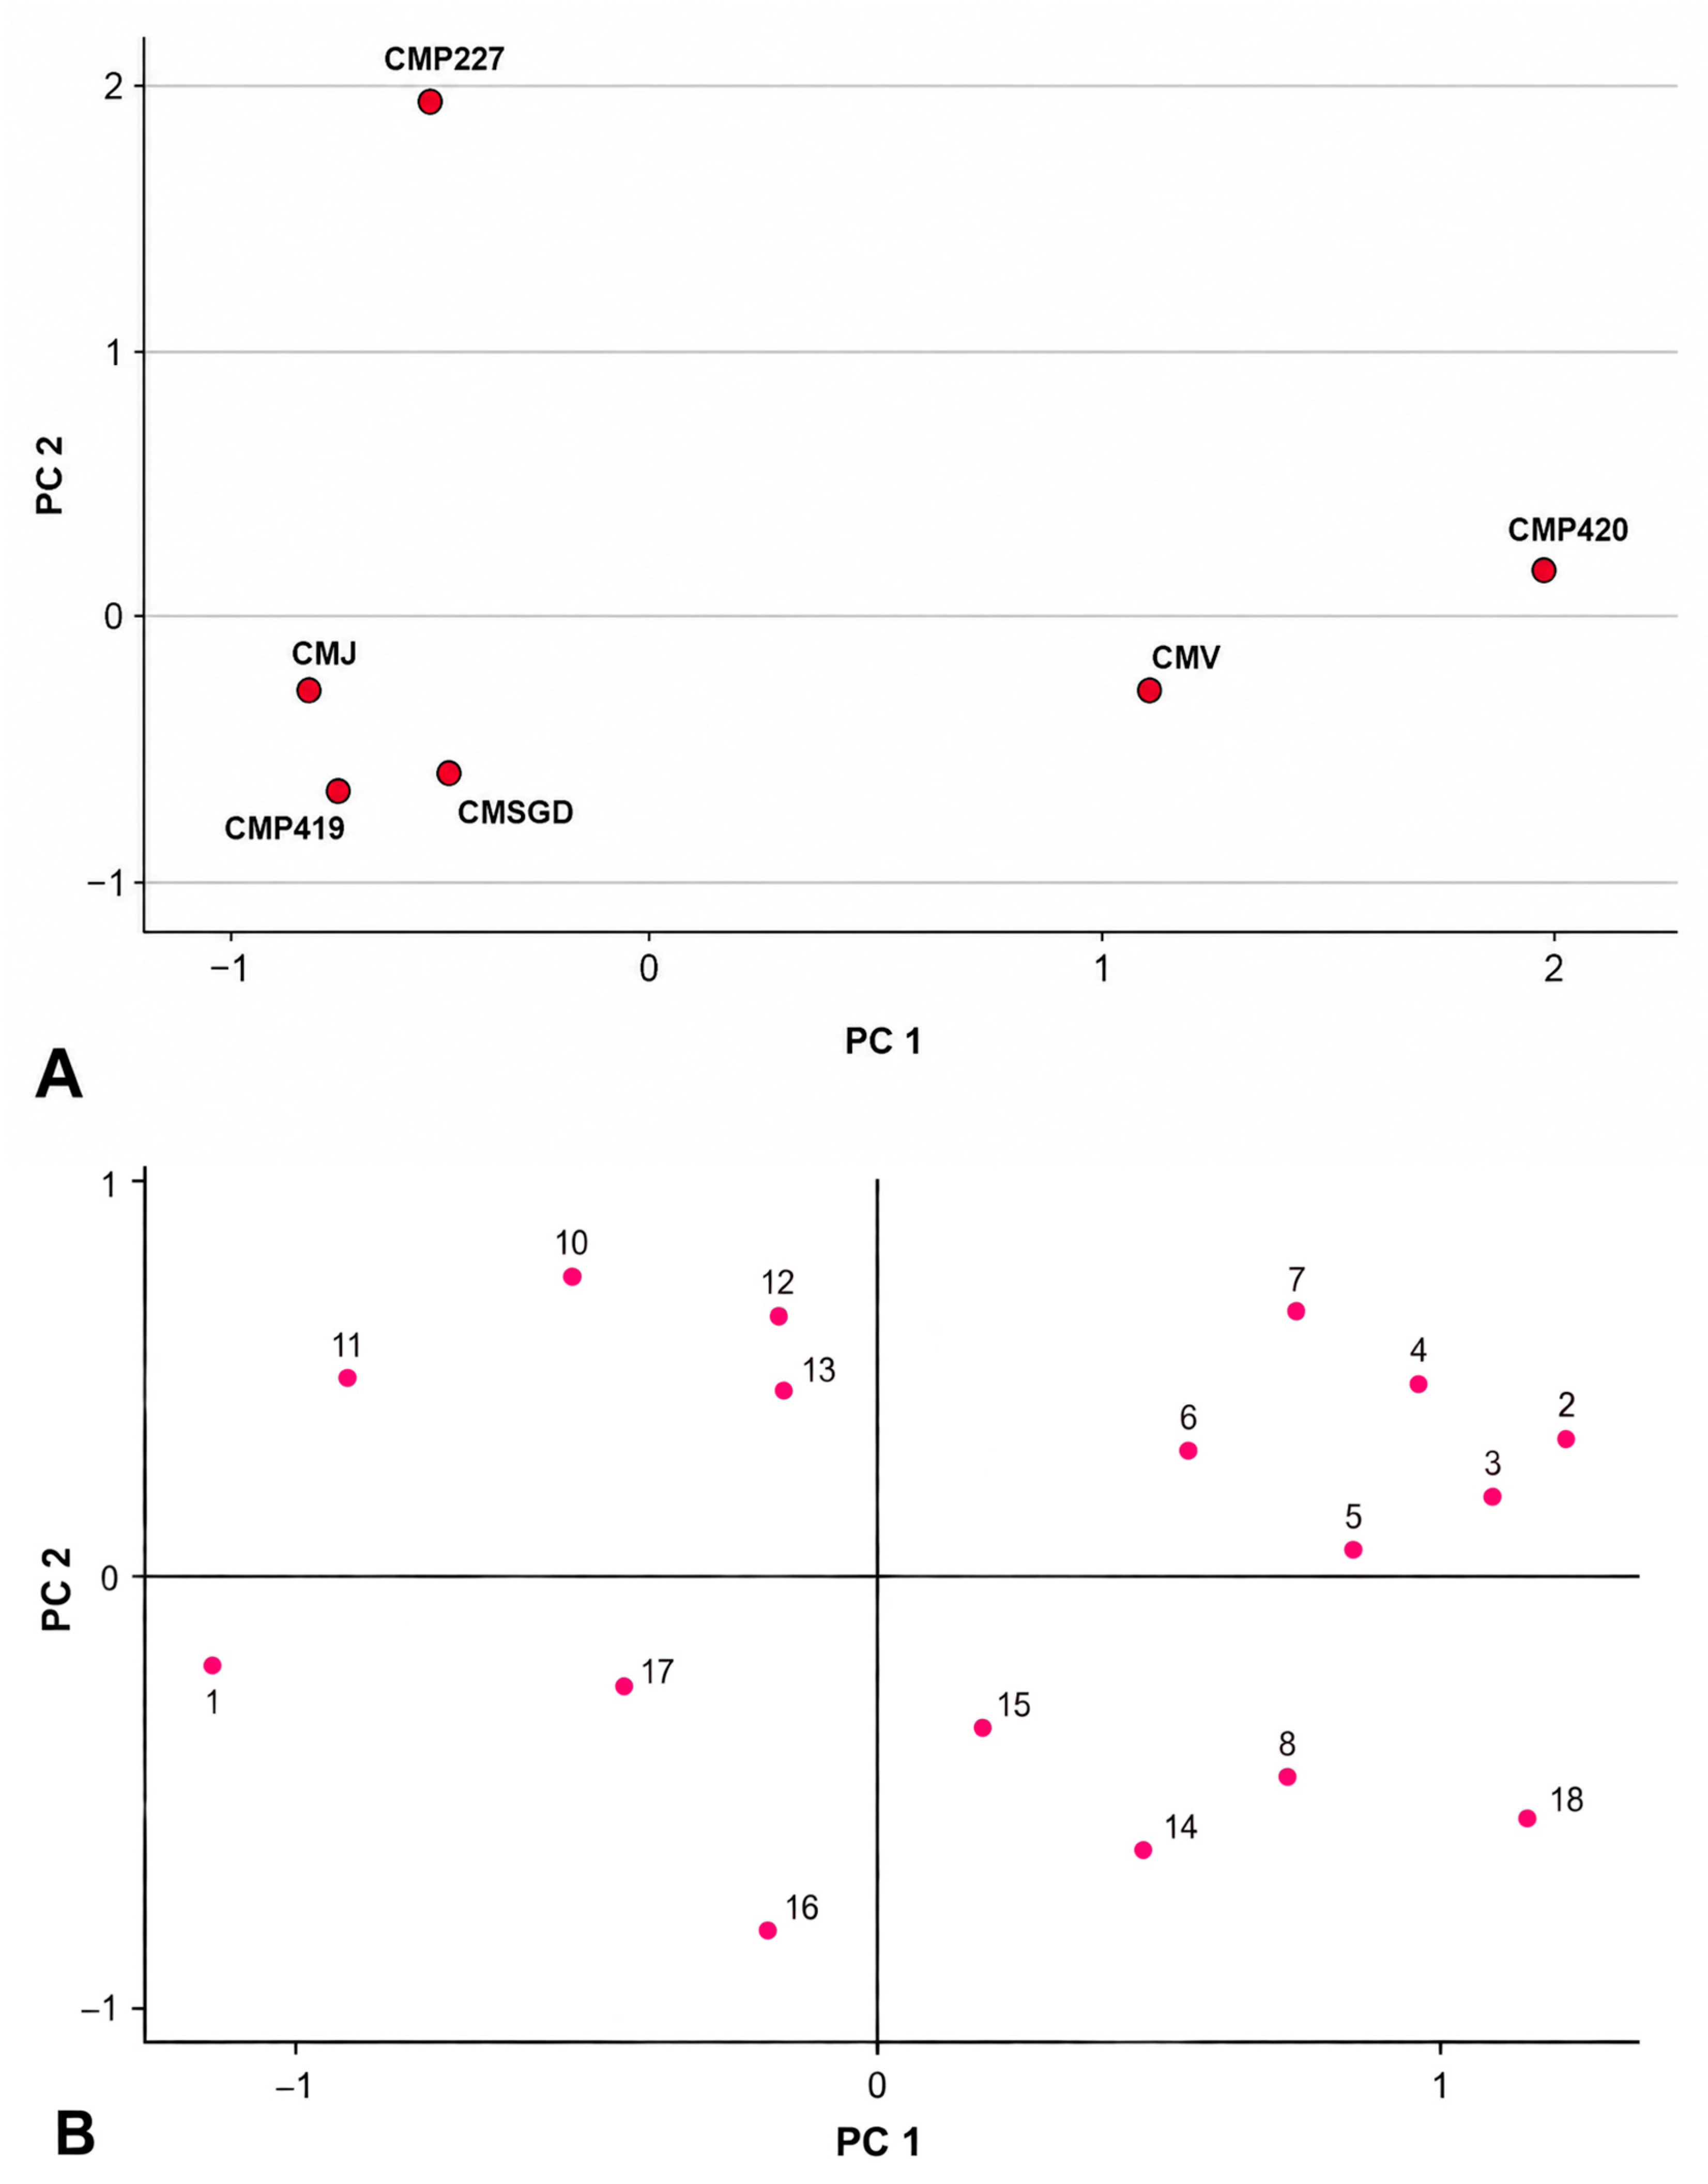
Principal component analysis (PCA) was performed using the identified individual phenolic compounds, together with TPC, TFC, ABTS, and CUPRAC values (Figure 5).
Figure 5.
PCA score plots (A) and loading plots (B) of individual phenolic compounds, total phenolic content (TPC), total flavonoid content (TFC), antiradical activity (ABTS), and reducing activity (CUPRAC) across various Cornus mas cultivars and clones. CMSGD—‘Schonbrunner Gourmet-Dirndl’; CMJ—‘Jolico’; CMV—‘Variegata’; CMP227—wild clone P227; CMP419—wild clone P419; CMP420—wild clone P420. 1—Kaempferol-3-O-glucoside; 2—Isorhamnetin-3-O-glucoside; 3—Rutin; 4—Hyperoside; 5—Quercetin; 6—Ferulic acid; 7—Isoquercitrin; 8—TPC; 9—Protocatechuic acid; 10—Chlorogenic acid; 11—Luteolin-7-O-glucoside; 12—Phloridzin; 13—Isorhamnetin-3-O-rutinoside; 14—CUPRAC; 15—ABTS; 16—TFC; 17—p-Coumaric acid; 18—Naringenin.
Two principal components, covering 97.78% of the total data variance, were extracted. The first principal component (PC1) explained 69.80% of the total variance. PC1 was positively correlated with isorhamnetin-3-O-glucoside (0.915), rutin (0.896), hyperoside (0.846), quercetin (0.782), ferulic acid (0.779), isoquercitrin (0.766), and TPC (0.726), and negatively with kaempferol-3-O-glucoside (-0.927).
The second principal component (PC2) explained 27.98% of the total variance and was positively correlated with chlorogenic acid (0.936), luteolin-7-O-glucoside (0.864), phloridzin (0.860), and isorhamnetin-3-O-rutinoside (0.812), and negatively with CUPRAC (−0.792), ABTS (−0.648), and TPC (−0.603).
The PCA revealed clear cultivar and clone-dependent differences in phenolic composition. C. mas ‘Variegata’ and clone P420 were positioned on the positive side of PC1 and were associated with rutin, hyperoside, quercetin, isorhamnetin-3-O-glucoside, ferulic acid, isoquercitrin, and TPC. This association was particularly evident for clone P420, which showed the highest TPC and rutin content among the investigated samples, whereas ‘Variegata’ had the highest TFC. In contrast, clone P419 was characterized by high antioxidant activity, showing the highest ABTS and CUPRAC values, despite being positioned separately from P420 along PC1. These findings suggest that differences in antioxidant activity were related not only to total phenolic content but also to the specific composition of individual phenolic compounds. Clone P227 showed the most distinct separation along PC2 and was associated with chlorogenic acid, luteolin, phloridzin, and isorhamnetin-3-O-rutinoside, consistent with its distinct phenolic profile and comparatively low antioxidant activity.
3.5. Effect of Tested Extracts on Cancer Cell Viability
The effect of Cornus-derived extracts on human triple-negative breast cancer (MDA-MB-231), human melanoma (IGR39), and human colon adenocarcinoma (HCT116) cell line viability was established using the MTT assay. The concentration of 2 mg/mL was selected based on previously published studies reporting the biological activity of Cornus mas extracts in cancer cells. In a study by Hosseini et al., C. mas extract was evaluated using the MTT assay in AGS gastric cancer cells at concentrations ranging from 0 to 10 mg/mL. The reported EC50 values were 5.44 mg/mL after 48 h and 2.44 mg/mL after 72 h of treatment, respectively. Thus, the concentration used in our study (2 mg/mL) is close to the previously reported EC50 value after 72 h of treatment [51]. Furthermore, C. mas extracts have previously been evaluated in HT-29 cells using the MTT assay over a concentration range of 0.05–6.4 mg/mL, which also encompasses the concentration used in our study [52].
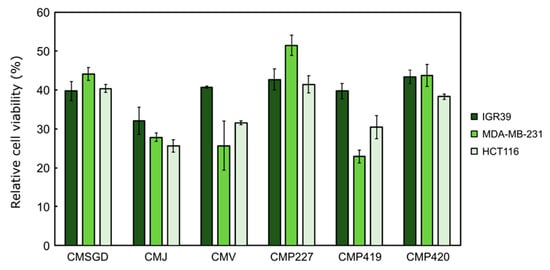
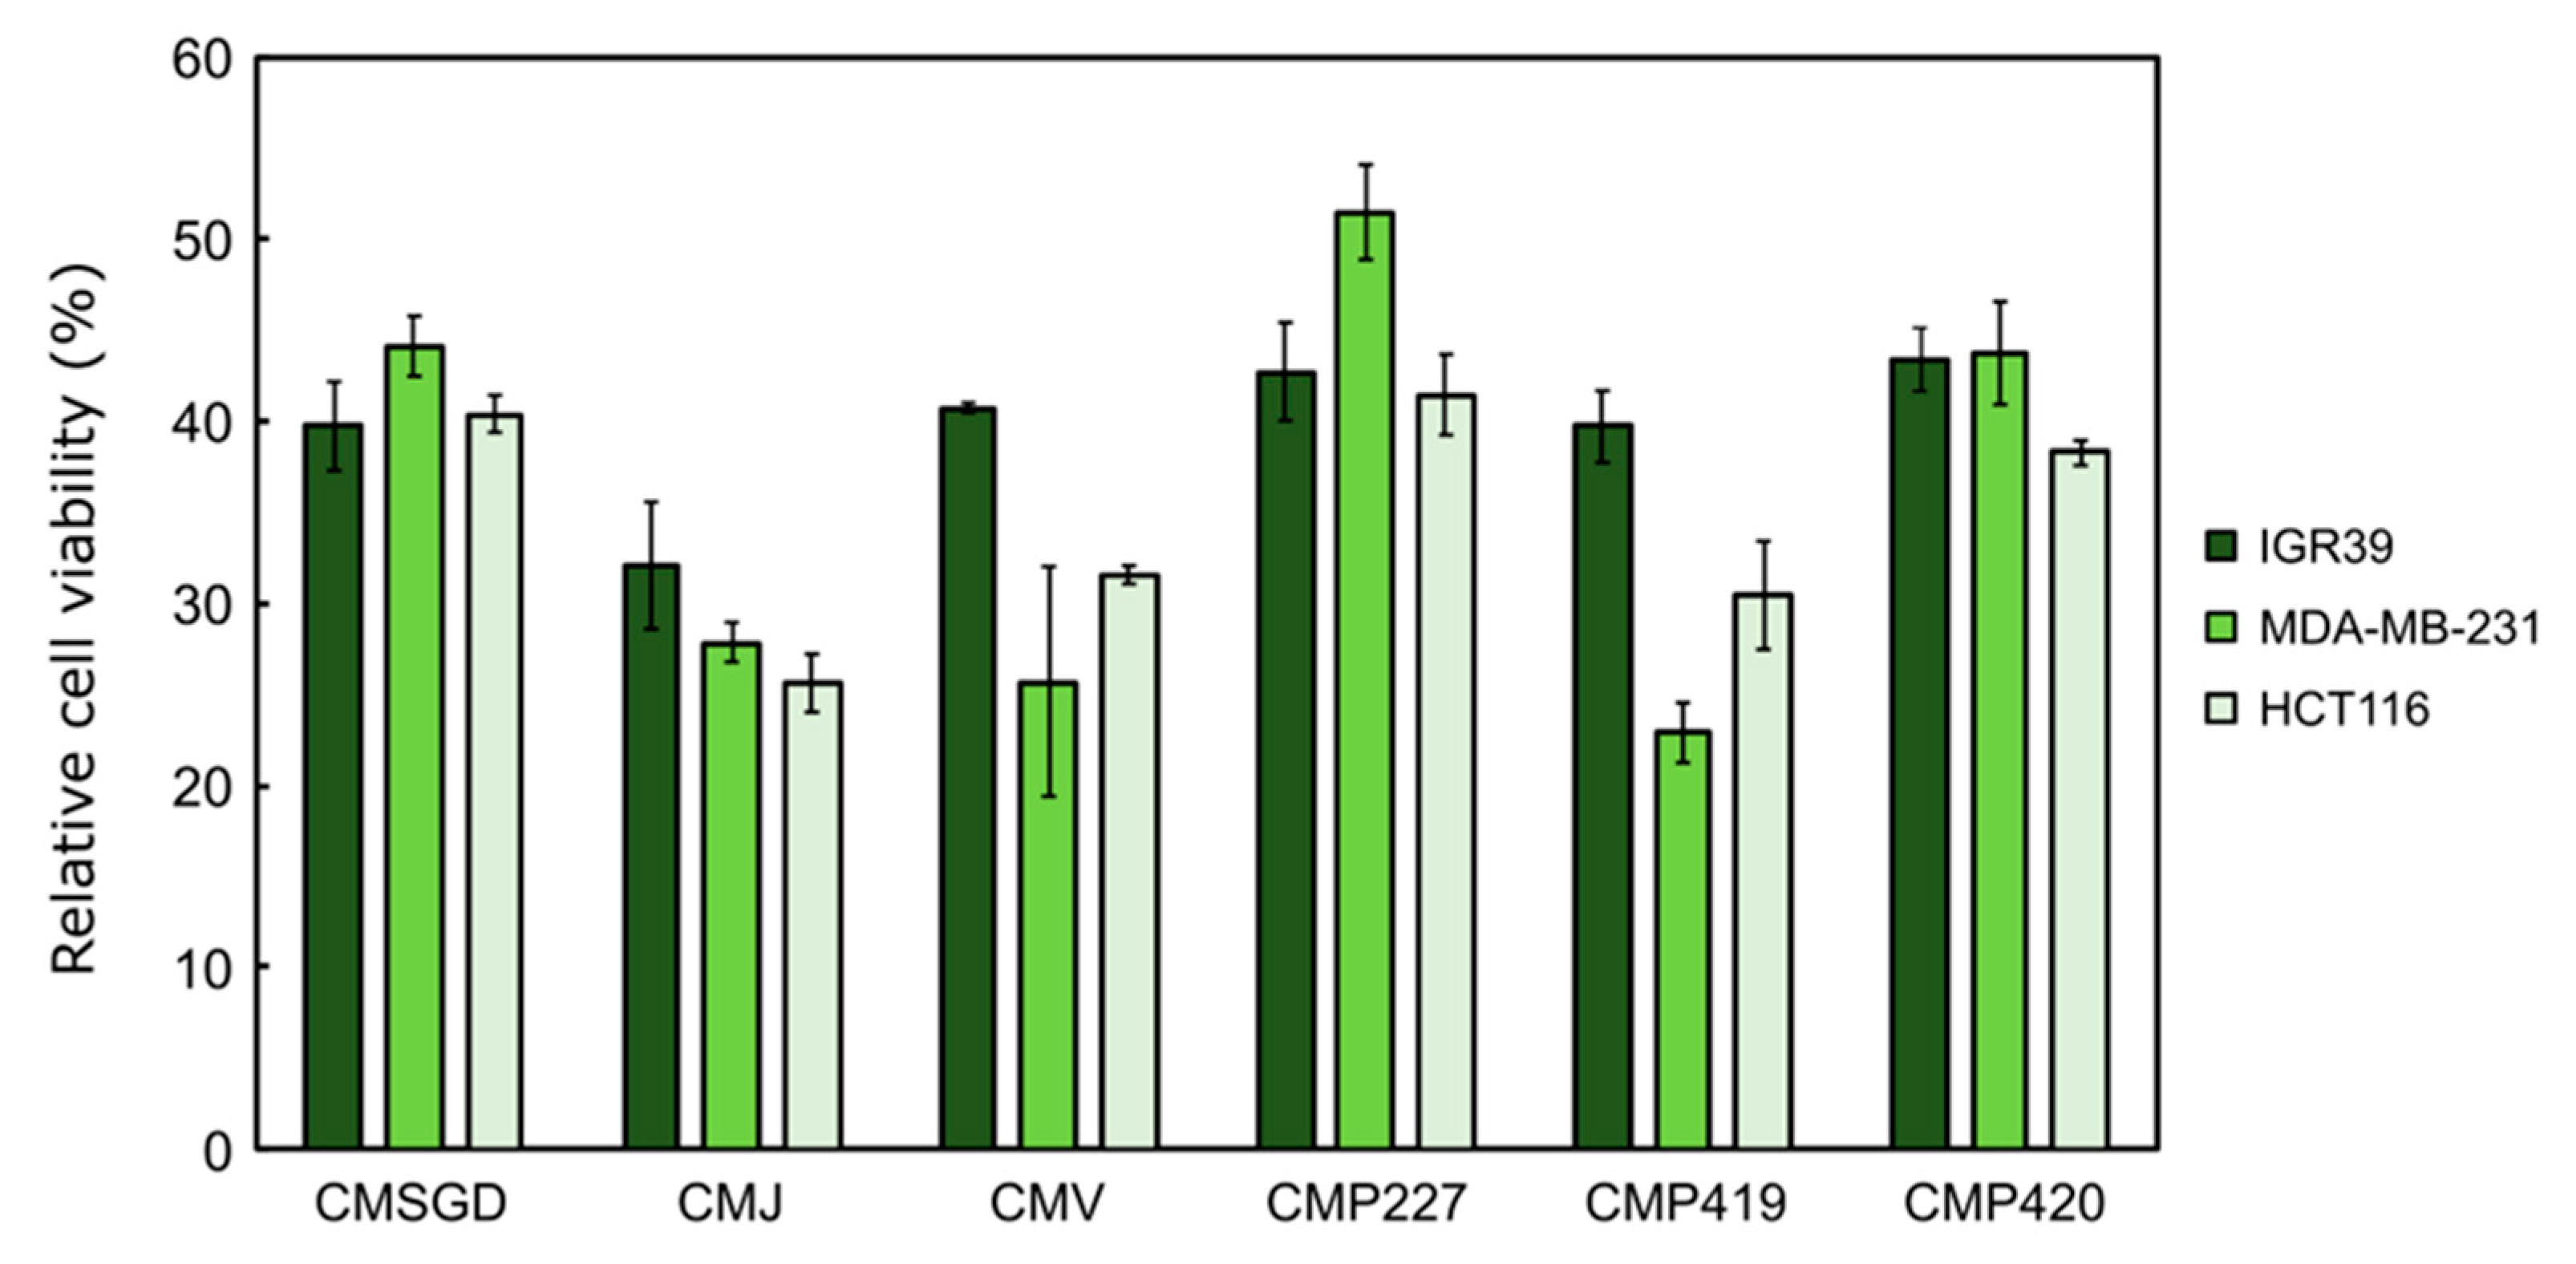
It is noted that all extracts at 2 mg/mL concentration showed a similar effect on the selected cell lines (Figure 6). Generally, most extracts were less active against melanoma cells, except clone C. mas P227, which showed the lowest activity against the triple-negative breast cancer cell line MDA-MB-231. Two cultivars and one clone (‘Jolico’, ‘Variegata’ and C. mas P419) reduced the viability of breast and colon cancer cells more efficiently compared to other cultivars.
Figure 6.
The extract effect on cancer cell viability at 2 mg/mL concentration after 72 hours of incubation. Viability was established using the MTT assay. MDA-MB-231—human triple-negative breast cancer cell line, IGR39—human melanoma cell line, HCT116—human colon adenocarcinoma cell line. CMSGD—‘Schonbrunner Gourmet-Dirndl’; CMJ—‘Jolico’; CMV—‘Variegata’; CMP227—clone P227; CMP419—clone P419; CMP420—clone P420.
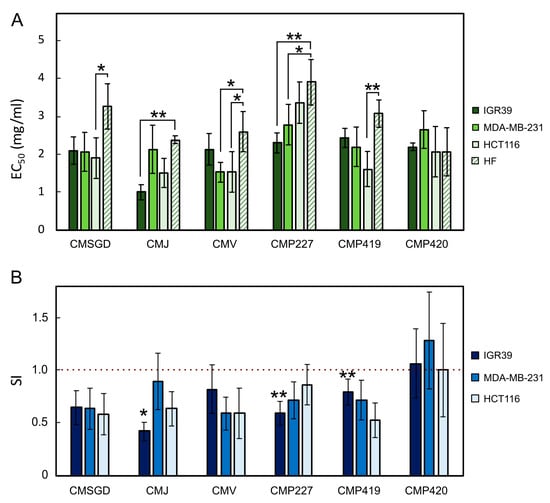
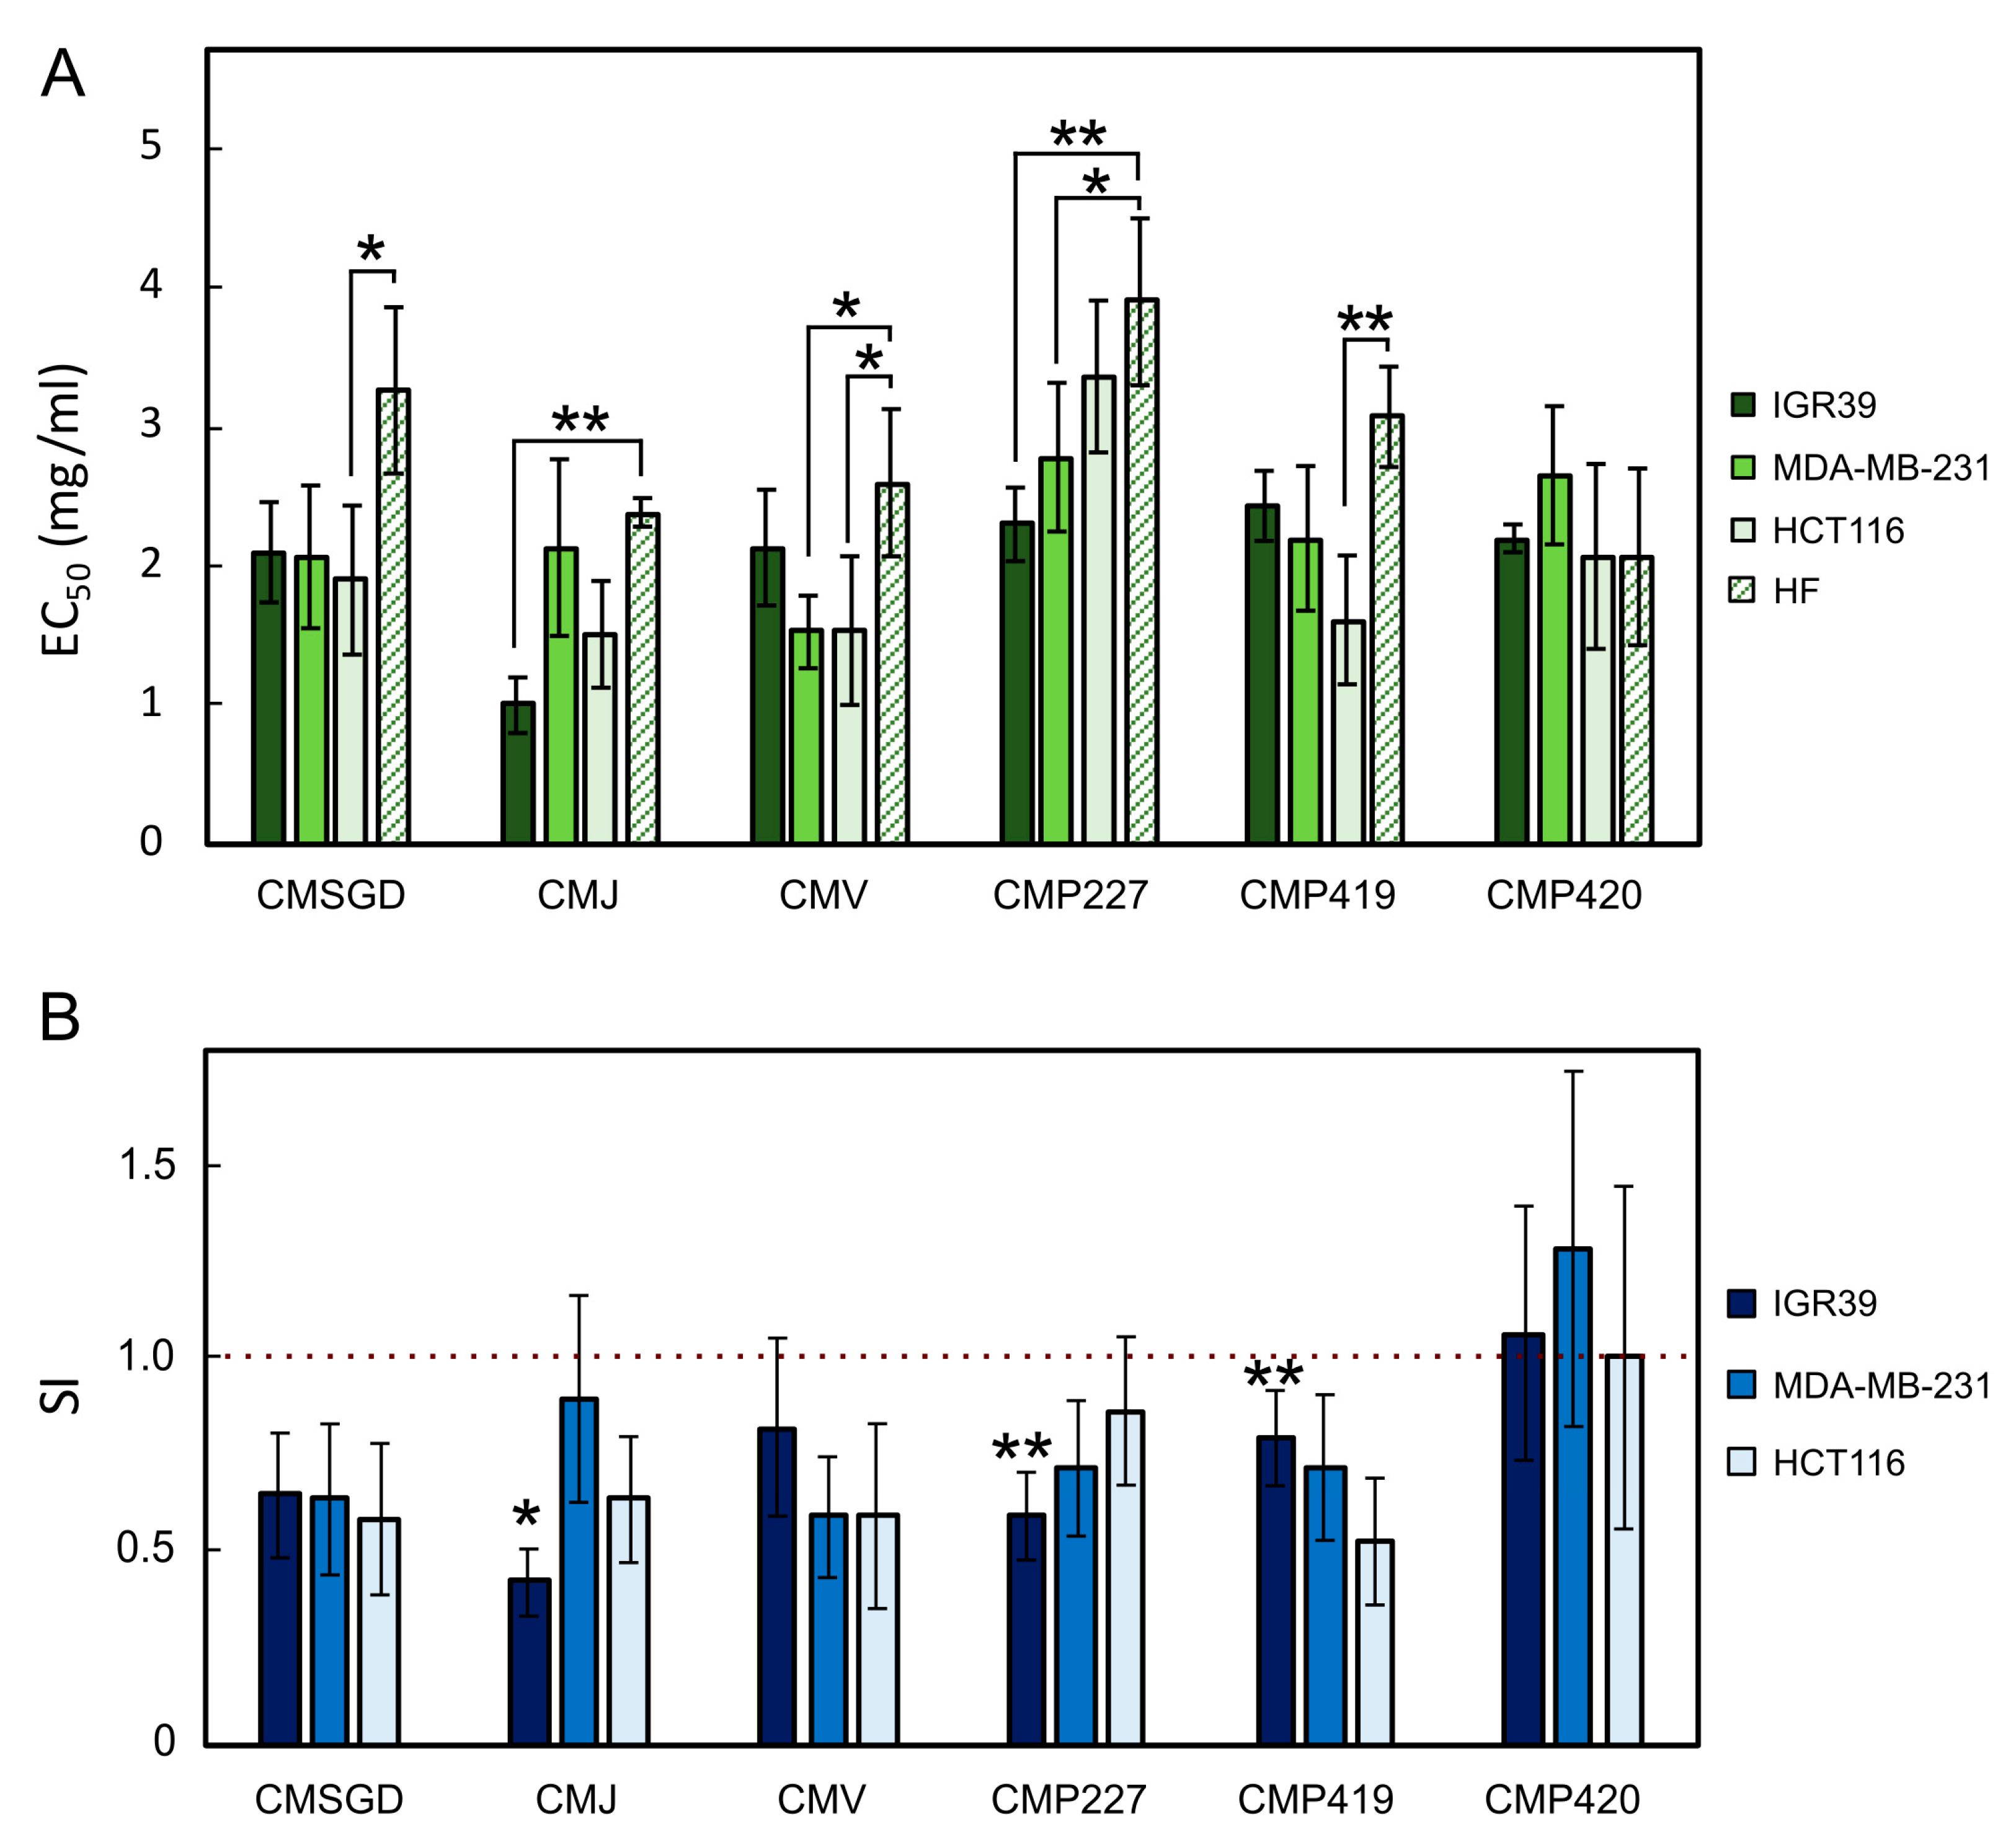
To further characterize the cytotoxicity of the extracts, dose–response experiments were performed, and EC50 values were determined for all three cancer cell lines and non-cancerous human fibroblasts (HF) (Figure 7). This additional analysis allowed us not only to quantify the cytotoxic activity of the extracts but also to compare their effects on cancer and non-cancerous cells. Based on the EC50 values, the selectivity index (SI) was calculated for each independent experiment as the ratio of the EC50 in cancer cells to the EC50 in HF cells. SI values below 1 indicate greater sensitivity of cancer cells to the tested extracts than HF cells, suggesting preferential activity against cancer cells.
Figure 7.
Dose–response characteristics and cancer cell selectivity of tested extracts. (A) EC50 values of the extracts determined in cancer cell lines MDA-MB-231, IGR39 and HCT116, and the human fibroblast cell line (HF), determined by MTT assay after 72 h of incubation; (B) Selectivity index (SI) of the extracts calculated for each cell line relative to HF cells. MDA-MB-231—human triple-negative breast cancer cell line, IGR39—human melanoma cell line, HCT116—human colon adenocarcinoma cell line. CMSGD—‘Schonbrunner Gourmet-Dirndl’; CMJ—‘Jolico’; CMV—‘Variegata’; CMP227—clone P227; CMP419—clone P419; CMP420—clone P420. Data are presented as mean ± SD of three independent biological experiments. For EC50 values (A), statistical differences between cell lines were evaluated using one-way repeated-measures ANOVA followed by Dunnett’s multiple comparisons test, comparing each cancer cell line with HF. For SI values (B), statistical significance was determined using a one-sample Student’s t-test on log10-transformed SI values, comparing each SI with 1. Asterisks indicate statistically significant differences (* p < 0.05, ** p < 0.01).
The dose–response analysis revealed distinct differences in the sensitivity of the three cancer cell lines to the tested C. mas extracts (Figure 7A). Among the investigated samples, ‘Jolico’ (CMJ) exhibited the highest cytotoxic activity against IGR39 melanoma cells, with the lowest EC50 value (1.00 ± 0.20 mg/mL). In contrast, MDA-MB-231 cells were most sensitive to ‘Variegata’ (CMV), which showed an EC50 value of 1.53 ± 0.26 mg/mL, while HCT116 cells exhibited the highest sensitivity to CMJ and CMV, with EC50 values of 1.51 ± 0.38 and 1.54 ± 0.53 mg/mL, respectively. Clone P227 generally showed lower cytotoxic activity, particularly against HCT116 cells, for which the EC50 value reached 3.36 ± 0.55 mg/mL. These findings indicate that the cytotoxic activity of C. mas extracts depends not only on the extract composition but also on the sensitivity of the individual cancer cell line.
Comparison of EC50 values between cancer cells and non-cancerous human fibroblasts (HF) further revealed differences in the sensitivity of these cell types. For most extracts, EC50 values were higher in HF cells than in cancer cells, suggesting that cancer cells were generally more sensitive to the tested extracts. This difference was particularly evident for CMJ, CMV and clone P419, although the extent of the effect varied among cancer cell lines. For example, CMJ exhibited a substantially lower EC50 value in IGR39 cells (1.00 ± 0.20 mg/mL) compared with HF cells (2.39 ± 0.10 mg/mL). Similarly, CMV showed lower EC50 values in MDA-MB-231 and HCT116 cells (1.53 ± 0.26 and 1.54 ± 0.53 mg/mL, respectively) than in HF cells (2.60 ± 0.53 mg/mL). In contrast, clone P227 showed relatively small differences between cancer cells and fibroblasts, particularly in HCT116 cells (3.36 ± 0.55 versus 3.90 ± 0.60 mg/mL). Notably, clone P420 exhibited similar EC50 values in HCT116 and HF cells (both 2.07 mg/mL), while its EC50 value in MDA-MB-231 cells (2.65 ± 0.50 mg/mL) was higher than that in HF cells. These results suggest that the potential preferential activity of the extracts against cancer cells varies considerably depending on both the extract and the cancer cell type.
The EC50 values in our study fell within a similar concentration range to those reported in previous studies on the cytotoxic activity of C. mas extracts. Hosseini et al. [51] reported an EC50 value of 2.44 mg/mL for C. mas extract in AGS gastric cancer cells following 72 h of treatment using the MTT assay. This value is close to the concentrations used in our study, suggesting comparable cytotoxic potency. However, differences in extract composition and cell line sensitivity should be considered when interpreting these findings.
Furthermore, Lewandowski et al. reported substantial differences in the sensitivity of two melanoma cell lines, A375 and MeWo, to C. mas fruit extracts [52]. Following 72 h of treatment, the EC50 values determined using the MTT assay were 9.9 µg/mL for A375 cells and 232.7 µg/mL for MeWo cells. This marked difference highlights the cell line-dependent response to C. mas extracts and supports our observation that the cytotoxic effects varied among melanoma, breast and colon cancer cells. Yousefi et al. reported higher cytotoxic activity of a hydroalcoholic C. mas fruit extract against several cancer cell lines, with reported EC50 values below 5 µg/mL [53]. However, these results should be interpreted cautiously, as the reported EC50 values were below the lowest tested concentration (5 µg/mL), limiting the reliability of their precise estimation. Tiptiri-Kourpeti et al. [6] investigated the antiproliferative activity of C. mas fruit juice against several cancer cell lines using the SRB assay after 72 h of exposure. The highest tested juice concentration (1% V/V) resulted in an approximately 40–50% reduction in cell viability, indicating a relatively modest antiproliferative effect. Although the concentration units and sample type differ from those used in the present study, both studies demonstrate that the cytotoxic activity of C. mas preparations depends on the tested cell line and preparation type.
When assessing the relationship between phenolic compound composition and cytotoxic activity, differences among the extracts were considered in relation to their phenolic profiles. E.g., C. mas ‘Variegata’ contained the highest amount of TFC (3.2 mg REg DW), but the cytotoxic effect of its extract was comparable to other extracts (C. mas ‘Jolico’ and C. mas P419) and even lower against the melanoma cell line. Meanwhile, C. mas ‘Jolico’ exhibited one of the highest viability-reducing effects against all tested cancer cell lines, but it did not contain the highest TFC. These findings suggest that the biological effects may be related to the combined contribution of multiple phenolic compounds and other bioactive metabolites not quantified in this study [54,55]. In addition, it was observed that despite the high chlorogenic acid content in clone P227, its cytotoxic activity was relatively low, especially against breast and colon cancer cell lines. Although chlorogenic acid is often associated with antioxidant and anticancer activity [56], the present results indicate that its concentration alone does not explain the observed differences in cytotoxic activity. Another phenolic compound found in the analyzed plant extract samples was rutin, with the highest amount detected in clone C. mas P420. However, this clone demonstrated moderate cytotoxic activity. This observation suggests that rutin concentration alone was insufficient to explain the differences in cytotoxic activity among the tested samples [57]. Similarly, clone P227 contained the highest amount of luteolin-7-O-glucoside but did not exhibit enhanced cytotoxic activity, further indicating that the concentration of an individual phenolic compound alone may not account for the observed cytotoxic responses.
Overall, the observed differences in cytotoxic activity may reflect the combined contribution of different classes of phenolic compounds and other secondary metabolites, including iridoids, which were not analyzed in this study. In addition, differences in sensitivity among melanoma, breast, and colon cancer cell lines indicate cell type-specific responses to the bioactive compounds.
The selectivity of the extracts varied depending on the cancer cell line and the tested sample. The most pronounced evidence of selective activity was observed for clones P227 and P419 against IGR39 melanoma cells, for which SI values were significantly below 1 (Figure 7B). In contrast, none of the tested extracts showed statistically significant selectivity against MDA-MB-231 or HCT116 cells. These findings indicate that the cytotoxic activity and selectivity of C. mas extracts are dependent on both the extract composition and the cancer cell type.
Previous studies have also reported differential sensitivity of cancer and non-cancerous cells to C. mas preparations. Hosseini et al. found that AGS gastric cancer cells were more sensitive to C. mas extract than non-cancerous L929 fibroblasts, with IC50 values of 2.44 and 3.76 mg/mL, respectively, after 72 h of exposure [51]. Similarly, Zagórska-Dziok et al. observed that selected C. mas extracts did not exert cytotoxic effects on normal human dermal fibroblasts or keratinocytes, whereas the reduction in A375 melanoma cell viability was relatively modest and depended on the extract type. Differences between these studies and our findings may be related to the chemical composition of the extracts, the origin and characteristics of the cell lines, and the experimental conditions [58].
No direct correlation was determined between the antioxidant and cytotoxic effects in this study, which is in accordance with our previous findings demonstrating that flavonoids with strong antioxidant properties did not always exhibit the highest cytotoxic activity, indicating that radical scavenging capacity alone is insufficient to predict cytotoxic effects against cancer cells [59]. This suggests that anticancer activity depends on additional mechanisms, including modulation of cell signaling pathways [60], induction of apoptosis [61,62], and pro-oxidant effects under specific cellular conditions [9].
We would like to note that several limitations of the present study should be acknowledged. A relatively limited number of C. mas cultivars and wild clones have been investigated; thus, the obtained results may not fully reflect the overall variability of this species. Therefore, further studies including a broader range of cultivars and clones are necessary to better understand the relationships between phenolic composition, antioxidant properties, and cytotoxic activity. Also, additional studies are needed to clarify the contribution of individual phenolic compounds, possible synergistic interactions, and the molecular pathways involved in the observed cell viability-reducing effects. Furthermore, iridoid compounds, particularly loganic acid, as well as total iridoid content, were not determined in the present study. Therefore, the potential contribution of these compounds to the antioxidant activity observed in C. mas fruit extracts could not be evaluated. Future investigations incorporating broader phytochemical profiling, particularly the determination of loganic acid and total iridoid content, would provide a more comprehensive characterization of C. mas fruits and help clarify the possible contribution of iridoids to their antioxidant properties.
4. Conclusions
The present findings confirm that Cornus mas L. fruits are characterized by a diverse phenolic profile associated with strong antioxidant activity and cytotoxic effects. Although the tested cultivars and clones showed generally similar biological activity, clone P419 demonstrated a more pronounced inhibitory effect against MDA-MB-231 cells, suggesting that genotype-related differences may influence the biological properties of cornelian cherry fruits. Chlorogenic acid and rutin were among the predominant phenolic compounds in the analyzed extracts; however, their predominance alone does not establish their direct contribution to the observed antioxidant capacity. The observed cytotoxic effects may reflect the combined contribution of multiple phenolic constituents; however, further concentration-dependent studies are needed to clarify these relationships. The rich phytochemical composition and observed biological activities highlight the potential of European cornelian cherry as a subject for further research, including investigations of its possible applications as a functional food resource. However, the biological effects observed in the present study were evaluated only in vitro. Further in vivo studies are required to determine the biological relevance and potential health effects of C. mas fruit extracts. Since this species remains relatively underexplored compared with other fruits, the present study provides additional evidence supporting its wider utilization and further investigation.
Author Contributions
Conceptualization, S.S. and V.P. (Viktorija Puzerytė); methodology, L.Č., M.L. and V.P. (Vilma Petrikaitė); software, S.S.; validation, J.V., P.V. and M.Z.; formal analysis, Y.V.; investigation, S.S., V.P. (Viktorija Puzerytė) and V.P. (Vilma Petrikaitė); resources, V.P. (Vilma Petrikaitė), R.D. and V.Ž.; data curation, L.Č.; writing—original draft preparation, S.S., V.P. (Viktorija Puzerytė) and V.P. (Vilma Petrikaitė); writing—review and editing, S.S., V.P. (Viktorija Puzerytė) and V.P. (Vilma Petrikaitė); visualization, J.V.; supervision, R.D. All authors have read and agreed to the published version of the manuscript.
Funding
This research received no external funding.
Institutional Review Board Statement
Not applicable.
Informed Consent Statement
Not applicable.
Data Availability Statement
The original contributions presented in this study are included in the article. Further inquiries can be directed to the corresponding authors.
Acknowledgments
The authors thank the researchers of the Faculty of Pharmacy of the Lithuanian University of Health Sciences and the Biochemistry and Technology Laboratory of the Lithuanian Research Centre for Agriculture and Forestry for their support in conducting the research.
Conflicts of Interest
The authors declare no conflicts of interest.
References
- Tenuta, M.C.; Deguin, B.; Loizzo, M.R.; Cuyamendous, C.; Bonesi, M.; Sicari, V.; Trabalzini, L.; Mitaine-Offer, A.-C.; Xiao, J.; Tundis, R. An Overview of Traditional Uses, Phytochemical Compositions and Biological Activities of Edible Fruits of European and Asian Cornus Species. Foods 2022, 11, 1240. [Google Scholar] [CrossRef] [Scilit] [PubMed]
- World Flora Online (WFO). Cornus L. Available online: https://www.worldfloraonline.org (accessed on 15 May 2026).
- Czerwińska, M.E.; Melzig, M.F. Cornus mas and Cornus officinalis-Analogies and Differences of Two Medicinal Plants Traditionally Used. Front. Pharmacol. 2018, 9, 894. [Google Scholar] [CrossRef] [Scilit] [PubMed]
- Dinda, B.; Kyriakopoulos, A.M.; Dinda, S.; Zoumpourlis, V.; Thomaidis, N.S.; Velegraki, A.; Dinda, M. Cornus mas L. (cornelian cherry), an important European and Asian traditional food and medicine: Ethnomedicine, phytochemistry and pharmacology for its commercial utilization in drug industry. J. Ethnopharmacol. 2016, 193, 670–690. [Google Scholar] [CrossRef] [Scilit] [PubMed]
- Skender, A.; Kurtović, M.; Drkenda, P.; Bećirspahić, D.; Vranac, A.; Ercisli, S.; Đorđević, B.; Güleryüz, M. Morphological and Biochemical Properties in Fruits of Naturally Grown Cornelian Cherry (Cornus mas L.) Genotypes in Northwest Bosnia and Herzegovina. Sustainability 2022, 14, 4579. [Google Scholar] [CrossRef] [Scilit]
- Tiptiri-Kourpeti, A.; Fitsiou, E.; Spyridopoulou, K.; Vasileiadis, S.; Iliopoulos, C.; Galanis, A.; Vekiari, S.; Pappa, A.; Chlichlia, K. Evaluation of Antioxidant and Antiproliferative Properties of Cornus mas L. Fruit Juice. Antioxidants 2019, 8, 377. [Google Scholar] [CrossRef] [Scilit] [PubMed]
- Aurori, M.; Niculae, M.; Hanganu, D.; Pall, E.; Cenariu, M.; Vodnar, D.C.; Bunea, A.; Fiţ, N.; Andrei, S. Phytochemical Profile, Antioxidant, Antimicrobial and Cytoprotective Effects of Cornelian Cherry (Cornus mas L.) Fruit Extracts. Pharmaceuticals 2023, 16, 420. [Google Scholar] [CrossRef] [Scilit] [PubMed]
- Milenkovic-Andjelkovic, A.S.; Andjelkovic, M.Z.; Radovanovic, A.N.; Radovanovic, B.C.; Nikolic, V. Phenol composition, DPPH radical scavenging and antimicrobial activity of Cornelian cherry (Cornus mas) fruit and leaf extracts. Hem. Ind. 2015, 69, 331–337. [Google Scholar] [CrossRef] [Scilit]
- Dong, Y.; Feng, Z.-L.; Chen, H.-B.; Wang, F.-S.; Lu, J.-H. Corni Fructus: A review of chemical constituents and pharmacological activities. Chin. Med. 2018, 13, 34–54. [Google Scholar] [CrossRef] [Scilit] [PubMed]
- Pawlowska, A.M.; Camangi, F.; Braca, A. Quali-quantitative analysis of flavonoids of Cornus mas L. (Cornaceae) fruits. Food Chem. 2010, 119, 1257–1261. [Google Scholar] [CrossRef] [Scilit]
- Peng, Z.; Wang, Y.; He, J.; Zhang, J.; Pan, X.; Ye, X.; Zhang, W.; Xu, J. Chemical constituents and their antioxidant and anti-inflammatory activities from edible Cornus officinalis fruits. Eur. Food Res. Technol. 2022, 248, 1003–1010. [Google Scholar] [CrossRef] [Scilit]
- Deng, S.; West, B.J.; Jensen, C.J. UPLC-TOF-MS characterization and identification of bioactive iridoids in Cornus mas fruit. J. Anal. Methods Chem. 2013, 2013, 710972. [Google Scholar] [CrossRef] [Scilit] [PubMed]
- Krivoruchko, E.V. Carboxylic acids from Cornus mas. Chem. Nat. Compd. 2014, 50, 112–113. [Google Scholar] [CrossRef] [Scilit]
- Antolak, H.; Czyzowska, A.; Sakač, M.; Mišan, A.; Đuragić, O.; Kregiel, D. Phenolic compounds contained in little-known wild fruits as antiadhesive agents against the beverage-spoiling bacteria asaia spp. Molecules 2017, 22, 1256. [Google Scholar] [CrossRef] [Scilit] [PubMed]
- Bayram, H.M.; Ozturkcan, S.A. Bioactive components and biological properties of cornelian cherry (Cornus mas L.): A comprehensive review. J. Funct. Foods 2020, 75, 104252. [Google Scholar] [CrossRef] [Scilit]
- Behrangi, N.; Ghafoori, H.; Farahmand, Z.; Khani, E.M.; Sanati, M.H. Comparison among cornelian cherry and Prunus cerasus according to phenolic content and antioxidant capacity by three various methods of extraction. Food Nutr. Sci. 2015, 6, 1166–1173. [Google Scholar]
- Szumny, D.; Sozański, T.; Kucharska, A.Z.; Dziewiszek, W.; Piórecki, N.; Magdalan, J.; Chlebda-Sieragowska, E.; Kupczynski, R.; Szeląg, A.; Szumny, A. Application of cornelian cherry iridoid-polyphenolic fraction and loganic acid to reduce intraocular pressure. Evid.-Based Complement. Altern. Med. 2015, 2015, 939402. [Google Scholar] [CrossRef] [Scilit] [PubMed]
- Drkenda, P.; Spahic, A.; Begic-Akagic, A.; Gasi, F.; Vranac, A.; Hudina, M.; Blanke, M. Pomological characteristics of some autochthonous genotypes of cornelian cherry (Cornus mas L.) in Bosnia and Herzegovina. Erwerbs-Obstbau 2014, 56, 59–66. [Google Scholar] [CrossRef] [Scilit]
- Jayaprakasam, B.; Olson, L.K.; Schutzki, R.E.; Tai, M.H.; Nair, M.G. Amelioration of obesity and glucose intolerance in high-fat-fed C57BL/6 mice by anthocyanins and ursolic acid in cornelian cherry (Cornus mas). J. Agric. Food Chem. 2006, 54, 243–248. [Google Scholar] [CrossRef] [Scilit] [PubMed]
- Ognjanov, V.; Cerovic, S.; Ninic- Todorovic, J.; Jacimovic, V.; Golocin, B.; Bijelic, S.; Vracevic, B. Selection and utilization of table cornelian cherry (Cornus mas L.). Acta Hortic. 2009, 814, 121–123. [Google Scholar] [CrossRef] [Scilit]
- Hassanpour, H.; Hamidoghli, Y.; Samizadeh, H. Some fruit characteristics of Iranian cornelian cherries (Cornus mas L.). Not. Bot. Horti Agrobot. Cluj-Napoca 2012, 40, 247–252. [Google Scholar] [CrossRef] [Scilit]
- Horvath, G.; Turcsi, E.; Molnar, P.; Szabo, L.G.; Deli, J. Isolation and identification of carotenoids in the fruit of cornelian cherry (Cornus mas L.). Planta Med. 2007, 73, 286–288. [Google Scholar] [CrossRef] [Scilit]
- Tural, S.; Koca, I. Physicochemical and antioxidant properties of cornelian cherry fruits (Cornus mas L.) grown in Turkey. Sci. Hortic. 2008, 116, 362–366. [Google Scholar] [CrossRef] [Scilit]
- Pantelidis, G.E.; Vasilakakis, M.; Manganaris, G.A.; Diamantidis, G. Antioxidant capacity, phenol, anthocyanin and ascorbic acid contents in raspberries, blackberries, red currants, gooseberries and Cornelian cherries. Food Chem. 2007, 102, 777–783. [Google Scholar] [CrossRef] [Scilit]
- Serteser, A.; Kargioglu, M.; Gok, V.; Bagci, Y.; Musa Ozcan, M.; Arslan, D. Antioxidant properties of some plants growing wild in Turkey. Grasas Y Aceites 2009, 60, 147–154. [Google Scholar] [CrossRef] [Scilit]
- Stanković, M.S.; Zia-Ul-Haq, M.; Bojovic, B.M.; Topuzovic, M.D. Total phenolic, flavonoid content and antioxidant power of leaf, flower and fruits from cornelian cherry. Bulg. J. Agric. Sci. 2014, 20, 358–363. [Google Scholar]
- Mirbadalzadeh, R.; Shirdel, Z. Antihyperglycemic and antihyperlipidemic effects of Cornus mas extract in diabetic rats compared with glibenclamide. Elixir Hormo. Signal. 2012, 47, 8969–8972. [Google Scholar]
- Rasoulian, H.; Shahryar, H.A.; Abbaspour, R.; Lotfi, H. Effects of dietary inclusion of cornelian cherry (Cornus mas L.) fruit on body weight, insulin level and glycemic status of hamsters. Pak. J. Biol. Sci. 2012, 15, 547–550. [Google Scholar] [CrossRef] [Scilit] [PubMed]
- Shamsi, F.; Asgary, S.; Rafieian, M.; Kazemi, S.; Adelnia, A. Effects of Cornus mas L. on blood glucose, insulin and histopathology of pancreas in alloxan-induced diabetic rats. J. Isfahan Med. Sch. 2011, 29, 929–938. [Google Scholar]
- Asgary, S.; Rafieian-kopaei, M.; Shamsi, F.; Najafi, S.; Sahebkar, A. Biochemical and histopathological study on the anti- hyperglycemic and anti- hyperlipidemic effects of cornelian cherry (Cornus mas L.) in alloxan-induced diabetic rats. J. Complement. Integr. Med. 2014, 11, 63–69. [Google Scholar] [CrossRef] [Scilit] [PubMed]
- Soltani, R.; Gorji, A.; Asgary, S.; Sarrafzadegan, N.; Siavash, M. Evaluation of the effects of Cornus mas L. fruit extract on glycemic control and insulin level in type 2 diabetic adult patients: A randomized double-blind placebo-controlled clinical trial. Evid. Based Complement. Altern. Med. 2015, 2015, 740954. [Google Scholar] [CrossRef] [Scilit] [PubMed]
- Asgary, S.; Kelishadi, R.; Rafieian-Kopaei, M.; Najafi, S.; Najafi, M.; Sahebkar, A. Investigation of the lipid-modifying and antiinflammatory effects of Cornus mas L. supplementation on dyslipidemic children and adolescents. Pediatr. Cardiol. 2013, 34, 1729–1735. [Google Scholar] [CrossRef] [Scilit] [PubMed]
- González-Burgos, E.; Liaudanskas, M.; Viškelis, J.; Žvikas, V.; Janulis, V.; Gómez-Serranillos, M.P. Antioxidant activity, neuroprotective properties and bioactive constituents analysis of varying polarity extracts from Eucalyptus globulus leaves. J. Food Drug Anal. 2018, 26, 1293–1302. [Google Scholar] [CrossRef] [Scilit] [PubMed]
- Česonienė, L.; Januškevičė, V.; Saunoriūtė, S.; Liaudanskas, M.; Žvikas, V.; Krikštolaitis, R.; Viškelis, P.; Urbonavičienė, D.; Martusevičė, P.; Zych, M.; et al. Phenolic Compounds in Berries of Winter-Resistant Actinidia arguta Miq. and Actinidia kolomikta Maxim.: Evidence of Antioxidative Activity. Antioxidants 2024, 13, 372. [Google Scholar] [CrossRef] [Scilit] [PubMed]
- Bobinaitė, R.; Viškelis, P.; Venskutonis, P.R. Variation of total phenolics, anthocyanins, ellagic acid and radical scavenging capacity in various raspberry (Rubus spp.) cultivars. Food Chem. 2012, 132, 1495–1501. [Google Scholar] [CrossRef] [Scilit] [PubMed]
- Urbonavičiūtė, A.; Jakštas, V.; Kornyšova, O.; Janulis, V.; Maruška, A. Capillary electrophoretic analysis of flavonoids in single-styled hawthorn (Crataegus monogyna Jacq.) ethanolic extracts. J. Chromatogr. A 2006, 1112, 339–344. [Google Scholar] [CrossRef] [Scilit] [PubMed]
- Re, R.; Pellegrini, N.; Proteggente, A.; Pannala, A.; Yang, M.; Rice-Evans, C. Antioxidant activity applying an improved ABTS radical cation decolorization assay. Free Radic. Bio. Med. 1999, 26, 1231–1237. [Google Scholar] [CrossRef] [Scilit] [PubMed]
- Liaudanskas, M.; Viškelis, P.; Raudonis, R.; Kviklys, D.; Uselis, N.; Janulis, V. Phenolic Composition and Antioxidant Activity of Malus domestica Leaves. Sci. World J. 2014, 1, 306217. [Google Scholar] [CrossRef] [Scilit]
- Apak, R.; Güçlü, K.; Demirata, B.; Ozyürek, M.; Celik, S.E.; Bektaşoğlu, B.; Berker, K.I.; Ozyurt, D. Comparative evaluation of various total antioxidant capacity assays applied to phenolic compounds with the CUPRAC assay. Molecules 2007, 12, 1496–1547. [Google Scholar] [CrossRef] [Scilit] [PubMed]
- Liaudanskas, M.; Žvikas, V.; Petrikaitė, V. The Potential of Dietary Antioxidants from a Series of Plant Extracts as Anticancer Agents against Melanoma, Glioblastoma, and Breast Cancer. Antioxidants 2021, 10, 1115. [Google Scholar] [CrossRef] [Scilit] [PubMed]
- Cosmulescu, S.N.; Trandafir, I.; Cornescu, F. Antioxidant Capacity, Total Phenols, Total Flavonoids and Colour Component of Cornelian Cherry (Cornus mas L.) Wild Genotypes. Not. Bot. Horti Agrobot. Cluj-Napoca 2019, 47, 390–394. [Google Scholar] [CrossRef] [Scilit]
- Kucharska, A.Z.; Sokół-Łętowska, A.; Piórecki, N. Morphological, Physicochemical and Antioxidant Characteristics of Fruits of Polish Cultivars of Cornelian Cherry (Cornus mas L.). Żywność. Nauka Technologia. Jakość 2011, 18, 78–89. [Google Scholar]
- Lidiková, J.; Čeryová, N.; Grygorieva, O.; Brindza, J.; Klymenko, S.; Vergun, O.; Horčinová Sedláčková, V. Cornelian Cherry (Cornus mas L.) as a Promising Source of Antioxidant Phenolic Substances and Minerals. Eur. Food Res. Technol. 2024, 250, 1745–1754. [Google Scholar] [CrossRef] [Scilit]
- Pomianek, T.; Zagórska-Dziok, M.; Skóra, B.; Ziemlewska, A.; Nizioł-Łukaszewska, Z.; Wójciak, M.; Sowa, I.; Szychowski, K.A. Comparison of the Antioxidant and Cytoprotective Properties of Extracts from Different Cultivars of Cornus mas L. Int. J. Mol. Sci. 2024, 25, 5495. [Google Scholar] [CrossRef] [Scilit] [PubMed]
- Ochmian, I.; Lachowicz-Wiśniewska, S.; Smolik, M. Genotype and Environment Synergistically Determine the Polyphenolic Composition and Functional Activity of Highbush Blueberries. Sci. Rep. 2025, 15, 39895. [Google Scholar] [CrossRef] [Scilit] [PubMed]
- Cervantes, L.; Ariza, M.T.; Miranda, L.; Lozano, D.; Medina, J.J.; Soria, C.; Martínez-Ferri, E. Stability of Fruit Quality Traits of Different Strawberry Varieties under Variable Environmental Conditions. Agronomy 2020, 10, 1242. [Google Scholar] [CrossRef] [Scilit]
- Zhang, Y.; Yang, M.; Hou, G.; Zhang, Y.; Chen, Q.; Lin, Y.; Li, M.; Wang, Y.; He, W.; Wang, X.; et al. Effect of Genotype and Harvest Date on Fruit Quality, Bioactive Compounds, and Antioxidant Capacity of Strawberry. Horticulturae 2022, 8, 348. [Google Scholar] [CrossRef] [Scilit]
- Džarić, T.; Petrović, D.; Božović, M. Antioxidant Activity and Total Phenolic Content of Different Extracts from Rosa canina L. Fruits. Nat. Prod. Commun. 2025, 20, 1934578X251369590. [Google Scholar] [CrossRef] [Scilit]
- Gąstoł, M.; Krośniak, M.; Derwisz, M.; Dobrowolska-Iwanek, J. Cornelian Cherry (Cornus mas L.) Juice as a Potential Source of Biological Compounds. J. Med. Food 2013, 16, 728–732. [Google Scholar] [CrossRef] [Scilit] [PubMed]
- Klymenko, S.; Kucharska, A.Z.; Sokół-Łętowska, A.; Piórecki, N.; Przybylska, D.; Grygorieva, O. Iridoids, Flavonoids, and Antioxidant Capacity of Cornus mas, C. officinalis, and C. mas × C. officinalis Fruits. Biomolecules 2021, 11, 776. [Google Scholar] [CrossRef] [Scilit] [PubMed]
- Hosseini, F.S.; Noroozi Karimabad, M.; Hajizadeh, M.R.; Khoshdel, A.; Khanamani Falahati-Pour, S.; Mirzaei, M.R.; Mirmohamadi, S.M.; Mahmoodi, M. Evaluating of Induction of Apoptosis by Cornus mas L. Extract in the Gastric Carcinoma Cell Line (AGS). Asian Pac. J. Cancer Prev. 2019, 20, 123–130. [Google Scholar] [CrossRef] [Scilit] [PubMed]
- Lewandowski, Ł.; Bednarz-Misa, I.; Kucharska, A.Z.; Kubiak, A.; Kasprzyk, P.; Sozański, T.; Przybylska, D.; Piórecki, N.; Krzystek-Korpacka, M. Cornelian Cherry (Cornus mas L.) Extracts Exert Cytotoxicity in Two Selected Melanoma Cell Lines—A Factorial Analysis of Time-Dependent Alterations in Values Obtained with SRB and MTT Assays. Molecules 2022, 27, 4193. [Google Scholar] [CrossRef] [Scilit] [PubMed]
- Yousefi, B.; Abasi, M.; Mesgari Abbasi, M.; Jahanban-Esfahlan, R. Anti-Proliferative Properties of Cornus mas Fruit in Different Human Cancer Cells. Asian Pac. J. Cancer Prev. 2015, 16, 5727–5731. [Google Scholar] [CrossRef] [Scilit] [PubMed]
- Radbeh, Z.; Asefi, N.; Hamishehkar, H.; Roufegarinejad, L.; Pezeshki, A. Novel Carriers Ensuring Enhanced Anti-Cancer Activity of Cornus mas (Cornelian Cherry) Bioactive Compounds. Biomed. Pharmacother. 2020, 125, 109906. [Google Scholar] [CrossRef] [Scilit] [PubMed]
- Emsen, B.; Cicek, M.; Surmen, B.; Karapinar, H.S. Potent Anticancer Activity of Phenolic-Enriched Extracts from Endemic Plants Supported by In Vitro Pharmacological Analyses and In Silico Molecular Docking. Sci. Nat. 2026, 113, 24. [Google Scholar] [CrossRef] [Scilit] [PubMed]
- Cortez, N.; Villegas, C.; Burgos, V.; Ortiz, L.; Cabrera-Pardo, J.R.; Paz, C. Therapeutic Potential of Chlorogenic Acid in Chemoresistance and Chemoprotection in Cancer Treatment. Int. J. Mol. Sci. 2024, 25, 5189. [Google Scholar] [CrossRef] [Scilit] [PubMed]
- Suman, I.; Jezidžić, A.; Dobrić, D.; Domitrović, R. Differential Effects of Rutin and Its Aglycone Quercetin on Cytotoxicity and Chemosensitization of HCT 116 Colon Cancer Cells to Anticancer Drugs 5-Fluorouracil and Doxorubicin. Biology 2025, 14, 527. [Google Scholar] [CrossRef] [Scilit] [PubMed]
- Zagórska-Dziok, M.; Mokrzyńska, A.; Ziemlewska, A.; Nizioł-Łukaszewska, Z.; Sowa, I.; Feldo, M.; Wójciak, M. Assessment of the Antioxidant and Photoprotective Properties of Cornus mas L. Extracts on HDF, HaCaT and A375 Cells Exposed to UVA Radiation. Int. J. Mol. Sci. 2024, 25, 10993. [Google Scholar] [CrossRef] [Scilit] [PubMed]
- Grigalius, I.; Petrikaite, V. Relationship between Antioxidant and Anticancer Activity of Trihydroxyflavones. Molecules 2017, 22, 2169. [Google Scholar] [CrossRef] [Scilit] [PubMed]
- Lin, C.-H.; Chang, C.-Y.; Lee, K.-R.; Lin, H.-J.; Chen, T.-H.; Wan, L. Flavones Inhibit Breast Cancer Proliferation through the Akt/FOXO3a Signaling Pathway. BMC Cancer 2015, 15, 958. [Google Scholar] [CrossRef] [Scilit] [PubMed]
- Kilani-Jaziri, S.; Frachet, V.; Bhouri, W.; Ghedira, K.; Chekir-Ghedira, L.; Ronot, X. Flavones Inhibit the Proliferation of Human Tumor Cancer Cell Lines by Inducing Apoptosis. Drug Chem. Toxicol. 2012, 35, 1–10. [Google Scholar] [CrossRef] [Scilit] [PubMed]
- Simunkova, M.; Barbierikova, Z.; Jomova, K.; Hudecova, L.; Lauro, P.; Alwasel, S.H.; Alhazza, I.; Rhodes, C.J.; Valko, M. Antioxidant vs. Prooxidant Properties of the Flavonoid, Kaempferol, in the Presence of Cu (II) Ions: A ROS-Scavenging Activity, Fenton Reaction and DNA Damage Study. Int. J. Mol. Sci. 2021, 22, 1619. [Google Scholar] [CrossRef] [Scilit] [PubMed]

Disclaimer/Publisher’s Note: The statements, opinions and data contained in all publications are solely those of the individual author(s) and contributor(s) and not of MDPI and/or the editor(s). MDPI and/or the editor(s) disclaim responsibility for any injury to people or property resulting from any ideas, methods, instructions or products referred to in the content. |
© 2026 by the authors. Licensee MDPI, Basel, Switzerland. This article is an open access article distributed under the terms and conditions of the Creative Commons Attribution (CC BY) license.