


Abstract
Juniperus phoenicea L. is a medicinal plant native to the Mediterranean region, including Morocco, where it is traditionally used to treat various ailments. This study aimed to characterize the phytochemical profiles of aqueous, ethanolic, and hydroethanolic leaf extracts of Moroccan J. phoenicea and evaluate their antioxidant, antibacterial, and antifungal activities. Potential interactions between the extracts and conventional antimicrobial agents were also investigated, alongside molecular docking analyses of selected phytochemicals and in silico predictions of their pharmacokinetic and toxicity profiles. The extracts were prepared by ultrasound-assisted extraction and characterized using ultra-high-performance liquid chromatography–mass spectrometry (UHPLC-MS). Antioxidant activity was assessed using the DPPH radical-scavenging and ferric reducing antioxidant power (FRAP) assays. Antimicrobial activity was evaluated using disk diffusion and minimum inhibitory concentration (MIC) and minimum bactericidal/fungicidal concentration (MBC/MFC) assays. Potential interactions between extracts and conventional antimicrobial agents were examined, while molecular docking was performed using the Schrödinger Glide platform. SwissADME and in silico toxicity prediction tools were used to assess the predicted pharmacokinetic properties and safety profiles of the annotated compounds. UHPLC-MS analysis revealed four compounds in the aqueous extract, five in the ethanolic extract, and eleven in the hydroethanolic extract. The aqueous extract exhibited the strongest antioxidant activity, with a DPPH IC50 of 36.43 ± 2.35 μg/mL and a FRAP value of 1280.00 ± 43.60 μmol Fe2+/L. The ethanolic extract showed the highest antibacterial activity against selected strains, including Klebsiella pneumoniae, Escherichia coli, and Pseudomonas aeruginosa, with MIC values of 0.0670, 0.1340, and 0.0330 g/L, respectively. The hydroethanolic extract displayed moderate antibacterial activity against Staphylococcus aureus and Klebsiella pneumoniae, whereas the aqueous extract showed no detectable antibacterial activity under the conditions tested. The ethanolic extract also exhibited antifungal activity against Candida albicans, with an MIC of 0.2700 g/L and an MFC of 0.5400 g/L. The evaluation of extract and antibiotic combinations suggested potential interactions against certain bacterial strains. Molecular docking identified promising predicted interactions between selected phytochemicals and bacterial DNA gyrase B and fungal sterol 14α-demethylase. Ferulic acid 4-O-glucuronide yielded Glide scores of −6.798 and Apigenin 7-O-glucuronide −8.800 kcal/mol against these respective targets. ADMET predictions revealed compound-dependent pharmacokinetic and toxicity profiles. Overall, these findings highlight the potential of Moroccan J. phoenicea leaf extracts as sources of antioxidant and antimicrobial compounds. Further studies involving compound isolation, experimental target validation, cytotoxicity assessment, and in vivo investigations are required to establish their mechanisms of action, safety, and potential applications.
1. Introduction
Plants are the primary sources of complex chemical compounds; these natural Medicinal plants are important sources of structurally diverse natural products with applications in the pharmaceutical, food, and other industrial sectors. Their biological properties are largely associated with secondary metabolites, including phenolic acids, flavonoids, tannins, terpenoids, and other specialized metabolites. The Mediterranean region is particularly rich in medicinal plant species, many of which have long been used in traditional medicine and continue to attract scientific interest as potential sources of bioactive compounds.
Among these plants, Juniperus phoenicea L., commonly known in Morocco as Arar Al Finiki, belongs to the family Cupressaceae and is widely distributed throughout the Mediterranean region. In Morocco, this species occurs in arid and semiarid environments, including mountainous areas of the Atlas range and regions bordering the Sahara Desert, where it can grow on rocky substrates [1]. The species has a long history of use in Moroccan traditional medicine, particularly for the treatment of gastrointestinal and respiratory disorders and rheumatic complaints. Its leaves are commonly prepared as decoctions for traditional medicinal applications [2,3].
Previous investigations of J. phoenicea have primarily focused on its essential oils and their chemical composition and biological properties. Studies conducted on plant material collected across the Mediterranean basin, including Algeria, France, Morocco, Greece, Spain, Portugal, Italy, and Tunisia, have reported antioxidant and antimicrobial activities associated with these volatile fractions [1,4,5,6]. The antimicrobial properties of J. phoenicea preparations have also been investigated against a range of bacterial pathogens, with minimum inhibitory concentration (MIC) and minimum bactericidal concentration (MBC) values reported in the literature [1,4,5,6]. However, the chemical composition and biological properties of non-volatile constituents may differ substantially from those of essential oils, reflecting differences in chemical structure, polarity, extraction selectivity, and biological activity.
Despite the existing literature on J. phoenicea, the relationship between the non-volatile phytochemical composition of its leaf extracts and their antioxidant, antibacterial, and antifungal activities remains insufficiently characterized. In particular, comparative investigations of aqueous, ethanolic, and hydroethanolic extracts may provide insights into the influence of solvent polarity on phytochemical recovery and biological activity. Furthermore, the potential interactions of these extracts with conventional antimicrobial agents warrant investigation, particularly in view of the increasing need to identify natural products that may complement existing antimicrobial strategies.
Analytical characterization using ultra-high-performance liquid chromatography coupled with mass spectrometry (UHPLC-MS) offers an effective approach for profiling non-volatile plant metabolites. When combined with antioxidant and antimicrobial assays, this technique can help establish associations between phytochemical composition and observed biological effects. Molecular docking can provide additional insights into the potential interactions of selected compounds with biological targets relevant to oxidative stress and microbial growth. Nevertheless, docking scores represent computational estimates and require experimental validation before specific mechanisms of action can be established. Similarly, in silico predictions of absorption, distribution, metabolism, excretion, and toxicity (ADMET) can support the preliminary assessment of compound properties but cannot replace experimental pharmacokinetic and toxicological studies.
Accordingly, the present study aimed to characterize the phytochemical profiles of aqueous, ethanolic, and hydroethanolic leaf extracts of J. phoenicea collected in the High Atlas region of Morocco, near Demnate, and to investigate their antioxidant, antibacterial, and antifungal activities. The study also examined the interactions between selected extracts and conventional antimicrobial agents to assess potential synergistic effects. Finally, molecular docking was used to explore the predicted interactions of selected annotated compounds with bacterial DNA gyrase B, and fungal sterol 14-α-demethylase, while computational ADMET analyses were performed to investigate their predicted pharmacokinetic and toxicity profiles. By integrating chemical profiling, biological assays, and computational approaches, this work provides a comparative assessment of J. phoenicea leaf extracts and a basis for further investigation of their bioactive constituents.
2. Results and Discussion
2.1. Phytochemical Screening
The obtained extraction yields (Table 1) were 16.4%, 12.6% and 7.1% for aqueous, hydroethanolic and ethanolic extracts, respectively. These differences may be attributed to the distinct polarity of the extraction solvents and their ability to solubilize different classes of phytochemicals. Preliminary phytochemical screening of Juniperus phoenicea L. leaves revealed the presence of several classes of secondary metabolites, including tannins, flavonoids, saponins, terpenoids, and steroids (Table 2). These findings are broadly consistent with previous investigations of J. phoenicea, although differences in the reported phytochemical composition have been observed among plant populations and geographical regions.
Table 1.
Extraction yield (%) of J. phoenicea L. leaves.
Table 2.
Phytochemical profile of J. phoenicea L. leave.
For example, an investigation of Algerian J. phoenicea reported the presence of alkaloid salts, coumarins, anthracenosides, steroids, flavonoids, and saponins, whereas tannins and anthocyanosides were not detected [6]. In contrast, a study of Moroccan J. phoenicea leaves identified polyphenols, tannins, flavonoids, sterols, and triterpenes, but reported no alkaloids or saponins [7]. Similarly, investigations of Tunisian J. phoenicea leaves have reported alkaloids, tannins, saponins, anthraquinones, and terpenoids, while glycosides were not detected.
The differences between these reports may reflect variations in geographical origin, environmental conditions, plant development, harvesting time, and sample preparation, as well as differences in the analytical methods and detection limits used. Preliminary phytochemical screening provides useful information about broad metabolite classes; however, these qualitative tests do not establish the identity or concentration of individual compounds. Accordingly, the biological properties of J. phoenicea should be interpreted in conjunction with more detailed chemical characterization and experimental evaluation.
2.2. Total Phenolic Content and Total Flavonoid Content
The total phenolic content (TPC) of the aqueous, ethanolic, and hydroethanolic leaf extracts of J. phoenicea is presented in Figure 1. The aqueous extract exhibited the highest TPC (195.62 ± 3.21 mg GAE/g), followed by the ethanolic extract (180.82 ± 2.17 mg GAE/g) and the hydroethanolic extract (172.34 ± 4.11 mg GAE/g).
Figure 1.
Total phenolic and total flavonoid contents of different solvent extracts of J. phoenicea L. leaves. Data are presented as mean ± SD (n = 3), Significant differences are indicated as * p < 0.05, ** p < 0.01, *** p < 0.001 and **** p < 0.0001 (following Prism’s notation).
The relatively high TPC of the aqueous extract suggests that water efficiently recovered phenolic constituents under the extraction conditions employed. This may be associated with the solubility of polar phenolic compounds, including certain phenolic acids, tannins, and glycosylated flavonoids. Ethanol also extracted substantial amounts of phenolic compounds, whereas the hydroethanolic mixture produced the lowest TPC among the three extracts. These findings indicate that the total recovery of phenolic compounds depended on solvent composition; however, TPC alone does not provide information about the identities or relative contributions of individual constituents.
The values obtained in the present study differ from those reported previously for J. phoenicea. Aqueous extracts of Moroccan leaves were reported to contain 116.35 ± 9.71 mg GAE/g dry extract [8], whereas an ethanolic extract of Algerian J. phoenicea leaves exhibited a TPC of 308 mg GAE/g dry extract [9]. A hydroethanolic extract of Tunisian leaves was reported to contain 70.3 ± 0.20 mg GAE/g dry extract [10]. Although these results indicate substantial variation in the measured phenolic content, direct comparisons should be made cautiously because differences in extraction procedures, analytical protocols, and reporting bases may influence the results.
The total flavonoid content (TFC) followed a different pattern (Figure 1). The hydroethanolic extract exhibited the highest value (66.51 ± 0.25 mg QE/g dry extract), followed by the aqueous extract (64.91 ± 0.29 mg QE/g) and the ethanolic extract (51.75 ± 0.15 mg QE/g). The relatively high TFC of the hydroethanolic extract may reflect the ability of the water–ethanol mixture to solubilize flavonoids with a range of polarities. Water may favor the extraction of highly polar glycosides, whereas ethanol may be more suitable for certain less polar constituents. The effectiveness of a solvent mixture nevertheless depends on the chemical structures of the target compounds and the extraction conditions.
Previous studies have reported a TFC of 11.33 ± 0.05 mg QE/g for a hydroalcoholic extract of Tunisian J. phoenicea [10], 20 mg QE/g for an ethanolic extract of Algerian material [9], and 66.9 mg QE/g for an aqueous extract of Moroccan leaves [8]. The comparatively high TFC observed in the present aqueous and hydroethanolic extracts is consistent with the potential of these solvents to recover flavonoid constituents, although methodological differences must be considered when interpreting the discrepancies among studies.
The variation in TPC and TFC may also be influenced by environmental and agronomic factors, including soil characteristics, altitude, climatic conditions, geographical location, and harvesting season. Abiotic stresses, such as drought, high temperatures, and intense solar radiation, can influence phenylpropanoid metabolism and consequently alter the accumulation of phenolic compounds in plants [11,12]. The differences between the TPC and TFC profiles further indicate that the extraction of total phenolics and flavonoids is not necessarily governed by the same solvent-dependent processes.
Overall, the results demonstrate that J. phoenicea leaves contain appreciable amounts of phenolic and flavonoid constituents, with aqueous and hydroethanolic extraction providing different outcomes depending on the parameter measured. However, the contribution of individual phenolic compounds to the biological activities of the extracts requires further investigation [12].
2.3. Antioxidant Activity
The antioxidant activity of the three J. phoenicea leaf extracts was evaluated using the DPPH radical-scavenging and ferric reducing antioxidant power (FRAP) assays (Figure 2). In the DPPH assay, lower IC50 values indicate stronger radical-scavenging activity, whereas higher FRAP values indicate greater reducing capacity.
Figure 2.
Antioxidant capacity of the three extracts by performing DPPH and FRAP methods. Data are presented as mean ± SD (n = 3). Significant differences are indicated as *** p < 0.001 and **** p < 0.0001 (following Prism’s notation).
The aqueous extract exhibited the strongest antioxidant activity, with a DPPH IC50 of 36.43 ± 2.35 μg/mL and a FRAP value of 1280.00 ± 43.60 μmol Fe2+/L. The hydroethanolic extract showed intermediate activity, with a DPPH IC50 of 49.59 ± 2.11 μg/mL and a FRAP value of 1063.03 ± 68.23 μmol Fe2+/L. The ethanolic extract exhibited the weakest activity of the three extracts, with a DPPH IC50 of 55.91 ± 2.10 μg/mL and a FRAP value of 732.00 ± 35.46 μmol Fe2+/L.
The agreement between the two assays indicates that the aqueous extract displayed both greater radical-scavenging activity and greater ferric-reducing capacity under the experimental conditions. This pattern is consistent with the comparatively high TPC measured in the aqueous extract. Polar constituents recovered by water may contribute to the observed antioxidant response through electron-transfer or radical-scavenging mechanisms. Nevertheless, the contribution of specific compounds cannot be established from these assays alone, and other extract constituents may also influence the measured activity.
Previous studies have likewise reported antioxidant activity in J. phoenicea leaf extracts. An aqueous extract of Moroccan leaves exhibited a DPPH IC50 of 30.74 ± 0.11 μg/mL and a reported FRAP-related value of 46.85 ± 0.42 μg/mL [8]. An ethanolic extract of Algerian leaves was reported to exhibit a DPPH IC50 of 9.8 ± 0.1 μg/mL [9]. Although these studies support the antioxidant potential of J. phoenicea, differences in extraction conditions, assay protocols, reference standards, and units complicate direct comparisons of absolute values.
Taken together, the results indicate that the aqueous extract was the most effective antioxidant preparation among those examined. This finding is particularly relevant because the hydroethanolic extract contained the highest number of detected compounds in the UHPLC–MS analysis. The results therefore suggest that antioxidant activity is not determined solely by the number of detected constituents or the overall flavonoid content. Instead, it may depend on the identities, concentrations, and relative contributions of compounds with different antioxidant properties. Further fractionation and compound-specific assays would be required to establish these relationships.
2.4. UHPLC/MS Analysis
UHPLC-MS profiling revealed differences in the chemical composition of the aqueous, ethanolic, and hydroethanolic extracts of J. phoenicea leaves (Table 3; Figures S1–S3) The compounds reported in the extracts included phenolic acids and their derivatives, flavonoids, flavonoid glycosides, stilbene glycosides, and diterpenoids. Three compounds were reported in both the aqueous and ethanolic extracts and eight in the hydroethanolic extract.
Table 3.
Tentative identification by UHPLC-MS analysis of three J. phoenicea L. extracts.
The aqueous extract exhibited a comparatively limited chemical profile. The reported compounds included the stilbene glycoside Mulberroside A, the isoflavone Formononetin (1-), and 3′-O-methyl-(-)-epicatechin 7-O-glucuronide, together with three additional compounds that were not identified. The presence of glycosylated or glucuronidated constituents is consistent with the ability of water to extract certain polar metabolites. However, the identities of these compounds and their relative abundances should be interpreted according to the level of analytical evidence available for each assignment.
The ethanolic extract contained a different group of detected constituents, including galloyl glucose, a hydrolysable tannin-related compound; ferulic acid 4-O-glucuronide, a phenolic acid derivative; 5,6,7,3′,4′-pentahydroxyisoflavone; and apigenin 7-O-glucuronide, with one additional compound that was not identified. These findings suggest that ethanol recovered a chemically distinct set of compounds compared with water. The occurrence of these constituents may be relevant to the biological activity observed for the ethanolic extract, although their individual contributions cannot be determined from the profiling data alone.
The hydroethanolic extract exhibited the largest number of reported compounds. Its profile included apigenin 7-O-apiosyl-glucoside, galloyl glucose, ferulic acid 4-O-glucuronide, procyanidin dimer B1, p-coumaric acid 4-O-glucoside, dihydrocaffeic acid 3-O-glucuronide, carnosic acid, and chrysoeriol 7-O-glucoside. The broader profile suggests that the combination of water and ethanol enabled the extraction of a wider range of compounds under the conditions used.
These differences highlight the influence of solvent composition on the chemical profile of plant extracts. The hydroethanolic mixture may provide a balance of solvent properties that facilitates the recovery of compounds spanning a range of polarities, whereas water and ethanol alone may favor different subsets of constituents. However, the number of detected compounds should not be equated with extraction yield or total metabolite abundance. The number of features detected by UHPLC–MS also depends on ionization efficiency, chromatographic separation, matrix effects, and data-processing and identification criteria.
The chemical profiles reported here are broadly comparable with previous studies of J. phoenicea, although differences in the individual compounds tentatively identified have been described. Ferulic acid 4-O-glucuronide, a p-coumaric acid derivative, and procyanidin dimer B1 have previously been reported in hydroethanolic extracts of Moroccan leaves [13]. In Algerian J. phoenicea, other reported constituents included 3-p-coumaroylquinic acid, quercetin-O-pentoside, myricetin-O-pentoside, and apigenin-6-C-glucoside [14]. A study of methanolic extracts of Tunisian leaves reported quercetin 3-O-glycoside, amentoflavone, and quercetin 3-O-pentoside [15].
The differences between the present findings and previous reports may be related to geographical origin, environmental conditions, plant material, extraction solvent, and analytical methodology. In particular, the polarity and composition of the extraction solvent can influence which constituents are recovered, while differences in chromatographic and mass-spectrometric conditions may affect their detection and annotation.
The chemical profiles also provide a basis for discussing the differences in antioxidant activity among the extracts. The aqueous extract contained the highest TPC and showed the strongest antioxidant activity, while the hydroethanolic extract contained the largest number of detected compounds and exhibited intermediate antioxidant activity. Previous studies have reported antioxidant properties for several classes of phenolic compounds, including epicatechin derivatives and stilbene glycosides [16,17,18,19,20]. Nevertheless, the tentative identification of compounds previously reported to exhibit antioxidant activity should not be interpreted as evidence that these compounds contribute to the antioxidant activity observed in the crude extract. In the absence of quantitative data on their abundance and experimental validation of their individual or combined activities, any association between the tentatively identified compounds and the observed antioxidant effects remains speculative. Therefore, these findings should be regarded as preliminary indications of potentially relevant constituents rather than evidence of a direct compound–activity relationship.
Overall, UHPLC-MS profiling revealed solvent-dependent differences in the tentatively annotated constituents of J. phoenicea leaf extracts. These differences may help explain the distinct biological profiles observed among the extracts, but the relationships between individual compounds and biological activity remain to be established experimentally.
2.5. Antibacterial Activity Test
2.5.1. Evaluation of Antibacterial Activity
The antibacterial activity of the three J. phoenicea leaf extracts was evaluated against the tested bacterial strains using the disk-diffusion assay. The results varied according to both the extract and the bacterial strain (Table 4 and Figure 3).
Table 4.
Antibacterial effect of extracts and commercial antibiotics on the indicator bacteria in millimeters.
Figure 3.
Inhibition zone of samples against S. aureus ATCC 29213 (A), K. pneumoniae CIPA22 (B), E. coli ATCC 25922 (C), E. coli ESBL (D), and carbapenem-resistant P. aeruginosa 104 (E); J1: aqueous extract, J2: hydroethanolic extract, J3: ethanolic extract.
The aqueous extract (J1) did not produce detectable inhibition against any of the tested bacteria under the experimental conditions. In contrast, the hydroethanolic extract (J2) exhibited selective antibacterial activity, with inhibition-zone diameters of 14.00 ± 1.00 mm against Staphylococcus aureus and 12.33 ± 0.57 mm against Klebsiella pneumoniae. No inhibition was observed against the other strains tested.
The ethanolic extract (J3) displayed a broader antibacterial profile, producing inhibition zones against several of the tested strains. Notable activity was reported against K. pneumoniae CIPA22, ESBL-producing Escherichia coli, and Pseudomonas aeruginosa PA104. Inhibition was also observed against S. aureus ATCC 29213 and E. coli ATCC 25922, although the magnitude of the response varied among strains.
The differences in antibacterial activity indicate that extraction solvent composition influenced the biological properties of the resulting preparations. The lack of detectable activity for J1, despite its relatively high phenolic content and strong antioxidant activity, suggests that antioxidant capacity does not necessarily predict antibacterial efficacy. Likewise, the broader chemical profile of J2 did not translate into greater antibacterial activity than that observed for J3. These findings suggest that antibacterial activity may depend on the identities and concentrations of particular constituents, their accessibility to bacterial cells, and possible interactions among extract components.
The activity observed against selected bacterial strains, including an ESBL-producing E. coli isolate, is noteworthy. However, inhibition-zone measurements alone do not establish the potency of an extract relative to standard antibiotics or demonstrate clinical efficacy. The results should therefore be interpreted alongside the MIC and MBC measurements presented below.
2.5.2. Determination of the Minimum Inhibitory and Bactericidal Concentration
The MIC and MBC measurements provided further information on the antibacterial activity of the hydroethanolic (J2) and ethanolic (J3) extracts (Table 5). In general, the results confirmed the differences observed in the disk-diffusion assay, with J3 showing activity against a broader range of bacterial strains.
Table 5.
Minimum inhibitory and bactericidal concentrations (g/L) of the extracts against the indicator bacteria.
J3 exhibited activity against both reference and ESBL-producing E. coli strains, with the reported MIC and MBC values indicating inhibition and, where the MBC data confirmed it, bactericidal effects. Activity against an ESBL-producing isolate is of particular interest because this phenotype is associated with resistance to several β-lactam antibiotics. Nevertheless, the results obtained with a single resistant isolate cannot be generalized to all ESBL-producing strains.
Both extracts exhibited bactericidal activity against S. aureus, with lower MIC and MBC values reported for J3 than for J2. J3 also showed pronounced activity against K. pneumoniae CIPA22. The reported MIC and MBC results indicated a particularly strong response to J3, while J2 exhibited weaker activity against this strain. The quantitative data also supported the activity of J3 against P. aeruginosa PA104, a species associated with multiple intrinsic and acquired resistance mechanisms.
The comparatively stronger antibacterial activity of J3 is consistent with the results of the disk-diffusion assay. However, the chemical profile alone does not establish the mechanism responsible for this difference. Although several compounds were detected in both ethanolic and hydroethanolic extracts, the extracts may differ in the concentrations of individual constituents, the presence of compounds not detected under the analytical conditions, and interactions among their components.
The observed antibacterial effects are broadly consistent with previous studies reporting antimicrobial activity for J. phoenicea preparations [1,4,5,6,13,14,21,22,23]. Alhadad et al. [24], for example, reported lower antibacterial activity for an aqueous leaf extract of Libyan J. phoenicea than for methanolic and acetone extracts, with no activity against P. aeruginosa. Conversely, aqueous fruit extracts collected in Tunisia have been reported to inhibit E. coli, S. aureus, P. aeruginosa, and K. pneumoniae [25]. These differences may be related to geographical origin, plant part, extraction procedure, extract concentration, bacterial strain, and assay conditions.
Chelouati et al. [13] reported antibacterial activity for 70% hydroethanolic extracts of J. phoenicea leaves and fruits against E. coli, S. aureus, and K. pneumoniae. Ghouti et al. [14] also reported activity for hydroethanolic and infusion extracts. Collectively, these studies support the potential of J. phoenicea as a source of antimicrobial constituents while illustrating the variability of activity among preparations.
The present results further suggest that the antibacterial efficacy of a plant extract cannot be inferred solely from the total number of detected phytochemicals. J3 showed stronger antibacterial activity than J2 despite the smaller number of compounds reported in its UHPLC–MS profile. This observation highlights the importance of compound-specific activity and concentration, as well as potential additive or synergistic interactions within the extracts. Further investigations using isolated compounds and standardized extract preparations are needed to establish the chemical basis of the observed activity.
2.5.3. Interactions Between Extracts and Antibiotics
The interactions between the hydroethanolic (J2) and ethanolic (J3) extracts and selected antibiotics were investigated using the checkerboard method, with the fractional inhibitory concentration index (FICI) used to characterize the interactions (Table 6). The results varied according to the bacterial strain and the combination tested, with synergistic interactions observed for selected extract–antibiotic combinations.
Table 6.
Type of interaction between extracts and antibiotics against the indicator bacteria.
Against S. aureus, the combination of amoxicillin/clavulanic acid with either J2 or J3 produced a reported FICI of 0.375, indicating synergy according to the interpretive criteria used in this study. This finding suggests that the combined preparations inhibited bacterial growth at concentrations lower than those required when the agents were evaluated individually.
J3 also showed synergistic interactions with amoxicillin/clavulanic acid against the ESBL-producing E. coli strain and P. aeruginosa PA104. These results indicate that the antibacterial effects of the extract and antibiotic were enhanced under the tested conditions. However, the experiments do not establish the molecular mechanism responsible for the observed interactions or demonstrate that the extract reverses antibiotic resistance.
A pronounced interaction was also reported for the combination of gentamicin with J2 or J3 against K. pneumoniae CIPA22. The reported reduction in the MIC of gentamicin, reaching a 64-fold change in the presence of J3, suggests substantial potentiation under the experimental conditions. Such an effect may warrant further investigation, particularly against additional bacterial isolates. However, any proposed explanation involving the inhibition of resistance mechanisms remains hypothetical unless supported by dedicated mechanistic experiments.
In contrast, the combination of J3 with tobramycin against E. coli ATCC 25922 was excluded from the FICI analysis because the experimentally determined MIC of tobramycin (0.0000228 g/L) was below the established CLSI quality-control range. Further validation under standardized testing conditions is therefore required to confirm this result.
The observed interactions are of interest because some plant-derived compounds can influence bacterial membrane properties, enzyme activity, efflux systems, or other processes involved in antimicrobial susceptibility [26,27]. Nevertheless, the present data establish the interaction phenotype rather than its underlying mechanism. Additional studies should determine whether the observed effects are reproducible across multiple isolates and whether they are associated with changes in antibiotic uptake, target accessibility, efflux activity, or other relevant processes.
Overall, the checkerboard results indicate that selected J. phoenicea extracts can enhance the activity of certain antibiotics in vitro. These findings provide a rationale for further investigation but do not, by themselves, establish therapeutic efficacy, safety, or a reduction in the emergence of antimicrobial resistance.
2.5.4. Interactions Between Extracts
The interaction between the hydroethanolic (J2) and ethanolic (J3) extracts was evaluated against selected bacterial strains using the checkerboard method (Table 7). The results differed according to the organism tested.
Table 7.
Interaction between extracts J2 and J3.
Against S. aureus ATCC 29213, the combination of J2 and J3 produced a FICI of 0.3, indicating a synergistic interaction according to the study’s interpretive criteria. The reported results showed a reduction in the concentrations of both extracts required to inhibit bacterial growth when they were combined. This finding suggests that the two preparations may contain constituents with complementary antibacterial effects. However, the individual compounds responsible for the interaction have not been established.
In contrast, the interaction against K. pneumoniae CIPA22 was classified as additive, with a reported FICI of 1.063. Although the MIC of J3 decreased by a factor of 16 in the combined preparation, the overall FICI did not meet the criterion for synergy. This distinction is important because a substantial reduction in the MIC of one component does not, on its own, establish a synergistic interaction; the FICI must be interpreted using the combined contributions of both extracts.
Previous studies of J. phoenicea have largely evaluated extracts or essential oils individually, or investigated their combinations with conventional antimicrobials or other formulation components [22,23,28,29] (Table 8). To the best of our knowledge, the present investigation extends this work by evaluating the interaction between crude hydroethanolic and ethanolic leaf extracts using the checkerboard method.
Table 8.
Comparative antibacterial activity of Juniperus phoenicea preparations reported against selected bacterial pathogens.
The synergistic interaction observed against S. aureus is therefore a potentially interesting finding, although its reproducibility and chemical basis require further investigation. Bioassay-guided fractionation, testing of isolated compounds, and additional combination assays could help determine whether the interaction arises from specific metabolites or from broader differences in extract composition.
The antibacterial results collectively demonstrate that the biological activity of J. phoenicea leaf extracts depends on both the extraction solvent and the bacterial strain. J3 showed the broadest antibacterial activity, while the combination of J2 and J3 produced synergy against S. aureus but only an additive interaction against K. pneumoniae. These results support further investigation of the extracts as sources of antimicrobial constituents, while emphasizing the need for mechanistic studies and broader biological validation.
The stronger antibacterial activity of J3, despite the greater number of compounds reported in J2, suggests that activity depends on more than the richness of the chemical profile. Potentially relevant constituents detected in J3 included 5,6,7,3′,4′-pentahydroxyisoflavone, and apigenin 7-O-glucuronide. However, their contribution to the observed antibacterial activity remains unconfirmed. Although flavonoids and related phenolic compounds have been associated with antibacterial effects through several proposed mechanisms, including membrane perturbation and interference with bacterial enzymes and biofilm formation [26,27], direct testing of the annotated compounds is required to establish their individual effects.
Consequently, the extracts should be regarded as promising subjects for further in vitro investigation rather than established therapeutic adjuvants. Cytotoxicity testing, mechanistic studies, and subsequent in vivo evaluation will be necessary before any conclusions can be drawn about their suitability for pharmaceutical applications.
2.6. Antifungal Activity
2.6.1. Evaluation of Antifungal Activity
The antifungal activity of the J. phoenicea leaf extracts was evaluated against the filamentous fungi Aspergillus flavus MW741887, Aspergillus niger MTCC 282, and Fusarium proliferatum OP820542, as well as the yeast Candida albicans ATCC 10231 (Figure 4 and Table 9).
Figure 4.
Antifungal effect of the extracts against Fusarium proliferatum OP820542 (A), Aspergillus flavus MW741887 (B), Aspergillus niger MW741887 (C), and Candida albicans ATCC10231 (D), J1: aqueous extract, J2: hydroethanolic extract, J3: ethanolic extract.
Table 9.
Effect of the extracts and conventional antifungals against different fungal strains.
None of the extracts produced detectable inhibition of the three filamentous fungi under the experimental conditions, whereas the positive controls 1% clotrimazole, 1% sulconazole nitrate, and 1% pyrithione, as specified in the experimental protocol, showed inhibition. These findings indicate that the extracts were not effective against the tested filamentous fungi at the concentrations and under the conditions examined.
The absence of detectable activity may reflect differences in fungal susceptibility, the composition of the extracts, or the ability of their constituents to reach and affect cellular targets. However, the results do not establish a specific resistance mechanism. Although fungal cell-wall components, including chitin and β-glucans, contribute to cell integrity and can influence susceptibility to antimicrobial compounds, the contribution of these structural features to the observed lack of activity remains speculative [30,31].
In contrast, the ethanolic extract (J3) exhibited moderate activity against C. albicans ATCC 10231, producing an inhibition-zone diameter of 9.33 ± 1.52 mm (Table 9). The difference between the response of this yeast and that of the tested filamentous fungi suggests that antifungal activity was species-dependent. Differences in cell-envelope structure, physiological characteristics, and susceptibility to individual extract constituents may contribute to this pattern, although further experiments would be required to identify the relevant factors.
The quantitative measurements supported the disk-diffusion findings. J3 exhibited an MIC of 0.2700 g/L and a minimum fungicidal concentration (MFC) of 0.5400 g/L, corresponding to an MFC/MIC ratio of 2 (Table 10). The reported ratio is consistent with a fungicidal effect under the interpretive criterion applied in the study. Nevertheless, the magnitude and reproducibility of this activity should be evaluated in additional experiments before its practical significance can be established.
Table 10.
Minimum inhibitory and fungicidal concentrations (g/L) of the J. phoenicea L. ethanolic extract against Candida albicans ATCC10231.
Overall, the antifungal results indicate selective activity of the ethanolic extract against C. albicans, rather than broad-spectrum activity against all tested fungi. Further investigations should examine the activity of the extract against additional yeast and filamentous fungal isolates and determine whether specific constituents are responsible for the observed response.
2.6.2. Type of Interaction Between Extracts and Commercial Antifungals Against Candida albicans
The interactions between the ethanolic extract (J3) and the tested commercial antifungal agents were evaluated against C. albicans ATCC 10231 (Table 11). The MIC values of the antifungal agents remained unchanged in the presence of J3, and the resulting FICI values were classified as indicating indifferent interactions according to the criteria used in this study.
Table 11.
Interaction between the J3 ethanolic extract and commercial antifungals against Candida albicans.
Thus, although J3 exhibited intrinsic antifungal activity against C. albicans, its combination with the tested antifungal agents did not produce a detectable enhancement of their activity under the experimental conditions. This finding highlights the distinction between the intrinsic activity of an extract and its ability to potentiate conventional antifungal agents.
The observed activity of J3 may be associated with one or more of its constituents. Flavonoids and related phenolic compounds have been investigated for their antifungal effects, with proposed mechanisms including interference with membrane integrity and inhibition of fungal growth [22,32]. However, their individual contributions to the activity of the crude extract cannot be established from the present data.
Direct evidence concerning the antifungal activity of apigenin derivatives have been investigated for their antifungal properties, and a recent study identified apigenin 7-O-glucuronide as a potential candidate against C. albicans [33]. The related compound apigenin-7-O-glucoside has also been reported to exhibit antifungal activity against several Candida strains, with MIC and MFC values ranging from 0.05 to 0.10 mg/mL [34]. Differences in glycosylation may influence biological activity, however, and the activity of one derivative should not be assumed to establish that of another.
The present findings are broadly consistent with reports of moderate antifungal activity for some Juniperus extracts, particularly against C. albicans [13,14]. Other studies have reported stronger antifungal effects for certain Juniperus preparations, particularly essential oils [27,35]. These differences may reflect variation in species, geographical origin, plant part, extraction method, and chemical composition, as well as differences in assay protocols and concentrations tested [36,37].
The absence of synergy between J3 and the tested antifungal agents does not negate the extract’s intrinsic antifungal activity. Rather, it indicates that its combination with the specific agents examined did not improve their activity under the conditions tested. Further studies using purified constituents, additional antifungal agents, and a wider panel of fungal isolates would help establish the reproducibility and chemical basis of the observed activity.
2.7. Molecular Docking
According to the in vitro essay hydroethanolic extract show an antibacterial effet also the ethanolic extract with antibacterial and antifungal effect. Molecular docking was performed to investigate the predicted interactions of compounds reported in the two J. phoenicea leaf extracts, namely hydroethanolic (J2), and ethanolic (J3) with three selected molecular targets: Escherichia coli DNA gyrase B, and fungal sterol 14-α-demethylase. The docking calculations were conducted using the Schrödinger Glide platform, and the resulting scores are summarized in Table 12.
Table 12.
Docking results of ligands (annotated compounds of J. phoenicea L. extract) in the targeted enzymatic receptors.
Docking provides a computational approach for examining potential ligand-binding poses and estimating their relative compatibility with selected protein-binding sites. However, docking scores are not experimentally measured binding affinities, and predicted interactions do not demonstrate target inhibition or establish a causal relationship with the biological activity of a crude extract.
2.7.1. Predicted Interactions with E. coli DNA Gyrase B
DNA gyrase is essential for bacterial DNA topology and replication, making it an established target for antibacterial agents. The predicted interactions of selected phytochemicals with the E. coli DNA gyrase B binding site are presented in Table 12.
Among the compounds examined, ferulic acid 4-O-glucuronide yielded a Glide score of −6.798 kcal/mol,5,6,7,3′,4′-pentahydroxyisoflavone at −6.743 kcal/mol, and galloyl glucose at −5.713 kcal/mol. Co-crystalized ligand (B46) of DNA gyrase B, used as the reference compound, yielded a reported score of −8.883 kcal/mol. Among the plant-derived compounds, ferulic acid 4-O-glucuronide produced the most favorable docking score, which was numerically close to that of the reference compound.
The predicted interactions suggest that these phytochemicals may be accommodated within the modeled binding site. However, a docking score values suggest that the selected compounds could be accommodated within the modeled binding site, although their predicted scores were less favorable than that of the B46 and does not establish comparable antibacterial potency, and the compounds cannot be classified as gyrase inhibitors without experimental evidence of target engagement or enzyme inhibition.
The two-dimensional interaction analysis indicated that Ferulic acid 4-O-glucuronide was reported to form hydrophobic contacts with Ile94, Ala90, Ala53, Ala47, Val43, Val120, Ile78, Pro78, Val167 and Phe104, and hydrogen-bond contacts involving Lys103, Asp73, Asn46 and Arg76 (Figure 5A). Galloyl glucose formed predicted hydrophobic contacts with Pro79, Ile78, Val111, Ala47 and Ile94, and hydrogen bonds involving Asp73, Phe104 and Asn46, together with a reported π– cation interaction involving Arg76 (Figure 5B) Table 13.
Figure 5.
2D and 3D interaction of (A) Ferulic acid 4-O-glucuronide and (B) Galloyl glucose and Gyrase B (3G7E).
Table 13.
Predicted binding interactions of the selected compounds with E. coli (PDB:3G7E) and sterol 14-α -demethylase (PDB:5FSA): hydrogen-bond residues (Donor-acceptor distances in Å) and hydrophobic/π-interaction.
Ferulic acid 4-O-glucuronide and galloyl glucose were reported in both the ethanolic and hydroethanolic extracts but were not detected in the aqueous extract. Their distribution may be relevant to the differences in antibacterial activity among the preparations. Nevertheless, the presence of these compounds in the extracts does not establish that they are responsible for the observed activity, and the docking results cannot explain the complete antibacterial profile of the crude extracts. Furthermore, because the experimental antibacterial assays included multiple species, docking against E. coli DNA gyrase B alone cannot explain the activity observed against S. aureus, K. pneumoniae, or P. aeruginosa.
2.7.2. Predicted Interactions with Sterol 14-α-Demethylase
Sterol 14-α-demethylase is involved in fungal sterol biosynthesis and is an established target of several antifungal agents. The predicted interactions of selected phytochemicals with this target were examined to explore potential molecular explanations for the antifungal activity observed against C. albicans.
Apigenin 7-O-glucuronide yielded the most favorable reported Glide score among the selected phytochemicals, at −8.800 kcal/mol, followed by 5,6,7,3′,4′-pentahydroxyisoflavone at −8.161 kcal/mol. Posaconazole, used as the reference compound, yielded a reported score of −10.929 kcal/mol. These values suggest that the selected plant-derived compounds could be accommodated within the modeled binding site, although their predicted scores were less favorable than that of the reference antifungal agent.
The interaction analysis indicated that Apigenin 7-O-glucuronide was reported to form hydrophobic contacts with Ile379, Leu121, Leu376, Phe380, Tyr64, Met508, Phe233, Pro230, Phe228, Phe126 and Ile131, and hydrogen bonds involving Tyr132, Thr118, Gly307 and Tyr505, together with additional π − π stacking interaction involving His377 (Figure 6A). 5,6,7,3′,4′-Pentahydroxyisoflavone was reported to form hydrophobic contacts with Leu376, Ile379, Leu121, Phe126, Phe228, Pro230, Phe233, Tyr505 and Met508, and hydrogen bonds involving His377, Ser378 and Tyr132, together with a reported π – π stacking interaction involving Tyr118 and His377 Table 13 (Figure 6B).
Figure 6.
2D and 3D interaction of (A) Apigenin 7-O-glucuronide, (B) 5,6,7,3′,4′-Pentahydroxyisoflavone and Sterol 14-α-demethylase (CYP51).
These predicted interactions suggest possible compatibility between the selected ligands and the modeled protein-binding site. However, the docking analysis does not demonstrate inhibition of sterol 14α-demethylase, disruption of fungal sterol biosynthesis, or a direct effect on membrane integrity. Such mechanisms would require experimental validation, for example through enzyme-inhibition studies or analysis of fungal sterol composition.
The three compounds were reported in the ethanolic extract but not in the aqueous or hydroethanolic extracts. Their presence may be relevant to the selective antifungal activity of J3 against C. albicans. Nevertheless, this relationship remains hypothetical because the individual compounds were not tested independently, and the absence of detectable activity against the tested filamentous fungi indicates that the biological effects of the extracts are not uniform across fungal species.
Overall, molecular docking identified several phytochemicals with favorable predicted interactions with the selected targets. These results provide a basis for prioritizing compounds for subsequent experimental investigation but should not be interpreted as evidence that the compounds directly inhibit the proteins or are responsible for the observed biological activities. Future work should include target-specific enzyme assays, evaluation of isolated compounds, and appropriate controls to determine whether the predicted interactions have functional significance.
2.8. ADMET Predictions
2.8.1. Predicted Absorption, Distribution, Metabolism, and Excretion Properties
The predicted absorption, distribution, metabolism, and excretion (ADME) properties of the compounds reported in the aqueous, ethanolic, and hydroethanolic extracts are summarized in Table 14. The molecular weights ranged from 267.26 to 639.58 Da, indicating that the investigated compounds encompassed both relatively small molecules and larger glycosylated derivatives.
Table 14.
ADME properties of annotated compounds of J. phoenicea L. extracts.
The predicted XlogP3 values ranged from −2.82 to 4.89, reflecting substantial variation in lipophilicity. Compounds with negative XlogP3 values are predicted to be relatively hydrophilic, whereas higher values indicate greater lipophilicity. The variation in these values is consistent with differences in molecular structure, including the number of hydroxyl groups and the presence of sugar or glucuronide moieties. Carnosic acid exhibited the highest predicted lipophilicity among the compounds examined.
Lipinski’s rule of five was used to assess selected physicochemical properties associated with oral drug-likeness. Ferulic acid 4-O-glucuronide, p-coumaric acid 4-O-glucoside, 5,6,7,3′,4′-pentahydroxyisoflavone, Formononetin (1-), and carnosic acid were reported to show no violations. Galloyl glucose and dihydrocaffeic acid 3-O-glucuronide showed one violation. Apigenin 7-O-glucuronide, chrysoeriol 7-O-glucoside, and 3′-O-methyl-(-)-epicatechin 7-O-glucuronide showed two violations, whereas apigenin 7-O-apiosyl-glucoside, procyanidin dimer B1 and Mulberroside A showed three violations.
The reported violations were mainly associated with molecular weight and the numbers of hydrogen-bond donors and acceptors. These properties can influence membrane permeability and oral absorption. However, Lipinski’s rule is a screening heuristic rather than a definitive predictor of bioavailability, particularly for natural products and glycosylated compounds. Compliance with the rule does not establish drug suitability, and violations do not necessarily preclude biological activity or further investigation.
The predicted topological polar surface area (TPSA) ranged from 62.50 to 250.59 Å2. Formononetin (1-) exhibited the lowest TPSA (62.50 Å2), whereas apigenin 7-O-apiosyl-glucoside, procyanidin dimer B1 and Mulberroside A showed relatively high values. Higher TPSA values generally indicate greater molecular polarity and may be associated with reduced passive membrane permeability. Consistent with this relationship, the highly polar compounds were predicted to have low gastrointestinal absorption, whereas Formononetin (1-) was predicted to have more favorable gastrointestinal absorption.
The blood–brain barrier (BBB) predictions indicated that Formononetin (1-) was the only compound classified as BBB-permeable by the model. This result should be interpreted as a computational prediction rather than evidence of actual brain exposure. Experimental permeability studies and pharmacokinetic measurements would be required to confirm whether any of the compounds can cross the BBB in vivo.
The predicted ESOL LogS values ranged from −0.93 to −5.14. Galloyl glucose showed the highest predicted aqueous solubility, with an ESOL LogS value of −0.93, whereas procyanidin dimer B1 showed the lowest predicted solubility, at −5.14. These predictions suggest that the compounds differ substantially in their potential aqueous solubility, which may affect their formulation and experimental handling. However, predicted solubility does not necessarily correspond to measured solubility under the conditions used in biological assays.
Overall, the ADME predictions revealed substantial variation in the physicochemical properties of the reported compounds. Although several compounds displayed predicted properties consistent with conventional drug-likeness criteria, these computational descriptors cannot establish their bioavailability or suitability for pharmaceutical development. Experimental solubility, permeability, metabolic stability, and pharmacokinetic studies would be required to substantiate the predictions.
2.8.2. Predicted Toxicity Properties
The in silico toxicity predictions for the compounds tentatively identified in the three extracts are summarized in Table 15. The model outputs included predicted hepatotoxicity, mutagenicity, cytotoxicity, carcinogenicity, immunotoxicity, and acute toxicity estimates.
Table 15.
Toxicity profile prediction of annotated compounds of J. phoenicea L. extracts.
None of the compounds was predicted to be hepatotoxic according to the models and thresholds applied. However, mutagenicity alerts were observed for 5,6,7,3′,4′-pentahydroxyisoflavone, with a prediction probability of 0.51. Furthermore, Carcinogenicity alerts were also reported for 5,6,7,3′,4′-pentahydroxyisoflavone, and Formononetin (1-), with prediction probabilities of 0.68, 0.52, respectively.
Positive immunotoxicity predictions were reported for 8 of the 13 compounds examined. These results indicate that the predicted safety profile was not uniformly favorable across all endpoints. The carcinogenicity, cytotoxicity, and immunotoxicity outputs should therefore be considered when prioritizing compounds for further investigation.
The predicted median lethal dose (LD50) values ranged from 287 to 5000 mg/kg. Carnosic acid exhibited the lowest predicted LD50, at 287 mg/kg, and was assigned to toxicity class 3. Mulberroside A showed a predicted LD50 of 1380 mg/kg and was assigned to toxicity class 4. The remaining compounds were assigned to toxicity class 5, with predicted LD50 values ranging from 2260 to 5000 mg/kg.
These values are model-derived estimates and should not be interpreted as experimentally determined toxicity thresholds. Moreover, predicted acute toxicity cannot establish the safety of the compounds under repeated exposure or in particular formulations. Similarly, the absence of a predicted hepatotoxicity or mutagenicity alert does not demonstrate that a compound is safe, while a positive computational alert does not, by itself, establish that the compound is toxic.
Taken together, the ADMET results identify differences in predicted pharmacokinetic and toxicity properties that may help guide the selection of compounds for future study. However, the positive toxicity alerts, particularly those concerning cytotoxicity, carcinogenicity, and immunotoxicity, preclude a general conclusion that all compounds have favorable safety profiles. Experimental cytotoxicity assays, appropriate genotoxicity testing, and further toxicological evaluation will be necessary before any pharmaceutical or other applied use can be considered.
3. Materials and Methods
3.1. Collection of Plant Material
Juniperus phoenicea L. was collected from Demnate, Morocco (31°43′40.0″ N; 6°58′ 41.4″ W and altitude 968 m above sea level) (Figure 7). The plant was collected in May 2023 and kept at room temperature and in darkness. It was identified by Pr. Aït Babahamd, Faculty of Sciences Semlalia, Cadi Ayyad University. A voucher specimen was deposited in the herbarium under N° MARK 14869.
Figure 7.
(A) photograph of Juniperus phoenicea L. collected from Demnate, Morocco (31°43′40.0″ N; 6°58′41.4″ W) (personal image taken in May 2023). A: tree in original place; (B): Branches; (C): fruit.
3.2. Preparation of Extracts
The extracts were prepared from shade dried leaves (30 g each) using ultrasonic waves (frequency of 40 kHz, at 25 °C.) with Ethanol (95%), water, and Ethanol-Water (50/50 v/v) separately. The extracts were subsequently filtered and concentrated under reduced pressure at 50 °C on a Rotavapor®. The resulting extracts were used for further analyses. The extraction yield (%) was calculated as the ratio of the dry extract weight to the initial dry plant weight (w/w × 100).
3.3. Phytochemical Screening
Phytochemical characterization of secondary metabolites was performed via specific coloration, turbidity, and precipitation tests following standard literature procedures [38,39,40].
The qualitative tests of the phytochemical screening were performed as follows:
- Detection of flavonoids: The presence of flavonoids was determined using concentrated (conc.) HCl and an alcoholic test. A small amount of alcoholic sample solution and 2–3 drops of conc. HCl were added, which was immediately followed by the development of a red color. The presence of flavonoids is indicated by this color change.
- Detection of alkaloids: The presence of alkaloids was determined using Dragendorff’s test. A small amount of sample was placed on a watch glass, and a few drops of conc. HCl were added to it and stirred. Then, one drop of Dragendorff’s reagent was added to the mixture. The presence of alkaloids is indicated by a brick-red precipitate.
- Detection of steroids: Steroids potentially present in the different extracts were detected according to the Liebermann-Burchard’s test. A few mg of sample in chloroform was placed in a test tube, and 1–2 drops of conc. sulfuric acid were added. Then, 2–3 drops of acetic anhydride were added. A light green color was observed at the junction of the two layers, by which the presence of steroids is confirmed.
- Detection of Terpenoids: 5 mL of ethanol extract was mixed with 2 mL of chloroform, followed by the careful addition of 3 mL of concentrated H2SO4. A layer of reddish-brown coloration was formed at the interface, by which a positive result for the presence of terpenoids is indicated.
- Detection of tannins: 1 mL of 5% ferric chloride solution was added to 5 mL of the crude extract. The appearance of orange precipitation in the mixture indicates the presence of tannins.
- Detection of saponin: 1 mL of the aqueous sample solution was added to 19 mL of distilled water. Then shake it for 15 min. We observed 1 cm of foam on the liquid layer, which confirms the presence of saponins.
For the quantitative analysis, the total content of flavonoids and polyphenols was determined according to methods described in the literature.
- Determination of total phenolic content; Total phenolic content in the leave extracts (Ethanolic, Aqueous and Ethanol-Water (v/v)) from J. phoenicea L. was measured using the Folin–Ciocalteu reagent method as described by Pinelo et al. [41]. The total phenolic content was expressed as mg of Gallic acid equivalent (GAE) per gram of dry extract of the sample (R2 = 0.987). The experiment was done in triplicate.
- Determination of total flavonoid content; Total flavonoid content of the different extracts of J. phoenicea L. leaves was determined using the method as described by Chang et al. [42]. The flavonoid content was calculated from the calibration curve and expressed as quercetin equivalents (mg of QE per gram of dry extract) (R2 = 0.995). The experiment was performed in triplicate.
3.4. Antioxidant Properties
3.4.1. DPPH Activity
The antioxidant activity of the extract was determined by the 1,1-diphenyl-2-picrylhydrazyl (DPPH) assay, as described earlier with some modifications [43]. Briefly, 200 µL of each extract was mixed with 3.8 mL DPPH solution and incubated in the dark at room temperature for 1 h. The absorbance of the mixture was then measured at 517 nm. Ascorbic acid was used as a positive control. The ability of the sample to scavenge DPPH radical was determined as:
3.4.2. Ferric Reducing Antioxidant Power Assay (FRAP)
The determination of ferric reducing antioxidant power (FRAP assay) was performed as described earlier [44]. 0.1 mL of extract (at concentration of 1 mg/mL) and 3 mL of FRAP reagent were added. The mixture was incubated in an aqueous bath for 30 min at 37 °C, and the absorbance was measured at 593 nm using a calibration curve with solutions of FeSO4 prepared at concentrations ranging from 200 to 1000 μmol/L (y = 0.002x + 0.0625; R2 = 0.9907).
3.5. LCMS Analysis
The three J. phoenicea L. leave extracts were subjected to UHPLC/MS analysis to identify the phenolic compounds. using the Outaki et al.’s method [45].
An Acquit system (Waters, Milford, MA, USA) with a quaternary pump, autosampler, and column oven was used in the experiment. A C18 reversed-phase column (250 × 4.6 mm, with 2.6 μm particles) supplied by Thermo-Fisher Scientific (San Jose, CA, USA) was used in the proposed procedure. Two solvents, Solvent A (a 0.1% formic acid aqueous solution) and Solvent B (methanol), were used to create a gradient for the separation. With a mobile phase flow rate of 0.5 mL/min, the gradient was constructed as a multistep gradient. The Xevo TQD, also from Milford, MA, USA, served as the triple quadrupole mass spectrometer. It was equipped with a heated electrostatic spray (H-ESI) ionization source, operating in negative mode. The temperatures for the ion transfer tube and the H-ESI vaporizer were both set to 250 °C, and the electrospray voltage was adjusted to 3500 V. The system operated in complete scan mode in Q1, capturing mass-to-charge ratios (m/z) ranging from 50 to 1000.
3.6. Antibacterial Activity
3.6.1. Evaluation of Antibacterial Activity
The in vitro evaluation of the antibacterial activity of the different J. phoenicea L. leave extracts was carried out using the disk diffusion method [46], against eight bacterial strains: Staphylococcus aureus ATCC 29213, Bacillus subtilis OP861484, Streptococcus sp. CCMM/B24, Escherichia coli ATCC 25922, extended-spectrum beta-lactamase -producing Escherichia coli (ESBL), Pseudomonas aeruginosa ATCC 9721, carbapenem-resistant Pseudomonas aeruginosa 104, and Klebsiella pneumoniae CIP A22.
The aqueous (J1), hydroethanolic (J2), and ethanolic (J3) extracts were prepared at concentrations of 10.5, 16.5, and 8.6 g/L, respectively. A volume of 15 µL for each extract was deposited onto a sterile paper disk (6 mm in diameter) placed on Mueller–Hinton agar (hydrolysate of casein 17.5 g, meat extract 2 g, soluble starch 1.5 g, and bacteriological agar 17 g per liter of distilled water) previously inoculated with 100 µL of bacterial suspension from the tested strains (OD595 nm = 0.5). The plates were incubated at 37 °C for 24 h. Following incubation, the diameters of the inhibition zones were measured in millimeters. All assays were performed in triplicate to ensure reproducibility and reliability of the results.
Commercial antibiotics, including ciprofloxacin (3 mg/mL; 15 µg/disk), tobramycin (3 mg/mL; 15 µg/disk), amoxicillin/clavulanic acid (100/12.5 mg/mL; 500/62.5 µg/disk), tetracycline (25 mg/mL; 125 µg/disk), and gentamicin (40 mg/mL; 200 µg/disk), were individually tested against the bacterial strains as positive controls for preliminary antibacterial screening rather than standardized clinical susceptibility testing. Due to their high stock concentrations, 5 µL of each antibiotic solution was applied per disk, compared with 15 µL for plant extracts. Three negative controls were used in the disk diffusion assay: sterile distilled water, a water-ethanol mixture (v/v), and ethanol, corresponding to J1, J2, and J3 extracts, respectively.
3.6.2. Determination of the Minimum Inhibitory Concentration
The minimum inhibitory concentration (MIC) is defined as the lowest concentration of an antimicrobial agent capable of inhibiting the visible growth of a bacterial strain after incubation [47]. The MIC values of J. phoenicea L. extracts were determined using the broth microdilution method, in accordance with the recommendations of the Clinical and Laboratory Standards Institute (CLSI M07 (12th edition, 2024)).
All J. phoenicea L. leave extracts that showed antibacterial activity in the disk diffusion assay were selected for MIC determination. A series of twofold serial dilutions was prepared for each extract, yielding final concentrations ranging from 8.6 g/L to 0.0021 g/L. Subsequently, 100 µL of each dilution was dispensed into the wells of a 96-well microplate and inoculated with 100 µL of a standardized bacterial suspension (106 CFU/mL) of the tested strains.
After incubation for 24 h at 37 °C, 5 µL of a resazurin solution (0.0001 g/mL) was added to each well, and the plates were further incubated for 2 h at 37 °C [48]. A color change from blue to pink indicated the reduction of resazurin to resorufin, reflecting bacterial growth, whereas wells remaining blue corresponded to inhibitory concentrations.
Commercial antibiotics were used as positive controls, with concentration ranges adjusted for each reference compound. Mueller-Hinton (MH) broth and sterile distilled water served as negative controls.
3.6.3. Determination of the Minimum Bactericidal Concentration
The minimum bactericidal concentration (MBC) corresponds to the lowest concentration of an antibacterial agent capable of killing more than 99.9% of the initial microbial inoculum, implying that fewer than 0.1% of viable bacteria remain [49].
To determine the MBC, a 100 µL aliquot from each purple-stained well showing no visible bacterial growth during the MIC assay was aseptically spread onto Mueller-Hinton (MH) agar plates.
The plates were then incubated at 37 °C for 24 h, after which bacterial colonies were counted. All experiments were performed in duplicate [50].
The type of antibacterial activity exhibited by the tested agent was assessed by calculating the MBC/MIC ratio. According to established criteria, the agent is considered bactericidal when the ratio is ≤4, whereas a ratio > 4 indicates a bacteriostatic effect. Moreover, when the ratio is ≥32, the bacterium is considered to display tolerance to the antibacterial agent [50].
3.6.4. Type of Interaction Between Extracts and Antibiotics
After determining the MICs and MBCs, the types of interaction between the tested extracts and the least susceptible antibiotic were evaluated using the broth microdilution method. A series of antibiotic dilutions was prepared following a twofold geometric progression, ranging from the MIC to MIC/128. Then, 50 µL of each antibiotic dilution was added horizontally to the microplate wells, with each well containing 50 µL of the tested extract arranged vertically at a fixed concentration corresponding to MIC/4. The wells were subsequently inoculated with 100 µL of a bacterial suspension adjusted to 106 CFU/mL of one of the aforementioned strains. After incubation for 24 h at 37 °C, 5 µL of a 0.15% resazurin solution was added to each well, followed by an additional 2 h incubation at 37 °C.
The MIC was defined as the lowest antibiotic concentration, in combination with the extract at MIC/4, that prevented a color change in resazurin.
Each assay included a growth control (bacteria without treatment) and a sterility control (Mueller-Hinton broth, distilled water, and extract alone) [51].
The interaction between the antibiotic and the tested extract was evaluated and quantified by calculating the following parameters:
- The gain corresponds to:
- The fractional inhibitory concentration index (FICI) was calculated using the following formula:where A represents the antibiotic and B the tested extract.
The interpretation of FICI values was based on EUCAST (2000) criteria:
The combination is synergistic if FICI ≤ 0.5; 0.5 < FICI ≤ 1 implies an additive effect, indifference corresponds to 1 < FICI ≤ 2; and FICI > 2 indicates the combination is antagonistic [52].
3.6.5. Combination of Extracts
To evaluate the interaction between extracts exhibiting antibacterial activity, the checkerboard assay was employed according to the protocol described by Kasrati (2014) [53]. Based on found MIC, serial dilutions of each extract were prepared in Mueller–Hinton (MH) broth.
Subsequently, 50 µL of the first extract were dispensed vertically into the wells of the microplate at increasing concentrations, while 50 µL of the second extract was added horizontally, thereby generating different extract combinations in each well. Thereafter, 100 µL of the bacterial suspension of the strain of interest, adjusted to a concentration of 106 CFU/mL, was added to each well. The microplates were incubated at 37 °C for 24 h.
The interaction between the tested extracts was assessed by calculating the fractional inhibitory concentration index (FICI) and the gain in minimum inhibitory concentration (MIC), in accordance with the method described in the previous assay.
3.7. Antifungal Activity
3.7.1. Antifungal Effect Against Molds
The antifungal activity of J. phoenicea L. extracts (ethanolic, hydroethanolic, and aqueous) was evaluated against three pathogenic molds, namely Aspergillus flavus MW741887, Aspergillus niger MTCC282, and Fusarium proliferatum OP820542, according to the protocol of El Abdali et al. [46], with slight modifications. Briefly, using the tip of a Pasteur pipette, a 6 mm diameter disk was excised from a one-week-old culture of the indicator fungi grown on solid Potato Dextrose Agar (PDA) medium (Potato 200 g/L, Dextrose 20 g/L, Agar 15 g/L) supplemented with tetracycline at 25 mg/L according to a modified protocol of Anasa et al. [54]. The disk was then placed at the center of each Petri dish in an inverted position, such that the agar surface faced upward and the fungal mycelium was in contact with the bottom of the Petri dish.
The fungal disk was subsequently surrounded by four sterile disks of 6 mm in diameter, ensuring a distance of 2 cm between these disks and the fungal disk. Thereafter, a volume of 15 µL of each extract stock solution (J1: 10.5 g/L; J2: 16.5 g/L; J3: 8.6 g/L) was deposited onto the sterile disks. The plates were incubated at 28 °C for a period of 7 days.
The percentage of mycelial growth inhibition was calculated using the following formula:
The negative control corresponded to mycelial growth without extract addition, while the positive controls corresponded to the activity of commercially available antifungal agents (clotrimazole at 10 mg/mL, sulconazole nitrate at 10 mg/mL, and pyrithione at 10 mg/mL). This assay was performed in duplicate.
3.7.2. Antifungal Effect Against Candida albicans
The antifungal activity against Candida albicans ATCC10231 was evaluated using the disk diffusion method. Briefly, a volume of 100 µL of the fungal suspension adjusted to an optical density of OD595 nm = 0.5 was uniformly spread onto Petri dishes containing PDA medium supplemented with tetracycline. Subsequently, a volume of 15 µL of each extract stock solution (J1: 10.5 g/L; J2: 16.5 g/L; J3: 8.6 g/L) was deposited onto a sterile 6 mm diameter disk. The plates were incubated at 37 °C for 2 days.
After incubation, the diameters of the inhibition zones around the disks were measured in millimeters. This assay was repeated twice. The negative control consisted of the same preparation without extracts, while the positive controls corresponded to the activity of commercially available antifungal agents (clotrimazole at 10 mg/mL, sulconazole nitrate at 10 mg/mL, and pyrithione at 10 mg/mL) [46].
3.7.3. Determination of MIC and MFC of Plant Extracts Against Candida albicans
The determination of the minimum inhibitory concentration (MIC) and minimum fungicidal concentration (MFC) against Candida albicans ATCC10231 was performed using a modified microdilution method adapted from the bacterial protocol described in Section 3.6.2, with slight adaptations for yeasts. Extracts that showed antifungal activity in the agar diffusion assay were subjected to serial dilutions and then incubated with a standardized suspension of Candida albicans (106 CFU/mL). The MIC was defined as the lowest concentration showing no visible growth after incubation.
For the MFC, a volume of 100 µL taken from the wells without visible growth was plated onto PDA medium. After incubation, colony counts were used to determine the fungicidal concentration [49]. The activity of the extracts was interpreted based on the MFC/MIC ratio: a ratio ≤ 4 indicated a fungicidal effect, while a ratio > 4 indicated a fungistatic effect [50].
3.7.4. Type of Interaction Between Extracts and Commercial Antifungals Against Candida albicans
After determining the MICs and MFCs, the interaction between the tested extracts and commercial antifungals (Clotrimazole 10 mg/mL, Sulconazole nitrate 10 mg/mL, and Pyrithione 10 mg/mL) was evaluated using the broth microdilution method. After prior determination of the MIC for each antifungal alone, a series of twofold serial dilutions was prepared, ranging from the MIC to MIC/128. Next, 100 µL of each antifungal dilution was added horizontally across the microplate wells, each well containing 100 µL of the tested extract arranged vertically at a fixed concentration corresponding to MIC/4. The wells were then inoculated with 100 µL of a Candida albicans suspension (106 CFU/mL). After incubation for 24 h at 37 °C, resazurin was added, and the plates were further incubated for 2 h to assess fungal growth. The MIC in combination was defined as the lowest concentration of antifungal, combined with the extract (MIC/4), that prevented a color change. Growth and sterility controls were included.
The interaction between the antifungal (A) and the extract (B) was determined by calculating the gain and the fractional inhibitory concentration index (FICI), using the same formulas previously applied for extract and antibiotic interactions [51,52].
3.8. Molecular Docking
Molecular docking studies were performed to investigate the binding mode between components found in J. phoenicea L. extracts (J1, J2 and J3) with two enzymes (Escherichia coli gyrase B and sterol 14-alpha demethylase (CYP51) from Candida albicans enzymes) which are key targets in the management of microbial infections. For the selected ligands, all phytocompounds tentatively identified in J. phoenicea L. extract using UHPLC-MS, the structures (SDF) were downloaded from PubChem (http://pubchem.ncbi.nlm.nih.gov, accessed on 13 November 2025). The three-dimensional (3D) structures of Escherichia coli gyrase B (PDB ID: 3G7E), and sterol 14-alpha demethylase (CYP51) from Candida albicans (PDB ID: 5FSA) were downloaded from RCSB Protein Data Bank (http://www.rcsb.org/, accessed on 13 November 2025). The receptor resolutions were set at, 2.20 Å, and 2.86 Å for E. coli gyrase B (3G7E), and sterol 14-alpha demethylase (CYP51) (5FSA). The protein preparation using the protein preparation tool in the Schrödinger Software suite (v. 11.5), and the optimization procedure involved several steps: the addition of hydrogen atoms, assignment of bond orders, removal of water molecules, determination of hydrogen bond networks at a physiological pH range (7 ± 2.00). the default receptor grid box (volumetric spacing of 20 × 20 × 20) was centered on the coordinates of the native co-crystallized ligand for each respective target. The ligands were prepared using LigPrep with OPLS4 force field, and possible ionization state and tautomers were generated at a physiological pH range (7 ± 2.00) using Epik. The prepared ligands were then docked onto this grid box using the Standard Precision method for docking simulations in Schrödinger Maestro (v. 11.5) [46]. To validate the molecular docking protocol, redocking experiments were performed for each target protein (E. coli gyrase B and sterol 14-alpha demethylase) using their respective co-crystallized ligands. The obtained root-mean square deviation (RSMD) values were 0.4466 Å and 0.9277 Å, respectively, indicating good agreement between the predicted binding poses and the experimentally determined ligand conformations.
3.9. ADMET Study
The pharmacokinetics (absorption, distribution, metabolism, and excretion (ADME)) studies were predicted using the ADME tool by a SwissADME online server (http://www.swissadme.ch/, accessed on 12 August 2026). The structures were exported in SMILES format, and then the drug-like and pharmacokinetic properties of the selected compounds were determined as per the developed protocol [55]. As for the toxicity, the ProTox 3.0 webserver (http://tox.charite.de/protox_II, accessed on 12 August 2026) was used to calculate the predictions based on different parameters such as organ toxicity (hepatotoxicity), oral toxicity, and toxicological endpoints (cytotoxicity, mutagenicity, carcinotoxicity, and immunotoxicity) [56].
3.10. Statistical Analysis
Statistical analyses were performed in GraphPad Prism 8.0.1 (GraphPad Software Incorporated, San Diego, CA, USA). One-way analysis of variance (ANOVA) followed by Tukey’s multiple comparison test and an unpaired t-test were used to determine statistically significant differences at p < 0.05, p < 0.01, and p < 0.001.
4. Conclusions
This study provides a comparative phytochemical and biological characterization of aqueous, ethanolic, and hydroethanolic leaf extracts of Juniperus phoenicea L. collected in the High Atlas region of Morocco. The findings demonstrate that extraction solvent influences the phytochemical profiles and biological activities of the resulting extracts. The aqueous extract exhibited the strongest antioxidant activity, as indicated by its DPPH radical-scavenging and FRAP results, whereas the ethanolic extract showed the most promising antibacterial activity and selective antifungal activity against Candida albicans. Synergistic interactions between selected extracts and conventional antibiotics were also observed against specific bacterial strains, although these effects were dependent on the extract–antibiotic combination and the microorganism tested.
UHPLC-MS analysis revealed differences in the number and composition of detected phytochemicals among the three extracts, highlighting the importance of solvent selectivity in recovering potentially bioactive constituents. Molecular docking identified favorable predicted interactions between selected compounds and DNA gyrase B and sterol 14α-demethylase, providing hypotheses for further investigation of their possible antimicrobial mechanisms. However, these computational findings do not establish direct target inhibition or demonstrate that the docked compounds are responsible for the biological activities of the crude extracts.
The ADMET predictions indicated substantial variation in the predicted pharmacokinetic properties and toxicity profiles of the annotated compounds. Although several compounds showed potentially favorable predicted characteristics, the toxicity alerts identified for some constituents highlight the need for a cautious interpretation of their potential applications.
Further research should focus on isolating and characterizing the principal constituents, experimentally evaluating their individual and combined biological activities, validating the proposed molecular targets, and investigating cytotoxicity, pharmacokinetics, and in vivo safety. These studies will be necessary to establish whether J. phoenicea leaf extracts or their constituents have practical potential for pharmaceutical or other antimicrobial applications.
Supplementary Materials
The following supporting information can be downloaded at https://www.mdpi.com/article/10.3390/molecules31224206/s1.
Author Contributions
Conceptualization, L.B.; writing—original draft preparation, Y.R.E., A.N., L.B. and I.Z.; software, Y.R.E.; methodology, Y.R.E. and A.N., L.B. and I.Z.; investigation: L.B., F.C., C.C., I.Z., Y.R.E., A.N. and M.C.; visualization, L.B., F.C., I.Z., M.C. and H.L.; writing—review and editing: L.B., F.C., I.Z., C.C. and M.C.; supervision, L.B. and F.C. All authors have read and agreed to the published version of the manuscript.
Funding
This research received no external funding.
Institutional Review Board Statement
Not applicable.
Informed Consent Statement
Not applicable.
Data Availability Statement
The original contributions presented in this study are included in the article. Further inquiries can be directed to the corresponding author.
Acknowledgments
The authors express their gratitude to all laboratory staff and collaborators who contributed to the execution of the experimental procedures, sample preparation, and technical analyses.
Conflicts of Interest
The authors declare no conflicts of interest.
References
- Bouyahyaoui, A.; Bahri, F.; Romane, A.; Höferl, M.; Wanner, J.; Schmidt, E.; Jirovetz, L. Antimicrobial Activity and Chemical Analysis of the Essential Oil of Algerian Juniperus phoenicea. Nat. Prod. Commun. 2016, 11, 519–522. [Google Scholar] [CrossRef] [Scilit]
- Adams, R.P.; Nguyen, S.; Achak, N. Geographic Variation in Juniperus phoenicea from the Canary Islands, Morocco and Spain, Based on RAPDS Analysis. Phytologia 2006, 88, 270–278. [Google Scholar]
- Bellakhdar, J.; Claisse, R.; Fleurentin, J.; Younos, C. Repertory of Standard Herbal Drugs in the Moroccan Pharmacopoea. J. Ethnopharmacol. 1991, 35, 123–143. [Google Scholar] [CrossRef] [Scilit] [PubMed]
- Meriem, A.; Msaada, K.; Sebai, E.; Aidi Wannes, W.; Salah Abbassi, M.; Akkari, H. Antioxidant, Anthelmintic and Antibacterial Activities of Red Juniper (Juniperus phoenicea L.) Essential Oil. J. Essent. Oil Res. 2022, 34, 163–172. [Google Scholar] [CrossRef] [Scilit]
- Shamsudin, K.J.; Rasolan, N.E.; Ghani, N.A. Phytochemical Composition, Antibacterial and Antifungal Activities of Essential Oil of Juniperus phoenicea from Fez-Meknes Region, North Central Morocco. Trop. J. Nat. Prod. Res. 2023, 7, 5633. [Google Scholar] [CrossRef] [Scilit]
- M’hammed, A.M.; Abdallah, M.; Ahmed, M.; Halima, D. Phytochemistry, Antimicrobial Activities of the Essential Oils of the Branches of Juniperus phoenicea in Bechar (Algeria). Appl. Biol. Sahar. Areas 2017, 1, 1–7. [Google Scholar]
- Amalich, S.; Fadili, K.; Fahim, M.; EL Hilali, F.; Zaïr, T. Polyphenols Content and Antioxidant Power of Fruits and Leaves of Juniperus phoenicea L. from Tounfite (Morocco). Moroc. J. Chem. 2016, 4, 177–186. [Google Scholar] [CrossRef]
- El Jemli, M.; Kamal, R.; Marmouzi, I.; Zerrouki, A.; Cherrah, Y.; Alaoui, K. Radical-Scavenging Activity and Ferric Reducing Ability of Juniperus thurifera (L.), J. oxycedrus (L.), J. phoenicea (L.) and Tetraclinis articulata (L.). Adv. Pharmacol. Sci. 2016, 2016, 6392656. [Google Scholar] [CrossRef] [Scilit] [PubMed]
- Menaceur, F.; Benchabane, A.; Hazzit, M.; Baaliouamer, A. Chemical Composition and Antioxidant Activity of Algerian Juniperus phoenicea L. Extracts. J. Biol. Act. Prod. Nat. 2013, 3, 87–96. [Google Scholar] [CrossRef] [Scilit]
- Zouari Bouassida, K.; Makni, S.; Tounsi, A.; Jlaiel, L.; Trigui, M.; Tounsi, S. Effects of Juniperus phoenicea Hydroalcoholic Extract on Inflammatory Mediators and Oxidative Stress Markers in Carrageenan-Induced Paw Oedema in Mice. BioMed Res. Int. 2018, 2018, 3785487. [Google Scholar] [CrossRef] [Scilit] [PubMed]
- Pant, P.; Pandey, S.; Dall’Acqua, S. The Influence of Environmental Conditions on Secondary Metabolites in Medicinal Plants: A Literature Review. Chem. Biodivers. 2021, 18, e2100345. [Google Scholar] [CrossRef] [Scilit] [PubMed]
- Jangpangi, D.; Patni, B.; Chandola, V.; Chandra, S. Medicinal Plants in a Changing Climate: Understanding the Links between Environmental Stress and Secondary Metabolite Synthesis. Front. Plant Sci. 2025, 16, 1587337. [Google Scholar] [CrossRef] [Scilit] [PubMed]
- Chelouati, T.; Lafraxo, S.; Metouekel, A.; Messkini, M.; Chebaibi, S.E.; Moussaoui, A.E.L.; El Barnossi, A.; Alyami, E.M.; Alghamdi, O.A.; Bin Jardan, Y.A.; et al. Chemical Profiling, Pharmacological Activities, and Toxicity Assessment of Juniperus phoenicea Sp. Turbinata L. Extract: Integrated In Vitro, In Vivo, and In Silico Insights. Food Sci. Nutr. 2026, 14, e71878. [Google Scholar] [CrossRef] [Scilit] [PubMed]
- Ghouti, D.; Rached, W.; Abdallah, M.; Pires, T.C.S.P.; Calhelha, R.C.; Alves, M.J.; Abderrahmane, L.H.; Barros, L.; Ferreira, I.C.F.R. Phenolic Profile and in Vitro Bioactive Potential of Saharan Juniperus phoenicea L. and Cotula Cinerea (Del) Growing in Algeria. Food Funct. 2018, 9, 4664–4672. [Google Scholar] [CrossRef] [Scilit] [PubMed]
- Keskes, H.; Belhadj, S.; Jlail, L.; El Feki, A.; Damak, M.; Sayadi, S.; Allouche, N. LC-MS–MS and GC-MS Analyses of Biologically Active Extracts and Fractions from Tunisian Juniperus phoenicea Leaves. Pharm. Biol. 2017, 55, 88–95. [Google Scholar] [CrossRef] [Scilit] [PubMed]
- Yu, D.-H.; Bao, Y.-M.; Wei, C.-L.; An, L.-J. Studies of Chemical Constituents and Their Antioxidant Activities from Astragalus mongholicus Bunge. Biomed. Environ. Sci. 2005, 18, 297–301. [Google Scholar] [PubMed]
- Yu, D.; Duan, Y.; Bao, Y.; Wei, C.; An, L. Isoflavonoids from Astragalus mongholicus Protect PC12 Cells from Toxicity Induced by L-Glutamate. J. Ethnopharmacol. 2005, 98, 89–94. [Google Scholar] [CrossRef] [Scilit] [PubMed]
- Natsume, M.; Osakabe, N.; Yasuda, A.; Baba, S.; Tokunaga, T.; Kondo, K.; Osawa, T.; Terao, J. In Vitro Antioxidative Activity of (−)-Epicatechin Glucuronide Metabolites Present in Human and Rat Plasma. Free Radic. Res. 2004, 38, 1341–1348. [Google Scholar] [CrossRef] [Scilit] [PubMed]
- Natsume, M.; Osakabe, N.; Yasuda, A.; Osawa, T.; Terao, J. Inhibitory Effects of Conjugated Epicatechin Metabolites on Peroxynitrite-Mediated Nitrotyrosine Formation. J. Clin. Biochem. Nutr. 2008, 42, 50–53. [Google Scholar] [CrossRef] [Scilit] [PubMed]
- Chen, Z.; He, Z.; Qin, J. Natural Deep Eutectic Solvents for the Extraction of Mulberroside A from White Mulberry Root Bark. ACS Omega 2025, 10, 17221–17227. [Google Scholar] [CrossRef] [Scilit] [PubMed]
- Asbabou, A.; Hanane, T.; Gourich, A.A.; Siddique, F.; Drioiche, A.; Remok, F.; Saidi, S.; Adadi, I.; Khamar, H.; Almaary, K.S.; et al. Phytochemical Profile, Physicochemical, Antioxidant and Antimicrobial Properties of Juniperus phoenicea and Tetraclinis Articulate: In Vitro and in Silico Approaches. Front. Chem. 2024, 12, 1397961. [Google Scholar] [CrossRef] [Scilit] [PubMed]
- Seleem, D.; Pardi, V.; Murata, R.M. Review of Flavonoids: A Diverse Group of Natural Compounds with Anti- Candida Albicans Activity In Vitro. Arch. Oral Biol. 2017, 76, 76–83. [Google Scholar] [CrossRef] [Scilit] [PubMed]
- Abdelli, W.; Bahri, F.; Höferl, M.; Wanner, J.; Schmidt, E.; Jirovetz, L. Chemical Composition, Antimicrobial and Anti-Inflammatory Activity of Algerian Juniperus phoenicea Essential Oils. Nat. Prod. Commun. 2018, 13, 223–228. [Google Scholar] [CrossRef] [Scilit]
- Alhadad, A.O.; Salem, G.S.; Hussein, S.M.; Elshareef, S.M. Antibacterial Activity of Libyan Juniperus phoenicea L. Leaves Extracts against Common Nosocomial Pathogens. J. Exp. Biol. Agric. Sci. 2023, 11, 371–379. [Google Scholar] [CrossRef] [Scilit]
- Hayouni, E.A.; Abedrabba, M.; Bouix, M.; Hamdi, M. The Effects of Solvents and Extraction Method on the Phenolic Contents and Biological Activities in Vitro of Tunisian Quercus coccifera L. and Juniperus phoenicea L. Fruit Extracts. Food Chem. 2007, 105, 1126–1134. [Google Scholar] [CrossRef] [Scilit]
- Pepeljnjak, S.; Kosalec, I.; Kalodera, Z.; Blazević, N. Antimicrobial activity of juniper berry essential oil (Juniperus communis L., Cupressaceae). Acta Pharm. 2005, 55, 417–422. [Google Scholar] [PubMed]
- Cabral, C.; Francisco, V.; Cavaleiro, C.; Gonçalves, M.J.; Cruz, M.T.; Sales, F.; Batista, M.T.; Salgueiro, L. Essential Oil of Juniperus communis Subsp. Alpina (Suter) Č Elak Needles: Chemical Composition, Antifungal Activity and Cytotoxicity. Phytother. Res. 2012, 26, 1352–1357. [Google Scholar] [CrossRef] [Scilit] [PubMed]
- Saoudi, Z.; Bouguerra, A.; Saadi, S.; Senoussi, A.; Zidoune, M.N.; Aissaoui, Z.O. Volatile Profile and Antimicrobial Activity of Essential Oil of Juniperus phoenicea L. and Its Combination Effect with Sodium Chloride, Used in Traditional Preparation of Djeld of Bouhezza. Microb. Pathog. 2026, 213, 108364. [Google Scholar] [CrossRef] [Scilit]
- Ismail, P.A.; Elwakil, B.H.; Hagar, M.; Olama, Z.A. Juniperus phoenicea Extract-Loaded Nanostructured Lipid Carriers for Potent Antimicrobial and Anticancer Combination Therapy. AMB Express 2026, 16, 88. [Google Scholar] [CrossRef] [Scilit] [PubMed]
- Shamsudin, N.F.; Ahmed, Q.U.; Mahmood, S.; Adnan, S.; Shah, A.; Khatib, A.; Mukhtar, S.; Alsharif, M.A.; Parveen, H.; Zakaria, Z.A. Antibacterial Effects of Flavonoids and Their Structure-Activity Relationship Study: A Comparative Interpretation. Molecules 2022, 27, 1149. [Google Scholar] [CrossRef] [Scilit] [PubMed]
- Garcia-rubio, R.; De Oliveira, H.C.; Rivera, J.; Niño-vega, G.A.; Hall, R.A. The Fungal Cell Wall: Candida, Cryptococcus, and Aspergillus Species. Front. Microbiol. 2020, 10, 2993. [Google Scholar] [CrossRef] [Scilit] [PubMed]
- Lima, S.L.; Colombo, A.L.; Junior, J.N.D.A. Fungal Cell Wall: Emerging Antifungals and Drug Resistance. Front. Microbiol. 2019, 10, 2573. [Google Scholar] [CrossRef] [Scilit] [PubMed]
- Al Aboody, M.S.; Mickymaray, S. Anti-Fungal Efficacy and Mechanisms of Flavonoids. Antibiotics 2020, 9, 45. [Google Scholar] [CrossRef] [Scilit] [PubMed]
- Mundhe, A.K.; Rajkumari, R. Large-Scale Virtual Screening of 17,967 IMPPAT Phytochemicals Identifies Multiple CDR1 Binders and Reveals Apigenin-7-O-Glucuronide as a Putative CDR1-GSC1 Dual-Target Lead against Candida Albicans with Initial in-Vitro Evidence. Front. Cell. Infect. Microbiol. 2026, 16, 1940083. [Google Scholar] [CrossRef] [Scilit] [PubMed]
- Lafraxo, S.; El Barnossi, A.; El Moussaoui, A.; Bourhia, M.; Salamatullah, A.M.; Alzahrani, A.; Akka, A.A.; Choubbane, A.; Akhazzane, M.; Aboul-Soud, M.A.M.; et al. Essential Oils from Leaves of Juniperus thurifera L., Exhibiting Antioxidant, Antifungal and Antibacterial Activities against Antibiotic-Resistant Microbes. Horticulturae 2022, 8, 321. [Google Scholar] [CrossRef] [Scilit]
- Aljaiyash, A.; Ghanmi, M.; Satrani, B.; Labiad, H.; Echchelh, A.; Chaouch, A. Chemical Composition of Essential Oils of Ripe and Unripe Berries and Leaves of Juniperus phoenicea L. and Determination of Their Antimicrobial Activities. Int. J. Eng. Res. Technol. 2016, 4, 7–14. [Google Scholar]
- Hu, H.; Li, D.; Bai, R.; Zhang, W.; Luo, H.; Yu, E. Chemodiversity and Bioactivity of the Essential Oils of Juniperus and Implication for Taxonomy. Int. J. Mol. Sci. 2023, 24, 15203. [Google Scholar] [CrossRef] [Scilit] [PubMed]
- Haddouchi, F.; Chaouche, T.M.; Halla, N. Screening Phytochimique, Activités Antioxydantes et Pouvoir Hémolytique de Quatre Plantes Sahariennes d’Algérie. Phytothérapie 2018, 16, 254–262. [Google Scholar] [CrossRef] [Scilit]
- Ezeonu, C.S.; Ejikeme, C.M. Qualitative and Quantitative Determination of Phytochemical Contents of Indigenous Nigerian Softwoods. New J. Sci. 2016, 2016, 5601327. [Google Scholar] [CrossRef] [Scilit]
- Hamdi, A.; Viane, J.; Mahjoub, M.A.; Majouli, K.; Gad, M.H.H.; Kharbach, M.; Demeyer, K.; Marzouk, Z.; Heyden, Y. Vander Polyphenolic Contents, Antioxidant Activities and UPLC–ESI–MS Analysis of Haplophyllum Tuberculatum A. Juss Leaves Extracts. Int. J. Biol. Macromol. 2018, 106, 1071–1079. [Google Scholar] [CrossRef] [Scilit] [PubMed]
- Pinelo, M.; Rubilar, M.; Sineiro, J.; Núñez, M.J. Extraction of Antioxidant Phenolics from Almond Hulls (Prunus Amygdalus) and Pine Sawdust (Pinus Pinaster). Food Chem. 2004, 85, 267–273. [Google Scholar] [CrossRef] [Scilit]
- Chang, C.-C.; Yang, M.-H.; Wen, H.-M.; Chern, J.-C. Estimation of Total Flavonoid Content in Propolis by Two Complementary Colorimetric Methods. J. Food Drug Anal. 2002, 10, 178–182. [Google Scholar] [CrossRef] [Scilit]
- Villaño, D.; Fernández-Pachón, M.S.; Moyá, M.L.; Troncoso, A.M.; García-Parrilla, M.C. Radical Scavenging Ability of Polyphenolic Compounds towards DPPH Free Radical. Talanta 2007, 71, 230–235. [Google Scholar] [CrossRef] [Scilit] [PubMed]
- Benzie, I.F.F.; Strain, J.J. The Ferric Reducing Ability of Plasma (FRAP) as a Measure of “Antioxidant Power”: The FRAP Assay. Anal. Biochem. 1996, 239, 70–76. [Google Scholar] [CrossRef] [Scilit] [PubMed]
- Outaki, M.; Zefzoufi, M.; Sammama, A.; El Gadali, K.; Fdil, R.; El Gaini, L. Phenolic Compounds from Moroccan Retama monosperma L. Boiss, Berberis vulgaris L. and Ricinus communis L.: Characterization, Antioxidant Activity and Performance Criteria of the Validated Method Using UHPLC/DAD/ESI-MS. Indones. J. Chem. 2023, 23, 1704. [Google Scholar] [CrossRef] [Scilit]
- Youness, E.A.; Meryem, J.; Amal, N.; Ilham, Z.; Abdelhak, B. Comprehensive in Vitro and in Silico Study of the Antioxidant and Antimicrobial Attributes of Chemically Characterized Essential Oil Derived from Moroccan Thymus Vulgaris. J. Biol. Biomed. Res. 2025, 2, 141–157. [Google Scholar] [CrossRef] [Scilit]
- Andrews, J.M. JAC Determination of Minimum Inhibitory Concentrations. J. Antimicrob. Chemother. 2001, 48, 5–16. [Google Scholar] [CrossRef] [Scilit]
- Mann, C.M.; Markham, J.L. A New Method for Determining the Minimum Inhibitory Concentration of Essential Oils. J. Appl. Microbiol. 1998, 84, 538–544. [Google Scholar] [CrossRef] [Scilit] [PubMed]
- Chebaibi, A.; Marouf, Z.; Rhazi-Filali, F.; Fahim, M.; Ed-Dra, A. Évaluation Du Pouvoir Antimicrobien Des Huiles Essentielles de Sept Plantes Médicinales Récoltées Au Maroc. Phytothérapie 2016, 14, 355–362. [Google Scholar] [CrossRef] [Scilit]
- Ganfon, H.; Houvohessou, J.; Gabin, A.; Sourou, H.; Gbenou, J. Activité Antibactérienne de l ’ Extrai t Éthanolique et Des Fractions de Anogeissus Antibacterial Activity of Ethanolic Extract and Fractions of Anogeissus Leiocarpa. Int. J. Biol. Chem. 2019, 13, 643–651. [Google Scholar] [CrossRef] [Scilit]
- Soulaimani, B.; Na, A.; Kasrati, A.; Rochdi, A.; Mezrioui, N.; Abbad, A.; Hassani, L. South African Journal of Botany Chemical Composition, Antimicrobial Activity and Synergistic Potential of Essential Oil from Endemic Lavandula maroccana (Mill.). S. Afr. J. Bot. 2019, 125, 202–206. [Google Scholar] [CrossRef] [Scilit]
- European Committee for Antimicrobial Susceptibility Testing (EUCAST) of the European Society of Clinical Microbiology and Infectious Diseases (ESCMID). EUCAST Definitive Document E.Def 1.2, May 2000: Terminology relating to methods for the determination of susceptibility of bacteria to antimicrobial agents. Clin. Microbiol. Infect. 2000, 6, 503–508. [Google Scholar] [CrossRef] [Scilit]
- Kasrati, A.; Alaoui, C.; Fadli, M.; Bekkouche, K. Antioxidative Activity and Synergistic Effect of Thymus Saturejoides Coss. Essential Oils with Cefixime against Selected Food-Borne Bacteria. Ind. Crops Prod. 2014, 61, 338–344. [Google Scholar] [CrossRef] [Scilit]
- Anasa, R.A.; Nurlaila, W.; Dharmastuti, W.; Santoso, I.; Maryanto, A.E.; Sitaresmi, S.; Yasman, Y. Isolation and Screening of Amylase Activity of Primary Moulds in Ragi Tapai of Indonesia. AIP Conf. Proc. 2019, 2168, 020080. [Google Scholar] [CrossRef] [Scilit]
- Daina, A.; Michielin, O.; Zoete, V. SwissADME: A Free Web Tool to Evaluate Pharmacokinetics, Drug-Likeness and Medicinal Chemistry Friendliness of Small Molecules. Sci. Rep. 2017, 7, 42717. [Google Scholar] [CrossRef] [Scilit] [PubMed]
- Banerjee, P.; Kemmler, E.; Dunkel, M.; Preissner, R. ProTox 3.0: A Webserver for the Prediction of Toxicity of Chemicals. Nucleic Acids Res. 2024, 52, W513–W520. [Google Scholar] [CrossRef] [Scilit] [PubMed]
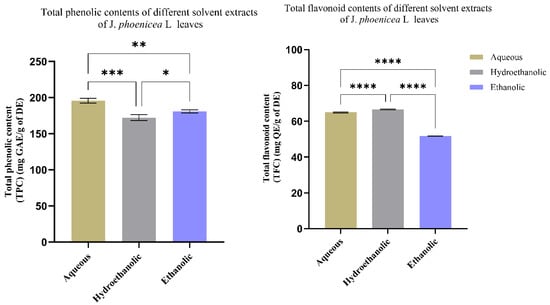
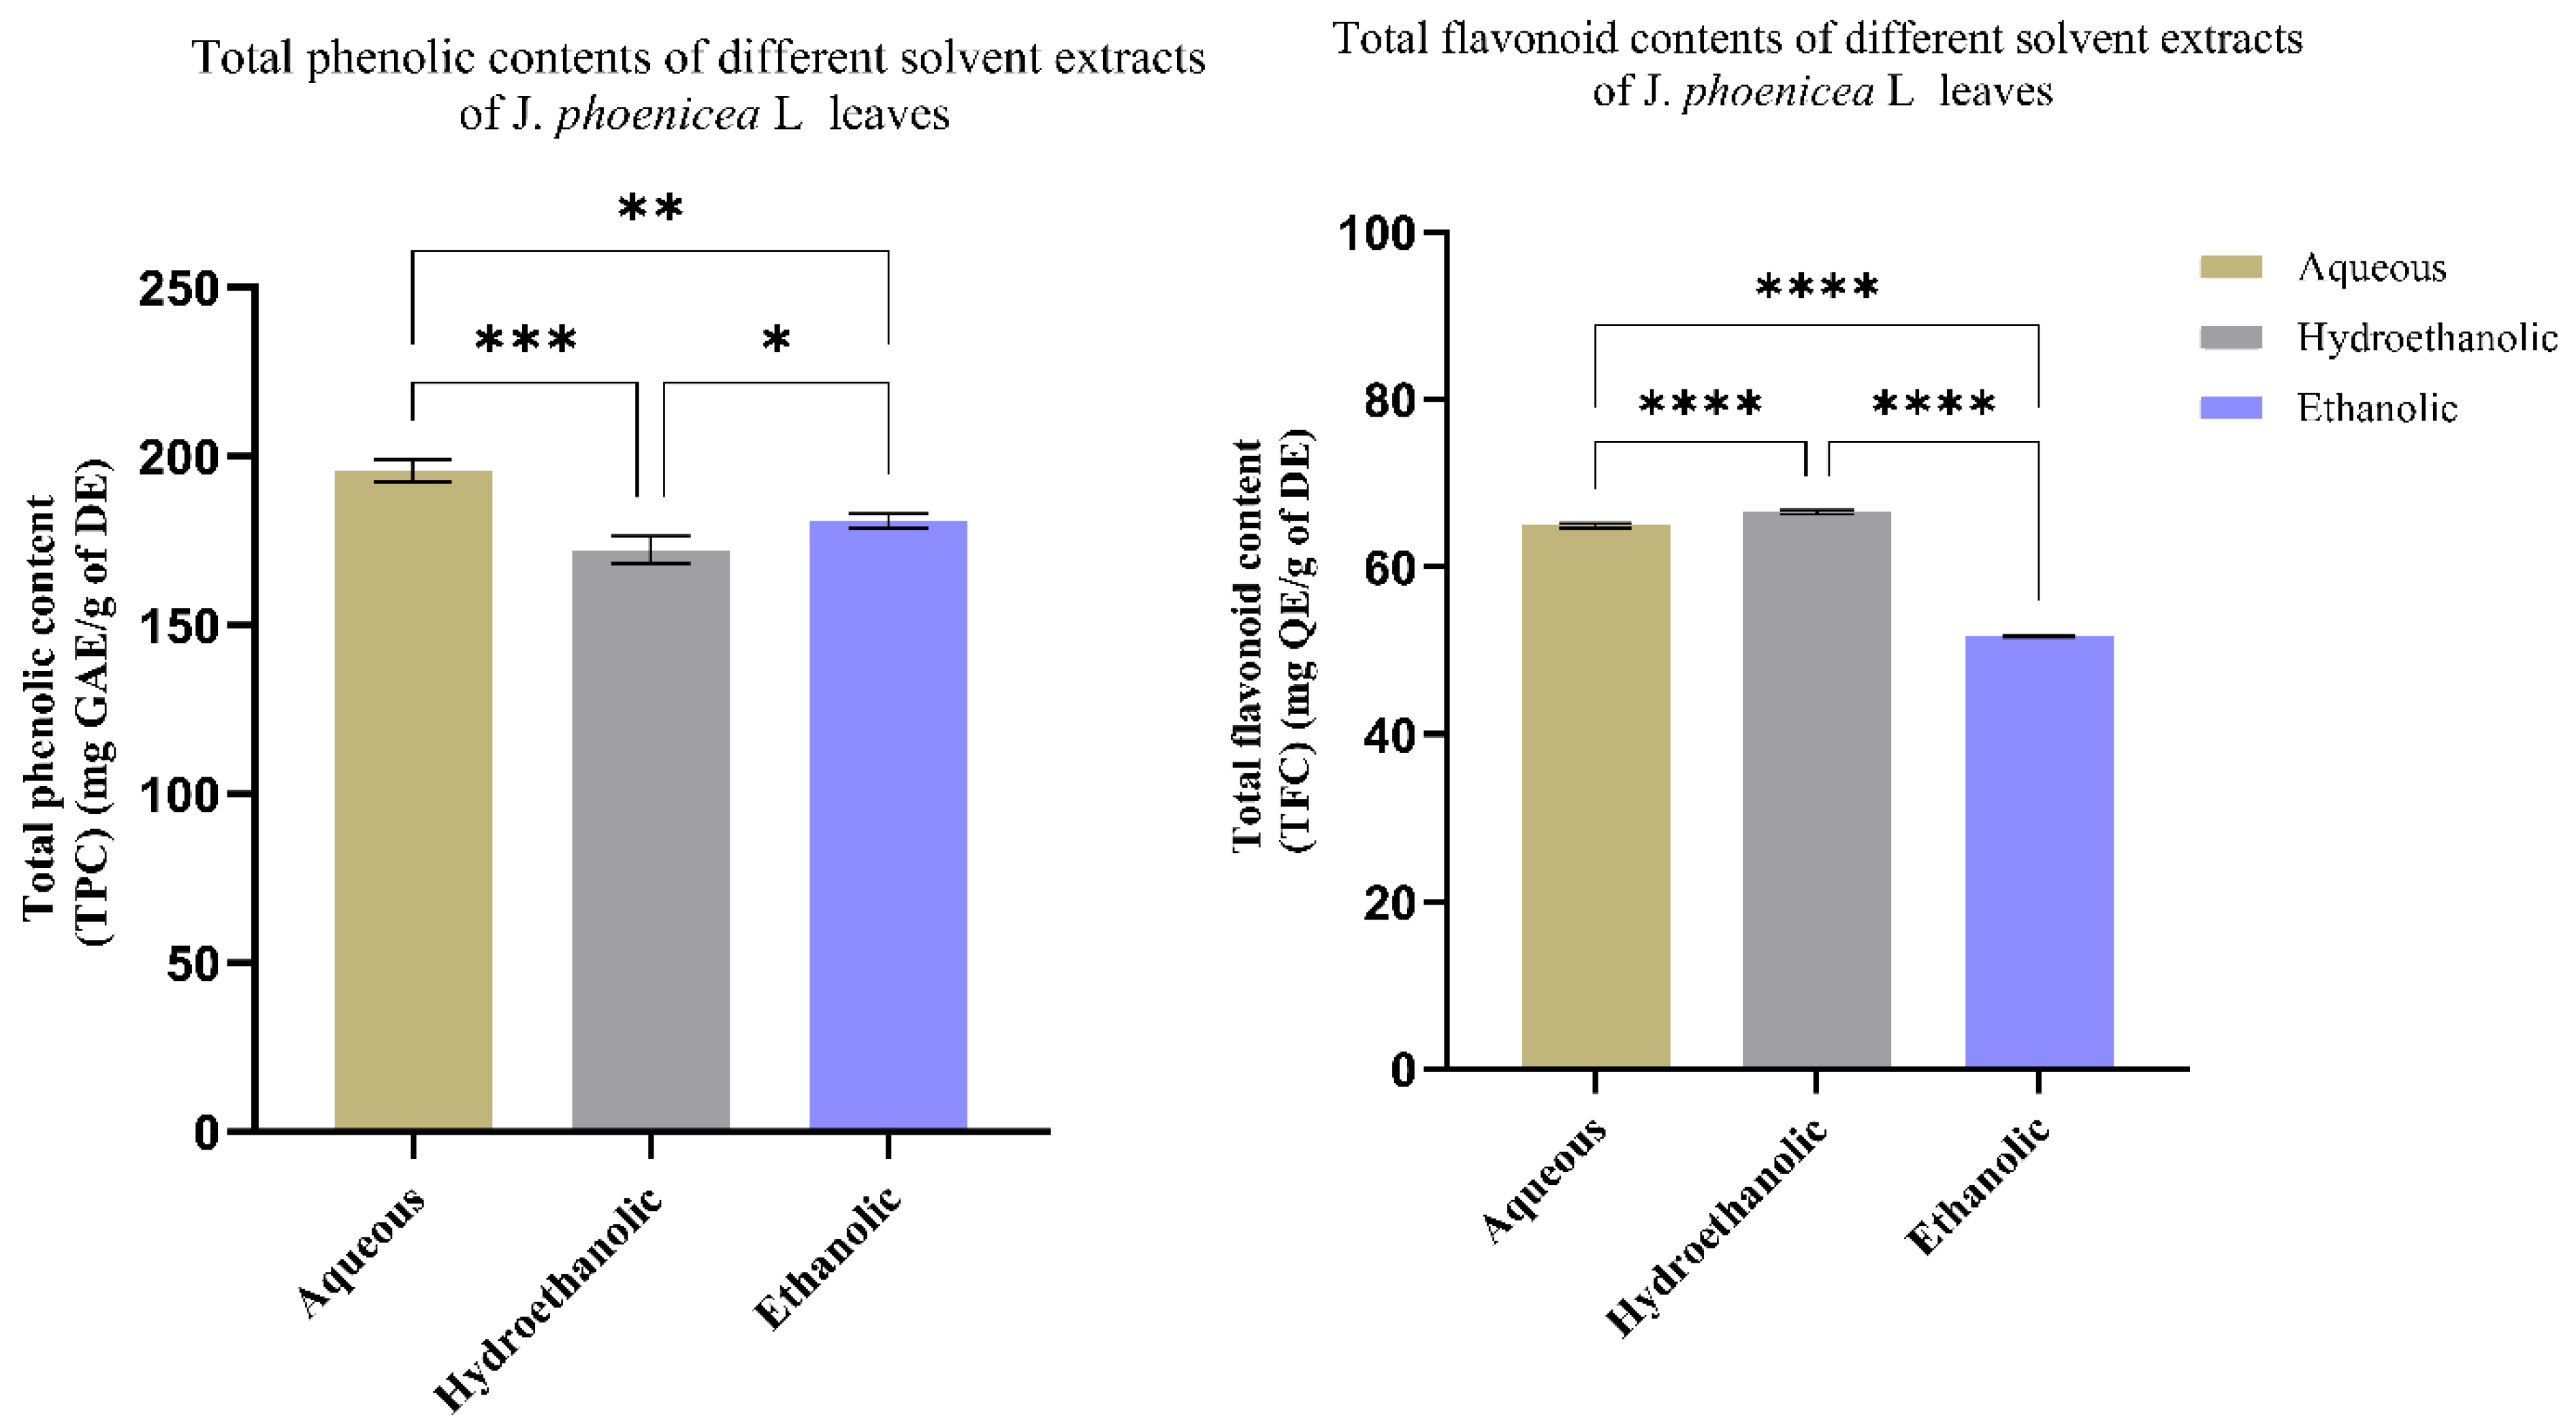
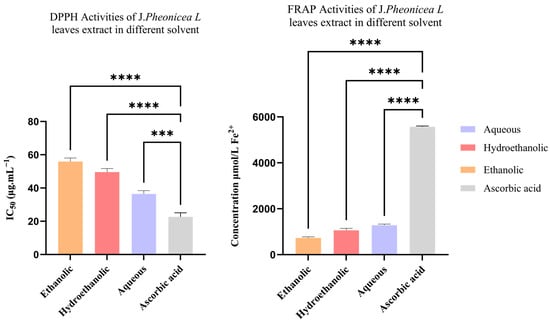
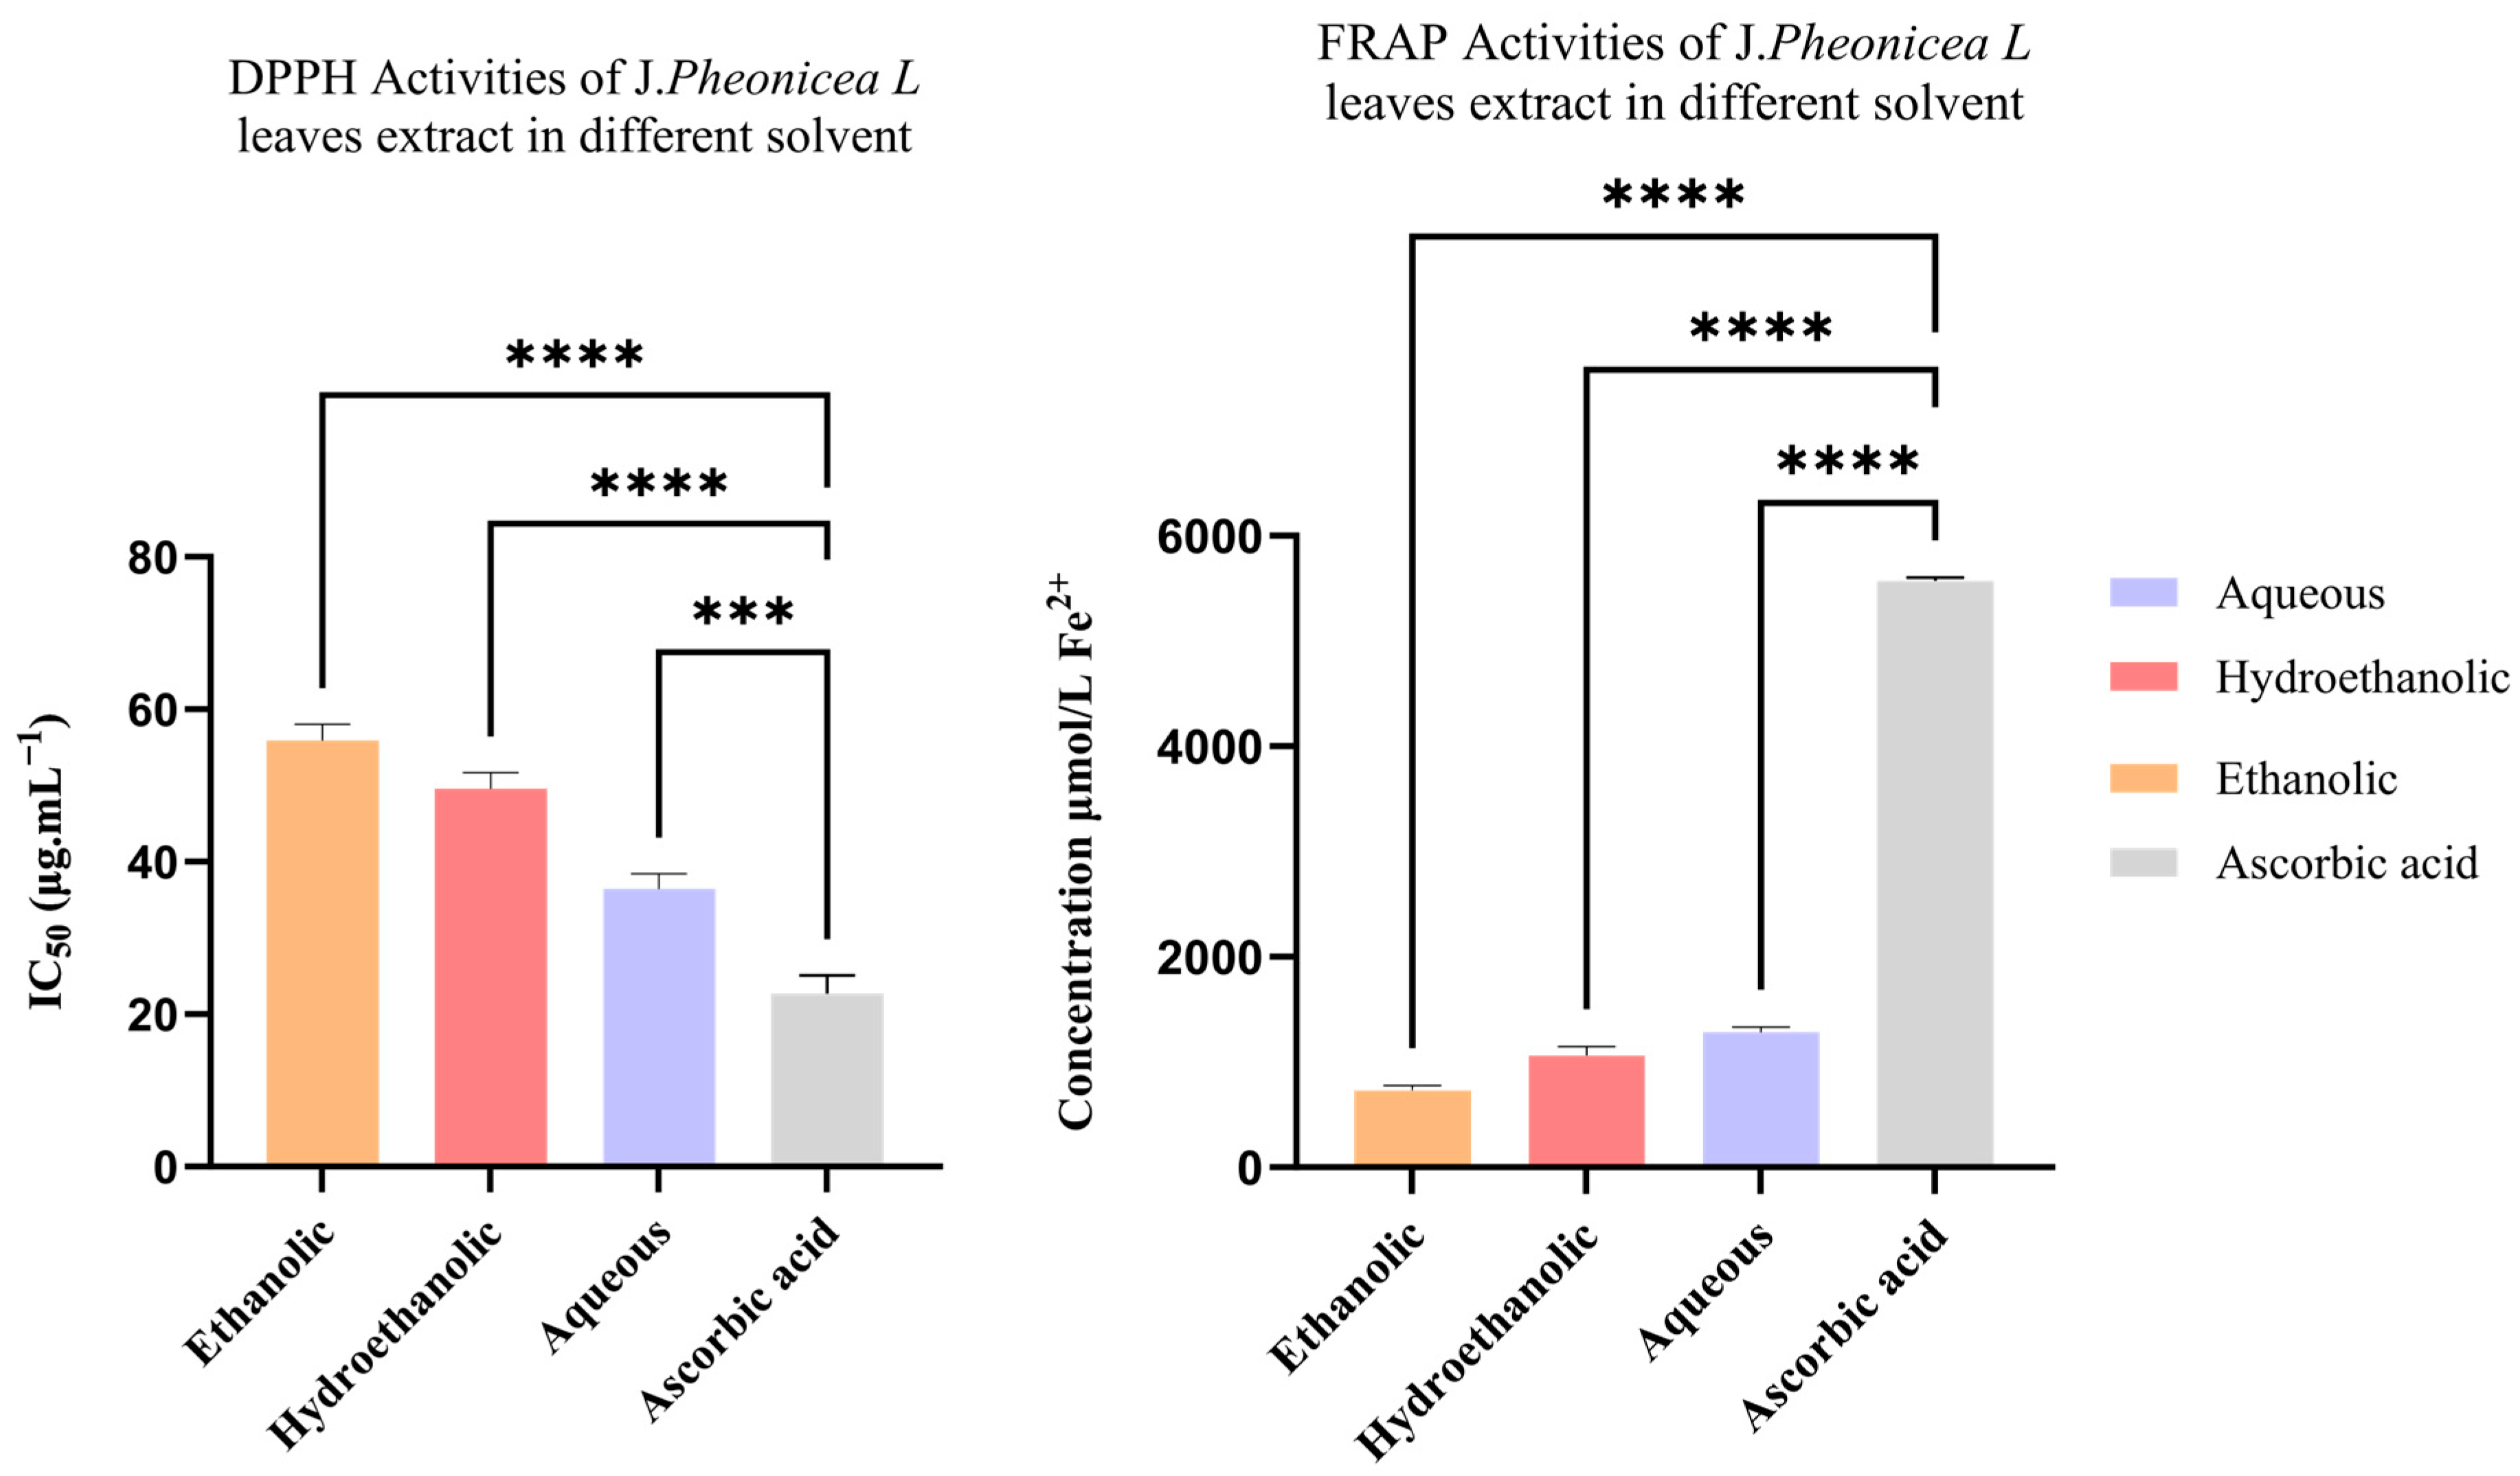
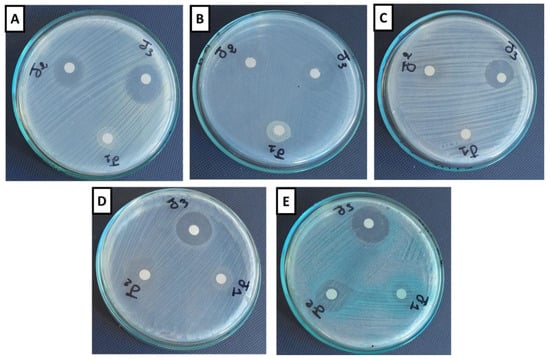
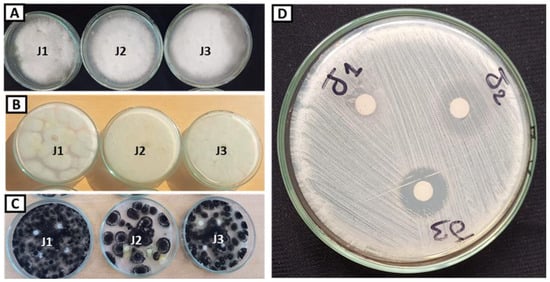
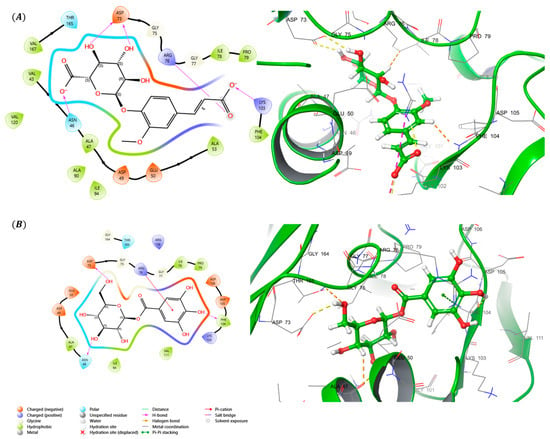
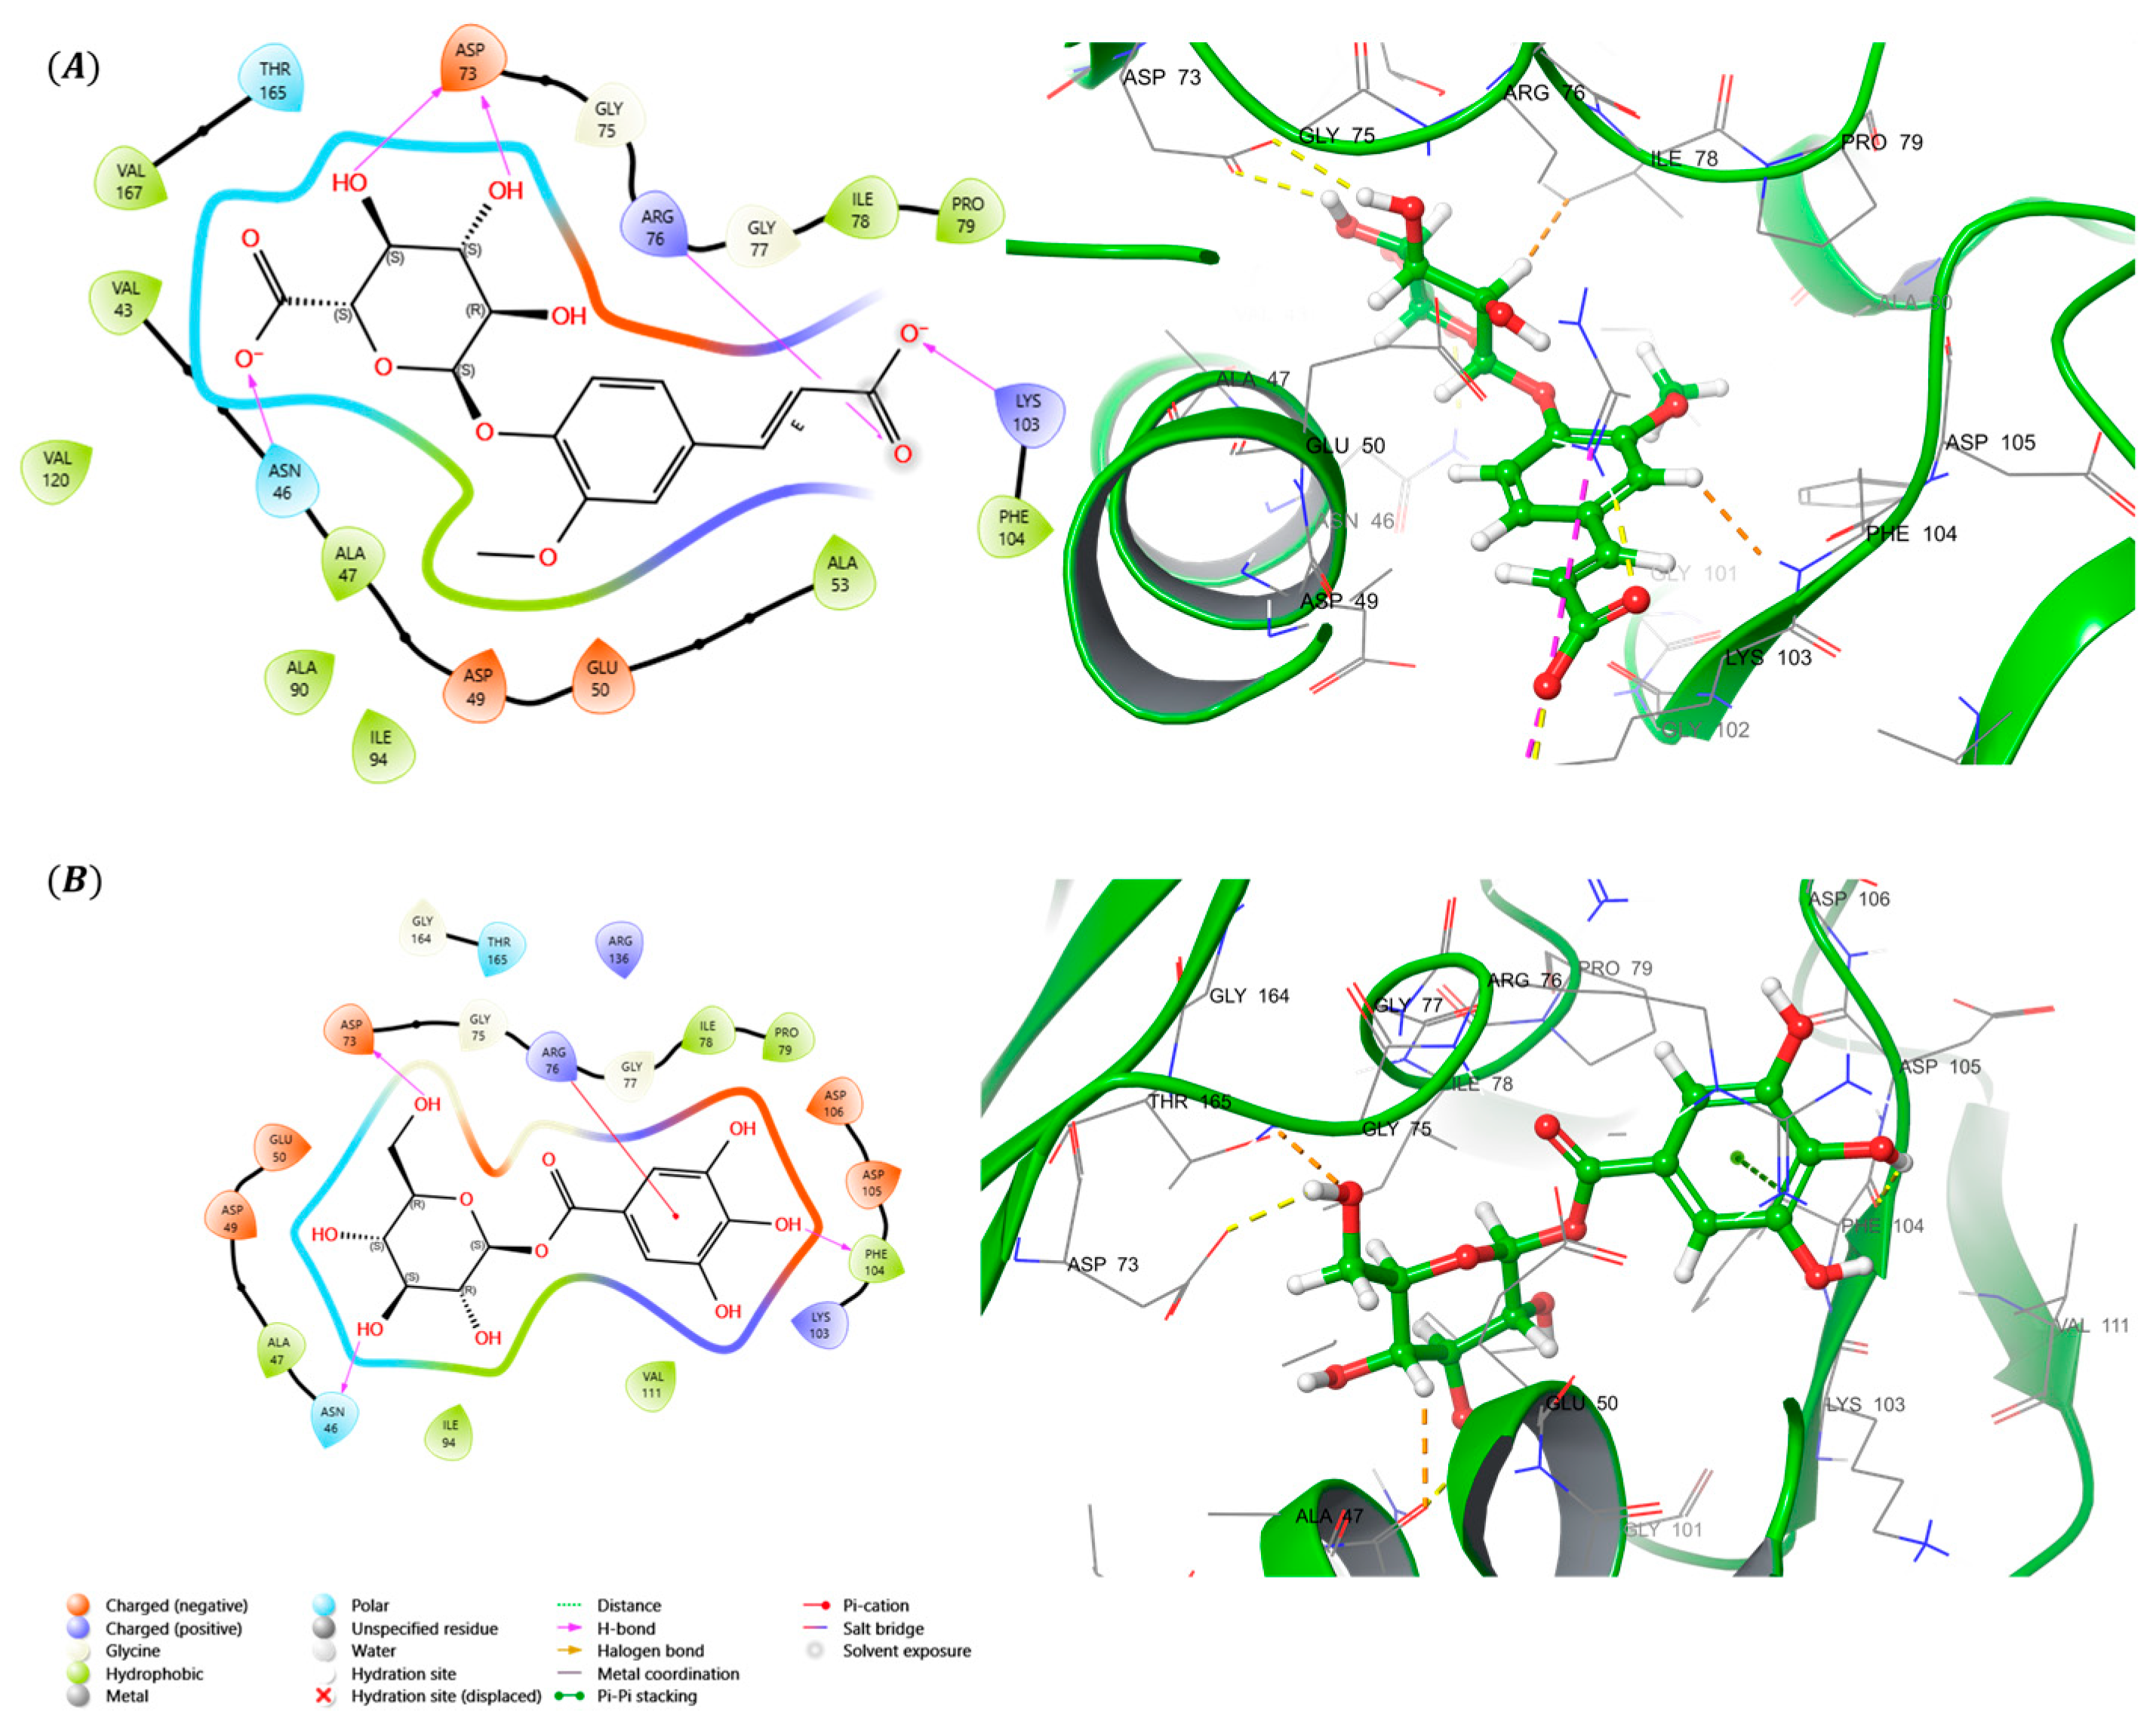
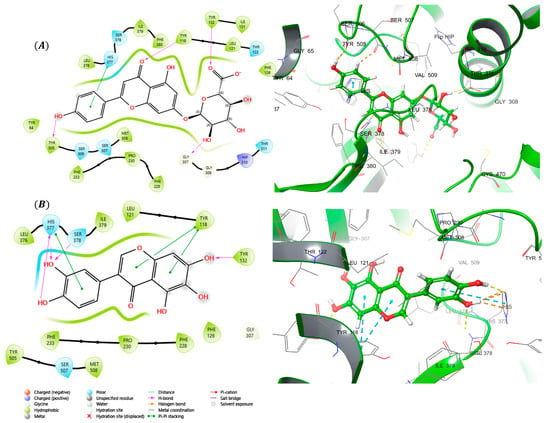
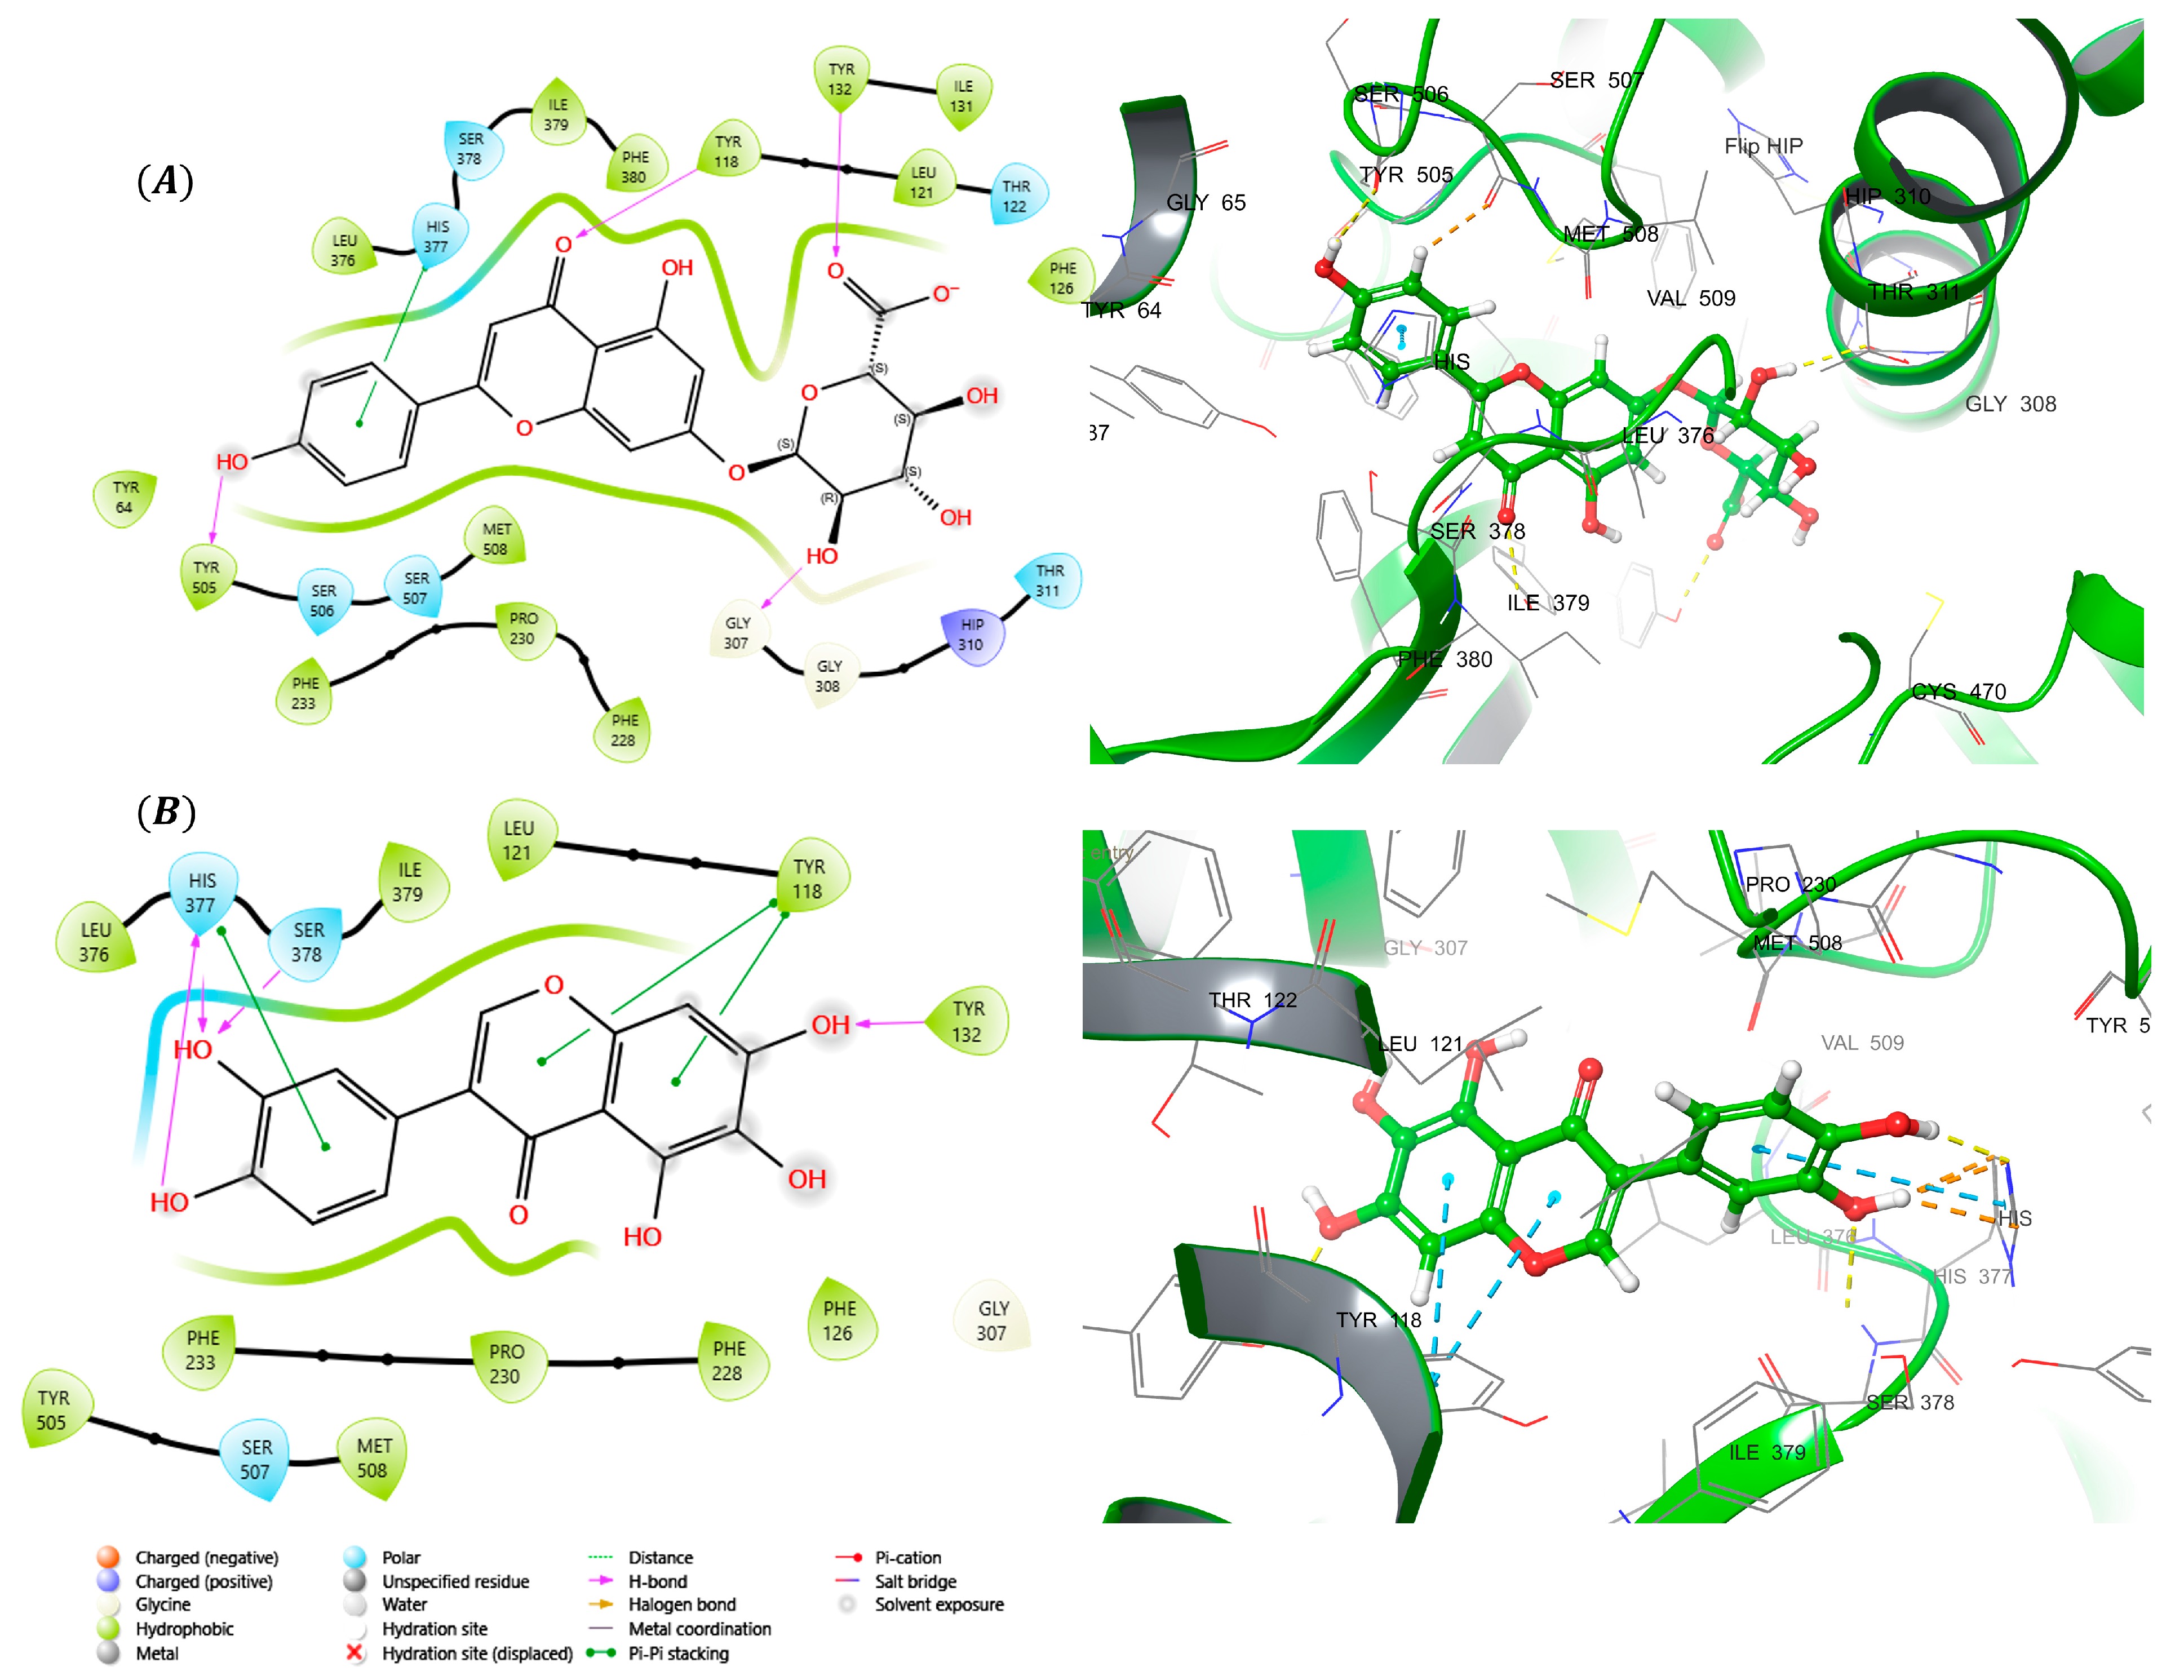
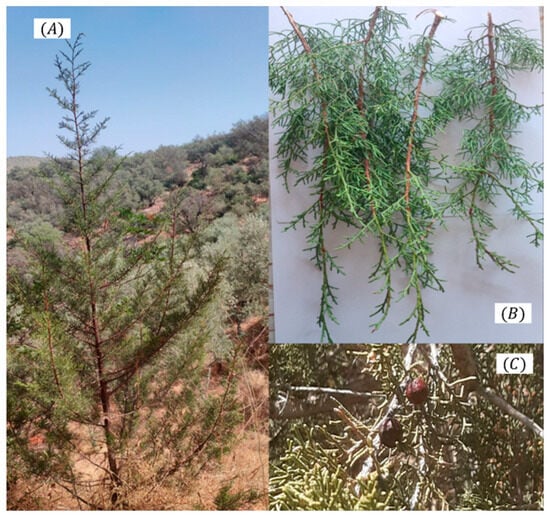
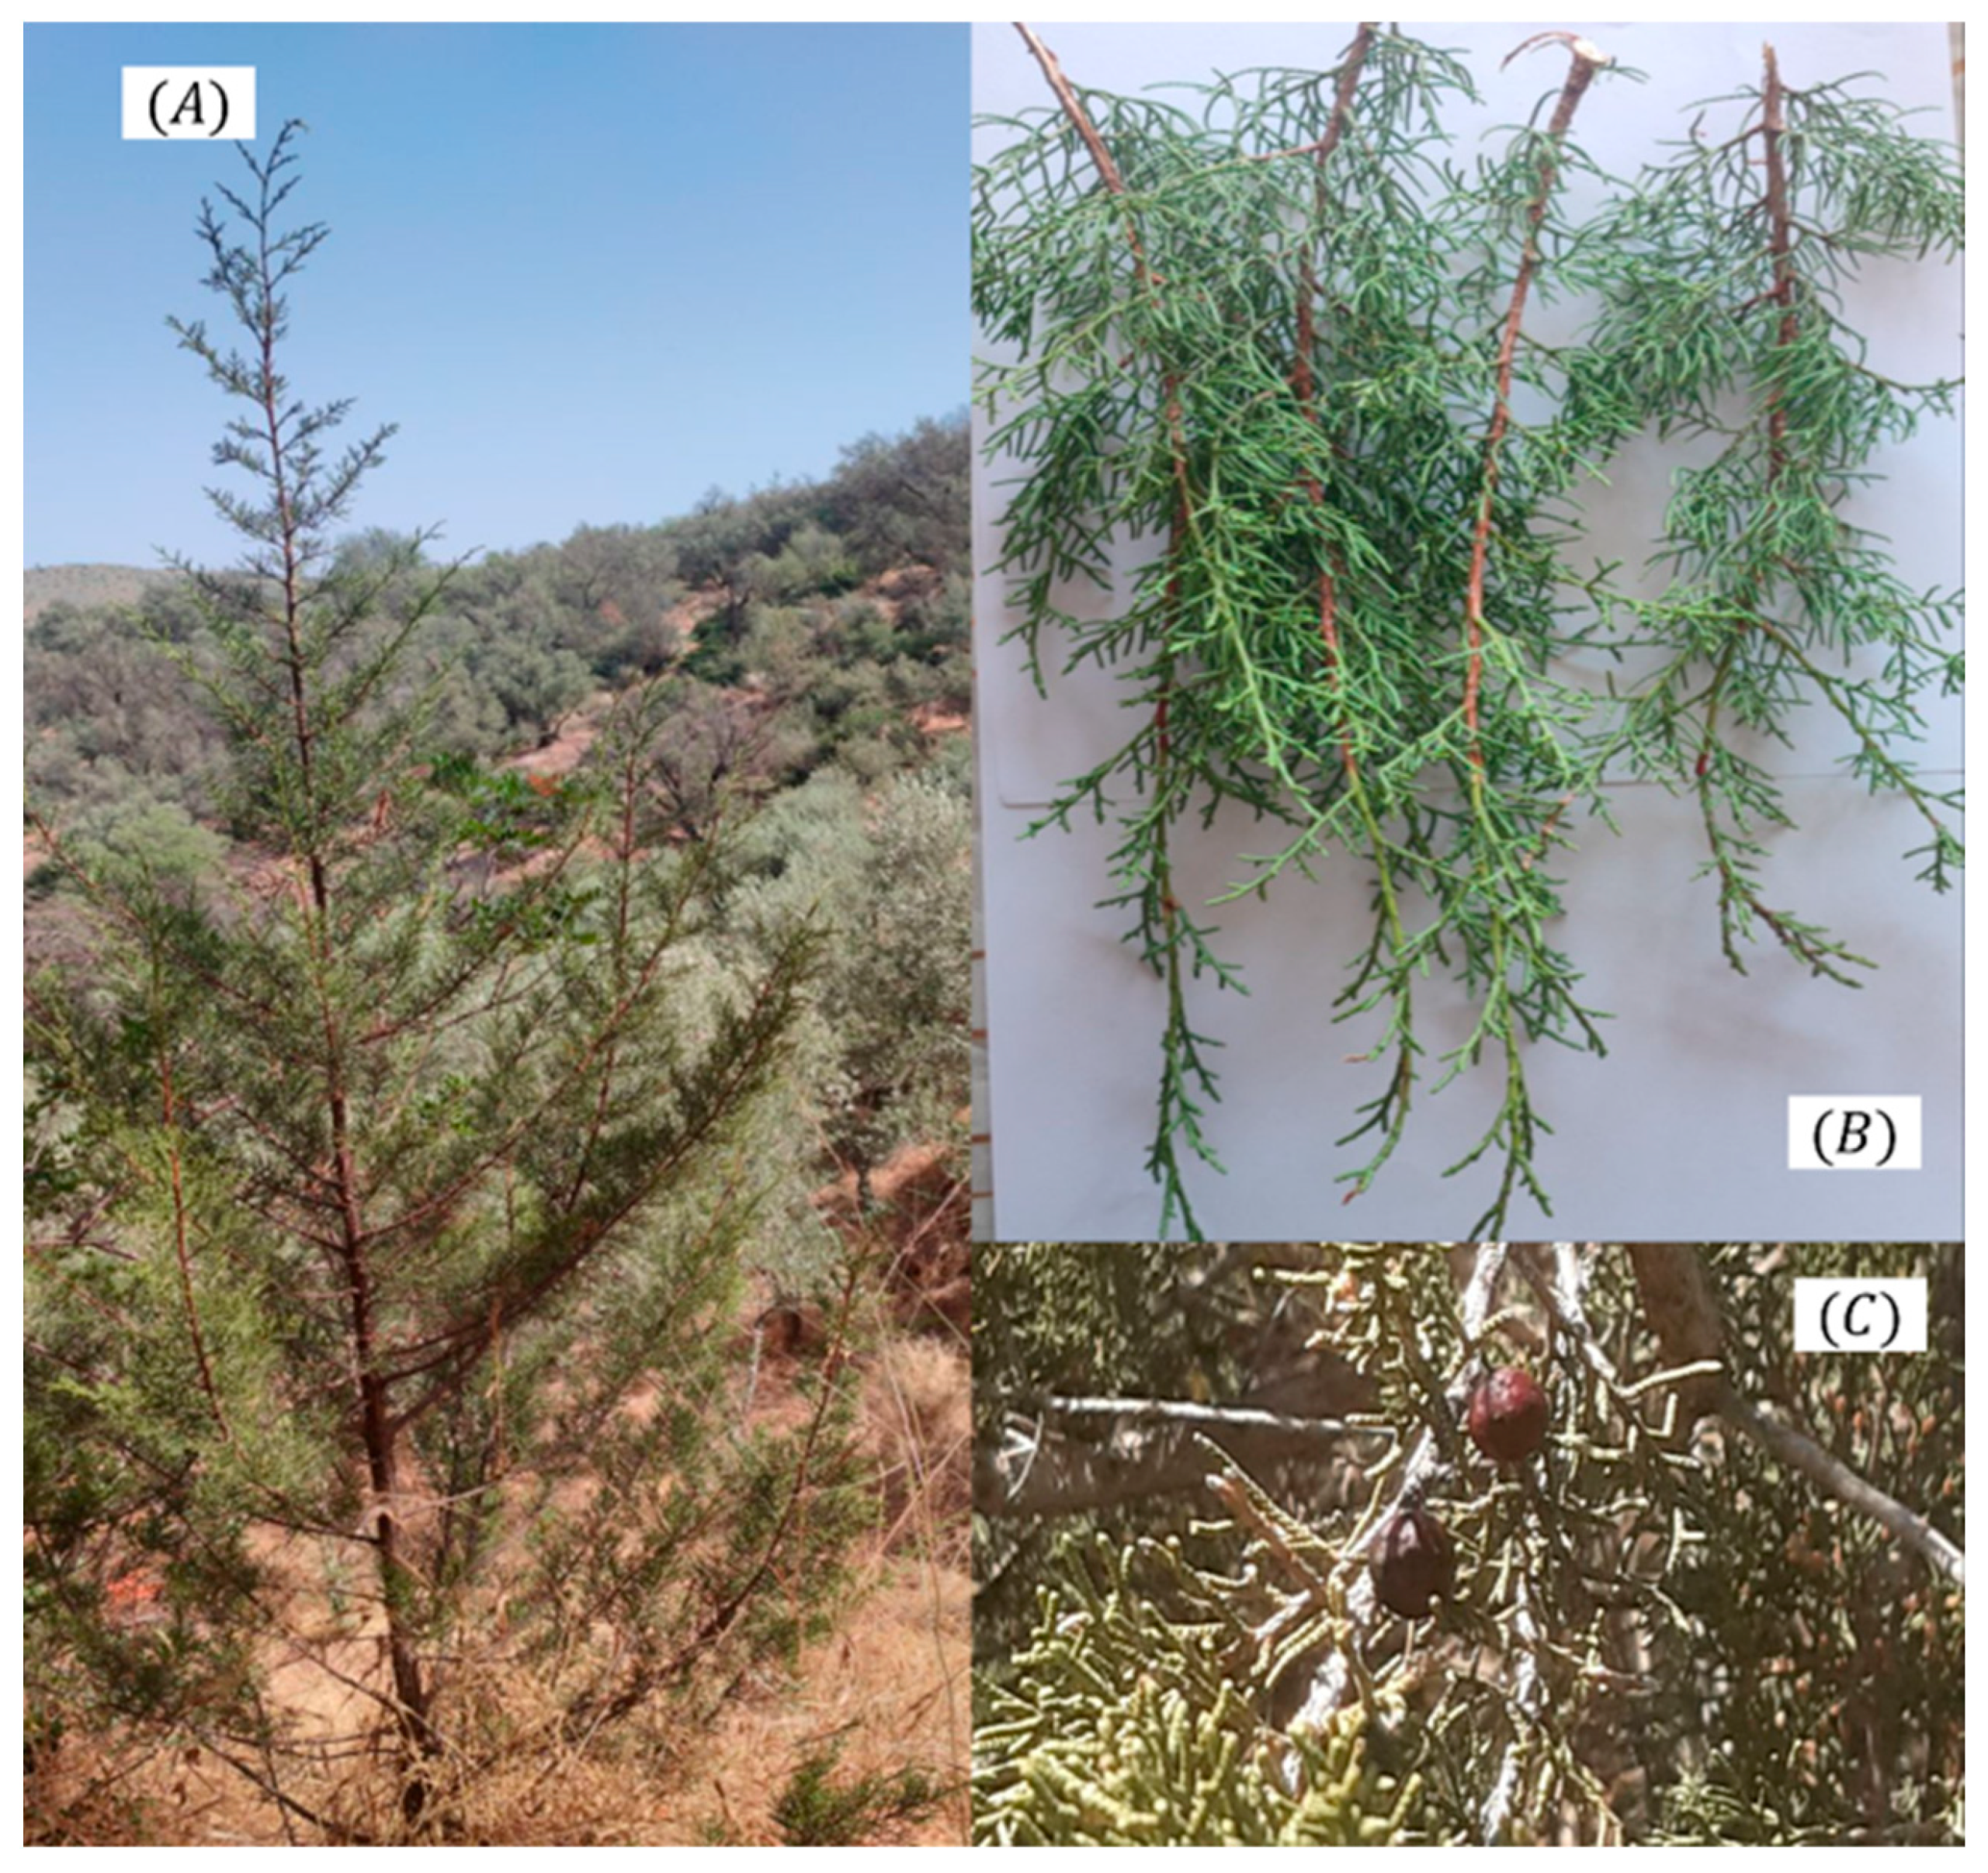

Disclaimer/Publisher’s Note: The statements, opinions and data contained in all publications are solely those of the individual author(s) and contributor(s) and not of MDPI and/or the editor(s). MDPI and/or the editor(s) disclaim responsibility for any injury to people or property resulting from any ideas, methods, instructions or products referred to in the content. |
© 2026 by the authors. Licensee MDPI, Basel, Switzerland. This article is an open access article distributed under the terms and conditions of the Creative Commons Attribution (CC BY) license.