


Abstract
Serum Fourier transform infrared (FTIR) spectroscopy offers a rapid and minimally invasive approach for auxiliary cancer discrimination, but distinguishing cancer types remains challenging because of spectral overlap and biological background variation. We developed a two-stage chemometric framework integrating serum FTIR spectra with routine biochemical indices to distinguish healthy controls, colorectal cancer and lung cancer. The study included 364 serum samples from 64 healthy controls, 160 patients with colorectal cancer and 140 patients with lung cancer. In the first stage, colorectal and lung cancer samples were pooled into a single cancer group for discrimination from healthy controls; in the second stage, cancer samples were further classified as colorectal or lung cancer. For the same three-class task, the FTIR-only model achieved a macro-F1 score of 0.982, compared with 0.746 for the best biochemical-only model. The complete hierarchical model achieved a primary saved-OOF accuracy of 0.9973 and a macro-F1 score of 0.9963, with one healthy control misclassified as colorectal cancer and no cancer sample missed. These results are internal estimates because preprocessing and feature selection were not refitted within the inner stacking folds; fully nested reanalysis and independent external validation are needed before clinical application.
1. Introduction
Lung cancer [1] and colorectal cancer [2] are two leading malignancies worldwide in terms of incidence and mortality. Early diagnosis and accurate typing are essential for improving patient prognosis and guiding individualized treatment. Current clinical diagnosis relies mainly on imaging, endoscopic biopsy and histopathological analysis. Although these approaches provide high diagnostic accuracy, they are often invasive, operationally complex, costly and dependent on operator expertise, which limits their suitability for large-scale population screening and dynamic monitoring [3]. Therefore, rapid and minimally invasive analytical methods based on blood or other body-fluid samples are increasingly needed for auxiliary cancer screening and sample discrimination [4].
Fourier transform infrared (FTIR) spectroscopy has shown potential for analyzing serum, plasma, urine, and other biofluids [5]. By recording the combined absorbance pattern of proteins, lipids, nucleic acids, carbohydrates, and metabolites, FTIR provides a global biochemical fingerprint rather than a signal from a single disease-specific molecule [6,7,8]. When combined with machine learning methods, biofluid FTIR has shown promising performance in the discrimination of several cancers, including colorectal cancer and lung cancer [9]. However, the resulting spectral profile may depend on the clinical context in which the specimen is collected, including tumor stage, treatment status, systemic inflammation, nutritional status, and hepatic or renal function. Toraman et al. [10] analyzed plasma samples from 30 patients with colon cancer and 40 healthy controls using ATR-FTIR, feature extraction, and machine learning classification. Their best model achieved an accuracy of 95.71%, a sensitivity of 93.33%, and a specificity of 97.50%. However, the reported classification results were not stratified by tumor stage or treatment status, limiting assessment of whether the observed spectral differences were consistent across clinical subgroups. Zhu et al. [11] investigated serum mid-infrared spectroscopy combined with machine learning for the differentiation of breast cancer and lung cancer. The study used 301 cases for model training and 50 cases for testing and reported that a fine K-nearest-neighbor model achieved complete prediction of the test samples under the reported evaluation design. The authors identified several differential spectral intervals, including 1318.59–1401.03 cm−1, 1492.15–1583.27 cm−1, and 1597.25–1721.64 cm−1, which were interpreted as being related to protein-associated chemical bonds. However, the original report did not provide stage-stratified or treatment-stratified performance. Beyond oncology, mid-infrared blood profiling combined with supervised chemometric modeling has also enabled the differentiation of clinically overlapping disorders in relatively large patient cohorts [12].
In addition, many studies have shown that malignant tumor development is accompanied by systemic remodeling of blood-borne macromolecular composition and conformation, and these changes can appear in infrared spectra as characteristic absorption peaks or spectral-shape differences [13,14,15,16,17]. Nevertheless, biofluid FTIR spectra [18] are high-dimensional, highly redundant and strongly affected by biological noise [19]. Spectral differences between disease categories, especially between different cancer types, often overlap substantially, which greatly limits the ability to achieve high-precision multiclass diagnosis using spectral information alone [20,21].
Despite these advances, two key obstacles remain when serum FTIR is used for multicancer discrimination involving lung cancer and colorectal cancer. First, different malignancies may share broad cancer-related systemic alterations. As a result, the difference between cancer and healthy samples is relatively obvious, whereas differences between cancer types are subtler, more localized and more easily masked by common cancer signals. Second, FTIR spectra are high-dimensional and strongly collinear, whereas sample sizes are usually limited. If a single direct three-class model is used, the model may mix cancer screening and cancer typing within the same decision boundary. If feature selection or parameter estimation is performed on the full dataset, information leakage may occur, leading to optimistic performance estimates.
Routine clinical biochemical indices are important quantitative parameters reflecting metabolic status and organ function, and they have long played a key role in tumor screening and treatment assessment [6,22]. For example, abnormalities in liver and kidney function, enzymatic activity and small-molecule metabolites are often closely associated with tumor-related metabolic reprogramming and systemic inflammatory responses. However, single biochemical indices, or combinations of only a few indices, usually lack sufficient specificity and sensitivity for reliable multicancer discrimination [23,24]. Integrating spectral features with biochemical indices may improve the model’s ability to comprehensively characterize tumor-related physiological perturbations [25,26]. However, multimodal fusion is not simply equivalent to feature concatenation. It also requires a modeling structure matched to the diagnostic task and a strict validation strategy.
The present study included patients with newly diagnosed, histopathologically confirmed colorectal or lung cancer whose serum was collected before the initiation of cancer-directed treatment. Disease stage and treatment status were considered separate clinical variables, and the stage distribution of the study cohorts is reported in Table 1. Thus, the present study evaluates pretreatment serum-sample discrimination across the included disease stages rather than treatment response, post-treatment surveillance, or longitudinal disease monitoring. Within this defined pretreatment setting, we developed a leakage-controlled two-stage chemometric framework for serum FTIR-based sample discrimination. In this framework, CARS-PLS-DA was first used to extract stable spectral variables and distinguish healthy controls from cancer samples. ANOVA-RFE and a stacking ensemble were then applied within the cancer branch to further discriminate colorectal cancer from lung cancer. This design decomposes the analytical task into two stages, allowing variable selection and model construction to match the specific discriminatory objective of each stage. The contribution of this study is the integration of this task-specific design with multimodal serum data and leakage-controlled validation, rather than the introduction of a new hierarchical classifier. CRC and LC were selected as a defined proof-of-concept pair because they arise from different organ systems, may share systemic serum alterations, and were available as newly diagnosed, pretreatment cohorts. All preprocessing, variable selection and model-training procedures were restricted to the training folds of the outer cross-validation to reduce information leakage and obtain more reliable performance estimates. This study therefore aimed to establish a reproducible serum FTIR-biochemical analytical workflow for multiclass serum sample discrimination. Rather than serving as a purely algorithmic classifier, the proposed framework integrates serum spectral preprocessing, variable selection, multimodal feature fusion and leakage-controlled validation into a coherent analytical workflow.
Table 1.
Demographic characteristics and available clinical-stage information of the study participants.
2. Materials and Methods
2.1. Serum Sample Preparation
This study included 364 participants, comprising 64 healthy controls, 160 patients with colorectal cancer, and 140 patients with lung cancer. Demographic characteristics and the available broad clinical-stage information are summarized in Table 1. Among the lung cancer patients, 19 (13.57%) were classified as stage I, 6 (4.29%) as stage II, 36 (25.71%) as stage III, and 60 (42.86%) as stage IV. The preliminary hospital diagnoses did not provide a specific stage for the remaining 19 patients (13.57%). Among the colorectal cancer patients, 5 (3.13%) were classified as stage I, 2 (1.25%) as stage II, and 2 (1.25%) as stage III; no patient was assigned to stage IV in the available records. The preliminary hospital diagnoses did not provide a specific stage for the remaining 151 patients (94.38%).
Histological subtype was explicitly specified in the available clinical metadata for 61 of the 140 lung cancer patients, including 44 patients with adenocarcinoma, 6 with squamous cell carcinoma, 9 with small-cell lung cancer, 1 with adenosquamous carcinoma, and 1 with non-small-cell lung cancer not otherwise specified. Histological subtype was not specified in the available cohort metadata for the remaining 79 lung cancer patients. For the colorectal cancer cohort, histopathology confirmed the cancer diagnosis, but histological subtype was not consistently available in the dataset used for the present analysis. Histological subtype was therefore not used as a modeling variable. The available histological-subtype information is summarized in Supplementary Table S1.
The protocol for healthy volunteers was approved by the Ethics Committee of South-Central Minzu University (approval No. 2024-scuec-044), and the protocol for patients with cancer was approved by the Ethics Committee of Xiangyang Central Hospital (approval No. 2024097). All participants provided written informed consent. All cancer patients had newly diagnosed primary lung cancer or colorectal cancer confirmed by histopathology and had not received surgery, radiotherapy, chemotherapy or targeted therapy before sampling. Healthy controls had no history of malignant tumor, acute inflammation or chronic active infection. Exclusion criteria included severe cardiac, hepatic or renal insufficiency, concurrent other malignancies, autoimmune disease and pregnancy. Healthy controls were recruited at South-Central Minzu University before the cancer cases. Patients with newly diagnosed, histopathologically confirmed lung or colorectal cancer who had not received cancer-directed treatment before sampling were consecutively recruited at Xiangyang Central Hospital between September 2024 and May 2025, at approximately two to three patients per day. The same documented sample-processing protocol was applied to the healthy-control and cancer samples. One tube of peripheral venous blood was collected from each participant after at least 12 h of fasting. Fresh blood was temporarily stored in a clinical refrigerator and centrifuged approximately 2 h after venipuncture at 3000 rpm for 10 min at 4 °C. The serum supernatant was aliquoted and transferred to −80 °C storage within 5 min after centrifugation. Frozen aliquots were transported to the laboratory in dry-ice-insulated transport containers.
2.2. Spectral Acquisition and Preprocessing
Samples were generally accumulated for approximately one month before FTIR measurement, although exact individual storage durations could not be reliably reconstructed for all samples. According to the routine protocol, each serum aliquot was thawed once for FTIR measurement. For each measurement batch, 10 samples were removed from −80 °C storage and thawed at room temperature for approximately 10 min until completely thawed. Samples were measured in chronological collection-batch order rather than being randomized across recruitment periods. The archived records did not retain participant-level assignments to measurement batches. Laboratory personnel performing spectral acquisition had access only to coded sample identifiers and were blinded to the clinical diagnosis.
Serum infrared spectra were acquired using an INVENIO-S Fourier transform infrared spectrometer (Bruker, Ettlingen, Germany) equipped with an attenuated total reflection (ATR) accessory and a liquid-nitrogen-cooled mercury cadmium telluride (MCT) detector. Spectra were recorded over 4000–700 cm−1 at a resolution of 4 cm−1, with 16 scans averaged for each sample. Before and during measurement, the optical and sample chambers were continuously purged with 99.9% high-purity nitrogen, and a background spectrum was collected before each sample measurement for subsequent baseline and environmental-drift correction.
Serum was measured using a dried-film protocol. After centrifugation, samples were thoroughly mixed, and 200 μL of serum was evenly dropped onto the zinc selenide (ZnSe) crystal surface of the ATR accessory. The accessory was placed on the bench, and airflow was directed above the sample to accelerate drying. The temperature setting was adjusted to 30–35 °C, and the serum sample on the accessory was uniformly dried for 10 min.
To ensure measurement reproducibility, each serum sample was measured twice consecutively on the same dried film. Each measurement comprised 16 co-added scans, and the two replicate spectra were averaged to obtain the representative spectrum used for subsequent analysis. After both replicate measurements had been completed, the ZnSe crystal was cleaned sequentially with absolute ethanol and deionized water, and a new air background was collected before the next sample was measured. Spectral preprocessing, feature selection, and machine learning modeling were performed using Matlab 2023b.
FTIR measurement repeatability was assessed using the replicate-level raw spectra retained in the archive. All 364 participants were measured twice consecutively using the same dried film, and the two measurements were averaged to generate one representative spectrum per participant for modeling. Both individual measurements were retrievable for 278 participants; for the remaining 86, only the processed mean spectrum was retained. The 278 participants comprised 147 patients with colorectal cancer and 131 patients with lung cancer; no healthy-control samples had retrievable replicate-level raw spectra. Each measurement consisted of 16 co-added instrument scans. Each available replicate spectrum was independently processed using the same preprocessing pipeline as the main analysis. Full-spectrum repeatability was summarized using Pearson correlation, RMSE, and mean absolute difference. Four prespecified spectral regions were evaluated using absolute-agreement ICC(2,1) with bootstrap 95% confidence intervals. Conventional CVs were not calculated because second-derivative regional means may be signed or close to zero.
2.3. Serum Biochemical Analysis
Routine biochemical indices were measured using a Mindray BS-360 automatic biochemical analyzer (Mindray, Shenzhen, China). The measured indices included glucose (Glu-G), total protein (TP), apolipoprotein A1 (ApoA1), apolipoprotein B (ApoB), albumin (ALB), immunoglobulin A (IgA), total bilirubin (T-bil-V), urea (UREA), uric acid (UA), calcium (Ca), alanine aminotransferase (ALT), lactate dehydrogenase (LDH), gamma-glutamyl transferase (gamma-GT), creatine kinase (CK), cholinesterase (CHE), alpha-amylase (alpha-AMY), alpha-hydroxybutyrate dehydrogenase (alpha-HBDH), total cholesterol (TC), triglyceride (TG), high-density lipoprotein cholesterol (HDL-C), and low-density lipoprotein cholesterol (LDL-C).
2.4. Spectral Preprocessing and Data Alignment
Before data modeling, FTIR spectral data and clinical biochemical data were first matched according to unique sample identifiers. To ensure label reliability, the spectral group labels and clinical group labels of the matched samples were checked for consistency. Raw FTIR spectra were then preprocessed by rubberband baseline correction, Savitzky–Golay smoothing and second-order finite-difference transformation to reduce the effects of baseline drift, measurement noise and inter-sample background differences. After preprocessing, spectral variables and clinical biochemical indices were fused at the feature level to form a unified multimodal input matrix for subsequent two-stage model construction.
For supplementary spectral quantification, six band-area and ratio measures were calculated from baseline-corrected and Savitzky–Golay-smoothed absorbance spectra before finite-difference transformation, using one representative spectrum per participant. Integrated band areas were normalized to the total area over 3600–700 cm−1. Group comparisons used the Kruskal–Wallis test and two-sided Wilcoxon rank-sum tests, with Benjamini–Hochberg correction applied across the six overall tests and, separately, across all 18 pairwise comparisons. The corresponding metric definitions and effect sizes are reported in Supplementary Table S3.
2.5. Two-Stage Multimodal Modeling Workflow
This study constructed a two-stage chemometric classification framework based on multimodal feature fusion. The framework was designed to separate two analytically distinct tasks: health-versus-cancer discrimination and cancer-type discrimination among cancer samples. As shown in Figure 1, the workflow included multimodal data matching, spectral preprocessing, feature-level fusion, leakage-controlled outer validation, task-specific variable selection and hierarchical probability integration.
Figure 1.
Overall workflow of the two-stage hierarchical three-class diagnostic model based on fusion of FTIR spectra and clinical biochemical indices. Abbreviations: FTIR, Fourier-transform infrared spectroscopy; CRC, colorectal cancer; LC, lung cancer; ANOVA, analysis of variance; CARS, competitive adaptive reweighted sampling; PLS-DA, partial least-squares discriminant analysis; RFE, recursive feature elimination.
As shown in Figure 1A, serum FTIR spectra were matched with the corresponding biochemical indices using unique sample identifiers, and only samples with complete measurements from both modalities were retained. The matched dataset comprised healthy controls (HL), patients with colorectal cancer (CRC), and patients with lung cancer (LC).
As summarized in Figure 1B, the matched FTIR spectra underwent the preprocessing procedure described in Section 2.4 and were subsequently integrated with the biochemical indices at the feature level to form the multimodal input matrix. The resulting matrix was then used in the leakage-controlled two-stage modeling workflow described below.
To evaluate model performance, stratified outer five-fold cross-validation was used (Figure 1C). In each outer fold, four folds were used for model development and the remaining fold was held out for testing. Within each outer-training partition, standardization and feature selection were fitted once using the full outer-training data. ANOVA screening and CARS were applied for the Master model, whereas ANOVA screening and SVM-RFE were applied for the Sub model. Stacking meta-features were generated by inner five-fold cross-validation using the feature matrix selected from the full outer-training partition. The standardization and feature-selection steps were not refitted within each inner training fold. The meta-learner was trained using the resulting inner out-of-fold predictions, and the resulting model was evaluated on the held-out outer test fold. Thus, outer test samples were excluded from model fitting but preprocessing and feature selection were not fully nested within the inner folds used to generate stacking meta-features. The reported estimates therefore reflect the implemented procedure and should not be interpreted as estimates from a fully nested pipeline. The outer five-fold procedure was repeated using 20 independently generated random seeds to assess partition-related variability. The model settings used for the reported analysis are summarized in Supplementary Table S2. This procedure represents internal validation in the available clinically assembled cohort, not external validation; no independent cohort from another institution was used for model development, threshold selection, or performance evaluation. This clarification is consistent with reporting guidance for machine learning-based clinical prediction models [27] and addresses the risk of optimistic estimates when information from held-out data contributes to preprocessing or feature selection [28].
In the first stage, a cancer-screening Master model was constructed (Figure 1D) to perform binary classification between healthy controls and patients with cancer. For the multimodal feature matrix in each training fold, one-way ANOVA screening was rank-based rather than based on a fixed p-value threshold. Features were ranked by the ANOVA F-statistic calculated within the relevant outer-training subset, and the top 800 variables were retained for the Master model and the top 200 variables for the Sub model. Competitive adaptive reweighted sampling (CARS) was then used to further select key discriminative variables. Finally, partial least-squares discriminant analysis (PLS-DA) was used to build the classification model and output the probability that each sample belonged to the cancer class, P(cancer).
In the second stage, a cancer-type discrimination Sub model was constructed (Figure 1E) to further distinguish colorectal cancer from lung cancer. Importantly, this stage was trained only on true cancer samples from the current training fold and did not include any information from the test fold. Within each outer training fold, variables were ranked by the ANOVA F-statistic, and the top 200 variables were retained before linear SVM-RFE; no fixed p-value threshold was applied. After RFE, the retained predictor indices were sorted in ascending column order, and pairwise products were generated from the first 15 standardized predictors, yielding 105 product terms per outer fold. These products were not subjected to an additional RFE step and were treated as statistical model features rather than molecular interactions. The base learners comprised linear discriminant analysis, an RBF-kernel support vector machine, ridge-regularized logistic regression and a bagged-tree ensemble. A meta-learner integrated the outputs of the base models to generate normalized conditional class scores for CRC and LC within the cancer branch.
During prediction (Figure 1F), the normalized class scores from the Master and Sub models were integrated according to hierarchical scoring rules. For any sample, the final class probabilities were determined as follows:
S(HL) = 1 − S(cancer)
S(CRC) = S(cancer) × S(CRC ∣ cancer)
S(LC) = S(cancer) × S(LC ∣ cancer)
These normalized scores were used for hierarchical class ranking and were not interpreted as calibrated clinical risk probabilities. Predictions from all outer test folds were aggregated to obtain out-of-fold (OOF) three-class predictions covering all samples and remaining fully independent of the training process, an approach consistent with recent FTIR-based spectroscopic liquid biopsy studies using rigorous cross-validation strategies [29]. Accuracy, sensitivity, specificity, precision and F1-score were then calculated from the OOF predictions to comprehensively evaluate the classification performance of the proposed two-stage multimodal model.
2.6. Performance Evaluation
The main evaluation metrics included overall accuracy (ACC), class-wise sensitivity (SEN), specificity (SPE), precision (PRE) and F1-score. Because the three classes were not completely balanced, macro-averaged SEN, SPE, PRE and F1-score were also reported. Model stability was evaluated using fold-level means and standard deviations across the outer five folds. The confusion matrix was constructed from all out-of-fold predictions from the outer test folds. Incremental model value was assessed by paired comparison of FTIR-only and multimodal out-of-fold predictions generated from the same participants and identical outer-fold assignments. Differences were quantified using 2000 participant-level stratified paired bootstrap resamples, and paired classification errors were compared using the exact McNemar test.
For the repeated validation analysis, performance metrics were calculated separately from the aggregated outer-test predictions of each repetition. Mean, standard deviation, median, interquartile range, minimum, maximum, and empirical 2.5th and 97.5th percentiles were used to summarize variability across cross-validation partitions. Participant-stratified bootstrap resampling with 2000 resamples per repetition was used to calculate repeat-specific percentile 95% confidence intervals. The empirical intervals across repetitions were interpreted as partition-stability intervals and were distinguished from the bootstrap confidence intervals. Calibration was evaluated from the outer-fold out-of-fold class scores using multiclass and one-versus-rest Brier scores, 10-bin reliability plots, and one-versus-rest logistic calibration intercepts and slopes. Unstable estimates and complete separation were reported explicitly; this analysis assessed internal OOF calibration rather than external calibration. A permutation sensitivity analysis was conducted using 223 completed permutations. For each permutation, class labels were randomly reassigned, outer test-set memberships were replayed, and inner folds were regenerated within the cancer subsets determined by the permuted labels. The implemented preprocessing, feature-selection, model-fitting and stacking procedures were repeated. However, feature selection was not refitted within each inner fold used to generate stacking inputs; therefore, this was not a fully nested feature-selection permutation test. Empirical p values were calculated as (b + 1)/(N + 1), where b was the number of permuted results at least as large as the observed result and N = 223.
For binary tasks, receiver operating characteristic (ROC) curves were plotted and the area under the curve (AUC) was calculated to evaluate the ranking ability of predicted probabilities for the two classes. To analyze screening performance at different decision thresholds, this study calculated the Youden index and used the predicted probability that maximized the Youden index as the Youden threshold. The Youden index is defined as follows:
where SEN denotes sensitivity and SPE denotes specificity. The Youden threshold of 0.676 was used only as an operating point for the binary health-versus-cancer analysis of the Master layer and was not used for final three-class routing. Final class assignment was based on the maximum of the three hierarchically integrated class scores.
J = SEN + SPE − 1
2.7. Assessment of Demographic and Cohort-Related Confounding
Demographic and cohort-related variables were examined before interpreting model performance. Age was summarized using the mean ± standard deviation, and differences among healthy controls, colorectal cancer patients, and lung cancer patients were assessed using one-way analysis of variance. Sex distributions were compared using the chi-square test. These analyses were intended to evaluate whether simple demographic imbalance could provide an obvious alternative explanation for the classification results. Because complete information on recruitment center, collection batch, operator, storage duration, freeze–thaw history, and other pre-analytical variables was not available for all samples, these factors could not be fully tested in the present dataset.
3. Results
3.1. Serum FTIR Spectral Characteristics and Preprocessing Effects
The raw FTIR spectra of serum samples from healthy controls, patients with colorectal cancer and patients with lung cancer showed broadly similar overall profiles, with major absorption peaks located at comparable positions, indicating a common serum molecular-composition background across groups (Figure 2A). In the raw spectra, clear absorption features were observed near 3300 cm−1, 3000–2800 cm−1, 1700–1500 cm−1 and 1300–900 cm−1. These regions are associated mainly with serum proteins, lipids, nucleic acids, phosphate groups and carbohydrates. Although intensity and spectral-shape differences were present in some bands between categories, the three groups, especially colorectal cancer and lung cancer samples, still showed substantial overlap. This indicates that stable multiclass discrimination is difficult using only overall intensity differences in raw spectra.
Figure 2.
Serum FTIR spectral characteristics and preprocessing effects in healthy controls, colorectal cancer and lung cancer. (A), raw FTIR spectra of the three groups; (B), mean spectra of healthy controls, colorectal cancer and lung cancer; (C), raw spectra of colorectal cancer samples (C1), rubberband baseline correction (C2), Savitzky–Golay smoothing (C3), and second-order finite-difference transformation (C4); (D), local difference spectra in the lipid region (D1) and protein region (D2). Abbreviation: FTIR, Fourier-transform infrared spectroscopy.
The mean spectra of the three groups further showed that healthy controls, colorectal cancer and lung cancer shared highly similar major peak positions, but subtle differences were present in the lipid-related C-H stretching region, protein-related amide region and nucleic-acid- and lipid-related fingerprint regions (Figure 2B). These differences were not characterized by clear separation of a single feature peak, but rather appeared as continuous, low-amplitude spectral-shape changes across multiple bands. This suggests that serum FTIR spectra reflect tumor-related systemic biochemical alterations rather than changes in a single molecular marker. Therefore, subsequent modeling required feature-selection methods to extract locally discriminative information from high-dimensional spectra.
To reduce the effects of baseline drift, background differences and noise on model training, raw spectra from colorectal cancer samples were used as an example (Figure 2C1) and sequentially processed by rubberband baseline correction (Figure 2C2), Savitzky–Golay smoothing (Figure 2C3) and second-order finite-difference transformation (Figure 2C4). Baseline correction reduced low-frequency background variation, smoothing decreased local noise interference, and the second-order finite-difference transformation enhanced local changes in peak shape and differences between adjacent spectral variables. This preprocessing workflow helped reduce non-disease-related background signals and provided more stable input for subsequent feature selection.
To visualize between-group differences more intuitively, local difference spectra in the lipid region (Figure 2D1) and protein region (Figure 2D2) were further enlarged. Local difference spectra highlighted variation in the lipid- and amide-related regions. Supplementary band-area analysis identified overall group differences in normalized lipid and amide areas and their ratio, with pairwise differences primarily involving healthy controls versus cancer groups (Supplementary Figure S1; Supplementary Table S3). None of the six measures showed a significant CRC–LC difference after multiple-testing correction. These overlapping distributions support modest spectral differences without establishing specific molecular changes.
Of the 364 participants, replicate-level raw spectra were available for 278 (147 colorectal cancer and 131 lung cancer samples); no healthy-control samples had retrievable replicate-level raw spectra. The remaining 86 participants were represented by their processed mean spectra and could not be included in the replicate-level repeatability analysis. The median within-sample Pearson correlation was 0.9844, the median RMSE was 0.000455821, and the median mean absolute difference was 0.000140498 across the 278 available pairs. Regional ICC(2,1) estimates with bootstrap 95% confidence intervals are reported in Supplementary Table S4. A low-correlation pair was retained and was not excluded post hoc.
3.2. Performance of the Master Model
The Master model was used for first-stage screening between healthy and cancer samples, with colorectal cancer and lung cancer samples combined into a single cancer group. This stage included 364 serum samples, comprising 64 healthy controls and 300 cancer samples. To avoid data leakage, ANOVA prescreening, CARS feature selection, PLS-DA model training and prediction were all performed within the training folds of the outer five-fold cross-validation, and the test folds were used only for independent prediction. The numbers of training and test samples, the numbers of CARS-selected wavenumbers and the numbers of PLS latent variables in each outer fold are shown in Supplementary Table S2. To ensure consistency with the final three-class results, performance evaluation in this section was based on Master-layer out-of-fold predictions derived from the same outer five-fold validation process of the complete two-stage model.
As shown in Figure 3A, the Master-layer predicted probabilities showed strong ranking ability for healthy and cancer samples. The ROC curve approached the upper-left corner, and the AUC was 0.9999. It should be noted that AUC reflects the ranking ability of predicted probabilities for the two classes and is not equivalent to classification performance at a fixed threshold. Based on the Master-layer predicted probabilities, the optimal Youden threshold was 0.676. At this threshold, the model correctly identified all 64 healthy samples and 299 cancer samples, with one cancer sample classified as healthy. This threshold-based result describes the Master layer alone and should be distinguished from the final hierarchical prediction, which used maximum integrated class score. The accuracy was 0.997, sensitivity was 0.997 and specificity was 1.000 (Table 2).
Figure 3.
Health-versus-cancer screening performance of the Master model. (A), ROC curve based on Master-layer out-of-fold predicted probabilities; (B), confusion matrix after the final hierarchical output was converted into healthy-versus-cancer binary results; (C), PLS-DA score plot of the Master layer; (D), distribution of Master-layer cancer predicted probabilities, with the gray dashed line and black solid line indicating the 0.50 routing threshold and Youden threshold, respectively; (E), frequency of CARS-selected wavenumbers across the outer five folds. Abbreviations: ROC, receiver operating characteristic; PLS-DA, partial least-squares discriminant analysis; CARS, competitive adaptive reweighted sampling.
Table 2.
Binary health-versus-cancer performance of the Master model at different decision thresholds.
In the final output of the complete hierarchical framework, the binary results at the healthy-versus-cancer level were as follows: 63 healthy samples and 300 cancer samples were correctly identified, one healthy sample was finally classified as cancer, and no cancer sample was missed (Figure 3B). The corresponding accuracy, sensitivity, specificity and F1-score were 0.997, 1.000, 0.984 and 0.998, respectively. This result indicates that the complete two-stage model maintained a high cancer detection rate while producing only a small number of false-positive healthy samples.
The PLS-DA score plot further showed distributional differences between healthy and cancer samples in latent-variable space (Figure 3C). Healthy samples were mainly distributed in the negative direction of the first PLS component, whereas cancer samples shifted overall toward the positive direction. Although the cancer group showed some internal dispersion, which was expected because colorectal cancer and lung cancer were merged into one cancer class, the two groups were generally well separated, supporting the rationality of using the Master layer for preliminary screening between healthy and cancer samples.
The predicted probability distribution showed clear ranking differences between healthy and cancer samples in Master-layer cancer probabilities (Figure 3D). Cancer probabilities for healthy samples were mainly concentrated near 0.50, ranging from 0.472 to 0.656, with a median of 0.513. Cancer samples generally showed higher probabilities, ranging from 0.638 to 0.773, with a median of 0.728. Further comparison of different decision thresholds showed that, when the default 0.500 threshold was used, the Master layer identified all 300 cancer samples, but 47 healthy samples were also routed to the cancer-candidate branch, resulting in low specificity. The Youden threshold calculated from the ROC curve was 0.676. At this threshold, all 64 healthy samples were correctly identified, but one cancer sample fell below the threshold and was classified as healthy (Table 2). These results indicate that the Master-layer predicted probability had good ranking ability for health-versus-cancer discrimination. The 0.500 threshold favored higher cancer detection, whereas the Youden threshold achieved a better balance between sensitivity and specificity. This threshold analysis was used only to evaluate Master-layer screening performance; the final three-class results were determined according to the hierarchical probability rules described in Section 2.6.
The CARS feature-selection results are shown in Figure 3E. Across different outer training folds, CARS-selected wavenumbers repeatedly appeared in multiple regions, indicating that Master-layer discrimination did not rely on a single wavenumber point but used joint information from multiple spectral regions. The repeatedly selected wavenumbers were mainly distributed in lipid-, protein- and carbohydrate-related absorption regions, which is consistent with the involvement of multicomponent metabolic and structural changes in serum-based cancer screening.
These results show that the Master layer exhibited strong internal health-versus-cancer discrimination under the complete two-stage outer cross-validation procedure in the present cohort. Its predicted probabilities had high ranking performance, and the final hierarchical output produced only one false-positive healthy sample and no missed cancer sample.
3.3. Performance of the Sub Model
After the Master model completed health-versus-cancer screening, a Sub model was further established to discriminate colorectal cancer from lung cancer within cancer samples. This stage included 300 cancer samples, comprising 160 colorectal cancer samples and 140 lung cancer samples. The Sub model used feature-level fusion data from FTIR spectral features and clinical biochemical indices as input, and standardization, ANOVA prescreening, SVM-RFE recursive feature elimination, second-order interaction-feature construction and stacking model training were performed sequentially within each outer training fold.
Based on the Sub-layer out-of-fold predictions derived from the same outer five-fold cross-validation of the complete two-stage model, the Sub model achieved high classification performance for colorectal cancer versus lung cancer (Figure 4 and Table 3). The ROC curve approached the upper-left corner, and the AUC was 1.000, indicating strong probability-ranking ability for the two cancer classes (Figure 4A). At the fixed threshold of 0.50, the Sub model correctly identified all 160 colorectal cancer samples and all 140 lung cancer samples in the originally reported outer five-fold partition, with no misclassification between the two cancer types (Figure 4B). All five outer test folds therefore produced identical performance metrics of 1.000, resulting in an across-fold SD of 0.000. However, performance was not uniformly perfect across independently generated partitions. Across 20 repeated five-fold analyses, Sub-model accuracy was 0.9937 ± 0.0047 and macro-F1 was 0.9936 ± 0.0047, with accuracy ranging from 0.9833 to 1.0000 (Supplementary Table S5).
Figure 4.
Colorectal cancer/lung cancer discrimination performance of the Sub model. (A), ROC curve based on Sub-layer out-of-fold predictions; (B), confusion matrix; (C), distribution of lung cancer predicted probabilities, with dashed and solid lines indicating the 0.50 threshold and Youden threshold, respectively; (D), distribution of lung cancer predicted probabilities in outer test folds; (E), five-fold selection frequency of features and second-order interaction terms. Second-order interaction terms were products of two standardized features.
Table 3.
Classification performance of the Sub model for colorectal cancer versus lung cancer discrimination.
The normalized class-score distribution further showed clear separation between the two cancer classes in the Sub-model output space. When the conditional lung-cancer class score was used as the horizontal axis, colorectal cancer samples were mainly concentrated in the low-probability range, whereas lung cancer samples were concentrated in the high-probability range (Figure 4C). Probability distributions across different outer test folds showed consistent trends, with colorectal cancer samples generally below 0.50 and lung cancer samples generally above 0.50, indicating good stability of the Sub model under different training/test partitions (Figure 4D).
Feature-selection analysis showed that several original FTIR variables were repeatedly selected across the outer folds (Figure 4E). Pairwise product terms, including 3221.01 cm−1 × 2556.56 cm−1, 3222.44 cm−1 × 2556.56 cm−1, and 3222.44 cm−1 × 3221.01 cm−1, were also generated across the five outer training folds. These terms were calculated as products of standardized predictors and were used solely as statistical representations of possible non-additive predictive patterns. They do not correspond to new infrared absorption peaks or demonstrate interactions between the underlying molecular constituents. Their recurrence across the current folds indicates consistency under the specified feature-generation procedure but does not exclude dataset-specific statistical effects. The fold-wise frequencies of the original biochemical variables and pairwise product terms are reported in Supplementary Table S6.
3.4. Final Three-Class Performance Evaluation of the Two-Stage Hierarchical Model
After completion of the Master model for health-versus-cancer screening and the Sub model for colorectal cancer-versus-lung cancer discrimination, the outputs of the two stages were integrated according to hierarchical probability rules to obtain final predictions for healthy controls, colorectal cancer and lung cancer.
In the primary saved OOF analysis, the final model achieved an accuracy of 0.9973, a macro-averaged AUC of 0.9999, and a macro-F1 score of 0.9963 (Figure 5A; Table 4). Across 20 repeated outer five-fold analyses, the mean macro-AUC, macro-sensitivity, macro-specificity, and macro-F1 were 0.9992 ± 0.0010, 0.9895 ± 0.0044, 0.9951 ± 0.0025, and 0.9914 ± 0.0038, respectively. The corresponding partition-stability intervals were 0.9954–1.0000, 0.9783–0.9952, 0.9889–0.9984, and 0.9815–0.9963. Participant-stratified bootstrap 95% confidence intervals were calculated separately within each repetition using 2000 resamples. The results are reported in Supplementary Table S7 and Supplementary Figure S2.
Figure 5.
Final three-class performance of the two-stage hierarchical multimodal model. (A), one-vs-rest ROC curves and macro-averaged AUC; (B), out-of-fold prediction confusion matrix; (C), hierarchical probability space, with dashed lines indicating the 0.50 threshold; (D), distribution of predicted probabilities corresponding to the true class of each sample. Abbreviations: ROC, receiver operating characteristic; AUC, area under the curve.
Table 4.
Final three-class performance metrics of the two-stage hierarchical model.
The archived permutation analysis was not used to support the primary saved-OOF estimate because its observed performance statistics correspond to a separate analysis path. Therefore, the existing permutation results are not interpreted as a significance test for the primary 0.9973 accuracy estimate. A permutation analysis matched to the primary saved-OOF pipeline would be required before such inference could be reported.
Calibration analysis yielded a multiclass Brier score of 0.3638. The class-specific Brier scores were 0.1082 for healthy controls, 0.1373 for colorectal cancer, and 0.1183 for lung cancer. One-versus-rest calibration regressions were unstable for all three classes, and complete separation occurred for lung cancer. Reliability plots showed compressed score ranges and abrupt changes in observed frequency across adjacent bins. Thus, the normalized scores showed strong discrimination but should not be interpreted as calibrated clinical risk probabilities (Supplementary Table S8 and Supplementary Figure S3).
The confusion matrix further showed that only one of 364 samples was misclassified (Figure 5B). Specifically, 63 of 64 healthy controls were correctly identified and one was misclassified as colorectal cancer, whereas all 160 colorectal cancer samples and all 140 lung cancer samples were correctly classified. Class-wise metrics showed that healthy controls had a sensitivity of 0.9844 and an F1-score of 0.9921; colorectal cancer had a sensitivity of 1.0000 and an F1-score of 0.9969; and lung cancer had precision, sensitivity and F1-score values of 1.0000 (Table 4). These results indicate that no cancer sample was classified as healthy and that no mutual misclassification occurred between colorectal cancer and lung cancer, which is important for both cancer screening and subsequent typing.
The hierarchical score space showed the probability sources of the final classification results (Figure 5C). The first-stage cancer probability mainly separated healthy controls from cancer samples, whereas the second-stage conditional lung cancer probability further separated colorectal cancer from lung cancer within cancer samples. Healthy controls, colorectal cancer and lung cancer samples showed clear distributional differences across the two probability dimensions, indicating that the two-stage framework can map health-versus-cancer screening and cancer-type discrimination to different discriminative dimensions.
The distribution of normalized class scores corresponding to the true labels of each class further showed that the predicted probabilities of the three classes were relatively concentrated and displayed a degree of separation (Figure 5D). Because final class assignment was based on the relative magnitude of the three integrated class scores rather than a fixed threshold from a single stage, the model could comprehensively use probability outputs from both the Master and Sub stages to make the final decision.
These results show that two-stage hierarchical integration achieved high internal discrimination between colorectal cancer and lung cancer in the present cohort. Because the analysis was performed in a clinically assembled cohort with incomplete information on some recruitment and pre-analytical variables, the result should not be interpreted as evidence that cohort-specific confounding has been fully excluded.
3.5. Ablation Experiments and Comparison with Control Models
To evaluate the contribution of the biochemical inputs, we performed a matched comparison of the same two-stage hierarchical pipeline with and without biochemical variables. The same 364 participants, random seed, and stratified outer-fold assignments were used, with the biochemical inputs as the only changed component. The results of this matched comparison are reported in Supplementary Table S9. The additional control-model comparisons in Table 5 used different modeling strategies and were interpreted descriptively rather than as isolated estimates of biochemical contribution.
Table 5.
Ablation experiments and comparison with control models under different feature inputs and modeling strategies.
Single-modality comparisons showed that clinical biochemical indices alone had limited discriminatory ability for the three-class task. Among the three biochemical models, stacking achieved relatively high performance, but its F1-score was only 0.746 and its overall accuracy was 0.706. The F1-scores of SVM-RBF and PLS-DA were 0.730 and 0.729, respectively. In contrast, FTIR-only models showed substantially stronger discrimination, with CARS-PLS-DA achieving an F1-score of 0.982, higher than spectral stacking and SVM-RBF. These results indicate that, in the present three-class task, FTIR spectra provided the main disease-related molecular-fingerprint information, whereas routine biochemical indices alone were insufficient to support high-precision classification.
The results also showed that the performance of spectral models did not simply improve with classifier complexity. CARS-PLS-DA outperformed spectral stacking and SVM-RBF, suggesting that, for high-dimensional and strongly collinear serum FTIR spectral data, stable variable selection and low-dimensional discriminant modeling are more important than directly using complex classifiers. CARS can reduce the influence of redundant wavenumbers and noise variables, whereas PLS-DA is suitable for handling the correlated structure among spectral variables. Therefore, their combination achieved more stable classification under the single-spectral condition.
The primary saved OOF predictions for the final hierarchical model yielded an accuracy of 0.9973 (363/364; Table 4). The separate estimate of 0.9918 arose from a different seed/random-state path. In a controlled loader comparison with the source code, inputs, seed, random-state handling, and outer folds held fixed, both loader versions yielded the same 0.9973 accuracy and confusion matrix; thus, the loader correction did not account for the 0.9918 estimate. To assess the contribution of biochemical inputs, we compared otherwise identical two-stage hierarchical pipelines using the same 364 participants, seed, and outer-fold assignments, changing only the biochemical inputs. The FTIR-only pipeline achieved an accuracy of 0.9863, macro-F1 of 0.9874, and macro-AUC of 0.9998; the FTIR-plus-biochemistry pipeline achieved 0.9835, 0.9852, and 0.9994, respectively. Paired bootstrap 95% confidence intervals for the multimodal-minus-FTIR differences were −0.0082 to 0 for accuracy, −0.0067 to 0 for macro-F1, and −0.0013 to 0.0001 for macro-AUC. This matched comparison did not demonstrate incremental predictive value from the biochemical inputs (Supplementary Table S9).
Two-stage hierarchical modeling further demonstrated the advantage of task decomposition. The ANOVA-RFE-stacking two-stage model achieved an F1-score of 0.985, with overall performance similar to that of weighted probability fusion, but its structure better matched the clinical screening workflow, namely health-versus-cancer screening followed by cancer-type discrimination within cancer samples. On this basis, the final model used CARS-Master as the first-stage screening model and combined it with the ANOVA-RFE-stacking Sub model for cancer-type discrimination, increasing the F1-score to 0.996 and the ACC to 0.997. This result indicates that the stability of first-stage health-versus-cancer screening is critical for the entire hierarchical framework.
The matched comparison did not demonstrate an incremental predictive contribution from the biochemical inputs. Under otherwise identical hierarchical modeling procedures, the FTIR-only pipeline showed slightly higher point estimates than the FTIR-plus-biochemistry pipeline, but the paired confidence intervals included zero.
3.6. Feature-Selection Results and Biological Interpretation
To interpret the discriminative basis of the two-stage hierarchical model, spectral features and biochemical indices selected by the final model were visualized. Figure 6A shows that key FTIR wavenumbers selected by the Master and Sub models were not randomly distributed but were mainly concentrated in the 3600–3000 cm−1, 1700–1500 cm−1, 1300–1000 cm−1 and 1000–700 cm−1 regions. These regions overlap with bands commonly assigned to protein O-H/N-H stretching vibrations, amide I/II, phosphate groups, carbohydrates, and nucleic acids. However, because serum FTIR bands overlap substantially, these assignments are tentative and do not identify the molecular origin of the selected features.
Figure 6.
Key feature distribution and multimodal interpretation of the two-stage model. (A), distribution of key FTIR wavenumbers selected by Master CARS and Sub ANOVA-RFE on the mean raw spectrum; (B), weighted distribution of selected FTIR features across different spectral regions; (C), Spearman correlation heat map between key FTIR wavenumbers and major biochemical indices; * p < 0.05; (D), relative importance ranking of biochemical indices. Abbreviations: FTIR, Fourier-transform infrared spectroscopy; CARS, competitive adaptive reweighted sampling; ANOVA, analysis of variance; RFE, recursive feature elimination.
Feature distributions differed between the two stages (Figure 6B). Master-model features were mainly distributed in the 3600–3000, 1300–1000 and 1000–700 cm−1 regions, whereas Sub-model features were more concentrated in the 1300–1000 and 1000–700 cm−1 fingerprint regions. Comparison of fold-wise selection frequencies further showed both shared and task-specific patterns (Table 6). The 1043.7–1045.2 cm−1 range was selected in all five outer folds by both models, while the 975.3–976.7 and 788.5–789.9 cm−1 ranges were also consistently selected across the two stages. In contrast, 2844.6 and 1192.0 cm−1 were selected more frequently by the Master model, whereas 1444.4 cm−1 was preferentially selected by the Sub model. These patterns indicate selection consistency within the current outer five-fold analysis and task-specific predictive relevance. Representative key wavenumbers and their tentative molecular vibrational assignments are shown in Table 6. Feature selection reflects predictive association rather than biological causation. In addition, the selected interaction terms are model-derived products of standardized variables and do not represent new absorption bands or specific molecular interactions.
Table 6.
Tentative band-level vibrational contexts of representative FTIR variables selected by the model.
Exploratory Spearman correlation analysis was used to describe associations between selected FTIR variables and biochemical indices (Figure 6C). The correlations were generally weak to moderate and should not be interpreted as evidence of predictive complementarity, causal coupling or a mechanism underlying model performance. Because the variables were selected using the same dataset, these associations may also be affected by post-selection bias and require independent confirmation.
The ranking of biochemical-index importance showed that LDL-C and ApoB had the highest relative predictive importance, whereas Ca, LDH and alpha-HBDH also contributed to the fitted model (Figure 6D). These indices have known physiological associations with lipid transport, energy metabolism, tissue injury and ion homeostasis; however, their model-derived importance does not establish that these biological processes caused the observed discrimination. Consistent with the ablation results in Section 3.5, biochemical indices alone showed limited predictive performance. Although they were included jointly with FTIR variables in the multimodal model, the present results do not establish statistically supported incremental predictive value or mechanistic complementarity between the two data types.
The feature-interpretation results also indicate that the high apparent performance of the final model was not attributable solely to classifier complexity. Rather, it was obtained using selected FTIR variables and biochemical indices within the specified hierarchical modeling framework. However, the selection or joint use of these variables does not establish a causal molecular or metabolic mechanism, and the observed correlations should be interpreted as descriptive predictive associations only.
4. Discussion
In this study, we established a two-stage multimodal chemometric framework for serum sample-based minimally invasive auxiliary discrimination of colorectal cancer and lung cancer. The framework decomposed the three-class task into two analytical subtasks: first identifying health-versus-cancer status and then discriminating colorectal cancer from lung cancer within cancer samples. In the internal outer five-fold out-of-fold evaluation, the final model produced only one misclassification, with no cancer sample classified as healthy and no mutual misclassification between colorectal cancer and lung cancer. However, this result was obtained in a single-center, proof-of-concept cohort and should be interpreted as an internal performance estimate rather than evidence of clinical readiness or generalizable diagnostic performance.
The matched hierarchical comparison did not demonstrate statistically supported incremental predictive value from the biochemical inputs. The FTIR-only pipeline achieved an accuracy of 0.9863, a macro-F1 score of 0.9874, and a macro-AUC of 0.9998, compared with 0.9835, 0.9852, and 0.9994, respectively, for the FTIR-plus-biochemistry pipeline. The paired confidence intervals included zero. The direct control-model comparisons in Table 5 used different modeling strategies and therefore do not isolate the contribution of biochemical variables.
The two-stage structure was another key factor contributing to model performance. Health-versus-cancer differences are usually broader and more systemic, whereas differences between cancer types are subtler and can be masked by shared cancer signals. A direct three-class model must perform screening and typing in the same discriminant space, which may mix decision objectives. In contrast, the two-stage framework first allowed the Master model to capture global cancer-related changes and then allowed the Sub model to focus on subtle signals within cancer samples, thereby reducing interference between tasks. Feature-selection results also supported this interpretation: the Master model focused on regions such as 3600–3000 cm−1, 1300–1000 cm−1 and 1000–700 cm−1, which reflect broad changes in molecular composition, whereas the Sub model was more concentrated in the fingerprint region, suggesting that inter-cancer differences were more local and subtle spectral changes. Compared with previous hierarchical diagnostic studies, the present work differs mainly in its combination of multimodal data, stage-specific feature selection and leakage-controlled validation.
Previous FTIR-based cancer-classification studies have reported encouraging discrimination performance across different cancer types and biological specimens. However, direct numerical ranking is inappropriate because these studies differ in specimen type, cohort composition, disease endpoint, preprocessing procedures, validation design and reported metrics. The present findings should therefore be interpreted within the context of the current cohort and internal validation design rather than as evidence of superiority over previously published methods.
This study also emphasizes the importance of preventing data leakage in high-dimensional spectral modeling. FTIR data are high-dimensional, strongly collinear and usually accompanied by relatively limited sample sizes. If test-set information enters standardization, feature selection or model tuning, performance can be easily overestimated. In the implemented procedure, the outer test fold was excluded from model fitting. However, standardization and feature selection were fitted once using the full outer-training partition before inner cross-validation was used to generate stacking meta-features; these steps were not refitted within the inner training folds. The reported estimates therefore characterize the implemented procedure and should not be interpreted as estimates from a fully nested feature-selection and stacking pipeline. A full nested rerun is required to estimate performance under that design. Although the normalized out-of-fold class scores showed strong discrimination, their calibration was not established. These scores should therefore not be interpreted as externally calibrated clinical risk probabilities. Independent calibration data and external validation are required before using them for clinical risk estimation or screening thresholds. The permutation analysis was conducted as a sensitivity analysis. Because feature selection was not refitted within each stacking inner fold and the observed accuracy came from a separate analysis path, it does not establish the statistical significance of the primary saved-OOF result.
Several limitations should be acknowledged. First, the healthy controls and cancer patients were recruited under different institutional and clinical settings. Therefore, effects associated with recruitment source, institutional practice, or sample handling cannot be excluded by the present internal cross-validation, and external validation using harmonized recruitment and measurement procedures is required. Accordingly, the near-perfect internal classification result should be regarded as hypothesis-generating evidence from a proof-of-concept cohort rather than a definitive estimate of clinical performance.
Although the same documented processing protocol was applied to all cohorts and spectral acquisition was diagnosis-blinded, healthy controls were recruited and collected before the cancer cases. Exact individual storage durations could not be reconstructed, and participant-level measurement-batch assignments were unavailable because samples were measured chronologically. Therefore, diagnostic groups were not sufficiently represented across collection periods for period-held-out validation, and batch-held-out validation could not be performed. Disease effects cannot be fully separated from recruitment-cohort, temporal, storage-related, or measurement-batch effects in this dataset. A group-level summary of recruitment, sample collection, sample handling and storage, and measurement batches is provided in Supplementary Table S10. Second, healthy individuals were the only non-cancer controls. The study did not include clinically relevant comparison groups such as benign pulmonary disease, colorectal polyps, inflammatory bowel disease, infection, or other malignancies. Consequently, the observed health-versus-cancer separation may partly reflect nonspecific inflammatory, nutritional, organ-function, or metabolic differences and cannot establish cancer-specific clinical specificity. Prospective studies should include symptom-matched and disease-relevant controls and should re-estimate specificity, predictive values, and decision thresholds in the intended clinical population. Third, tumor-stage information was incompletely specified in the preliminary hospital diagnoses for 19 lung cancer patients and 151 colorectal cancer patients. Therefore, the present cohort cannot be used to establish stage-independent diagnostic performance or early-stage cancer-screening ability. In addition, because all cancer samples were collected before cancer-directed treatment, the findings may not represent patients receiving treatment or presenting with recurrent, residual or advanced disease in routine clinical practice. Future studies should prospectively collect uniformly coded tumor-stage information and evaluate model performance across clinically defined stage groups. In addition, although this study analyzed the default 0.500 threshold and the Youden threshold in the Master layer, practical decision thresholds for different screening scenarios should be prespecified and externally calibrated according to target-population prevalence, the cost of missed diagnosis and the burden of false positives. Finally, FTIR spectral peak regions overlap. The molecular assignments of key wavenumbers in this study should therefore be interpreted as reasonable inferences based on common peak regions rather than direct molecular identification, and future work may combine metabolomics or proteomics for further validation. Moreover, data-driven feature selection and constructed interaction terms indicate predictive associations only and do not establish that particular molecules or metabolic processes caused the observed discrimination. Although all 364 samples were measured twice on the same dried film and the two spectra were averaged for modeling, replicate-level raw spectra were retrievable for only 278 participants. For the remaining 86 participants, only the processed mean spectrum was retained.
Overall, the internal results support the feasibility of hierarchical task decomposition and stage-specific feature selection rather than demonstrating an advantage from classifier complexity alone. Serum FTIR spectra were the primary information source, whereas the paired analysis did not establish statistically supported incremental predictive value of the biochemical variables. Prospective evaluation of a locked model in independent multicenter cohorts, with complete clinical and pre-analytical metadata and assessment of both discrimination and calibration, is required before clinical screening applications can be considered. A potential implementation workflow would comprise standardized serum collection and storage, ATR-FTIR measurement using the specified dried-film protocol, automated preprocessing and locked-model prediction, with the output interpreted as an auxiliary result alongside established clinical assessment. Serum FTIR spectra provided the main molecular-fingerprint information, biochemical indices supplied functional metabolic context, and the two-stage framework modeled cancer screening and cancer-type discrimination separately. If prospectively validated in independent multicenter cohorts with broader and clinically representative disease spectra, this framework may provide an extensible analytical strategy for serum spectroscopy-assisted discrimination of colorectal cancer and lung cancer.
5. Conclusions
This study developed a two-stage multimodal chemometric framework based on serum FTIR spectra and routine biochemical indices for minimally invasive auxiliary discrimination among healthy controls, colorectal cancer and lung cancer. The framework first used a Master model to screen healthy and cancer samples and then used a Sub model to distinguish colorectal cancer from lung cancer within cancer samples, thereby decomposing multicancer three-class classification into two clinically interpretable decision steps.
In the primary saved OOF analysis, the final model achieved an accuracy of 0.9973, a macro-averaged AUC of 0.9999, and a macro-averaged F1-score of 0.9963. One healthy control was misclassified as colorectal cancer, whereas no cancer sample was misclassified. In a matched comparison of otherwise identical hierarchical pipelines, adding biochemical variables did not demonstrate statistically supported incremental predictive value beyond the FTIR inputs.
Feature interpretation showed that key FTIR wavenumbers selected by the model were mainly distributed in spectral regions associated with proteins, lipids, carbohydrates, nucleic acids and phosphate groups. Routine biochemical indices were included as candidate predictors, but the paired analysis did not establish statistically supported incremental predictive value. These associations are predictive rather than causal and require independent biochemical or omics-based validation. The results were obtained within a framework combining hierarchical task decomposition and stage-specific feature selection. They do not establish a biological mechanism or complementarity between the two modalities.
In summary, two-stage hierarchical modeling that combines serum FTIR spectra with clinical biochemical indices achieved high internal discrimination of healthy controls, colorectal cancer, and lung cancer in the present selected cohort. The findings provide methodological support for further evaluation of serum spectroscopy-assisted multicancer discrimination, but independent multicenter validation is required before conclusions about generalizable diagnostic or screening performance can be drawn. Future work should further validate the model’s generalization ability and clinical applicability in larger multicenter independent cohorts and real clinical settings that include benign diseases and other tumor types.
Supplementary Materials
The following supporting information can be downloaded at: https://www.mdpi.com/article/10.3390/molecules31224202/s1, Table S1, Available histological subtype information for the cancer cohorts; Table S2, Parameter-selection mechanisms in the hierarchical modeling pipeline; Table S3, Quantitative comparison of serum FTIR band areas and area ratios among healthy controls, patients with colorectal cancer, and patients with lung cancer; Table S4, FTIR measurement repeatability; Table S5, Fold-wise classification performance of the Sub model for colorectal cancer-lung cancer discrimination; Table S6, Original biochemical features and constructed pairwise product terms retained in the Sub model; Table S7, Distribution and uncertainty of performance across 20 repeated outer five-fold analyses; Table S8, Calibration assessment of normalized out-of-fold class scores; Table S9, Paired comparison of the FTIR-only and multimodal models under identical outer-fold assignments; Table S10, Summary of cohort recruitment, sample handling, and FTIR measurement batches. Figure S1, Quantitative comparison of serum FTIR band areas and area ratios; Figure S2, Stability of the final three-class model across 20 repeated nested cross-validation analyses; Figure S3, Reliability plots for normalized out-of-fold class scores.
Author Contributions
X.M.: data curation, formal analysis, writing—original draft. Y.Z.: project administration, Data curation, writing—review and editing. Y.Y.: Conceptualization, writing—review and editing. Z.Z.: funding acquisition, investigation, writing—review and editing, project administration. Y.G. and H.C.: investigation, writing—review and editing. All authors have read and agreed to the published version of the manuscript.
Funding
This research was funded by the National Natural Science Foundation of China (Grant Nos. 61501526 and 61178087). It was also supported by horizontal projects (Grant No. HZY24133).
Institutional Review Board Statement
The study was conducted in accordance with the Declaration of Helsinki. The protocol involving healthy volunteers was approved by the Ethics Committee of South-Central Minzu University (protocol code 2024-scuec-044; date of approval: 7 March 2024), and the protocol involving patients with colorectal or lung cancer was approved by the Ethics Committee of Xiangyang Central Hospital (protocol code 2024097; date of approval: 7 September 2024).
Informed Consent Statement
Written informed consent to participate was obtained from all subjects involved in the study.
Data Availability Statement
The data supporting the findings of this study are available from the corresponding author upon reasonable request. The data are not publicly available because they contain potentially sensitive clinical information.
Conflicts of Interest
The authors declare no conflicts of interest.
References
- Kepesidis, K.V.; Stoleriu, M.G.; Feiler, N.; Gigou, L.; Fleischmann, F.; Aschauer, J.; Eiselen, S.; Koch, I.; Reinmuth, N.; Tufman, A.; et al. Assessing lung cancer progression and survival with infrared spectroscopy of blood serum. BMC Med. 2025, 23, 101. [Google Scholar] [CrossRef] [Scilit] [PubMed]
- Delrue, C.; De Bruyne, S.; Speeckaert, M.M. The Promise of Infrared Spectroscopy in Liquid Biopsies for Solid Cancer Detection. Diagnostics 2025, 15, 368. [Google Scholar] [CrossRef] [Scilit] [PubMed]
- Shrivastava, P.K.; Kumar, A.; Aggarwal, Y.; Kumar, A.; Agrawal, A.; Rai, A. Diagnostic accuracy of Vibrational spectroscopy in the diagnosis of oral potentially malignant and malignant disorders: A systematic review and meta-analysis. J. Cancer Res. Ther. 2023, 19, 151–158. [Google Scholar] [CrossRef] [Scilit] [PubMed]
- Wang, D.; Shen, Y.; Qian, H.; Jiang, J.; Xu, W. Emerging advanced approaches for liquid biopsy: In situ nucleic acid assays of extracellular vesicles. Theranostics 2024, 14, 7309–7332. [Google Scholar] [CrossRef] [Scilit] [PubMed]
- Wang, R.; Wang, Y. Fourier Transform Infrared Spectroscopy in Oral Cancer Diagnosis. Int. J. Mol. Sci. 2021, 22, 1206. [Google Scholar] [CrossRef] [Scilit] [PubMed]
- Kochan, K.; Bedolla, D.E.; Perez-Guaita, D.; Adegoke, J.A.; Chakkumpulakkal Puthan Veettil, T.; Martin, M.; Roy, S.; Pebotuwa, S.; Heraud, P.; Wood, B.R. Infrared Spectroscopy of Blood. Appl. Spectrosc. 2021, 75, 611–646. [Google Scholar] [CrossRef] [Scilit] [PubMed]
- Sala, A.; Anderson, D.J.; Brennan, P.M.; Butler, H.J.; Cameron, J.M.; Jenkinson, M.D.; Rinaldi, C.; Theakstone, A.G.; Baker, M.J. Biofluid diagnostics by FTIR spectroscopy: A platform technology for cancer detection. Cancer Lett. 2020, 477, 122–130. [Google Scholar] [CrossRef] [Scilit] [PubMed]
- Vitorino, R.; Barros, A.S.; Guedes, S.; Caixeta, D.C.; Sabino-Silva, R. Diagnostic and monitoring applications using near infrared (NIR) spectroscopy in cancer and other diseases. Photodiagn. Photodyn. Ther. 2023, 42, 103633. [Google Scholar] [CrossRef] [Scilit] [PubMed]
- Wang, S.; Wang, X.; Cui, X.; Xie, X.; Zhu, Z.; Ayaka, T.; Song, R.; Zhou, L.; Sun, J.; Zhang, L.; et al. Machine learning-enhanced confocal Raman imaging enables label-free diagnosis and spatial metabolic profiling of isoniazid-induced hepatotoxicity. Theranostics 2025, 15, 9663–9677. [Google Scholar] [CrossRef] [Scilit] [PubMed]
- Toraman, S.; Girgin, M.; Üstündağ, B.; Türkoğlu, I. Classification of the likelihood of colon cancer with machine learning techniques using FTIR signals obtained from plasma. Turk. J. Electr. Eng. Comput. Sci. 2019, 27, 1765–1779. [Google Scholar] [CrossRef] [Scilit]
- Zhu, K.; Shen, J.; Xu, W.; Yue, K.; Zhu, L.; Niu, Y.; Wu, Q.; Pan, W.; Rajamohan, V. Application of Serum Mid-Infrared Spectroscopy Combined with Machine Learning in Rapid Screening of Breast Cancer and Lung Cancer. Int. J. Intell. Syst. 2023, 2023, 4533108. [Google Scholar] [CrossRef] [Scilit]
- Nuguri, S.M.; Hackshaw, K.V.; de Lamo Castellvi, S.; Bao, H.; Yao, S.; Aziz, R.; Selinger, S.; Mikulik, Z.; Yu, L.; Osuna-Diaz, M.M.; et al. Portable Mid-Infrared Spectroscopy Combined with Chemometrics to Diagnose Fibromyalgia and Other Rheumatologic Syndromes Using Rapid Volumetric Absorptive Microsampling. Molecules 2024, 29, 413. [Google Scholar] [CrossRef] [Scilit] [PubMed]
- Blat, A.; Wiercigroch, E.; Smeda, M.; Wislocka, A.; Chlopicki, S.; Malek, K. Fourier transform infrared spectroscopic signature of blood plasma in the progression of breast cancer with simultaneous metastasis to lungs. J. Biophotonics 2019, 12, e201900067. [Google Scholar] [CrossRef] [Scilit] [PubMed]
- Elmi, F.; Movaghar, A.F.; Elmi, M.M.; Alinezhad, H.; Nikbakhsh, N. Application of FT-IR spectroscopy on breast cancer serum analysis. Spectrochim. Acta Part A Mol. Biomol. Spectrosc. 2017, 187, 87–91. [Google Scholar] [CrossRef] [Scilit] [PubMed]
- Wang, X.; Shen, X.; Sheng, D.; Chen, X.; Liu, X. FTIR spectroscopic comparison of serum from lung cancer patients and healthy persons. Spectrochim. Acta Part A Mol. Biomol. Spectrosc. 2014, 122, 193–197. [Google Scholar] [CrossRef] [Scilit] [PubMed]
- Yonar, D.; Severcan, M.; Gurbanov, R.; Sandal, A.; Yilmaz, U.; Emri, S.; Severcan, F. Rapid diagnosis of malignant pleural mesothelioma and its discrimination from lung cancer and benign exudative effusions using blood serum. Biochim. Biophys. Acta (BBA)-Mol. Basis Dis. 2022, 1868, 166473. [Google Scholar] [CrossRef] [Scilit] [PubMed]
- Yang, X.; Ou, Q.; Qian, K.; Yang, J.; Bai, Z.; Yang, W.; Shi, Y.; Liu, G. Diagnosis of Lung Cancer by ATR-FTIR Spectroscopy and Chemometrics. Front. Oncol. 2021, 11, 753791. [Google Scholar] [CrossRef] [Scilit] [PubMed]
- Bonnier, F.; Blasco, H.; Wasselet, C.; Brachet, G.; Respaud, R.; Carvalho, L.F.; Bertrand, D.; Baker, M.J.; Byrne, H.J.; Chourpa, I. Ultra-filtration of human serum for improved quantitative analysis of low molecular weight biomarkers using ATR-IR spectroscopy. Analyst 2017, 142, 1285–1298. [Google Scholar] [CrossRef] [Scilit] [PubMed]
- Mokari, A.; Guo, S.; Bocklitz, T. Exploring the Steps of Infrared (IR) Spectral Analysis: Pre-Processing, (Classical) Data Modelling, and Deep Learning. Molecules 2023, 28, 6886. [Google Scholar] [CrossRef] [Scilit] [PubMed]
- Imanbekova, M.; Sharma, M.; Wachsmann-Hogiu, S. On the dilemma of using single EV analysis for liquid biopsy: The challenge of low abundance of tumor EVs in blood. Theranostics 2025, 15, 8031–8048. [Google Scholar] [CrossRef] [Scilit] [PubMed]
- Mantsch, H.H. Biomedical Vibrational Spectroscopy in the Era of Artificial Intelligence. Molecules 2021, 26, 1439. [Google Scholar] [CrossRef] [Scilit] [PubMed]
- Zhang, P.; Zou, M.; Wen, X.; Gu, F.; Li, J.; Liu, G.; Dong, J.; Deng, X.; Gao, J.; Li, X.; et al. Development of serum parameters panels for the early detection of pancreatic cancer. Int. J. Cancer 2014, 134, 2646–2655. [Google Scholar] [CrossRef] [Scilit] [PubMed]
- Faubert, B.; Solmonson, A.; DeBerardinis, R.J. Metabolic reprogramming and cancer progression. Science 2020, 368, eaaw5473. [Google Scholar] [CrossRef] [Scilit] [PubMed]
- Hanahan, D. Hallmarks of Cancer: New Dimensions. Cancer Discov. 2022, 12, 31–46. [Google Scholar] [CrossRef] [Scilit] [PubMed]
- Cuprych, P.; Kokot, I.; Szostak, R.; Kratz, E.M.; Mazurek, S. Discrimination of Rheumatoid and Psoriatic Arthritis Based on Raman and NIR Spectra Using Machine-Learning Algorithms. Molecules 2025, 30, 4513. [Google Scholar] [CrossRef] [Scilit] [PubMed]
- Xu, P.; He, J.; Xu, T.; Wang, W.; Wu, B.; Chen, R.; Wang, H.; Yang, Q.; Wu, W.; Sun, D. Synergistic integration of extracellular vesicles and metal-organic frameworks: Unlocking new opportunities in disease diagnosis and therapy. Theranostics 2025, 15, 8609–8638. [Google Scholar] [CrossRef] [Scilit] [PubMed]
- Collins, G.S.; Moons, K.G.M.; Dhiman, P.; Riley, R.D.; Beam, A.L.; Van Calster, B.; Ghassemi, M.; Liu, X.; Reitsma, J.B.; van Smeden, M.; et al. TRIPOD+AI statement: Updated guidance for reporting clinical prediction models that use regression or machine learning methods. BMJ 2024, 385, e078378. [Google Scholar] [CrossRef] [Scilit] [PubMed]
- Kapoor, S.; Narayanan, A. Leakage and the reproducibility crisis in machine-learning-based science. Patterns 2023, 4, 100804. [Google Scholar] [CrossRef] [Scilit] [PubMed]
- Cameron, J.M.; Sala, A.; Antoniou, G.; Brennan, P.M.; Butler, H.J.; Conn, J.J.A.; Connal, S.; Curran, T.; Hegarty, M.G.; McHardy, R.G.; et al. A spectroscopic liquid biopsy for the earlier detection of multiple cancer types. Br. J. Cancer 2023, 129, 1658–1666. [Google Scholar] [CrossRef] [Scilit] [PubMed]
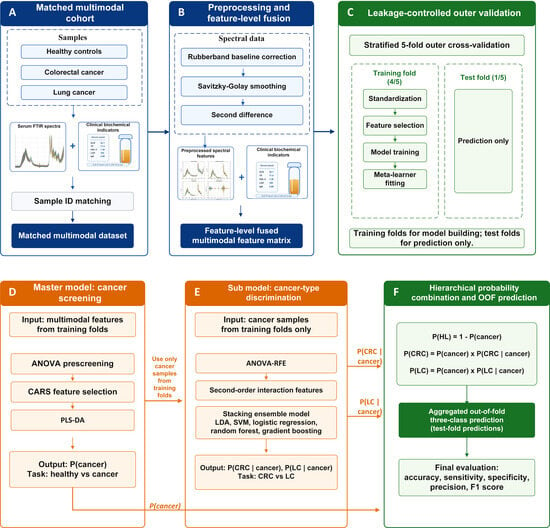
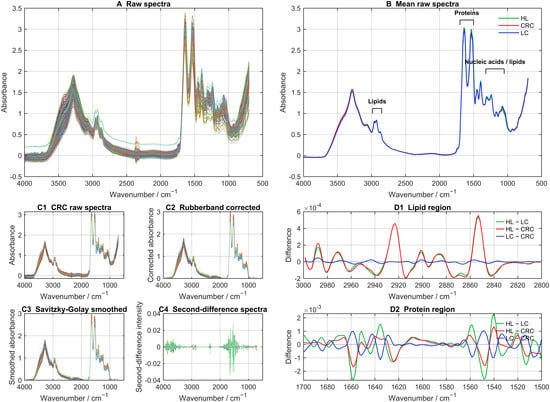
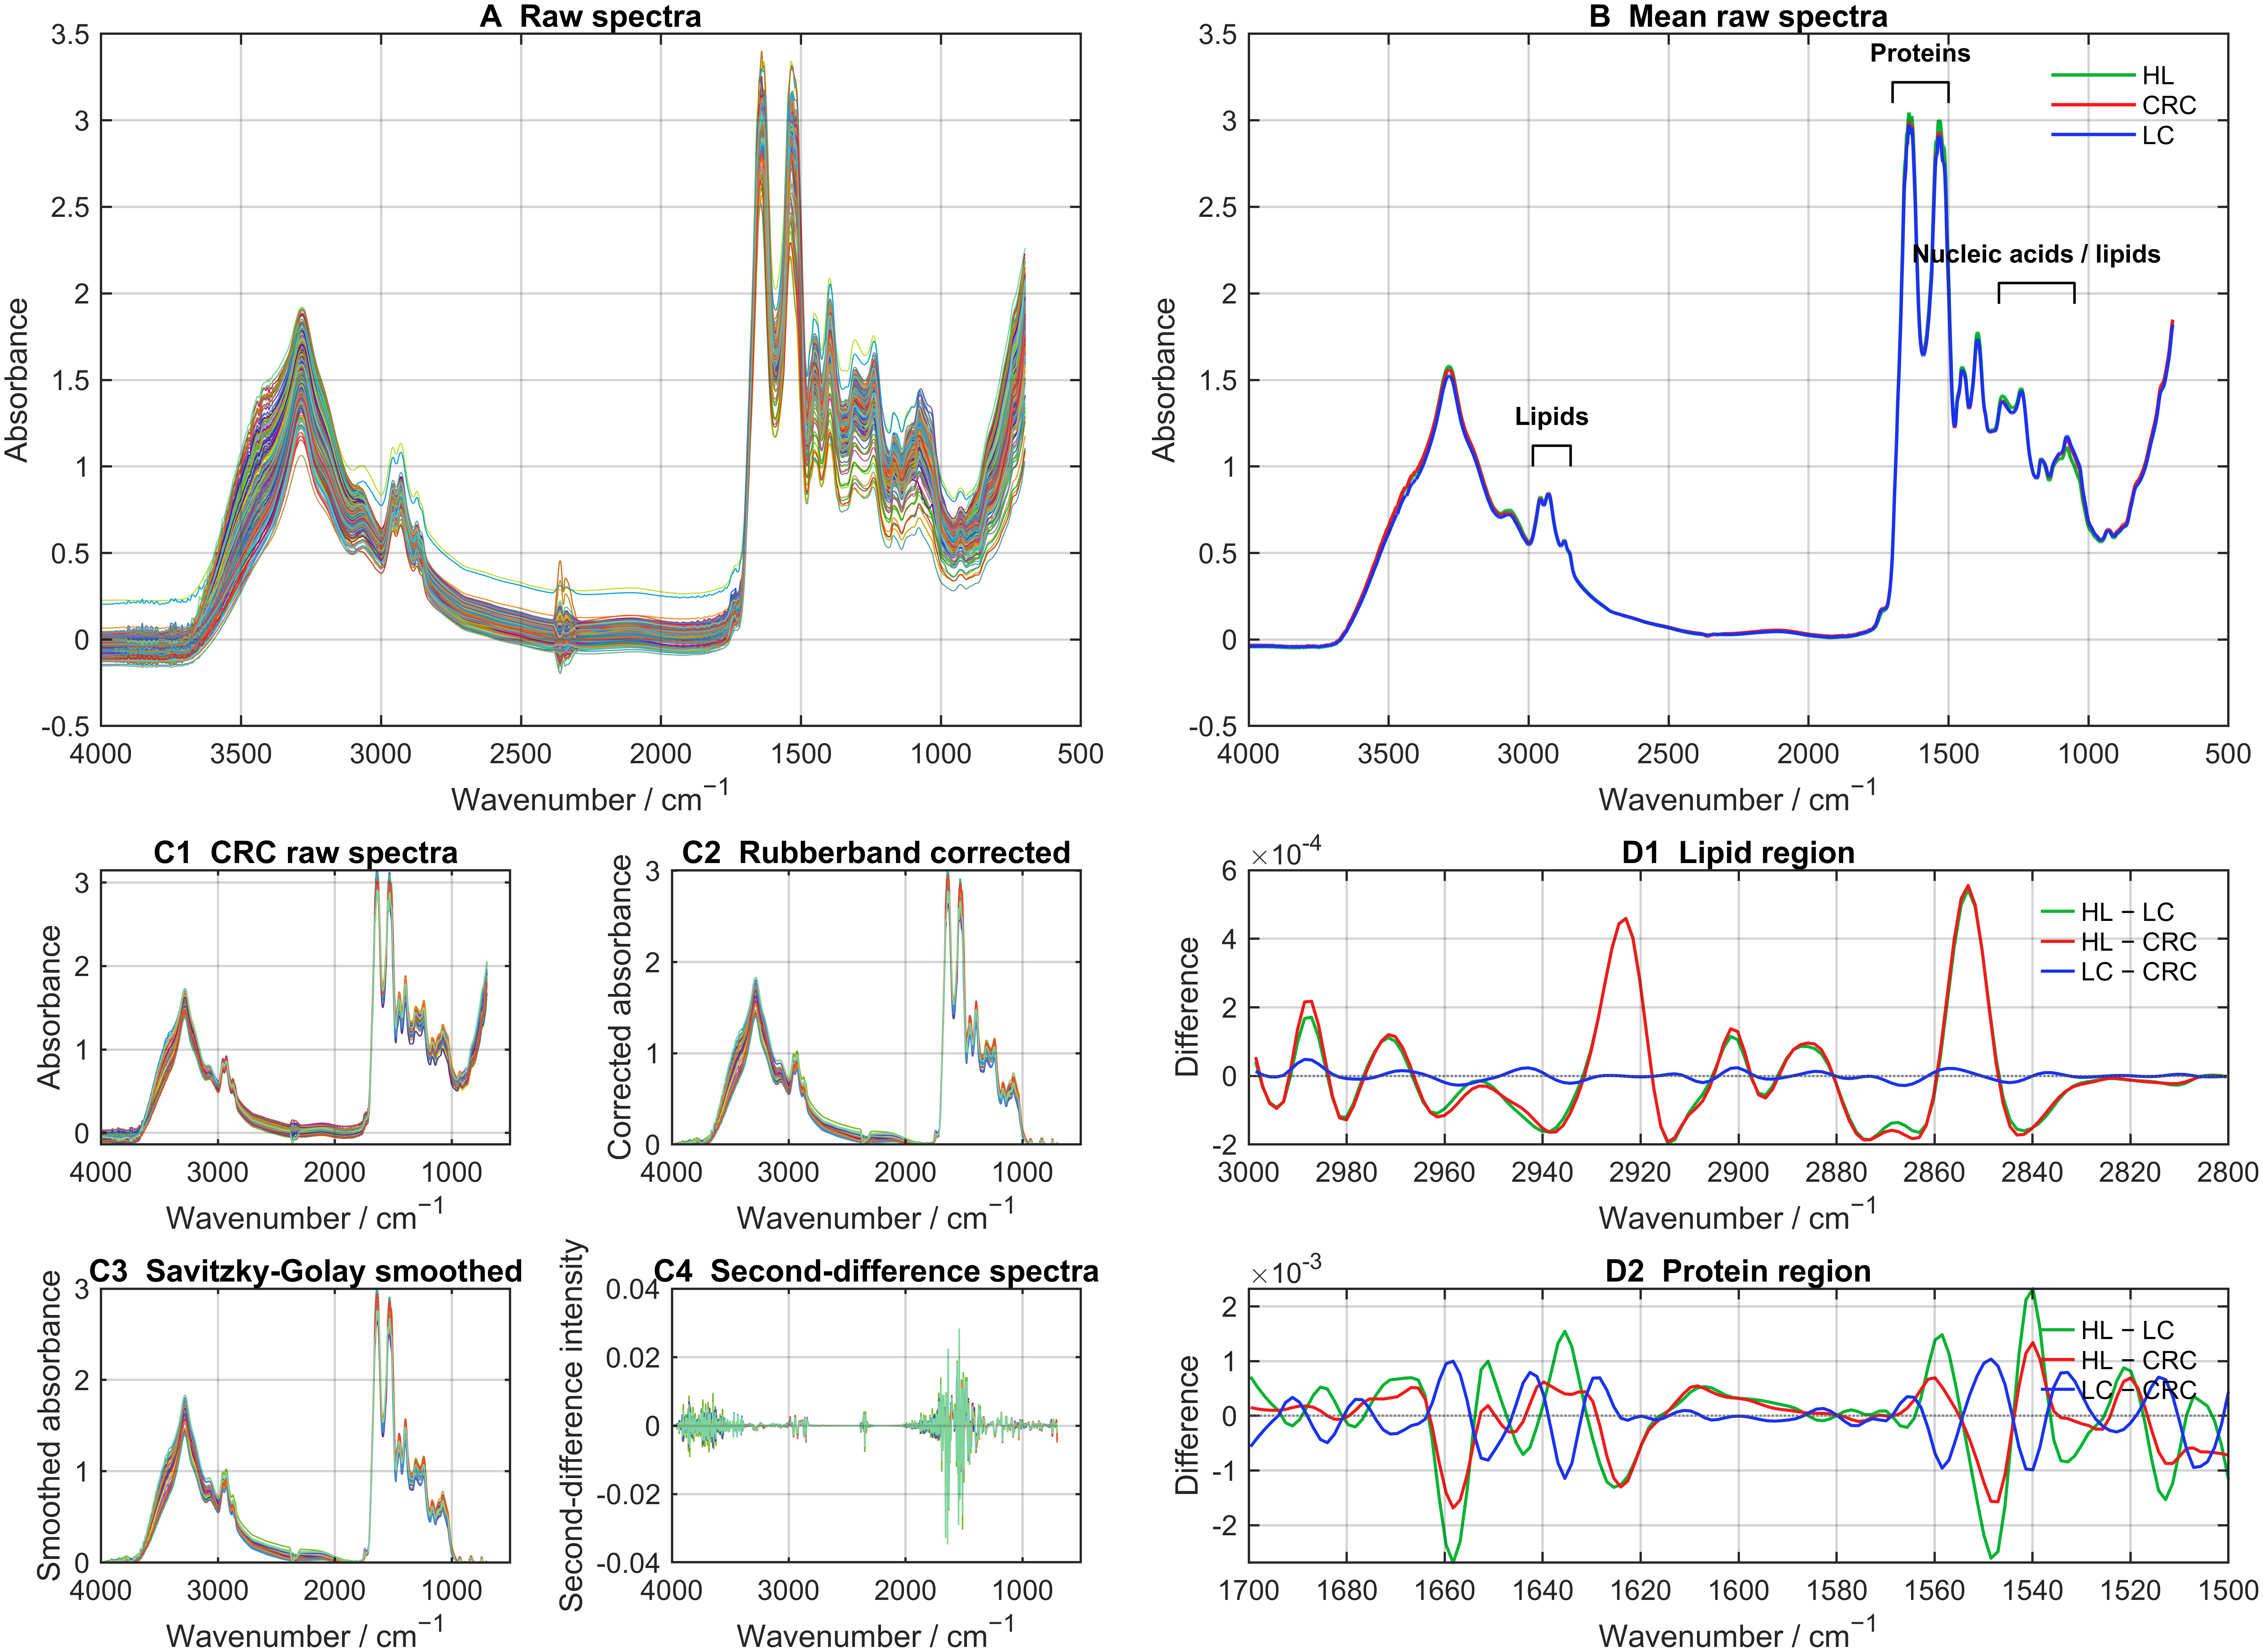
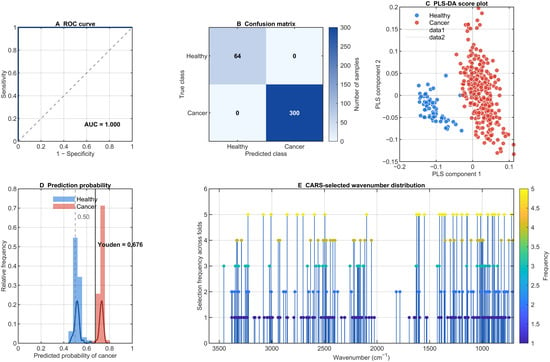
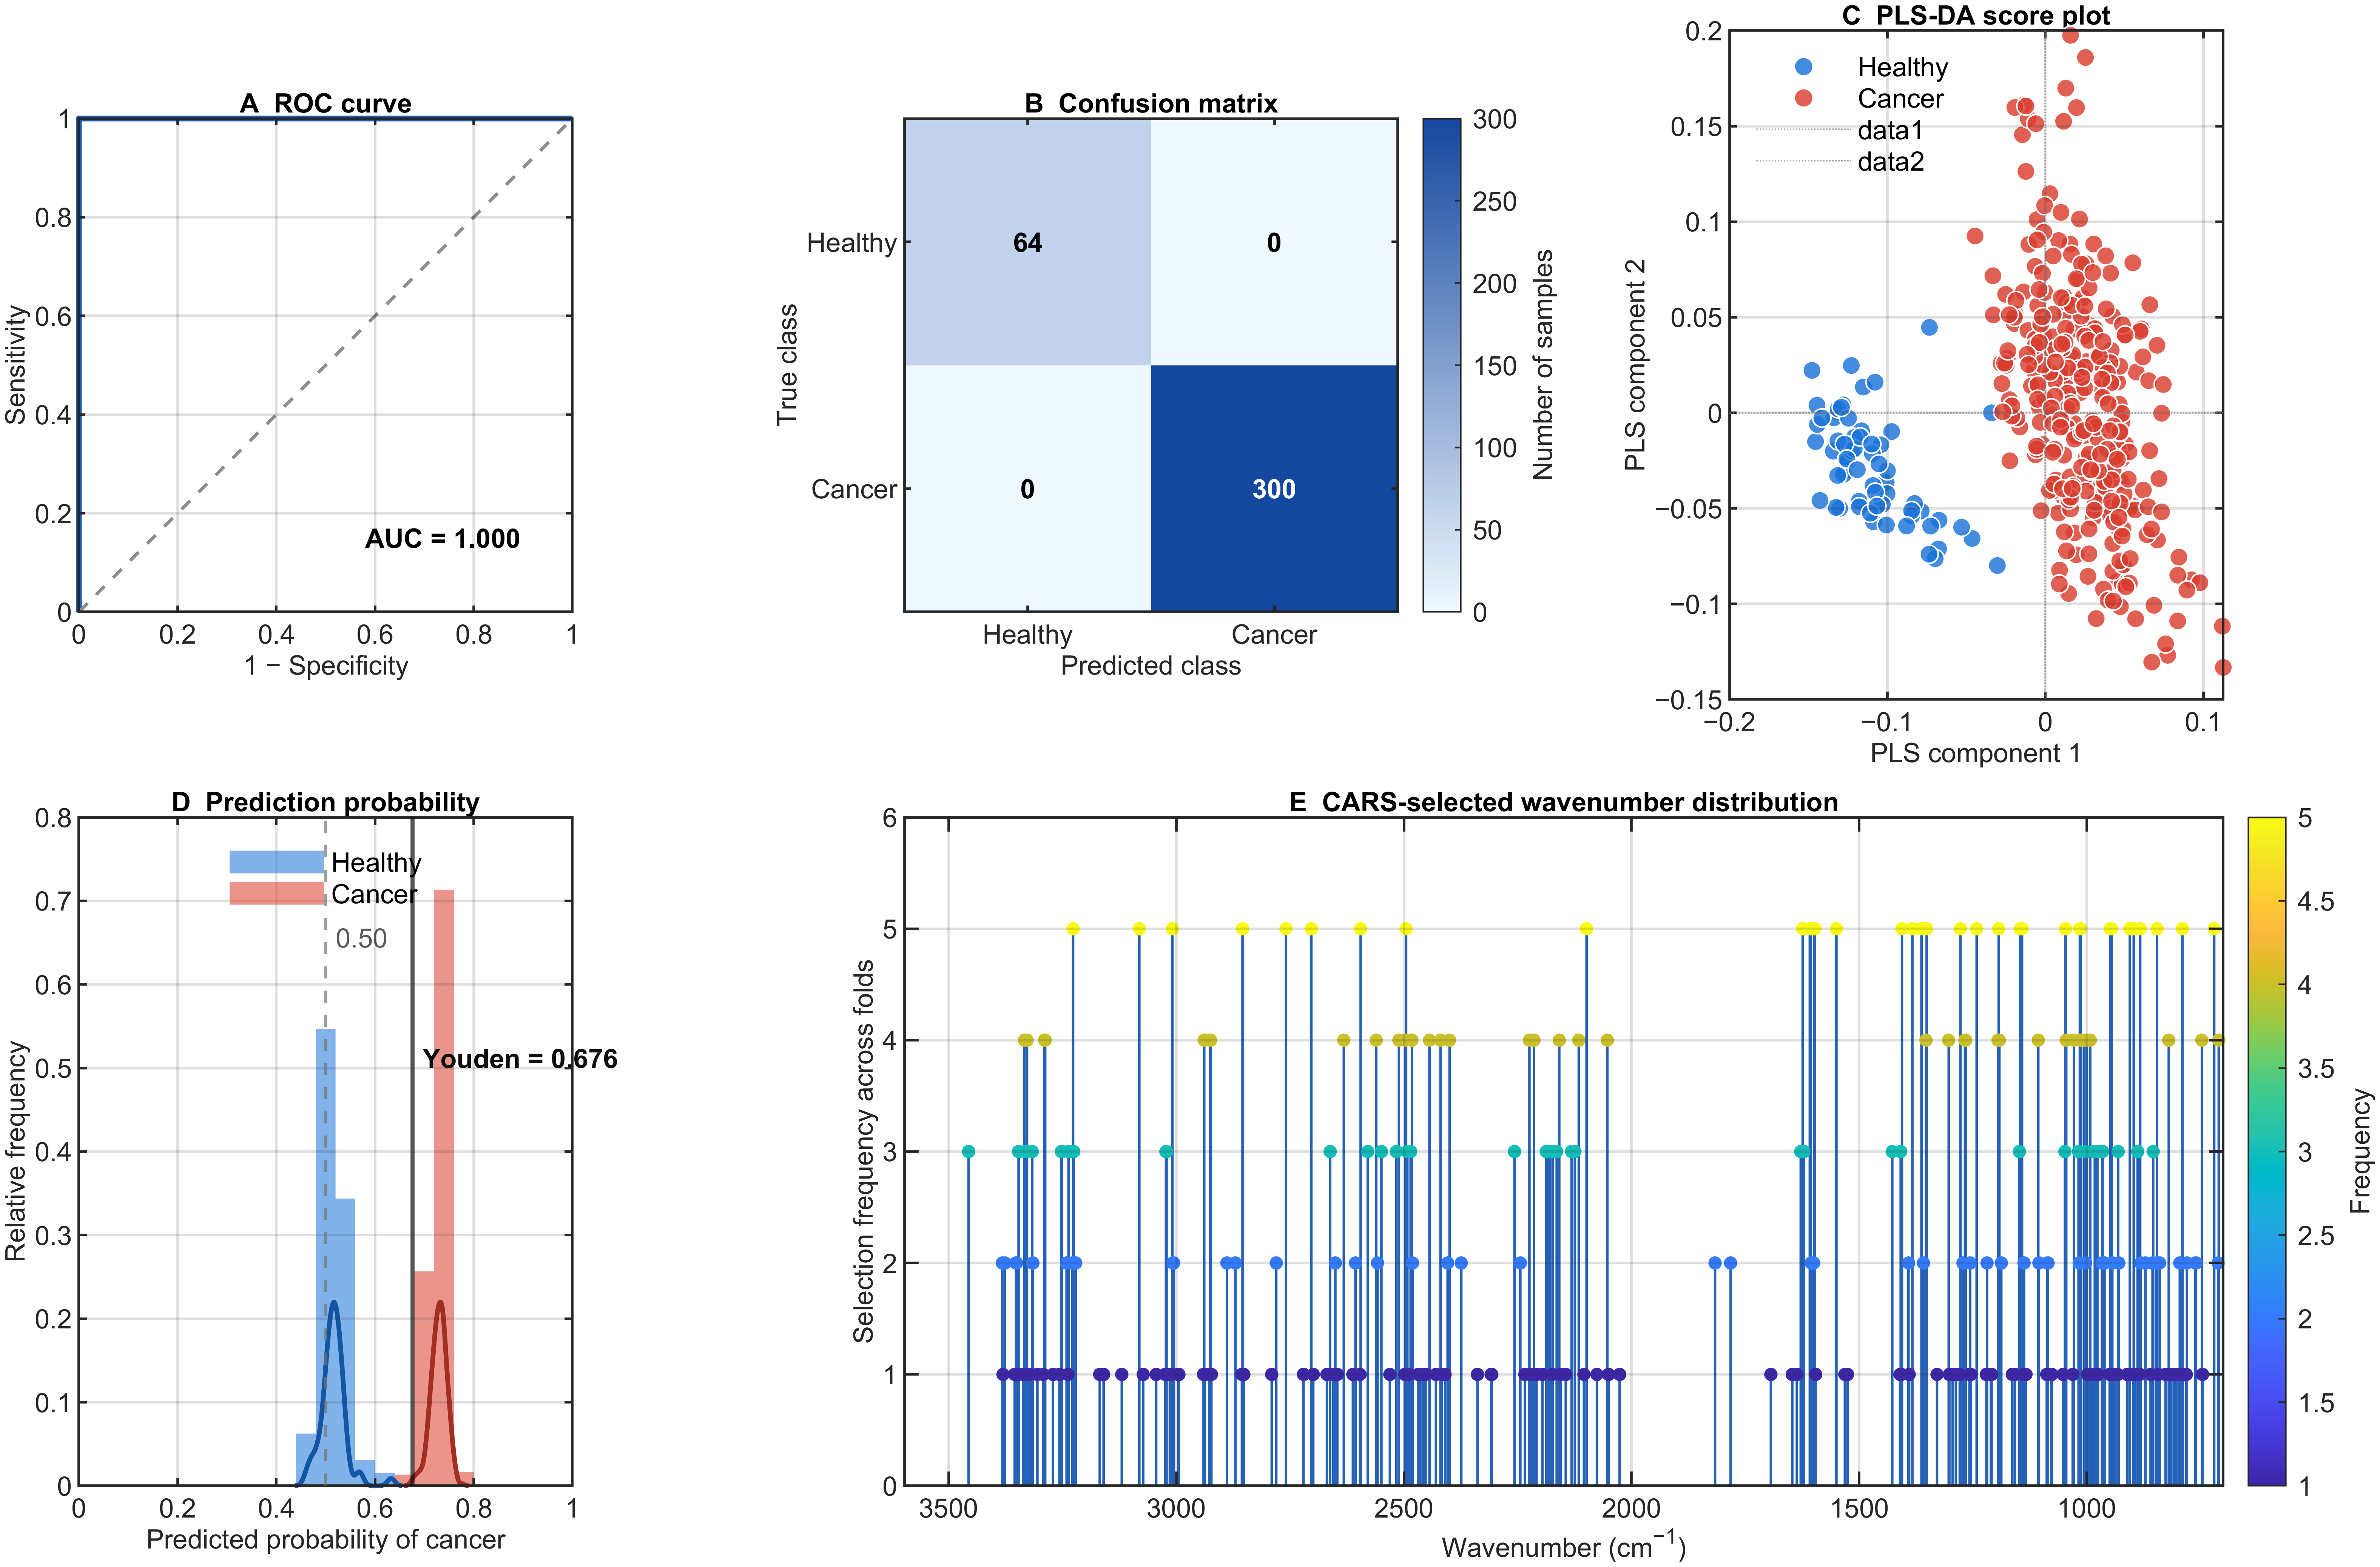
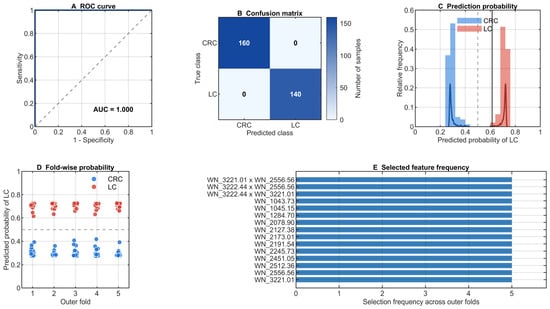
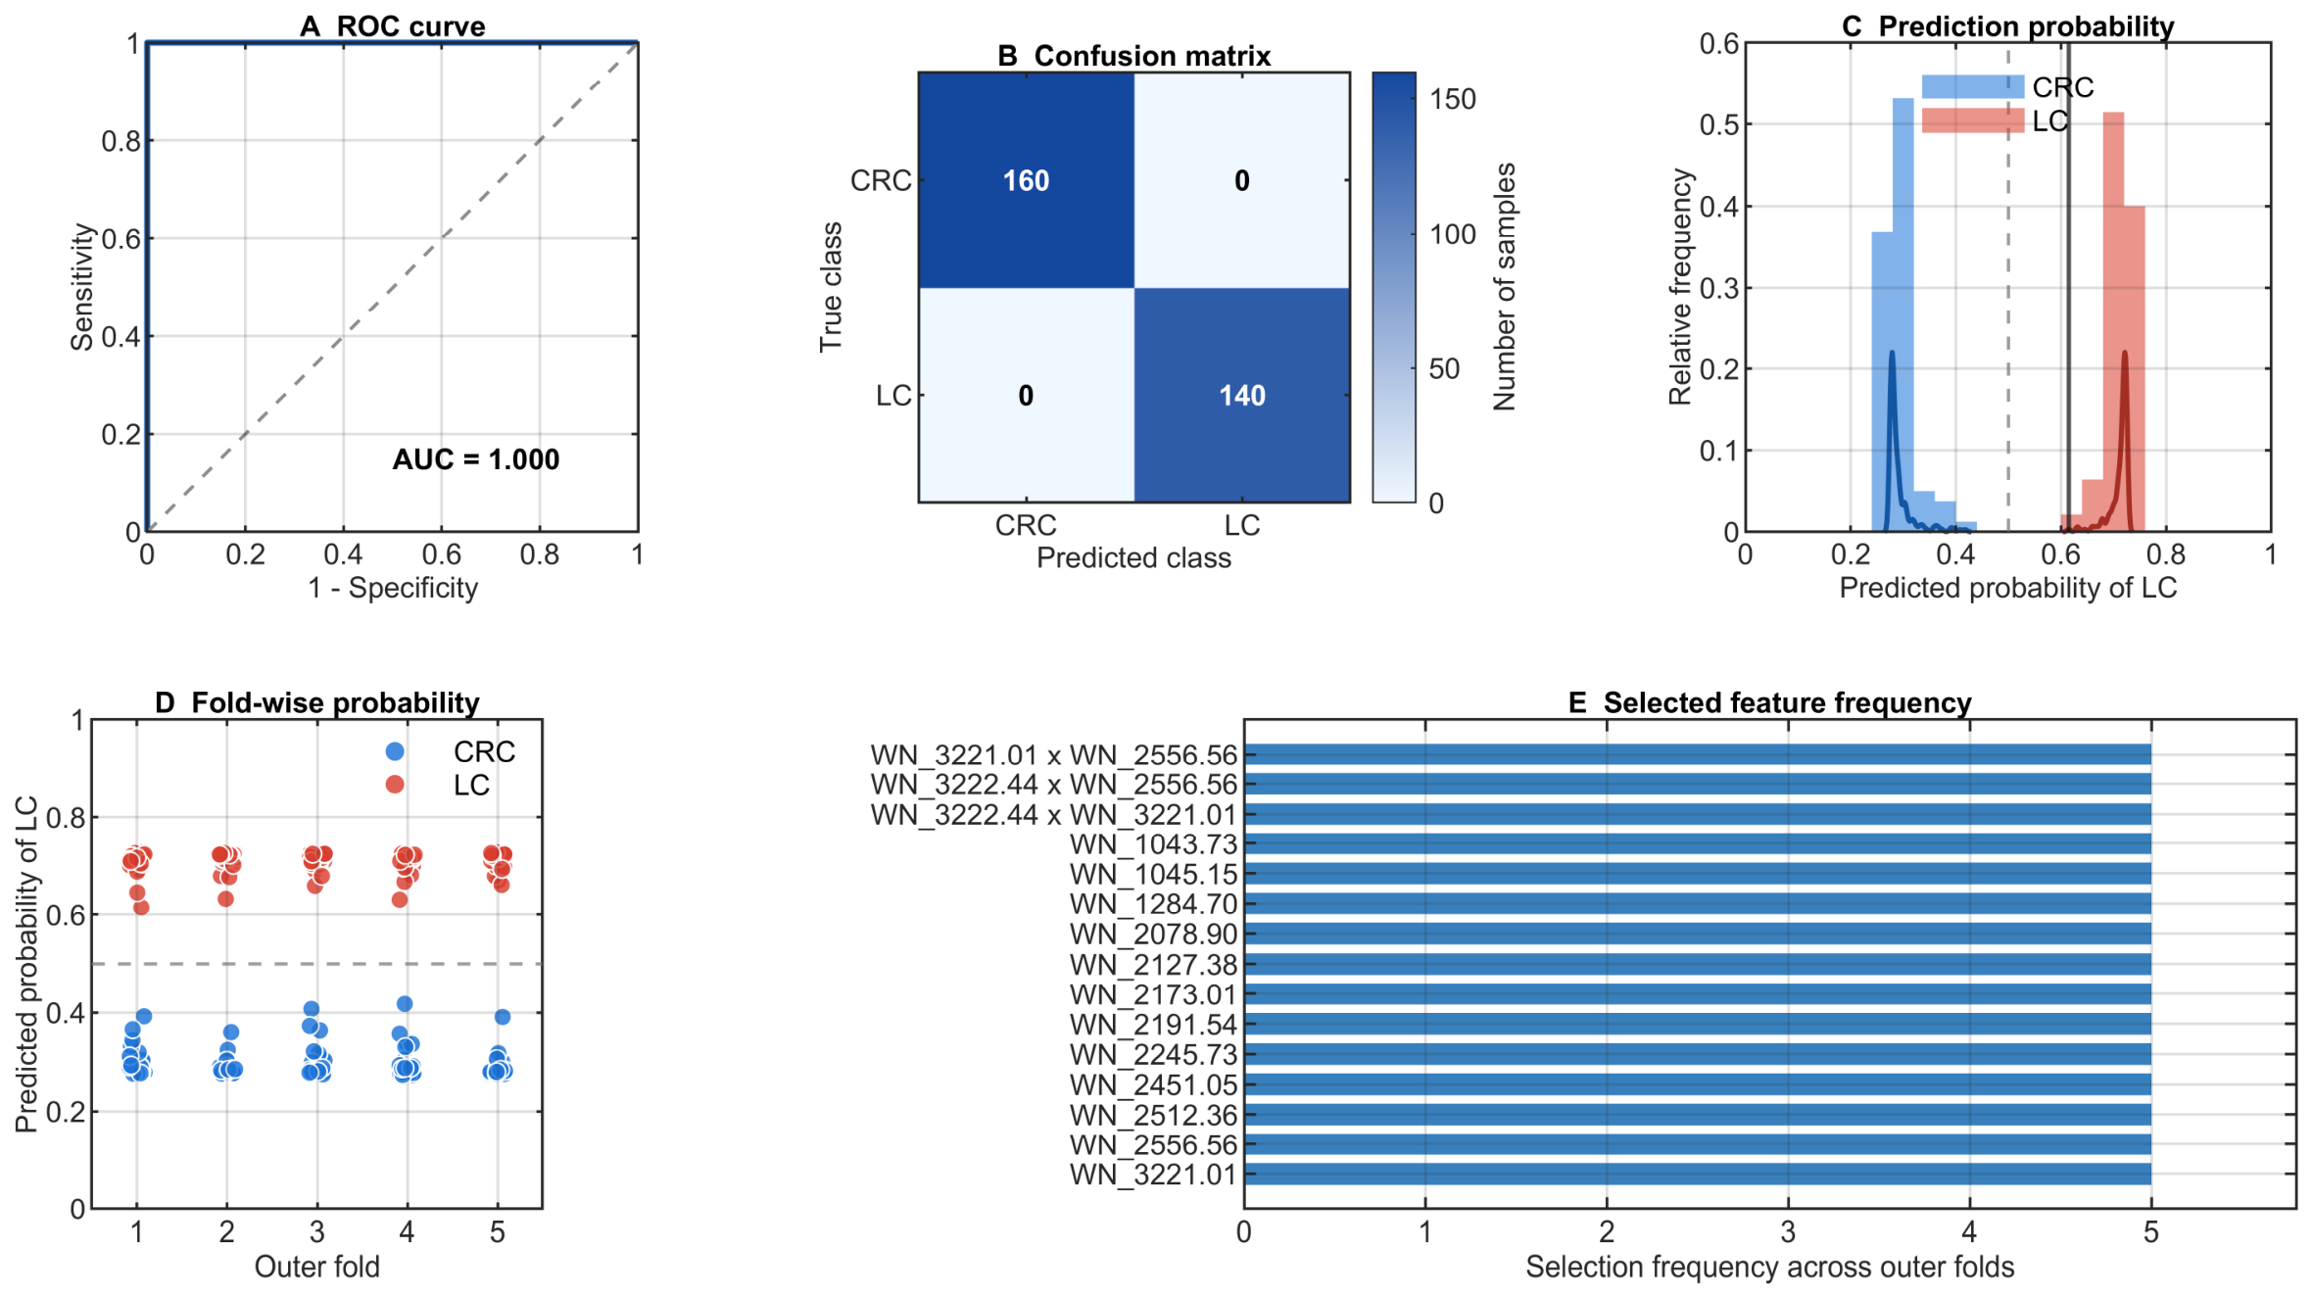
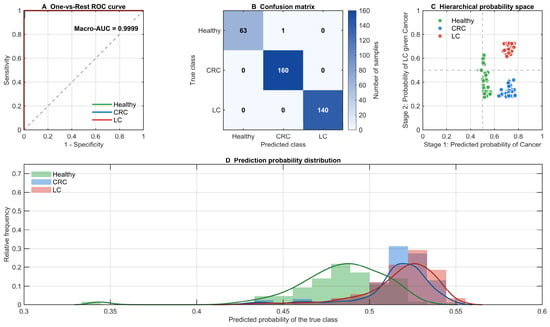
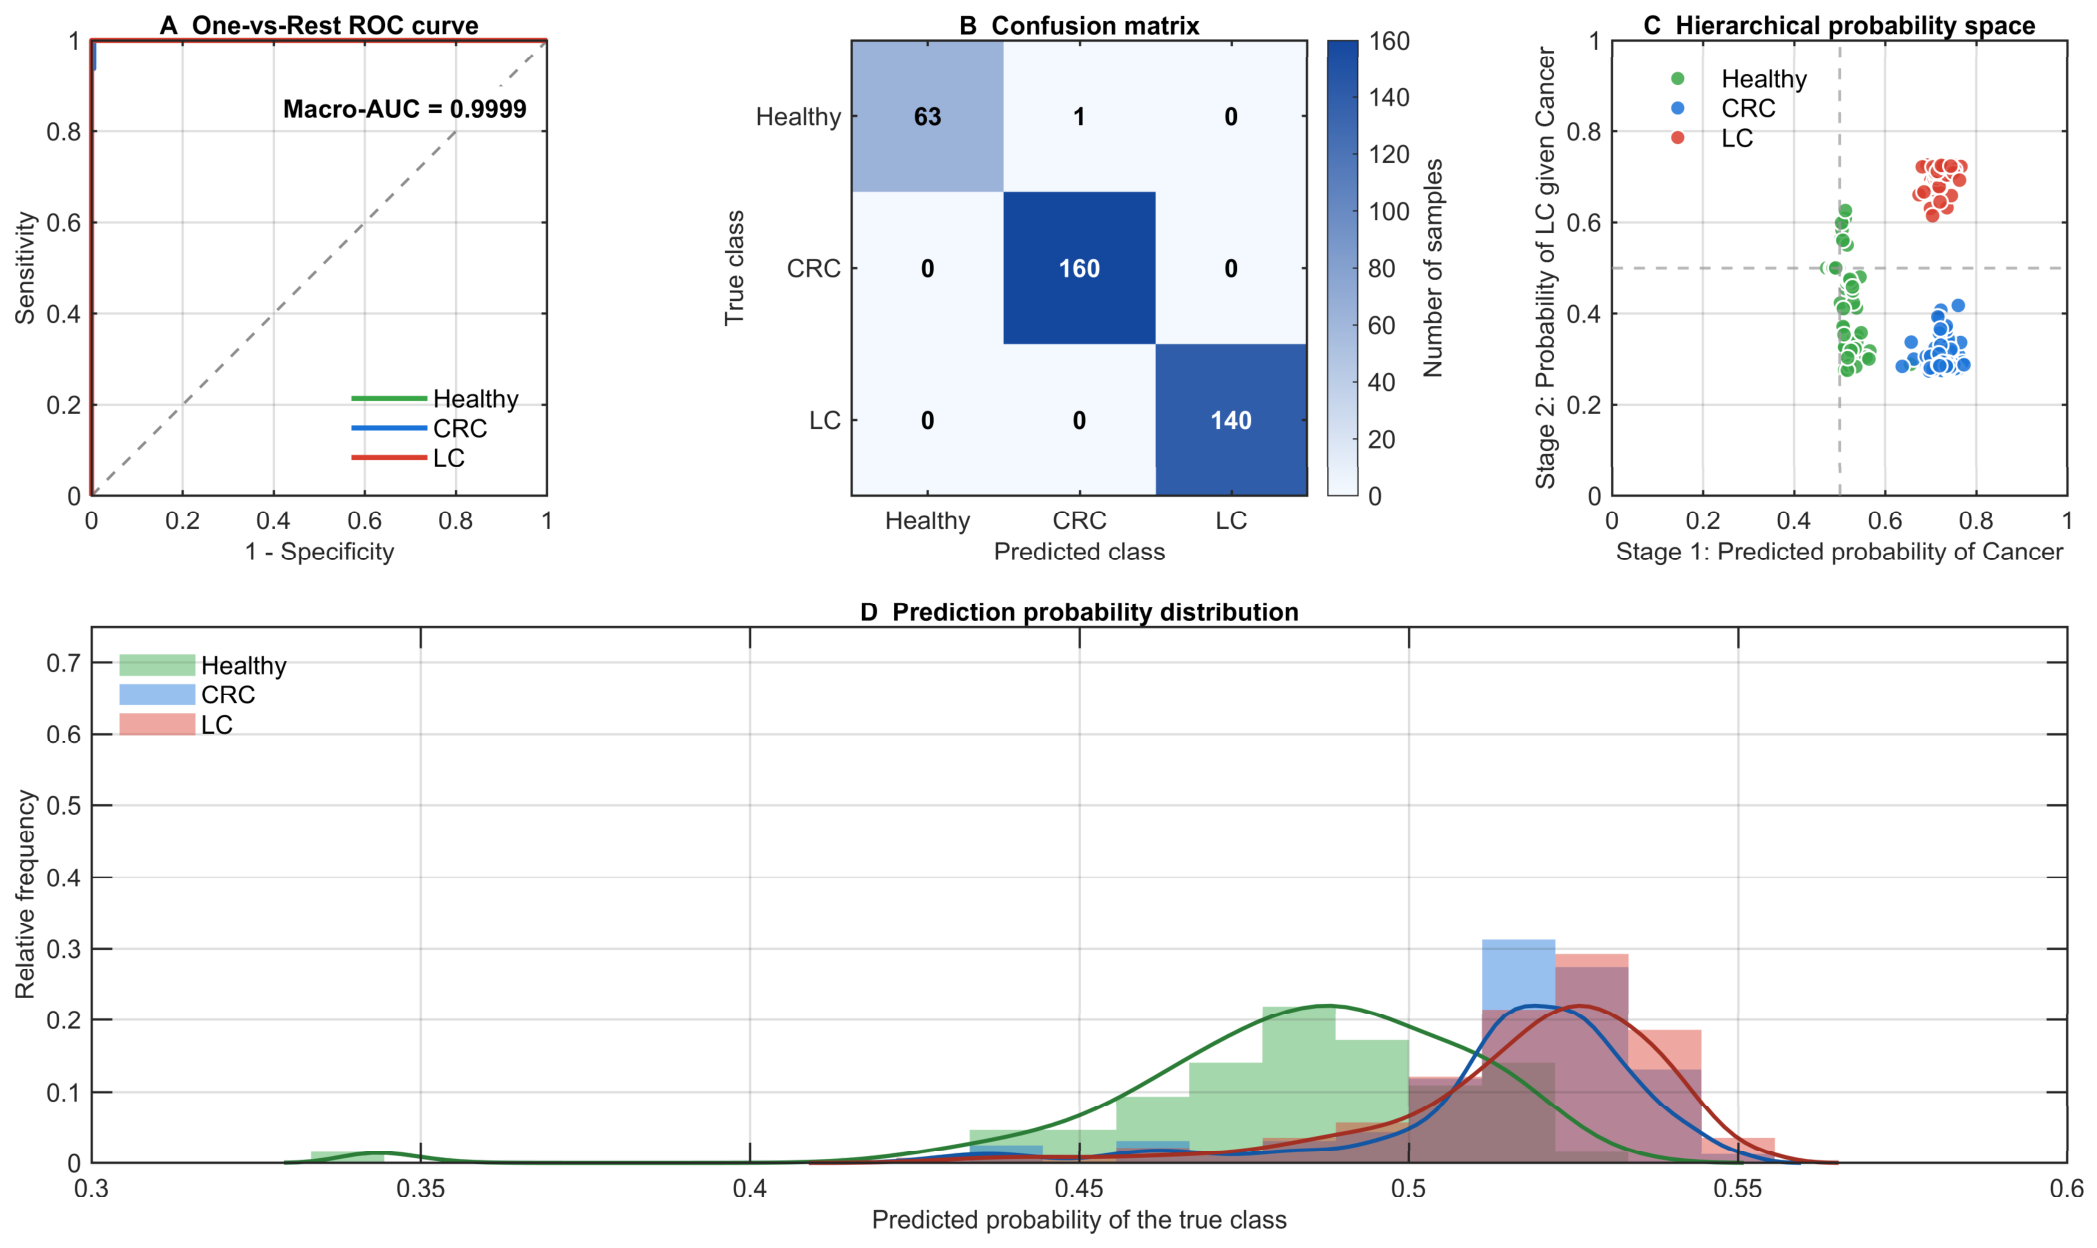
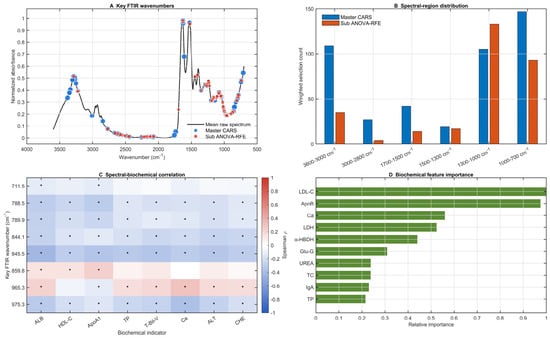
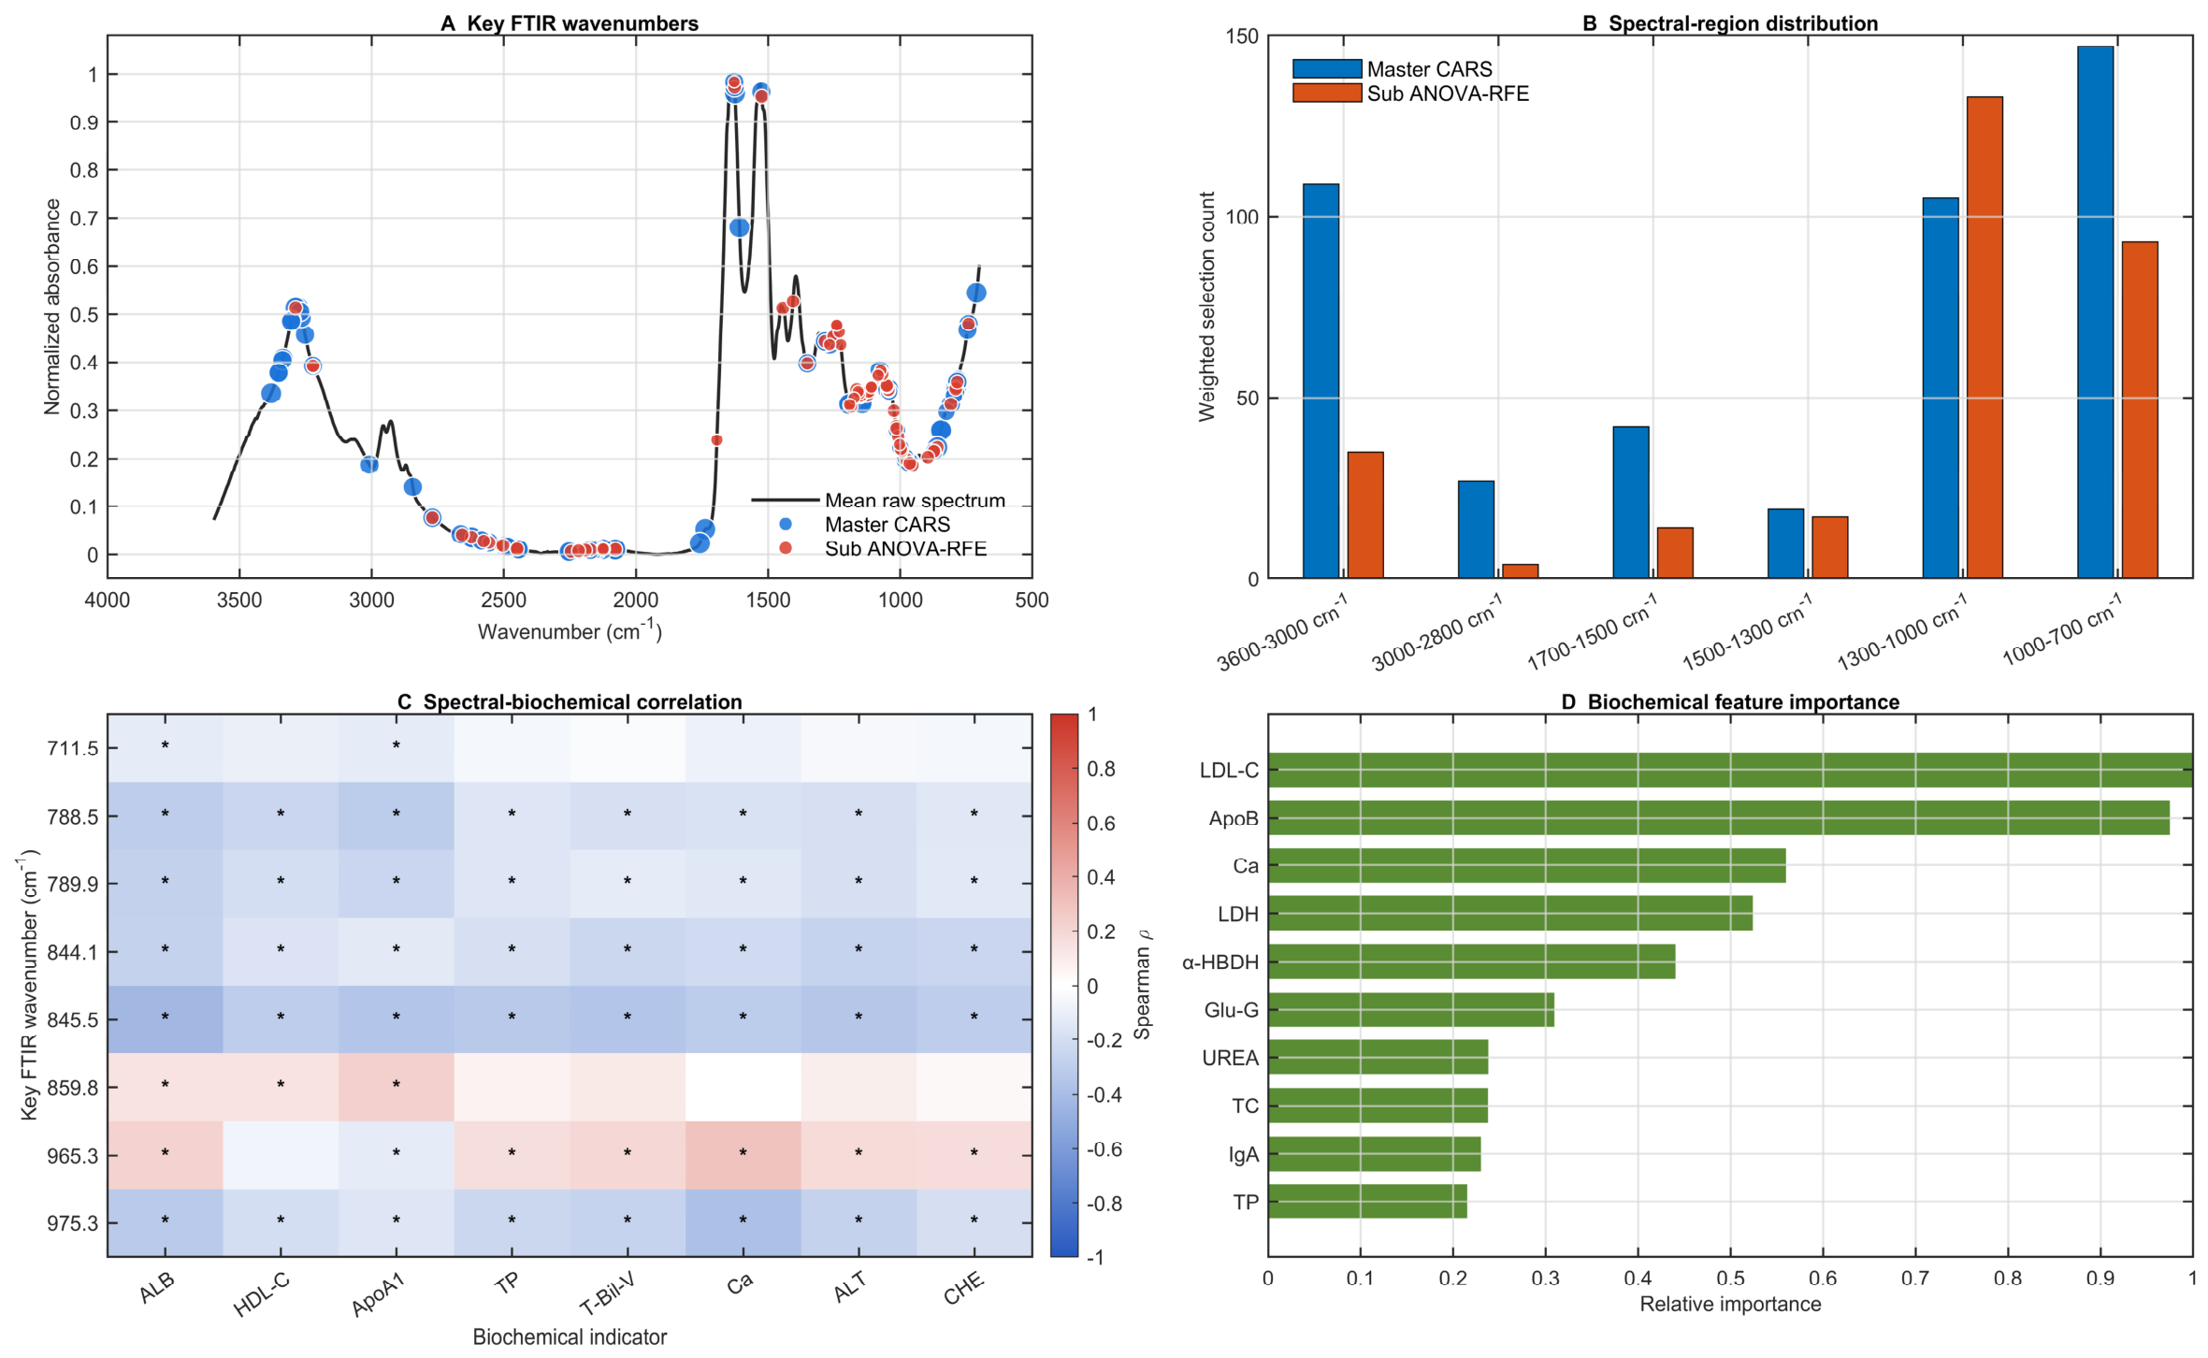

Disclaimer/Publisher’s Note: The statements, opinions and data contained in all publications are solely those of the individual author(s) and contributor(s) and not of MDPI and/or the editor(s). MDPI and/or the editor(s) disclaim responsibility for any injury to people or property resulting from any ideas, methods, instructions or products referred to in the content. |
© 2026 by the authors. Licensee MDPI, Basel, Switzerland. This article is an open access article distributed under the terms and conditions of the Creative Commons Attribution (CC BY) license.