


Abstract
Endogenous fluorophores provide sensitive optical reporters of carbon nanotube (CNT) interactions with vegetable oils. This exploratory study examined cold-pressed rapeseed oil contacted with unmodified, carboxyl-functionalized and amino-functionalized multiwalled CNTs and double-walled CNTs. Fluorescence emission, excitation, and synchronous spectra were recorded immediately after preparation and after 4 and 24 h, with complementary UV-Vis measurements. Emission and excitation revealed strongly material-dependent responses, as follows: red chlorophyll-derived fluorescence was substantially suppressed, whereas carboxyl-functionalized CNTs retained a larger residual signal and enhanced selected UV excitation contributions associated with green-visible emission. After 24 h, red synchronous-fluorescence areas decreased by 66.6–84.9% relative to untreated oil, with centroid displacements below 1.4 nm. In contrast, green-visible synchronous areas increased by 43.1–88.9% and shifted toward longer wavelengths. Principal component analysis distinguished CNT-dependent fingerprints, particularly the carboxylated preparation, and summarized variation associated with contact time. Unbalanced optimal transport-derived descriptors complemented intensity changes with information on spectral redistribution, while two-dimensional correlation spectroscopy identified non-parallel evolution of UV and red spectral domains. These complementary analyses demonstrated that the response cannot be represented by uniform fluorescence attenuation or a single spectral marker. The findings support that UV-Vis and fluorescence combined with chemometrics may be used as a framework for investigating CNT–oil interactions
1. Introduction
Rapeseed oil (RO) consists mainly of triacylglycerols, whereas its UV-Vis and fluorescence spectra are strongly influenced by minor constituents possessing chromophoric systems, including carotenoids, chlorophyll-derived pigments, tocopherols, and phenolic compounds [1,2]. Their optical responses can also change during storage and oxidation [3,4]. These constituents therefore provide accessible reporters of changes in the oil, although a spectral response alone does not establish oil quality or identify a reaction mechanism.
Three spectral domains provide the main analytical landmarks. The 250–350 nm region contains overlapping contributions from UV-active constituents, including tocopherols, phenolic compounds, and oxidation-related chromophores [1,2]. The 430–520 nm region is dominated by pigment-related absorption, particularly carotenoids and the short-wavelength contribution of chlorophyll-related species, whereas the 600–670 nm region contains the characteristic long-wavelength absorption of chlorophyll-related pigments [2,5]. Changes in this range may therefore indicate degradation, adsorption, or optical attenuation of the chlorophyll-related fraction. Chlorophyll pigments are also photochemically active constituents of rapeseed oil and can participate in oxidation-related processes [5].
Fluorescence provides access to selected emissive fractions within this chemically complex matrix. Synchronous and total-luminescence measurements have been used to characterize edible oils [6,7], and fluorescence has been related to chemical measures of rapeseed-oil deterioration during storage [2]. The latter connection is essential, as follows: a spectral response becomes useful for quality assessment when its relationship with an external property is established. Absorption complements fluorescence by reporting overlapping chromophores, including carotenoid-related and chlorophyll-related contributions that are not represented equally in emission.
Carbon nanotubes (CNTs) provide a comparative system for probing between graphitic surfaces and oil constituents. Nanomaterials have been investigated for food analysis, packaging, and separation [8,9], and CNT-based fluorescence sensing provides a broader analytical precedent [10,11]. Dispersion forces and interactions between conjugated molecules and graphitic surfaces can contribute to adsorption, while COOH and NH2 functionalization changes surface polarity and potential hydrogen-bonding sites [12,13]. In a lipid solvent, however, competition with the oil matrix and the accessible surface must be considered; mechanisms established in aqueous systems cannot be transferred directly.
Several processes can contribute to a CNT-induced spectrum, as follows: adsorption, transformation of pigment, altered fluorescence efficiency, aggregation, and optical attenuation. Complementary spectroscopy and chemometrics can help distinguish response patterns without uniquely assigning these processes. UV-Vis studies have characterized changes in heated oils and oxidative status [14,15], while data-fusion has combined complementary spectral information for edible-oil analysis [16,17,18]. Fluorescence studies of other oils provide additional examples of matrix-dependent responses [19]. MCR-ALS and 2D-COS offer established frameworks for resolving overlapping or co-evolving signals [20,21,22,23,24,25]; the present results focus on PCA, spectral descriptors, optimal transport, and 2D-COS.
Adsorption directly in oil is supported by Lv et al., who demonstrated removal of chlorophyll from rapeseed oil using thermally reduced graphene oxide [26]. Modified CNTs and graphene composites have also been applied to contaminant extraction or removal from vegetable oils [27,28,29]. These studies establish feasibility in lipid matrices, but involve materials or solutes different from those examined here. Farkas and Booth demonstrated both chlorophyll adsorption and interference with fluorescence measurements by carbon nanomaterials in algal/extract systems [30]. This evidence supports adsorption as a hypothesis while highlighting the need to separate pigment depletion from optical interference.
The working hypothesis was that controlled CNT contact produces material-dependent responses of endogenous chromophore domains. The workflow asks which domains respond, whether absorption and fluorescence agree, and which interpretable features merit independent chemical validation. Here, “interaction” denotes the measured response of the CNT–oil system; a specific molecular interaction is assigned only when supported by additional evidence.
Four CNT preparations differing in wall structure or functionalization were compared as an exploratory case study. The aims were to identify material- and time-dependent spectral patterns and assess their potential as candidate optical reporters. Compound-specific adsorption, oxidation kinetics, and oil-quality prediction remain validation targets.
2. Results and Discussion
UV-Vis absorption, fluorescence emission, excitation, and synchronous fluorescence were used to compare untreated rapeseed oil (r0) with oil contacted with unmodified multiwalled CNTs (MCNT), amino-functionalized multiwalled CNTs (MCNT-NH2), double-walled CNTs (DCNT), and carboxyl-functionalized multiwalled CNTs (MCNT-COOH). The CNT-contact series comprises 0 h (immediately after preparation), 4 h, and 24 h. Unless stated otherwise, fluorescence percentages refer to untreated oil, whereas time-dependent absorption changes refer to the corresponding CNT-specific 0 h spectrum. These reference states describe different parts of the response and must be kept separate.
2.1. Defining the Model Case: Baseline UV-Vis Characteristics
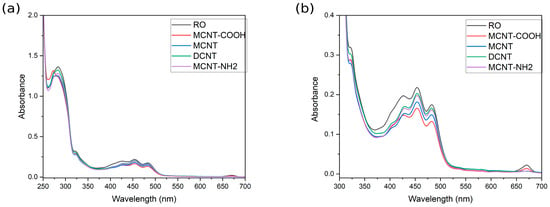
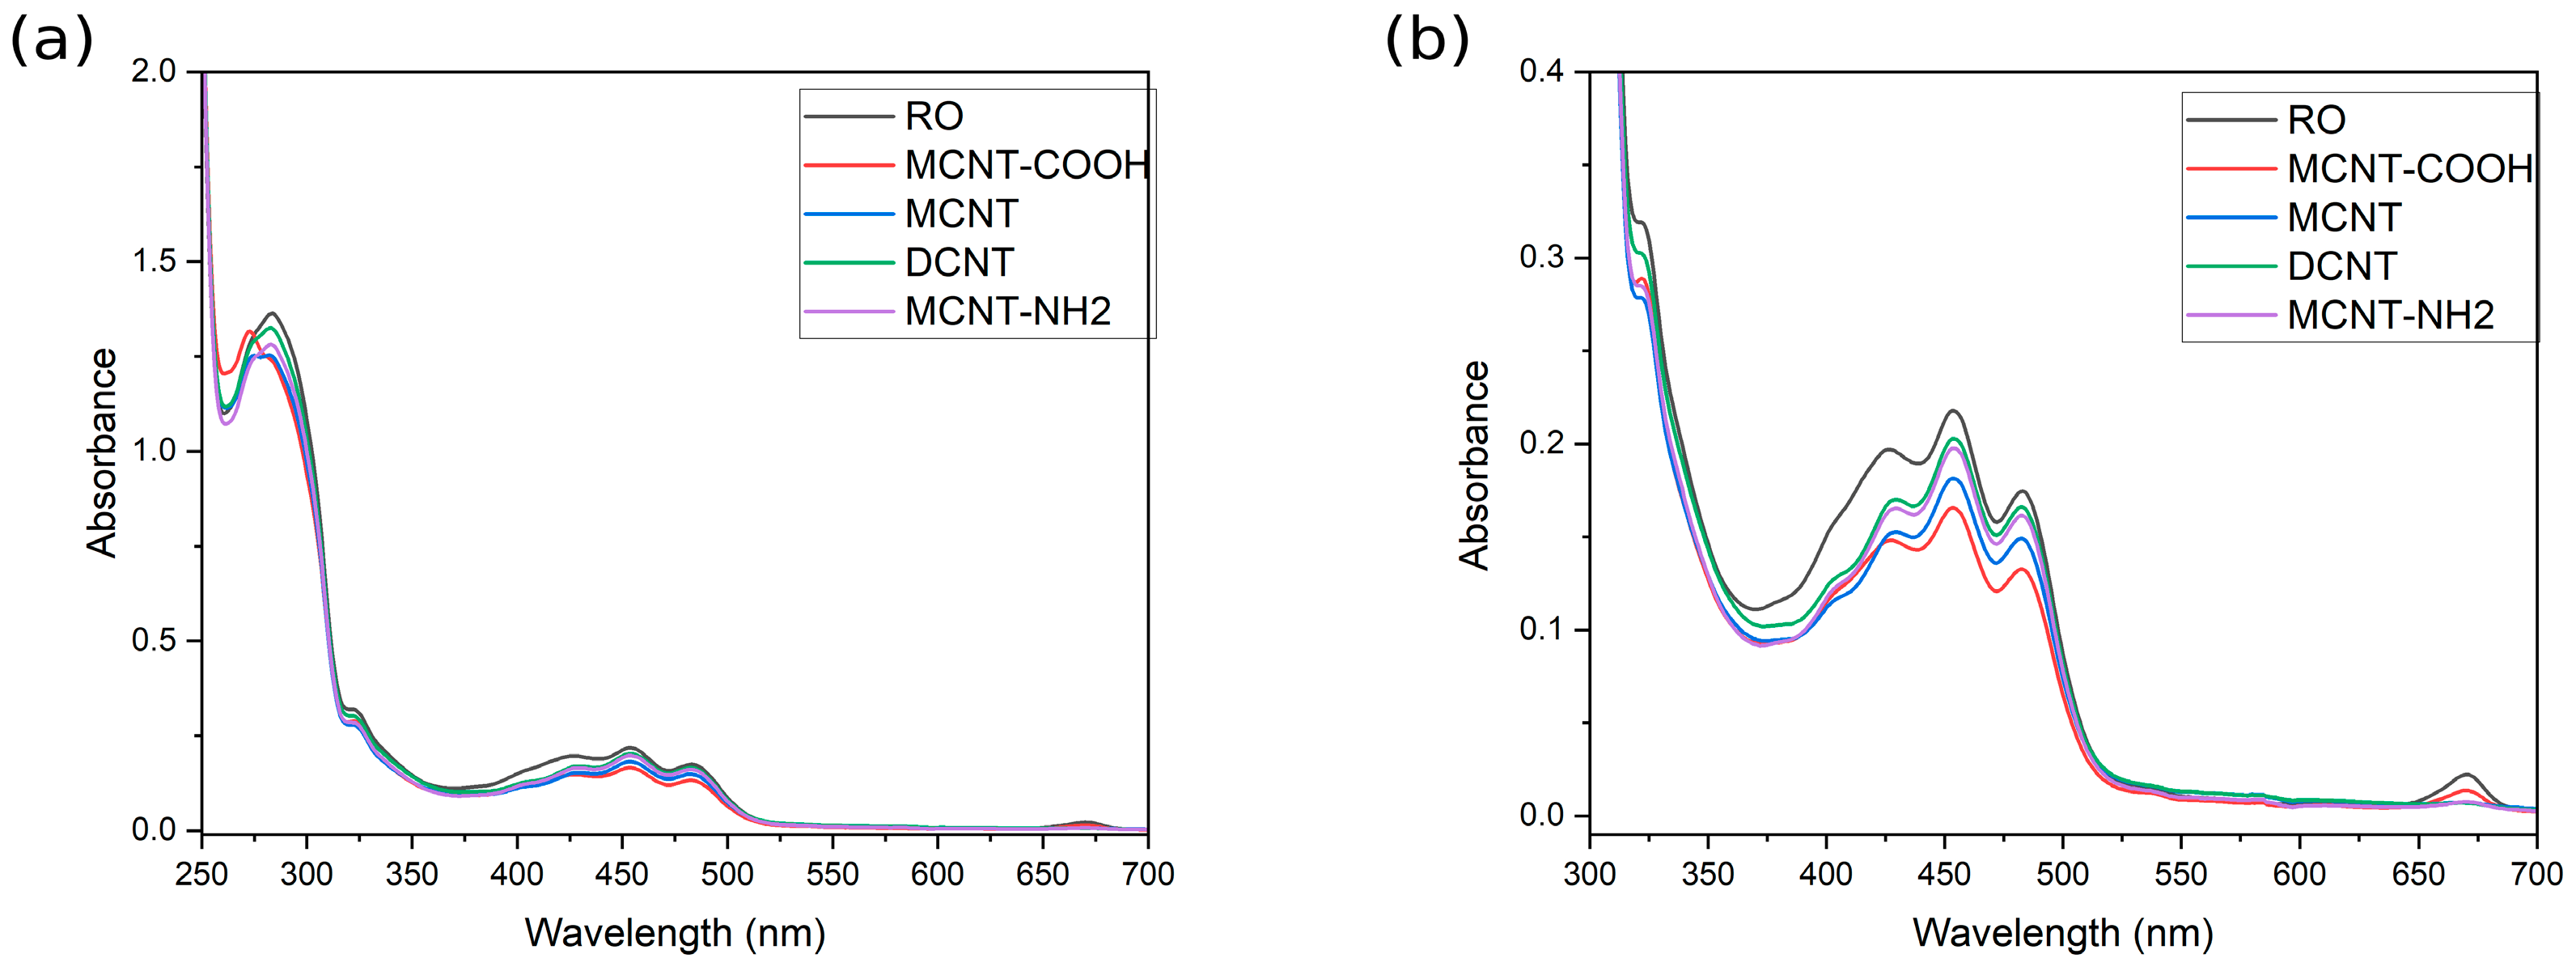
Figure 1 compares untreated RO with the four CNT-contact systems at 0 h. This comparison captures the immediate optical perturbation. Subsequent absorption changes are evaluated against each material’s own 0 h spectrum, so they exclude any change already established during preparation.
Figure 1.
(a) Absorption spectra of untreated rapeseed oil (RO) and RO contacted with each CNT preparation at 0 h. (b) Enlarged view of the 300–700 nm region.
The baseline spectrum retains the expected chromophoric profile of cold-pressed RO. The broad 430–480 nm absorption band is consistent with overlapping carotenoid and chlorophyll-related contributions, while the far-red band is associated more selectively with chlorophyll-derived pigments [2,5]. The feature around 325 nm is compatible with phenolic contribution, including sinapate-related compounds, and absorption near 295 nm overlaps the characteristic UV range of α-tocopherol [1,31,32]. These assignments identify plausible spectral domains; individual compounds cannot be quantified from these overlapping bands.
Immediate CNT addition altered both intensity and spectral shape (Figure 1), but no single wavelength captured the complete response. This observation establishes the central analytical feature of the case, as follows: CNT exposure perturbs several overlapping spectral domains, making whole-spectrum and multivariate analysis more appropriate than interpretation based on an isolated band.
2.2. Difference Spectra
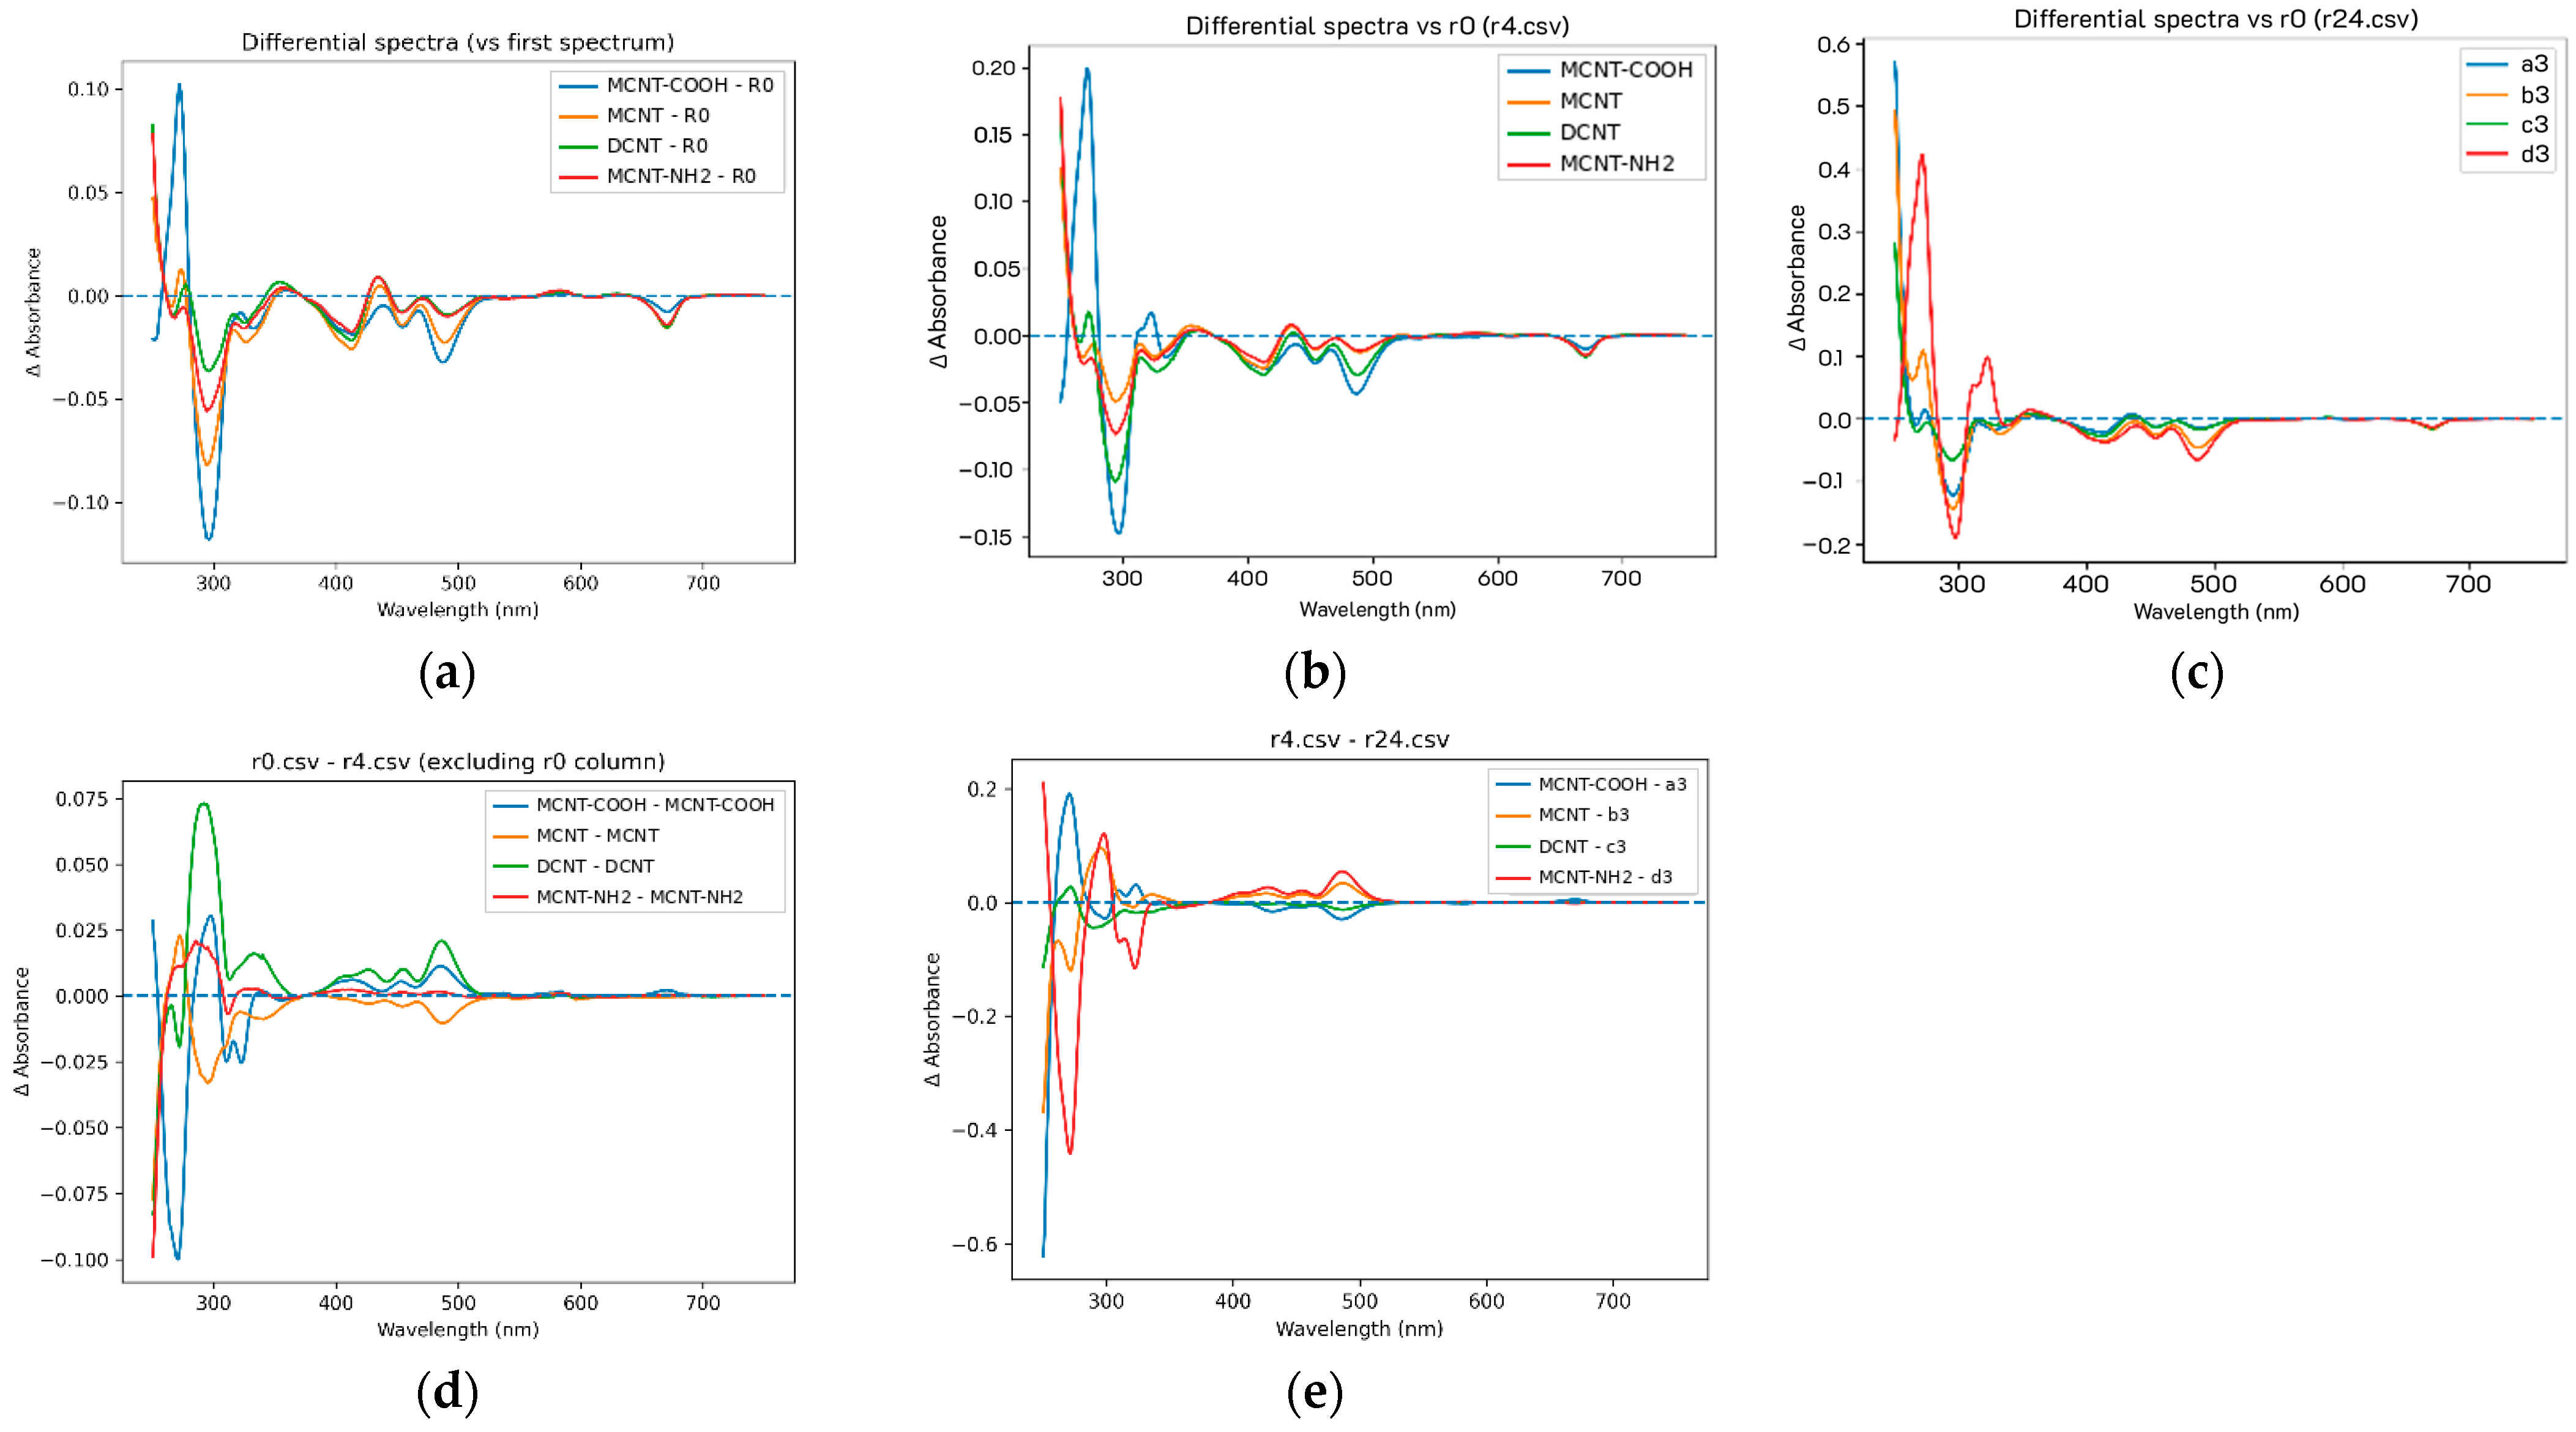
To better visualize the changes occurring during RO–CNT interaction, difference spectra were calculated as the first descriptive layer of the case. Figure 2 shows changes at successive interaction times (t = 0, 4, and 24 h) relative to pure RO (Figure 2a–c) and between consecutive time points (Figure 2d,e). Difference spectra emphasize changes relative to the common oil background.
Figure 2.
Difference spectra for successive interaction times (t = 0, 4, 24 h): differences relative to pure RO (a–c) and differences between consecutive time points (d,e).
The 250–350 nm domain represents overlapping UV-active constituents, while the 430–670 nm interval includes prominent pigment-related contributions [1,2,5].
The distinct band shapes obtained for the CNT preparations show that the optical response depends on the material. Functionalization can influence solute affinity and dispersion [12,13], but these spectra do not isolate its effect from differences in morphology, aggregation, or accessible surface area.
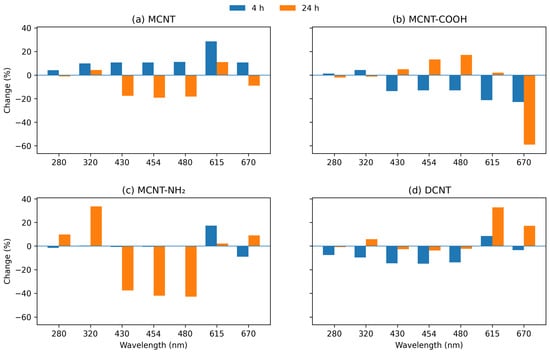
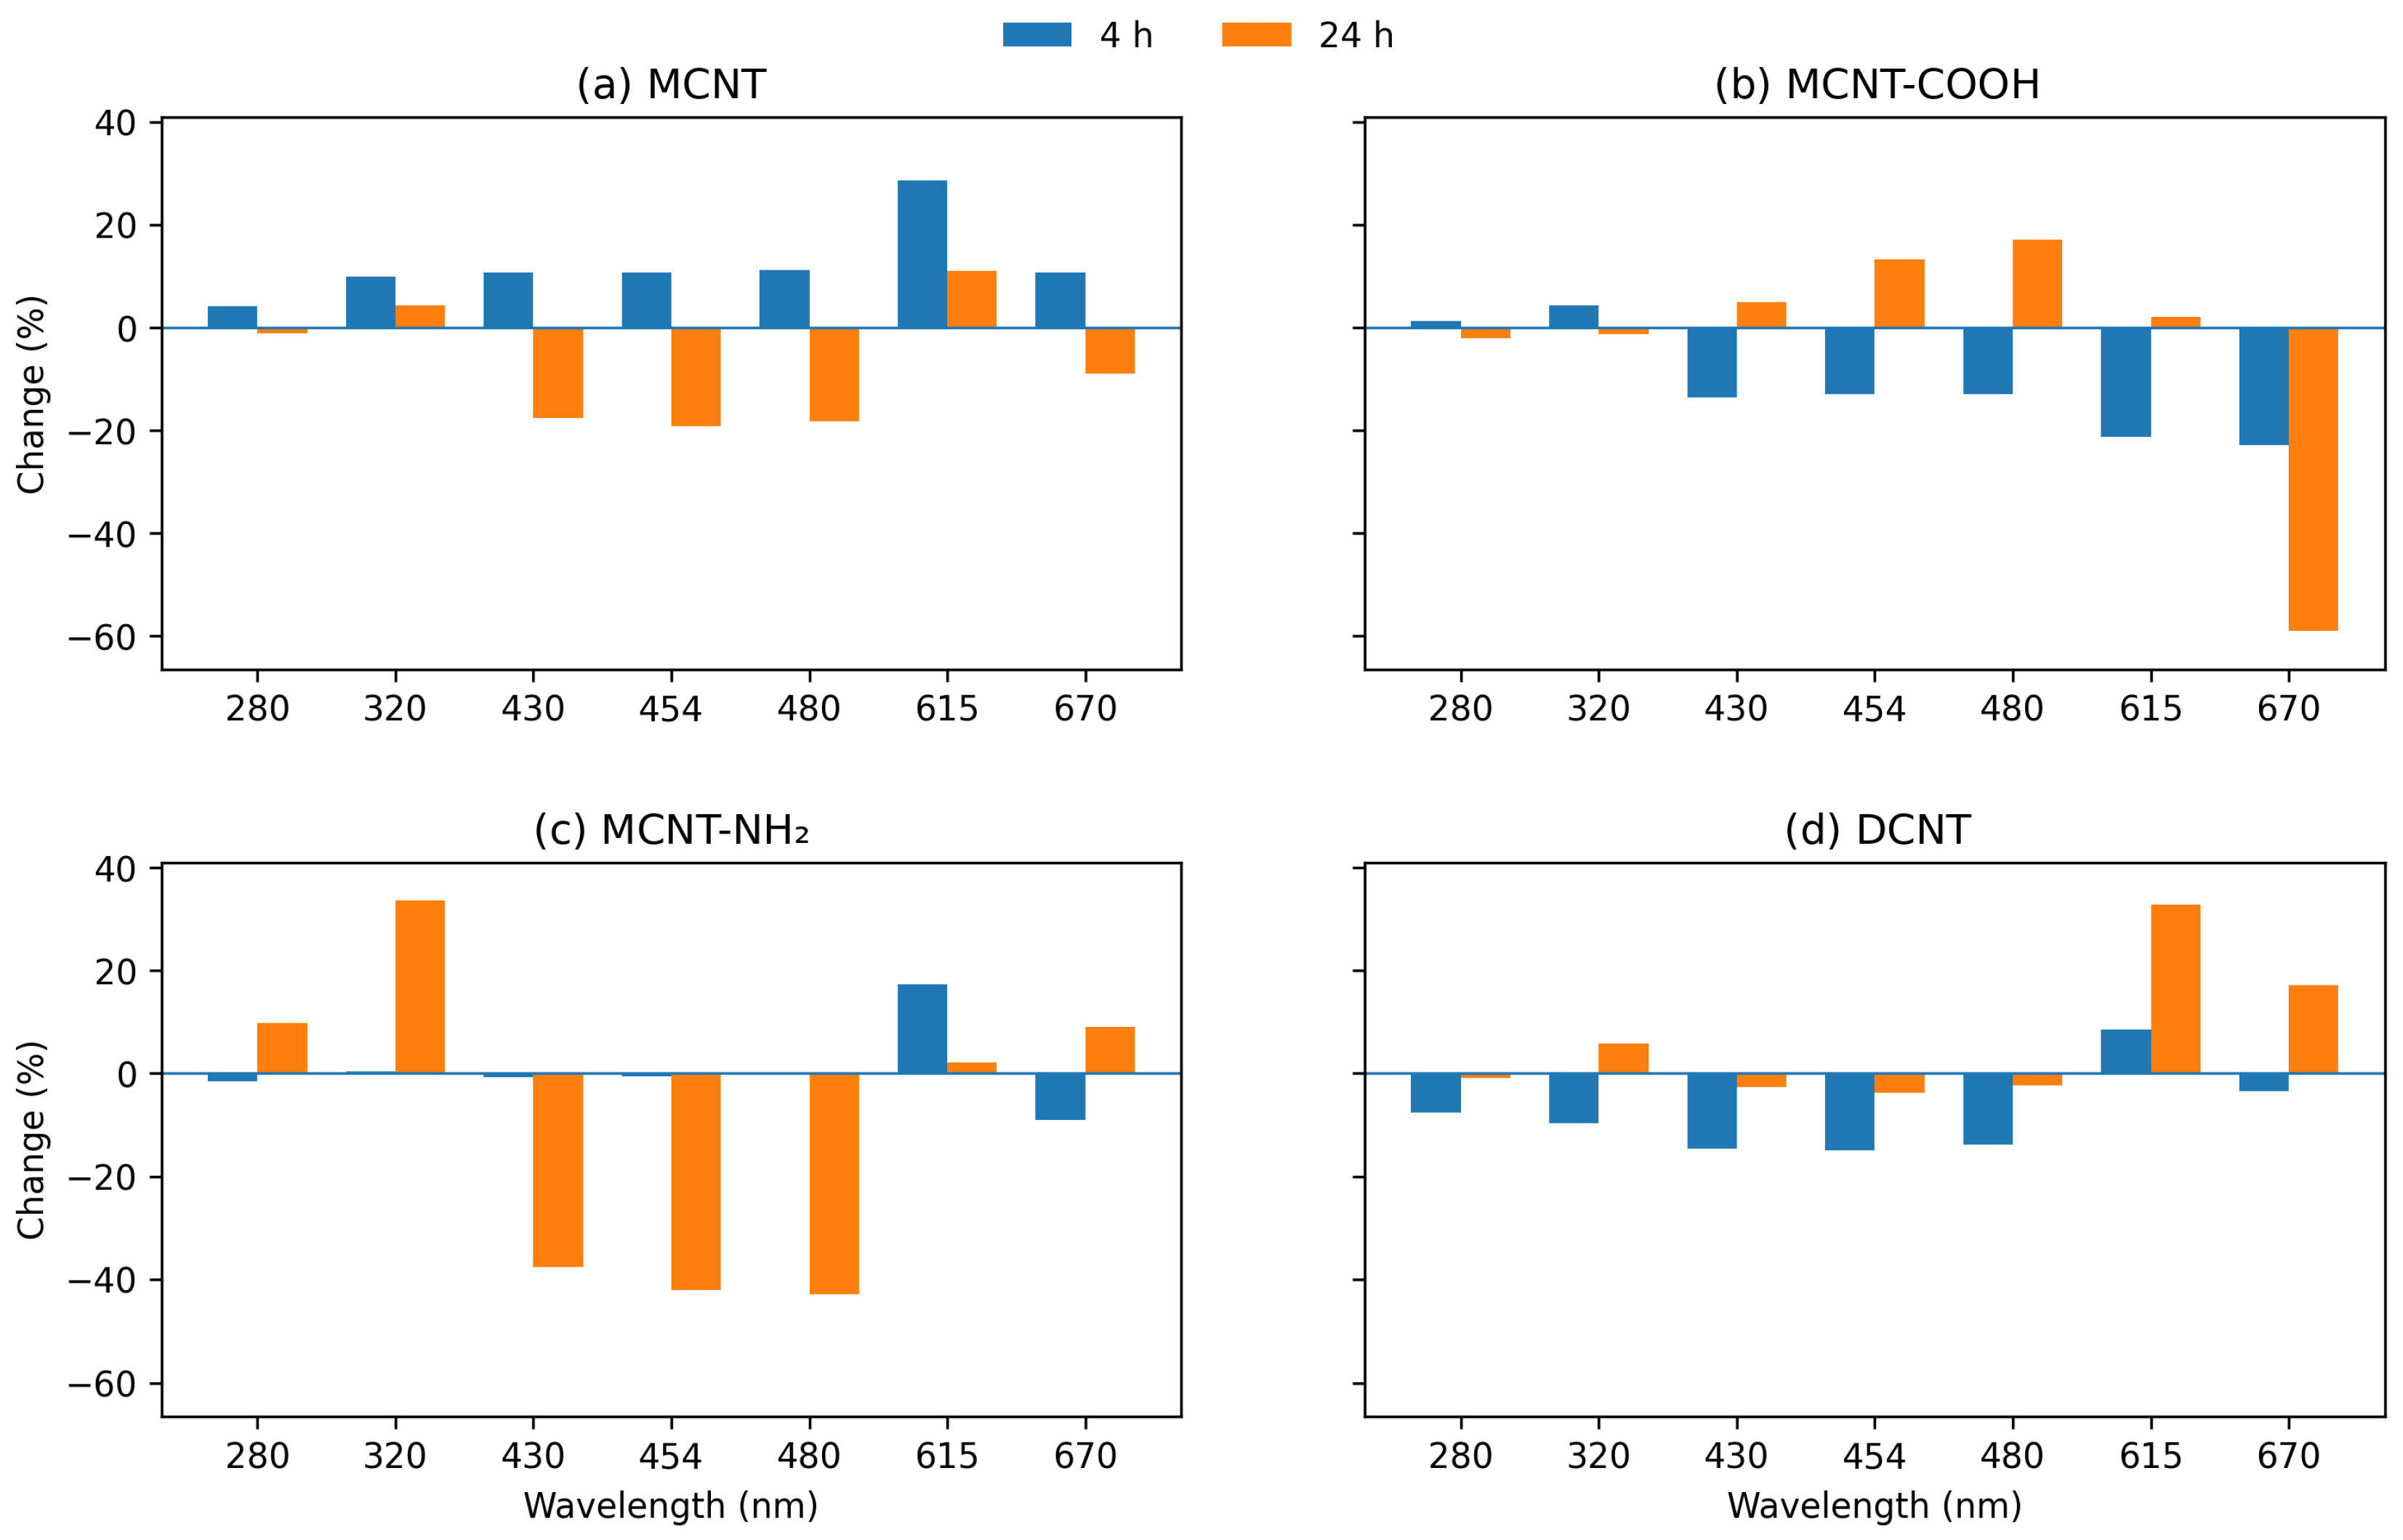
Figure 3 summarizes percentage absorbance changes at 280, 320, 430, 454, 480, 615, and 670 nm after 4 and 24 h. These wavelengths sample the principal response domains.
Figure 3.
CNT-specific percentage absorbance changes at selected characteristic wavelengths after 4 and 24 h of interaction with rapeseed oil. Percentage changes were calculated as %ΔA = [(At − A0)/A0] × 100 from the same minimum-offset-corrected spectra. Panels correspond to (a) MCNT, (b) MCNT-COOH, (c) MCNT-NH2, and (d) DCNT; all panels use a common y-axis scale.
The selected wavelengths confirmed that the response depends strongly on both spectral region and interaction time. At 24 h the clearest divergence occurred between the UV-active and pigment-related domains. MCNT-NH2 showed the strongest late UV increase, reaching +9.9% at 280 nm and +33.6% at 320 nm, whereas MCNT and MCNT-COOH changed only slightly in this region and DCNT remained close to its initial level. The 280–320 nm interval is therefore best interpreted as a composite UV-active response rather than as the trajectory of a single compound.
The UV response may involve phenolic, tocopherol, or oxidation-related contributions, but does not establish the formation or depletion of any particular constituent. Independent chemical measurements would be required to assign these changes [1,2].
The 390–500 nm pigment-related interval showed a distinctly CNT-dependent temporal pattern rather than a universal progressive decrease. After 24 h, MCNT and especially MCNT-NH2 showed pronounced losses at 430–480 nm (approximately −18% for MCNT and −38 to −43% for MCNT-NH2 at the selected wavelengths), whereas DW returned close to its initial state and MCNT-COOH reversed its early decrease to a modest increase. The same spectral region can therefore follow depletion-like, recovery-like, or non-monotonic trajectories depending on the CNT variant.
The chlorophyll-related far-red region was even more selective. At 670 nm, MCNT-COOH showed a pronounced 24 h decrease of approximately 59%, whereas MCNT exhibited only a small decrease (about 9%) and MCNT-NH2 and DCNT showed small positive final changes. The band-integrated 650–685 nm analysis confirmed this contrast, with a −50.4% AUC change for MCNT-COOH but only −4.8% for MCNT and small positive changes for MCNT-NH2 and DCNT. Thus, the chlorophyll-related response should not be described as a common loss across all CNTs; it is primarily a distinctive feature of the MCNT-COOH case.
The selective far-red absorption loss for MCNT-COOH is compatible with a change in the chlorophyll-derived fraction. Chlorophyll adsorption by graphitic materials is supported by Lv et al. [26], but the present spectra cannot distinguish adsorption from pigment transformation or optical effects. This late absorption change should not be equated with the total fluorescence loss relative to untreated oil.
2.3. Fluorescence Studies
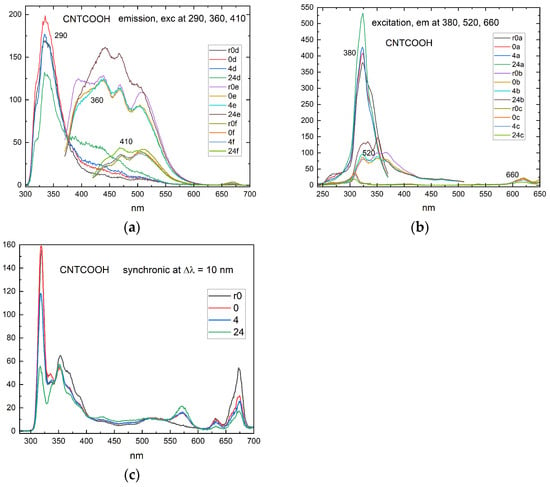
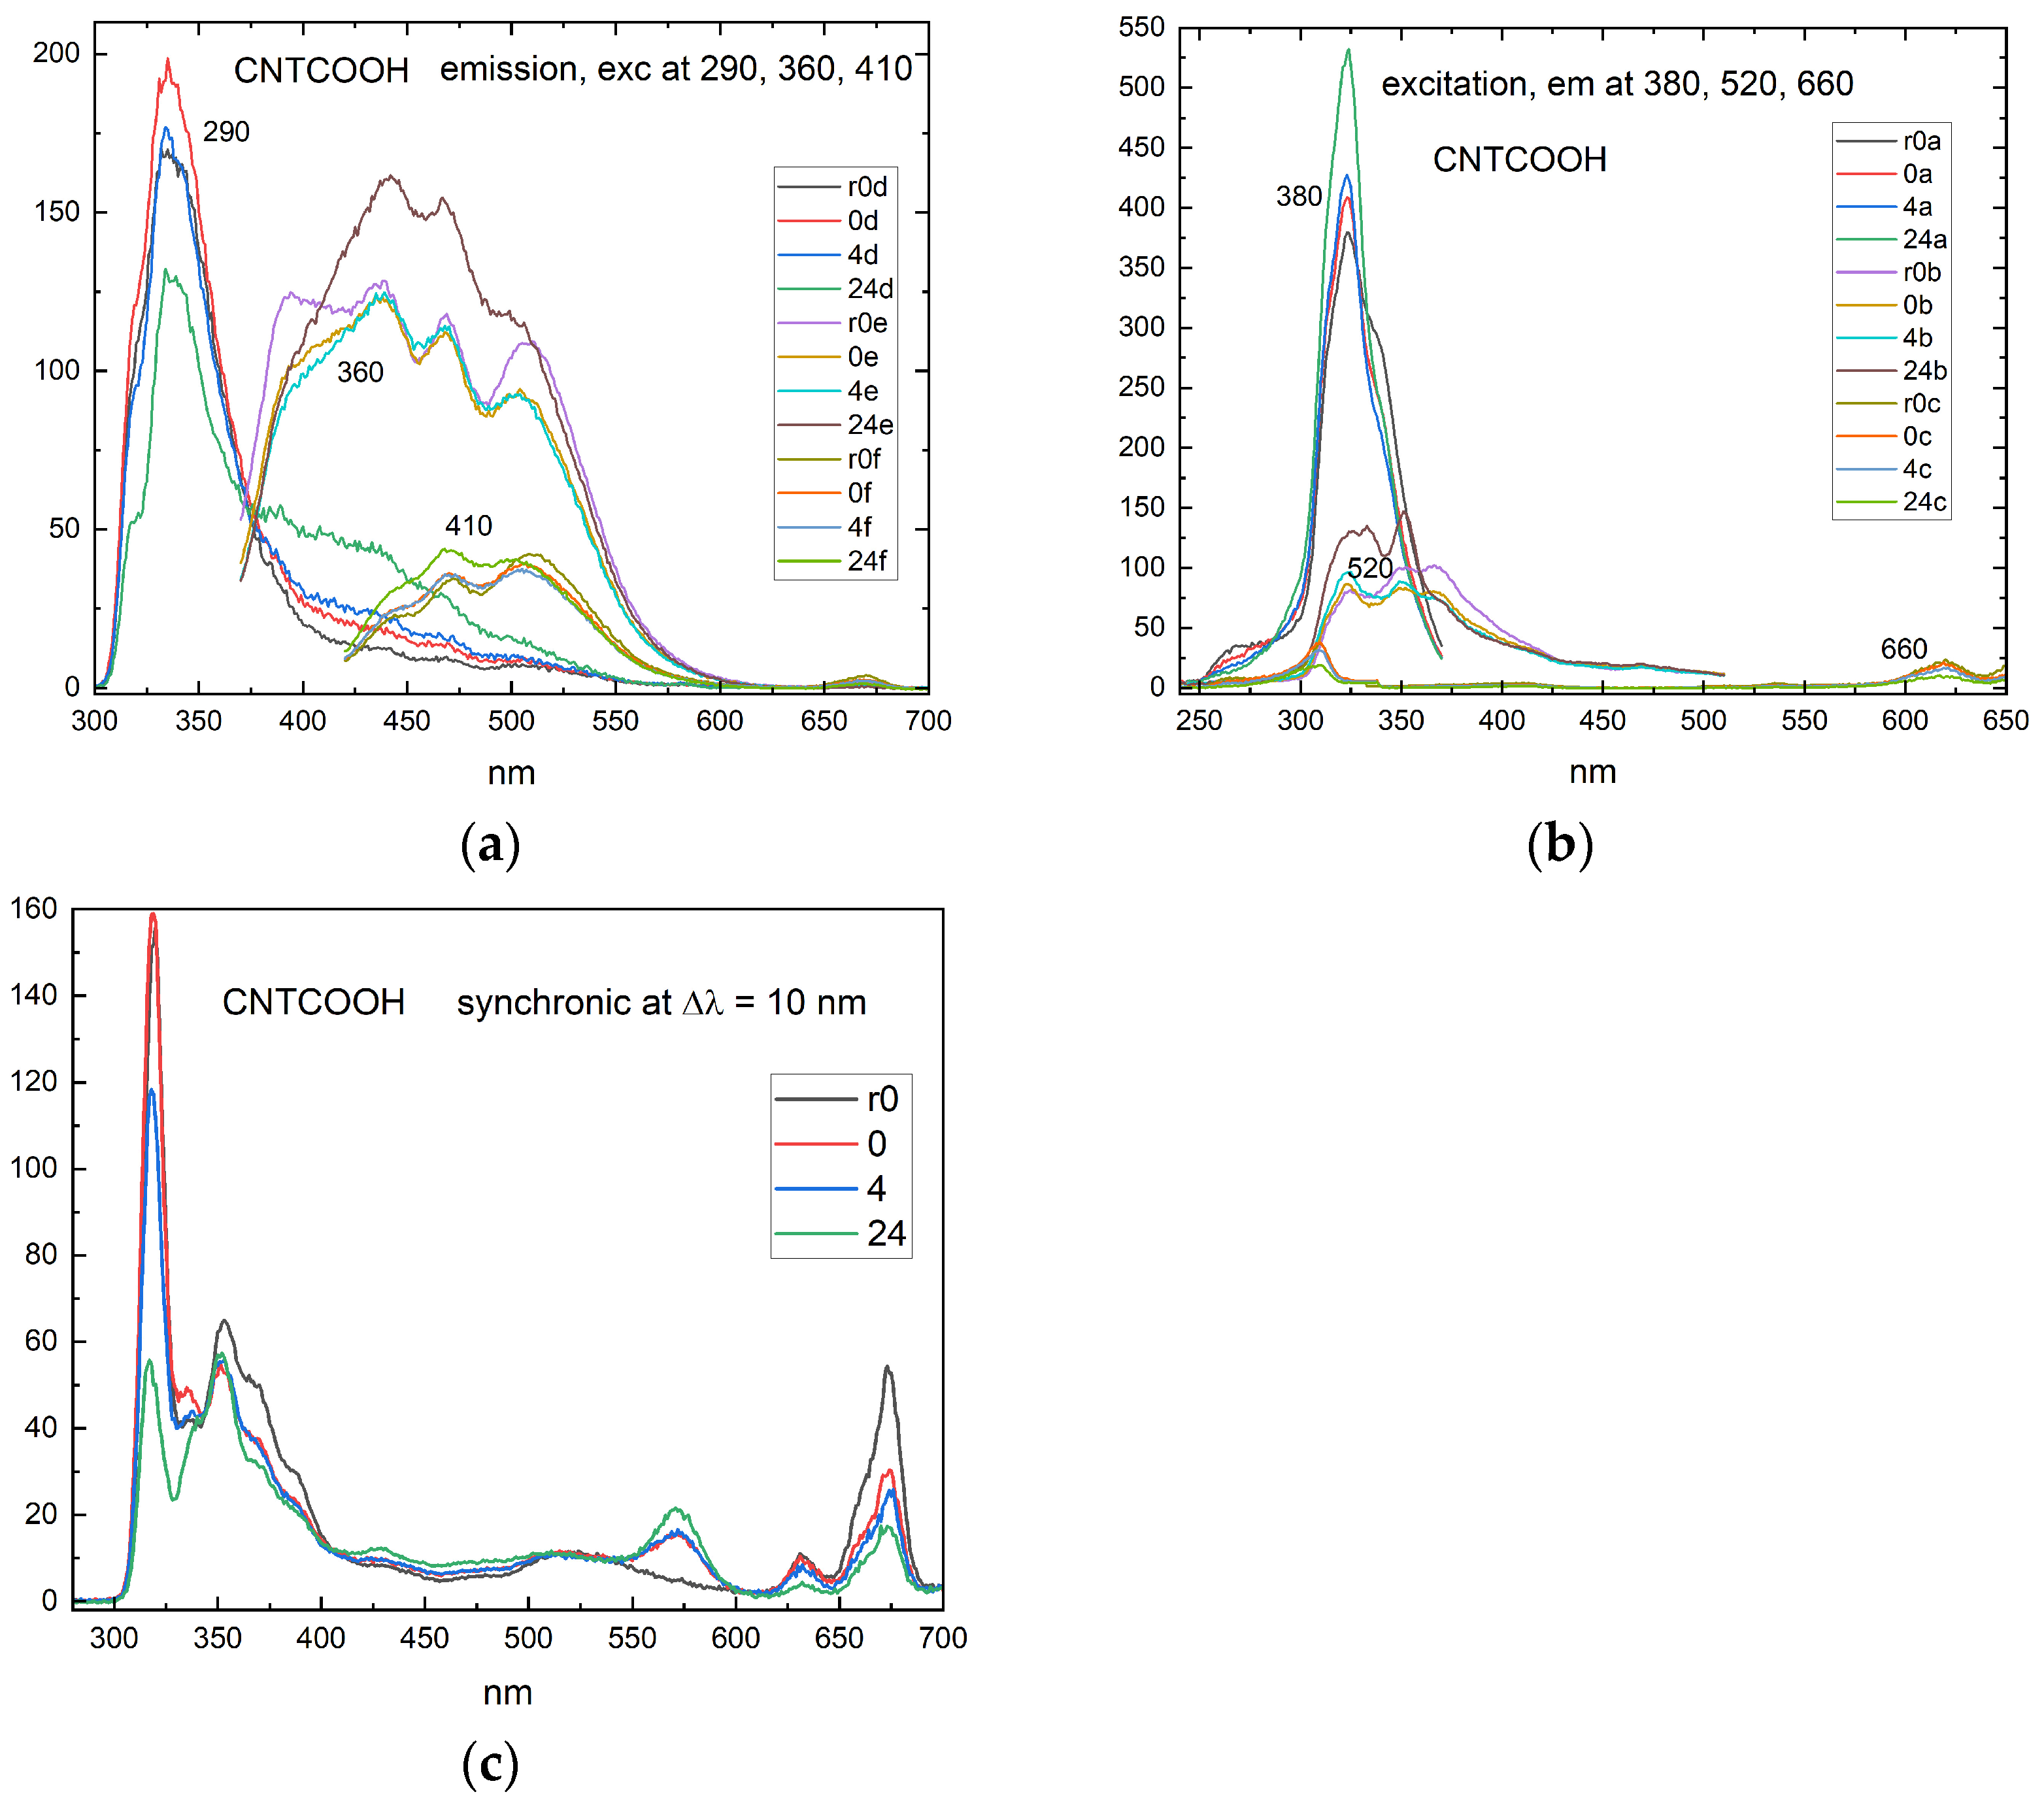
Emission spectra were collected at excitation wavelengths of 290, 360, and 410 nm (em_d, em_e and em_f). Excitation spectra were monitored at emission wavelengths of 380, 520, and 670 nm (ex_a, ex_b and ex_c). Synchronous spectra supplied a complementary scan at Δλ = 10 nm. Figure 4 illustrates the results obtained for the MCNT-COOH.
Figure 4.
(a) Fluorescence emission spectra of rapeseed oil contacted MCNT-COOH at the indicated excitation wavelengths and contact times. (b) Fluorescence excitation spectra of rapeseed oil contacted with MCNT-COOH, monitored at the indicated emission wavelengths and contact times. (c) Synchronous fluorescence spectra (Δλ = 10 nm) of rapeseed oil contacted with MCNT-COOH at the indicated contact times.
2.3.1. Emission Spectra
The emission spectra revealed that CNT-induced changes were strongly dependent on excitation wavelength and spectral region, indicating that the response cannot be described as uniform fluorescence attenuation. Instead, different endogenous fluorophore groups showed distinct temporal and surface-dependent behavior (Figure 4a).
At Ex = 290 nm, emission at 320–335 nm overlaps the fluorescence of tocopherols and potentially canolol [33,34]. It is therefore treated as a composite UV antioxidant-related domain. After 24 h, its integrated intensity decreased by approximately 37.5% for MCNT-COOH, 22.2% for MCNT-NH2, 19.6% for MCNT and 16.8% for DCNT relative to untreated oil. MCNT-COOH, DCNT and MCNT-NH2 initially showed small increases followed by attenuation, whereas MCNT caused an immediate decrease. These non-monotonic responses are compatible with changes in emissive composition or environment and do not establish a one-step adsorption process.
At Ex = 360 nm, the 370–384 nm signal decreased immediately for all CNT systems, with 24 h reductions of approximately 31–57%. At 414–434 nm, MCNT, DCNT, and MCNT-NH2 produced persistent attenuation, whereas MCNT-COOH changed from a weak initial decrease to approximately 18% enhancement at 24 h. This sign reversal indicates a change in the detected fluorescence profile. Oxidation-associated and other overlapping fluorophores can contribute in this region [2,35], but the enhancement alone does not demonstrate oxidation during CNT contact. At 536–552 nm, the 24 h signal decreased by approximately 56% for MCNT, 51% for DCNT, and 36% for MCNT-NH2, compared with about 9% for MCNT-COOH. Thus, the supplied carboxylated preparation produced a distinct green-visible response.
The strongest differentiation was observed for emission spectra excited at 410 nm. In the 479–505 nm interval, MCNT, DCNT, and MCNT-NH2 showed pronounced attenuation, whereas MCNT-COOH displayed a moderate signal enhancement after 24 h. Thus, the same excitation wavelength produced opposite responses depending on CNT surface chemistry. The adjacent 520–555 nm and 568–576 nm regions behaved differently, as follows: fluorescence decreased for all CNTs, but attenuation was substantially stronger for MCNT and DCNT than for MCNT-COOH. These results identify the approximately 480–575 nm range as a highly informative multicomponent fingerprinting domain rather than a compound-specific fluorescence band.
The 400–600 nm emission region contains overlapping, matrix-dependent contributions in edible oils [2,35]. Its CNT-dependent changes provide a useful fingerprint, but cannot be assigned to a single oxidation product or used directly as a measure of oxidative deterioration. At Ex = 410 nm, red emission around 650–690 nm was almost completely suppressed for MCNT and DCNT and strongly attenuated for MCNT-NH2, with a larger residual signal for MCNT-COOH. This domain is associated with chlorophyll-derived pigments [2,6,7]. Adsorption is plausible given the independent evidence for chlorophyll affinity toward carbon nanomaterials [26,30].
Taken together, the emission responses distinguish MCNT-COOH from MCNT and DCNT, particularly through retention of red fluorescence and sign changes in parts of the blue-green domain. They establish material-dependent optical responses. A ranking of adsorption capacity or a causal attribution to COOH groups would require chemical quantification and normalization for accessible surface and dispersion.
2.3.2. Excitation Spectra
Excitation spectra describe the wavelength dependence of fluorescence detected at a fixed emission wavelength. In a complex oil matrix they depend on absorption, fluorescence efficiency, and sample optics, and therefore complement absorption spectra without directly measuring individual chromophore concentrations.
When fluorescence was monitored at 380 nm, the excitation spectrum showed important contributions in the UV region (Figure 4b). Particularly strong CNT discrimination occurred around 304–310 nm. After 24 h, MCNT-COOH produced an approximately 49% enhancement in this interval, whereas MCNT, DCNT, and MCNT-NH2 showed decreases or only minor changes. In contrast, the 342–351 nm region decreased for all CNTs, with the strongest attenuation for MCNT and DCNT. The opposite behavior of the short- and longer-wavelength excitation regions indicates wavelength-dependent redistribution within the UV fluorophore pool. This again argues against interpreting the UV fluorescence response solely as a change in tocopherol concentration.
An even stronger surface-dependent effect was detected when excitation spectra were recorded at an emission wavelength of 520 nm. In the 307–312 nm excitation interval, MCNT-COOH showed a progressive enhancement from approximately +19% immediately after mixing to +35% after 4 h and approximately +83% after 24 h. In contrast, the corresponding response remained negative for MCNT, DCNT, and MCNT-NH2. This is one of the clearest spectroscopic signatures differentiating the carboxylated nanotube from the other CNT systems. It suggests that COOH functionalization selectively modifies the contribution or environment of UV-absorbing species capable of feeding green-visible fluorescence.
At excitation wavelengths of approximately 330–500 nm, MCNT and DCNT showed stronger attenuation than MCNT-COOH. The combination of enhanced short-UV excitation and attenuated longer-wavelength excitation contributes to the distinctive MCNT-COOH fingerprint.
The excitation spectra monitored at 670 nm were the most chemically selective because this emission wavelength targets chlorophyll/pheophytin-related fluorescence. Two characteristic excitation domains were affected, as follows: approximately 370–420 nm and 629–660 nm. The first includes the strong Soret-type excitation of chlorophyll-derived pigments, while the second corresponds to their lower-energy red excitation transitions. Both domains decreased substantially following CNT contact.
The 370–420 nm excitation region was already strongly attenuated immediately after mixing and continued to decrease with contact time. After 24 h, the signal was reduced by approximately 71% for MCNT-COOH and was close to complete suppression for MCNT, DCNT, and MCNT-NH2. The 629–660 nm excitation domain showed the same CNT hierarchy, with approximately 61% attenuation for MCNT-COOH compared with approximately 68–77% for the other CNT systems.
Attenuation of both the Soret-related and red excitation domains, together with the red emission loss, identifies a consistent change in the chlorophyll-derived fluorescence signature. It supports perturbation of the red-emitting fraction but does not independently distinguish adsorption from changes in fluorescence yield or optical transmission [30].
2.3.3. Synchronous Spectra
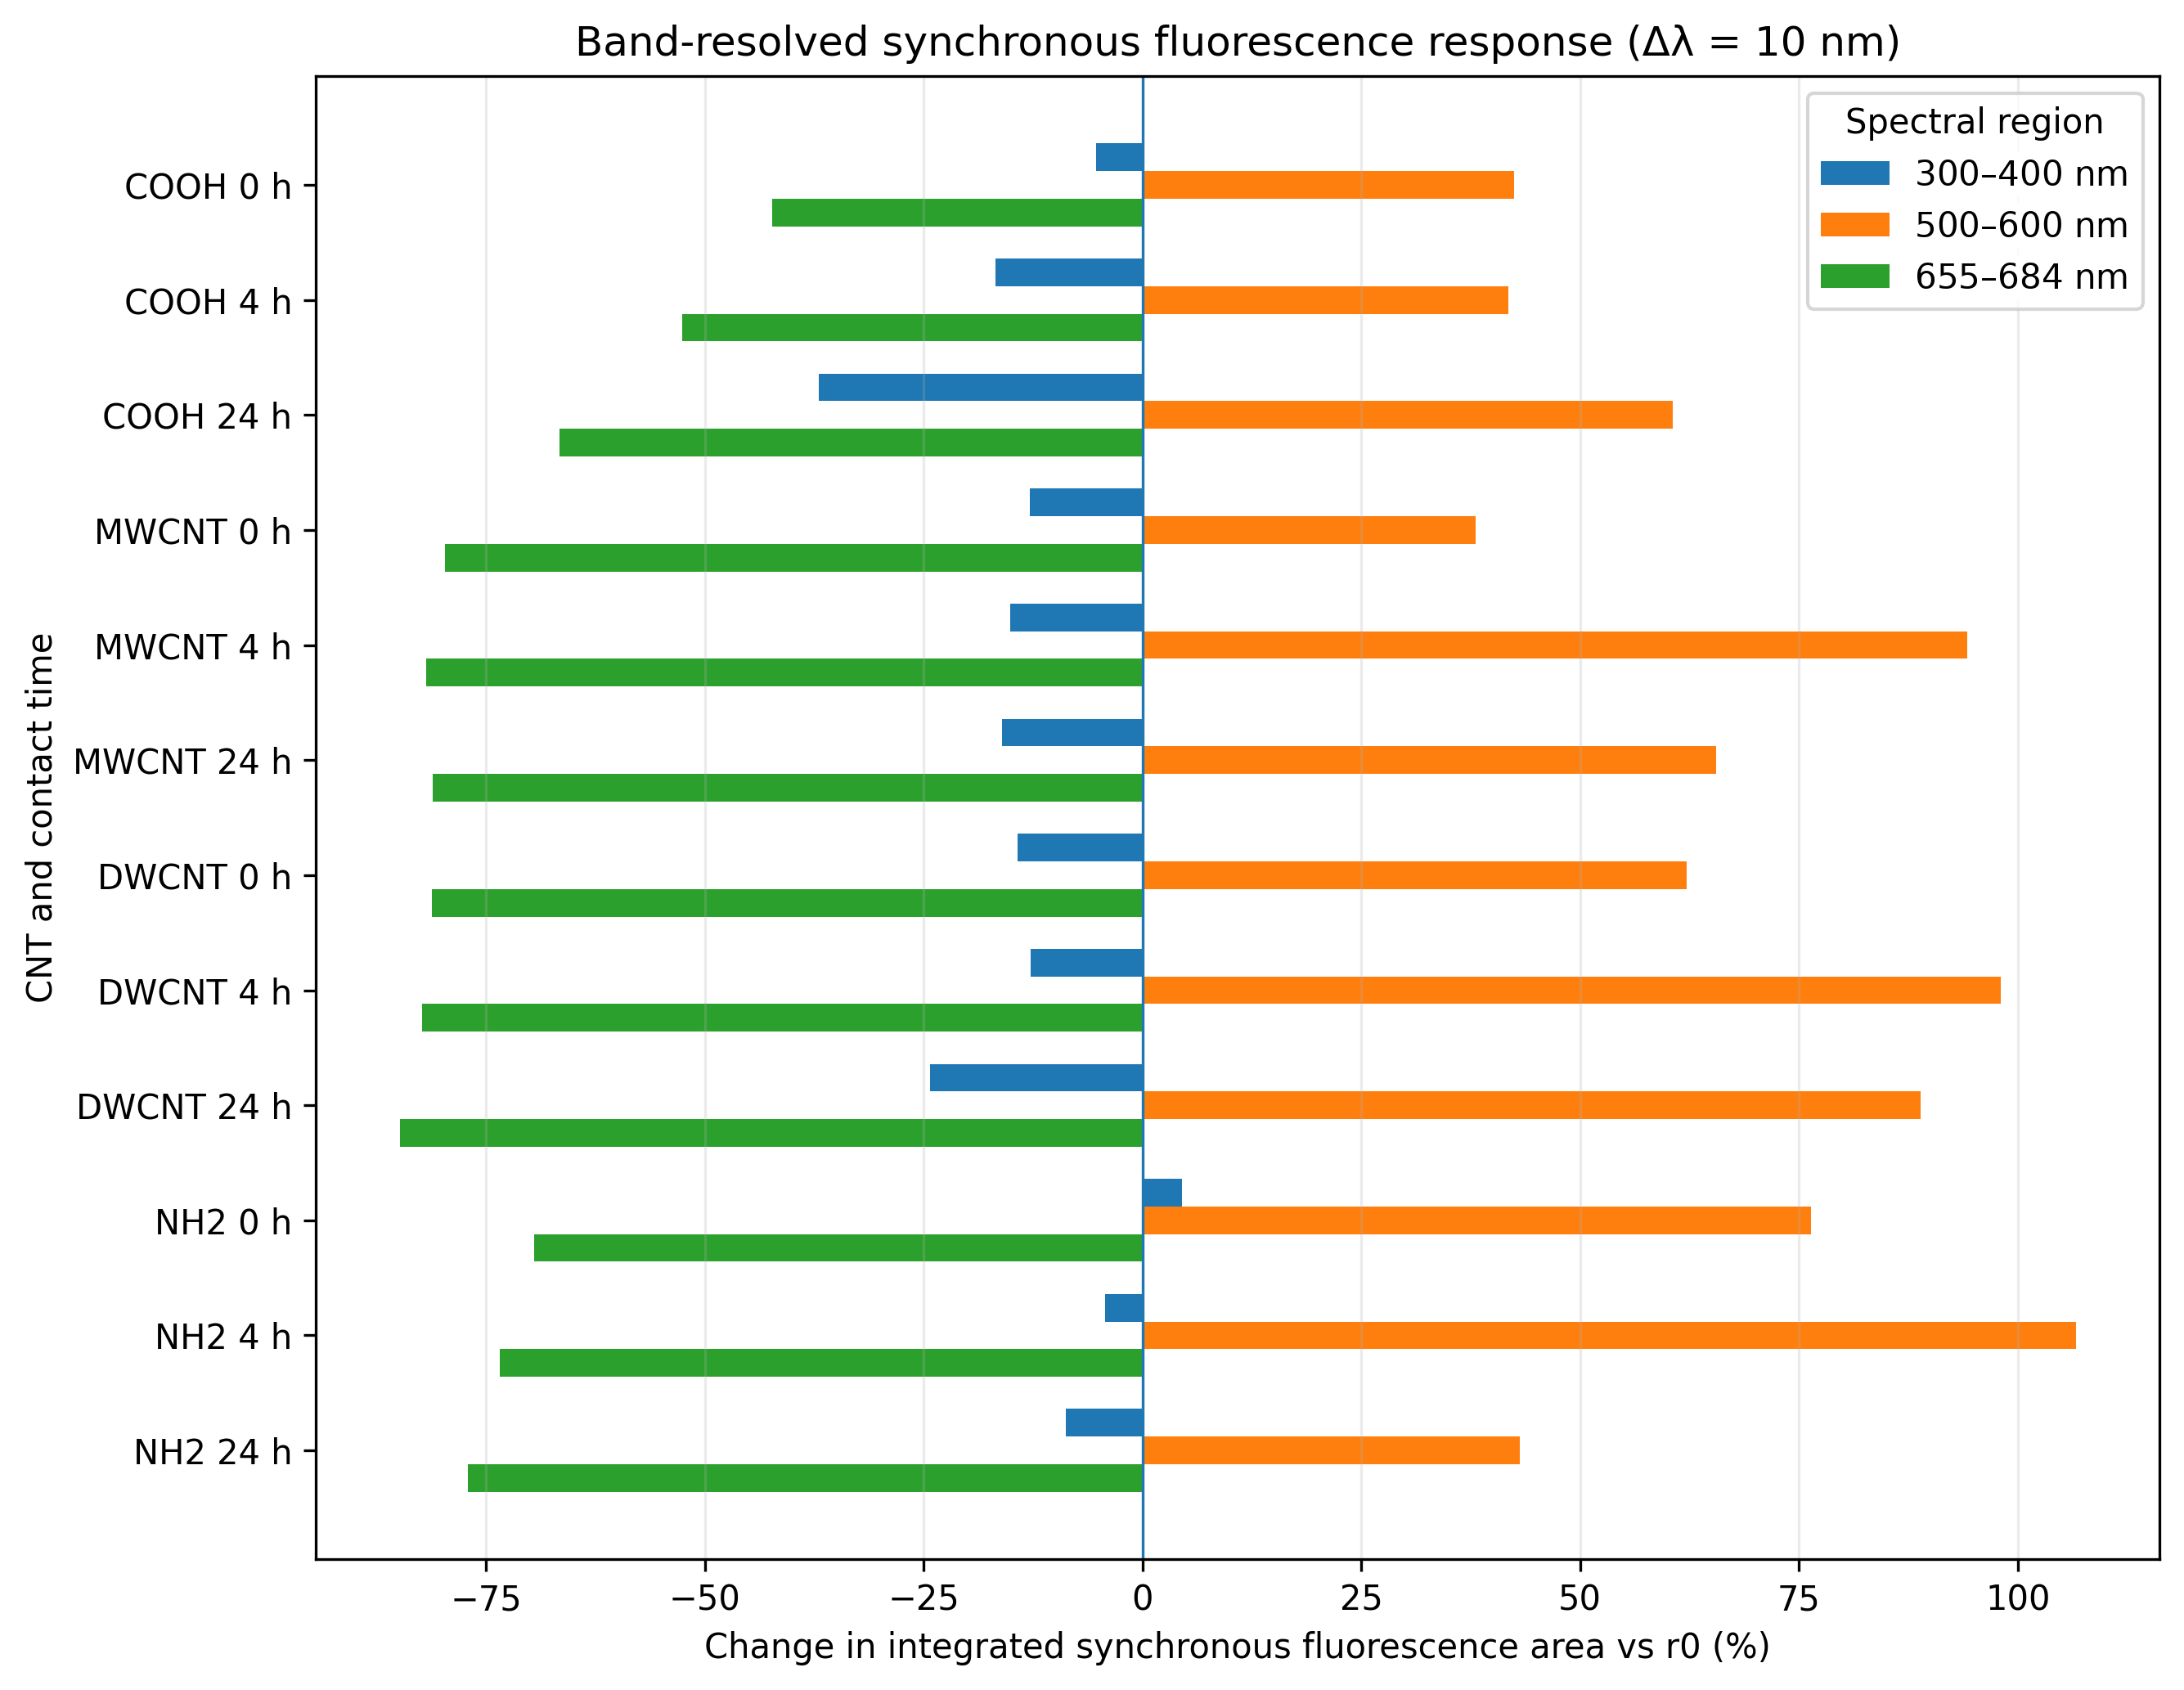
Synchronous fluorescence spectroscopy (Δλ = 10 nm) revealed three distinct response domains rather than a single red marker, as follows: a UV/blue region at 300–400 nm, a green-visible region at 500–600 nm, and the chlorophyll/pheophytin-related red region at 655–684 nm (Figure 4c). Band-resolved integration was therefore performed relative to the initial oil spectrum (r0) to quantify how each domain responded to CNT contact (Figure 5).
In the 300–400 nm interval, the integrated synchronous-fluorescence area decreased at 24 h by 37.0% for MCNT-COOH, 24.3% for DCNT, 16.0% for MCNT, and 8.7% for MCNT-NH2. The largest late-stage pointwise changes were concentrated near 320 nm; earlier responses for DCNT and MCNT-NH2 also involved approximately 353–355 nm. Tocopherols and canolol may overlap in the shorter-wavelength domain [33,34], while phenolic and other matrix contributions extend its chemical scope [31,32].
The 500–600 nm synchronous area increased for all CNT systems, as follows: by 38.1–76.4% at 0 h and 41.8–106.7% at 4 h, remaining 43.1–88.9% above untreated oil at 24 h. The largest 4 h responses occurred for MCNT-NH2 (+106.7%), DCNT (+98.0%) and MCNT (+94.3%). Centroids shifted approximately 5.3–12.0 nm toward longer wavelengths, with prominent pointwise changes near 553–571 nm. The opposite directions of this synchronous response and some fixed-excitation emission responses are not intrinsically contradictory, as follows: the scans sample different excitation–emission combinations.
The red synchronous domain at 655–684 nm decreased by 66.6–84.9% at 24 h, while centroid displacement remained below 1.4 nm. This combination indicates strong attenuation with comparatively little movement of the band. Its association with chlorophyll-derived pigments is supported by edible-oil fluorescence studies [2,6,7], but chlorophylls and pheophytins were not resolved individually.
Green-visible enhancement and red-band attenuation rule out a single uniform scaling of the entire synchronous spectrum. They do not establish CNT-induced oxidation. Lipid oxidation in plant oils produces diverse compounds [36], and antioxidant composition affects rapeseed-oil stability [37]; neither finding identifies the fluorophores responsible here. Changes in overlapping emission, microenvironment, reabsorption, and residual-particle optics remain possible contributors.
Figure 5.
Band-integrated synchronous responses relative to untreated oil r0. The three domains retain response direction: UV/blue attenuation, green-visible enhancement and red pigment-related attenuation. These signed regional changes are candidate reporter features rather than calibrated quality scores.
Absorption adds complementary chromophore information. Its 0–24 h changes describe evolution after the immediate CNT-contact state, whereas the fluorescence percentages above describe the total response relative to untreated oil. The selective far-red absorption loss for MCNT-COOH can therefore coexist with its greater residual red fluorescence. Direct comparison requires matched reference states and control of optical attenuation (Figure 6).
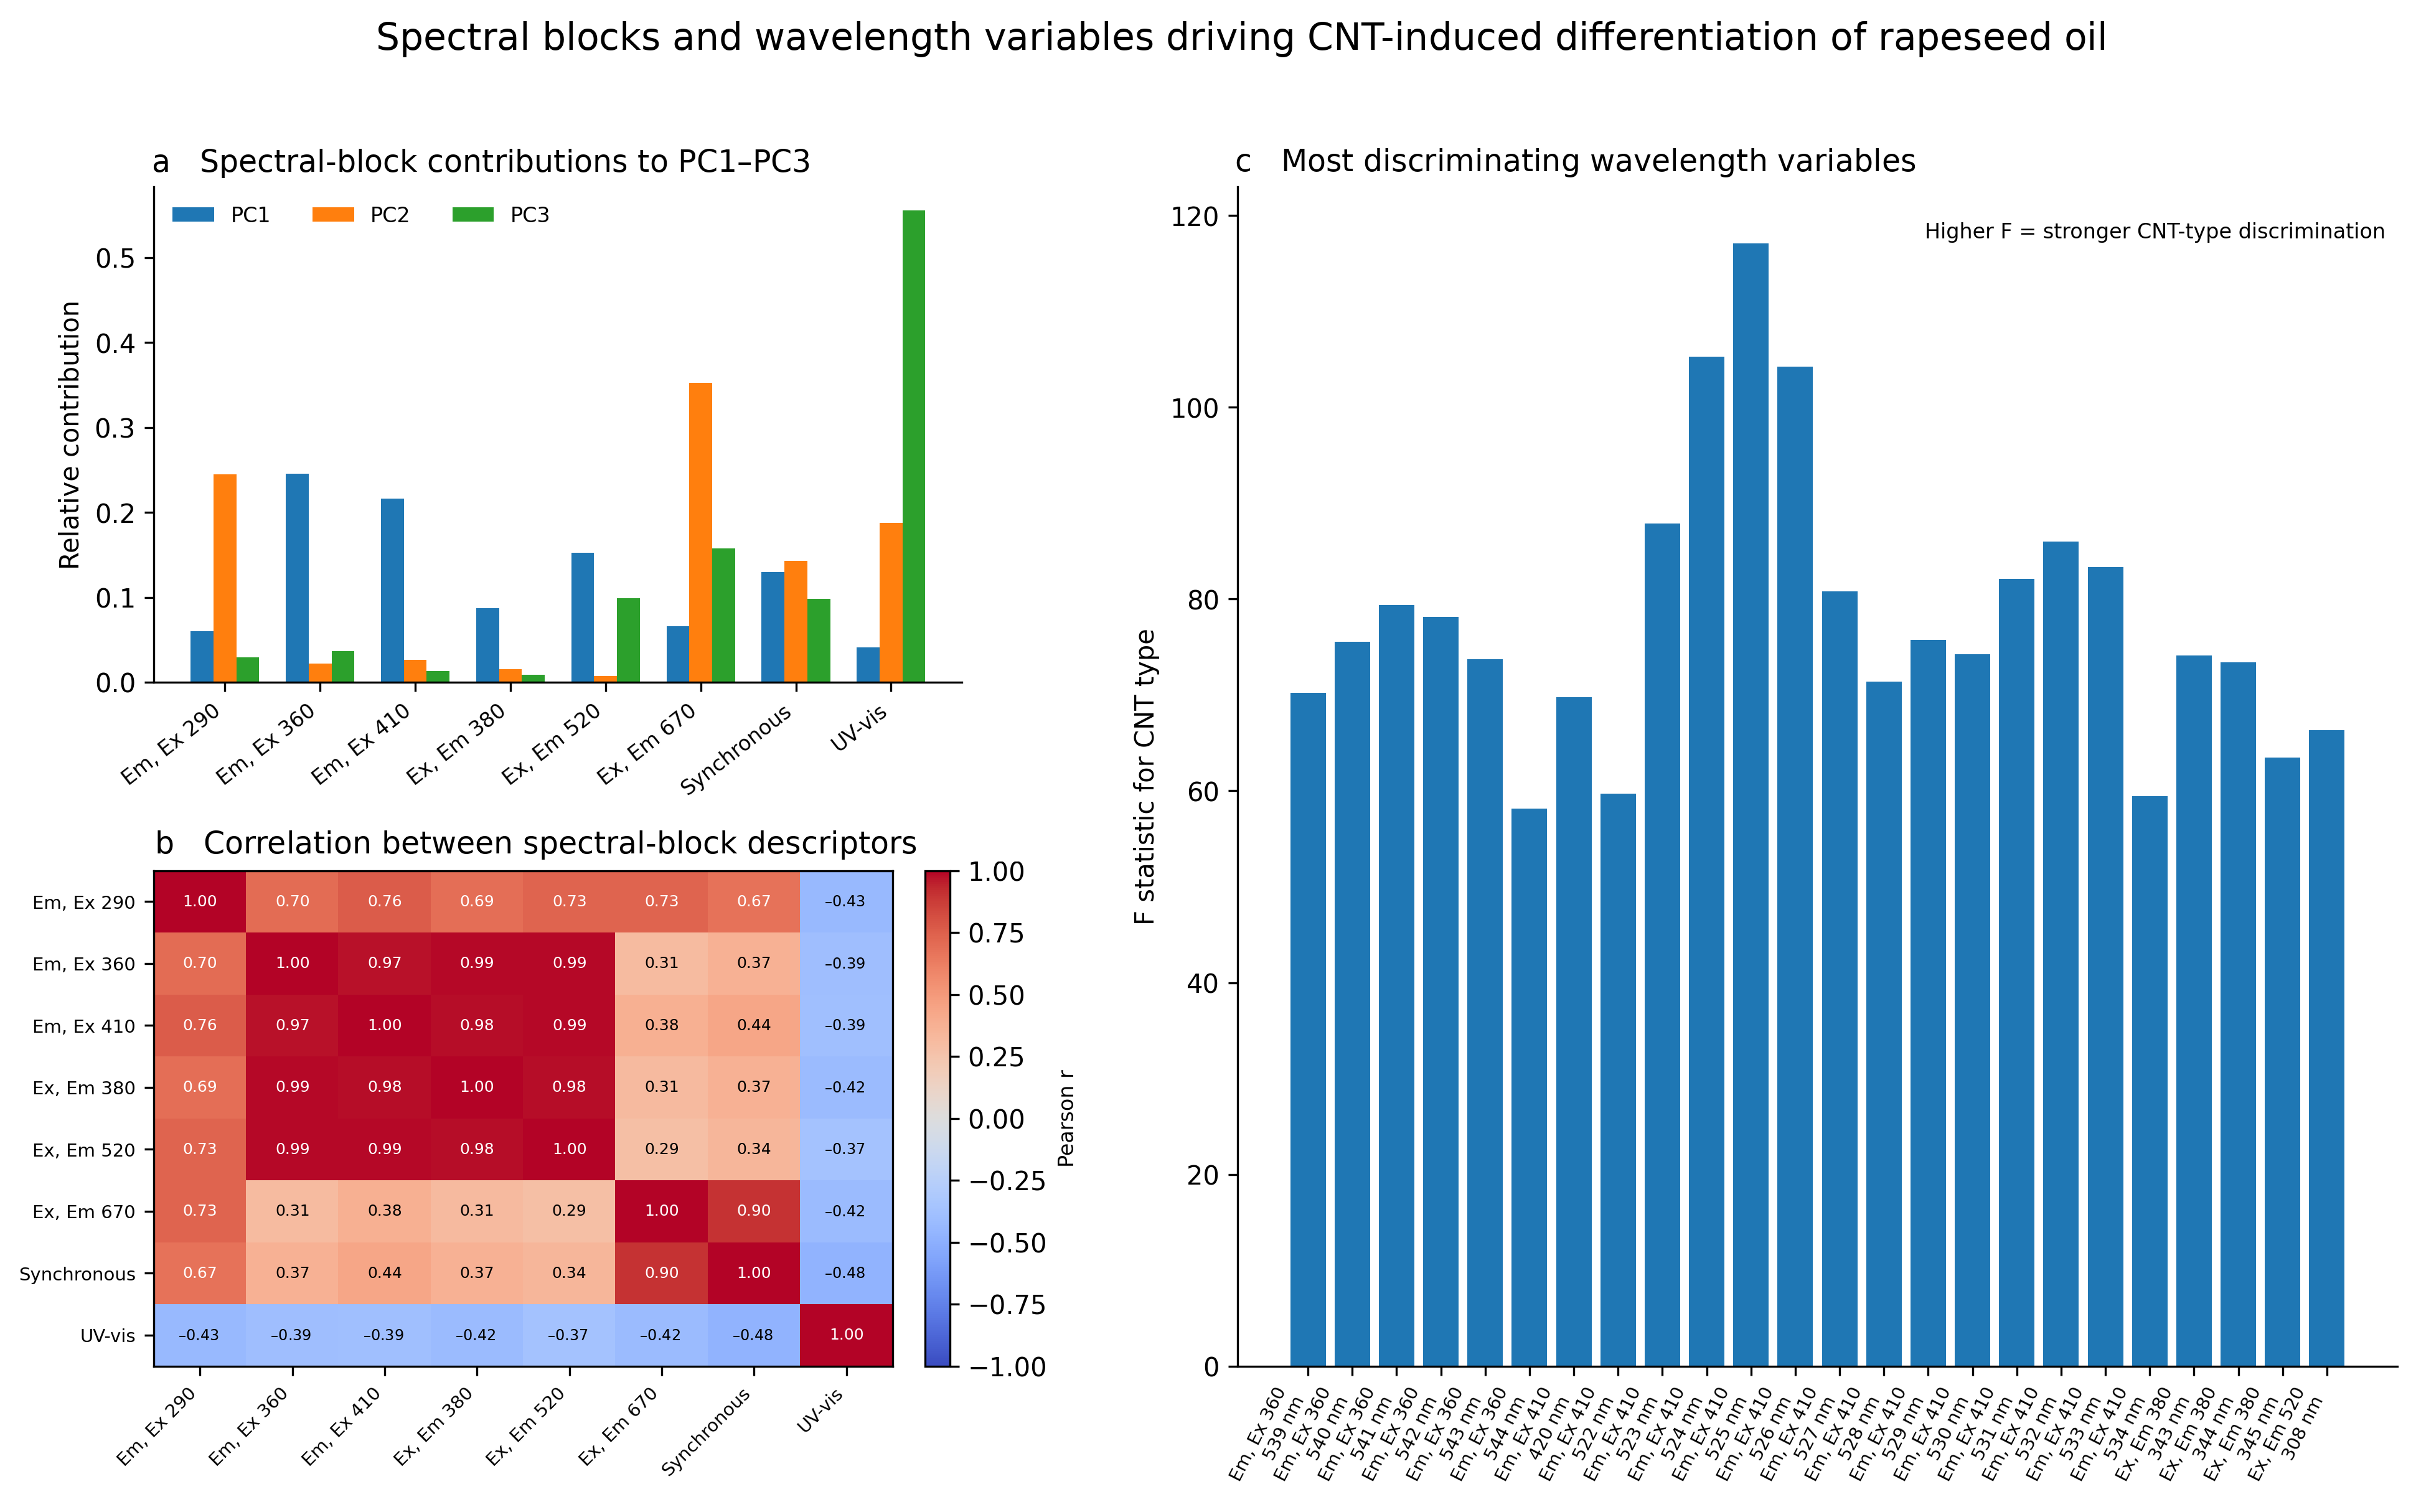
The combined evidence supports a hierarchy of candidate features based on chemical interpretability and complementary response. The red synchronous area is the primary pigment-sensitive feature, while its centroid tests whether attenuation preserves band position. Far-red absorption supplies a companion chromophore measure. The 390–500 nm absorption area adds the composite carotenoid/Soret context, and green-visible area and centroid capture an oppositely directed response. Supplementary UV features can extend the fingerprint when antioxidant-related context is required.
Figure 6.
Chemometric support for candidate reporter selection. Panels show (a) spectral-block contributions, (b) correlations between block descriptors and (c) an exploratory F-statistic ranking of wavelength variables. Rankings describe this CNT-contact dataset; they are not validated predictors of oil quality.
The candidate descriptors should remain a feature vector because summing absolute percentage changes discards response direction. The exploratory UV antioxidant response index (UARI) combines emission at 320–335 nm, synchronous fluorescence at 300–340 nm, and absorption at 290–300 nm after dataset-dependent normalization. Its reported value was 82.1 for MCNT-COOH and 39.1–47.7 for the other preparations. These values describe this normalized dataset; they do not quantify antioxidant concentration, antioxidant activity, or oil quality.
2.4. Chemometric AnalysisResults
Chemometrics is useful here when it connects a spectral pattern with candidate reporter features. Global PCA of spectral changes relative to the initial rapeseed oil separated the four nanotube systems. PC1 accounted for 50.25% of the variance and PC2 for 30.61%, giving 80.86% in the two-dimensional score space. Together, these components captured the dominant structure of the multimodal response.
MCNT-COOH occupied a distinct position along PC1, while MCNT and DCNT clustered on its negative side and MCNT-NH2 remained intermediate. This organization is consistent with the spectroscopic contrasts, but does not isolate functionalization from other differences between the CNT preparations.
Samples shifted toward negative PC2 scores after 24 h, consistent with an additional time-associated response within this model. Assignment of a component to a chemical process requires supporting loadings and independent measurements.
2.4.1. Complementarity of Absorption and Fluorescence
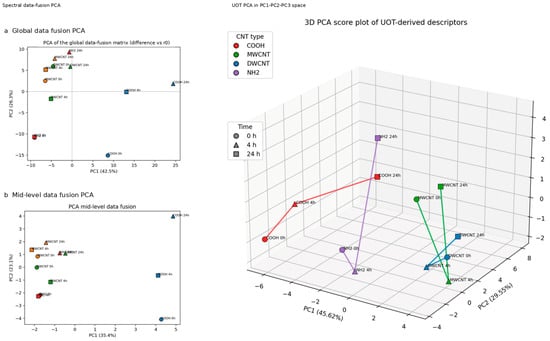
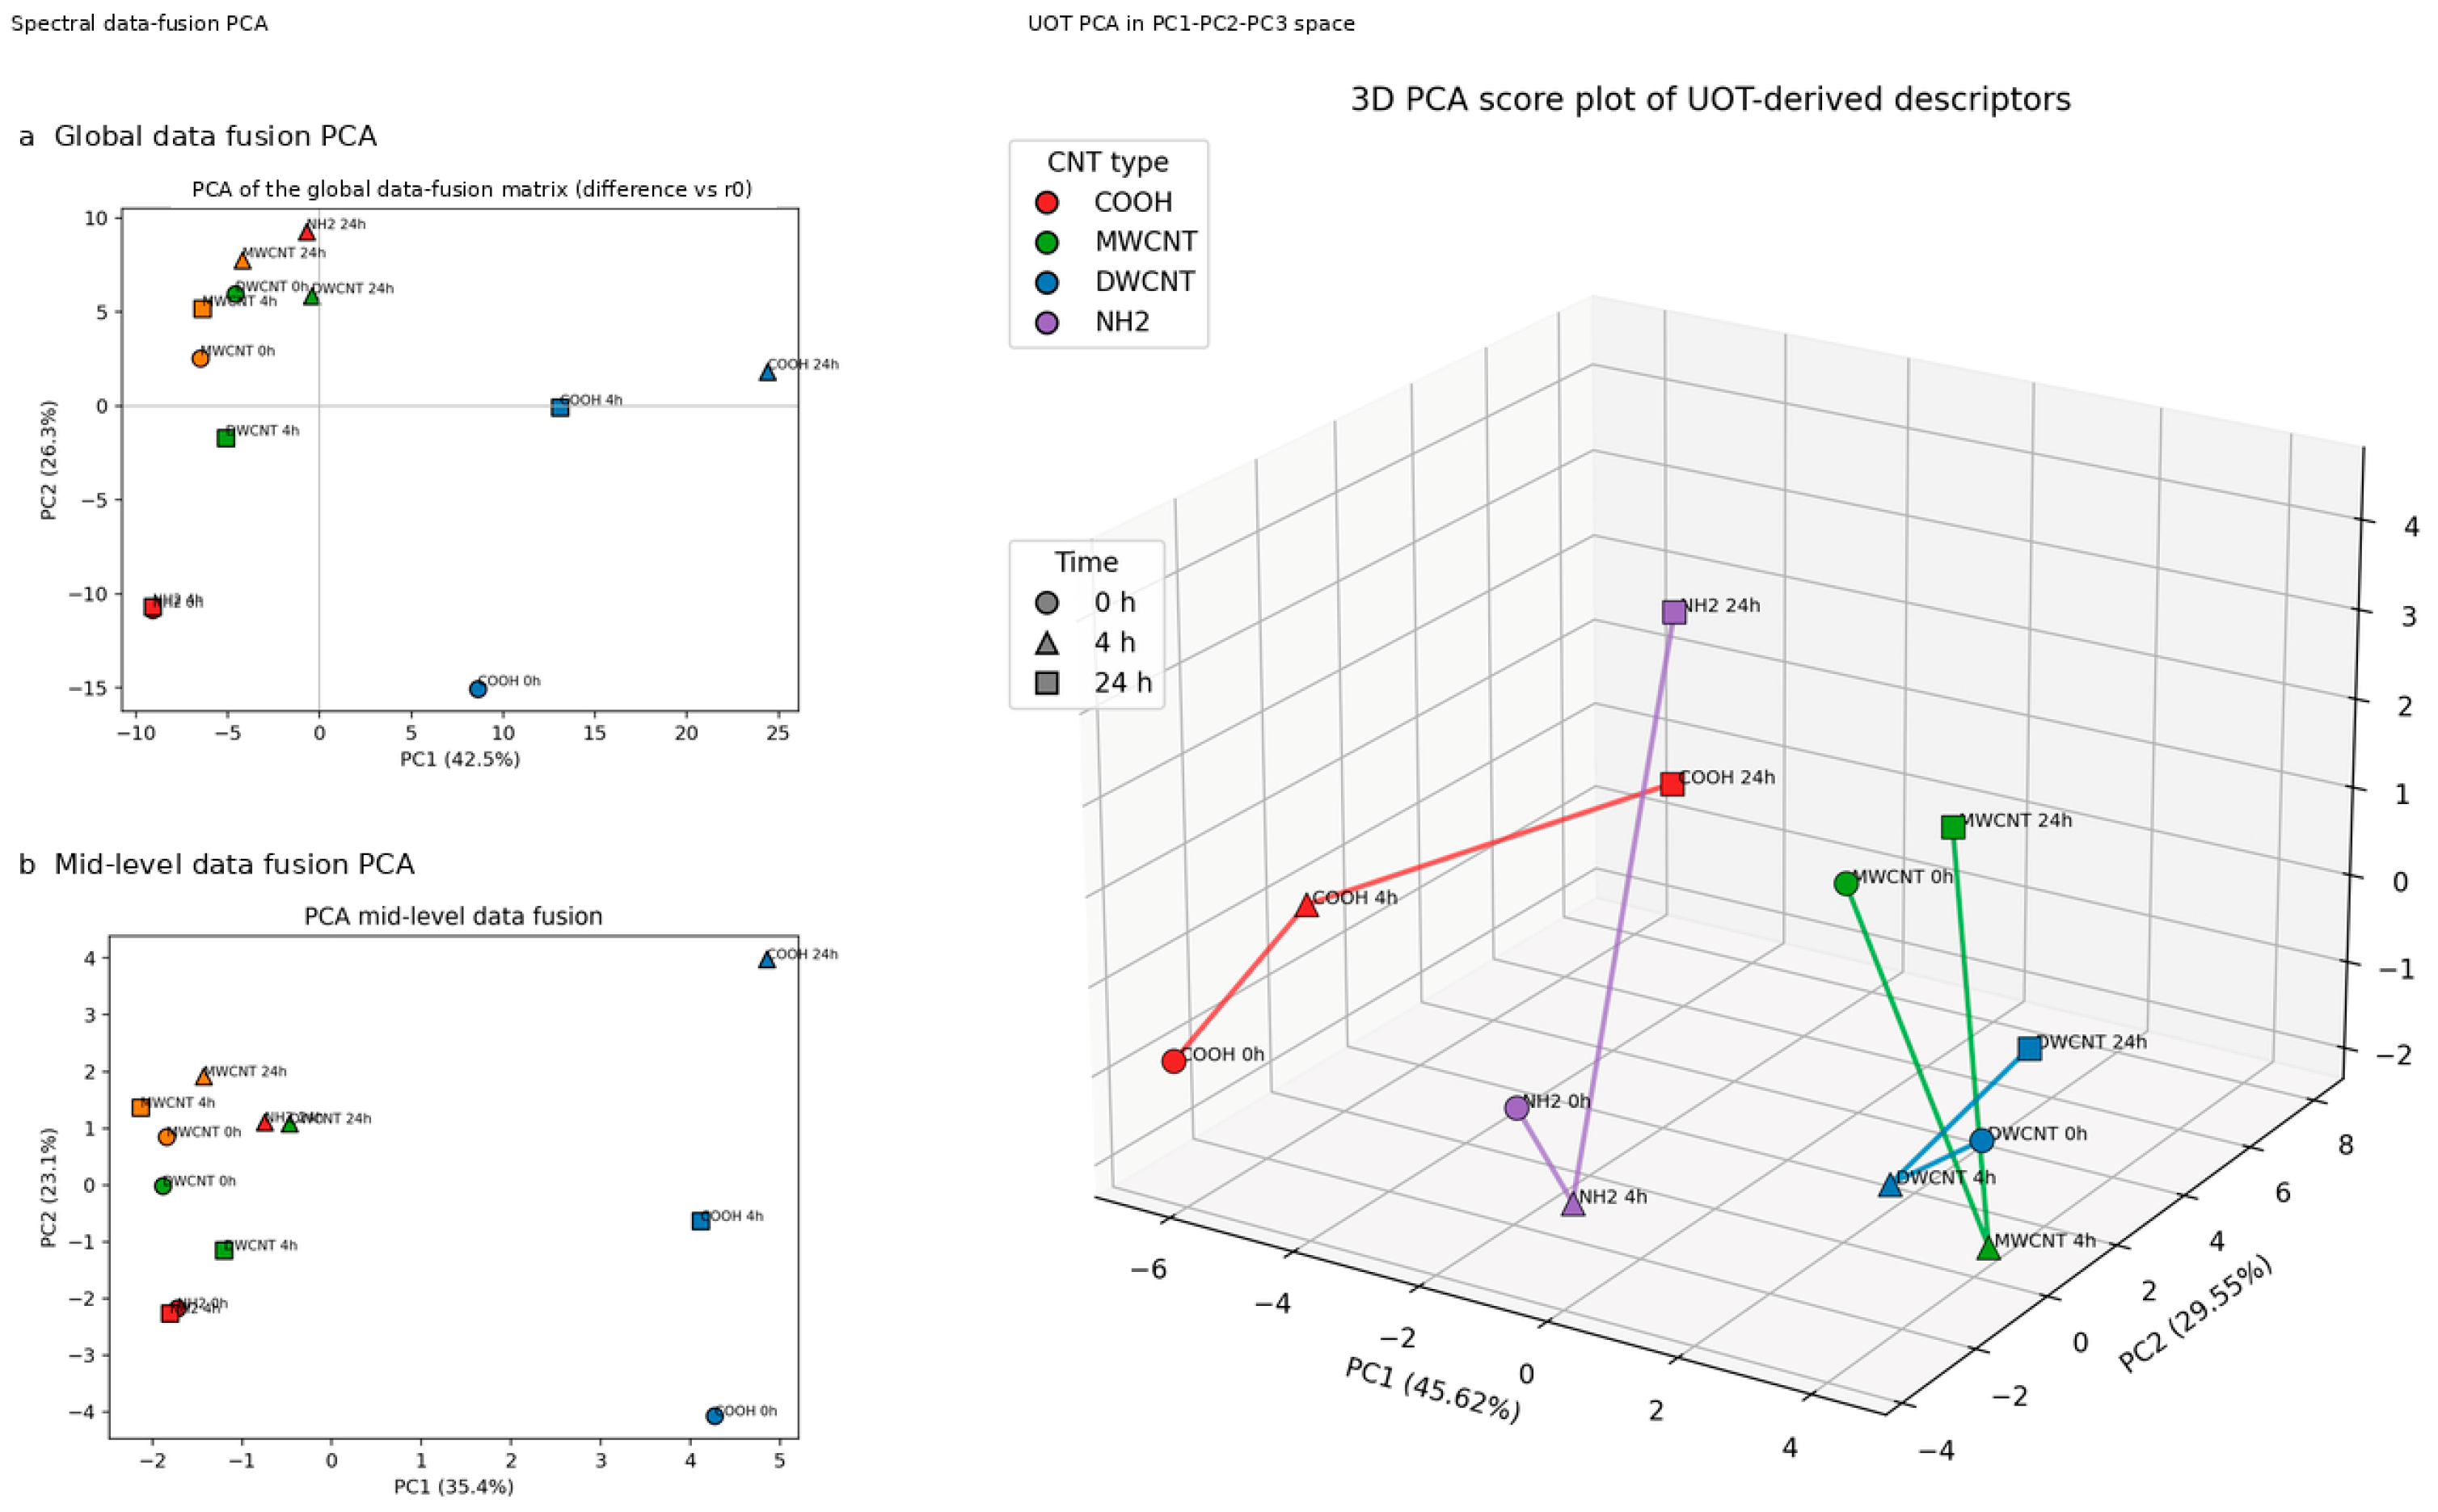
The fused spectral score plot distinguished the MCNT-COOH fingerprint from the other CNT preparations (Figure 7). Its displayed PC1 and PC2 account for 42.5% and 26.3% of variance, respectively, or 68.8% cumulatively. The mid-level fusion plot retained a similar broad contrast. This organization supports material-dependent responses of the endogenous optical fractions, while morphology and surface chemistry remain confounded across the supplied CNT preparations.
Figure 7.
Multivariate organization of endogenous optical responses. Left: (a) global and (b) mid-level spectral data-fusion PCA. Right: three-dimensional PCA of intensity/shape descriptors, labeled UOT in the graphic. The descriptor model explains 75.17% in PC1–PC2 and 85.20% in PC1–PC3. These are different input matrices and do not represent quality-prediction accuracies.
The descriptor PCA retained an additional 10.03% variance in PC3. This improves representation of the input descriptors, but explained variance is not a measure of analytical sensitivity, classification accuracy, or the strength of a molecular interaction. The interactive 3D plot is given in Figure S1.
2.4.2. Changes with Contact Time
Separate PCA models at 0, 4, and 24 h summarized the response at each contact stage. At 0 h, PC1 and PC2 explained 74.44% and 14.56% of variance, respectively. Separation at this stage is consistent with an immediate optical perturbation during sample preparation.
At 4 h, the variance distribution was similar (PC1 = 74.58%, PC2 = 14.83%). Similarity of these percentages alone does not demonstrate that slower processes were absent.
At 24 h, PC1 explained 68.40% and PC2 20.94%. The larger PC2 share indicates a different distribution of variability, but does not identify adsorption, oxidation, or aggregation as its cause. As these PCA models were fitted separately, their axes do not define a shared kinetic trajectory.
2.4.3. Spectral Blocks and Individual Channels
For emission spectra, PC1 and PC2 explained 65.71% and 23.68% of variance (89.39% from the rounded values). This describes the concentration of variance in the score plane; material separation must be judged from the score distributions and validated separately (Figure 8).
Emission channels at Ex = 360 and 410 nm (em_e and em_f) contributed prominently to the observed response. They sample overlapping UV/visible fluorophores and are treated as multicomponent optical fingerprints [2,35].
Figure 8.
Explained variance across PCA models. Stacked bars show PC1 and PC2 for (a) time-specific models, (b) spectral-block models and (c) individual fluorescence channels. Values above bars denote their sum. Models use different input matrices; variance retention does not establish classification performance.
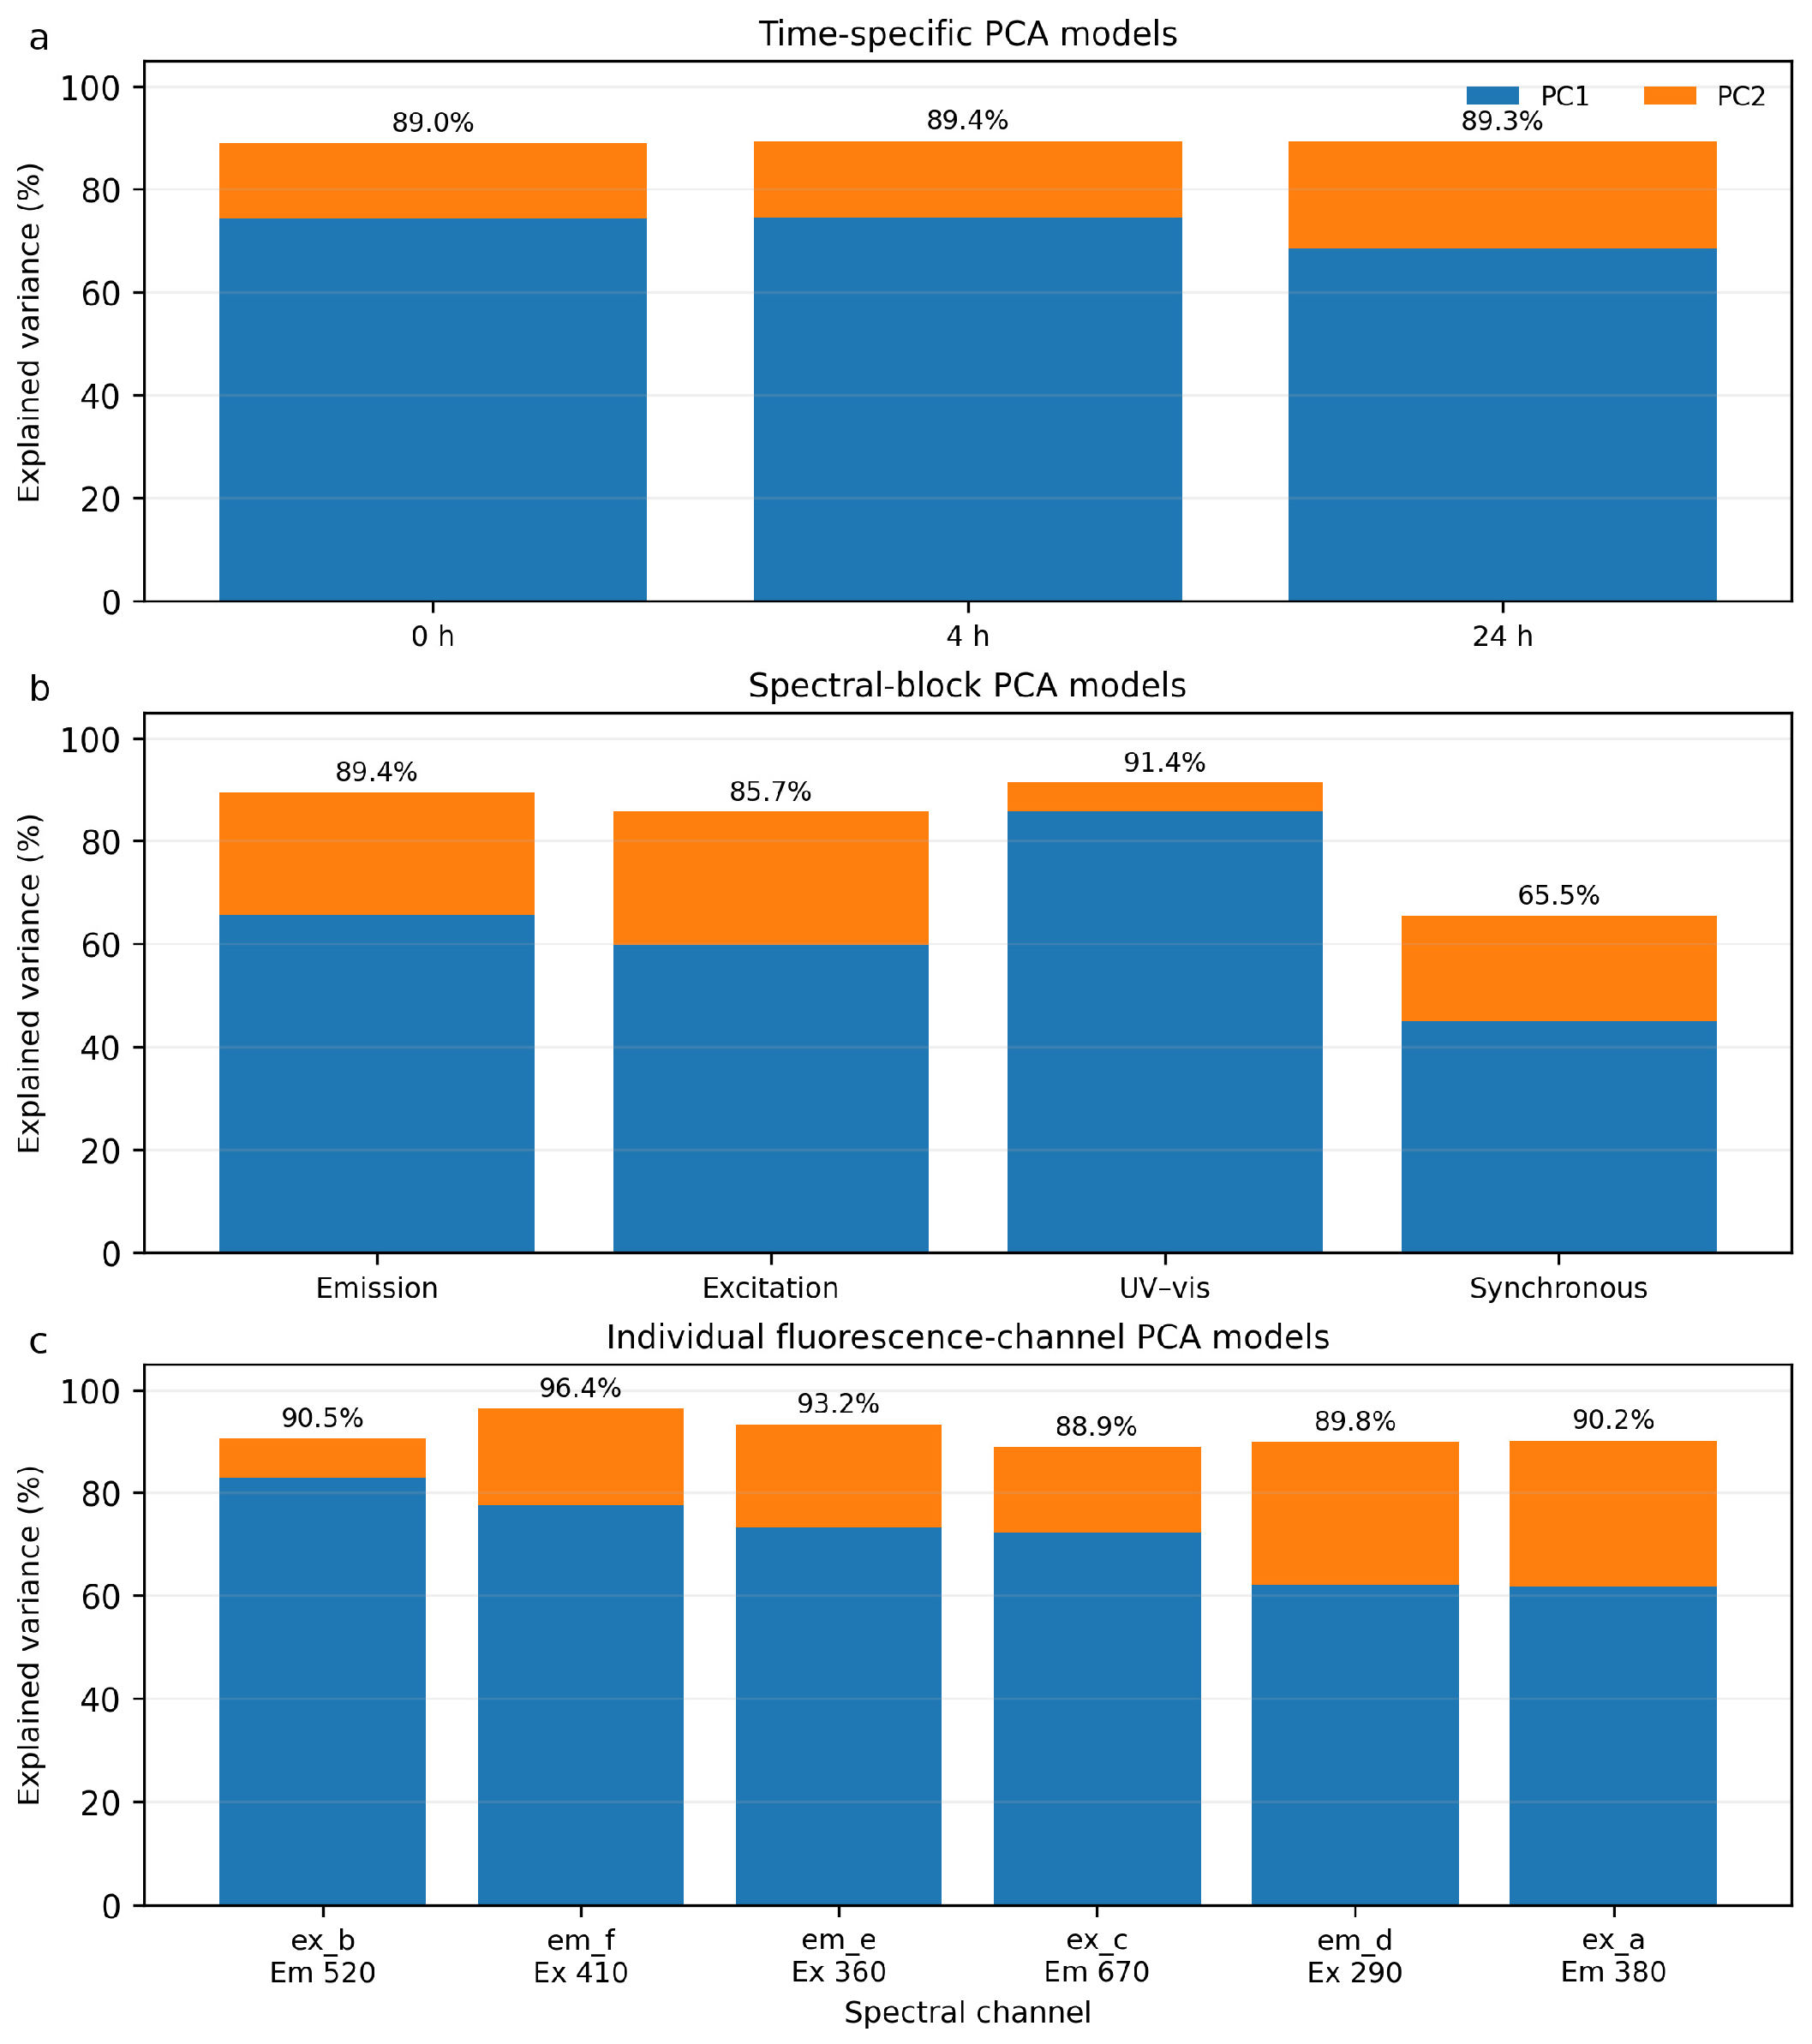
Excitation spectra showed PC1 = 59.95% and PC2 = 25.72% (85.67% combined), with MCNT-COOH differentiated from MCNT and DCNT. This agrees with the excitation-domain contrasts described above.
UV-Vis variance was dominated by PC1 (85.66%), with PC2 contributing 5.70%. The first two synchronous-fluorescence components explained 65.47%. These different variance distributions reflect different input blocks and cannot by themselves rank their discriminatory performance. Synchronous fluorescence provides complementary pigment-related information in the red domain [2,6,7].
At the channel level, ex_b retained a large proportion of variance in two components, followed by em_f and em_e. These channels are candidates for a simplified acquisition scheme, subject to checks of reproducibility and independent discrimination performance.
The ex_c channel adds information associated with red emission at 670 nm. The em_d and ex_a channels provide supplementary UV-domain information with overlapping tocopherol and phenolic contributions [2,33,34].
2.4.4. Optimal Transport Descriptors
Unbalanced optimal transport (UOT) provides a framework for comparing non-normalized positive measures, allowing both signal-magnitude differences and redistribution along the wavelength axis [38]. Optimal-transport alignment has also been explored for fluorescence-based edible-oil analysis [39], although that application does not validate the present descriptor implementation. Here, the reported intensity and shape descriptors are interpreted as complementary summaries of spectral change.
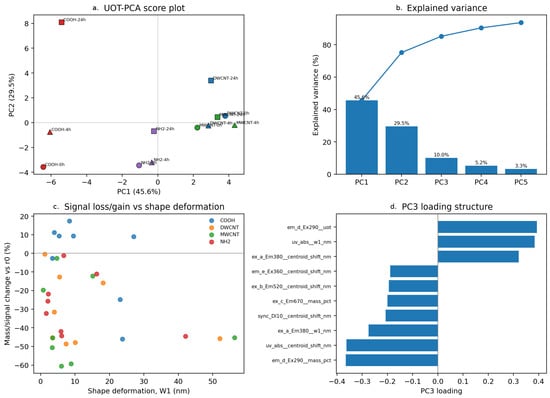
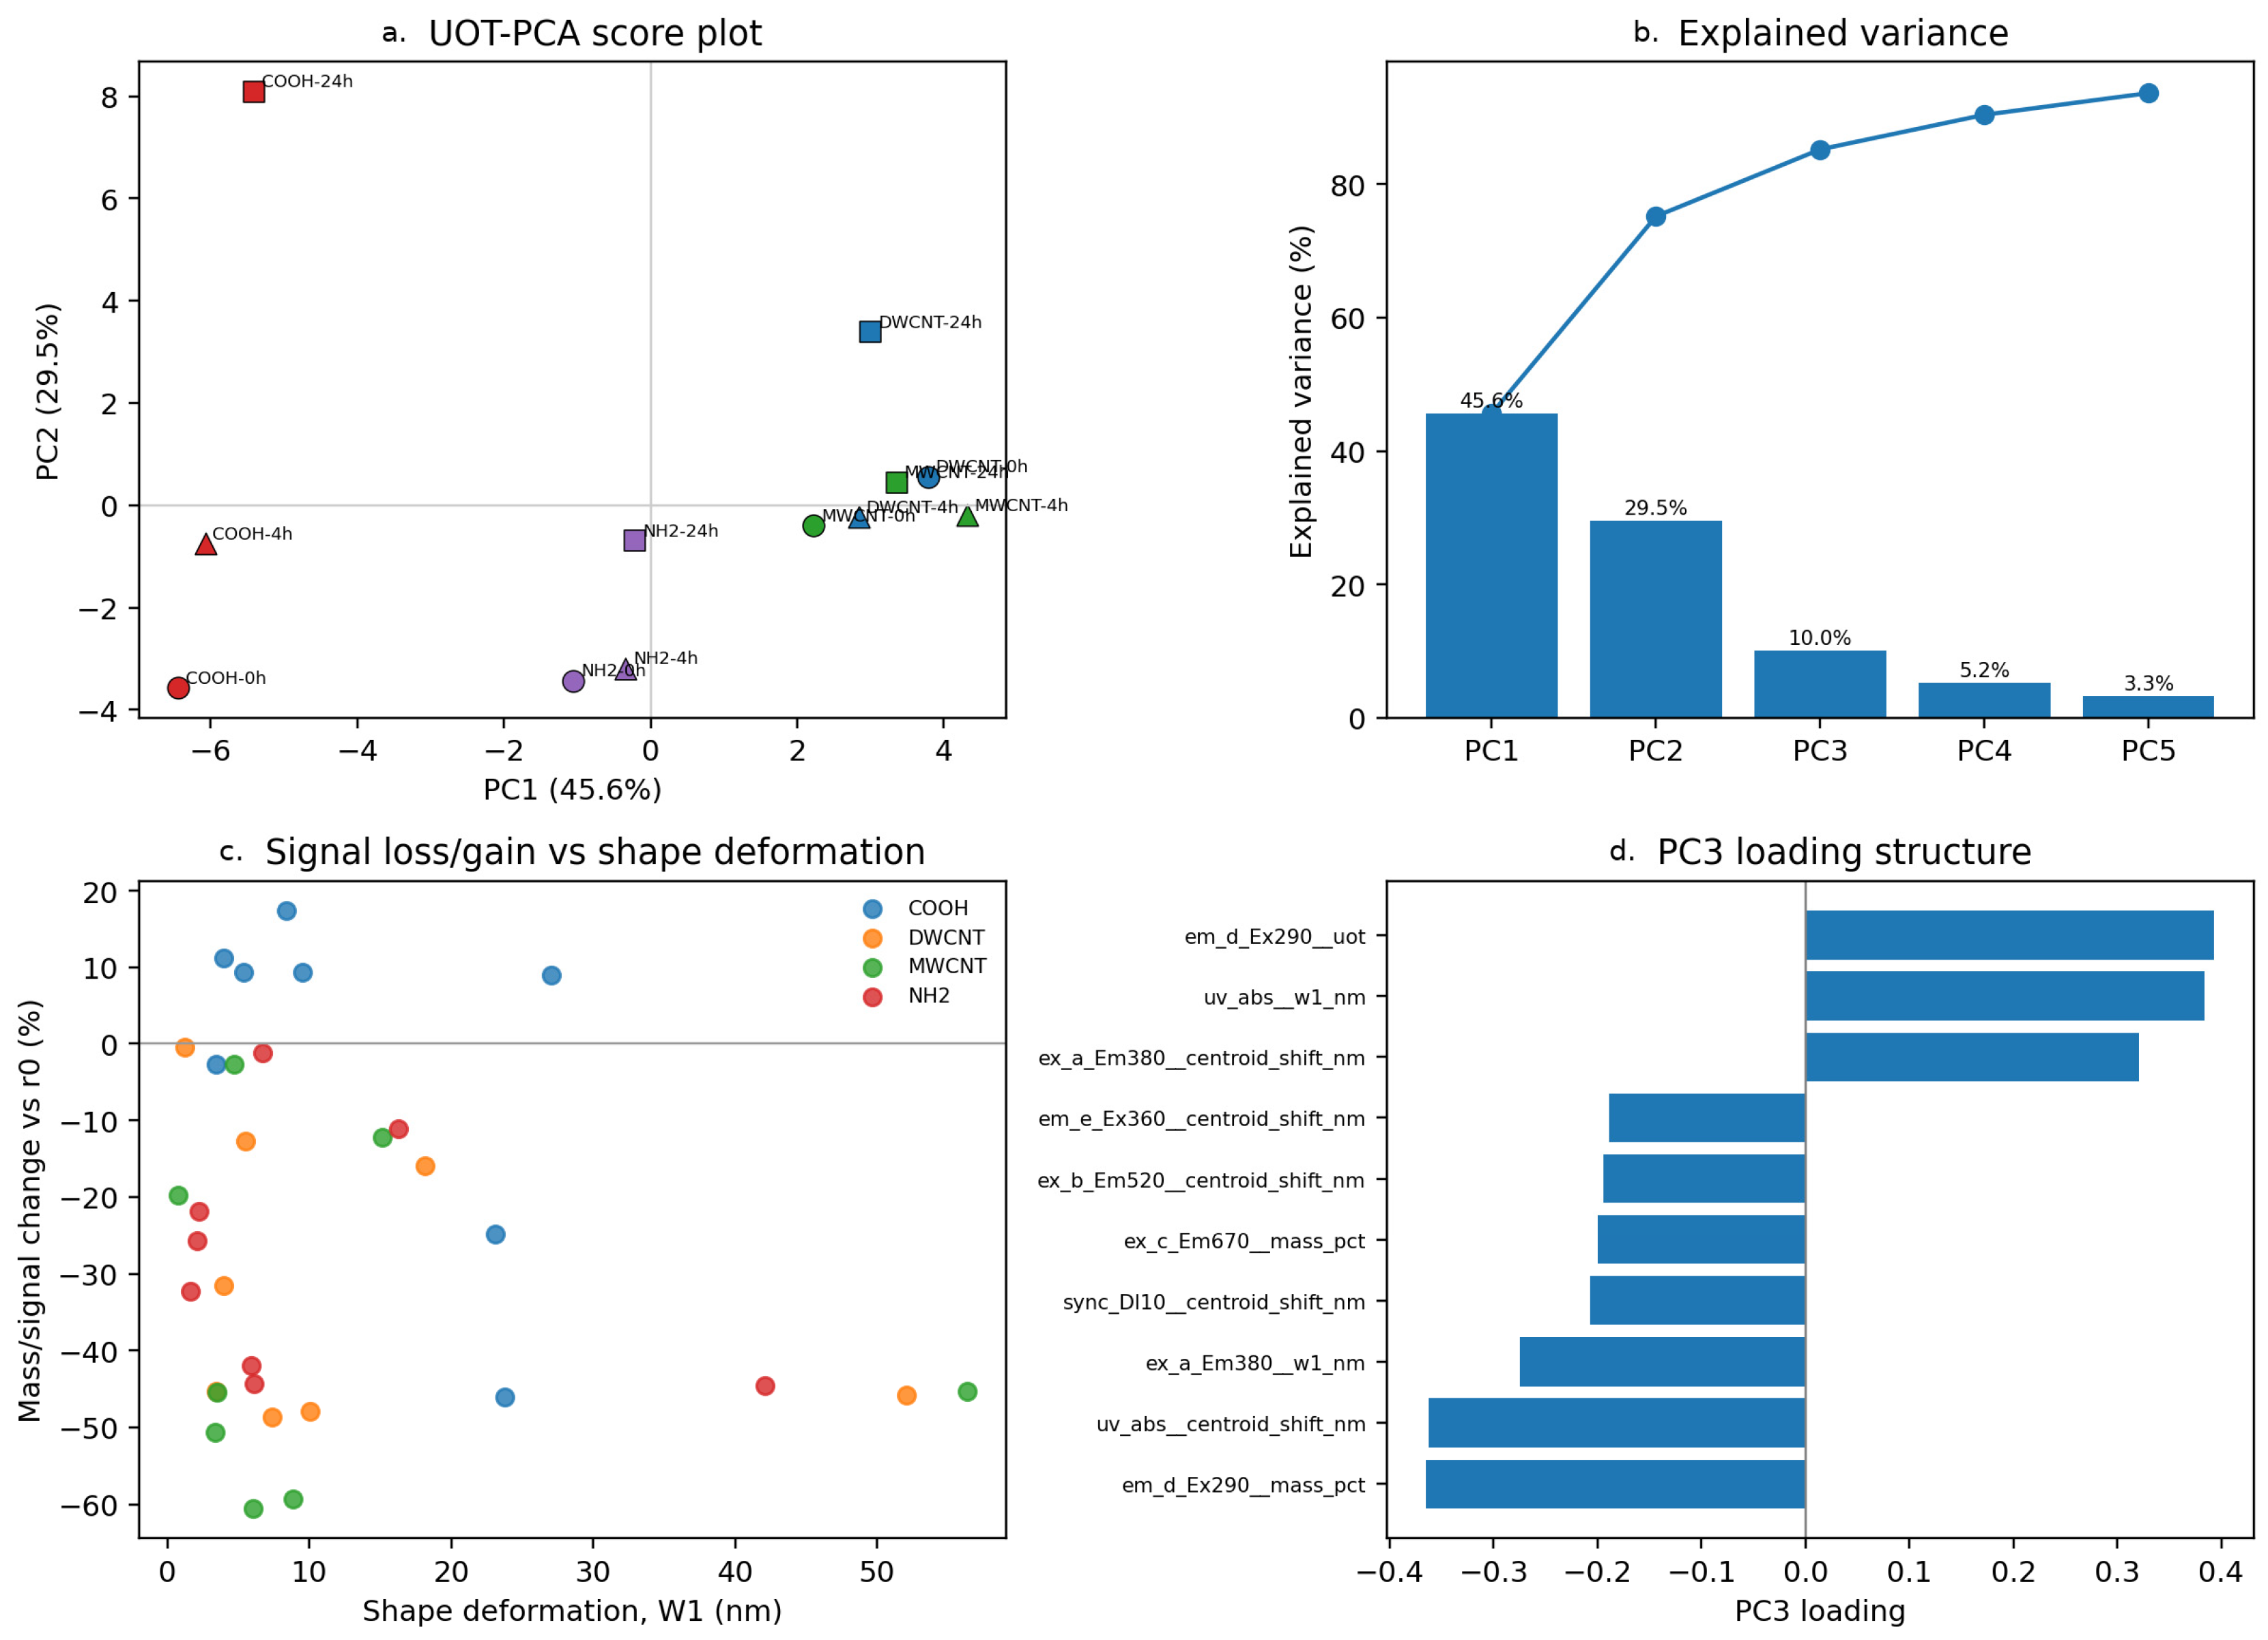
PCA of the UOT-derived descriptor matrix explained 45.62% in PC1 and 29.55% in PC2 (75.17% combined) (Figure 9). PC3 added 10.03%, increasing the cumulative value to 85.20%. Retaining PC3 therefore represents more of the descriptor variability; its molecular meaning remains tentative.
Figure 9.
UOT-derived descriptors. (a) PCA scores. (b) Scree plot. (c) Intensity and shape-related descriptors. (d) PC3 loadings. The first three PCs explain 85.20% of descriptor variance.
PC3 loadings emphasized em_d_Ex290 descriptors, UV-Vis shape changes, ex_a_Em380 centroid shifts and ex_c_Em670 redistribution. These contributions distinguish different forms of spectral change, without uniquely identifying the physical or chemical process behind them.
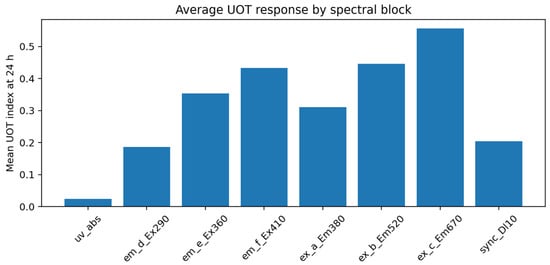
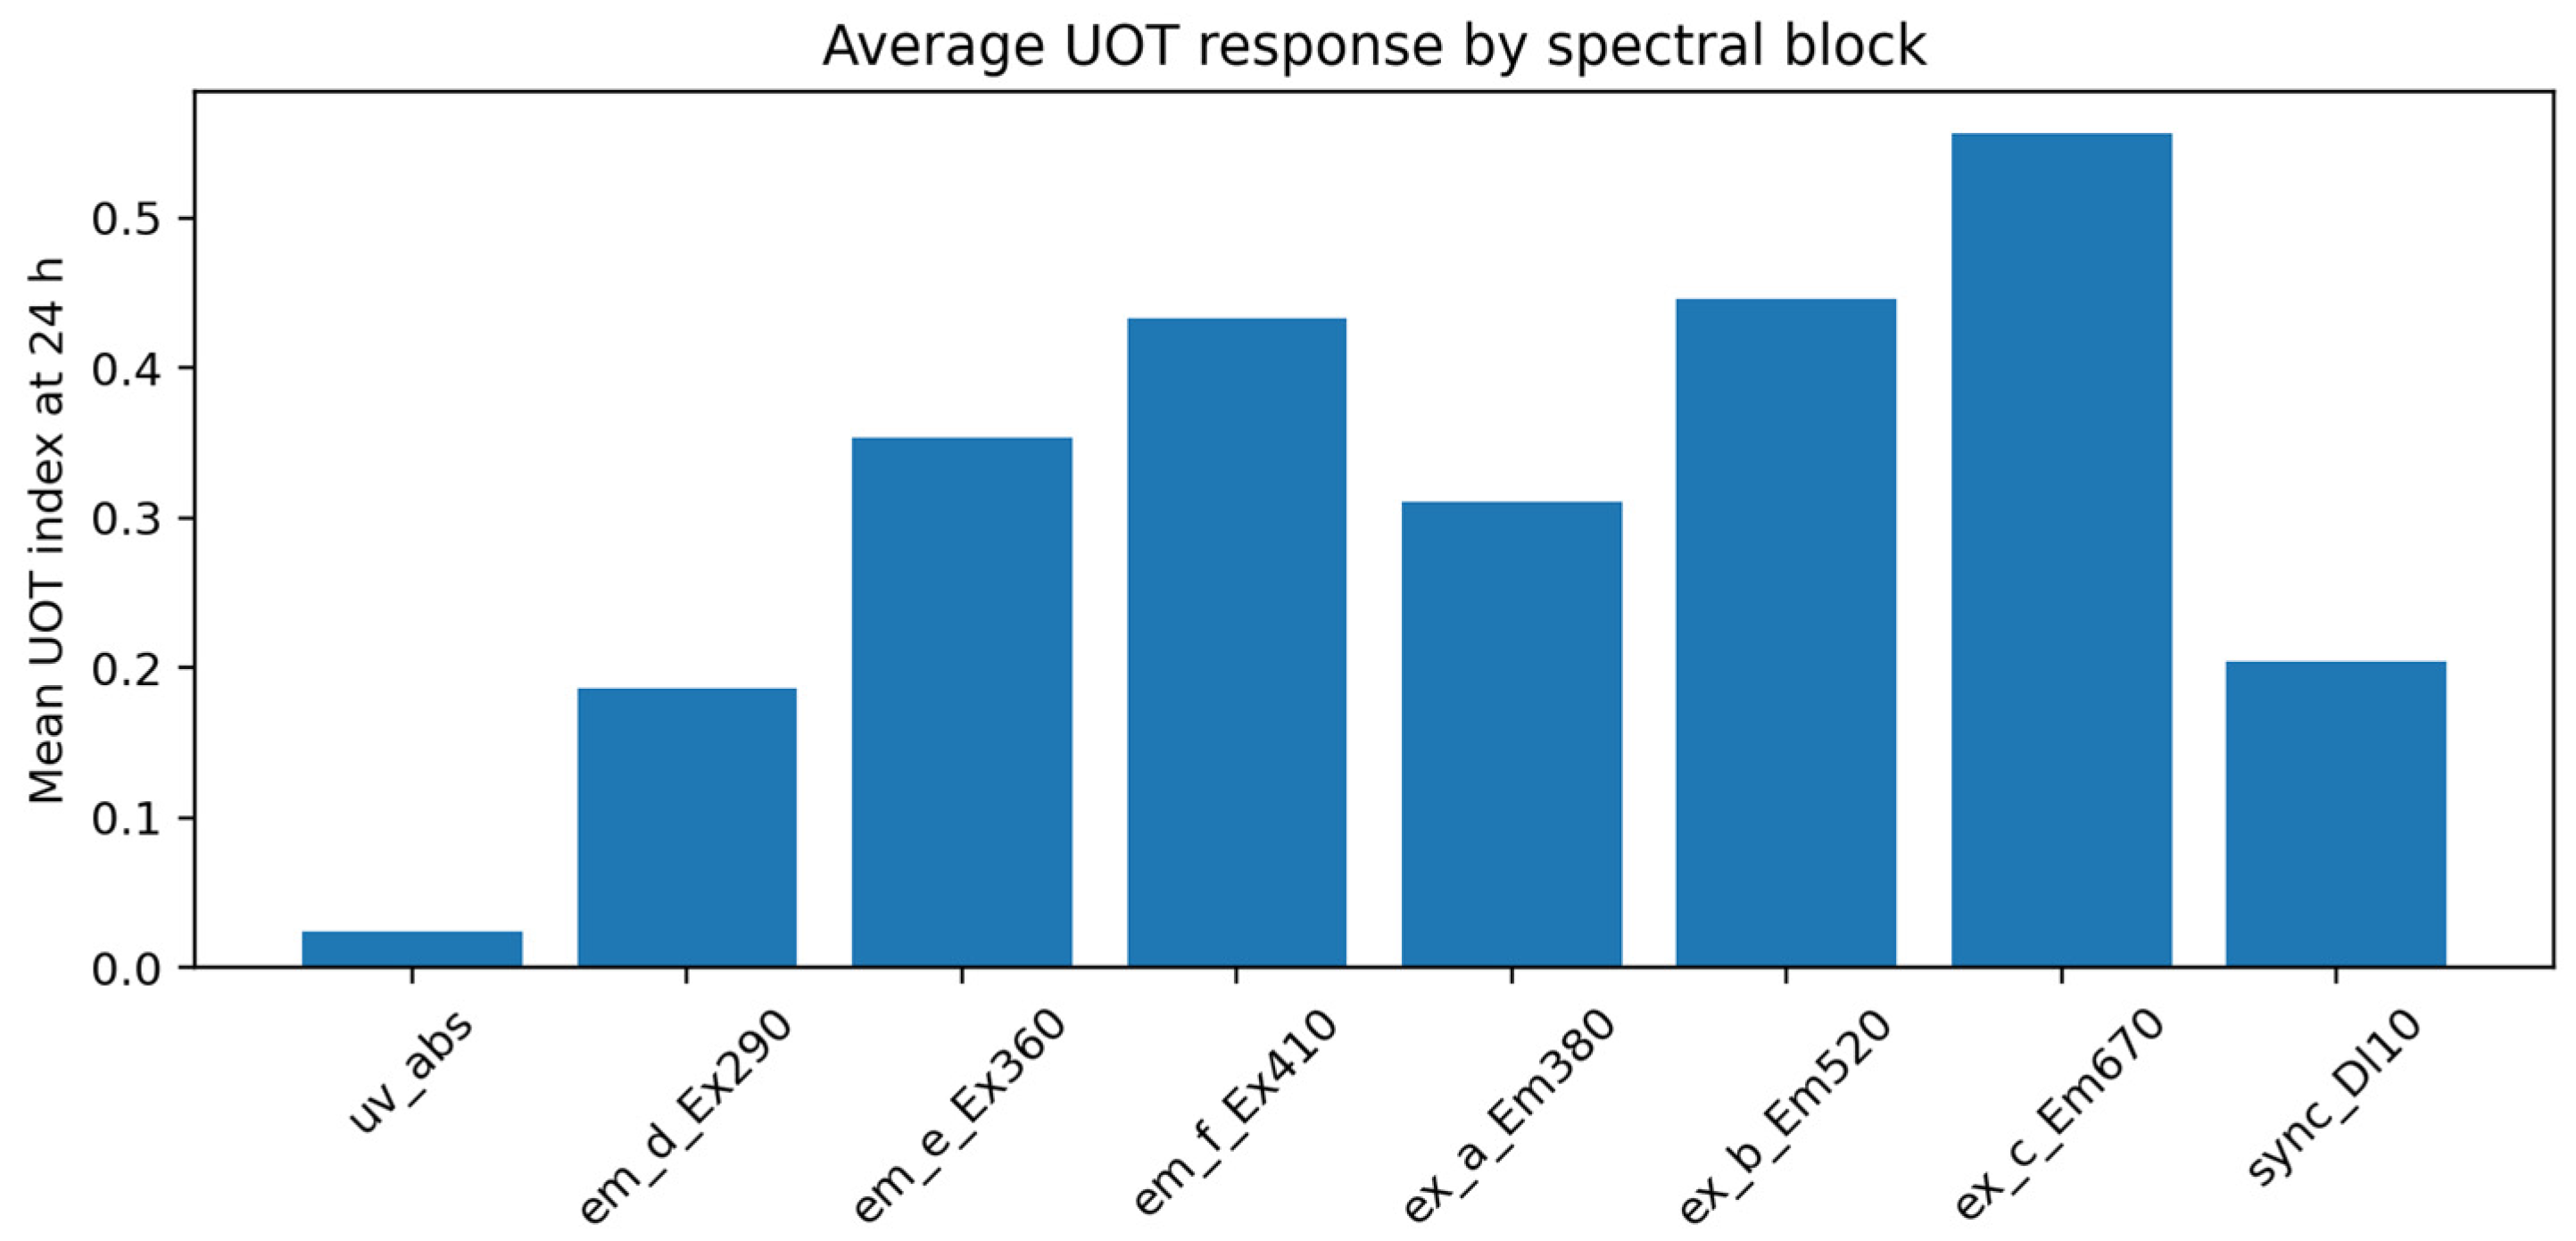
The reported mean 24 h UOT responses followed ex_c_Em670 (0.556) > ex_b_Em520 (0.446) > em_f_Ex410 (0.433) > em_e_Ex360 (0.354) > ex_a_Em380 (0.310) > synchronous fluorescence (0.205) > em_d_Ex290 (0.187) > UV-Vis (0.024) (Figure 10). Interpretation of this ranking across blocks depends on common scaling, wavelength coordinates, and transport parameters. It identifies candidate channels within the stated preprocessing scheme, rather than an intrinsic ranking of measurement sensitivity.
Figure 10.
Mean reported UOT response by spectral block after 24 h. Cross-block comparisons depend on the preprocessing and parameterization used.
In UOT terminology, “mass” refers to integrated spectral signal, not molecular mass or analyte amount. Its change can arise from concentration, quantum yield, or optical transmission. Likewise, a transport-related descriptor measures spectral redistribution and does not imply movement of molecules or prove a particular interfacial mechanism.
2.4.5. Two-Dimensional Correlation Analysis
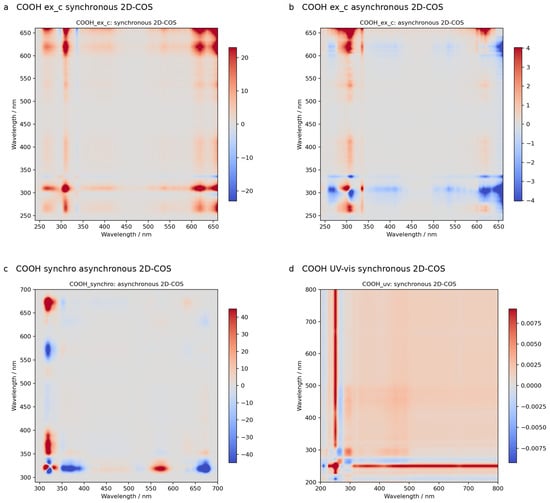
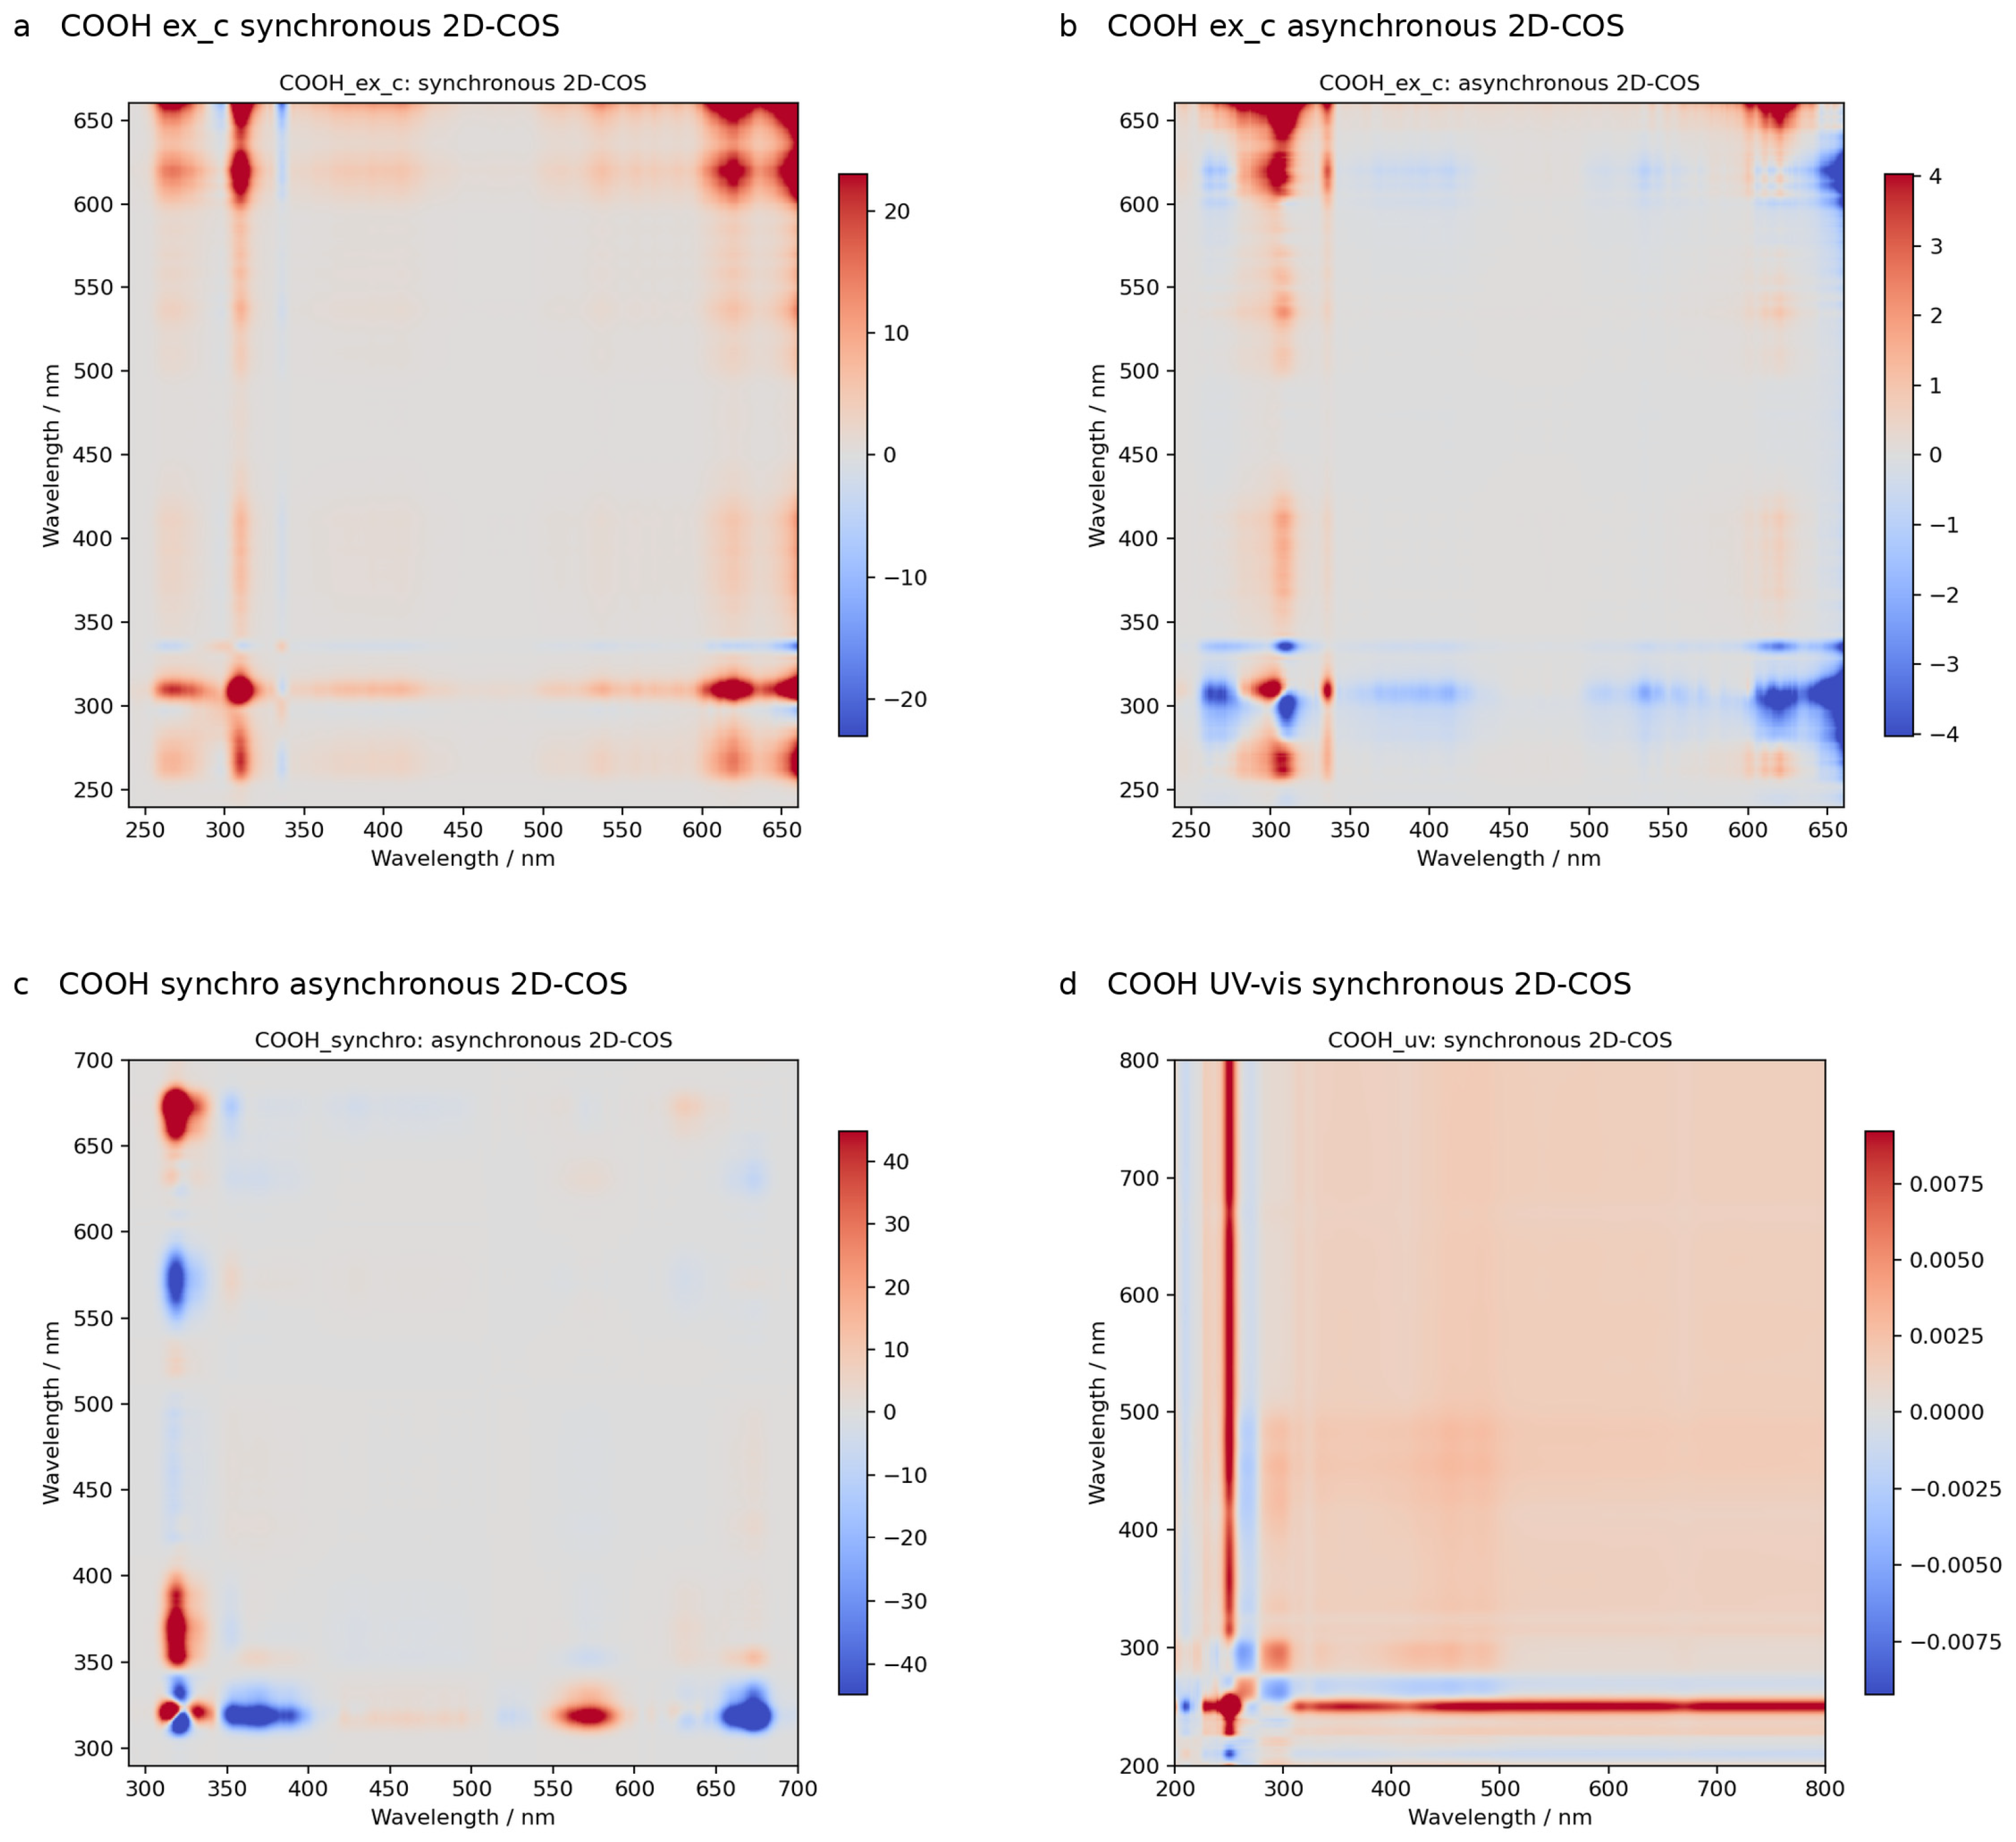
2D-COS was applied to the ordered sequence untreated oil → 0 h → 4 h → 24 h, using generalized synchronous and asynchronous analysis [21,22,23]. This sequence combines a change in treatment status with subsequent contact time and is not a uniformly sampled kinetic series. With only four spectra, cross-peaks are treated as exploratory evidence of co-variation or non-parallel response. Previous applications to oil oxidation involved different perturbations and spectroscopies [24,25].
For MCNT-COOH, the synchronous map contained an autopeak at an excitation wavelength of 660.0 nm in ex_c and UV autopeaks around 320–333 nm (Figure 11). The red feature belongs to an excitation scan monitored at Em = 670 nm; it must not be described as an emission peak. Because it lies close to the detection wavelength, scatter contamination must be excluded before assigning it to a pigment transition. The UV features overlap composite antioxidant-related domains [33,34].
Figure 11.
Representative synchronous and asynchronous 2D-COS maps. Cross-peaks describe co-variation and non-parallel spectral changes in the ordered treatment/contact sequence; they do not establish adsorption kinetics.
Asynchronous cross-peaks included 308.7/660.0 nm in ex_c and 318.4/671.6 nm in synchronous fluorescence. They indicate non-parallel evolution of spectral variables under the chosen perturbation ordering, but do not by themselves establish a causal sequence of adsorption events.
Additional synchronous autopeaks occurred at 320.9 nm (ex_a), 333.4 nm (ex_b), 325.3 nm (em_d), 455.1 nm (em_e), 462.1 nm (em_f), 318.4 nm (synchronous fluorescence) and 249.1 nm (UV-Vis). Asynchronous pairs at 390.8/455.1 nm (em_e) and 321.4/333.1 nm (em_d) further indicate non-parallel responses. Competitive adsorption is one possible explanation among several; confirmation would require denser time sampling and independent compositional measurements.
2.5. Interpretation of CNT Interactions in the Oil Matrix
The optical response is consistent with selective perturbation of minor oil constituents. Dispersion forces and interactions of conjugated pigments with graphitic surfaces provide plausible adsorption contributions, while COOH and NH2 groups may alter local polarity and hydrogen bonding [12,13]. In neat oil, the relevant driving forces depend on solvation and competition with triacylglycerols and other minor constituents. An aqueous hydrophobic-effect argument, or an assumed surface charge based on aqueous pH, is insufficient to establish the mechanism here.
The supplied materials differ in more than their nominal functional groups. Wall structure, dimensions, defects, accessible area, aggregation, and residual catalyst may also affect the response. Consequently, the distinct MCNT-COOH fingerprint supports a material-associated effect but cannot be attributed exclusively to carboxyl groups. Likewise, attenuation of carotenoid-region absorption does not establish aromatic π–π stacking, as follows: carotenoids have conjugated polyene structures, and their adsorption would require a broader description of surface and solvation interactions.
Adsorption, fluorescence quenching and pigment transformation require different evidence. Matched absorption and fluorescence comparisons after verified removal of CNTs, together with quantitative pigment measurements in the oil and recovered sorbent, would test adsorption. Fluorescence lifetimes and dilution or geometry controls would help assess quenching and optical attenuation. Time-matched oil controls and independent peroxide value, secondary-oxidation, and chromatographic measurements would test chemical transformation. Until these checks are available, the spectra establish a CNT-dependent optical fingerprint and candidate reporter domains, Table 1, rather than adsorption capacities or a calibrated quality sensor [2,26,30].
Table 1.
Candidate optical domains for further investigation of rapeseed oil after CNT contact. The evidence concerns spectral response in this dataset; chemical specificity and quality-prediction performance remain unvalidated.
3. Materials and Methods
3.1. Oil Sample
Fresh rapeseeds were dried at 40 °C and subsequently cold-pressed using a screw-pressing machine YD-ZY-03A (Zhejang Chubial Electrical Appliances, Jinhua, China) at a pressing temperature of 45 °C. To remove suspended impurities, the obtained rapeseed oil (RO) was centrifuged (MPW Med. Instruments, 04-347 Warszawa, Poland) at 5000 rpm (978× g) for 5 min. Before storage, the oil was purged with nitrogen gas (99.99% purity) to minimize oxidative changes. The oil samples were transferred into brown glass bottles and stored at −80 °C until analysis.
3.2. Carbon Nanotubes
Four carbon nanotubes (CNTs), differing in wall structure, dimensions, specific surface area, and surface functionalization, were used in this study, as follows: unmodified multiwalled CNTs (MCNT), amino-functionalized multiwalled CNTs (MCNT-NH2), double-walled CNTs (DCNT), and carboxyl-functionalized multiwalled CNTs (MCNT-COOH) (Table 2).
Table 2.
Manufacturer-reported physicochemical characteristics of the carbon nanotubes used in this study.
Pure MCNTs (CMP20105), MCNT-NH2 (CNTMA005), and DCNTs (CDI00101) were supplied by ACS Material LLC, Pasadena, CA, USA, whereas MCNT-COOH (755125) were obtained from Sigma-Aldrich, Merck, Darmstadt, Germany.
The introduction of carboxyl and amino groups was expected to modify the surface polarity and the relative contributions of dispersive, π–π, and polar interactions with endogenous oil constituents. Consequently, these four CNT systems were selected to investigate whether differences in nanotube structure and surface chemistry produce distinguishable optical responses of native rapeseed-oil chromophores.
3.3. Sample Preparation and Incubation
CNTs were added to the oil at a concentration of 0.5% (w/w, relative to the mass of oil). Initially, 0.5 mL of RO and 0.05 mL of oleic acid, used as a dispersion-promoting agent, were added to a vial containing the appropriate amount of CNTs and gently mixed. Subsequently, an additional 1.5 mL of RO was added, giving a total oil volume of 2.0 mL.
The samples were magnetically stirred at 300 rpm and 35 °C for 30 min and then incubated for 24 h with occasional gentle mixing. UV-Vis spectra were recorded immediately after preparation (0 h) and after 4 and 24 h of interaction.
After incubation, the samples were centrifuged at 10,000 rpm (1946× g) for 10 min, and the resulting supernatant was used for spectroscopic measurements. All experimental time points were included in the time-dependent chemometric analyses.
3.4. UV–Vis and Emission Spectroscopy and Spectral Preprocessing
UV-Vis absorption spectra were recorded using a UV-3100 Analyst PC spectrometer (VWR International bv, Leuven, Belgium) over the wavelength range of 200–750 nm. The spectral interval from 250 to 750 nm was retained for subsequent chemometric analysis. Fluorescence spectra were recorded using a 5001 PC spectrofluorometer (Shimadzu Corporation, Kyoto, Japan). Undiluted oil samples were measured using a silica cuvette with a 1 mm optical path length and 10 mm external width (Hellma GmbH & Co. KG, Müllheim, Germany).
Before chemometric analysis, each spectrum was offset-corrected by subtracting its minimum absorbance value over the analyzed spectral range. This procedure removed constant spectral offsets while preserving the relative shape and intensity distribution of the absorption bands.
3.5. Chemometric Analysis Methods
Chemometric analyses were performed on minimum-offset-corrected spectra. Selected-wavelength changes were calculated as At − A0 within each CNT series. Whole-spectrum analyses used either these time-difference spectra or the complete non-negative baseline-corrected spectral matrix, as specified below. This consistent preprocessing was applied after verification of the CNT assignments at all time points.
3.5.1. Principal Component and Contribution Analyses
PCA was performed on time-difference spectra for the complete 250–750 nm interval. For each CNT variant, the 0 h state was represented by the zero difference vector, and the 4 h and 24 h states by A4h − A0h and A24h − A0h, respectively. PCA scores were used to compare CNT-specific temporal trajectories, and wavelength–PC1 correlations were calculated to identify the spectral variables most strongly associated with the dominant axis.
Region-level interpretation used the principal chromophoric intervals 250–350 nm, 390–500 nm, and 650–685 nm. The contribution profile was calculated as the root-mean-square magnitude of the 24 h minus 0 h difference across the four CNT variants, thereby avoiding cancellation when different CNTs produced changes of opposite sign.
Because no replicate confidence regions were available for the PCA trajectories, the score-space separations were interpreted descriptively. Percentage changes at low-absorbance wavelengths were always considered together with the corresponding absolute ΔA values.
3.5.2. Two-Dimensional Correlation Spectroscopy
Generalized two-dimensional correlation spectroscopy (2D-COS) was recalculated separately for each CNT using the three available interaction times (0, 4, and 24 h) as the external perturbation variable. Dynamic spectra were obtained by subtracting the mean spectrum of each three-point series.
Synchronous maps were used to describe coordinated spectral changes and asynchronous maps to identify responses that were not perfectly in phase. CNT-specific maps were calculated first, and their arithmetic mean was used only as an overall visualization of the case.
Tentative relative response orders were derived from the signs of the strongest cross-domain synchronous and asynchronous peaks according to Noda’s rules. Because only three perturbation points were available, these orders were used strictly as comparative descriptors and not as kinetic reaction sequences.
The main domains evaluated in the corrected 2D-COS summary were 250–330 nm (UV-active), 390–500 nm (carotenoid-related), and 650–685 nm (chlorophyll-related). The low absolute variance of the far-red signal was considered when interpreting weak 2D-COS features.
3.5.3. Optimal Transport Analysis
Balanced OT quantified spectral-shape changes using the first Wasserstein distance after normalizing each non-negative baseline-corrected spectrum to unit mass. For UOT, the wavelength axis was scaled to 0–1 and a squared-distance cost matrix was used with entropic regularization ε = 5 × 10⁻⁴ and mass-relaxation parameter 2 × 10⁻². Comparisons were calculated for 0–4 h, 4–24 h, and 0–24 h. Band-integrated AUC changes were additionally calculated for 250–330, 390–500, and 650–685 nm. OT/UOT metrics were interpreted as descriptors of spectral redistribution, not direct measures of adsorption or molecular conversion.
3.6. Software
Spectral data visualization was performed using OriginPro 2025 (OriginLab Corporation, Northampton, MA, USA). Chemometric calculations were performed in Python 3.13 using the NumPy, scikit-learn, and Matplotlib libraries. Python scripts were developed and executed in the PyCharm 2025.4 development environment.
4. Conclusions
Contact with different CNT preparations produced distinct, time-dependent optical responses in cold-pressed rapeseed oil. Fluorescence emission and excitation differentiated the materials, particularly through strong suppression of chlorophyll-derived red fluorescence and the larger residual signal and selective UV excitation enhancements observed for MCNT-COOH. Synchronous fluorescence revealed contrasting regional responses, as follows: after 24 h, red-band areas decreased by 66.6–84.9% relative to untreated oil with centroid displacements below 1.4 nm, whereas green-visible areas increased by 43.1–88.9% and shifted toward longer wavelengths. Complementary absorption measurements identified additional changes in the UV and visible chromophore domains.
PCA organized the material-dependent fingerprints and variation associated with contact time. UOT-derived descriptors captured complementary intensity and spectral-shape changes, while 2D-COS identified non-parallel evolution of spectral domains. Together, these analyses showed that the response cannot be represented adequately by uniform fluorescence attenuation or a single wavelength. Their contribution is exploratory characterization of spectral variability rather than independent identification of molecular mechanisms or validation of predictive performance.
The study supports a feasibility assessment of endogenous chromophores as optical reporters of CNT–oil interactions. Quantitative pigment analysis, matched time controls, documented particle removal, and independent oxidation measurements are needed to test the proposed mechanisms. Validation across oil batches and comparison with measurements without CNT probing are required before claiming oil-quality prediction.
Supplementary Materials
The following supporting information can be downloaded at: https://www.mdpi.com/article/10.3390/molecules31224193/s1. An interactive three-dimensional PCA score plot is additionally provided as Interactive Figure S1 (Interactive_Figure_S1_PCA_3D.html).
Author Contributions
Conceptualization, G.N. and K.P.; methodology, G.N. and K.P.; software, K.P.; validation, G.N. and K.P.; formal analysis, G.N., W.K.-R., J.C.O. and K.P.; investigation, G.N. and K.P.; resources, W.K.-R. and K.P.; data curation, G.N., W.K.-R., J.C.O. and K.P.; writing—original draft preparation, G.N. and K.P.; writing—review and editing, G.N., W.K.-R., J.C.O. and K.P.; visualization, G.N. and K.P.; supervision, K.P.; project administration, G.N.; funding acquisition, G.N. All authors have read and agreed to the published version of the manuscript.
Funding
The publication was partially financed by the Polish Minister of Science and Higher Education as part of the Strategy of the Poznan University of Life Sciences for 2024–2026 in the field of improving scientific research and development work in priority research areas.
Institutional Review Board Statement
Not applicable.
Informed Consent Statement
Not applicable.
Data Availability Statement
The original contributions presented in the study are included in the article, further inquiries can be directed to the corresponding authors.
Acknowledgments
The authors would like to thank Mikołaj Kościński for providing the research materials (carbon nanotubes) used in this study. During the preparation of this manuscript, the authors used ChatGPT 6.1 Sol (OpenAI) for language editing and manuscript formatting. The authors reviewed and edited the output and take full responsibility for the content of the publication.
Conflicts of Interest
The authors declare no conflicts of interest.
Abbreviations
The following abbreviations are used in this manuscript:
| CNT | Carbon Nanotube(s) |
| MCNT | Unmodified Multiwalled Carbon Nanotubes |
| MCNT-NH2 | Amino-Functionalized Multiwalled Carbon Nanotubes |
| DCNT | Double-Walled Carbon Nanotubes |
| MCNT-COOH | Carboxyl-Functionalized Multiwalled Carbon Nanotubes |
| PCA | Principal Component Analysis |
| MCR-ALS | Multivariate Curve Resolution–Alternating Least Squares Analysis |
| 2D-COS | Two-Dimensional Correlation Spectroscopy |
| OT | Optimal Transport |
| UOT | Unbalanced Optimal Transport |
References
- Chew, S.C. Cold-Pressed Rapeseed (Brassica Napus) Oil: Chemistry and Functionality. Food Res. Int. 2020, 131, 108997. [Google Scholar] [CrossRef] [Scilit] [PubMed]
- Sikorska, E.; Wójcicki, K.; Kozak, W.; Gliszczynska-Swigło, A.; Khmelinskii, I.; Górecki, T.; Caponio, F.; Paradiso, V.M.; Summo, C.; Pasqualone, A. Front-Face Fluorescence Spectroscopy and Chemometrics for Quality Control of Cold-Pressed Rapeseed Oil during Storage. Foods 2019, 8, 665. [Google Scholar] [CrossRef] [Scilit] [PubMed]
- Li, Q.; Wang, M.; Belén Fernández, M.; Sagymbek, A.; Dong, Y.; Gao, Y.; Yu, X. Indication of the Color Change on the Oxidation Properties of Fragrant Rapeseed Oil during Shelf Storage. Food Chem. X 2023, 20, 100908. [Google Scholar] [CrossRef] [Scilit] [PubMed]
- Marcinkowski, D.; Bochniak, M.; Wereńska, M.; Czwartkowski, K. The Influence of Storage Conditions of Cold-Pressed Rapeseed Oil on Its Quality Parameters. Appl. Sci. 2023, 13, 11746. [Google Scholar] [CrossRef] [Scilit]
- Daun, J.K. Spectrophotometric Analysis of Chlorophyll Pigments in Canola and Rapeseed Oils. Lipid Technol. 2012, 24, 134–136. [Google Scholar] [CrossRef] [Scilit]
- Sikorska, E.; Górecki, T.; Khmelinskii, I.V.; Sikorski, M.; Kozioł, J. Classification of edible oils using synchronous scanning fluorescence spectroscopy. Food Chem. 2005, 89, 217–225. [Google Scholar] [CrossRef] [Scilit]
- Sikorska, E.; Romaniuk, A.; Khmelinskii, I.V.; Herance, R.; Bourdelande, J.L.; Sikorski, M.; Kozioł, J. Characterization of Edible Oils Using Total Luminescence Spectroscopy. J. Fluoresc. 2004, 14, 25–35. [Google Scholar] [CrossRef] [Scilit] [PubMed]
- Wahab, Y.A.; Al-Ani, L.A.; Khalil, I.; Schmidt, S.; Tran, N.N.; Escribà-Gelonch, M.; Woo, M.W.; Davey, K.; Gras, S.; Hessel, V.; et al. Nanomaterials: A critical review of impact on food quality control and packaging. Food Control 2024, 163, 110466. [Google Scholar] [CrossRef] [Scilit]
- Yan, Z.; Lin, S.; Li, F.; Qiang, J.; Zhang, S. Food nanotechnology: Opportunities and challenges. Food Funct. 2024, 15, 9690–9706. [Google Scholar] [CrossRef] [Scilit] [PubMed]
- Li, C.; Shi, G. Carbon nanotube-based fluorescence sensors. J. Photochem. Photobiol. C Photochem. Rev. 2014, 19, 20–34. [Google Scholar] [CrossRef] [Scilit]
- Sabui, P.; Mallick, S.; Singh, K.R.; Natarajan, A.; Verma, R.; Singh, J.; Singh, R.P. Potentialities of fluorescent carbon nanomaterials as sensor for food analysis. Luminescence 2023, 38, 1047–1063. [Google Scholar] [CrossRef] [Scilit] [PubMed]
- Dubey, R.; Dutta, D.; Sarkar, A.; Chattopadhyay, P. Functionalized carbon nanotubes: Synthesis, properties and applications in water purification, drug delivery, and material and biomedical sciences. Nanoscale Adv. 2021, 3, 5722–5744. [Google Scholar] [CrossRef] [Scilit] [PubMed]
- Pan, B.; Xing, B. Adsorption Mechanisms of Organic Chemicals on Carbon Nanotubes. Environ. Sci. Technol. 2008, 42, 9005–9013. [Google Scholar] [CrossRef] [Scilit] [PubMed]
- Gonçalves, R.P.; Março, P.H.; Valderrama, P. Thermal edible oil evaluation by UV–Vis spectroscopy and chemometrics. Food Chem. 2014, 163, 83–86. [Google Scholar] [CrossRef] [Scilit] [PubMed]
- Mahesar, S.A.; Bendini, A.; Cerretani, L.; Bonoli-Carbognin, M.; Sherazi, S.T.H. Application of a spectroscopic method to estimate the olive oil oxidative status. Eur. J. Lipid Sci. Technol. 2010, 112, 1356–1362. [Google Scholar] [CrossRef] [Scilit]
- Much, D.G.; Alcaraz, M.R.; Camiña, J.M.; Goicoechea, H.C.; Azcarate, S.M. Leveraging the performance of conventional spectroscopic techniques through data fusion approaches in high-quality edible oil adulteration analyses. Talanta Open 2024, 9, 100313. [Google Scholar] [CrossRef] [Scilit]
- Guo, M.; Wang, K.; Lin, H.; Wang, L.; Cao, L.; Sui, J. Spectral data fusion in nondestructive detection of food products: Strategies, recent applications, and future perspectives. Compr. Rev. Food Sci. Food Saf. 2024, 23, e13301. [Google Scholar] [CrossRef] [Scilit] [PubMed]
- Li, Z.; Deng, W.; Zhao, J.; Kong, Y. Spectroscopy-multimodal data fusion empowers smart food quality analysis: Challenges and prospects. Food Chem. X 2026, 36, 103939. [Google Scholar] [CrossRef] [Scilit] [PubMed]
- Martín-Tornero, E.; Simón-García, D.; Álvarez-Ortí, M.; Pardo, J.E.; Durán-Merás, I.; Martín-Vertedor, D. Non-destructive fluorescence spectroscopy for quality evaluation of almond oils extracted from roasted kernel. Talanta Open 2024, 9, 100334. [Google Scholar] [CrossRef] [Scilit]
- Ruckebusch, C.; Blanchet, L. Multivariate curve resolution: A review of advanced and tailored applications and challenges. Anal. Chim. Acta 2013, 765, 28–36. [Google Scholar] [CrossRef] [Scilit] [PubMed]
- Ozaki, Y.; Šašic, S.; Tanaka, T.; Noda, I. Two-Dimensional Correlation Spectroscopy: Principle and Recent Theoretical Development. Bull. Chem. Soc. Jpn. 2001, 74, 1–17. [Google Scholar] [CrossRef] [Scilit]
- Jung, Y.M.; Noda, I. New Approaches to Generalized Two-Dimensional Correlation Spectroscopy and Its Applications. Appl. Spectrosc. Rev. 2006, 41, 515–547. [Google Scholar] [CrossRef] [Scilit]
- Noda, I. Two-Dimensional Correlation Analysis Useful for Spectroscopy, Chromatography, and Other Analytical Measurements. Anal. Sci. 2007, 23, 139–146. [Google Scholar] [CrossRef] [Scilit] [PubMed]
- Muik, B.; Lendl, B.; Molina-Diaz, A.; Valcarcel, M.; Ayora-Cañada, M.J. Two-dimensional correlation spectroscopy and multivariate curve resolution for the study of lipid oxidation in edible oils monitored by FTIR and FT-Raman spectroscopy. Anal. Chim. Acta 2007, 593, 54–67. [Google Scholar] [CrossRef] [Scilit] [PubMed]
- Matsakidou, A.; Papadopoulou, D.; Nenadis, N.; Tsimidou, M.Z. Getting inside on virgin olive oil (VOO) photooxidation kinetics through combined generalized 2D correlation analysis and moving window 2D correlation analysis of ATR-FTIR spectra. Talanta 2020, 215, 120917. [Google Scholar] [CrossRef] [Scilit] [PubMed]
- Lv, Y.; Luo, S.; Xiong, Y.; Ye, Z.; Liu, Y.; Zhang, Z. Graphene materials as a novel and efficient adsorbent for the chlorophyll removal from rapeseed oil: Adsorption performance and mechanism. Food Biosci. 2024, 62, 105210. [Google Scholar] [CrossRef] [Scilit]
- Xu, H.; Sun, J.; Wang, H.; Zhang, Y.; Sun, X. Adsorption of aflatoxins and ochratoxins in edible vegetable oils with dopamine-coated magnetic multi-walled carbon nanotubes. Food Chem. 2021, 365, 130409. [Google Scholar] [CrossRef] [Scilit] [PubMed]
- Ma, F.; Tang, F.; Yang, B.; Guo, Q.; Li, P.; Yu, L. Vitamin C-reduced graphene oxide/Fe3O4 composite for simultaneous removal of aflatoxin B1 and benzo(a)pyrene in vegetable oils. LWT 2024, 203, 116342. [Google Scholar] [CrossRef] [Scilit]
- Wan, L.; Zhao, F.; Lv, M.; Gao, S.; Gao, H.; Chen, M.; Song, L.; Liu, W.; Liu, H.; Wang, F. Solvent-free one-step mechanochemical synthesis of magnetic graphene composite adsorbent for efficient removal of multiple aflatoxins in vegetable oils. Food Chem. 2026, 502, 147741. [Google Scholar] [CrossRef] [Scilit] [PubMed]
- Farkas, J.; Booth, A.M. Are fluorescence-based chlorophyll quantification methods suitable for algae toxicity assessment of carbon nanomaterials? Nanotoxicology 2017, 11, 569–577. [Google Scholar] [CrossRef] [Scilit] [PubMed]
- Xu, Y.J.; Jiang, F.; Song, J.; Yang, X.; Shu, N.; Yuan, L.; Tan, C.P.; Liu, Y. Understanding of the Role of Pretreatment Methods on Rapeseed Oil from the Perspective of Phenolic Compounds. J. Agric. Food Chem. 2020, 68, 8847–8854. [Google Scholar] [CrossRef] [Scilit] [PubMed]
- Sherefedin, U.; Belay, A.; Gudishe, K.; Kebede, A.; Kumela, A.G.; Asemare, S. Photophysical Properties of Sinapic Acid and Ferulic Acid and Their Binding Mechanism with Caffeine. J. Fluoresc. 2025, 35, 2379–2393. [Google Scholar] [CrossRef] [Scilit] [PubMed]
- Sikorska, E.; Gliszczyńska-Świgło, A.; Khmelinskii, I.; Sikorski, M. Synchronous Fluorescence Spectroscopy of Edible Vegetable Oils. Quantification of Tocopherols. J. Agric. Food Chem. 2005, 53, 6988–6994. [Google Scholar] [CrossRef] [Scilit] [PubMed]
- Siger, A.; Gawrysiak-Witulska, M.; Bartkowiak-Broda, I. Antioxidant (Tocopherol and Canolol) Content in Rapeseed Oil Obtained from Roasted Yellow-Seeded Brassica napus. J. Am. Oil Chem. Soc. 2017, 94, 37–46. [Google Scholar] [CrossRef] [Scilit] [PubMed]
- Domínguez-Lacueva, P.; Sikorska, E.; Cantalejo-Díez, M.J. Excitation–emission matrix spectroscopy coupled with chemometrics for monitoring ozonation of olive oil and olive pomace oil. Anal. Methods 2025, 17, 1860–1869. [Google Scholar] [CrossRef] [Scilit] [PubMed]
- Koch, E.; Wiebel, M.; Löwen, A.; Willenberg, I.; Schebb, N.H. Characterization of the Oxylipin Pattern and Other Fatty Acid Oxidation Products in Freshly Pressed and Stored Plant Oils. J. Agric. Food Chem. 2022, 70, 12935–12945. [Google Scholar] [CrossRef] [Scilit] [PubMed]
- Huang, Y.; Zheng, C.; Liu, C.; Wan, C.; Deng, Q.; Li, Z.; Zheng, M. Unveiling the Antioxidant Mechanism of Canolol: Packaging Impacts the Long-Term Stability of Microwave-Pretreated Rapeseed Oil. Foods 2026, 15, 1797. [Google Scholar] [CrossRef] [Scilit] [PubMed]
- Chizat, L.; Peyré, G.; Schmitzer, B.; Vialard, F.X. Unbalanced optimal transport: Dynamic and Kantorovich formulations. J. Funct. Anal. 2018, 274, 3090–3123. [Google Scholar] [CrossRef] [Scilit]
- Sun, R.; Li, Q.; Wang, T.; Li, Z.; Liu, H.; Gao, J.; Huang, X.; Wang, Y.; Fan, X.; Gao, J.; et al. Open-world quantification of olive-oil adulteration from fluorescence spectra via optimal-transport alignment. npj Sci. Food 2026, in press. [Google Scholar] [CrossRef] [Scilit]

Disclaimer/Publisher’s Note: The statements, opinions and data contained in all publications are solely those of the individual author(s) and contributor(s) and not of MDPI and/or the editor(s). MDPI and/or the editor(s) disclaim responsibility for any injury to people or property resulting from any ideas, methods, instructions or products referred to in the content. |
© 2026 by the authors. Licensee MDPI, Basel, Switzerland. This article is an open access article distributed under the terms and conditions of the Creative Commons Attribution (CC BY) license.