


Abstract
Globe artichoke (Cynara cardunculus subsp. scolymus) has been widely studied as a source of bioactive compounds, but most reports focus on a single edible part and use only one analytical technique. Here, we describe a three-level analytical workflow comprising 1H-NMR spectroscopy, nano-LC–UV–MS, and analytical-scale LC–UV, applied to ultrasound-assisted hydroalcoholic extracts from stems, large basal leaves, outer bracts, and the globe. NMR quantified the main primary metabolites and selected phenolic acids, revealing part-specific profiles: stems were rich in soluble carbohydrates and caffeoylquinic acids; outer bracts in free amino acids; leaves in inositol isomers; and globes in inulin and other nutritionally relevant metabolites. LC–UV enabled rapid semi-quantitative comparison of phenolic profiles and, together with nano-LC–MS, highlighted the leaves as the fraction with the most complex phenolic fingerprint, dominated by luteolin glycosides and accompanied by low-abundance flavonoid derivatives. Nano-LC–MS, via the nano-ESI interface, provided complementary nominal-mass EIC profiles consistent with selected phenolic-acid and flavonoid-glycoside classes, including species not detected by LC–UV. Overall, the approach provides a comprehensive metabolite profile of different artichoke parts and offers a working template for the sustainable profiling and valorization of both edible and non-edible plant fractions.
1. Introduction
Natural foods are often valuable sources of health-promoting substances with significant biological activity. In recent decades, attention has increasingly focused on the nutritional and functional properties of food components, which are now recognized as key determinants of human health [1].
The chemical diversity of plant-based foods includes low-molecular-weight compounds, which can be broadly classified by origin and function as primary and secondary metabolites. Primary metabolites, including carbohydrates, amino acids, organic acids, and lipids, are essential for plant survival and growth and provide the macronutrients that form the foundation of the human diet. Secondary metabolites are particularly relevant to human health owing to their wide range of bioactive properties [2]. These specialized compounds, which plants produce primarily to interact with their environment and mount stress and defense responses, encompass a diverse range of chemical classes, including polyphenols, terpenoids, and alkaloids, among others [3].
Among secondary metabolites, polyphenolic compounds are among the most widespread and structurally diverse classes in the plant kingdom [4]. They are ubiquitous in fruits, vegetables, seeds, nuts, and cereals and are often incorporated into nutraceutical and functional food formulations. Phenolic compounds occur naturally in multiple forms, including free aglycones, glycosides, esters, and oligomeric structures [5]. This chemical complexity underscores the growing demand for robust, sensitive, selective, and reliable analytical techniques capable of comprehensive qualitative characterization and accurate quantitative determination of all metabolites, particularly phenolic compounds in food, tasks in food science and nutrition research [6].
A notable example of a plant food exceptionally rich in health-promoting phytochemicals is the globe artichoke (Cynara cardunculus subsp. scolymus). This perennial herbaceous plant in the Asteraceae family has been valued for centuries not only as a culinary delicacy but also for its significant medicinal properties [7]. Originating in the Mediterranean basin, it is now cultivated worldwide, primarily for its edible immature flower heads. In Italy, artichokes are classified into four major varietal groups, “Spinoso,” “Violetto,” “Romanesco,” and “Catanese.” Beyond its culinary appeal, various parts of the artichoke plant, such as leaves, bracts, stems, and hearts, are rich sources of bioactive compounds, notably caffeoylquinic acid derivatives (including chlorogenic acid and cynarin), flavonoids (apigenin and luteolin glycosides), and sesquiterpene lactones [8,9]. The concentrations of these compounds vary considerably by the plant organ, cultivar, growing conditions, and post-harvest processing [10].
Owing to its complex and variable phytochemical composition, the artichoke has attracted substantial scientific interest, particularly for its well-documented health benefits, which range from hepatoprotective and hypolipidemic to antioxidant and anti-inflammatory activities [11,12]. A thorough understanding of the chemical composition of different plant parts is therefore essential to fully harness the artichoke’s nutraceutical potential. However, comprehensively analyzing such a chemically rich matrix poses significant analytical and resource-related challenges. As food matrices become more complex and target analytes more diverse, there is growing interest in methods that combine high resolving power with a more efficient use of analytical resources. This evolution is framed by the principles of Green Analytical Chemistry (GAC) [13], a discipline that extends the tenets of Green Chemistry [14] into the laboratory workflow by encouraging miniaturization, lower solvent consumption, and reduced waste generation [15].
Miniaturized chromatographic systems, specifically capillary and nano-liquid chromatography (CLC/nano-LC) and capillary electromigration techniques (CE/CEC), are widely considered promising approaches within Green Analytical Chemistry. By employing columns with internal diameters below 500 µm, these methods can reduce mobile-phase consumption while maintaining high chromatographic efficiency and minimizing peak dilution [16]. Furthermore, their inherently low flow rates enable seamless coupling to mass spectrometry via nanospray ionization, providing the high sensitivity required for trace-level analysis of bioactive compounds in complex food matrices. Despite these sustainable advantages and growing academic interest, CLC and nano-LC remain notably underutilized in food metabolomics, particularly for polyphenol profiling [17].
Only a limited number of studies have used these miniaturized techniques to determine polyphenols in foods. For instance, the CLC-UV method has been used to analyze polyphenols in orange fruit [18], grape seeds [19], tea samples [20], bee pollen [21], and spent coffee grounds [22]. Combining CLC with MS for polyphenol analysis is even less common, with only a few reports for wine [23], extra-virgin olive oil [24], and cranberry products [25]. Applications of nano-LC–MS to artichoke analysis remain limited. Previous studies include proteomic analysis [26] and a recent investigation from our group combining nano-LC–MS and NMR spectroscopy to characterize artichoke leaf extracts obtained using alternative green solvents [27].
Similarly, this matrix has been scarcely explored using electromigration techniques. Existing applications of capillary electrophoresis (CE) in artichoke analysis are limited to the determination of water-soluble vitamins [28], the profiling of selected caffeoylquinic acids and flavonoid derivatives [29], the quantification of cynarin and chlorogenic acid [30], and the quantification of protein [31].
Complementing separation-based techniques, 1H NMR spectroscopy has emerged as a powerful platform for untargeted profiling of primary metabolites in plant foods. It is non-destructive and inherently quantitative, does not require reference standards, and detects sugars, amino acids, organic acids, and fatty acids that are largely overlooked by polyphenol-targeted chromatographic methods [31,32].
A recent study by Cerulli et al. used an integrated LC-MS and 1H NMR approach to characterize hydroalcoholic extracts of the geographically protected cultivar “Carciofo di Paestum PGI” [33]. NMR-based metabolomics has also been used to profile artichoke by-products and to classify the leaf metabolomes of different cultivars [34,35]. Moreover, NMR spectroscopy has been applied to the metabolomic characterization of edible globe artichoke parts, either as entire heads or as separated fractions of external bracts and heart [36,37,38].
Integrating NMR spectroscopy with mass spectrometry-based approaches can provide a complementary and more comprehensive view of the plant metabolome. In particular, it enables the combined investigation of primary metabolites by NMR and secondary metabolites, especially phenolic compounds, which are more effectively profiled by chromatographic techniques coupled with UV and MS detection.
Previous investigations have established the value of NMR for artichoke metabolite profiling and of combined NMR–MS approaches for complementary phytochemical characterization. In particular, a nano-LC–MS/NMR study focused on leaf extracts obtained using alternative green solvents, with particular emphasis on hydrophobic metabolites and sesquiterpene lactones [27].
The present study extends this scope to four anatomical fractions of Romanesco artichoke: stems, leaves, outer bracts, and globes (edible part). 1H-NMR spectroscopy provides quantitative information on extractable primary metabolites and selected phenolic acids, analytical-scale LC–UV provides comparative phenolic fingerprints, and nano-LC–MS supplies complementary tentative nominal-mass annotations by EIC profile.
Overall, the combined use of these platforms allows complementary information to be obtained while maintaining a resource-conscious workflow. In particular, the miniaturized chromatographic approach reduces solvent consumption and extraction times, addressing the still limited application of nano-LC platforms in food metabolomics and supporting their implementation within a Green Analytical Chemistry framework.
2. Results and Discussion
The results are organized according to the analytical platform and metabolite class. NMR-based quantification of primary metabolites and selected phenolic acids in stems, leaves, external bracts, and the edible globe is presented first.
Assignments of polyphenols supported by authentic standards were based on agreement in retention time and UV spectral features using the analytical-scale LC–UV method. Nano-LC–MS provided complementary full-scan information at nominal mass resolution. Features without standard-based support were annotated as putative compound classes or structural candidates; individual positional isomers and isobaric compounds could not be unequivocally distinguished. Both LC-based approaches were used to profile selected secondary metabolites, with particular emphasis on caffeoylquinic acid derivatives and flavonoid glycosides that NMR analysis could not fully resolve or distinguish.
Given the substantial compositional differences among the analyzed artichoke parts and the complementary nature of the analytical platforms, each section first describes the profiles observed for each plant part and then compares the findings with the previously reported literature.
2.1. Metabolomic NMR
The assignment of the 1H NMR spectra of globe artichoke extracts was based entirely on a previous study [34], which used the same experimental conditions for extraction, NMR sample preparation, and spectral acquisition. Although that study analyzed only leaf and stem extracts, we observed the same 1H NMR signals in the outer bract and globe extracts in the present work. This finding indicates that, from a qualitative standpoint, extracts from the four parts are comparable. Nevertheless, marked quantitative differences were observed, as shown in Figure 1, which presents the 1H NMR spectra of all four extracts (the complete identification was previously reported in our publication [34]).
Figure 1.
1H NMR spectra of stem (A), leaves (B), outer bracts (C) and globe (D) extracts in D2O phosphate buffer.
The NMR data reported below were obtained from pooled composite samples prepared by combining the corresponding anatomical fraction from 12 commercially purchased artichokes. The three replicate measurements per fraction were independent technical extractions from the same homogenized composite material. Therefore, the observed differences are presented as comparative compositional features of the analysed market batch and should not be interpreted as inferential evidence of biological variation among independently sampled plants or production lots.
Stems exhibited the highest proportion of soluble metabolites, accounting for approximately 42% of dry weight, followed by the globe (~25.6% of dry weight), whereas leaves contained the lowest amount (Table 1).
Table 1.
Metabolite content (mg/g dry weight) in pooled water-soluble artichoke extracts from four anatomical fractions from one commercial market batch. Mean values ± standard deviations of three technical extraction replicates are reported.
When metabolites were grouped into compound classes (sugars, free amino acids, organic acids, polyols, and others; Table 1), the greater extractable mass in stems was primarily attributable to their higher sugar content. In contrast, the relative abundance of the remaining classes was generally comparable across the plant parts considered, with the exception of a marked reduction in amino acids in leaves. Analysis of total compound-class weights (Table 1) further showed that sugars represented the predominant class in stems (~73% of total soluble metabolites) and in the globe (53%). The free amino acids constituted the second most abundant class in both stems and globe, and were the dominant class in outer bracts, where they accounted for approximately 40% of total soluble metabolites.
Carbohydrates. Glucose was the most abundant sugar in leaves, outer bracts, and the entire globe, followed by fructose or sucrose. Fructose was the predominant sugar in stems alone. The highest proportion of sucrose (23.7%) was found in the outer bracts. By contrast, in a previous study [34], glucose was the predominant sugar in stems, exceeding fructose, whereas in leaves the relative contents of fructose and glucose were comparable to the present results. Inulin (a mixture of linear oligofructans with a single terminal α- glucose unit) was detected exclusively in the globe, outer bracts, and stems. The quantification of inulins extracted in the solution was based on the integration of the characteristic H-1 signal at 5.44 ppm from the anomeric proton of the terminal glucose ring and the fructose H-3 protons at 4.21–4.28 ppm. The fructose- to- glucose ratio, calculated from the corresponding integrals, indicated that the average degree of polymerization of oligofructans was higher in stems and outer bracts (7.75 fructose units in both) than in the globe (5.55 units). Across the parts considered, all carbohydrates except inulin were most abundant in stems, whereas inulin content was highest in the globe. In leaves, the inulin content could not be quantified because it was below the limit of quantification. Considering that the temperature used during the Bligh-Dyer extraction [39] (20–25° C) was far below the optimal range for inulin extraction (60–85° C), an additional extraction was carried out in parallel at 85° C using a conventional method [40]. The amount of inulin extracted from the outer bracts and the globe increased (see Table 1), but there was no significant change in the stems. Specifically, the inulin content increased by approximately ninefold in outer bracts and sixfold in the globe. This increase is likely due to more efficient extraction of long-chain oligofructans, which are highly soluble in hot water. In the extracts, the average degree of polymerization of inulin increased from 7.75 to 22.1 in outer bracts and from 5.55 to 17.44 in the globe following hot-water extraction at 85° C.
Inulin is a dietary fiber that is metabolized by intestinal bacteria into short-chain fatty acids, key metabolites involved in colonic cell nourishment and immune regulation [41]. Considering the conventional hot-water extraction procedure, the inulin content in globes (approximately 11% of dry weight) was fully consistent with values reported in the literature [40]. In contrast, the inulin content of stems (approximately 1.5–1.7% DW) and leaves (only trace amounts, below the limit of quantification) was substantially lower than those previously reported by Francavilla et al. [40] (2.9% and 3.7% DW, respectively). In the case of outer bracts, the content of inulin (about 3% DW) was in agreement with that reported by Pagano et al. [42] (4–8% DW).
Amino acids. All free amino acids identified in the previous study [34] were also detected in the present study; however, not all could be quantified. In particular, Arg (arginine), GABA (γ-aminobutyric acid), Glu (glutamic acid), and Lys (lysine) were not quantified because their 1H NMR signals overlapped strongly with those of other metabolites.
The total absolute amount of free amino acids was comparable in stems, outer bracts, and the globe (Table 1), whereas it was 2- to 3-fold lower in leaves. Asparagine (Asn) was the most abundant amino acid in all parts, reaching its highest content in the outer bracts (52.3 mg/g DW, ~90% of the total amino acid fraction) and a similarly high, though somewhat lower, proportion in the globe. The second most abundant amino acid varied by tissue: proline (Pro) in stems and the globe, phenylalanine (Phe) in leaves, and aspartic acid (Asp) in the outer bracts. Across tissues, alanine (Ala) and leucine (Leu) were most abundant in the globe, whereas glutamine (Gln), proline, valine (Val), tyrosine (Tyr), and threonine (Thr) were most abundant in stems. Overall, the content of all amino acids in stems in the present study was substantially higher than that reported in a previous study [34], with increases of approximately one order of magnitude for Val, Asp, Asn, and His, and up to fourfold for Gln and Leu. By contrast, amino acid content in leaves was comparable in the two studies. In both cases, asparagine remained the most abundant amino acid. The higher amino acid levels observed in stems in the present study are likely attributable to differences in plant material and physiological state, as well as to agronomic and environmental conditions that strongly influence nitrogen metabolism in vegetative tissues. Stems are known to function as dynamic nitrogen reservoirs, which may account for the greater variability observed compared with leaves, where amino acid profiles were more consistent across studies.
Organic acids. The variation in total organic acid content among the different artichoke parts was more moderate compared with sugars and amino acids (Table 1). Nevertheless, the highest concentration—observed in the globe—was approximately 28 mg/g dry weight, whereas the lowest, in the leaves, was about 18 mg/g. Malic acid was the predominant organic acid in all parts, reaching a maximum of ~68% in the outer bracts. However, its absolute quantity was similar in different parts (15–16 mg/g dry weight), except in leaves, where it was approximately half that amount. In all tissues except the globe, the second most abundant organic acid was quinic acid. In the globe, citric acid exceeded quinic acid in abundance. The combined content of the remaining acids (succinic, fumaric, and formic) did not exceed 4% of the total. In comparison with a previous study [34] both studies consistently identified malic acid as the most abundant organic acid in stems and leaves, followed by quinic acid. However, the absolute concentrations of two organic acids in stems were markedly higher in the present study, with approximately sixfold higher levels of citric acid and twofold higher levels of malic acid. As observed for amino acids, stems appear to exhibit greater variability, likely reflecting their stronger sensitivity to physiological, agronomic, and methodological factors.
Polyols. Myo-inositol and its stereoisomers (scyllo- and chiro-inositol) are six-carbon cyclic polyols. Numerous studies have suggested potential insulin-related bioactivities for these compounds, including improvements in insulin sensitivity [43]. In accordance with previous studies, refs. [34,44], chiro-inositol was the predominant isomer in leaves and outer bracts, whereas myo-inositol was more abundant in stems and in the globe. The highest chiro-inositol concentration (7.97 mg/g DW) was observed in leaves, in agreement with values reported for another cultivar (10.19 mg/g DW, ref. [44]) and consistent with those obtained in our previous study [34]. Similarly, scyllo-inositol—the least abundant of the three isomers—showed its highest relative and absolute levels in leaves, in line with observations for the Blanca de Tudela variety [44]. Notably, however, scyllo-inositol concentrations in all tissues were generally two- to three-fold higher in the present study compared with previous reports [34,44].
Caffeoylquinic acids. Within the polyphenol fraction, caffeoylquinic acids (esters of caffeic acid and quinic acids) were present. Several isomers of caffeoylquinic acids can occur in artichoke tissues, distinguished by the position of the esterified hydroxyl group (e.g., 5-caffeoylquinic acid—commonly referred to as chlorogenic acid and 3-caffeoylquinic acid, known as neochlorogenic acid). Using NMR analysis, only chlorogenic acid—the most abundant compound in the polyphenol fraction—and 1,5-di-O-caffeoylquinic acid (1,5-diCQA) were quantified. The assignment of 1,5-diCQA was confirmed by spiking the extract with an authentic commercial standard. According to the NMR data (Table 1), stems contained the highest levels of chlorogenic acid and 1,5-diCQA, whereas outer bracts and leaves exhibited the lowest contents of chlorogenic acid and 1,5-diCQA, respectively.
Chlorogenic acid varies widely among globe artichoke parts and cultivars. In [45], edible heads ranged from 1.4 to 31.2 mg/g DW, outer bracts from 2.2 to 30.6, floral stems from 13.2 to 18.8, and leaves from 4.1 to 14.6, indicating that stems were the most consistently rich tissue, while heads and outer bracts were the most cultivar-dependent. In the single-genotype dataset of [46], chlorogenic acid was 32.3 mg/g DW in edible heads, 10.6 in outer bracts, 45.9 in floral stems, and 28.9 in leaves, again placing stems among the richest tissues. The chlorogenic acid content measured in all four parts in the present study falls within the ranges reported above.
The content of 1,5-diCQA in stems (10.0 mg/g DW) was higher than that reported by Corrias et al. [46] (3.39 mg/g DW) for different cultivars and extraction methods. In contrast, the contents in outer bracts (2.96 mg/g DW) and the globe (3.89 mg/g DW) were within the reported ranges (0.93–3.0 mg/g DW in outer bracts and 3.48–3.89 mg/g DW in edible heads) [42,46,47]. The content of 1,5-diCQA in leaves was too low for quantification; however, the reported value can be as low as 1.06 mg/g DW [46].
Miscellaneous metabolites. Additional quantified metabolites included choline, its derivative phosphocholine, and trigonelline—all nitrogen-containing compounds commonly found in plant tissues. A pronounced variation in the levels of these metabolites, particularly phosphocholine, was observed across the different tissues.
Finally, based on the NMR data (Table 1), the four artichoke parts exhibit clearly differentiated metabolic profiles reflecting their physiological roles. Stems show the highest overall metabolite content, dominated by soluble carbohydrates and substantial pools of free amino acids—especially asparagine—together with high levels of chlorogenic acid, consistent with a primary role in carbon and nitrogen storage and transport. Leaves contain the lowest total metabolite content but are selectively rich in polyols, notably chiro- and scyllo-inositol, and maintain moderate organic acid levels, indicating a metabolism oriented toward regulation, signaling, and stress adaptation rather than storage. Outer bracts display an intermediate profile, characterized by high amino acid concentrations and moderate carbohydrate and organic acid contents, suggesting a mixed storage and protective function. In contrast, the globe (edible head) represents a metabolic sink, combining high levels of carbohydrates, amino acids, and organic acids with significant amounts of bioactive phenolics, thereby integrating nutritional and functional attributes. Overall, the NMR-based profiling highlights clear compositional differences among the pooled stem, leaf, outer-bract, and globe fractions of the analysed commercial market batch in the accumulation of primary metabolites within the artichoke plant.
2.2. Development of the Nano-LC-UV-MS Platform and Extraction Strategy
Building on our previous nano-LC studies of phenolic profiling in complex matrices [21,48], a reversed-phase gradient eluent of ACN and H2O acidified with formic acid was selected as the starting point for method development. This solvent system had already proven optimal for separating closely related phenolic acids and flavonoids, including isomers, and was therefore considered suitable for maximizing resolution in this work. Although acidic conditions can also be achieved with trifluoroacetic or acetic acid, as reported in related applications [49,50], these additives significantly impaired MS performance in our setup, causing ion suppression and unstable signals. By contrast, formic acid provided the best balance between chromatographic efficiency and negative-mode ESI response.
One of the main limitations to the wider use of nano-LC systems as an alternative to traditional chromatography is their inherently low injection volume, typically just a few nanoliters. Although MS sensitivity improves with downscaling, as we discuss later, this small theoretical injection volume often yields a signal too weak for many applications. To overcome this, the system was intentionally operated under column-overloading conditions, carefully managed using the on-column focusing technique for the sample and analytes. As described in our previous studies [51,52], it was possible to inject relatively large sample volumes and concentrate the analytes into a narrow plug at the top of the capillary column [53]. This is achieved by diluting the sample in a suitable solvent with eluent strength weaker than or comparable to the initial mobile phase, thereby enhancing detection without reducing chromatographic efficiency. Various solvents were tested (including MeOH, water, ACN, IPA, EtOH), but MeOH and water offered the best combination of analyte solubility (in both standard solutions and the artichoke extract sample) and on-column focusing performance. A 95/5 H2O/MeOH (v/v) mixture was chosen as the optimal balance, allowing injection volumes of up to 200 nL without adversely affecting the chromatographic profile under overloading conditions.
The most widely used approach for extracting metabolites from plant matrices is solvent extraction, which relies on the solubility of target compounds [34,54]. Optimizing polyphenol extraction from complex matrices, such as artichoke, is crucial for downstream analysis. While various methods exist, the hydroalcoholic solvent system is frequently favored for its effectiveness in solubilizing a broad spectrum of phenolic compounds with varying polarities. Typically, methanol–water [10,55] or ethanol–water [56] mixtures within a 50–80% (v/v) range are employed. In the present study, the hydroalcoholic ratio was adapted from the Bligh and Dyer procedure, exploiting the aqueous–methanolic phase originally designed for lipid partitioning as a highly effective medium for extracting polar and semi-polar metabolites, including phenolics [39,42].
To improve extraction efficiency and minimize time and solvent consumption, ultrasound-assisted extraction using a probe sonicator was employed. The ultrasonic energy enhances rapid solvent penetration and cavitation-driven disruption of the plant matrix, thereby speeding up the release of intracellular polyphenols and decreasing overall extraction time compared to traditional maceration, aligning with previous UAE (ultrasound-assisted extraction) applications on artichoke and similar matrices [57].
For the classes of interest in artichoke (phenolic acids, flavonoids, and flavones), UV detection offers characteristic absorption patterns; however, in our nano-LC setup, the on-column UV detector did not provide sufficient sensitivity for reliable profiling. Even at 195 nm, a non-selective region used to maximize absorbance, the nano-LC UV chromatograms were of limited utility for quantitative or even robust qualitative assessment.
As the scientific literature extensively supports, mass spectrometry in negative-ion mode effectively detects these compound classes. When the nano-LC was coupled to MS, a sensitive recording of analyte signals as [M−H]− in full-scan mode was performed.
Nevertheless, combining negative-mode detection with highly aqueous initial mobile phases (≥80% water content) posed a significant challenge for conventional nanospray ESI. Under these conditions, electrospray formation was unstable, and MS signals for target analytes were weak or absent even at 100 ppm, improving only when the organic-phase content exceeded ~35%.
To decouple chromatographic and ionization requirements, the nano-LC system was finally interfaced to the MS via a liquid-junction ESI source. This configuration allows a make-up (spray) liquid with high organic content to be merged with the low-flow effluent from the nano-column before electrospray formation, thereby stabilizing the spray and improving desolvation while preserving the highly aqueous gradient needed for early-eluting hydrophilic phenolic acids. The spray-liquid composition, make-up-flow rate (controlled by the hydrostatic pressure of the spray-liquid reservoir), and applied ESI voltage were systematically optimized by monitoring MS signal intensity, peak shape, and run-to-run repeatability.
A 0.1% (v/v) ammonia solution in a 10/10/80 (v/v/v) IPA/H2O/MeOH mixture was selected as the optimal spray liquid, providing efficient deprotonation of target analytes in the ESI region without introducing excessive baseline noise or ion suppression, which were observed at higher ammonia concentrations. The best compromise between spray stability and MS response across all monitored analytes was achieved at a spray-liquid flow of approximately 200 nL/min—corresponding to a reservoir height of 50 cm (i.e., an estimated hydrostatic pressure of about 4.0 kPa)—and an applied ESI voltage of −1.8 kV at the emitter tip.
2.3. Nano-LC-UV-MS and LC-UV Profiling of Artichoke Extracts
A preliminary study was conducted to optimize chromatographic separation using a model mixture of phenolic acids and flavonoids, with the aim of maximizing the resolution of isomeric compounds. Nano-LC-UV-MS was employed to determine retention behavior and MS characteristics under microscale conditions. In parallel, LC-UV analyses at multiple wavelengths (280, 325, and 349 nm) were performed on the same extract to enable comparison with the standard mixture at the analytical scale. Although the optimization included mainly non-glycosylated compounds and only a limited number of glycosylated standards, the resulting retention factors and UV spectral profiles proved essential for the subsequent non-targeted identification of unknown metabolites in artichoke extracts. This approach combined retention behaviour, UV spectral features, molecular-weight information, and previously reported LC-MS data to support compound assignment. The analytical-scale LC-UV method was used as a comparative, semi-quantitative profiling tool and was not intended for absolute quantification of individual phenolics in the plant extracts.
A comparative analysis of hydroalcoholic extracts from different parts of the artichoke highlighted the chemical complexity of this botanical matrix. Nano-LC-UV/MS chromatographic profiles revealed distinct fingerprints for each plant part, with the large basal leaves exhibiting a substantially richer composition of metabolites (secondary and low molecular weight) than the edible portion and the stem (Figure S1).
At a non-selective absorption wavelength such as 195 nm, chromatographic profiles obtained by gradient elution from 5% to 50% (v/v) acetonitrile indicated that the extracts consisted of a complex mixture of highly and moderately polar compounds. Around the initial retention time (T0), the eluent likely contained primary metabolites such as carbohydrates, amino acids, and small organic acids. Quinic acid could likely be observed at [M-H]− m/z 191 by EIC in nano-LC-MS experiments.
At a non-selective wavelength such as 195 nm, nano-LC chromatograms highlight the overall abundance of hydrophilic and moderately polar components but do not allow reliable assignment of polyphenol classes. Analytical-scale LC-UV traces recorded at class-selective wavelengths were developed to discriminate among caffeoylquinic acids, flavones (apigenin and luteolin derivatives), and flavanones (naringenin derivatives) in both standard mixtures and extract samples (see Figure 2).
Figure 2.
LC–UV chromatographic profiles recorded at different absorption wavelengths for (A) standard mixture and (B) hydroalcoholic extracts obtained from different parts of the artichoke. Peak identification: *, caffeoylquinic acid derivative; 1, chlorogenic acid; 2, caffeic acid; 3, narirutin; 4, lut-7-glc; 5, lut-7-glr; 6, 1, 5-diCQA, **, 1, 3-diCQA; 7, rosmarinic acid; 8, api-7-glu; 9, api-7-glr; 10, luteolin; 11, naringenin; 12, apigenin. Experimental conditions are described in Section 3.
The LC-UV chromatograms (Figure 2B) revealed a highly characteristic fingerprint for each extract, dominated by intense peaks attributable to standard reference compounds. At 325 nm, corresponding to the absorption maximum of caffeoylquinic acid (CQA) isomers, chlorogenic acid (5-CQA, peak #1) was identified as the predominant compound. At the same wavelength, the chromatographic profile also revealed minor peaks attributable to other CQA isomers, such as 1, 5-diCQA (peak #6), and likely dicaffeoyl derivatives, such as 1, 3-diCQA (peak #**). Notably, the peak eluting at approximately 6 min (peak #*) was consistently present across all artichoke plant parts (see Table 2), suggesting it was attributable to a structurally related but less abundant caffeoylquinic acid derivative. The occurrence of these compounds across all fractions was also observed with nano-LC-MS analysis.
Table 2.
Tentative/confirmed identification by nano-LC-MS and LC-UV and semi-quantitative comparative LC-UV profiles of phenolic compounds in extracts from different Romanesco globe artichoke parts.
The full-scan extracted ion chromatogram (EIC) at nominal m/z 353 showed chromatographic features consistent with mono-caffeoylquinic acid (CQA) candidates (Figure 3). The broad features and shoulders at nominal m/z 353 were compatible with unresolved putative mono-caffeoylquinic acid candidates but did not establish the occurrence of specific positional isomers, including 3-O-caffeoylquinic acid (3-CQA, neochlorogenic acid), 5-O-caffeoylquinic acid (5-CQA, chlorogenic acid), and 4-O-caffeoylquinic acid (4-CQA, cryptochlorogenic acid) [58,59]. Although isomer identification was not allowed, the assignment of the 5-O-caffeoylquinic acid signal was supported by comparison with an authentic standard using the analytical-scale LC–UV method. Its high abundance was also consistent with the literature, which identifies 5-CQA as the predominant isomer across all matrices. [40,58,60]. In addition, an ion at nominal m/z 191 was also observed in the full-scan data, likely suggesting in-source fragmentation of CQAs attributable to the [quinic acid−H]− ion [61].
Figure 3.
EIC profile of polyphenols selected by Nano-LC-MS for hydroalcoholic extracts from different artichoke parts. (*), unknown peak. Experimental conditions are detailed in the text.
Although the literature reports several hydroxybenzoic acids in artichoke extracts, including syringic acid [61] and gallic acid [62], their contribution to the overall polyphenolic profile appeared minor in the samples investigated here. This is consistent with the LC-UV chromatograms recorded at 280 nm (Figure 2B), which showed only sparse, low-intensity signals in the early elution window (0–9 min), a region typically associated with the retention of polar hydroxybenzoic acid derivatives under reversed-phase conditions. In agreement with these observations, nano-LC-MS analysis revealed only negligible amounts of vanillic acid ([M−H]− at m/z 167), detected exclusively in leaf extracts and eluting immediately after chlorogenic acid. Regarding hydroxycinnamic acids, only negligible amounts of caffeic acid were detected in both leaves and bracts (Figure 3), whereas p-coumaric acid, despite being reported in the literature [61], was not detected under the applied experimental conditions, possibly reflecting differences in cultivar, plant growth stage, or extraction protocol.
Among the caffeoylquinic acid fraction detected at 325 nm (Figure 2), two dicaffeoylquinic acid (diCQA) isomers, cynarin (1,3-di-O-caffeoylquinic acid, peak **) and 1,5-di-O-caffeoylquinic acid (1,5-diCQA, peak 6, standard), emerged as the dominant compounds in the 20–25 min window of the chromatogram, consistent with the pattern reported for the Romanesco family and Italian artichoke genotypes in general [8,47].
Regarding their distribution across the four plant parts (Table 2), we reported semi-quantitative LC-UV data. Because the LC-UV comparison was based on responses from a limited set of authentic standards at a single reference concentration, the data in Table 2 are expressed as relative signal-intensity classes rather than concentrations. The classification provides a rapid comparative indication of the occurrence and relative response of a given compound across the investigated extracts. It is not a fully validated quantitative assay and does not support direct comparison of absolute amounts of different compounds, owing to their distinct UV spectral properties and response factors.
Table 2 confirmed that chlorogenic acid (peak #1) and 1,5-diCQA (peak #6) are the dominant markers. Regarding cynarin, it was a consistently detectable but a consistently detectable constituent with a lower relative LC-UV response, whose relative weight increases slightly in stems, a finding aligned with the distribution hierarchy reported by Pandino et al. [8] for Italian landraces. The results in Table 2 corroborate the well-documented higher relative LC–UV response of caffeoylquinic acid derivatives in floral stems and in globe artichoke [8,10]. Cynarin (1,3-diCQA) followed a similar but lower relative LC-UV response (+++ to ++), consistent with published data indicating that relative signal intensities were generally lower than 1,5-diCQA across all plant parts of Romanesco cultivars [48,63].
The full-scan EIC at nominal m/z 515, as reported in Figure 3, showed features compatible with putative dicaffeoylquinic acid (diCQA) candidates in all four artichoke fractions. The assignment of 1,5-di-O-caffeoylquinic acid is supported independently by LC-UV retention/UV match to an authentic standard, while the assignment of the peak labelled “cynarin” remained tentative in the absence of an authentic 1,3-diCQA standard or other isomer-specific evidence. In addition, in leaves, the LC–UV data confirmed that 1,5-diCQA was the major constituent and supported the probable presence of 1,3-diCQA (** peak).
In the 22–28 min window, the EIC at nominal m/z 515 showed a broad, partially resolved envelope compatible with dicaffeoylquinic acid candidates. The available data do not distinguish contributions from co-eluting isomeric or isobaric compounds (cynarin and 1,5-diCQA and 3,4-, 3,5-, 4,5-diCQA), limited chromatographic resolution, and signal-quality effects. Individual constituents and their relative concentrations were therefore not inferred from this envelope [64].
As reported in the literature, the EIC peak at approximately 20 min, showing a pseudomolecular ion at m/z 337, can be tentatively assigned to coumaroylquinic acid isomers, whereas the peak at m/z 367 was consistent with feruloylquinic acid isomers. These assignments were aligned with previous artichoke metabolite profiling studies, which reported both coumaroylquinic and feruloylquinic derivatives among the phenolic constituents of the plant [11,58,61,65,66].
Among the flavonoids detected in the hydroalcoholic extracts, luteolin derivatives constitute one of the most abundant and significant subclasses, consistent with previous reports on artichoke phytochemistry [58,61].
In the LC–UV chromatograms recorded at 349 nm (see Figure 2), the two main luteolin glycosides eluting between 19 and 20 min were unambiguously assigned to luteolin-7-O-glucoside (Lut-7-glc, cynaroside, peak #4) and luteolin-7-O-glucuronide (Lut-7-glr, peak #5), both of which are known to exhibit a maximum absorbance around this wavelength. The chromatographic profiles and semi-quantitative analysis (see Table 2) clearly showed that both luteolin-7-O-glucoside and luteolin-7-O-glucuronide show high relative LC-UV responses in the leaf extract, whereas only moderate LC-UV responses are present in the outer bracts, and only low-intensity LC-UV signals were observed in the globe and stem extracts.
These findings are fully consistent with the nano-LC–MS data, as illustrated by the EICs in Figure 4 for flavones across the different artichoke tissues. Mass spectrometric analysis of the chromatographic profiles specifically highlighted glycosylated luteolin derivatives: full-scan EIC features at nominal m/z 447 and 593 were compatible with luteolin-7-O-glucoside (cynaroside, Lut-7-glc), as confirmed by comparison with an authentic standard in the LC–UV method, and with other isomeric/isobaric flavonoid glycosides, likely including luteolin-7-O-rutinoside (Lut-7-rut), respectively. Free luteolin was scarce in the outer bracts and was not reliably detected by LC–UV in the other plant parts under the applied conditions. In agreement with the LC–UV results, Lut-7-glc was present at low levels in the globe, whereas its glucuronic acid analogue, luteolin-7-O-glucuronide (Lut-7-glr), was abundant in the globe but not detected in the stems. Additionally, a further signal at m/z 447, detected at significant levels in leaves and outer bracts, could be tentatively attributed to luteolin-7-O-galactoside (Lut-7-gal), other luteolin hexosides, or quercetin rhamnosides, as suggested by the literature.
Figure 4.
Nano-LC-MS EIC profiles illustrating the distribution of luteolin and apigenin derivatives in hydroalcoholic extracts obtained from different parts of the artichoke. Experimental conditions are described in Section 3.
Among the detected flavonoids, apigenin derivatives showed similar absorbance at 325 and 349 nm in the LC–UV chromatograms, with markedly lower absorbance at 280 nm. The target compounds, apigenin-7-O-glucoside (Api-7-glc, peak #8) and apigenin-7-O-glucuronide (Api-7-glr, peak #9), were clearly observed in the chromatographic profiles shown in Figure 2. Based on spiking experiments, peak #9 (Api-7-glr) was widely distributed across artichoke tissues, except in the stem, whereas Api-7-glc, eluting slightly earlier (t = 22–23 min), was detected only at low levels.
In contrast to the apigenin aglycone, for which no attributable LC-UV peak was observed in the investigated fractions under the applied conditions consistent with previous reports for artichoke extracts [10,59,64], its glycosylated derivatives were detected and constituted characteristic markers of the investigated plant fractions.
As shown in Figure 2 and summarized in Table 2, apigenin-7-O-glucuronide (peak #9) was the predominant apigenin glycoside, yielding moderate to appreciable signals in the outer bracts and globe, whereas it was not detected in leaves or stems. Apigenin-7-O-glucoside (apigetrin, peak 8) exhibited a more restricted distribution, with an attributable LC-UV signal observed only in the outer bracts under the applied conditions.
A signal tentatively assigned to apigenin-7-O-rutinoside (isorhoifolin) was observed by nano-LC–MS; however, this compound could not be assessed by comparative LC-UV profiling because an authentic reference standard was unavailable. Accordingly, its identity cannot be unequivocally confirmed based on the LC–UV data, and the absence of a quantifiable LC–UV peak should not be interpreted as evidence of its absence. Rather, its MS signal suggests that isorhoifolin may be present only at negligible amounts that were not reliably detectable by the LC-UV profiling method under the applied conditions.
Overall, these results support a specific distribution of apigenin glycosides in the Romanesco artichoke plant, with the outer bracts and globe as the principal repositories of these compounds. This pattern is consistent with the literature, which reports higher flavonoid concentrations in outer floral tissues than in stems and inner parts [8,10,58,61]. The exclusive occurrence of apigenin in glycosylated forms, rather than as the free aglycone, reinforces the established view that glycosylation is the predominant conjugation state of flavonoids in artichoke and in plants, with direct implications for their aqueous solubility, gastrointestinal stability, and nutraceutical bioavailability [8,10,65,66].
In the case of quercetin, the aglycone was found to be below the limit of detection, whereas several glycosylated derivatives could be detected by nano-LC-MS, albeit at relatively low abundance. The EICs recorded for the pseudomolecular ion [M–H]− at m/z 463 likely suggested the occurrence of quercetin-3-O-galactoside (Que-3-O-gal) and quercetin-3-O-glucoside (Que-3-O-glc) and for [M–H]− at m/z 433, quercetin-3-O-arabinoside (Que-3-O-ara), mainly in the leaf extract. The presence of these quercetin glycosides, even at low relative levels, indicates that they contribute to the overall flavonol profile of artichoke, in agreement with previous reports describing quercitrin in the edible portions of the plant [61,62] and rutin (quercetin-3-O-rutinoside) as a consistently detectable component [55] but not in our study. Given their low response, however, no further quantitative conclusions can be reliably drawn from the present data, and the quercetin series is therefore discussed here mainly in qualitative terms.
Finally, to complete the overview of the metabolites considered in this study, it should be noted that some bioactive compounds reported at low concentrations in artichoke, such as kaempferol and narirutin (together with their glycosylated forms), were not confidently detected under the present experimental conditions. This may be due either to their occurrence below the instrumental detection limits or to possible overlaps of their pseudomolecular ions with those of apigenin- and luteolin-based glycosides described above [10,59,61,62,67,68,69]. In addition, naringenin derivatives, which typically show maximum absorbance around 280 nm, were not detected in our LC–UV (see Figure 2) traces at this wavelength, further supporting their negligible contribution to the overall phenolic profile under the conditions applied in this work.
3. Materials and Methods
3.1. Chemicals and Materials
All chemicals used in this study were of analytical reagent grade and used as received. 2-propanol (IPA), ammonia solution (30% w/w), and formic acid (FA) (99% w/w) were purchased from Carlo Erba (Rodano, Milan, Italy), while acetonitrile of HPLC grade (ACN), methanol (MeOH), and HPLC ultrapure water (filtered through 0.2 μm and packaged under nitrogen) were purchased from VWR (International PBI S.r.l., Milan, Italy). K2HPO4 and KH2PO4 were obtained from Carlo Erba Reagenti (Milan, Italy). Deuterium oxide (D2O, 99.9 atom% D) and 3-(trimethylsilyl)propionic-2,2,3,3-d4 acid sodium salt (TSP) were supplied by Eurisotop (Saint-Aubin, France).
Analytical-grade standards of toluene (CAS No.: 108-88-3), ethylbenzene (CAS No: 100 41-4) propylbenzene (Cas No: 103-65-1), butylbenzene (Cas No: 104-51-8) and standard reference compounds such as apigenin (CAS 520-36-5), caffeic acid (CAS 331-39-5), chlorogenic acid (CAS 327-97-9), cinnamic acid (CAS 140-10-3), ferulic acid (CAS 537-98-4), gallic acid (CAS 149-91-7), kaempferol (CAS 520-18-3), luteolin (CAS 491-70-3), myricetin (CAS 529-44-2), naringenin (CAS 67604-48-2), protocathecuic acid (CAS 99-50-3), quercetin (CAS 849061-97-8), quercitrin (CAS 522-12-3), rosmarinic acid (CAS 20283-92-5), rutin (CAS 153-18-4), syringic acid (CAS No.: 530-57-4) vanillic acid (CAS 121-34-6) were from Sigma Aldrich (Merk Life Science S.r.l., Milano, Italy). In addition, apigenin-7-O-glucoside (CAS 578-74-5), apigenin-7-O-glucuronide (CAS 29741-09-1), 1,5-O-dicaffeoylquinic acid (CAS 19870-46-3), luteolin-7-O-glucuronide (CAS 29741-10-4) were supplied by Medchem Express (DBA—Milan, Italy) and luteolin-7-O-glucoside (CAS 5373-11-5) was purchased from PhytoLab (Merck Life Science—Milan, Italy).
A 400 mM phosphate buffer at pH 7.0 was prepared in water using K2HPO4 and KH2PO4 and used to obtain a buffered D2O solution containing 2.0 mM TSP for 1H NMR analysis of the hydroalcoholic extracts.
For nano-LC and LC analyses, the mobile phase was an organic–aqueous mixture, programmed in gradient mode from two solutions of HPLC-grade water and acetonitrile (ACN), both containing 0.1% (v/v) formic acid (FA). Both solutions were prepared in a 100 mL volumetric flask and, after five minutes in an ultrasonic bath, they were ready for use in each nano-LC/LC solvent channel. All standard solutions and plant matrices were stored at −18 °C, while the sample extracts from artichoke plant material were stored in the dark at +4 °C until analysis.
Polyimide-coated fused silica capillaries from Polymicro Technologies (Silsden, UK), with an outer diameter (OD) of 375 µm and either an internal diameter (ID) of 100 µm or 50 µm, were used to prepare capillary columns for a nano-LC system.
The stationary phase used for packing the chromatographic capillary column was a bulk of Chromspher C18 (3.0 µm, 120 Å) from Varian (Varian—Agilent Technologies, Inc., Santa Clara, CA, USA).
Capillary columns were packed to a length of 25.0 cm, with an effective and total length of 26.5 and 35.0 cm, respectively.
3.2. Instrumentation
A 3510E ultrasonic bath from Bransonic (Dambury, CT, USA) was utilized for degassing mobile phases, dissolving analytes, and homogenizing the slurry of stationary phase and packing bed into a capillary column during the packing process.
A Stereozoom 4 optical microscope (Bausch & Lomb, Rochester, NY, USA) was used to observe the column during the packing procedure and check its status.
An HPLC pump (PerkinElmer Series 10, Palo Alto, CA, USA) was used to pack the column and, when appropriate, to equilibrate it with the mobile phase.
A Free Zone 1 system (Labconco, KS, USA) was used to freeze-dry artichoke plant samples.
3.2.1. Capillary Column Packing Procedure
The capillary columns were packed in our laboratory following a slurry packing method previously published [70].
The protocol was modified to achieve both structural and practical improvements in the packing step. A 3 µm stationary phase (Chromspher C18) was used for the main packing bed while the inlet frit was formed from a 10 µm C18-based stationary phase, LiChrosorb RP18 (Merck Life Science S.r.l., Milan, Italy). A temporary frit, designed to retain the stationary phase, was easily prepared by tapering the capillary outlet to a diameter of approximately 15–20 µm using a butane gas torch, as described by Cheong et al. [71]. The formation solvent for both frits was a 5 mM NaCl solution in distilled water.
The packed bed length was 25 cm. The detection window was created 2.5 cm from the empty side of the outlet frit by removing the polyimide coating with a razor blade. Finally, each capillary column was evaluated for robustness under high backpressure and for chromatographic performance using a standard alkylbenzene mixture prior to application. At the end of each working day, the column was flushed with ACN.
3.2.2. Nano-LC System
A nano/capillary LC pump (Ultimate™ Capillary HPLC unit, LC Packings Dionex, Amsterdam, The Netherlands), equipped with a manual sample injector and an internal flow-splitting device, was used for the nano-LC experiments. The injector consisted of a low-dispersion six-port valve (VICI VALCO Instruments, Houston, TX, USA) fitted with an external 5 µL sample loop. Real samples and reference standards were appropriately diluted in a 95:5 (v/v) H2O/MeOH mixture to optimize on-column focusing and peak shape. The effective injection volume was approximately 200 nL, estimated from the working flow rate and the valve-switching time.
Separated compounds were monitored using a lab-made on-column UV detection cell set at 195 nm, with a data acquisition rate of 10 Hz. To minimize extra-column dead volume and chromatographic band broadening, the capillary columns were connected directly to the injector valve. The chromatographic system was operated at ambient temperature, which was maintained between 18 and 22 °C by continuous room conditioning. The pump and UV–Vis detector were controlled using the Chromeleon™ Chromatography Management System software (version 6.6, LC Packings, Amsterdam, The Netherlands).
Optimal nano-LC separation of secondary plant metabolites was obtained using a linear gradient. The flow rate was set to 210 nL/min, and the elution program was as follows: starting conditions were 95:5 (v/v) of solvent A (water containing 0.1% FA, v/v) and solvent B (acetonitrile containing 0.1% FA, v/v); the composition was changed to 40:60 (v/v) A/B at 35 min and then to 100% solvent B at 50 min. The initial conditions were re-established and maintained for at least 15 min before the next injection to ensure proper column re-equilibration. At the end of each working day, the column was flushed with 100% (v/v) solvent B.
3.2.3. Mass Spectrometry Conditions and Electrospray Interface
The nano-LC system was coupled to an LXQ ion-trap mass spectrometer (Thermo Finnigan, San Jose, CA, USA) by means of a laboratory-made liquid-junction ESI interface, as previously reported [72]. The interface body was machined from a block of polysulfone (PSU 1000, Politecnica-Cetai, Bassano del Grappa, Vicenza, Italy) and designed as a multi-port device to connect the spray-liquid reservoir, the high-voltage ESI contact, the nano-LC capillary column, and the ESI emitter. The liquid junction was formed by positioning the column outlet and the emitter tip at a distance of approximately 100 µm, with automatic alignment ensured by a PEEK® tube inside the interface.
The spray liquid was delivered to the junction by hydrostatic pressure from a small electrolyte reservoir containing 0.1% (v/v) ammonia in a 10:10:80 (v/v/v) 2-propanol/H2O/MeOH mixture. The reservoir was connected to the liquid-junction interface via a plastic tube and positioned 50 cm above the junction level, generating a hydrostatic head of about 40 mbar. The emitter consisted of a 10 cm fused-silica capillary (50 µm I.D., 375 µm O.D.), sharpened with fine sandpaper, and its position with respect to the MS inlet was adjusted using an XYZ translation stage and monitored with an analogue video camera.
Negative-ion ESI conditions were optimized by direct infusion of a 10 µg mL−1 syringic acid solution, monitoring the deprotonated ion [M−H]− at nominal m/z 197. The following settings were used: spray voltage, −1.8 kV; capillary voltage, −12.0 V; capillary temperature, 195 °C; tube-lens voltage, −5.0 V; automatic gain control target, 1.0 × 10⁵; number of microscans, 3; and maximum injection time, 100 ms. Mass spectra were acquired in full-scan mode over the m/z 140–800 range. Retention time and peak height were determined from the extracted ion chromatograms (EICs) for each studied compound. Total ion chromatogram (TIC), extracted ion chromatograms (EICs) base peak, and mass spectra were acquired and reprocessed using XcaliburTM 2.0 software (Thermo-Finnigan, San Jose, CA, USA).
No internal standard was added to samples for nano-LC–MS analysis. Reference standards were analyzed separately. EIC intensities were not normalized to an internal standard and were not used for quantitative comparisons among anatomical fractions.
3.2.4. LC-UV System
High-performance liquid chromatography (HPLC) analyses of the extracts were carried out on an Accela 1250 UHPLC system equipped with a diode-array detector (DAD) (Thermo Fisher Scientific, Waltham, MA, USA). Separation was achieved using a Synergy Fusion-RP column (150 × 4.6 mm, 4.0 μm particle size; Phenomenex Inc., Torrance, CA, USA) fitted with a guard column. The samples consisted of hydroalcoholic extracts of artichoke or reference standards, diluted in a 50:50 (v/v) MeOH/H2O mixture. The mobile phase consisted of solvent A (H2O containing 0.1% FA, v/v) and solvent B (ACN containing 0.1% FA, v/v). Elution was performed using a linear gradient of solvent B: 0.0 min, 8.0%; 8.0 min, 14.0%; 20.0 min, 25.0%; 30.0 min, 50.0%; 35.0 min, 90.0%; 40.0 min, 90.0%; 42.0 min, 8.0%; 45.0 min, 8.0%. The flow rate was set to 1.0 mL/min, and the column temperature was maintained at 30 °C. Detection was carried out using a UV–Vis DAD with three acquisition channels at 280, 325, and 349 nm, while full spectra over the range 200–750 nm were recorded throughout the run. The injection volume was 5 μL.
To minimize carry-over, the injector loop was washed between injections with a 50:50 (v/v) H2O/MeOH mixture. At the end of each working day, the column was flushed with 100% acetonitrile to remove strongly retained components and then stored according to the manufacturer’s recommendations.
LC-UV analysis was used for comparative semi-quantitative profiling and peak assignment, rather than for absolute quantification. Extract responses (n = 3 and m = 3, number of extractions and injections, respectively) were compared with those of an external reference mixture containing the available authentic standards at 1.0 µg mL−1, analyzed under identical chromatographic conditions. In addition, the response categories do not represent concentration ranges. Comparisons are restricted to the response of the same assigned chromatographic feature. Relative signal-intensity classes were assigned as described in the footnote to Table 2.
No compound-specific multipoint calibration curves or formal validation parameters, including accuracy, recovery, LOD, and LOQ, were established for the LC-UV profiling procedure; accordingly, LC-UV data are not reported as concentrations.
3.2.5. NMR Analysis
Proton nuclear magnetic resonance (1H NMR) analyses of the hydroalcoholic artichoke extracts were performed on a Bruker AVANCE III HD 600 spectrometer (Bruker, Rheinstetten, Germany) operating at 600.13 MHz for 1H and equipped with a multinuclear z-gradient inverse probehead. The dried hydroalcoholic fraction was re-dissolved in 0.75 mL of buffered D2O (400 mM phosphate buffer, pH 7.0) containing 2 mM 3-(trimethylsilyl)propionic-2,2,3,3-d4 acid sodium salt (TSP) as an internal standard for chemical-shift referencing and quantification. 1H NMR spectra of the hydroalcoholic extracts were acquired at 28 °C by co-adding 256 transients with a recycle delay of 7 s, a 45° pulse of 6–7 µs, 32k data points, and a spectral width of 10.4 ppm. Residual HDO was suppressed using a presaturation pulse sequence (Bruker pulse program zgpr) during the relaxation delay. Free induction decays were zero-filled to 64k points and multiplied by an exponential line-broadening factor of 0.3 Hz prior to Fourier transformation. Spectra were manually phased and baseline-corrected, and chemical shifts were referenced to the TSP signal at 0.00 ppm.
For metabolite quantification, selected non-overlapping 1H signals were integrated (Table S1), and their integrals were normalized to the integral of the TSP resonance at 0.00 ppm, assuming a known concentration of the internal standard. Metabolite contents were calculated from the normalized signal integrals after correction for the number of equivalent protons contributing to each resonance. Signals exhibiting a signal-to-noise ratio (S/N) lower than 10 were considered below the limit of quantification (LOQ). Metabolite levels were expressed as milligrams per gram of dry weight (mg/g dw), taking into account the sample mass used for extraction and the dilution factors applied during NMR sample preparation. The average degree of polymerization for inulin was estimated from the ratio between fructose (H-3 at 4.21–4.28 ppm) and terminal glucose (H-1 at 5.44 ppm) signals (F/G). Since the calculated DP corresponds to the average number of fructose residues per chain, the average molecular weight of inulin was obtained as:
where 180.16 g mol−1 is the molecular weight of the terminal glucose unit and 162.14 g mol−1 is the molecular weight contribution of each fructose residue after glycosidic-bond formation.
MW = 180.16 + DP × 162.14
Because the three NMR measurements for each anatomical fraction were technical extraction replicates prepared from a single pooled composite sample, no inferential statistical analysis was performed. Results are reported as mean ± standard deviation (n = 3 technical extraction replicates) to describe within-batch extraction and analytical repeatability. No p-values or post-hoc group comparisons are reported, and the data should not be interpreted as estimates of biological variability among independent plants or production lots. The reported standard deviations describe the variability among technical extraction replicates and should not be interpreted as a complete assessment of quantitative accuracy or extraction recovery.
3.3. Sample Preparation
Fresh immature flower heads (globes) of globe artichoke (Cynara cardunculus subsp. scolymus) were purchased from a retail vendor at a local market in southern Rome, Italy. A total of 12 commercially immature specimens were purchased at the same time and treated as a single commercial market batch. The plant material was identified as “Carciofo Romanesco del Lazio,” bearing the European Union Protected Geographical Indication (PGI) quality mark. Botanical identification was performed based on morphological traits characteristic of the Romanesco ecotype, including a spherical and compact flower head (approximately 10 cm in height and 4.5 cm in diameter at the sampled developmental stage), violet coloration, absence of spines, sparse inner bristles, a robust ribbed stem, and large grey-green tomentose leaves. The retail vendor did not provide information on the farm of origin, production field, or number of upstream agricultural lots.
Immediately after purchase, artichokes were stored at 4 °C and manually separated into their main anatomical components within a few hours. From each of the 12 artichokes, the stem and major basal stem leaves (hereafter referred to as leaves) were isolated, and the outer bracts and the remaining inner portion of the immature flower head (hereafter referred to as globe) were separated. Stems and stem leaves were isolated, and then the globes were deprived of their external bracts. For each anatomical fraction, the corresponding material from all 12 specimens was pooled to obtain one composite sample per plant part. The four composite samples were freeze-dried for 48–72 h to constant weight, finely ground using a blade blender (Termozeta, Milan, Italy), homogenized, protected from light, and stored at −20 °C until extraction and analysis.
The study was designed as a comparative analytical profiling of four pooled anatomical fractions from one representative commercial market batch. Accordingly, the results describe the within-batch compositional differences observed under the present experimental conditions and are not intended to estimate biological variability among independently cultivated plants, agricultural lots, or production sites.
3.3.1. Sample Preparation for LC-UV and Nano-LC/MS
For each anatomical fraction, three independent extracts were prepared, and each extract was analyzed by LC–UV in triplicate following the procedure described in detail below.
50 mg of each lyophilized plant part were accurately weighed into 15 mL polypropylene (PP) screw-cap centrifuge tubes (Greiner Bio-One S.r.l., Cassina de’ Pecchi, Italy). The powder was vortex-mixed (Heidolph Relax 2000, Heidolph Scientific Products, Schwabach, Germany) for 5 min with 1.8 mL of Milli-Q water and 2.0 mL of MeOH. The resulting suspension was then subjected to ultrasound-assisted liquid extraction (USA-SLE). Ultrasound was applied using a probe directly immersed in the tube (Q125 sonicator, Qsonica L.L.C., Newtown, CT, USA) at 20 kHz and 50% amplitude (maximum power 125 W) for 15 min, with a 5-s on/5-s off pulse cycle. To maintain a constant extraction temperature, the tubes were kept in a thermostated bath at 20 °C.
After sonication, the mixtures were centrifuged at 4000 rpm for 5 min at 20 °C (Universal 320R, Hettich Benelux B.V., Geldermalsen, The Netherlands). The aqueous supernatant was carefully collected with a glass Pasteur pipette and transferred to an 8-mL screw-cap glass vial. The extract was dried under a gentle stream of dry nitrogen at 37 °C using a DC150-2 nitrogen sample concentrator (Yooning, Hangzhou, China).
The dry residue was dissolved in 500 µL of a 95:5 (v/v) H2O/MeOH solution. After complete dissolution, the sample was transferred to a 2 mL polypropylene microcentrifuge tube (Eppendorf S.r.l., Milan, Italy) and centrifuged at 13,400 rpm for 5 min (MiniSpin, Eppendorf S.r.l.). The clear supernatant was used for chromatographic and spectroscopic analyses. For nano-LC–MS, an aliquot of the supernatant was injected directly, while for HPLC-UV analyses, the extract was further diluted with a 50:50 (v/v) MeOH/H2O mixture to optimize on-column focusing and detector response. The final extracts were stored at 4 °C in the dark and analyzed promptly to minimize degradation.
3.3.2. Sample Preparation for NMR Analysis
The extraction procedure, based on the Bligh–Dyer extraction method [39], was previously reported [34]. Briefly, 25 mg of ground freeze-dried sample was extracted with 0.75 mL of methanol/chloroform (2:1, v/v), followed by the addition of 0.20 mL of distilled water, with thorough mixing after each step. The resulting emulsion was sonicated for 10 min at room temperature. Phase separation was induced by adding 0.25 mL of chloroform and 0.25 mL of distilled water; then, the mixture was centrifuged at 4200 rpm for 15 min at 25 °C, and the upper hydroalcoholic phase was carefully collected. The extraction was repeated twice on the residual pellet to ensure the highest metabolite recovery, and the hydroalcoholic extracts were pooled. The combined hydroalcoholic fraction was dried under a gentle nitrogen stream at room temperature and stored at −20 °C until analysis.
For each pooled anatomical fraction, three independent extraction replicates were prepared from separate 25 mg aliquots of the same homogenized freeze-dried composite powder and analysed by NMR spectroscopy (n = 3 technical extraction replicates per fraction). These replicates were used to evaluate extraction and analytical repeatability within the pooled market batch; they do not represent independent biological replicates.
For efficient inulin extraction, a conventional hot-water method was employed [39]. Samples from the four tissues (50 mg dry weight) were extracted with 5 mL of water at 85 °C under continuous magnetic stirring for 1 h. The mixture was then cooled to room temperature and centrifuged, and the supernatant was collected and dried under a gentle nitrogen stream at room temperature. Inulin content was determined by NMR spectroscopy under the same experimental conditions used for the hydroalcoholic extracts.
No protein-hydrolysis step was performed. Accordingly, the amino acid results refer to extractable free amino acids rather than total amino acid composition or protein content.
4. Conclusions
In this study, an integrated multi-platform strategy combining 1H NMR spectroscopy, conventional LC–UV, and nano-LC–MS was used to qualitatively profile hydroalcoholic extracts from distinct globe artichoke organs (Cynara cardunculus subsp. scolymus, Carciofo Romanesco del Lazio). The three techniques proved highly complementary: NMR provided a quantitative overview of primary metabolites (sugars, free amino acids, organic acids, and polyols); LC–UV offered a robust, pattern-oriented description of the main phenolic families while nano-LC–MS provided complementary nominal-mass data, with positional-isomer assignments limited by the absence of MS/MS and high-resolution mass measurements.
LC–UV chromatograms recorded at selected wavelengths (280, 325, and 349 nm) enabled rapid visualization and comparison of phenolic profiles across stems, leaves, outer bracts, and globes, highlighting luteolin- and apigenin-based glycosides as the dominant flavonoid subclasses and revealing clear organ-dependent differences in their relative abundance. Nano-LC–MS, operated in full-scan mode with a nano-spray interface, complemented this information by leveraging the high sensitivity and favorable signal-to-noise ratio of nanoflow electrospray to detect and tentatively assign individual glycosylated derivatives of luteolin, apigenin, and, to a lesser extent, quercetin, even at low levels that were not reliably observed by LC-UV under the applied profiling conditions.
Taken together, NMR, LC–UV and nano-LC–MS data reveal a strongly part-resolved artichoke metabolome that may inform future application-oriented valorization studies. Stems, characterized by very high levels of soluble carbohydrates, free amino acids (notably asparagine), and relevant phenolic acids, could be investigated for the recovery of fermentable sugars, nitrogen-rich compounds, and phenolic bioactives within circular economy frameworks. Despite their lower overall metabolite content, leaves are selectively rich in inositol isomers, particularly chiro- and scyllo-inositol, suggesting potential interest in further investigating them as sources of functional polyols. Outer bracts exhibit an intermediate profile, with high amino acid content and moderate levels of carbohydrates and organic acids, suggesting possible avenues for investigating secondary valorization streams, such as nutrient-rich extracts or feed ingredients. Finally, the globe (edible part) acts as an integrated metabolic sink, combining carbohydrates, free amino acids, organic acids, and phenolics, consistent with its dietary role and suggesting potential interest for future functional food research. Overall, differentiated valorization of individual plant organs could be explored as a means of improving resource efficiency and sustainability in artichoke processing chains.
Notably, the compositional profile of the analyzed pooled market batch indicated that the non-edible artichoke fractions, particularly the leaves, contain several metabolites of potential interest for future valorization studies. These observations may help prioritize fraction-specific investigations into extraction, recovery, stability, bioactivity, safety, and potential food, feed, or nutraceutical applications. However, the present study did not evaluate these applications, which require dedicated validation using independent samples and process-oriented experiments.
In the current multi-platform workflow, the nano-LC–MS component proved useful for complementary full-scan profiling of putative secondary metabolite features and demonstrated the potential of miniaturized chromatography to reduce mobile-phase consumption. At a column flow rate of 210 nL/min, less than 10 µL of mobile phase was delivered to the capillary column over a 35-min separation window. Furthermore, the naospray interface operated without nebulizing gas, and a 10 mL batch of spray liquid was sufficient for several days of operation. These practical features highlight the low resource requirements at the separation and ionization stages, although total solvent consumption also depends on the flow-splitting configuration. Thus, nano-LC–MS may be a promising, resource-efficient tool for future studies of secondary metabolite profiling in artichoke and other plant matrices.
Supplementary Materials
The following supporting information can be downloaded at https://www.mdpi.com/article/10.3390/molecules31224161/s1: Figure S1: Comparative analysis of base peak MS (BP-MS) and UV chromatogram (UV) profiles of hydroalcoholic extract from selected parts of artichoke using a Nano-LC-UV-MS system; Table S1: List of metabolites and corresponding 1H NMR signals for quantification.
Author Contributions
Conceptualization, G.D. and A.P.S.; methodology, G.D. and A.P.S.; formal analysis, G.D., E.S., G.S. and A.P.S.; investigation, G.D., E.S., G.S.; writing—original draft preparation, G.D., E.S., A.P.S.; writing—review and editing, G.D., E.S., G.S. and A.P.S. All authors have read and agreed to the published version of the manuscript.
Funding
This work was supported by the National Recovery and Resilience Plan (NRRP), Mission 4 Component 2 Investment 1.3—Call for proposals No. 341 of 15 March 2022 of the Italian Ministry of University and Research funded by the European Union—NextGenerationEU; Award Number: Project code PE00000003, Concession Decree No. 1550 of 11 October 2022 adopted by the Italian Ministry of University and Research, CUP D93C22000890001, Project title “ON Foods—Research and innovation network on food and nutrition Sustainability, Safety and Security-Working ON Foods”.
Institutional Review Board Statement
Not applicable.
Informed Consent Statement
Not applicable.
Data Availability Statement
The data presented in this study are included in the article and its Supplementary Materials. The underlying raw NMR and chromatographic data are available from the corresponding authors upon reasonable request.
Conflicts of Interest
The authors declare no conflicts of interest.
Abbreviations
The following abbreviations are used in this manuscript:
| Nano-LC | Nano Liquid Chromatography |
| CLC | Capillary Liquid Chromatography |
| CE | Capillary Electrophoresis |
| CEC | Capillary Electrochromatography |
References
- Liu, R.H. Health-Promoting components of fruits and vegetables in the diet. Adv. Nutr. 2013, 4, 384S–392S. [Google Scholar] [CrossRef] [Scilit] [PubMed]
- Pott, D.M.; Osorio, S.; Vallarino, J.G. From Central to Specialized Metabolism: An Overview of Some Secondary Compounds Derived From the Primary Metabolism for Their Role in Conferring Nutritional and Organoleptic Characteristics to Fruit. Front. Plant Sci. 2019, 10, 835. [Google Scholar] [CrossRef] [Scilit] [PubMed]
- Isah, T. Stress and Defense Responses in Plant Secondary Metabolites Production. Biol. Res. 2019, 52, 39. [Google Scholar] [CrossRef] [Scilit] [PubMed]
- Quideau, S.; Deffieux, D.; Douat-Casassus, C.; Pouysegu, L. Plant polyphenols: Chemical properties, biological activities, and synthesis. Angew. Chem. Int. Ed. 2011, 50, 586–621. [Google Scholar] [CrossRef] [Scilit] [PubMed]
- Mañes, J.; Luz Clara, A.; Mañes, J. Analysis of main and healthy phenolic compounds in foods. J. AOAC Int. 2019, 102, 1356–1367. [Google Scholar] [CrossRef] [PubMed]
- Ignat, I.; Volf, I.; Popa, V.I. A critical review of methods for characterisation of polyphenolic compounds in fruits and vegetables. Food Chem. 2011, 126, 1821–1835. [Google Scholar] [CrossRef] [Scilit] [PubMed]
- Lattanzio, V.; Kroon, P.A.; Linsalata, V.; Cardinali, A. Globe artichoke: A functional food and source of nutraceuticals. J. Funct. Foods 2009, 1, 131–139. [Google Scholar] [CrossRef] [Scilit]
- Pandino, G.; Lombardo, S.; Mauromicale, G. Globe artichoke leaves and floral stems as a source of bioactive compounds. Ind. Crops Prod. 2013, 44, 44–49. [Google Scholar] [CrossRef] [Scilit]
- Pinelli, P.; Agostini, F.; Comino, C.; Lanteri, S.; Portis, E.; Romani, A. Simultaneous quantification of caffeoyl esters and flavonoids in wild and cultivated cardoon leaves. Food Chem. 2007, 105, 1695–1701. [Google Scholar] [CrossRef] [Scilit]
- Lombardo, S.; Pandino, G.; Mauromicale, G.; Knödler, M.; Carle, R.; Schieber, A. Influence of genotype, harvest time and plant part on polyphenolic composition of globe artichoke [Cynara cardunculus L. var. scolymus (L.) Fiori]. Food Chem. 2010, 119, 1175–1181. [Google Scholar] [CrossRef] [Scilit]
- Feiden, T.; Valduga, E.; Zeni, J.; Steffens, J. Bioactive compounds from artichoke and application potential. Food Technol. Biotechnol. 2023, 61, 312–327. [Google Scholar] [CrossRef] [Scilit] [PubMed]
- Di Napoli, A.; Germani, F.; Domingues Da Silva, S.; Senatori, L.; Parisi, F.; Zucchetti, P. Health-promoting properties of artichoke in selected gastrointestinal diseases. Authorea 2023. [Google Scholar] [CrossRef] [Scilit] [PubMed]
- De la Guardia, M.; Armenta, S. Origins of green analytical chemistry. In Green Analytical Chemistry: Theory and Practice; De la Guardia, M., Garrigues, S., Eds.; Comprehensive Analytical Chemistry; Elsevier: Amsterdam, The Netherlands, 2011; Volume 57, pp. 1–23. [Google Scholar] [CrossRef] [Scilit]
- Anastas, P.; Eghbali, N. Green chemistry: Principles and practice. Chem. Soc. Rev. 2010, 39, 301–312. [Google Scholar] [CrossRef] [Scilit] [PubMed]
- De Cesaris, M.G.; Antonelli, L.; Lucci, E.; Felli, N.; Dal Bosco, C.; Gentili, A. Current trends to green food sample preparation. A review. J. Chromatogr. Open 2024, 6, 100170. [Google Scholar] [CrossRef] [Scilit]
- Fanali, S. An overview to nano-scale analytical techniques: Nano-liquid chromatography and capillary electrochromatography. Electrophoresis 2017, 38, 2340–2359. [Google Scholar] [CrossRef] [Scilit] [PubMed]
- Asensio Ramon, M.; Fanali, C.; Della Posta, S.; D’Orazio, G.; Fanali, S. Nano-liquid chromatography. In Liquid Chromatography, 3rd ed.; Elsevier: Amsterdam, The Netherlands, 2023; pp. 177–226. [Google Scholar] [CrossRef] [Scilit]
- Rocco, A.; Fanali, C.; Dugo, L.; Mondello, L. A nano-LC/UV method for the analysis of principal phenolic compounds in commercial citrus juices and evaluation of antioxidant potential. Electrophoresis 2014, 35, 1701–1708. [Google Scholar] [CrossRef] [Scilit] [PubMed]
- Gómez-Mejía, E.; Vicente-Zurdo, D.; Rosales-Conrado, N.; León-González, M.E.; Madrid, Y. Screening the extraction process of phenolic compounds from pressed grape seed residue: Towards an integrated and sustainable management of viticultural waste. LWT 2022, 169, 113988. [Google Scholar] [CrossRef] [Scilit]
- Uysal, U.D.; Aturki, Z.; Raggi, M.A.; Fanali, S. Separation of catechins and methylxanthines in tea samples by capillary electrochromatography. J. Sep. Sci. 2009, 32, 1002–1010. [Google Scholar] [CrossRef] [Scilit] [PubMed]
- Fanali, C.; Dugo, L.; Rocco, A. Nano-liquid chromatography in nutraceutical analysis: Determination of polyphenols in bee pollen. J. Chromatogr. A 2013, 1313, 270–274. [Google Scholar] [CrossRef] [Scilit] [PubMed]
- Ramón-Gonçalves, M.; Gómez-Mejía, E.; Rosales-Conrado, N.; León-González, M.E.; Madrid, Y. Extraction, identification and quantification of polyphenols from spent coffee grounds by chromatographic methods and chemometric analyses. Waste Manag. 2019, 96, 15–24. [Google Scholar] [CrossRef] [Scilit] [PubMed]
- Hashim, S.N.N.S.; Schwarz, L.J.; Boysen, R.I.; Yang, Y.; Danylec, B.; Hearn, M.T.W. Rapid solid-phase extraction and analysis of resveratrol and other polyphenols in red wine. J. Chromatogr. A 2013, 1313, 284–290. [Google Scholar] [CrossRef] [Scilit] [PubMed]
- García-Villalba, R.; Carrasco-Pancorbo, A.; Oliveras-Ferraros, C.; Menéndez, J.A.; Segura-Carretero, A.; Fernández-Gutiérrez, A. Uptake and metabolism of olive oil polyphenols in human breast cancer cells using nano-liquid chromatography coupled to electrospray ionization-time of flight-mass spectrometry. J. Chromatogr. B 2012, 898, 69–77. [Google Scholar] [CrossRef] [Scilit] [PubMed]
- Contreras, M.M.; Arráez-Román, D.; Fernández-Gutiérrez, A.; Segura-Carretero, A. Nano-liquid chromatography coupled to time-of-flight mass spectrometry for phenolic profiling: A case study in cranberry syrups. Talanta 2015, 132, 929–938. [Google Scholar] [CrossRef] [Scilit] [PubMed]
- Falvo, S.; Acquadro, A.; Albo, A.G.; America, T.; Lanteri, S. Proteomic Analysis of PEG-Fractionated UV-C Stress-Response Proteins in Globe Artichoke. Plant Mol. Biol. Rep. 2012, 30, 111–122. [Google Scholar] [CrossRef] [Scilit]
- Sobolev, A.P.; Dal Bosco, C.; D’Orazio, G. A sustainable approach to the identification of plant matrices by nano-liquid chromatography and nuclear magnetic resonance spectroscopy: Artichoke leaves sample. J. Chromatogr. Open 2026, 9, 100342. [Google Scholar] [CrossRef] [Scilit]
- Serni, E.; Audino, V.; Del Carlo, S.; Manera, C.; Saccomanni, G.; Macchia, M. Determination of water-soluble vitamins in multivitamin dietary supplements and in artichokes by micellar electrokinetic chromatography. Nat. Prod. Res. 2013, 27, 2212–2215. [Google Scholar] [CrossRef] [Scilit] [PubMed]
- Sevčíková, P.; Glatz, Z.; Slanina, J. Analysis of artichoke (Cynara cardunculus L.) extract by means of micellar electrokinetic capillary chromatography. Electrophoresis 2002, 23, 249–252. [Google Scholar] [CrossRef] [PubMed]
- Trajtemberg, S.P.; Apóstolo, N.M.; Fernández, G. Calluses of Cynara cardunculus var. cardunculus cardoon (Asteraceae): Determination of cynarine and chlorogenic acid by automated high-performance capillary electrophoresis. In Vitr. Cell. Dev. Biol. Plant 2006, 42, 534–537. [Google Scholar] [CrossRef] [Scilit]
- Ordiales, E.; Martín, A.; Benito, M.J.; Hernández, A.; Ruiz-Moyano, S.; Córdoba, M.d.G. Technological characterisation by free zone capillary electrophoresis (FCZE) of the vegetable rennet from (Cynara cardunculus) used in “Torta del Casar” cheese-making. Food Chem. 2012, 133, 227–235. [Google Scholar] [CrossRef] [Scilit]
- Fiorentino, A.; D’Abrosca, B.; Valentino, G.; Scognamiglio, M.; Pacifico, S.; Graziani, V. NMR-based plant metabolomics in nutraceutical research: An overview. Molecules 2020, 25, 1444. [Google Scholar] [CrossRef] [Scilit] [PubMed]
- Cerulli, A.; Masullo, M.; Pizza, C.; Piacente, S. Metabolite profiling of “green” extracts of Cynara cardunculus subsp. scolymus, cultivar “Carciofo di Paestum” PGI by 1H NMR and HRMS-based metabolomics. Molecules 2022, 27, 3328. [Google Scholar] [CrossRef] [Scilit] [PubMed]
- Mascellani Bergo, A.; Leiss, K.; Havlík, J. Twenty years of 1H NMR plant metabolomics. J. Agric. Food Chem. 2024, 72, 4727–4752. [Google Scholar] [CrossRef] [Scilit] [PubMed]
- Sobolev, A.; Ingallina, C.; Campiglia, E.; Acciaro, E.; Di Matteo, G.; Mannina, L.; Spano, M. Byproducts of globe artichoke and cauliflower production as a new source of bioactive compounds: An NMR study. Molecules 2023, 28, 1363. [Google Scholar] [CrossRef] [Scilit] [PubMed]
- De Falco, B.; Incerti, G.; Pepe, R.; Amato, M.; Lanzotti, V. Metabolomic fingerprinting of Romaneschi globe artichokes by NMR spectroscopy and multivariate data analysis. Phytochem. Anal. 2016, 30, 304–314. [Google Scholar] [CrossRef] [Scilit] [PubMed]
- Albergamo, A.; Rotondo, A.; Salvo, A.; Pellizzeri, V.; Bua, D.G.; Maggio, A.; Cicero, N.; Dugo, G. Metabolite and mineral profiling of “Violetto di Niscemi” and “Spinoso di Menfi” globe artichokes by 1H-NMR and ICP-MS. Nat. Prod. Res. 2016, 31, 990–999. [Google Scholar] [CrossRef] [Scilit] [PubMed]
- Blanco, E.; Musio, B.; Todisco, S.; Mastrorilli, P.; Gallo, V.; Sonnante, G. Non-targeted NMR approach to unveil and promote the biodiversity of globe artichoke in the Mediterranean area. J. Food Compos. Anal. 2022, 110, 104539. [Google Scholar] [CrossRef] [Scilit]
- Bligh, E.G.; Dyer, W.J. A rapid method of total lipid extraction and purification. Can. J. Biochem. Physiol. 1959, 37, 911–917. [Google Scholar] [CrossRef] [Scilit] [PubMed]
- Francavilla, M.; Marone, M.; Marasco, P.; Contillo, F.; Monteleone, M. Artichoke biorefinery: From food to advanced technological applications. Foods 2021, 10, 112. [Google Scholar] [CrossRef] [Scilit] [PubMed]
- Roberfroid, M.B. Introducing inulin-type fructans. Br. J. Nutr. 2005, 93, S13–S25. [Google Scholar] [CrossRef] [Scilit] [PubMed]
- Pagano, I.; Piccinelli, A.L.; Celano, R.; Campone, L.; Gazzerro, P.; De Falco, E.; Rastrelli, L. Chemical profile and cellular antioxidant activity of artichoke by-products. Food Funct. 2016, 7, 4841–4850. [Google Scholar] [CrossRef] [Scilit] [PubMed]
- Mancini, M.; Andreassi, A.; Salvioni, M.; Pelliccione, F.; Mantellassi, G.; Banderali, G. myo-Inositol and D-chiro-inositol in improving insulin resistance in obese male children: Preliminary data. Int. J. Endocrinol. 2016, 2016, 8720342. [Google Scholar] [CrossRef] [Scilit] [PubMed]
- Mena-García, A.; Rodríguez-Sánchez, S.; Ruiz-Matute, A.I.; Sanz, M.L. Exploitation of artichoke byproducts to obtain bioactive extracts enriched in inositols and caffeoylquinic acids by microwave assisted extraction. J. Chromatogr. A 2020, 1613, 460703. [Google Scholar] [CrossRef] [Scilit] [PubMed]
- Bonasia, A.; Conversa, G.; Lazzizera, C.; Elia, A. Characterization of targeted phenolic compounds in globe artichoke heads and waste from vegetatively and “seed”-propagated genotypes. Plants 2023, 12, 2579. [Google Scholar] [CrossRef] [Scilit] [PubMed]
- Corrias, F.; Scano, E.; Milia, M.; Atzei, A.; Casula, M.; Arru, N.; Angioni, A. Extraction and characterization of artichoke (Cynara cardunculus L.) solid waste from the industrial processing of fresh-cut products for nutraceutical use. Foods 2025, 14, 13. [Google Scholar] [CrossRef] [Scilit] [PubMed]
- Schütz, K.; Carle, R.; Schieber, A. Identification and quantification of caffeoylquinic acids and flavonoids from artichoke (Cynara scolymus L.) heads, juice, and pomace by HPLC-DAD-ESI/MSn. J. Agric. Food Chem. 2004, 52, 4090–4096. [Google Scholar] [CrossRef] [Scilit] [PubMed]
- Fanali, C.; Rocco, A.; Aturki, Z.; Mondello, L.; Fanali, S. Analysis of polyphenols and methylxanthines in tea samples by means of nano-liquid chromatography utilizing capillary columns packed with core-shell particles. J. Chromatogr. A 2012, 1234, 38–44. [Google Scholar] [CrossRef] [Scilit] [PubMed]
- León-González, M.E.; Gómez-Mejía, E.; Rosales-Conrado, N.; Madrid-Albarrán, Y. Residual brewing yeast as a source of polyphenols: Extraction, identification and quantification by chromatographic and chemometric tools. Food Chem. 2018, 267, 246–254. [Google Scholar] [CrossRef] [Scilit] [PubMed]
- García-Villalba, R.; Carrasco-Pancorbo, A.; Zurek, G.; Behrens, M.; Bässmann, C.; Segura-Carretero, A.; Fernández-Gutiérrez, A. Nano and rapid resolution liquid chromatography-electrospray ionization-time of flight mass spectrometry to identify and quantify phenolic compounds in olive oil. J. Sep. Sci. 2010, 33, 2069–2078. [Google Scholar] [CrossRef] [Scilit] [PubMed]
- Dal Bosco, C.; Bonoli, F.; Gentili, A.; Fanali, C.; D’Orazio, G. Chiral nano-liquid chromatography and dispersive liquid-liquid microextraction applied to the analysis of antifungal drugs in milk. Molecules 2021, 26, 7094. [Google Scholar] [CrossRef] [Scilit] [PubMed]
- Buonasera, K.; D’Orazio, G.; Fanali, S.; Dugo, P.; Mondello, L. Separation of organophosphorus pesticides by using nano-liquid chromatography. J. Chromatogr. A 2009, 1216, 3970–3976. [Google Scholar] [CrossRef] [Scilit] [PubMed]
- Héron, S.; Tchapla, A.; Chervet, J.P. Influence of injection parameters on column performance in nanoscale high-performance liquid chromatography. Chromatographia 2000, 51, 495–499. [Google Scholar] [CrossRef] [Scilit]
- Dai, J.; Mumper, R.J. Plant phenolics: Extraction, analysis and their antioxidant and anticancer properties. Molecules 2010, 15, 7313–7352. [Google Scholar] [CrossRef] [Scilit] [PubMed]
- Alarcón-Flores, M.I.; Romero-González, R.; Martínez Vidal, J.L.; Garrido Frenich, A. Determination of phenolic compounds in artichoke, garlic and spinach by ultra-high-performance liquid chromatography coupled to tandem mass spectrometry. Food Anal. Methods 2014, 7, 2095–2106. [Google Scholar] [CrossRef] [Scilit]
- Pagliari, S.; Cannavacciuolo, C.; Celano, R.; Carabetta, S.; Russo, M.; Labra, M.; Campone, L. Valorisation, green extraction development, and metabolomic analysis of wild artichoke by-product using pressurised liquid extraction UPLC–HRMS and multivariate data analysis. Molecules 2022, 27, 7157. [Google Scholar] [CrossRef] [Scilit] [PubMed]
- Kollia, E.; Markaki, P.; Zoumpoulakis, P.; Proestos, C. Antioxidant activity of Cynara scolymus L. and Cynara cardunculus L. extracts obtained by different extraction techniques. Nat. Prod. Res. 2017, 31, 1163–1167. [Google Scholar] [CrossRef] [Scilit] [PubMed]
- Turkiewicz, I.P.; Wojdyło, A.; Tkacz, K.; Nowicka, P.; Hernández, F. Antidiabetic, anticholinesterase and antioxidant activity vs. terpenoids and phenolic compounds in selected new cultivars and hybrids of artichoke Cynara scolymus L. Molecules 2019, 24, 1222. [Google Scholar] [CrossRef] [Scilit] [PubMed]
- Zazzali, I.; Gabilondo, J.; Peixoto Mallmann, L.; Rodrigues, E.; Perullini, M.; Santagapita, P.R. Overall evaluation of artichoke leftovers: Agricultural measurement and bioactive properties assessed after green and low-cost extraction methods. Food Biosci. 2021, 41, 100963. [Google Scholar] [CrossRef] [Scilit]
- Claus, T.; Maruyama, S.A.; Palombini, S.V.; Montanher, P.F.; Bonafé, E.G.; Santos Junior, O.O.; Matsushita, M.; Visentainer, J.V. Chemical characterization and use of artichoke parts for protection from oxidative stress in canola oil. LWT-Food Sci. Technol. 2015, 61, 346–351. [Google Scholar] [CrossRef] [Scilit]
- Pereira, C.; Barros, L.; Carvalho, A.M.; Santos-Buelga, C.; Ferreira, I.C.F.R. Infusions of artichoke and milk thistle represent a good source of phenolic acids and flavonoids. Food Funct. 2015, 6, 56–62. [Google Scholar] [CrossRef] [Scilit] [PubMed]
- Sánchez-Rabaneda, F.; Jáuregui, O.; Lamuela-Raventós, R.M.; Bastida, J.; Viladomat, F.; Codina, C. Identification of phenolic compounds in artichoke waste by high-performance liquid chromatography-tandem mass spectrometry. J. Chromatogr. A 2003, 1008, 57–72. [Google Scholar] [CrossRef] [Scilit] [PubMed]
- Ucar Turker, A.; Basay, S.; Cimen, A.; Baba, Y.; Birinci Yildirim, A. Evaluation of the phenolic content and the nutraceutical potential of ancestor and cultivated artichokes. Chem. Biodivers. 2024, 21, e202400203. [Google Scholar] [CrossRef] [Scilit] [PubMed]
- Clifford, M.N.; Knight, S.; Kuhnert, N. Discriminating between the six isomers of dicaffeoylquinic acid by LC-MSn. J. Agric. Food Chem. 2005, 53, 3821–3832. [Google Scholar] [CrossRef] [Scilit] [PubMed]
- Gil-Martínez, L.; de la Torre-Ramírez, J.M.; Martínez-López, S.; Ayuso-García, L.M.; Dellapina, G.; Poli, G.; Verardo, V.; Gómez-Caravaca, A.M. Green extraction of phenolic compounds from artichoke by-products: Pilot-scale comparison of ultrasound, microwave, and combined methods with pectinase pre-treatment. Antioxidants 2025, 14, 423. [Google Scholar] [CrossRef] [Scilit] [PubMed]
- Llorach, R.; Espín, J.C.; Tomás-Barberán, F.A.; Ferreres, F. Artichoke (Cynara scolymus L.) byproducts as a potential source of health-promoting antioxidant phenolics. J. Agric. Food Chem. 2002, 50, 3458–3464. [Google Scholar] [CrossRef] [Scilit] [PubMed]
- D’Antuono, I.; Carola, A.; Linsalata, V.; Cardinali, A. Polyphenols from artichoke heads (Cynara cardunculus (L.) subsp. scolymus Hayek): In Vitro bio-accessibility, intestinal uptake and bioavailability. Food Funct. 2015, 6, 1268–1277. [Google Scholar] [CrossRef] [Scilit] [PubMed]
- Ben Salem, M.; Ksouda, K.; Dhouibi, R.; Charfi, S.; Turki, M.; Hammami, S.; Ayedi, F.; Sahnoun, Z.; Zeghal, K.M.; Affes, H. LC-MS/MS analysis and hepatoprotective activity of artichoke (Cynara scolymus L.) leaves extract against high fat diet-induced obesity in rats. BioMed Res. Int. 2019, 2019, 4851279. [Google Scholar] [CrossRef] [Scilit] [PubMed]
- Jiménez-Moreno, N.; Cimminelli, M.J.; Volpe, F.; Ansó, R.; Esparza, I.; Mármol, I.; Rodríguez-Yoldi, M.J.; Ancín-Azpilicueta, C. Phenolic Composition of Artichoke Waste and Its Antioxidant Capacity on Differentiated Caco-2 Cells. Nutrients 2019, 11, 1723. [Google Scholar] [CrossRef] [Scilit] [PubMed]
- Fanali, S.; D’Orazio, G.; Quaglia, M.G. Separation of aryl propionic acids by capillary liquid chromatography. Chromatographia 2004, 60, S239–S243. [Google Scholar] [CrossRef] [Scilit]
- Cheong, W.J. Fritting techniques in chromatography. J. Sep. Sci. 2014, 37, 603–617. [Google Scholar] [CrossRef] [Scilit] [PubMed]
- Fanali, S.; D’Orazio, G.; Foret, F.; Kleparnik, K.; Aturki, Z. On-line CE-MS using pressurized liquid junction nanoflow electrospray interface and surface-coated capillaries. Electrophoresis 2006, 27, 4666–4673. [Google Scholar] [CrossRef] [Scilit] [PubMed]
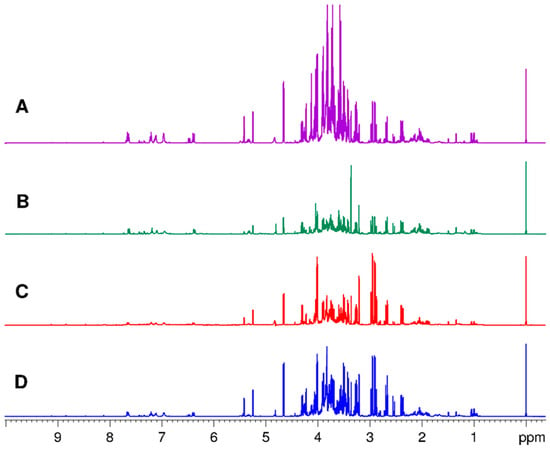
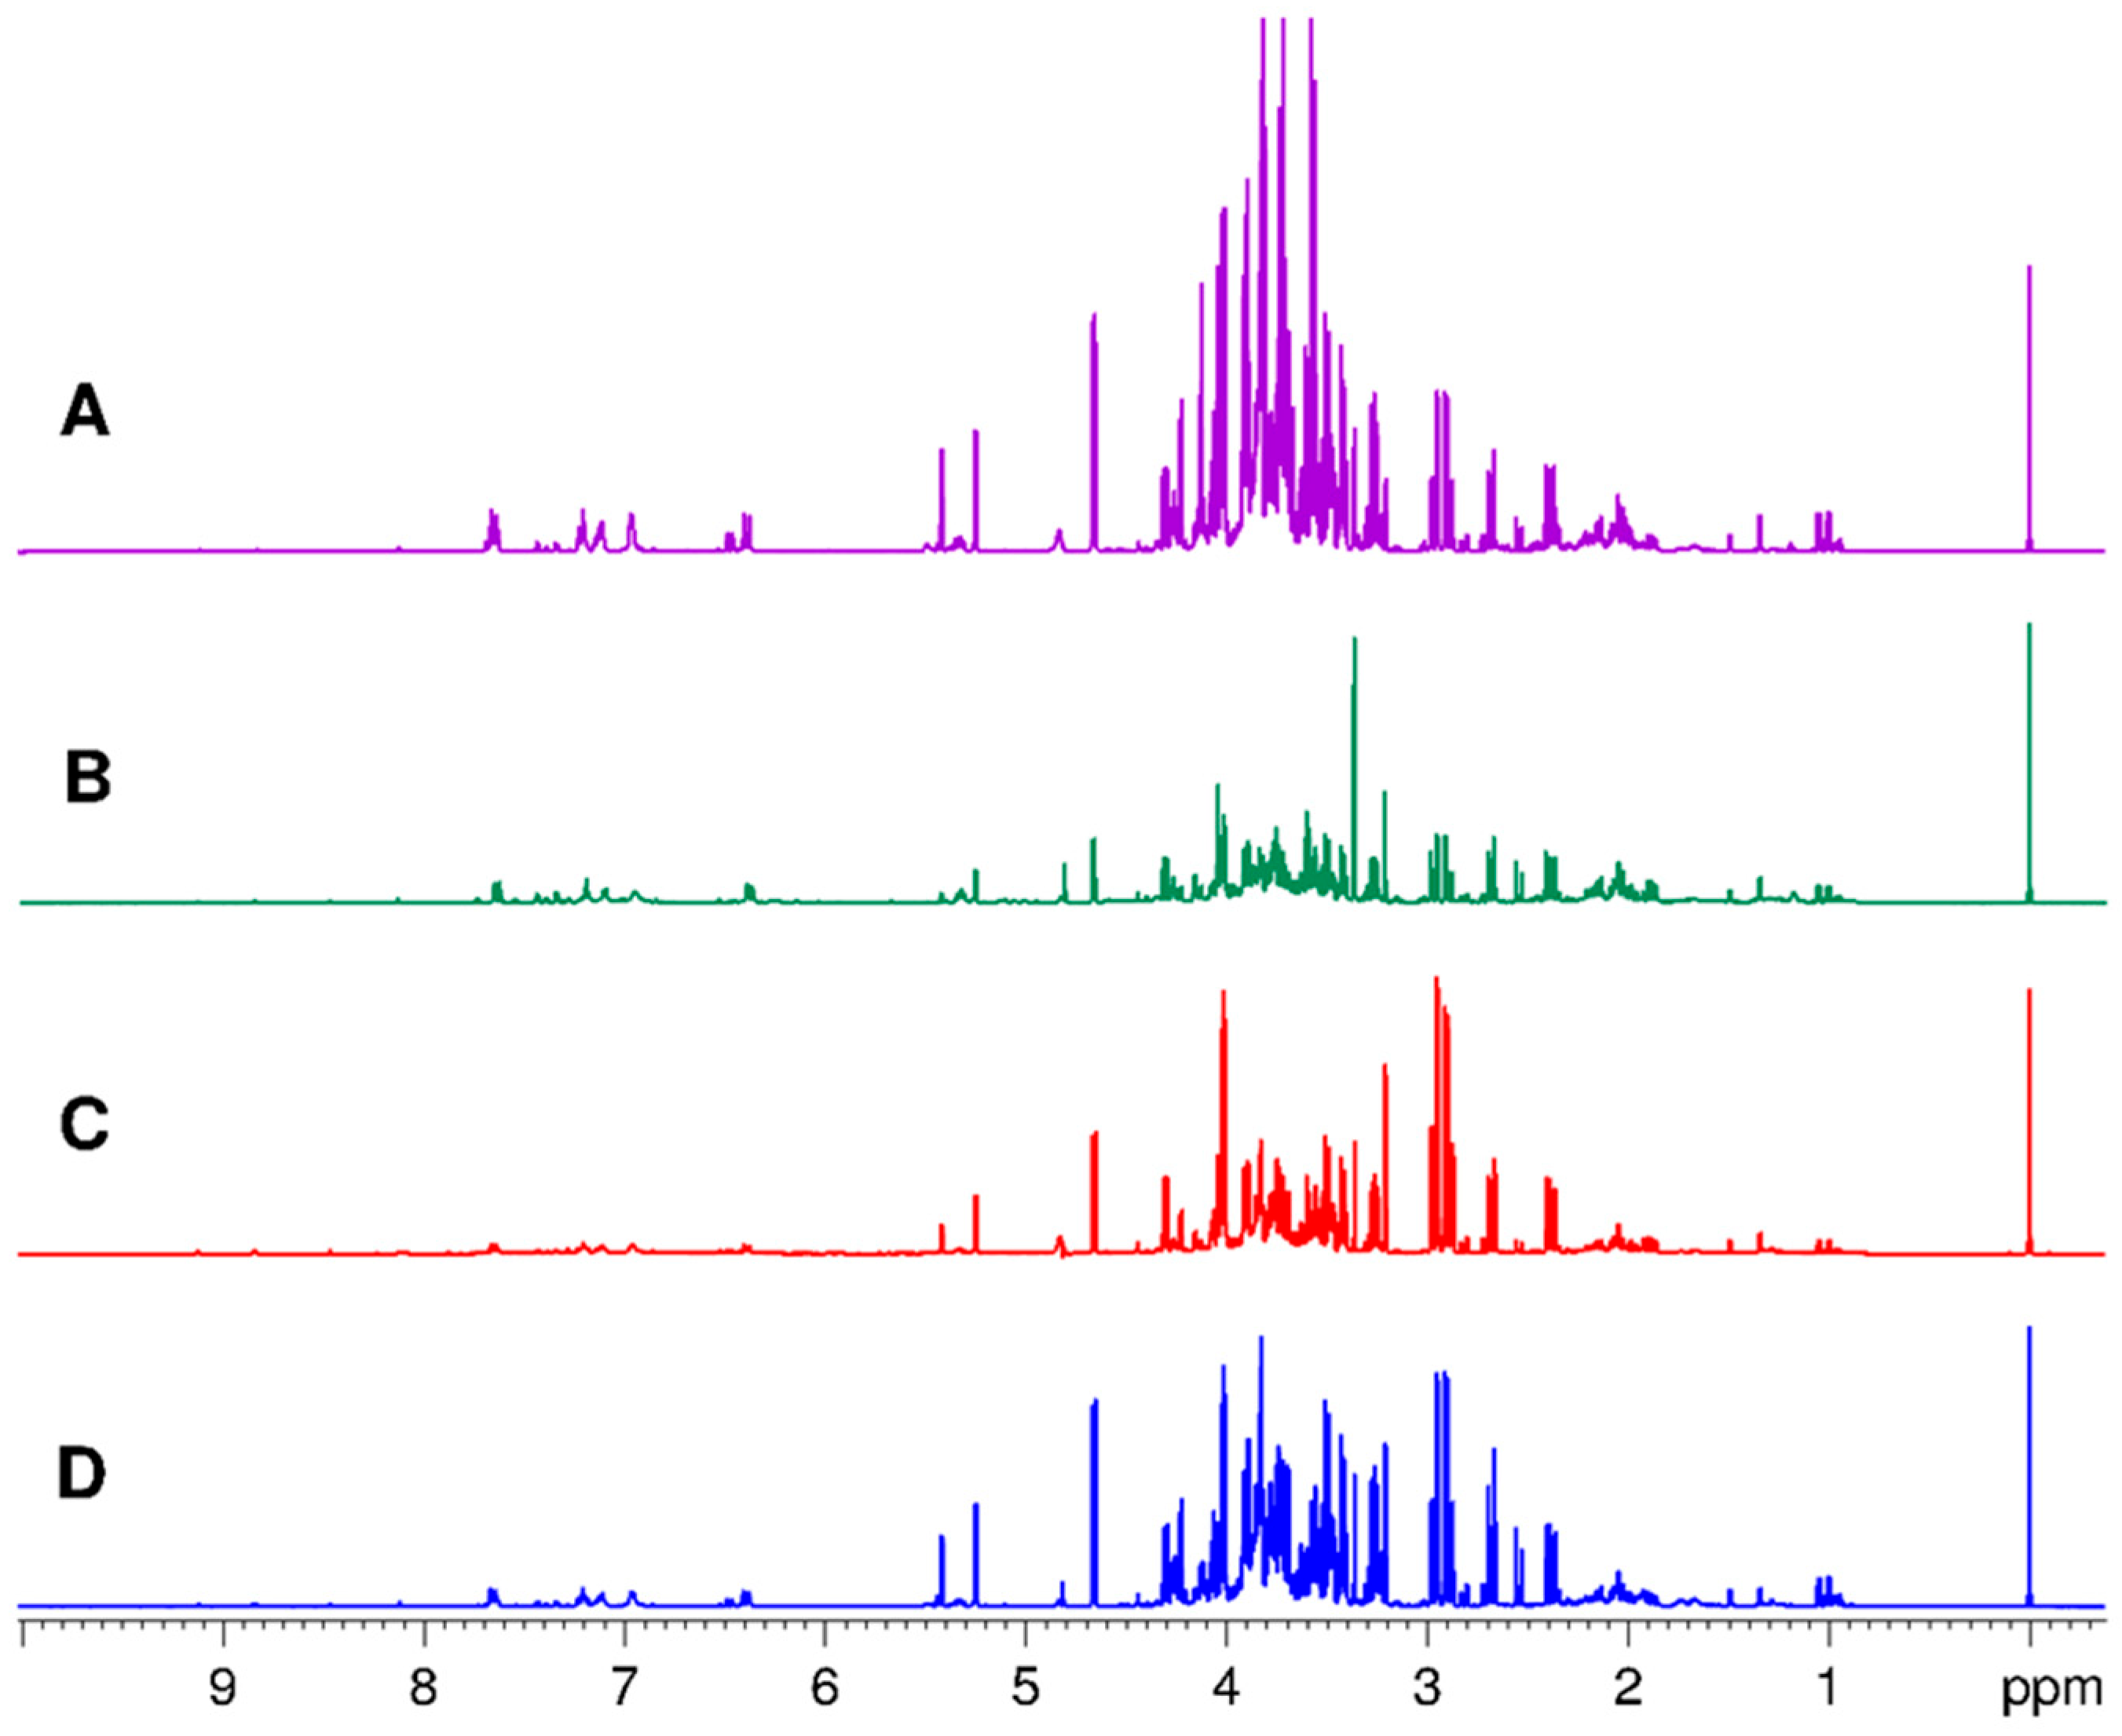
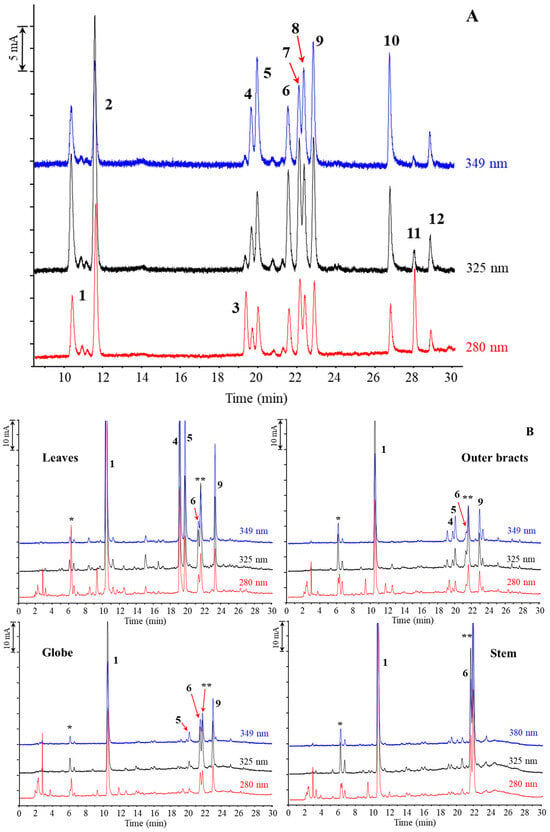
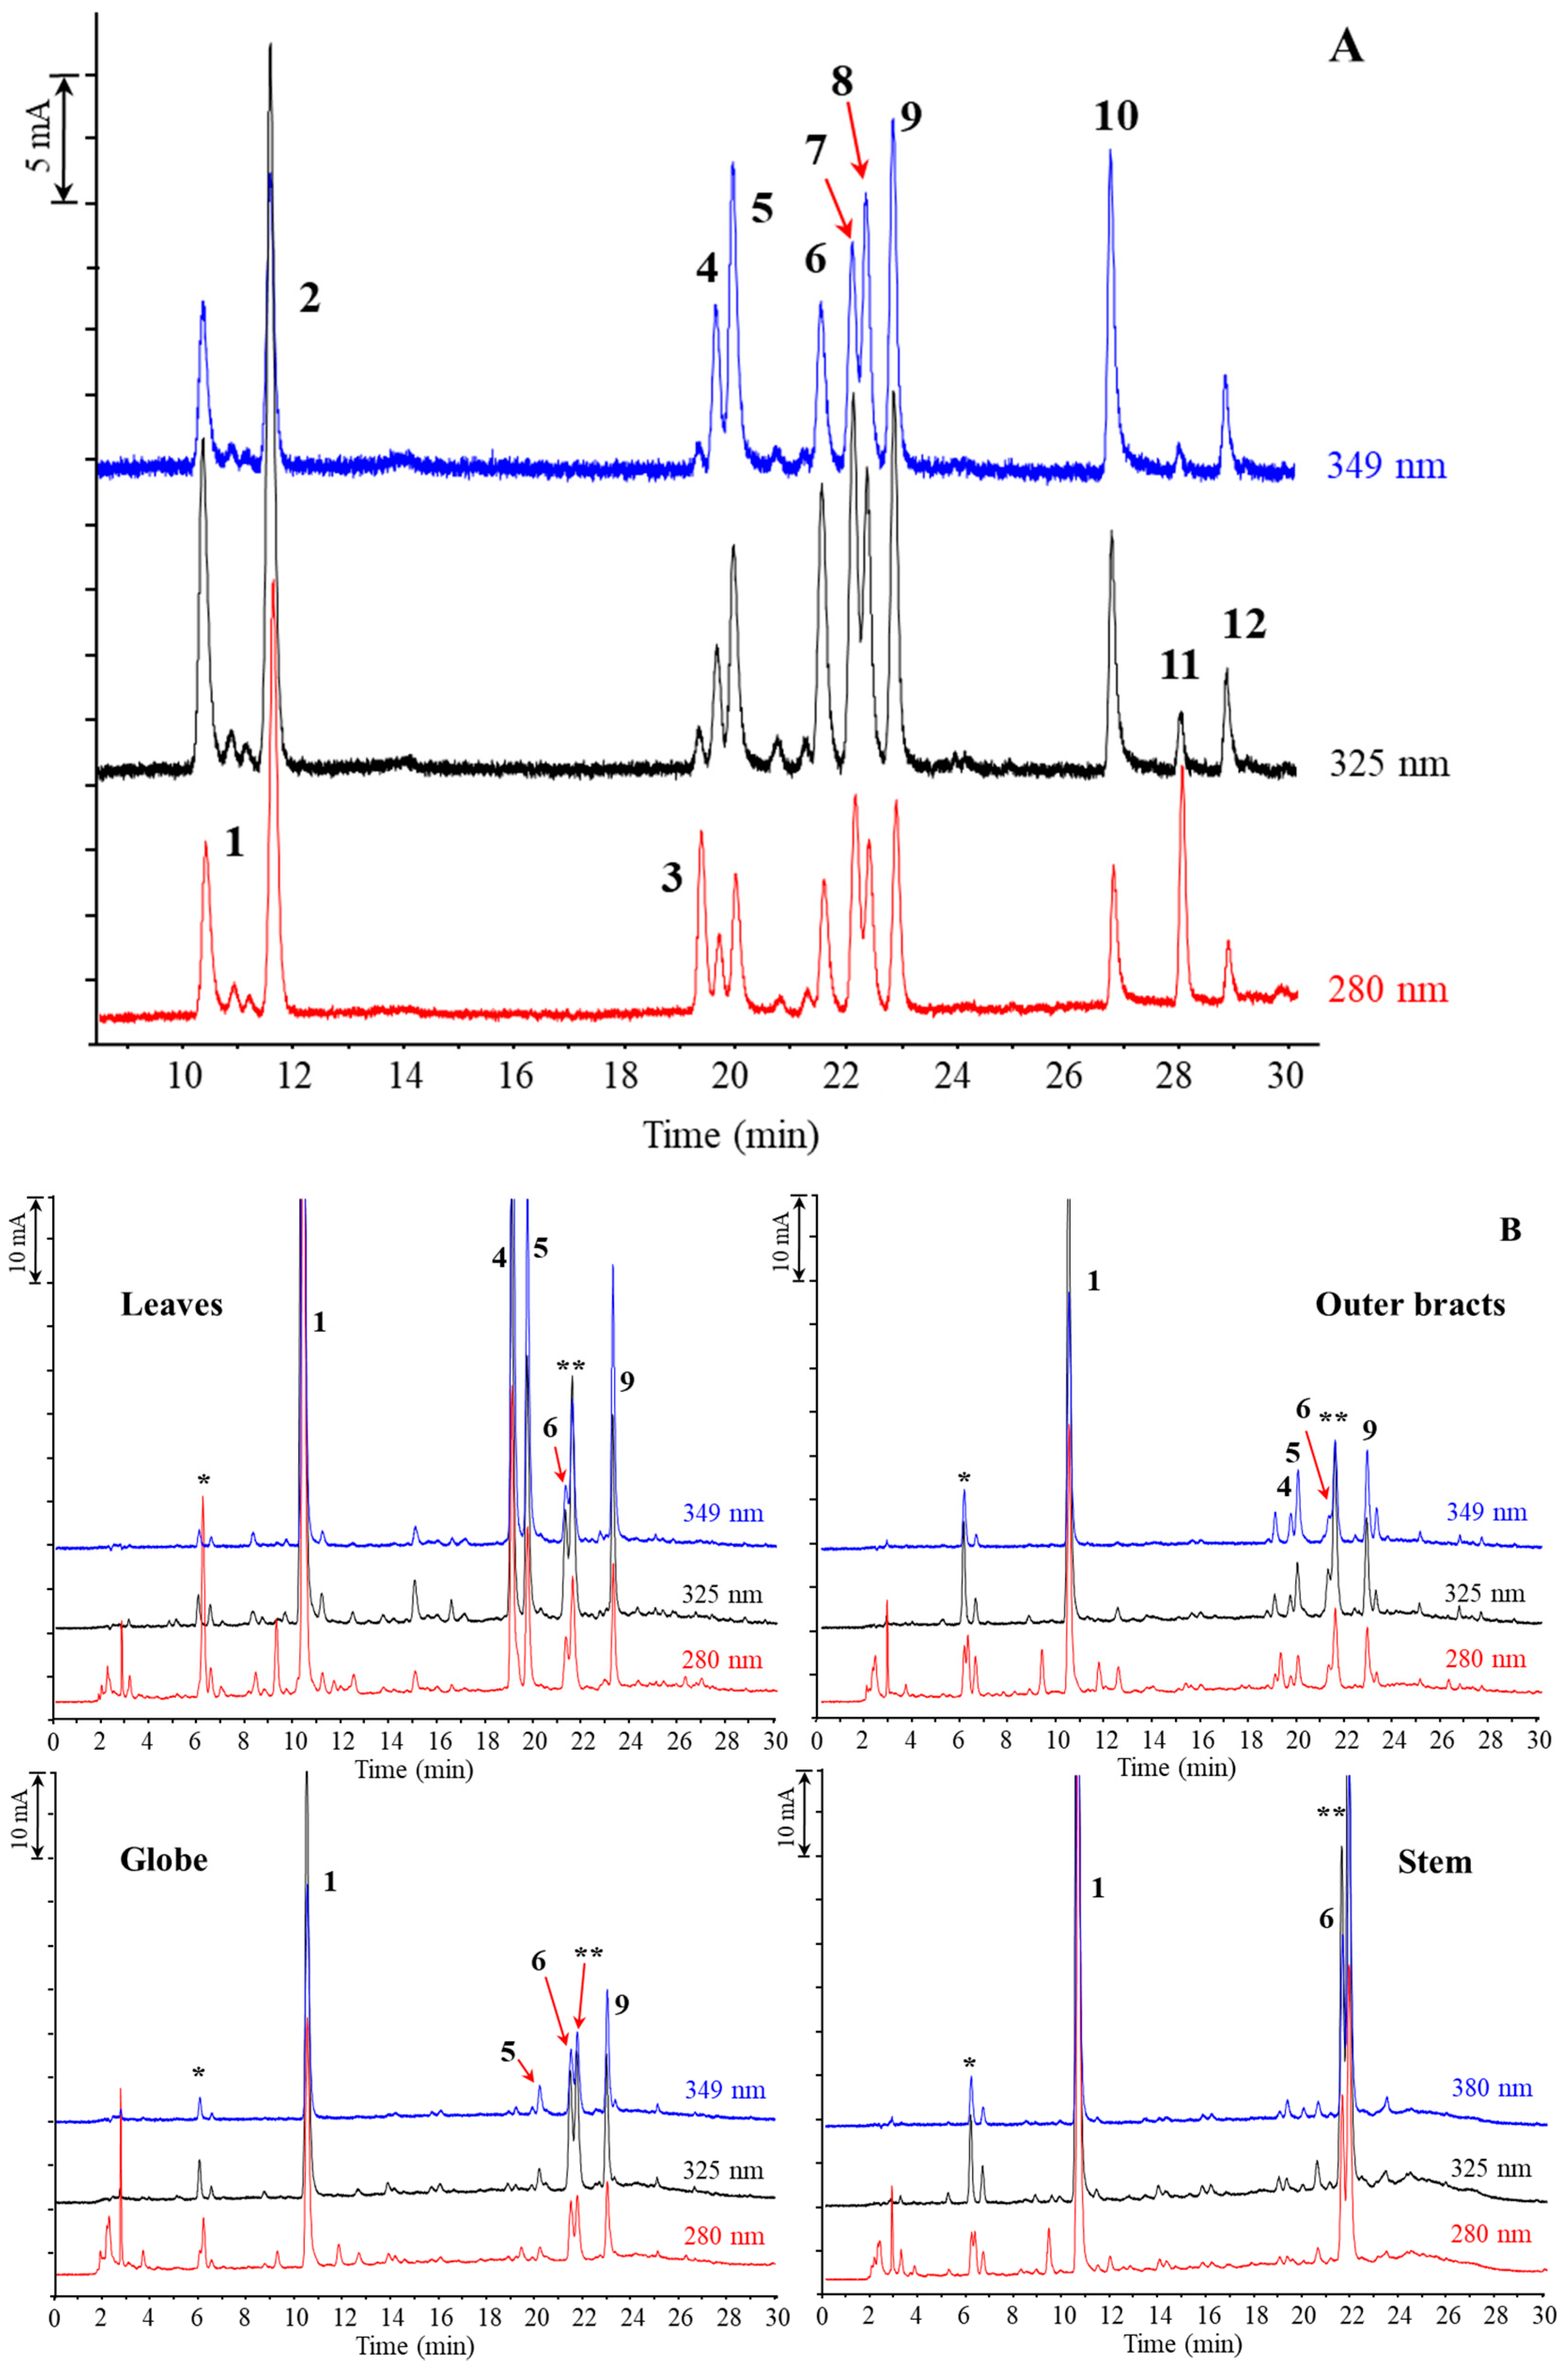
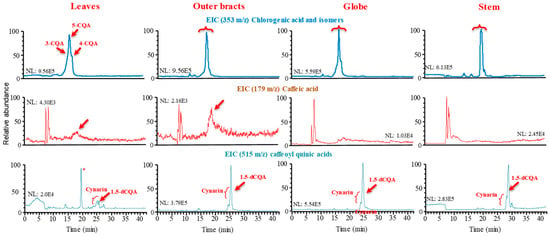
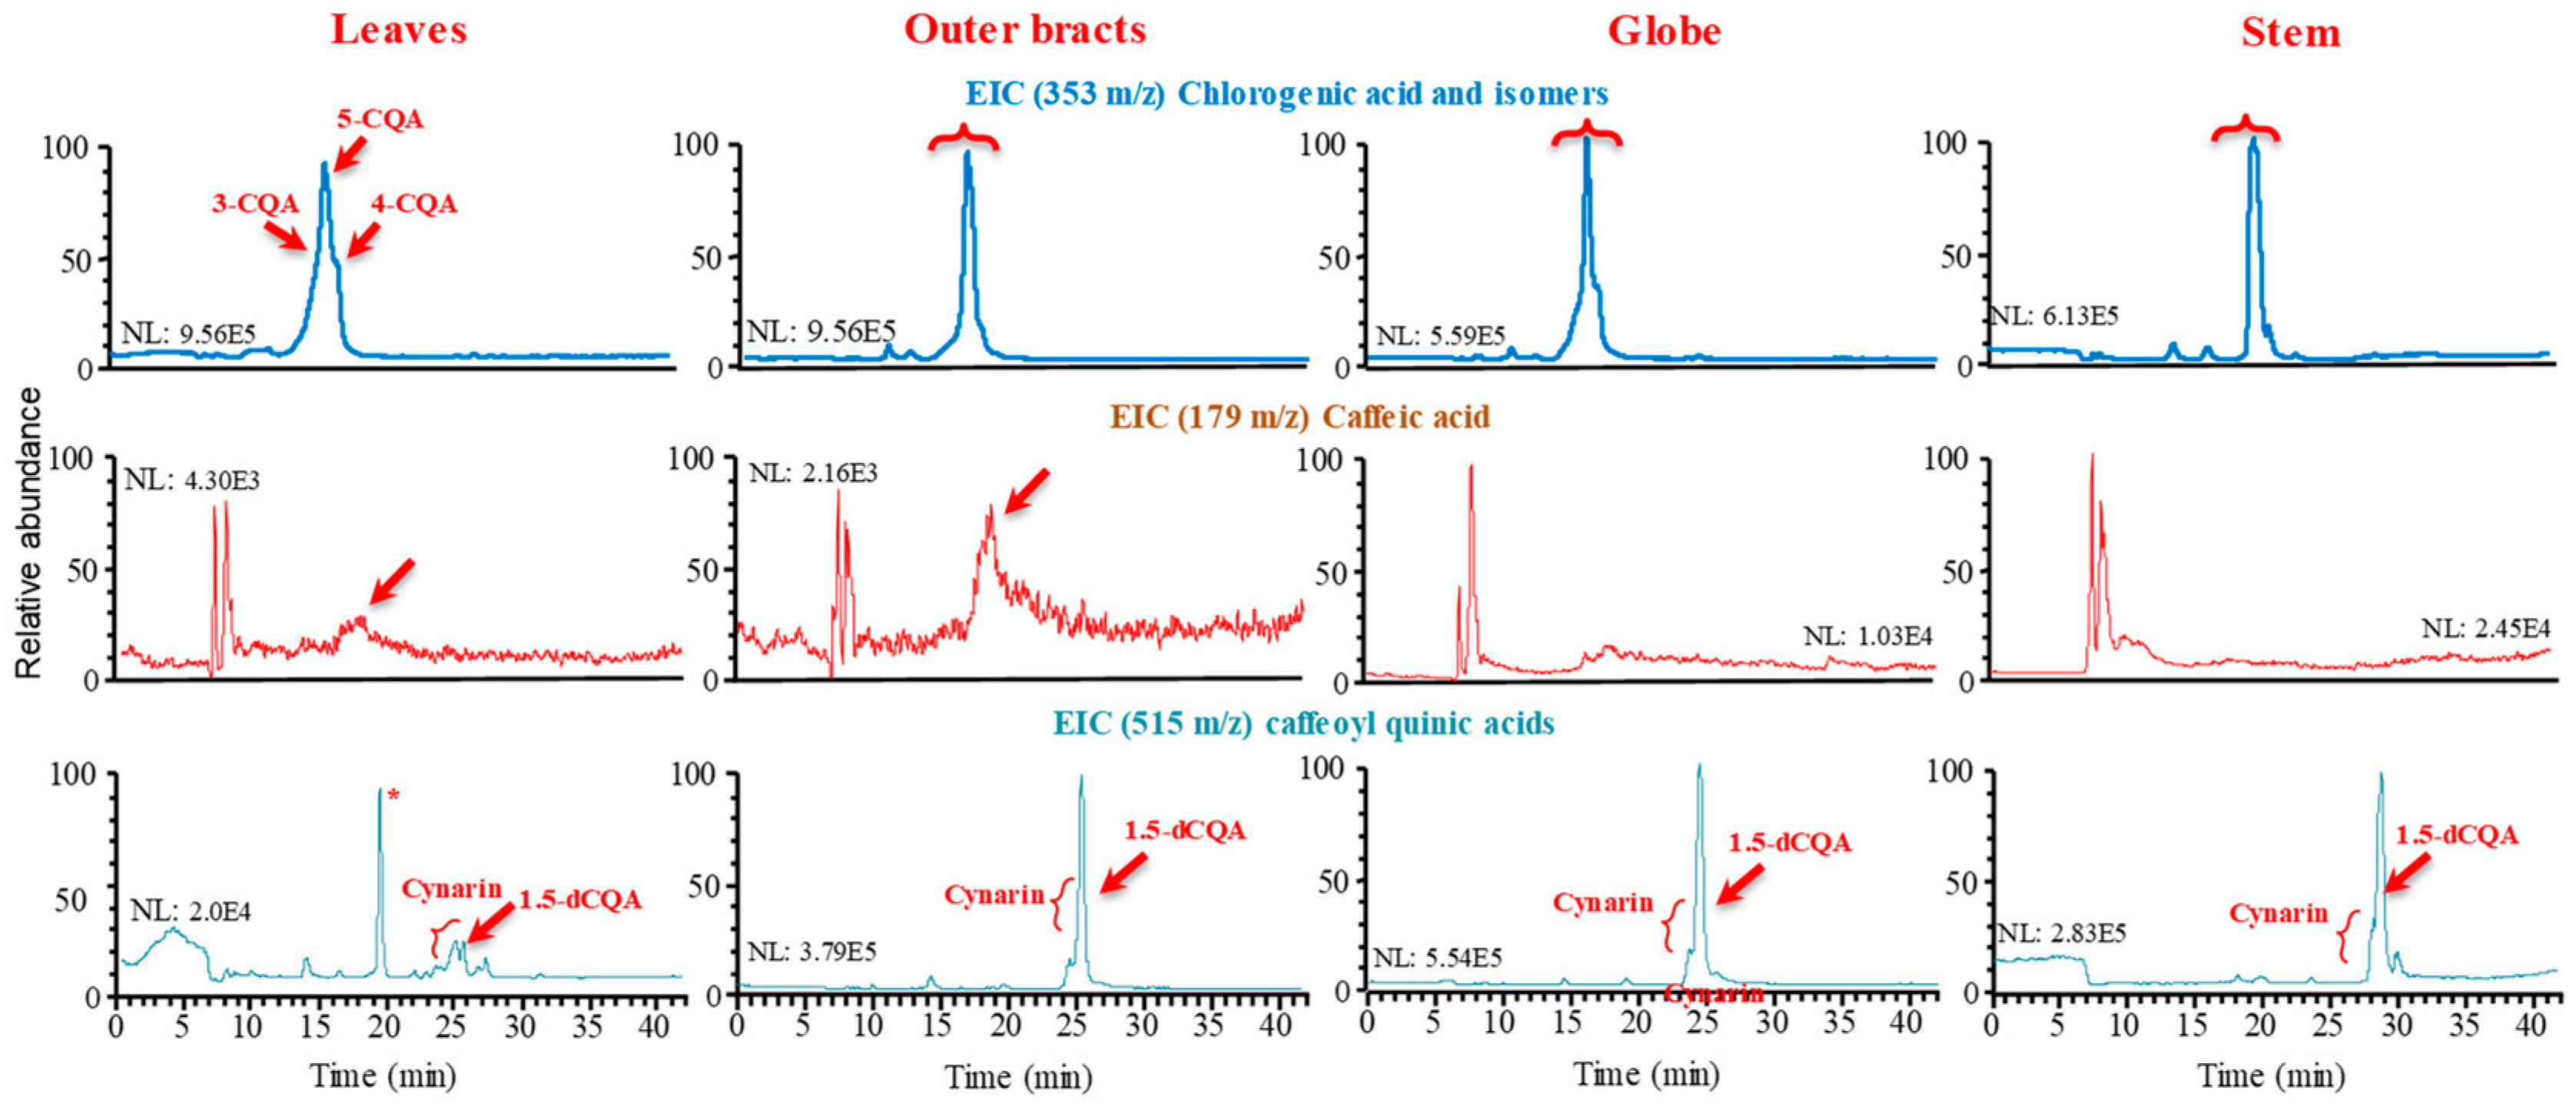
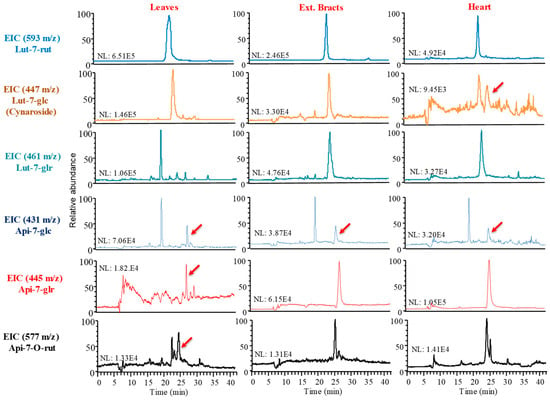
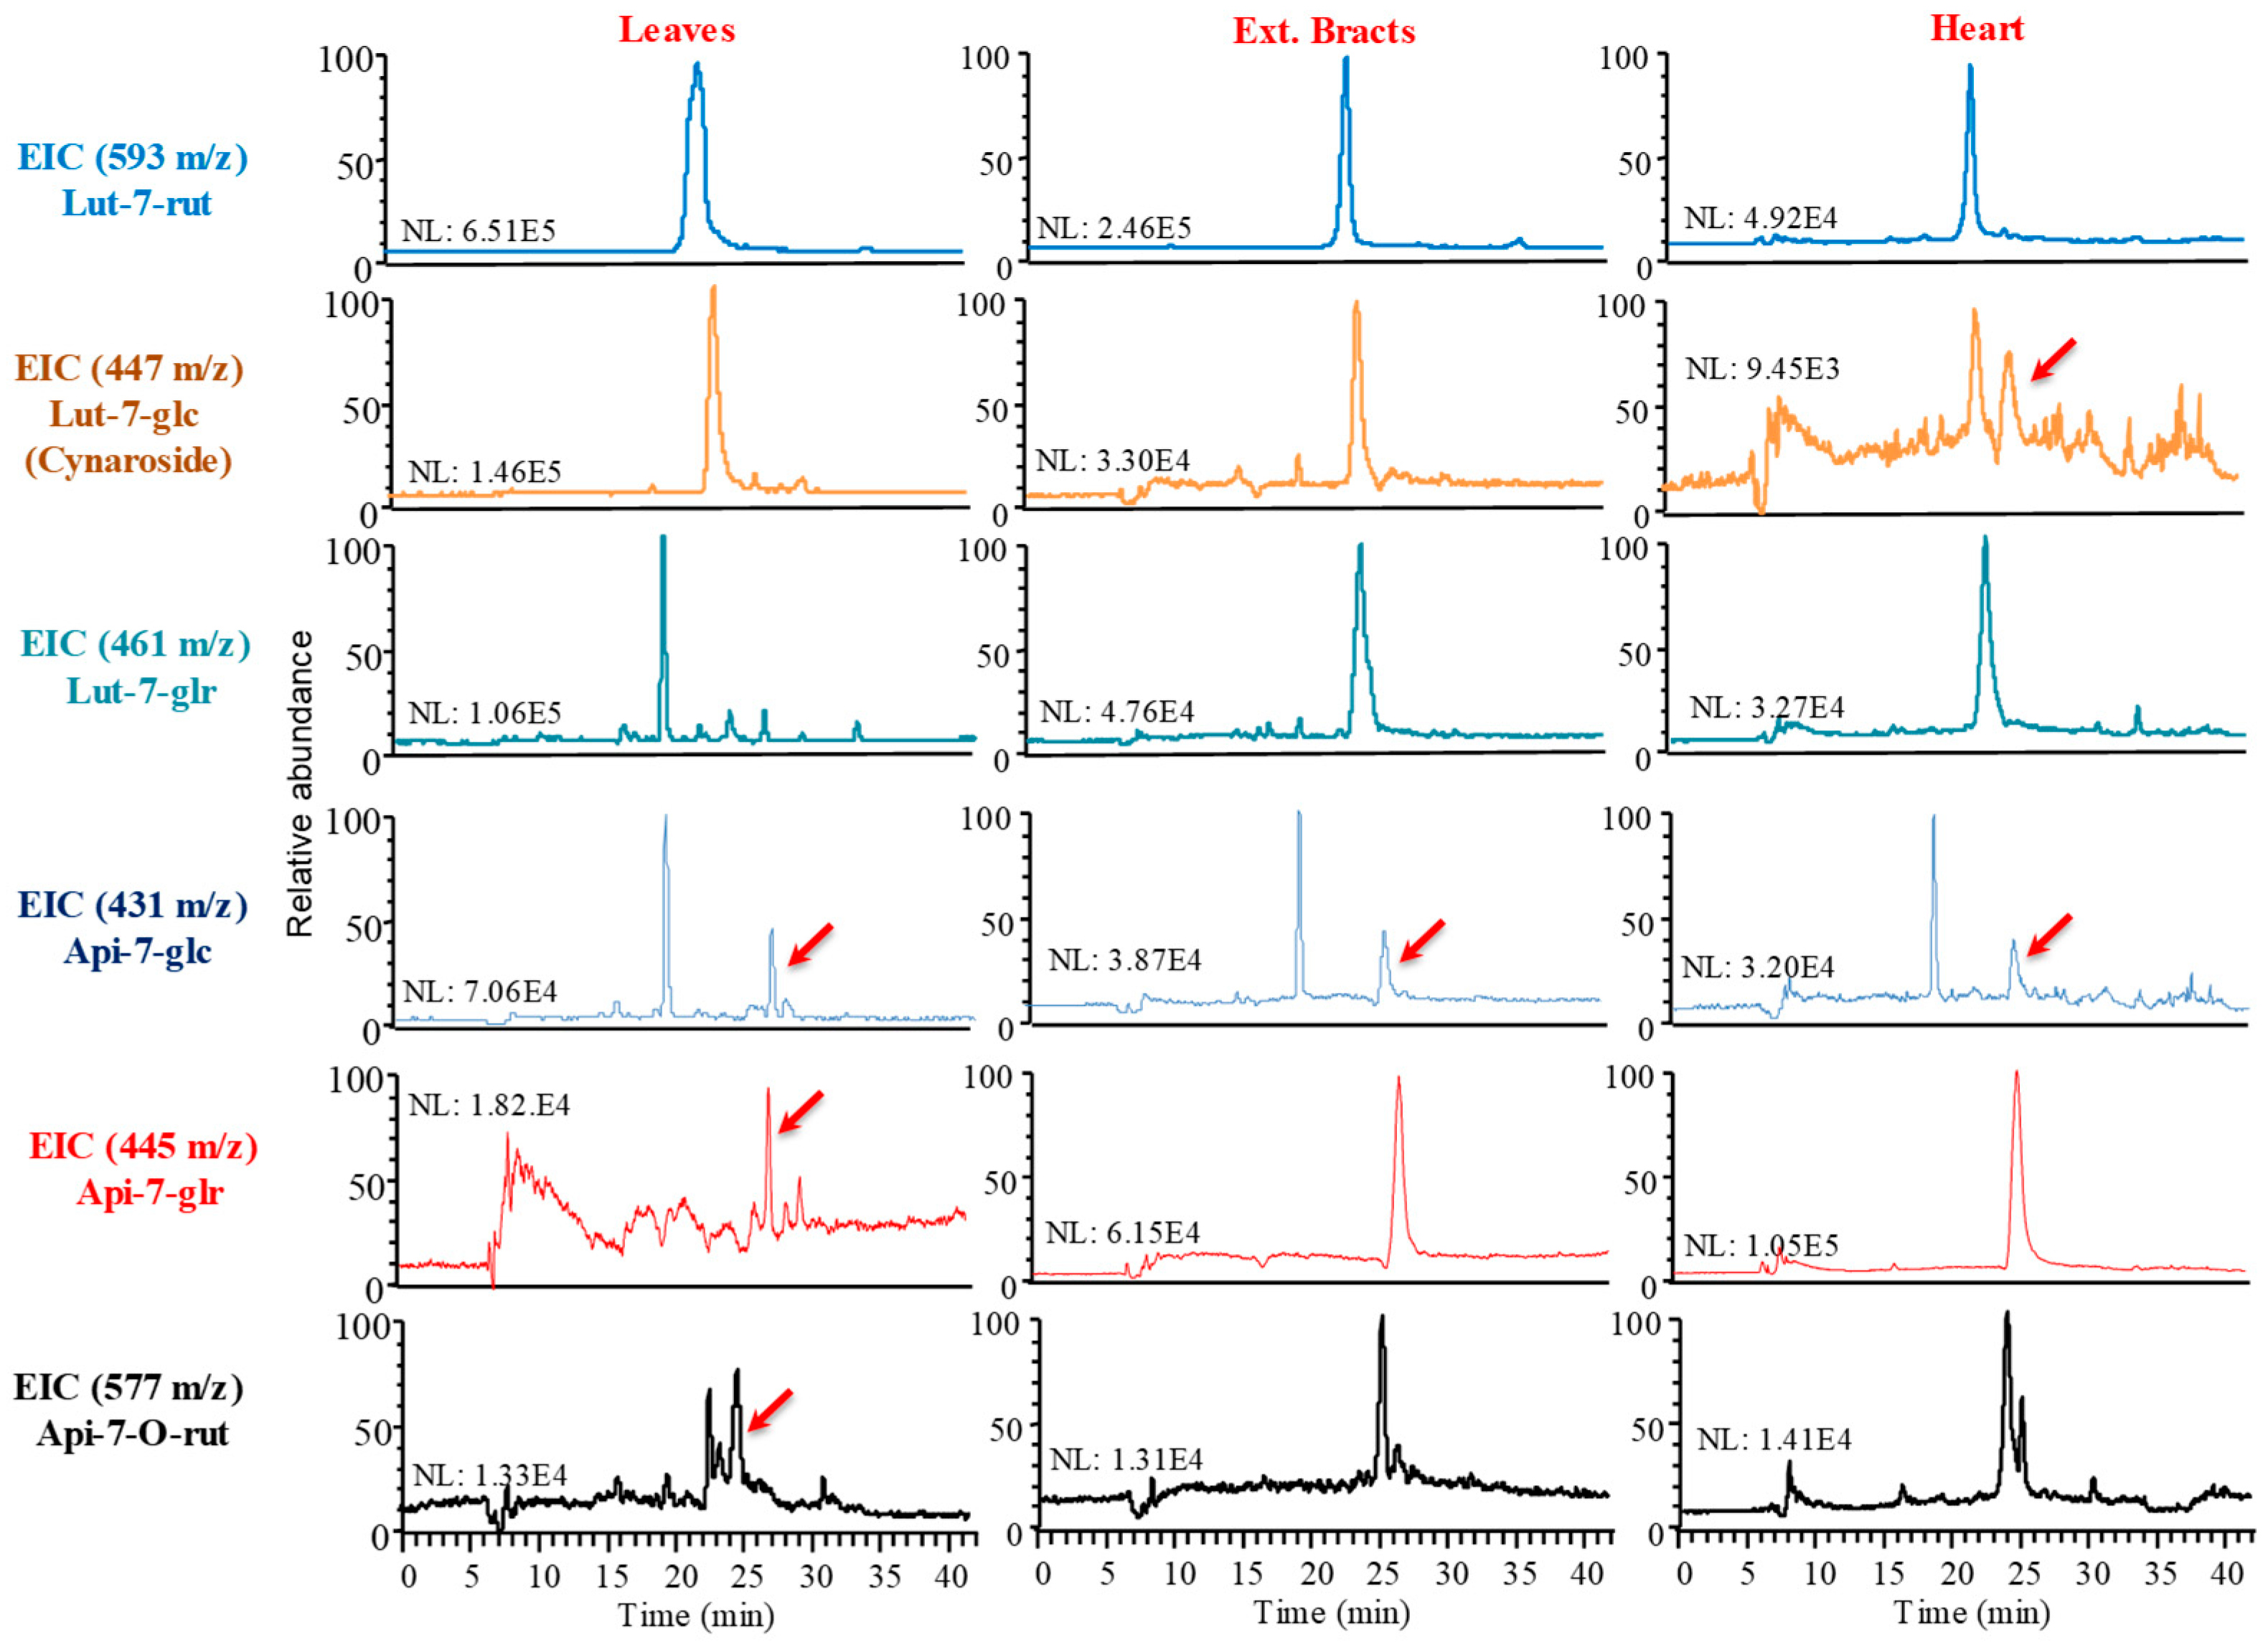

Disclaimer/Publisher’s Note: The statements, opinions and data contained in all publications are solely those of the individual author(s) and contributor(s) and not of MDPI and/or the editor(s). MDPI and/or the editor(s) disclaim responsibility for any injury to people or property resulting from any ideas, methods, instructions or products referred to in the content. |
© 2026 by the authors. Licensee MDPI, Basel, Switzerland. This article is an open access article distributed under the terms and conditions of the Creative Commons Attribution (CC BY) license.