


Abstract
An apixaban (APX) amorphous solid dispersion (ASD) containing hydroxypropyl methylcellulose (HPMC) and D-α-tocopheryl polyethylene glycol 1000 succinate (TPGS) was prepared by spray drying to improve solubility and oral exposure. Screening identified HPMC for supersaturation maintenance and TPGS for apparent solubilization. A central composite design optimized their ratios using five responses: supersaturation solubility, 30-min kinetic solubility, kinetic solubility area under the curve (AUC), particle size, and polydispersity index (PDI). The optimized APX/HPMC/TPGS ratio was 1:3.93:0.85 (w/w/w), with a composite desirability of 0.8491 (on a scale from 0 to 1). Compared with crystalline APX, the optimized ASD increased supersaturation solubility, 30-min kinetic solubility, and kinetic solubility AUC 4.04-, 5.47-, and 8.10-fold, respectively. The dispersed formulation exhibited a particle size of 203.4 ± 17.3 nm and PDI of 0.246 ± 0.018. PXRD and DSC supported predominantly amorphous APX, while electron microscopy and DLS supported nanosized colloidal particle formation. The optimized ASD also maintained higher kinetic solubility in fasted-state simulated intestinal fluid than crystalline and amorphous APX. In rats, Cmax, AUC0–24, and AUC0–inf increased by 2.46-, 3.04-, and 2.80-fold, respectively, versus crystalline APX.
1. Introduction
Apixaban (APX) is a direct factor Xa inhibitor used for the prevention and treatment of thromboembolic disorders, including stroke prevention in patients with non-valvular atrial fibrillation and the treatment and prevention of venous thromboembolism [1,2]. Despite its established clinical use, APX has low aqueous solubility of approximately 0.028 mg/mL [3], and its absolute oral bioavailability is approximately 50% at doses of up to 10 mg [1,2]. To overcome these limitations, various formulation strategies have been investigated, including amorphous solid dispersions, nanostructured lipid carriers, polymeric nano-aggregates, cyclodextrin-based systems, and pharmaceutical co-crystals [3,4,5,6]. These approaches have improved the solubility, dissolution, permeability, and/or oral bioavailability of APX. However, the relationships among supersaturation maintenance, the onset of liquid–liquid phase separation (LLPS) associated turbidity formation, colloidal dispersion after ASD dissolution, and systemic exposure have not been sufficiently evaluated in an integrated manner.
Amorphous solid dispersions (ASD) are widely used to improve the oral delivery of poorly water-soluble drugs. Conversion of a crystalline drug to a higher-energy amorphous form can generate supersaturation during dissolution, while an appropriate polymeric matrix can inhibit precipitation and recrystallization and thereby prolong the supersaturated state [7,8]. However, generation of supersaturation alone does not necessarily ensure improved formulation performance. The supersaturated state must be maintained during the intestinal absorption process to support drug absorption, and drug-rich or colloidal species formed during aqueous dispersion may also contribute to the apparent solubilization and dissolution behavior of ASDs [9,10,11]. Thus, for APX formulations, precipitation inhibition and dispersion stabilization are important in addition to increasing the initial apparent solubility.
The selection of polymer and surfactant is therefore an important aspect of formulation design. Hydroxypropyl methylcellulose (HPMC) can inhibit drug precipitation and crystal growth and thereby prolong supersaturation [12,13], whereas D-α-tocopheryl polyethylene glycol 1000 succinate (TPGS) can improve wetting, micellar solubilization, and dispersion [14,15,16]. Furthermore, APX is a substrate of P-glycoprotein (P-gp), an efflux transporter that may influence its intestinal absorption [1,2]. Previous studies have demonstrated that TPGS can inhibit P-gp-mediated drug efflux, suggesting an additional potential benefit for the oral delivery of P-gp substrates [17]. Considering these complementary functions, the combination of HPMC and TPGS may provide a formulation strategy capable of supporting both supersaturation maintenance and colloidal stabilization. In this study, an HPMC/TPGS-based ASD system was investigated to improve apparent solubilization while maintaining supersaturation and colloidal stability.
Accordingly, polymers and surfactants were screened for their effects on APX apparent solubilization, LLPS-associated turbidity formation, and solvent-shift-induced supersaturation behavior. Based on the screening results, HPMC and TPGS were selected, and their ratios were optimized using a central composite design. The optimized formulation was characterized by Powder X-ray diffraction (PXRD), Differential scanning calorimetry (DSC), Scanning Electron Microscope (SEM), and Transmission Electron Microscope (TEM), and the kinetic solubility of APX was evaluated in fasted-state simulated intestinal fluid (FaSSIF). Finally, oral pharmacokinetic performance was evaluated in rats using crystalline APX powder as the reference.
2. Results
2.1. Screening of Polymers and Surfactants for Apparent Solubilization and Supersaturation Maintenance
For the polymer and surfactant screening studies, blank FaSSIF buffer (pH 6.5), which does not contain bile salts or phospholipids, was used as the test medium to independently evaluate the effects of the added polymers and surfactants [18,19,20]. Under these conditions, apparent solubilization, LLPS-associated turbidity onset, and supersaturation maintenance were evaluated. The polymers and surfactants were selected based on their physicochemical characteristics and previously reported functions in improving the solubility and supersaturation maintenance of poorly water-soluble drugs. The polymers included hydrophilic and pH-dependent materials with potential precipitation-inhibiting and crystal-growth-suppressing properties [12,13,21], whereas the surfactants were selected based on their potential to enhance wetting, micellar solubilization, and drug dispersion [14,15,16]. This screening strategy aimed to identify excipients capable of improving APX apparent solubilization and maintaining supersaturation rather than maximizing initial solubility alone.
Preliminary solvent-shift experiments were conducted in blank FaSSIF containing the tested polymers to establish an appropriate APX loading for evaluating supersaturation maintenance. Initially, 5 mg of APX was introduced into the polymer-containing solutions using a 25 mg/mL APX stock solution; however, no appreciable decrease in APX concentration was observed over approximately 36 h. Therefore, a higher drug loading was considered necessary to better differentiate the supersaturation-maintaining performance of the tested formulations. Considering the equilibrium solubility of crystalline APX in blank FaSSIF (27.75 ± 1.73 μg/mL), the APX amount was increased to 10 mg using a 50 mg/mL stock solution. At a medium volume of 30 mL, this corresponded to a nominal APX concentration of 333.3 μg/mL, approximately 12-fold higher than the equilibrium solubility of crystalline APX.
The effects of surfactants and polymers on APX solubilization are shown in Figure 1. Among the surfactants tested, TPGS produced the highest APX concentration, followed by Tween 80. The other surfactants also increased the APX concentration, although to a lesser extent (Figure 1A). Based on these results, TPGS was selected as the surfactant for subsequent ASD formulation studies.
Figure 1.
Apparent solubility of Apixaban in various surfactant and polymer solutions. (A) Effect of surfactants. (B) Effect of polymers on crystalline and amorphous Apixaban.
Polymer screening was performed using both crystalline and amorphous APX to evaluate the ability of each polymer to maintain the apparent drug concentration. As shown in Figure 1B, amorphous APX generally exhibited higher apparent solubility than the crystalline form. Among the polymers tested, HPMCAS and HPMC produced the highest APX concentrations, with the difference being particularly pronounced for amorphous APX. Based on these results, HPMCAS and HPMC were selected for further evaluation of supersaturation maintenance and precipitation inhibition using LLPS-associated turbidity and solvent-shift precipitation studies [9,10,12,21].
LLPS-associated turbidity was evaluated by stepwise addition of a 50 mg/mL APX stock solution to blank FaSSIF containing 0.05% (w/v) of each polymer, followed by measurement of absorbance at 500 nm after each addition. At low APX concentrations, the absorbance remained nearly constant but increased sharply once a formulation-dependent threshold concentration was reached. This threshold was defined as the LLPS onset concentration (Figure 2), consistent with the use of turbidity changes to identify drug-rich phase formation in supersaturated systems [10,11]. All tested polymers shifted the turbidity onset toward higher APX concentrations compared with the polymer-free control, with the largest shifts observed for HPMC and HPMCAS. Under the tested conditions, HPMC and HPMCAS therefore showed the greatest ability to delay LLPS-associated turbidity formation, consistent with the reported role of polymeric excipients in suppressing precipitation and phase separation from supersaturated drug solutions [12,21].
Figure 2.
Effect of polymers on the LLPS onset concentration of Apixaban.
The ability of the selected polymers to maintain APX supersaturation was further compared using solvent-shift experiments. In the polymer-free control, the APX concentration decreased rapidly after supersaturation was generated and remained at a low level thereafter (Figure 3A). HPMC showed the most pronounced “parachute” effect, with the initial APX concentration reaching approximately 340 μg/mL followed by a gradual decline over 24 h. HPMCAS also prolonged the supersaturated state relative to the polymer-free control, although the decrease in APX concentration was faster than that observed with HPMC. The other polymers showed comparatively weaker effects. This behavior is consistent with the reported ability of hydrophilic polymers, including HPMC, to inhibit drug precipitation and crystal growth from supersaturated solutions [12,13]. HPMC was therefore selected as the polymer for subsequent ASD development.
Figure 3.
Polymer-dependent solvent-shift precipitation behavior of Apixaban in blank FaSSIF. (A) Effect of different polymers on Apixaban supersaturation maintenance. (B) Effect of HPMC ratio on solvent-shift-induced supersaturation and precipitation behavior over 24 h. Data are expressed as mean ± SD.
The effect of HPMC content was then evaluated over an APX:HPMC ratio range of 1:1 to 1:5 (w/w). Initial APX concentrations were similar across all tested ratios, whereas the subsequent decline became progressively slower as the HPMC content increased (Figure 3B). Ratios of 1:3 or higher maintained relatively high APX concentrations after 24 h, while increasing the HPMC ratio from 1:3 to 1:5 provided little additional benefit. The supersaturation-maintaining effect of HPMC therefore appeared to approach a plateau at approximately an APX:HPMC ratio of 1:3. Because further increases in HPMC content would increase the total formulation mass without a clear additional improvement in supersaturation maintenance, an APX:HPMC ratio of approximately 1:3 was selected as the central HPMC level for subsequent CCD optimization.
The effect of surfactants on the HPMC-mediated supersaturated state was subsequently evaluated. In the solvent-shift study, TPGS maintained higher APX concentrations over 24 h than Tween 80 and Labrasol®, whereas the Tween 80- and Labrasol®-containing systems showed a more rapid decline after the initial supersaturated state was generated (Figure 4A).
Figure 4.
Surfactant-dependent solvent-shift precipitation behavior of Apixaban in HPMC-containing blank FaSSIF. (A) Effect of different surfactants on Apixaban supersaturation maintenance. (B) Effect of TPGS ratio relative to Apixaban in the presence of a fixed HPMC ratio. Data are expressed as mean ± SD.
The effect of TPGS content was then evaluated to define a suitable range for formulation optimization. As shown in Figure 4B, supersaturation was maintained over the 24 h test period at all TPGS ratios. However, increasing the TPGS ratio did not produce a proportional increase in the concentration–time profiles. APX:TPGS ratios of 1:0.1 and 1:0.5 maintained relatively high APX concentrations during the early-to-intermediate period, whereas the differences among the tested groups became smaller at 24 h. Thus, increasing the TPGS content beyond a certain level provided limited additional benefit for maintaining APX supersaturation over the full test period.
This non-linear response was considered in the subsequent formulation design. TPGS can promote drug solubilization and dispersion through its surfactant and micelle-forming properties; however, increasing the surfactant concentration does not necessarily result in a proportional improvement in supersaturation maintenance [14,15,16]. At higher TPGS levels, greater partitioning of APX into micellar or colloidal domains may alter the balance between apparent solubilization and the freely dissolved supersaturated drug fraction. Accordingly, TPGS was included as an independent formulation variable in the CCD rather than being simply maximized.
Overall, TPGS provided a more favorable balance between initial APX solubilization and supersaturation maintenance than Tween 80 or Labrasol®. Its performance in the presence of HPMC further supported the selection of the HPMC–TPGS combination for ASD development. HPMC and TPGS were therefore selected as the two formulation variables for subsequent DOE-based optimization.
2.2. Optimization of APX ASD Composition Using Central Composite Design
2.2.1. Response Surface Optimization of HPMC and TPGS Ratios
The effects of HPMC and TPGS ratios on the supersaturation and colloidal properties of apixaban ASDs were evaluated using a central composite design (CCD). The HPMC and TPGS ratios were selected as independent formulation variables (X), while supersaturation solubility, kinetic solubility at 30 min, kinetic solubility area under the curve (AUC), particle size, and polydispersity index (PDI) were selected as the five response variables (Y). The experimental design matrix and the observed response values are summarized in Table 1. All APX-ASD formulations prepared for the CCD experiments exhibited spray-drying yields of approximately 40–50% and drug contents ranging from 97% to 102% of the theoretical values.
Table 1.
Central composite design matrix and experimental responses for optimization of HPMC/TPGS-based Apixaban ASDs.
The three solubility-related responses were used to assess the extent and maintenance of APX supersaturation, whereas particle size and PDI were used to characterize the size and uniformity of the colloidal dispersion formed after aqueous dispersion. CCD-based response surface methodology was applied to evaluate the linear, quadratic, and interaction effects of formulation variables to be evaluated with a limited number of experimental runs [22,23].
The CCD included factorial, axial, and center points, with HPMC ratios ranging from 1.585786 to 4.414214 and TPGS ratios ranging from 0.155025 to 1.144975. Across this design space, supersaturation solubility ranged from 77.89 to 139.84 μg/mL, kinetic solubility at 30 min from 57.68 to 324.35 μg/mL, and kinetic solubility AUC from 21,019.39 to 107,884.20 μg·min/mL. Particle size and PDI ranged from 105.8 to 629.7 nm and from 0.290 to 0.674, respectively, demonstrating substantial formulation-dependent variations in all five responses.
The CCD results revealed distinct and partly opposing effects of HPMC and TPGS on ASD performance. Increasing the TPGS ratio generally enhanced supersaturation solubility while reducing particle size and PDI, consistent with its surfactant-mediated solubilization and dispersion properties [14,15,16]. However, higher TPGS levels did not consistently improve kinetic solubility at 30 min or kinetic solubility AUC. In contrast, increasing the HPMC ratio generally improved kinetic solubility maintenance, consistent with its reported ability to inhibit drug precipitation and crystal growth [12,13], but was accompanied by an increase in particle size. These findings indicated a trade-off between supersaturation maintenance and colloidal dispersion properties, emphasizing the need to balance the HPMC and TPGS ratios rather than maximize either excipient independently.
Second-order polynomial equations were subsequently fitted to the five responses to quantify the effects of HPMC and TPGS and support multi-response formulation optimization [22,23].
2.2.2. Model Fitting and Statistical Adequacy
Each response was described using a second-order polynomial equation in uncoded units to evaluate the linear, quadratic, and interaction effects of the HPMC and TPGS ratios and to provide a basis for subsequent response surface optimization.
All five regression models were statistically significant, with R2 values exceeding 92%, indicating that the models explained a substantial proportion of the observed variability within the investigated design space. The adjusted R2 values also remained high indicating that the selected formulation factors explained a substantial proportion of the observed variability after accounting for the number of model terms.
Among the five responses, the particle size model exhibited the highest goodness of fit, with an R2 of 95.38% and an adjusted R2 of 92.07%. The models for supersaturation solubility, kinetic solubility at 30 min, kinetic solubility AUC, and PDI also demonstrated high coefficients of determination, supporting their ability to describe the major response trends.
However, lack-of-fit analysis revealed differences in model adequacy. Lack-of-fit was not statistically significant for supersaturation solubility, particle size, and PDI, whereas significant lack-of-fit was observed for kinetic solubility at 30 min and kinetic solubility AUC. Therefore, the latter two models were interpreted primarily as tools for identifying formulation trends rather than for precise quantitative prediction. Experimental validation of the optimized formulation was subsequently performed to assess the agreement between predicted and observed responses.
Overall, the statistical analyses supported the use of CCD-based response surface methodology to identify a formulation region balancing solubility-related performance and colloidal dispersion properties, while recognizing the predictive limitations associated with significant lack-of-fit in the kinetic solubility models [22,23].
2.2.3. Effects of HPMC and TPGS on Solubility-Related Responses
The effects of HPMC and TPGS ratios on the supersaturation solubility of APX ASDs were described by the following quadratic equation:
The model statistics are summarized in Table 2. The quadratic model showed an R2 of 92.02% and an adjusted R2 of 86.33%, with a significant overall regression (F = 16.15, p = 0.001) and a non-significant lack-of-fit (F = 1.47, p = 0.350).
Table 2.
Analysis of variance for the fitted quadratic model of supersaturation solubility of APX ASDs.
ANOVA showed a significant contribution of the linear terms (F = 38.47, p < 0.001), whereas the quadratic terms and HPMC × TPGS interaction were not statistically significant. Among the individual factors, TPGS showed the strongest effect on supersaturation solubility (F = 74.46, p < 0.001), while the linear contribution of HPMC was smaller and not statistically significant (F = 2.48, p = 0.159).
The graphical analysis results supported these findings. In the standardized Pareto chart (Figure 5A), only TPGS exceeded the significance threshold, while the interaction plot (Figure 5B) indicated that supersaturation solubility increased as the TPGS ratio rose. The contour and response surface plots (Figure 5C,D) revealed that the highest solubility was achieved when the TPGS level was high and the HPMC concentration was in the medium-to-high range. Taken together, these results demonstrate that within the studied design space, TPGS was the dominant factor influencing supersaturation solubility.
Figure 5.
Effects of HPMC and TPGS ratios on the supersaturation solubility (μg/mL) of APX ASDs. (A) Standardized Pareto chart, (B) interaction plot, (C) contour plot, and (D) response surface plot.
The effect on kinetic solubility at 30 min was described by the following quadratic equation:
The fitted quadratic model showed an R2 of 93.02% and an adjusted R2 of 88.03%, with a significant overall regression (F = 18.64, p = 0.001; Table 3).
Table 3.
Analysis of variance for the fitted quadratic model of kinetic solubility at 30 min of APX ASDs.
ANOVA showed significant contributions from both the linear factor group (F = 29.75, p < 0.001) and the quadratic terms (F = 15.31, p = 0.003), indicating the presence of both linear and nonlinear effects. HPMC exhibited the strongest linear contribution (F = 58.68, p < 0.001), whereas the linear effect of TPGS was not significant (F = 0.82, p = 0.395). The HPMC2 and TPGS2 terms were both significant, with p-values of 0.015 and 0.002, respectively, indicating significant nonlinear effects of both formulation variables.
However, significant lack-of-fit was observed (F = 10.27, p = 0.024), indicating limitations in the model’s predictive accuracy. Therefore, the model was used primarily to characterize formulation trends, and the optimized formulation was subsequently evaluated through experimental validation.
The standardized Pareto chart identified HPMC as the dominant factor affecting kinetic solubility at 30 min (Figure 6A). The interaction plot showed that kinetic solubility increased with increasing HPMC ratios, particularly at low-to-intermediate TPGS levels, before approaching a plateau or decreasing slightly at higher HPMC ratios (Figure 6B). TPGS exhibited a nonlinear response, with kinetic solubility increasing at intermediate levels but decreasing at the highest level. Accordingly, the contour and response surface plots identified the highest-response region at high HPMC and intermediate TPGS levels (Figure 6C,D). These findings indicate that an appropriate balance between HPMC and TPGS was required to maximize early kinetic solubility.
Figure 6.
Effects of HPMC and TPGS ratios on the kinetic solubility at 30 min (μg/mL) of APX ASDs. (A) Standardized Pareto chart, (B) interaction plot, (C) contour plot, and (D) response surface plot.
The kinetic solubility AUC was described by the following quadratic equation:
The fitted quadratic model showed an S value of 9833.87, an R2 of 93.01%, and an adjusted R2 of 88.02%, with a significant overall regression (F = 18.64, p = 0.001; Table 4).
Table 4.
Analysis of variance for the fitted quadratic model of kinetic solubility AUC of APX ASDs.
Kinetic solubility AUC was used to assess the overall maintenance of APX supersaturation throughout the test period. The linear factor group was significant (F = 29.24, p < 0.001), with HPMC showing the strongest individual linear effect (F = 57.65, p < 0.001). In contrast, the linear contribution of TPGS was not significant (F = 0.83, p = 0.392).
The quadratic terms were also significant (F = 15.51, p = 0.003). Both HPMC2 and TPGS2 reached statistical significance, with p-values of 0.009 and 0.002, respectively, indicating nonlinear effects of both formulation variables. The HPMC × TPGS interaction showed a marginal but non-significant effect (F = 3.70, p = 0.096).
Significant lack-of-fit was observed (F = 9.60, p = 0.027), indicating limitations in the model’s predictive accuracy. Accordingly, the model was used primarily to identify formulation trends, with subsequent experimental validation of the optimized ASD.
The standardized Pareto chart identified HPMC as the most influential factor affecting kinetic solubility AUC (Figure 7A). The interaction plot showed that AUC generally increased with increasing HPMC ratios before declining slightly at the upper end of the investigated range (Figure 7B). In contrast, TPGS exhibited a nonlinear response, with higher AUC values at intermediate TPGS levels. The contour and response surface plots consequently located the highest-AUC region at high HPMC and intermediate TPGS levels (Figure 7C,D). Overall, these findings indicate that HPMC was the primary factor influencing kinetic solubility AUC, whereas intermediate TPGS levels were more favorable than the highest tested level.
Figure 7.
Effects of HPMC and TPGS ratios on the kinetic solubility AUC (μg·min/mL) of APX ASDs. (A) Standardized Pareto chart, (B) interaction plot, (C) contour plot, and (D) response surface plot.
2.2.4. Effects of HPMC and TPGS on Particle Characteristics
The particle size response was described by the following quadratic equation:
The model results are presented in Table 5. The particle size model exhibited an S value of 41.4046, an R2 of 95.38%, and an adjusted R2 of 92.07%. The overall regression was highly significant (F = 28.88, p < 0.001), with a non-significant lack-of-fit (F = 3.87, p = 0.112), supporting model adequacy within the investigated design space.
Table 5.
Analysis of variance for the fitted quadratic model of particle size of APX ASDs.
The linear factor group was highly significant (F = 65.67, p < 0.001), with TPGS showing the largest individual effect (F = 108.93, p < 0.001). HPMC also exerted a significant influence (F = 22.40, p = 0.002), but in the opposite direction to TPGS. The quadratic terms were significant as a group (F = 6.11, p = 0.029), mainly because of the TPGS2 term (F = 6.17, p = 0.042). The HPMC × TPGS interaction was not significant (F = 0.84, p = 0.390).
The graphical analyses were consistent with the ANOVA results. In the standardized Pareto chart, TPGS was the most influential factor, followed by HPMC (Figure 8A). The interaction plot showed a marked decrease in particle size with increasing TPGS, whereas higher HPMC ratios increased particle size (Figure 8B).
Figure 8.
Effects of HPMC and TPGS ratios on the particle size (nm) of APX ASDs. (A) Standardized Pareto chart, (B) interaction plot, (C) contour plot, and (D) response surface plot.
The contour and response surface plots located the smallest particle size region at low HPMC and high TPGS levels, whereas the largest particles occurred at high HPMC and low TPGS levels (Figure 8C,D). However, the formulation region favoring smaller particles differed from that favoring sustained kinetic solubility, indicating that particle size minimization alone was insufficient for selecting the optimal formulation.
The PDI response was described by the following quadratic equation:
The fitted quadratic model showed an S value of 0.0397199, an R2 of 93.57%, and an adjusted R2 of 88.97%. The overall regression was statistically significant (F = 20.36, p < 0.001), while lack-of-fit was not statistically significant (F = 5.89, p = 0.060; Table 6).
Table 6.
Analysis of variance for the fitted quadratic model of PDI of APX ASDs.
The linear factor group was significant (F = 37.29, p < 0.001), primarily due to the strong linear contribution of TPGS (F = 74.46, p < 0.001). In contrast, the linear effect of HPMC was not significant (F = 0.13, p = 0.733). The quadratic terms were also significant as a group (F = 12.52, p = 0.005), with TPGS2 showing a pronounced nonlinear effect (F = 22.11, p = 0.002).
Consistent with the statistical results, the standardized Pareto chart identified TPGS and TPGS2 as the principal contributors to PDI (Figure 9A). The interaction plot showed a marked decrease in PDI with increasing TPGS ratio, with the lowest values observed at intermediate-to-high TPGS levels (Figure 9B). HPMC exhibited a weaker U-shaped response, with lower PDI values near the middle of the investigated range.
Figure 9.
Effects of HPMC and TPGS ratios on the PDI of APX ASDs. (A) Standardized Pareto chart, (B) interaction plot, (C) contour plot, and (D) response surface plot.
The contour and response surface plots located the lowest PDI region at moderate HPMC and relatively high TPGS levels (Figure 9C,D). In contrast, low TPGS levels resulted in higher PDI values across the HPMC range.
Overall, TPGS exerted the dominant influence on both particle size and PDI, whereas HPMC significantly affected particle size but showed a limited linear contribution to PDI. These findings highlighted the need to balance colloidal dispersion properties with supersaturation-related responses during multi-response optimization.
2.2.5. Multi-Response Optimization and Evaluation of the Optimized ASD
Multi-response optimization was performed to identify a formulation region that simultaneously increased supersaturation solubility, kinetic solubility at 30 min, and kinetic solubility AUC while reducing particle size and PDI. Accordingly, the three solubility-related responses were set to maximize, whereas particle size and PDI were set to minimize [23,24]. Minimizing these two responses was intended to favor smaller and more uniformly distributed colloidal particles. However, no fixed particle size threshold was imposed because previous ASD studies have reported drug-rich colloidal particles with sizes ranging from approximately 80 to 350 nm, and their crystallization behavior depends on formulation composition and drug–polymer interactions [25,26].
The predicted responses, standard errors, 95% confidence intervals (CI), and 95% prediction intervals (PI) at the optimized condition are summarized in Table 7. The optimal HPMC and TPGS ratios relative to APX were predicted to be 3.92852 and 0.85499, respectively, with a composite desirability of 0.8491. The desirability function converts individual responses into dimensionless desirability values and combines them into a single composite score, thereby enabling simultaneous optimization of multiple responses [24].
Table 7.
Comparison of predicted and experimentally observed responses, with 95% confidence intervals (CI) and prediction intervals (PI), for the optimized HPMC/TPGS-based APX ASD.
At the optimized condition, the predicted supersaturation solubility, kinetic solubility at 30 min, kinetic solubility AUC, particle size, and PDI were 128.24 μg/mL, 295.3 μg/mL, 97,371 μg·min/mL, 260.6 nm, and 0.2961, respectively. The corresponding 95% prediction intervals were 109.18–147.30 μg/mL, 212.0–378.6 μg/mL, 70,671–124,071 μg·min/mL, 148.2–373.0 nm, and 0.1882–0.4039, respectively.
An overlaid contour plot was constructed to visualize the region in which the predefined response criteria were simultaneously satisfied (Figure 10). The unshaded area represents the feasible formulation region, whereas the shaded areas indicate factor combinations that failed to satisfy at least one response criterion. The feasible region was located primarily at relatively high HPMC and intermediate-to-high TPGS levels, with the optimized formulation positioned within this region. This result indicated that the selected composition represented a compromise among the five responses rather than the optimum of any individual response.
Figure 10.
Overlaid contour plot for multi-response optimization of the APX ASD formulation. The contour limits were generated using the 95% prediction intervals of the predicted responses at the optimized factor setting. The red dot indicates the optimized formulation (HPMC/APX = 3.92852; TPGS/APX = 0.85499, w/w).
The predicted optimal formulation was subsequently prepared to evaluate the numerical optimization [23,24]. The experimentally observed values were 112.09 ± 2.19 μg/mL for supersaturation solubility, 329.65 ± 4.06 μg/mL for kinetic solubility at 30 min, and 114,265.60 ± 1043.77 μg·min/mL for kinetic solubility AUC, 203.4 ± 17.3 nm for particle size, and 0.246 ± 0.018 for PDI. The optimized ASD exhibited a drug content of 101.0 ± 1.1% of the theoretical value and a spray-drying yield of 46.45%.
Compared with the predicted mean values, the experimentally observed kinetic solubility at 30 min and kinetic solubility AUC were higher, whereas supersaturation solubility, particle size, and PDI were lower. Although the observed mean values of all five responses fell within their corresponding 95% PI, deviations from the predicted means were observed. The observed mean values of kinetic solubility at 30 min and PDI were within the corresponding 95% CI for the predicted mean responses, whereas those of supersaturation solubility, kinetic solubility AUC, and particle size were outside their respective 95% CI. However, direct comparison of observed means with the model-based 95% CI does not constitute a formal statistical test of agreement. Furthermore, statistically significant lack-of-fit was observed for both kinetic solubility models, indicating limitations in their quantitative predictive accuracy. Therefore, these findings support the selection of the optimized formulation but do not establish precise predictive agreement across all five responses.
To further evaluate the improvement achieved by formulation optimization, the solubility-related responses of the optimized ASD were compared with those of crystalline APX. Crystalline APX exhibited a supersaturation solubility of 27.75 ± 1.73 μg/mL, kinetic solubility at 30 min of 60.23 ± 5.81 μg/mL, and kinetic solubility AUC of 14,112.46 ± 951.79 μg·min/mL. Compared with crystalline APX, the optimized ASD exhibited 4.04-, 5.47-, and 8.10-fold increases in these responses, respectively. These findings demonstrate improvements in the measured solubility-related performance of APX following formulation optimization. A direct comparison of particle size and PDI was not performed because corresponding colloidal particle size and PDI data were not available for crystalline APX.
Overall, the multi-response optimization and experimental evaluation supported the selection of an APX ASD containing HPMC and TPGS at weight ratios of approximately 3.93 and 0.85 relative to APX, respectively, as a promising formulation candidate. However, the significant lack-of-fit observed for the kinetic solubility models and the absence of independent manufacturing batch validation warrant cautious interpretation of the quantitative optimization results.
2.3. Characterization and Biorelevant Performance of the Optimized ASD
2.3.1. Solid-State and Morphological Characterization of the Optimized ASD
The solid-state and morphological properties were further evaluated by PXRD, DSC, and SEM to determine whether the optimized composition had been successfully converted into an amorphous solid dispersion. PXRD and DSC are complementary techniques commonly used to assess residual crystallinity and thermal transitions in ASD systems [27,28]. The PXRD and DSC profiles of all ASD formulations prepared during the screening and optimization studies (Runs 1–13) are presented in Figures S1 and S2, respectively, while the corresponding SEM images are shown in Figure S3.
Crystalline APX exhibited characteristic sharp diffraction peaks in the PXRD pattern, confirming its crystalline nature. These characteristic peaks were retained in the physical mixture, indicating that simple blending did not alter the crystalline state of APX (Figure 11A). In contrast, no distinct diffraction peaks attributable to crystalline APX were observed in the optimized ASD. The DSC thermogram showed a consistent pattern (Figure 11B). Crystalline APX exhibited a distinct melting endotherm corresponding to its melting point, whereas this thermal event was absent in the optimized ASD. The disappearance of the characteristic APX melting endotherm, together with the absence of detectable crystalline diffraction peaks, supports the predominantly amorphous nature of APX in the optimized ASD rather than the presence of a simple physical mixture containing crystalline APX [27,28]. However, a distinct glass transition could not be reliably identified in the DSC thermogram of the optimized ASD under the experimental conditions. Therefore, the glass transition temperature (Tg) could not be determined from the present DSC data. Similarly, none of the individual formulations from Runs 1–13 showed the characteristic crystalline APX signals in either PXRD or DSC analysis, suggesting that the prepared ASD formulations were predominantly amorphous (Figures S1 and S2). Collectively, these results support the presence of APX predominantly in an amorphous state within the HPMC/TPGS-based ASD matrix.
Figure 11.
Solid-state characterization of the optimized ASD. (A) PXRD patterns of APX, HPMC 2910, TPGS, physical mixture, and the optimized ASD. (B) DSC thermograms of APX, physical mixture, and the optimized ASD.
SEM analysis further revealed marked morphological changes following formulation. Crystalline APX consisted of irregular particles with well-defined edges (Figure 12A), whereas HPMC displayed its characteristic bulk morphology at low magnification (Figure 12B). In contrast, the optimized ASD consisted predominantly of collapsed or deflated spherical particles that were clearly distinguishable from crystalline APX (Figure 12C). Similar morphologies were observed in the individual formulations from Runs 1–13 (Figure S3). Collapsed or wrinkled spherical particles are commonly observed in spray-dried ASD systems and can arise from rapid solvent evaporation, shell formation, and subsequent particle shrinkage during the drying process [29]. No obvious needle-like or plate-like crystalline structures were observed in the optimized ASD.
Figure 12.
SEM images of crystalline APX, HPMC, and the optimized ASD. (A) Crystalline APX at ×5000 magnification. (B) HPMC at ×1000 magnification. (C) Optimized ASD at ×5000 magnification.
Overall, the PXRD, DSC, and SEM results supported the successful formation of the optimized ASD. The absence of characteristic crystalline APX diffraction peaks, disappearance of the APX melting endotherm, and distinct spray-dried particle morphology collectively confirmed substantial loss of APX crystallinity within the optimized HPMC/TPGS formulation. The PXRD and DSC results provide the primary evidence for the amorphous state, while SEM demonstrates the accompanying morphological changes after formulation [27,28,30].
2.3.2. Transmission Electron Microscope (TEM) Observation of Dispersed Colloidal Particles from the Optimized ASD
TEM analysis was performed to observe the morphology of colloidal particles formed following aqueous dispersion of the optimized ASD. As shown in Figure 13, the TEM images revealed isolated, nearly spherical nanosized particles with relatively smooth surfaces. The observed particles were generally consistent with the nanoscale particle size measured by DLS, supporting the formation of colloidal particles following aqueous dispersion of the optimized HPMC/TPGS-based ASD.
Figure 13.
Representative TEM images of colloidal particles generated after dispersion of the optimized ASD. The images were acquired at a nominal magnification of 22,000×. Scale bars = 200 nm.
Although the TEM images primarily showed individual particles rather than multiple particles within a single field of view, they provided morphological evidence of nanosized colloidal particle formation. The scale bars included in the TEM images allowed direct assessment of particle dimensions. However, because only a limited number of particles were observed, the TEM images were not considered representative of the overall particle size distribution. Therefore, the TEM observations were used as complementary morphological evidence alongside the particle size and PDI measurements obtained by DLS [29].
2.3.3. Biorelevant Kinetic Solubility of the Optimized ASD in FaSSIF
The kinetic solubility behavior of the optimized ASD was further evaluated under biorelevant FaSSIF conditions and compared with those of crystalline and amorphous APX. FaSSIF contains bile salts and lecithin as physiologically relevant surfactant components and is widely used as a biorelevant medium to evaluate the dissolution behavior of poorly water-soluble drugs under simulated fasted intestinal conditions [31,32].
The kinetic solubility profiles of crystalline APX, amorphous APX, and the optimized ASD in FaSSIF at pH 6.5 are shown in Figure 14. Both crystalline and amorphous APX exhibited substantially lower APX concentrations than the optimized ASD throughout the experimental period. Crystalline APX showed a low but relatively stable concentration profile. In contrast, amorphous APX did not exhibit the expected increase in early kinetic solubility. Its concentration was initially lower than that of crystalline APX and gradually increased over time. This behavior was likely associated with poor wettability and pronounced aggregation of the amorphous powder upon direct dispersion in the medium. Thus, the kinetic solubility of spray-dried amorphous APX appeared to be limited primarily by its wetting and dispersion behavior, despite the higher apparent solubility generally associated with the amorphous state [33,34].
Figure 14.
Effect of bile components and solid-state form on the kinetic solubility of APX. Data are expressed as mean ± SD.
The optimized ASD produced markedly higher APX concentrations than both crystalline and amorphous APX in FaSSIF. Following dispersion, the APX concentration rapidly increased to approximately 300 μg/mL during the early phase and remained elevated throughout the experiment, although a gradual decline was observed over time. This behavior is consistent with the complementary roles of HPMC in maintaining supersaturation and TPGS in promoting wetting and dispersion [12,13,14,15,16]. The optimized ASD therefore overcame the poor dispersion behavior observed with amorphous APX powder and provided substantially higher kinetic solubility than the unformulated crystalline and amorphous drug forms. These findings demonstrate improved biorelevant dissolution and supersaturation performance of the optimized HPMC/TPGS-based ASD and provide a basis for its subsequent in vivo evaluation.
2.4. Pharmacokinetics
The pharmacokinetic profiles of crystalline APX powder and the optimized ASD were evaluated following oral administration in rats. The mean plasma concentration–time profiles are presented in Figure 15, and the pharmacokinetic parameters, including AUC0–24, AUC0–inf, Cmax, Tmax, Kel, and t1/2, are summarized in Table 8.
Figure 15.
Mean plasma concentration–time profiles of APX after oral administration of crystalline APX powder and the optimized APX ASD in rats. Data are expressed as mean ± SD (n = 6). * Adjusted p < 0.05 compared with crystalline APX powder.
Table 8.
Pharmacokinetic parameters of APX after oral administration of crystalline APX powder and the optimized APX ASD in rats.
Following oral administration, the optimized ASD produced higher plasma APX concentrations than crystalline APX powder over most of the experimental period. Plasma concentrations increased rapidly during the early absorption phase and reached a higher maximum level with the ASD formulation. At the individual post-dose sampling time points, plasma APX concentrations were significantly higher with the optimized ASD than with crystalline APX powder from 0.25 to 12 h (adjusted p < 0.05), whereas no significant difference was observed between the two groups at 24 h. In contrast, crystalline APX powder maintained relatively lower plasma concentrations throughout the absorption phase under the same dosing conditions.
The increased systemic exposure was also reflected in the pharmacokinetic parameters (Table 8). Cmax was 1030.6 ± 232.3 ng/mL for the optimized ASD and 419.1 ± 115.7 ng/mL for crystalline APX powder, corresponding to an approximately 2.46-fold increase. AUC0–24 increased from 4121.0 ± 1988.4 ng·h/mL for crystalline APX powder to 12,512.5 ± 2023.8 ng·h/mL for the optimized ASD, representing an approximately 3.04-fold increase in systemic exposure. Similarly, AUC0–inf increased from 4877.0 ± 2166.9 to 13,645.7 ± 2326.6 ng·h/mL, corresponding to an approximately 2.80-fold increase in total systemic exposure.
Because Tmax showed considerable interindividual variability in both groups, it was expressed as the median (range). The median Tmax was 1.5 h (0.5–3 h) for crystalline APX powder and 1.25 h (0.25–6 h) for the optimized ASD. Elimination-related pharmacokinetic parameters were comparable between the two groups. Kel values were 0.1281 ± 0.0449 h−1 for the optimized ASD and 0.1331 ± 0.0369 h−1 for crystalline APX powder, while the corresponding apparent half-lives were 6.13 ± 2.60 and 5.52 ± 1.43 h, respectively, with no statistically significant differences. Thus, the optimized ASD primarily increased the peak plasma concentration and extent of systemic APX exposure, whereas Tmax remained variable and the elimination-related parameters were not significantly altered.
The greater oral exposure achieved with the optimized ASD was consistent with its improved in vitro dissolution and supersaturation behavior. In the in vitro studies, the optimized ASD generated higher kinetic solubility and maintained supersaturated APX concentrations more effectively than the unformulated drug forms. The resulting increase in dissolved APX available in the gastrointestinal tract may have contributed to the higher systemic exposure following oral administration. Similar improvements in APX oral exposure have been reported with other solubility-enhancing formulation approaches, including solid dispersions and nanostructured lipid carriers [3,5].
Overall, the optimized ASD significantly enhanced the oral absorption of APX compared with crystalline APX powder, as demonstrated by the increases in Cmax, AUC0–24, and AUC0–inf. The pharmacokinetic improvement was consistent with the enhanced in vitro kinetic solubility and supersaturation maintenance of the formulation, supporting the HPMC/TPGS-based ASD as a promising approach for improving the oral delivery of APX.
3. Discussion
The present study demonstrated that the formulation performance of APX could be improved through the combined use of HPMC and TPGS in an ASD system. Previous APX formulation studies have improved solubility, dissolution, permeability, or oral exposure using solid dispersions, cocrystals, nanostructured lipid carriers, and other solubility-enhancing systems [3,4,5,6,35,36]. The present study extends these approaches by integrating LLPS-associated turbidity, time-dependent supersaturation, colloidal dispersion properties, biorelevant kinetic solubility, and oral pharmacokinetics into a single formulation framework. This approach enabled a more comprehensive evaluation of formulation performance beyond conventional equilibrium solubility and dissolution measurements.
HPMC and TPGS exhibited complementary but partly competing effects on ASD performance. HPMC primarily contributed to kinetic solubility and supersaturation maintenance, consistent with the ability of hydrophilic polymers to inhibit nucleation, crystal growth, and precipitation [12,13,21,37]. In contrast, TPGS predominantly influenced apparent supersaturation solubility, particle size, and PDI, consistent with its surfactant-mediated solubilization and dispersion properties [14,15,16]. However, increasing TPGS did not consistently improve kinetic solubility, indicating that higher surfactant content was not necessarily beneficial for maintaining supersaturation. These findings emphasize the importance of balancing polymer and surfactant ratios rather than maximizing either component independently.
Multi-response optimization identified HPMC and TPGS ratios of approximately 3.93 and 0.85 relative to APX, respectively. Compared with Run 4, which had relatively similar HPMC and TPGS ratios of 4.00 and 1.00, the optimized ASD exhibited lower supersaturation solubility (112.09 vs. 128.68 µg/mL) but higher kinetic solubility at 30 min (329.65 vs. 253.07 µg/mL) and kinetic solubility AUC (114,265.60 vs. 85,440.30 µg·min/mL). These results corresponded to a 12.9% decrease in supersaturation solubility and increases of 30.3% and 33.7% in kinetic solubility at 30 min and kinetic solubility AUC, respectively. The differences may reflect distinct formulation-dependent effects on apparent solubilization and time-dependent supersaturation maintenance, as higher supersaturation solubility does not necessarily correspond to higher kinetic solubility or prolonged maintenance of apparent drug concentrations. Nevertheless, the magnitude of the observed differences cannot be conclusively attributed to the relatively modest changes in HPMC and TPGS ratios alone.
Although all five experimentally observed mean responses fell within their corresponding 95% prediction intervals (PI), deviations from the model-predicted mean values were observed. The observed mean values of kinetic solubility at 30 min and PDI were within the corresponding 95% confidence intervals (CI) for the model-predicted means, whereas those of supersaturation solubility, kinetic solubility AUC, and particle size were outside their respective 95% CI. However, the 95% CI describes uncertainty in the predicted mean response, whereas the 95% PI represents the range expected for an individual observation. Therefore, inclusion of the observed mean values within the 95% PI does not establish precise agreement between the predicted and experimental responses. Furthermore, statistically significant lack-of-fit was observed for both kinetic solubility models, indicating limitations in their quantitative predictive accuracy. Consequently, the CCD models were considered useful for guiding formulation selection, but the observed differences between Run 4 and the optimized ASD could not be conclusively explained by the fitted models.
The optimized ASD was prepared as a single spray-drying batch, from which three separate samples were collected and independently evaluated. Therefore, the reported mean ± SD (n = 3) values represent within-batch experimental replication rather than measurements from three independently manufactured batches. Although the experimental results supported the selection of the optimized formulation, batch-to-batch reproducibility was not established. Further studies using independently prepared batches would be necessary to determine the reproducibility of the observed formulation performance and the differences between Run 4 and the optimized ASD.
PXRD and DSC results supported the predominantly amorphous nature of APX in the optimized ASD, while SEM and TEM revealed changes in particle morphology and the formation of nanosized colloidal particles following aqueous dispersion. These characteristics are consistent with the ability of ASD systems to improve apparent drug solubilization through amorphization and formulation-dependent dispersion behavior [7,8,33,34,37,38]. Although zeta potential provides information on particle surface charge and electrostatic stabilization, it was not measured in the present study because the primary focus was on supersaturation maintenance, LLPS-associated behavior, and colloidal particle characteristics. Previous studies have suggested that LLPS-associated drug-rich phases may influence drug dissolution and intestinal absorption, supporting the relevance of these measurements to ASD performance [10,39]. Furthermore, because HPMC and TPGS are nonionic excipients, steric stabilization may contribute to colloidal dispersion behavior, although this mechanism was not directly investigated. Previous studies have also indicated that zeta potential alone may not adequately predict colloidal stability, particularly in systems containing nonionic stabilizers [40,41]. Nevertheless, the absence of zeta potential and time-dependent particle size measurements represents a limitation of the present study, and further investigations are required to characterize the colloidal stability of the optimized ASD.
The FaSSIF study further demonstrated that amorphization alone did not ensure favorable kinetic solubility. Amorphous APX powder exhibited low early APX concentrations, potentially reflecting insufficient wetting or particle aggregation, whereas the optimized ASD generated and maintained higher apparent APX concentrations. These findings suggest that formulation-dependent dispersion and supersaturation maintenance may have contributed to the improved in vitro performance beyond the effects of amorphization alone [33,34].
The improved formulation was also associated with increased oral APX exposure in rats, with the optimized ASD producing approximately 2.5–3-fold increases in Cmax and AUC compared with crystalline APX powder. Elimination-related pharmacokinetic parameters were not significantly different between the formulations, suggesting that improved systemic exposure was more likely associated with formulation-dependent changes in drug availability during absorption than with altered elimination. However, the individual contributions of supersaturation, colloidal dispersion, and other absorption-related mechanisms were not directly determined. Overall, these findings support the potential of HPMC/TPGS-based ASD formulation optimization as a strategy for improving the oral delivery of poorly water-soluble drugs [8,34,37,38].
4. Materials and Methods
4.1. Materials
Crystalline apixaban (APX) was purchased from Medichem, S.A. (Barcelona, Spain). The amorphous APX reference sample was prepared in-house by spray drying crystalline APX under the same processing conditions used for the ASD formulations, as described in Section 4.4.2. Hypromellose acetate succinate LF and hypromellose 2910 were supplied by Hanmi Pharm. Co., Ltd. (Seoul, Republic of Korea). Methacrylic acid–ethyl acrylate copolymer (1:1), type A, abbreviated as Eudragit® L100-55, was obtained from Evonik (Essen, Germany). Caprylocaproyl macrogolglycerides, abbreviated as Labrasol®, were acquired from Gattefossé (Saint-Priest, France). Polyvinylpyrrolidone–vinyl acetate copolymer, abbreviated as Kollidon® VA64, D-α-tocopherol polyethylene glycol 1000 succinate, abbreviated as Kolliphor® TPGS, polysorbate 80, abbreviated as Kollisolv® TW 80, macrogol 15 hydroxystearate, abbreviated as Solutol® HS 15, Cremophor® RH 40, Cremophor® RH 60, and Cremophor® EL were sourced from BASF (Ludwigshafen, Germany). Polyvinyl alcohol was purchased from Sigma-Aldrich (St. Louis, MO, USA). FaSSIF/FeSSIF/FaSSGF powder was purchased from Biorelevant Ltd. (London, UK). Dichloromethane (DCM), dimethyl sulfoxide (DMSO), Span 80, ethanol (EtOH), and acetonitrile (ACN) were purchased from Daejung Co., Ltd. (Siheung, Republic of Korea). Sodium carboxymethyl cellulose, sodium hydroxide, Sodium phosphate monobasic anhydrous, sodium chloride, hydrochloric acid and pectin (from citrus) were purchased from Duksan Pure Chemicals (Ansan, Republic of Korea). All other chemicals used were of analytical grade.
4.2. High-Performance Liquid Chromatography (HPLC)
APX quantification was carried out using a high-performance liquid chromatography system (1260 series, Agilent Technologies, Santa Clara, CA, USA) equipped with an autosampler, high-pressure gradient pump, UV detector, and an Inertsil ODS analytical column (150 × 4.6 mm, 5 µm). The mobile phase was a mixture of deionized water and acetonitrile (60:40, v/v), delivered at a flow rate of 1.0 mL/min. The injection volume was 30 µL, and analytes were monitored at a wavelength of 280 nm. Chromatographic data were acquired and processed using OpenLab CDS ChemStation software (version C.01.08 [210], Agilent Technologies, Santa Clara, CA, USA) [42].
4.3. In Vitro Screening Studies
4.3.1. Apparent Solubility
Apparent solubility screening was performed under excess-drug conditions. Crystalline APX, amorphous APX, or ASD samples containing an amount equivalent to 10 mg of APX were accurately weighed into 2 mL polypropylene tubes. Then, 1 mL of blank FaSSIF containing each polymer or surfactant was added. Blank FaSSIF without polymer or surfactant was used as the control. Unless otherwise specified, the polymer or surfactant amount was adjusted to a 1:1 (w/w) ratio relative to APX. Surfactant screening was conducted using crystalline APX, whereas polymer screening was conducted using both crystalline and amorphous APX.
The samples were incubated at 37 °C and 100 rpm for 3 days, followed by centrifugation at 15,000 rpm for 15 min at 37 °C. The supernatant was collected, filtered through a 0.2 μm PTFE syringe filter, and diluted with the HPLC mobile phase. The APX concentration in the filtrate was quantified by HPLC and defined as the apparent solubility under each tested condition.
4.3.2. Solvent Shift–Induced Supersaturation and Precipitation Study
Supersaturation and solvent shift-induced precipitation of APX were evaluated in a biorelevant buffer medium. Blank FaSSIF was selected as the dissolution medium to assess the intrinsic effects of added polymers and surfactants without interference from bile salt/phospholipid components present in complete FaSSIF [20]. A stock solution of APX was prepared in DMSO at a concentration of 50 mg/mL and filtered through a 0.22 μm PTFE membrane filter before use. For each experiment, 0.2 mL of the stock solution was rapidly injected into 30 mL of blank FaSSIF buffer (pH 6.5) pre-equilibrated at 37 ± 0.5 °C in a shaking water bath at 100 rpm.
For the initial excipient screening, both polymers and surfactants were evaluated at a drug-to-excipient weight ratio of 1:1 (w/w). Based on the results of this preliminary screening, selected polymers and surfactants were further investigated in subsequent concentration-dependent studies to determine their effects on supersaturation maintenance and precipitation inhibition.
4.3.3. Determination of LLPS Onset by Solvent-Shift Titration and Turbidity
The onset of liquid–liquid phase separation (LLPS) of APX was determined using solvent-shift titration combined with optical turbidity measurements. This approach was used to evaluate supersaturation generation, phase separation, and drug-rich colloidal phase formation in the presence of polymers [9,21,37]. A stock solution of APX was prepared in DMSO at a concentration of 50 mg/mL and filtered through a 0.22 µm PTFE membrane filter before use. The stock solution was added stepwise in 8 µL increments to blank FaSSIF buffer (pH 6.5) containing 0.05% (w/v) polymer under gentle stirring at 37 ± 0.5 °C. This procedure increased the nominal APX concentration in a stepwise manner.
4.4. Experimental Design and Preparation of APX ASDs
4.4.1. CCD-Based Experimental Design for ASD Optimization
Based on the polymer and surfactant screening results, supersaturation behavior and colloidal dispersion properties were selected as the key performance attributes of the APX ASDs. A central composite design (CCD) was used to evaluate the effects of HPMC and TPGS ratios on these responses. CCD was selected because response surface methodology allows the evaluation of linear, quadratic, and interaction effects of formulation variables and can identify an optimized ASD region with a limited number of experimental runs [23,24].
A two-factor rotatable CCD was constructed using the HPMC ratio (X1, low–high: 2–4) and TPGS ratio (X2, low–high: 0.3–1.0) as independent variables, with an axial distance (α) of √2 (approximately 1.414). Both factors were expressed as weight ratios relative to APX. The design consisted of four factorial points, four axial points, and five center points, resulting in 13 experimental runs [43]. The measured responses were supersaturation solubility (Y1, µg/mL), kinetic solubility at 30 min (Y2, µg/mL), kinetic solubility AUC (Y3, µg·min/mL), particle size (Y4, nm), and PDI (Y5). The factor levels and optimization goals for each response are summarized in Table 9.
Table 9.
Factor levels and response goals for the central composite design.
The CCD consisted of 13 experimental runs, including four factorial points, four axial points, and five center points. For each run, ASDs were prepared at the specified HPMC and TPGS ratios under fixed process conditions and then characterized for supersaturation and colloidal dispersion behavior. The experimental design, model fitting, ANOVA, response surface analysis, and desirability-based optimization were performed using Minitab 19® (Minitab LLC, State College, PA, USA). The experimental data were fitted to second-order polynomial models to evaluate the effects of HPMC and TPGS on each response and to identify an optimized ASD region for the APX ASD.
4.4.2. Preparation of Spray-Dried Amorphous APX and APX Amorphous Solid Dispersions
Spray-dried APX ASDs were prepared based on a previously reported spray-drying method for APX formulations, with appropriate modifications [35]. For the preparation of spray-dried amorphous APX, APX alone was dissolved in the same mixed solvent system used for ASD preparation and processed under identical spray-drying conditions. The obtained spray-dried APX powder was used as the amorphous APX reference in the comparative in vitro studies.
Spray-dried APX ASDs were prepared according to the CCD formulation compositions listed in Table 1. In the design matrix, HPMC and TPGS ratios were expressed as weight ratios relative to APX and used to calculate the amount of each excipient for each experimental run. For each CCD run, the amount of APX was fixed at 500 mg, and the corresponding amounts of HPMC and TPGS were determined from the X1 and X2 values in Table 1. The optimized ASD was prepared as a single spray-drying batch, from which three separate samples were collected for experimental evaluation.
APX, HPMC, and TPGS were dissolved in a mixed solvent system composed of 30 mL DCM:EtOH (1:1, v/v) and 30 mL EtOH:water (1:1, v/v). The resulting clear and homogeneous feed solution was passed through a 0.45 μm membrane filter to remove any undissolved particulates before spray drying.
Spray drying was performed using a Yamato ADL311SA spray dryer (Yamato Scientific Co., Ltd., Tokyo, Japan). The operating conditions were as follows: inlet temperature, 90 °C; outlet temperature, 55–60 °C; atomizing air pressure, 0.1 MPa; blower setting, 7; and pump setting, 1. The filtered feed solution was continuously fed into the drying chamber under these conditions until the process was completed. The collected spray-dried powders were stored in a desiccator at room temperature for 24 h and then accurately weighed to determine the spray-drying yield. Subsequently, the powders were gently passed through a 250 μm sieve to break up soft agglomerates before further characterization. The spray-drying yield was calculated as the percentage of the recovered powder mass relative to the total initial mass of APX, HPMC, and TPGS used in the feed solution, according to the following equation:
where Wrecovered is the mass of the recovered spray-dried powder before sieving, and Winitial is the total initial mass of APX, HPMC, and TPGS used in the feed solution.
The amorphous nature of the spray-dried APX and optimized ASD was evaluated by PXRD and DSC, as described in the solid-state characterization sections.
4.4.3. Drug Content of APX-SD
The drug content of APX-SD powder was determined using HPLC. An APX standard stock solution (200 µg/mL) was prepared by dissolving 10 mg of APX in 50 mL of mobile phase. For the test solution, an accurately weighed amount of APX-SD powder equivalent to 10 mg of APX was dissolved in 50 mL of mobile phase, followed by sonication for 10 min. Both solutions were filtered through a 0.45 µm nylon syringe filter and subsequently diluted fivefold with the mobile phase prior to HPLC analysis. The drug content was determined in triplicate (n = 3) and calculated using the following equation:
where Cmeasured is the APX concentration determined by HPLC, and Ctheoretical is the theoretical APX concentration calculated based on the nominal drug content of the APX-SD formulation.
4.5. Morphological Characterization
4.5.1. X-Ray Powder Diffraction
X-ray powder diffraction (PXRD) analysis was performed to evaluate the crystalline or amorphous state of APX in crystalline APX powder, amorphous APX, the physical mixture, and the optimized ASD. PXRD patterns were obtained using an X-ray diffractometer (D/MAX-2500, Rigaku, Japan) at room temperature with Cu Kα radiation (λ = 1.54178 Å). The generator was operated at 40 kV and 100 mA. Samples were scanned over a 2θ range of 2–60° with an angular step size of 0.02°.
4.5.2. Differential Scanning Calorimetry
Differential scanning calorimetry (DSC) measurements were performed using a Thermal Analysis system with a DSC Q200 (TA Instruments, New Castle, DE, USA). DSC was used to evaluate the thermal behavior and crystalline-to-amorphous transition of APX in the ASD formulations, as thermal analysis is commonly applied together with PXRD for solid-state characterization of amorphous solid dispersions [27,30]. Each accurately weighed sample was placed in standard aluminum pans, and nitrogen was used as the purge gas. All samples were scanned at a temperature ramp speed of 10 °C/min, with the heat flow measured from 50 °C to 300 °C.
4.5.3. Scanning Electron Microscope
The morphology and surface characteristics of the samples were observed using a field-emission scanning electron microscope (SEM, Tescan MIRA3, TESCAN Korea, Seoul, Republic of Korea). SEM was used as a complementary technique to evaluate the morphological changes in APX after ASD formation [28]. The powders were affixed to aluminum stubs with double-sided adhesive carbon tape. Prior to imaging, the samples were sputter-coated with a thin platinum layer using an EmiTech K575X sputter coater (Quorum Technologies Ltd., Ashford, UK).
4.6. Colloidal Dispersion Characterization and Biorelevant Kinetic Solubility
4.6.1. Particle Size and Polydispersity Index (PDI) Analysis
The particle size and PDI of the dispersed ASD formulations were measured by dynamic light scattering (DLS) using a Zetasizer Nano ZS particle size analyzer (Malvern Instruments Ltd., Malvern, UK). Each ASD sample, equivalent to approximately 5 mg of APX, was dispersed in 20 mL of FaSSIF medium at pH 6.5. An aliquot of the resulting dispersion was collected and diluted 10-fold with the same medium before being transferred to a disposable cuvette for analysis. Measurements were performed at 37 °C using a laser wavelength of 633 nm and a backscattering angle of 173°. The hydrodynamic diameter was reported as the Z-average particle size, and the PDI was used as an indicator of the width of the particle size distribution. All measurements were performed in triplicate.
4.6.2. Transmission Electron Microscopy Analysis
Transmission electron microscopy (TEM) was used to examine the morphology of colloidal particles formed after dispersion of the optimized ASD in FaSSIF medium. Briefly, the optimized ASD prepared for particle size and PDI analysis was used after 10-fold dilution with FaSSIF medium at pH 6.5. Approximately 20 μL of the diluted dispersion was dropped onto a carbon-coated copper TEM grid (FCF200-CU-50, Electron Microscopy Sciences, Inc., Hatfield, PA, USA) and dried at room temperature. The prepared sample was observed using a transmission electron microscope (Talos L120C, Thermo Fisher Scientific Inc., Waltham, MA, USA) at an accelerating voltage of 120 kV.
4.6.3. Kinetic Solubility Study in FaSSIF
The drug loading and medium volume were selected with reference to the preliminary solvent-shift screening results described in Section 2.1, while the present kinetic solubility experiment involved direct dispersion of the ASD powders. The kinetic solubility of APX from ASD formulations and reference drug forms was evaluated using a dispersion-based method. Blank FaSSIF at pH 6.5 was used as the primary medium for CCD optimization because it provides an intestinal pH environment without bile salts or phospholipids, allowing the effects of HPMC and TPGS on supersaturation maintenance and colloidal dispersion to be evaluated with minimal interference from endogenous amphiphilic components. For CCD optimization, each ASD formulation equivalent to 10 mg of APX was accurately weighed and added to 30 mL of blank FaSSIF in a conical tube. These conditions were intended to evaluate formulation-dependent apparent concentration–time profiles under non-sink conditions rather than to reproduce compendial dissolution testing.
After optimization, crystalline APX powder, spray-dried amorphous APX, and the optimized ASD, each equivalent to 10 mg of APX, were tested under the same dispersion conditions in FaSSIF at pH 6.5 to compare their kinetic solubility behavior under bile-containing biorelevant intestinal conditions [31,32]. The samples were gently vortexed for a short period to disperse the powder uniformly and then incubated in a shaking water bath at 37 ± 0.5 °C with agitation at 100 rpm.
At predetermined time points, 1 mL aliquots were withdrawn from each sample and immediately filtered through a 0.22 μm PTFE membrane filter to remove undissolved drug particles. The filtrate was appropriately diluted with the mobile phase and analyzed by HPLC to determine the APX concentration. After each sampling, an equal volume of the corresponding fresh medium was added to maintain the total medium volume. The kinetic solubility profile was constructed by plotting APX concentration against time. For CCD optimization, the APX concentration at 30 min and the area under the kinetic solubility–time curve obtained in blank FaSSIF were used as the early kinetic solubility response and the overall supersaturation-maintaining response, respectively. Additional kinetic solubility testing in FaSSIF was performed to compare the optimized ASD with crystalline and amorphous APX under bile-containing biorelevant conditions. For the optimized ASD, three separate samples were collected from a single spray-drying batch and independently subjected to the kinetic solubility experiment. The results were expressed as mean ± standard deviation (SD, n = 3).
4.7. Pharmacokinetics Study
4.7.1. Animal Care
All animal experiments were conducted in accordance with institutional and international guidelines for the care and use of laboratory animals. The study protocol was reviewed and approved by the Institutional Animal Care and Use Committee of Gyeongsang National University (IACUC approval no. GNU 260512 R0104). Male Sprague–Dawley rats (8 weeks old, weighing 250 ± 50 g) were purchased from Samtako Bio Korea Co., Ltd. (Osan, Republic of Korea). The animals were housed in groups of three per cage with bedding material at the institutional animal facility of Gyeongsang National University under controlled environmental conditions (24 ± 0.5 °C, 60 ± 5% relative humidity, and a 12 h light/dark cycle). The animals were provided with standard laboratory feed and water. Animal housing and husbandry were routinely managed by trained animal care personnel throughout the study. No additional environmental enrichment items were provided.
4.7.2. Oral Administration and Blood Sampling
Male Sprague–Dawley rats were randomly assigned to two experimental groups (n = 6 per group). Anesthesia was induced using inhaled isoflurane at a concentration of 3–4% for 1–2 min and maintained with 0.5–2% isoflurane in oxygen at a flow rate of 1–2 L/min during the surgical procedure. After induction of anesthesia, each rat was placed in the supine position on a surgical board and immobilized. The inguinal region was disinfected with 70% EtOH, and a 1.0–1.5 cm incision was made to expose the femoral artery. A PE-50 catheter was inserted approximately 2.5–3.0 cm into the femoral artery and secured with suture material. The incision site was then closed with nylon sutures, and the external portion of the catheter was fixed to the skin to prevent displacement during blood sampling.
For the pharmacokinetic study, rats received a single oral dose of crystalline APX powder or the optimized ASD, each suspended in 0.5% carboxymethyl cellulose, at an APX-equivalent dose of 10 mg/kg. Serial blood samples of approximately 350 μL were withdrawn through the femoral arterial catheter at 0.25, 0.5, 1, 2, 3, 6, 9, 12, and 24 h after oral administration. The collected blood samples were immediately transferred into heparin-coated microcentrifuge tubes and centrifuged at 13,500 rpm for 15 min at 4 °C. The plasma supernatant was carefully separated and stored at −20 °C until HPLC analysis.
4.7.3. Plasma Sample Analysis and Pharmacokinetic Evaluation
The plasma concentration of APX was determined using the HPLC method described in Section 4.2, except that a Waters SunFire C18 column (250 × 4.6 mm, 5 μm) was used and the injection volume was set to 70 μL. Briefly, 150 μL of plasma sample was mixed with 50 μL of internal standard solution, tadalafil in acetonitrile at 10 μg/mL, followed by the addition of 300 μL of acetonitrile for deproteinization. The mixture was vortexed for 1 min and centrifuged at 13,500 rpm for 15 min at 4 °C. The resulting supernatant was collected and subjected to HPLC analysis [42].
Calibration standards were prepared by spiking blank rat plasma with known concentrations of APX and were processed using the same sample preparation procedure as that used for the pharmacokinetic plasma samples. The APX concentration in each plasma sample was calculated from the calibration curve.
Pharmacokinetic parameters were calculated by noncompartmental analysis using PKSolver version 2.0, a Microsoft Excel-based add-in for pharmacokinetic and pharmacodynamic data analysis [44]. The maximum plasma concentration (Cmax) and the time to reach Cmax (Tmax) were obtained directly from the observed plasma concentration–time profiles. The area under the plasma concentration–time curve from 0 to 24 h (AUC0–24) was calculated using the trapezoidal method. The terminal elimination rate constant (Kel) was estimated from the terminal log-linear portion of the plasma concentration–time curve, and the elimination half-life (t1/2) was calculated as 0.693/Kel. The area under the plasma concentration–time curve from 0 to infinity (AUC0–inf) was calculated as AUC0–24 + Clast/Kel, where Clast represents the last measurable plasma concentration.
4.8. Statistical Analysis
All experimental data are presented as mean ± standard deviation (SD), unless otherwise stated. Pharmacokinetic parameters, including Cmax, AUC0–24, AUC0–inf, Kel, and t1/2, were compared between crystalline APX powder and the optimized ASD using two-sided unpaired Welch’s t-tests. Tmax was presented as median (range) and summarized descriptively without statistical comparison.
For plasma concentration–time profiles, APX concentrations between crystalline APX powder and the optimized ASD were compared at each post-dose sampling time point using two-sided unpaired Welch’s t-tests. The 0 h time point was not included in the statistical comparison because all values were zero. To control for multiple comparisons across sampling time points, Holm–Bonferroni correction was applied to the resulting p-values. Differences were considered statistically significant at adjusted p < 0.05.
Pharmacokinetic statistical comparisons and Holm–Bonferroni correction were performed using Microsoft Excel 365 (Microsoft Corporation, Redmond, WA, USA).
5. Conclusions
This study demonstrated that an HPMC/TPGS-based ASD improved the dissolution performance, supersaturation maintenance, and oral exposure of APX. HPMC primarily contributed to supersaturation stabilization, whereas TPGS promoted apparent solubilization and colloidal dispersion. CCD-based multi-response optimization identified an optimal formulation containing HPMC and TPGS at ratios of approximately 3.93 and 0.85 relative to APX, respectively.
The optimized ASD maintained APX predominantly in an amorphous state and exhibited favorable colloidal dispersion properties and substantially improved kinetic solubility under FaSSIF conditions. Following oral administration in rats, Cmax, AUC0–24, and AUC0–inf were increased by approximately 2.46-, 3.04-, and 2.80-fold, respectively, compared with crystalline APX powder. Overall, these findings indicate that balancing polymer-mediated supersaturation maintenance with surfactant-mediated solubilization and dispersion is important for improving APX oral delivery and support HPMC/TPGS-based ASD as a promising formulation approach for poorly water-soluble APX.
Supplementary Materials
The following supporting information can be downloaded at: https://www.mdpi.com/article/10.3390/molecules31224133/s1, Figure S1: PXRD patterns of Apixaban ASD formulations prepared in CCD runs 1–13; Figure S2: DSC thermograms of Apixaban ASD formulations prepared in CCD runs 1–13; Figure S3: SEM images of Apixaban ASD formulations prepared in CCD runs 1–13.
Author Contributions
Conceptualization, J.-G.L.; formal analysis, J.-G.L.; writing—original draft preparation, J.-G.L.; writing—review and editing, K.-S.K.; supervision, K.-S.K.; project administration, K.-S.K. All authors have read and agreed to the published version of the manuscript.
Funding
This research received no external funding.
Institutional Review Board Statement
The animal study was conducted in accordance with institutional guidelines for the care and use of laboratory animals and was approved by the Institutional Animal Care and Use Committee of Gyeongsang National University (permit number: GNU 260512 R0104, date of approval: 12 May 2026).
Informed Consent Statement
Not applicable.
Data Availability Statement
The data presented in this study are available from the corresponding author upon reasonable request.
Acknowledgments
During the preparation of this manuscript, the authors used ChatGPT (GPT 5.6, OpenAI) for English language editing, including grammar, clarity, and stylistic refinement. The authors reviewed and edited all outputs and take full responsibility for the content of the publication.
Conflicts of Interest
The authors declare no conflicts of interest.
Abbreviations
The following abbreviations are used in this manuscript:
| ACN | Acetonitrile |
| APX | Apixaban |
| ASD | Amorphous solid dispersion |
| AUC | Area Under the Curve |
| CCD | Central Composite Design |
| Cmax | Maximum plasma concentration |
| DCM | Dichloromethane |
| DLS | Dynamic light scattering |
| DMSO | Dimethyl sulfoxide |
| DSC | Differential scanning calorimetry |
| EtOH | Ethanol |
| FaSSIF | Fasted State Simulated Intestinal Fluid |
| HPLC | High-performance liquid chromatography |
| HPMC 2910/HPMC | Hydroxypropyl methylcellulose 2910 |
| HPMCAS | Hydroxypropyl methylcellulose acetate succinate |
| Kel | Elimination rate constant |
| LLPS | Liquid–liquid phase separation |
| PDI | Polydispersity index |
| P-gp | P-glycoprotein |
| PVA | Polyvinyl alcohol |
| PXRD | Powder X-ray diffraction |
| SEM | Scanning electron microscopy |
| t1/2 | Elimination half-life |
| TEM | Transmission electron microscopy |
| Tmax | Time to reach maximum plasma concentration |
| TPGS | D-α-tocopherol polyethylene glycol 1000 succinate |
| VA64 | Polyvinylpyrrolidone-vinyl acetate copolymer/Kollidon® VA64 |
References
- Byon, W.; Garonzik, S.; Boyd, R.A.; Frost, C.E. Apixaban: A clinical pharmacokinetic and pharmacodynamic review. Clin. Pharmacokinet. 2019, 58, 1265–1279. [Google Scholar] [CrossRef] [Scilit] [PubMed]
- Bristol Myers Squibb/Pfizer. ELIQUIS (Apixaban) Prescribing Information; Bristol Myers Squibb/Pfizer: Princeton, NJ, USA, 2025. [Google Scholar]
- Lee, J.; Lee, J.J.; Lee, S.; Dinh, L.; Oh, H.; Abuzar, S.M.; Ahn, J.H.; Hwang, S.J. Preparation of Apixaban solid dispersion for the enhancement of Apixaban solubility and permeability. Pharmaceutics 2023, 15, 907. [Google Scholar] [CrossRef] [Scilit] [PubMed]
- Chen, Y.; Li, L.; Yao, J.; Ma, Y.-Y.; Chen, J.-M.; Lu, T.-B. Improving the Solubility and Bioavailability of Apixaban via Apixaban–Oxalic Acid Cocrystal. Cryst. Growth Des. 2016, 16, 2923–2930. [Google Scholar] [CrossRef] [Scilit]
- Zaky, M.F.; Megahed, M.A.; Hammady, T.M.; Gad, S.; Ghorab, M.M.; El-Say, K.M. Tailoring Apixaban in nanostructured lipid carrier enhancing its oral bioavailability and anticoagulant activity. Pharmaceutics 2023, 15, 80. [Google Scholar] [CrossRef] [Scilit] [PubMed]
- Zhang, L.; Kong, D.; Wang, H.; Jiao, L.; Zhao, X.; Song, J.; Yang, D.; Yang, H.; Yang, S.; Du, G.; et al. Cocrystal of Apixaban–Quercetin: Improving solubility and bioavailability of drug combination of two poorly soluble drugs. Molecules 2021, 26, 2677. [Google Scholar] [CrossRef] [Scilit] [PubMed]
- Baghel, S.; Cathcart, H.; O’Reilly, N.J. Polymeric amorphous solid dispersions: A review of amorphization, crystallization, stabilization, solid-state characterization, and aqueous solubilization of biopharmaceutical classification system class II drugs. J. Pharm. Sci. 2016, 105, 2527–2544. [Google Scholar] [CrossRef] [Scilit] [PubMed]
- Schittny, A.; Huwyler, J.; Puchkov, M. Mechanisms of increased bioavailability through amorphous solid dispersions: A review. Drug Deliv. 2020, 27, 110–127. [Google Scholar] [CrossRef] [Scilit] [PubMed]
- Qian, K.; Stella, L.; Jones, D.S.; Andrews, G.P.; Du, H.; Tian, Y. Drug-rich phases induced by amorphous solid dispersion: Arbitrary or intentional goal in oral drug delivery? Pharmaceutics 2021, 13, 889. [Google Scholar] [CrossRef] [Scilit] [PubMed]
- Kawakami, K. Roles of supersaturation and liquid–liquid phase separation for enhanced oral absorption of poorly soluble drugs from amorphous solid dispersions. Pharmaceutics 2025, 17, 262. [Google Scholar] [CrossRef] [Scilit] [PubMed]
- Nair, A.R.; Lakshman, Y.D.; Anand, V.S.K.; Sree, K.S.N.; Bhat, K.; Dengale, S.J. Overview of extensively employed polymeric carriers in solid dispersion technology. AAPS PharmSciTech 2020, 21, 309. [Google Scholar] [CrossRef] [Scilit] [PubMed]
- Alonzo, D.E.; Gao, Y.; Zhou, D.; Mo, H.; Zhang, G.G.Z.; Taylor, L.S. Dissolution and precipitation behavior of amorphous solid dispersions. J. Pharm. Sci. 2011, 100, 3316–3331. [Google Scholar] [CrossRef] [Scilit] [PubMed]
- Zarmpi, P.; Flanagan, T.; Meehan, E.; Mann, J.; Fotaki, N. Biopharmaceutical understanding of excipient variability on drug apparent solubility based on drug physicochemical properties: Case study—Hypromellose (HPMC). AAPS J. 2020, 22, 49. [Google Scholar] [CrossRef] [Scilit] [PubMed]
- Feng, D.; Peng, T.; Huang, Z.; Singh, V.; Shi, Y.; Wen, T.; Lu, M.; Quan, G.; Pan, X.; Wu, C. Polymer–surfactant system based amorphous solid dispersion: Precipitation inhibition and bioavailability enhancement. Pharmaceutics 2018, 10, 53. [Google Scholar] [CrossRef] [Scilit] [PubMed]
- Guo, Y.; Luo, J.; Tan, S.; Otieno, B.O.; Zhang, Z. The applications of vitamin E TPGS in drug delivery. Eur. J. Pharm. Sci. 2013, 49, 175–186. [Google Scholar] [CrossRef] [Scilit] [PubMed]
- Yang, C.; Wu, T.; Qi, Y.; Zhang, Z. Recent advances in the application of vitamin E TPGS for drug delivery. Theranostics 2018, 8, 464–485. [Google Scholar] [CrossRef] [Scilit] [PubMed]
- Dintaman, J.M.; Silverman, J.A. Inhibition of P-glycoprotein by D-α-tocopheryl polyethylene glycol 1000 succinate. Pharm. Res. 1999, 16, 1550–1556. [Google Scholar] [CrossRef] [Scilit] [PubMed]
- Klein, S. The use of biorelevant dissolution media to forecast the in vivo performance of a drug. AAPS J. 2010, 12, 397–406. [Google Scholar] [CrossRef] [Scilit] [PubMed]
- Fagerberg, J.H.; Tsinman, O.; Sun, N.; Tsinman, K.; Avdeef, A.; Bergström, C.A.S. Dissolution rate and apparent solubility of poorly soluble drugs in biorelevant dissolution media. Mol. Pharm. 2010, 7, 1419–1430. [Google Scholar] [CrossRef] [Scilit] [PubMed]
- El Sayed, M.; Alhalaweh, A.; Bergström, C.A.S. Impact of simulated intestinal fluids on dissolution, solution chemistry, and membrane transport of amorphous multidrug formulations. Mol. Pharm. 2021, 18, 4079–4089. [Google Scholar] [CrossRef] [Scilit] [PubMed]
- Jackson, M.J.; Kestur, U.S.; Hussain, M.A.; Taylor, L.S. Dissolution of danazol amorphous solid dispersions: Supersaturation and phase behavior as a function of drug loading and polymer type. Mol. Pharm. 2016, 13, 223–231. [Google Scholar] [CrossRef] [Scilit] [PubMed]
- Box, G.E.P.; Wilson, K.B. On the experimental attainment of optimum conditions. J. R. Stat. Soc. Ser. B Stat. Methodol. 1951, 13, 1–38. [Google Scholar] [CrossRef] [Scilit]
- Myers, R.H.; Montgomery, D.C.; Anderson-Cook, C.M. Response Surface Methodology: Process and Product Optimization Using Designed Experiments, 4th ed.; Wiley: Hoboken, NJ, USA, 2016. [Google Scholar]
- Derringer, G.; Suich, R. Simultaneous optimization of several response variables. J. Qual. Technol. 1980, 12, 214–219. [Google Scholar] [CrossRef] [Scilit]
- Ilevbare, G.A.; Liu, H.; Pereira, J.; Edgar, K.J.; Taylor, L.S. Influence of additives on the properties of nanodroplets formed in highly supersaturated aqueous solutions of ritonavir. Mol. Pharm. 2013, 10, 3392–3403. [Google Scholar] [CrossRef] [Scilit] [PubMed]
- Hiew, T.N.; Zemlyanov, D.Y.; Taylor, L.S. Balancing solid-state stability and dissolution performance of lumefantrine amorphous solid dispersions: The role of polymer choice and drug–polymer interactions. Mol. Pharm. 2022, 19, 392–413. [Google Scholar] [CrossRef] [Scilit] [PubMed]
- Jarrells, T.W.; Munson, E.J. Comparison of differential scanning calorimetry, powder X-ray diffraction, and solid-state nuclear magnetic resonance spectroscopy for measuring crystallinity in amorphous solid dispersions—Application to drug-in-polymer solubility. J. Pharm. Sci. 2022, 111, 2765–2778. [Google Scholar] [CrossRef] [Scilit] [PubMed]
- Xi, H.; Zhu, A.; Klinzing, G.R.; Zhou, L.; Zhang, S.; Gmitter, A.J.; Ploeger, K.; Sundararajan, P.; Mahjour, M.; Xu, W. Characterization of spray dried particles through microstructural imaging. J. Pharm. Sci. 2020, 109, 3404–3412. [Google Scholar] [CrossRef] [Scilit] [PubMed]
- Michen, B.; Geers, C.; Vanhecke, D.; Endes, C.; Rothen-Rutishauser, B.; Balog, S.; Petri-Fink, A. Avoiding drying-artifacts in transmission electron microscopy: Characterizing the size and colloidal state of nanoparticles. Sci. Rep. 2015, 5, 9793. [Google Scholar] [CrossRef] [Scilit] [PubMed]
- Chasse, T.; Conway, S.L.; Danzer, G.D.; Feng, L.; Leone, A.M.; McNevin, M.; Smoliga, J.; Stroud, P.A.; van Lishaut, H. Industry White Paper: Contemporary opportunities and challenges in characterizing crystallinity in amorphous solid dispersions. J. Pharm. Sci. 2022, 111, 1543–1555. [Google Scholar] [CrossRef] [Scilit] [PubMed]
- Jantratid, E.; Janssen, N.; Reppas, C.; Dressman, J.B. Dissolution media simulating conditions in the proximal human gastrointestinal tract: An update. Pharm. Res. 2008, 25, 1663–1676. [Google Scholar] [CrossRef] [Scilit] [PubMed]
- Kleberg, K.; Jacobsen, F.; Fatouros, D.G.; Müllertz, A. Characterising the behaviour of poorly water soluble drugs in the intestine: Application of biorelevant media for solubility, dissolution and transport studies. J. Pharm. Pharmacol. 2010, 62, 1656–1668. [Google Scholar] [CrossRef] [Scilit] [PubMed]
- Li, N.; Taylor, L.S. Tailoring supersaturation from amorphous solid dispersions. J. Control. Release 2018, 279, 114–125. [Google Scholar] [CrossRef] [Scilit] [PubMed]
- Taylor, L.S.; Zhang, G.G.Z. Physical chemistry of supersaturated solutions and implications for oral absorption. Adv. Drug Deliv. Rev. 2016, 101, 122–142. [Google Scholar] [CrossRef] [Scilit] [PubMed]
- Song, D.Y.; Lee, J.G.; Kim, K.S. Spray-Dried Inclusion Complex of Apixaban with β-Cyclodextrin Derivatives: Characterization, Solubility, and Molecular Interaction Analysis. Polymers 2025, 17, 2850. [Google Scholar] [CrossRef] [Scilit] [PubMed]
- Din, F.U.; Lee, H.I.; Kim, J.S.; Woo, M.R.; Cheon, S.; Park, S.; Woo, S.; Jin, S.G.; Choi, H.-G. Physicochemical characterization and in vivo assessment of novel Apixaban-loaded polymeric nano-aggregates. J. Pharm. Investig. 2025, 55, 707–719. [Google Scholar] [CrossRef] [Scilit]
- Ashwathy, P.; Anto, A.T.; Sudheesh, M.S. A mechanistic review on the dissolution phase behavior and supersaturation stabilization of amorphous solid dispersions. Drug Dev. Ind. Pharm. 2021, 47, 1–11. [Google Scholar] [CrossRef] [Scilit] [PubMed]
- Kawakami, K. Supersaturation and crystallization: Non-equilibrium dynamics of amorphous solid dispersions for oral drug delivery. Expert Opin. Drug Deliv. 2017, 14, 735–743. [Google Scholar] [CrossRef] [Scilit] [PubMed]
- Zhao, P.; Han, W.; Shu, Y.; Li, M.; Sun, Y.; Sui, X.; Liu, B.; Tian, B.; Liu, Y.; Fu, Q. Liquid–liquid phase separation drug aggregate: Merit for oral delivery of amorphous solid dispersions. J. Control. Release 2023, 353, 42–50. [Google Scholar] [CrossRef] [Scilit] [PubMed]
- Pochapski, D.J.; Carvalho dos Santos, C.; Leite, G.W.; Pulcinelli, S.H.; Santilli, C.V. Zeta potential and colloidal stability predictions for inorganic nanoparticle dispersions: Effects of experimental conditions and electrokinetic models on the interpretation of results. Langmuir 2021, 37, 13379–13389. [Google Scholar] [CrossRef] [Scilit] [PubMed]
- Cortés, H.; Hernández-Parra, H.; Bernal-Chávez, S.A.; Del Prado-Audelo, M.L.; Caballero-Florán, I.H.; Borbolla-Jiménez, F.V.; González-Torres, M.; Magaña, J.J.; Leyva-Gómez, G. Non-ionic surfactants for stabilization of polymeric nanoparticles for biomedical uses. Materials 2021, 14, 3197. [Google Scholar] [CrossRef] [Scilit] [PubMed]
- Ramadan, S.E.; El-Gizawy, S.A.; Osman, M.A.; Arafa, M.F. Application of design of experiment in the optimization of apixaban-loaded solid lipid nanoparticles: In vitro and in vivo evaluation. AAPS PharmSciTech 2023, 24, 167. [Google Scholar] [CrossRef] [Scilit] [PubMed]
- Montgomery, D.C. Design and Analysis of Experiments, 8th ed.; John Wiley & Sons: Hoboken, NJ, USA, 2012. [Google Scholar]
- Zhang, Y.; Huo, M.; Zhou, J.; Xie, S. PKSolver: An add-in program for pharmacokinetic and pharmacodynamic data analysis in Microsoft Excel. Comput. Methods Programs Biomed. 2010, 99, 306–314. [Google Scholar] [CrossRef] [Scilit] [PubMed]
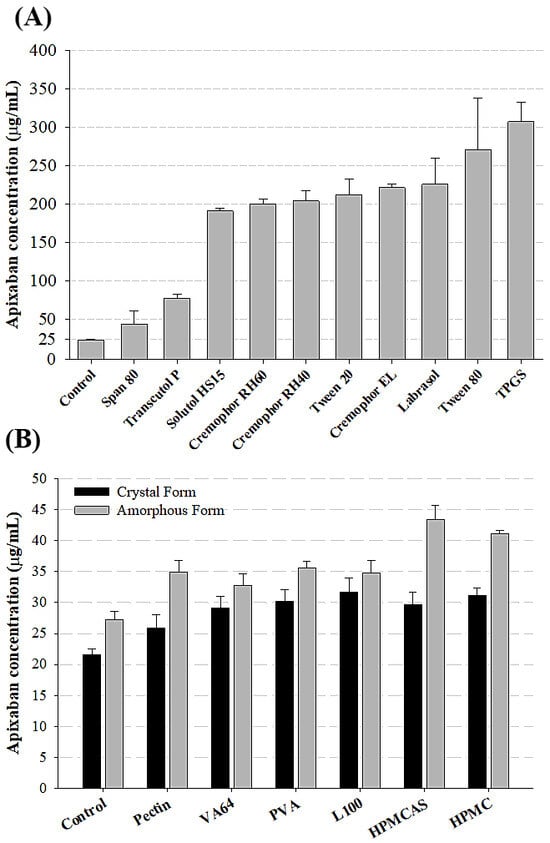
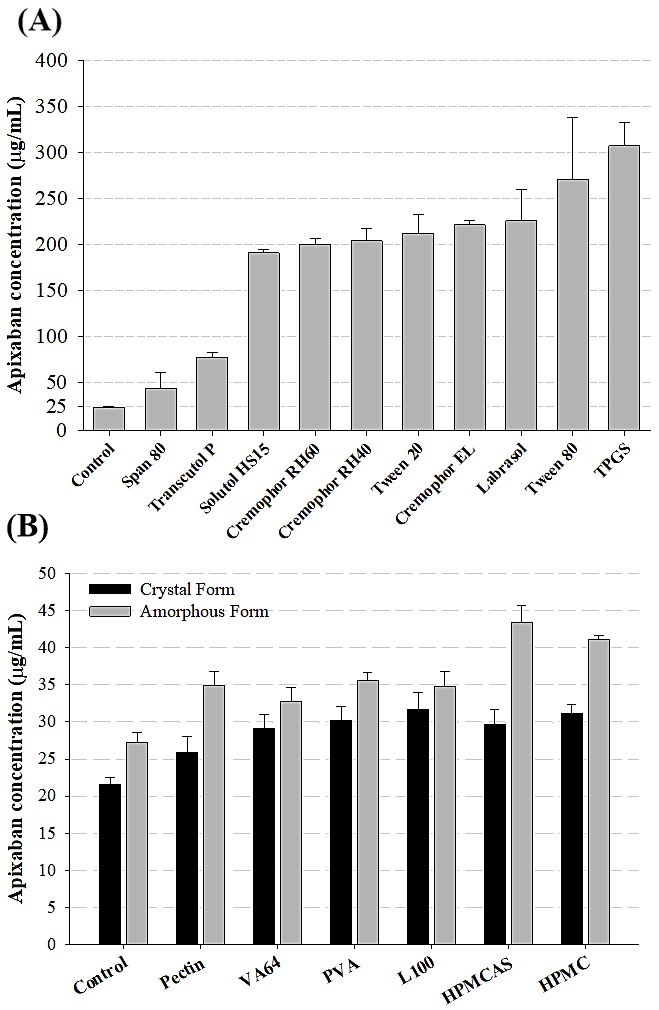
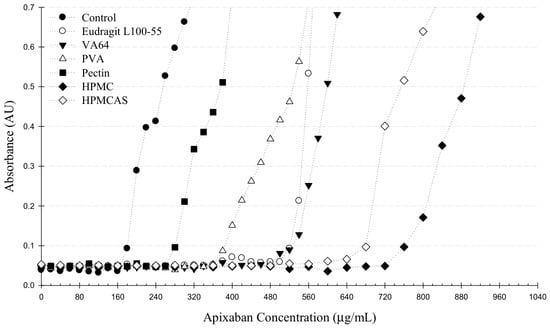
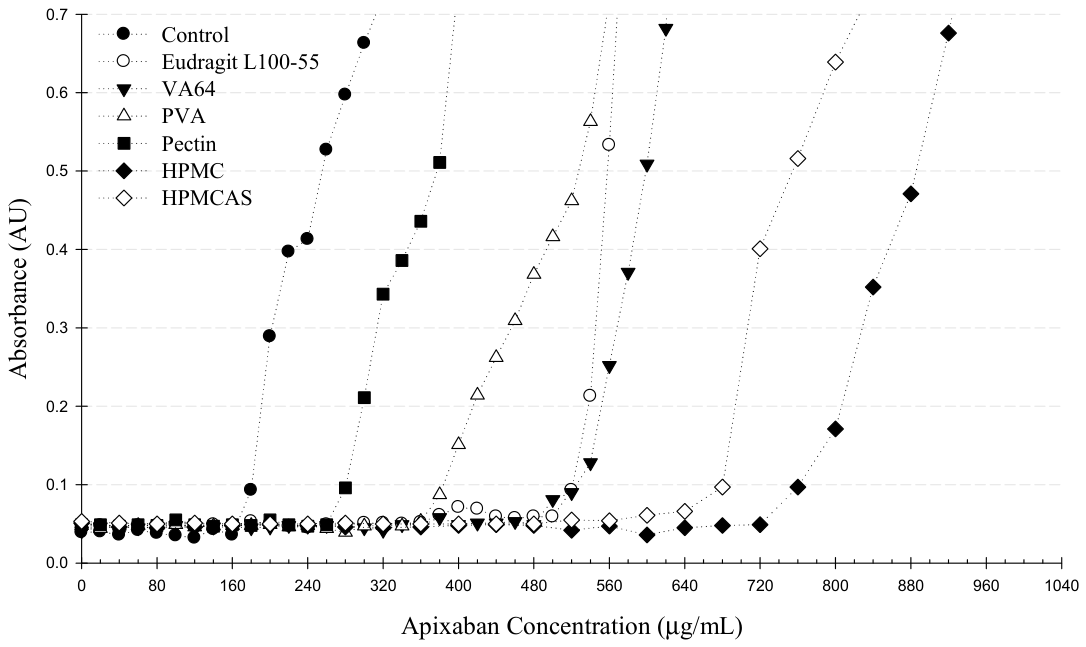
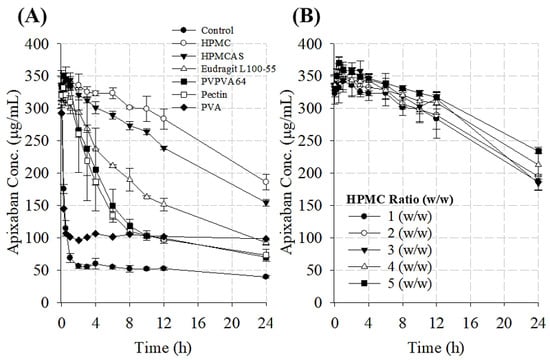
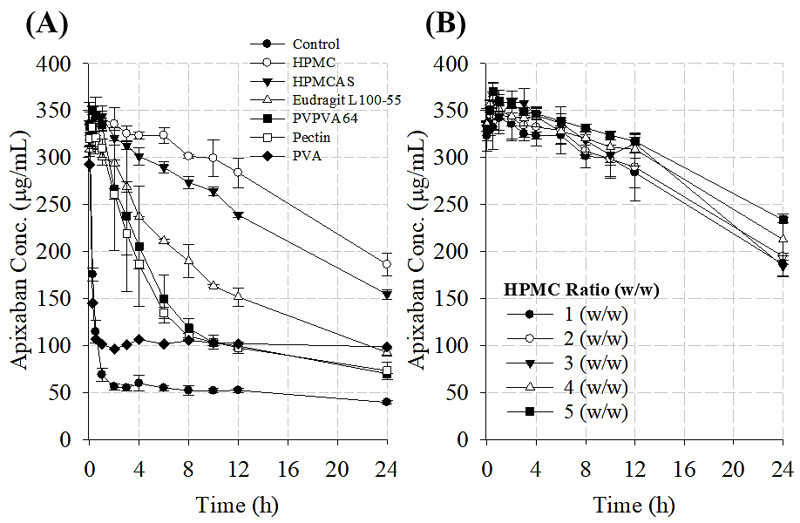
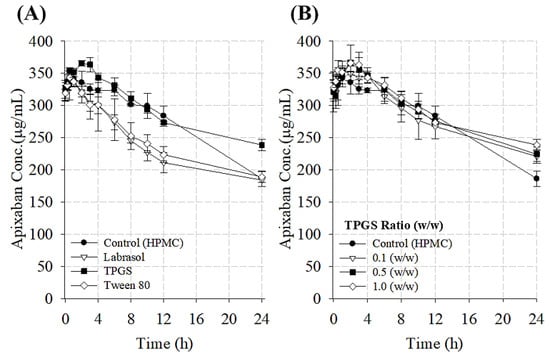
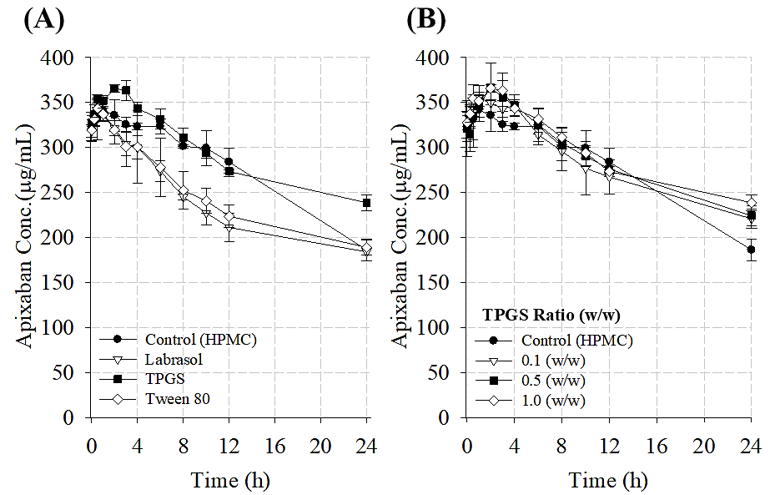
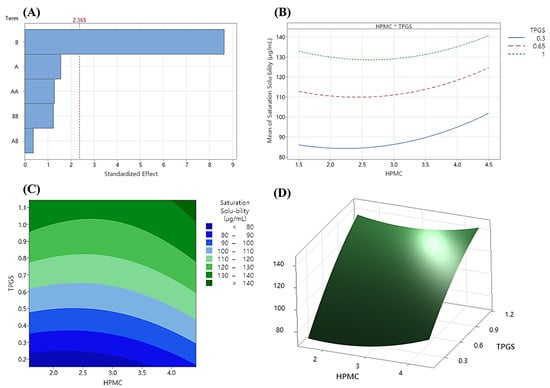
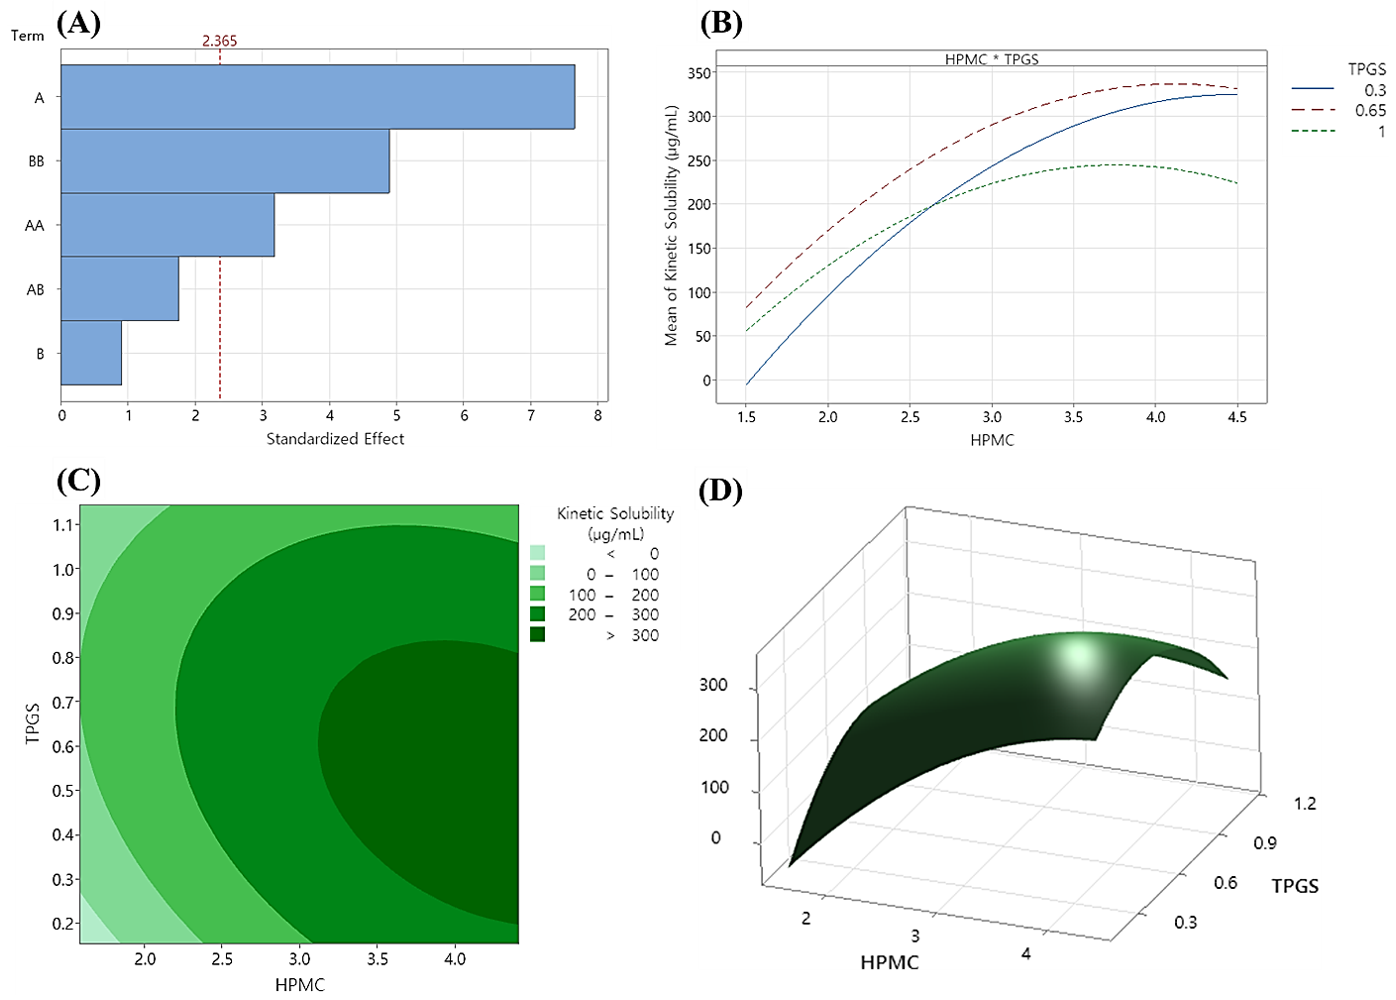
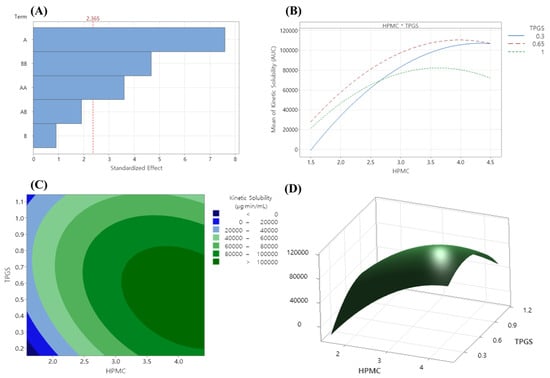
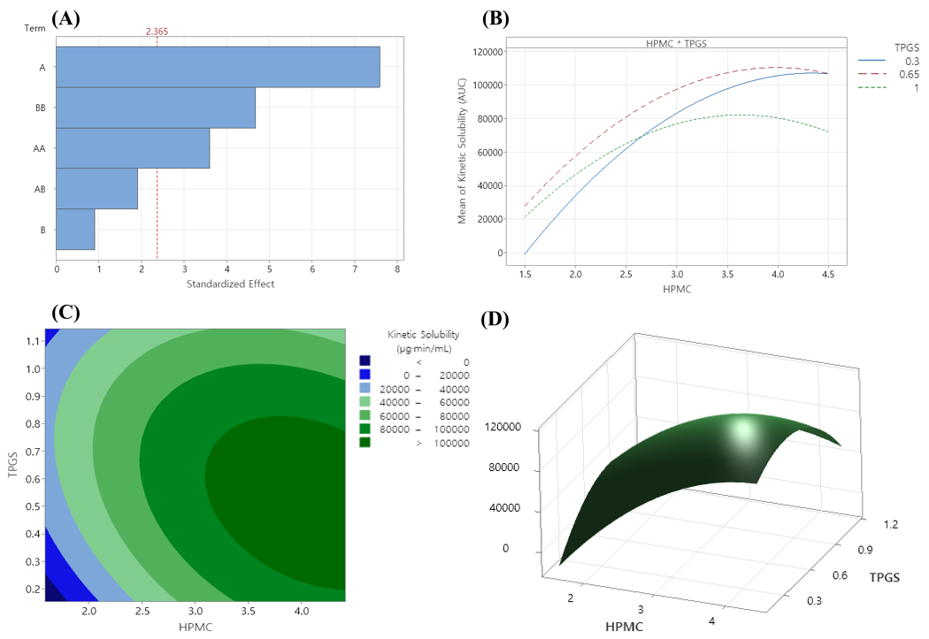
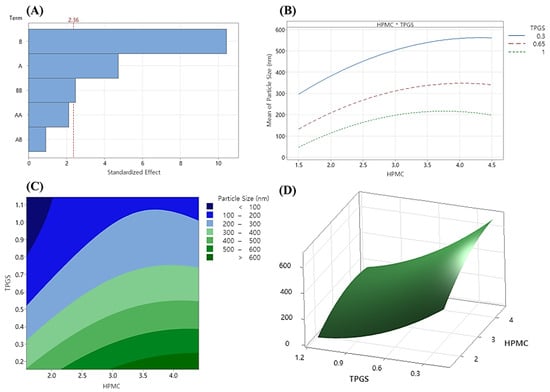
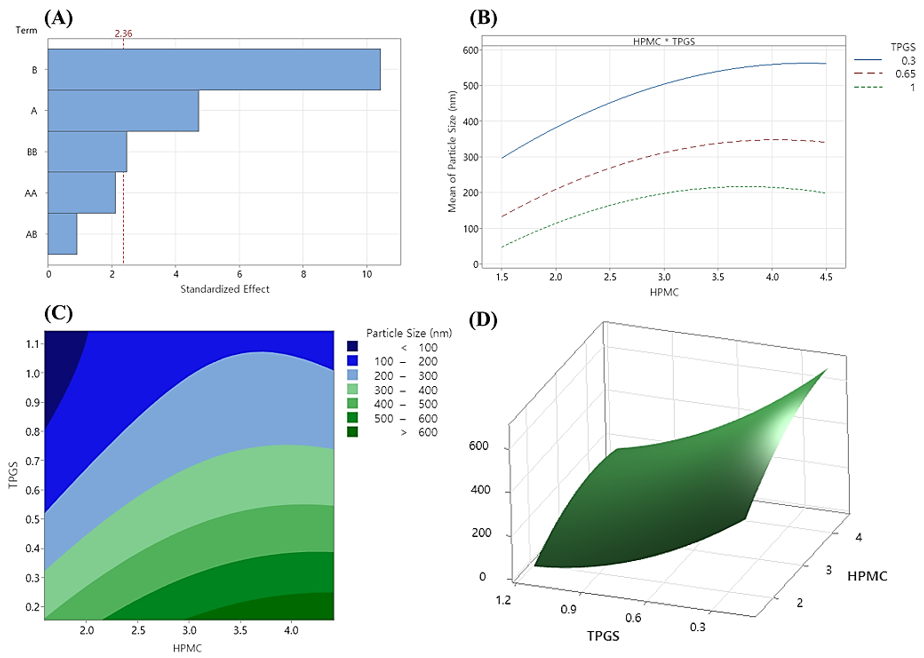
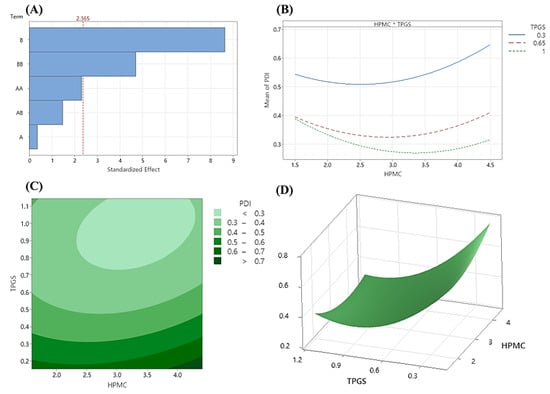
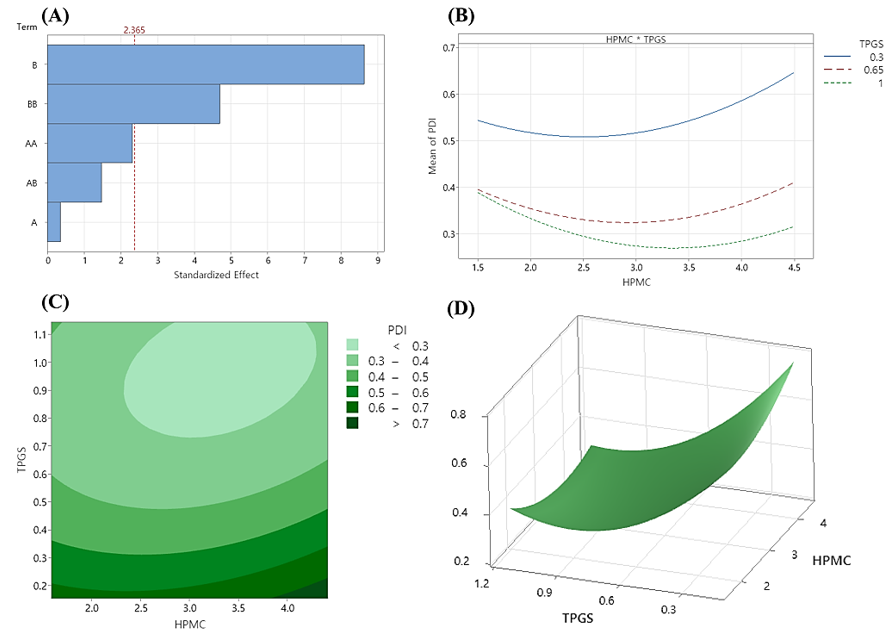
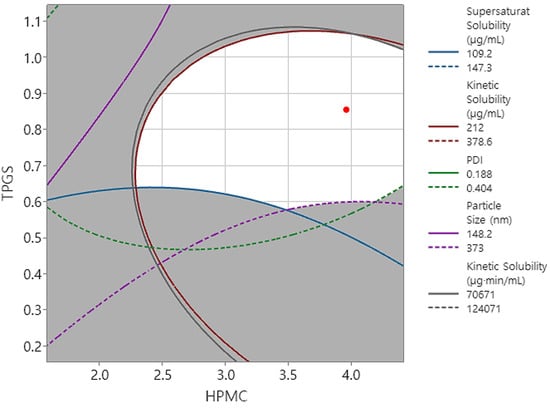
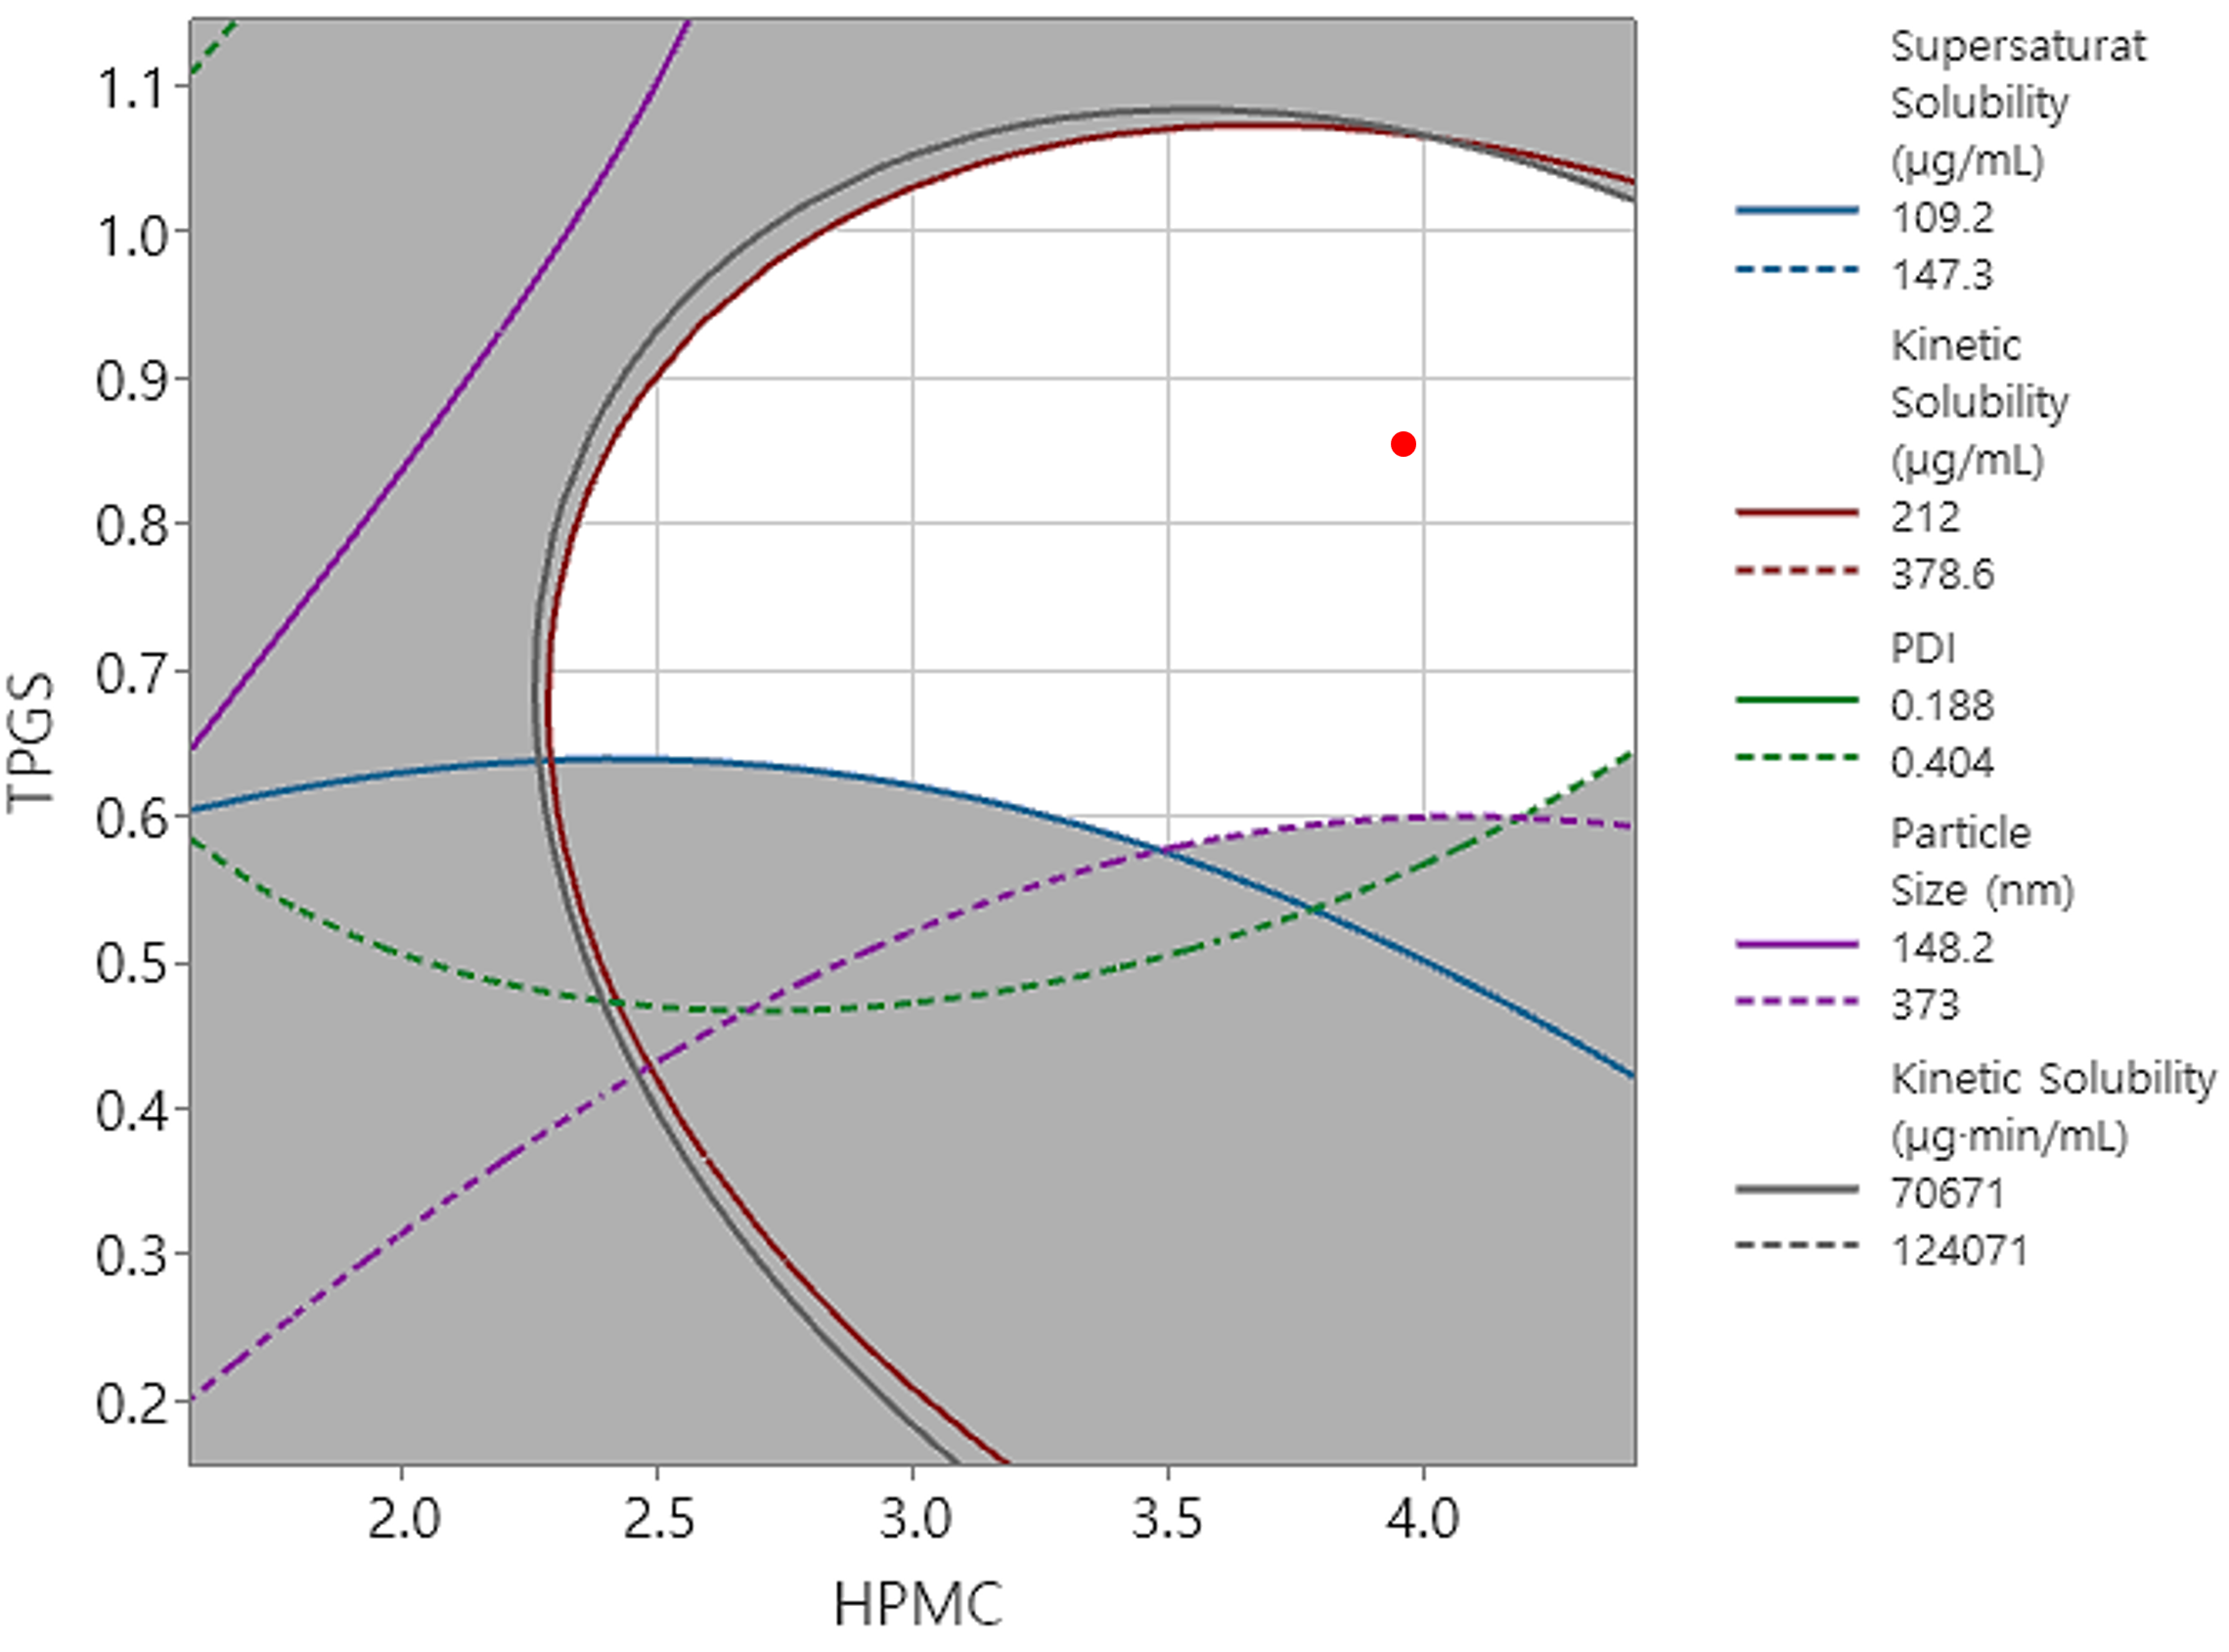
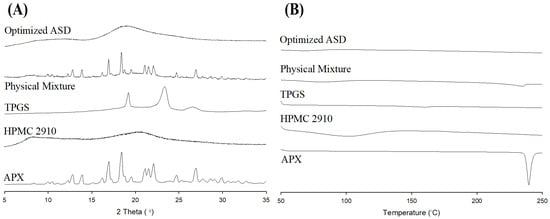
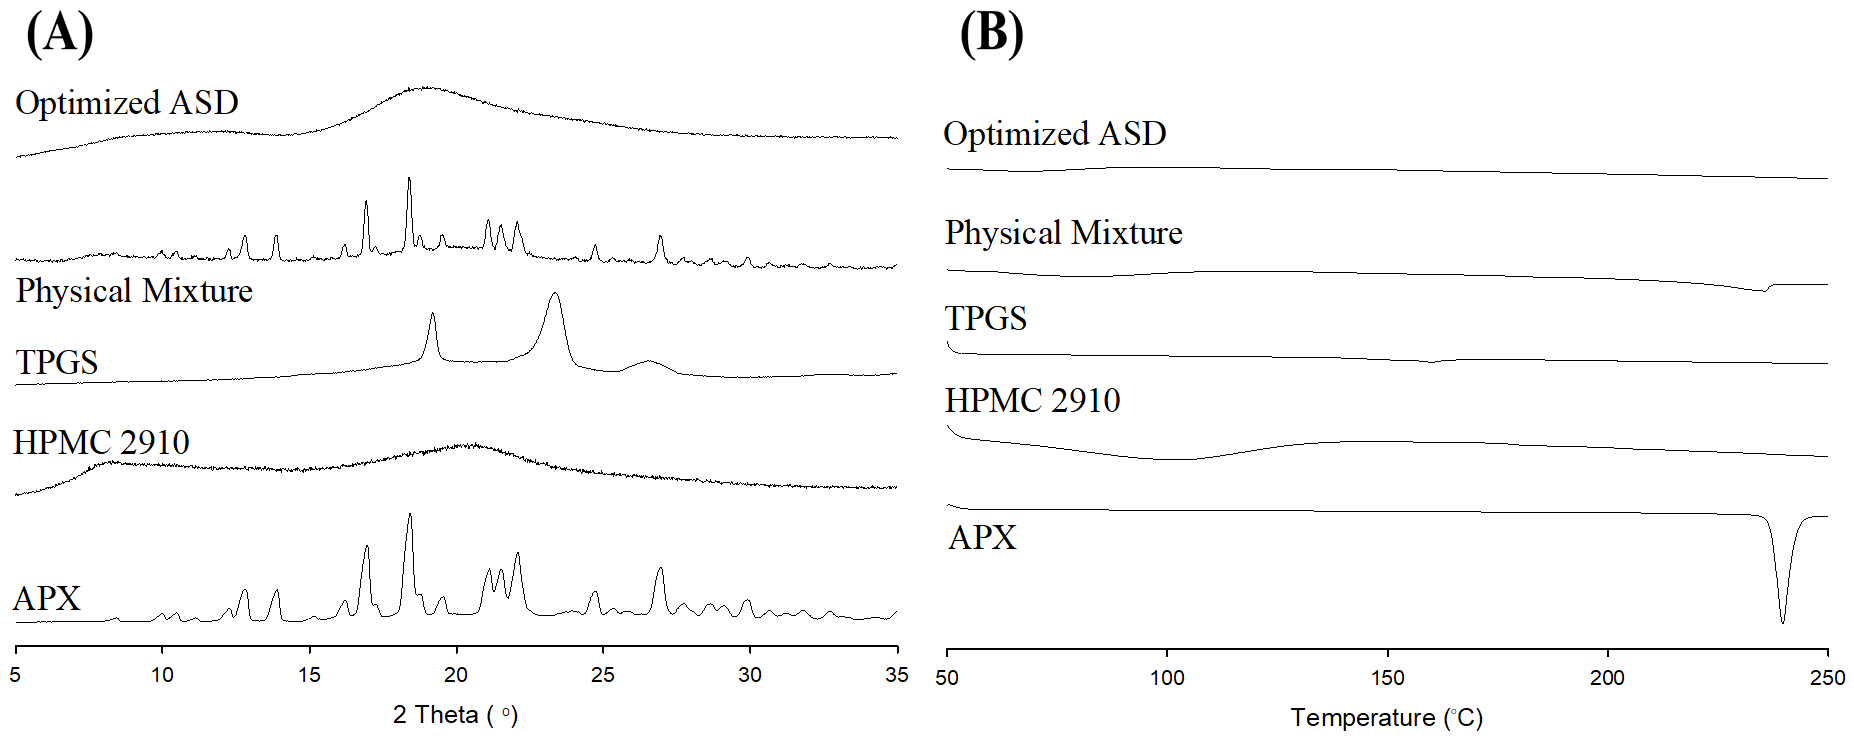
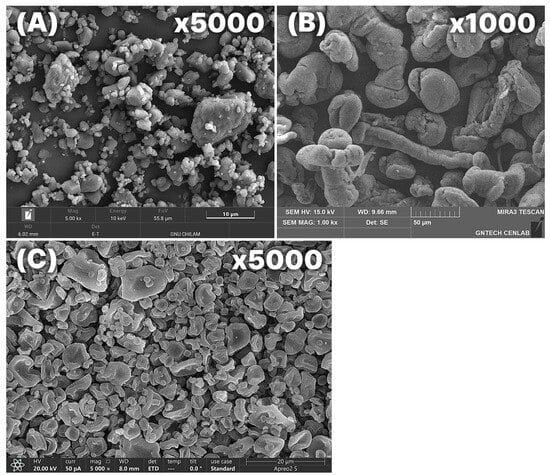
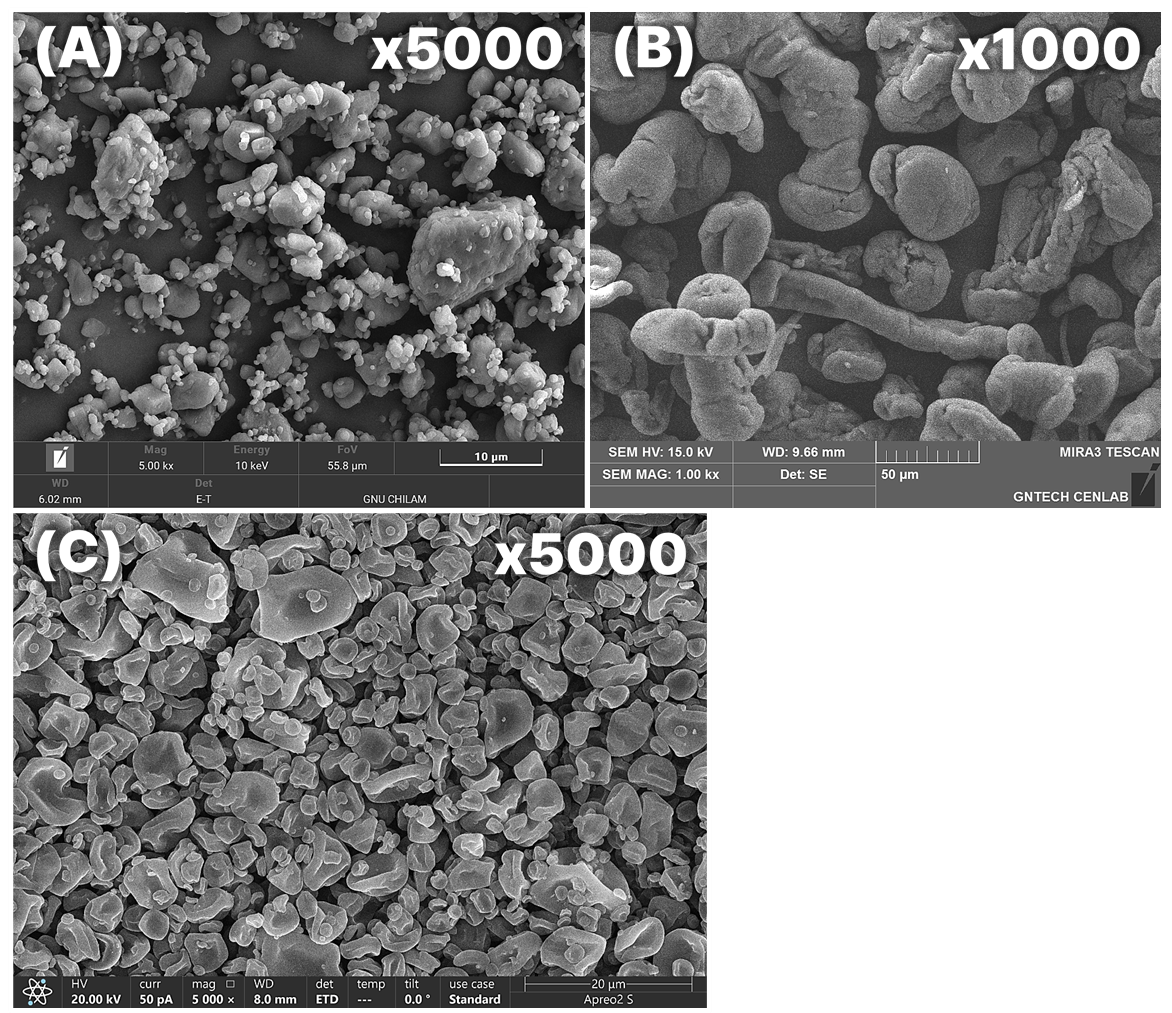
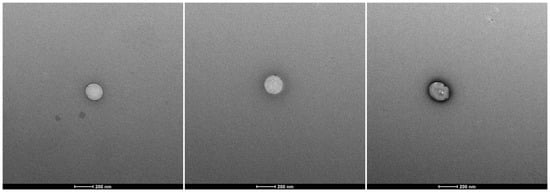
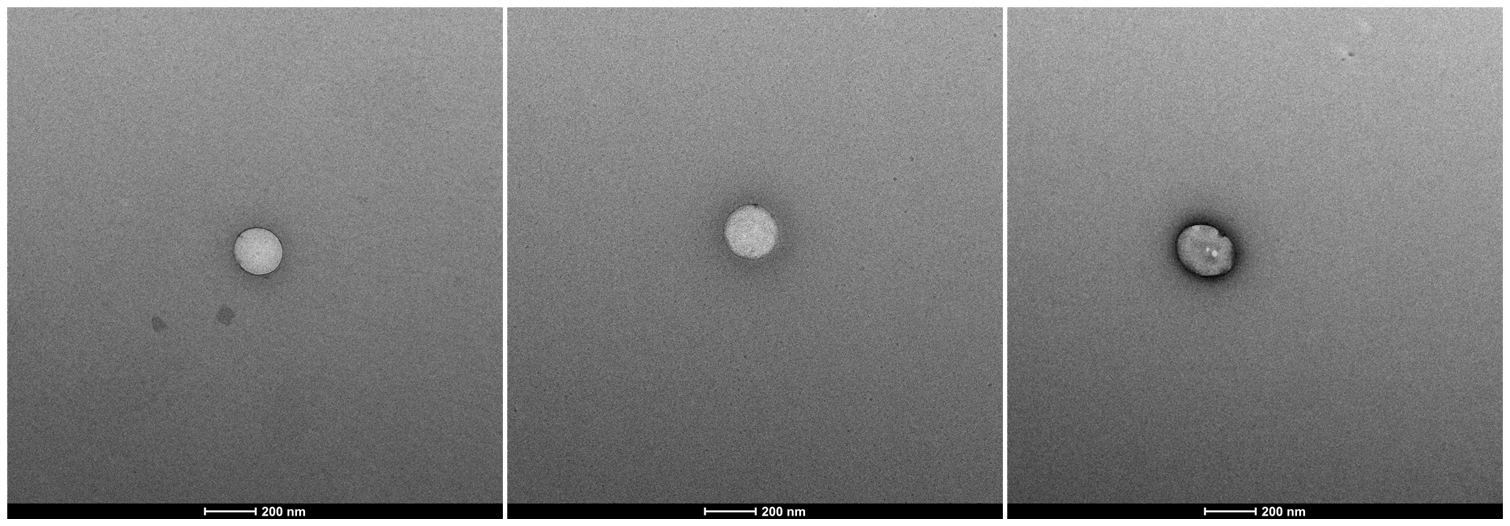
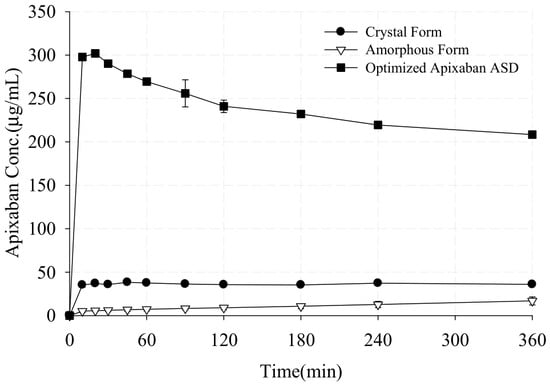
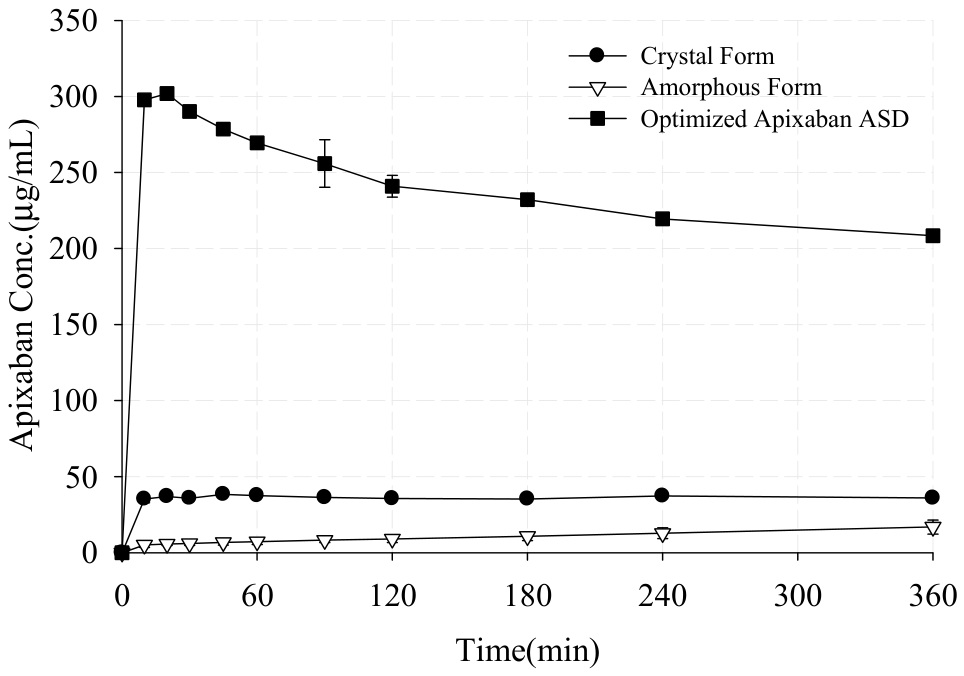
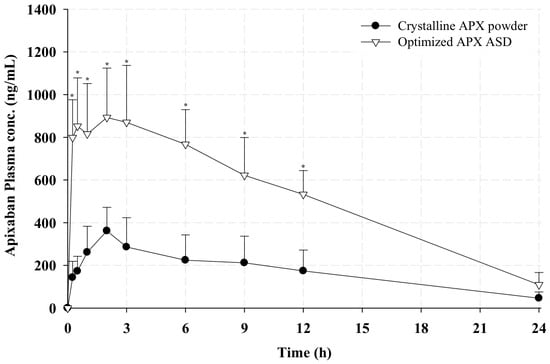
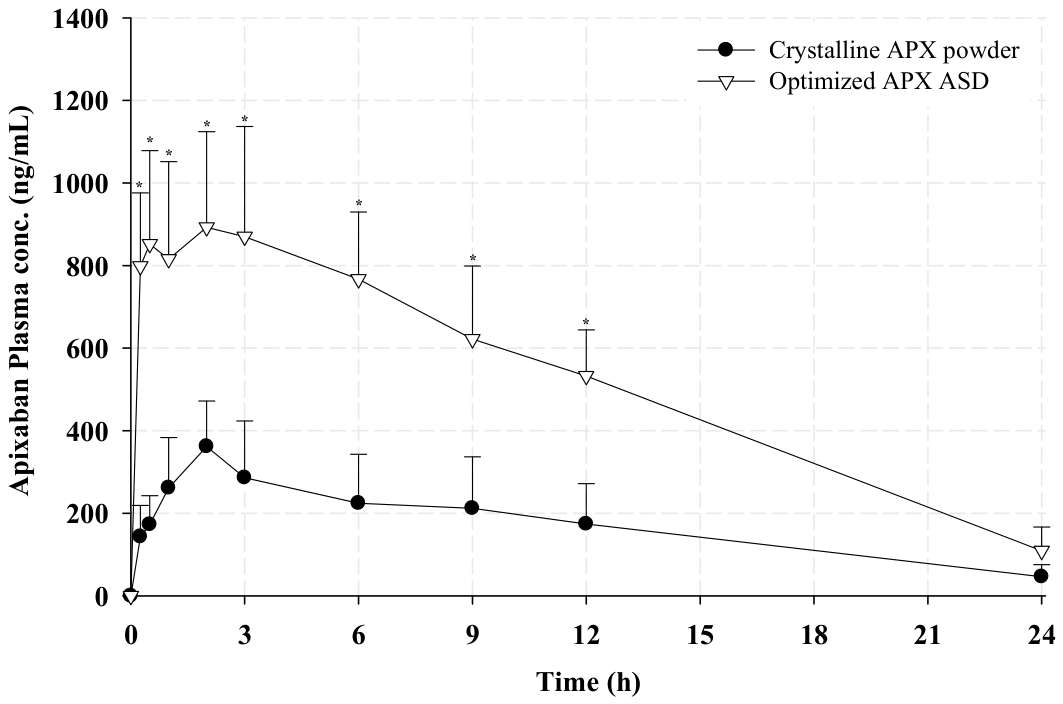

Disclaimer/Publisher’s Note: The statements, opinions and data contained in all publications are solely those of the individual author(s) and contributor(s) and not of MDPI and/or the editor(s). MDPI and/or the editor(s) disclaim responsibility for any injury to people or property resulting from any ideas, methods, instructions or products referred to in the content. |
© 2026 by the authors. Licensee MDPI, Basel, Switzerland. This article is an open access article distributed under the terms and conditions of the Creative Commons Attribution (CC BY) license.