


Abstract
Faba bean is a promising substrate for tempeh-like products, although its sensory characteristics and the presence of compounds such as vicine, convicine and L-DOPA may limit its wider use. This study investigated whether ozone pretreatment modifies chemical and aroma-related changes during Rhizopus oligosporus NRRL 2710 fermentation of faba bean. Non-ozonated and ozonated samples were fermented for 15, 22, 39 and 46 h and analysed for free amino acids (FAA), L-DOPA, vicine and convicine by HPLC, while volatile compounds were evaluated by SPME–GC–MS, multivariate analysis and sensory assessment. Ozone pretreatment strongly modified the later stages of fermentation. Total FAA increased to 543.55 mg/100 g DW in O46 samples, compared with 48.20 mg/100 g DW in NO46 samples. L-DOPA decreased mainly as a function of fermentation time, whereas significant time × ozone interactions were observed for vicine and convicine, with markedly lower concentrations in ozonated samples at prolonged fermentation. Volatile profiles also diverged most strongly at 39–46 h, with several grassy/green-associated compounds not detected from late ozonated samples. However, ozonated tempeh evaluated after 24 h showed stronger pungent/ammonia notes and overall aroma. Overall, ozone pretreatment altered fermentation-associated chemical and volatile development in a time- and compound-dependent manner.
Keywords:
faba bean; Rhizopus oligosporus; tempeh; ozonation; free amino acids; vicine; convicine; L-DOPA; volatile compounds 1. Introduction
The increasing demand for sustainable and locally produced protein sources has stimulated interest in the broader use of legumes in plant-based foods. Faba bean (Vicia faba L.) is particularly attractive in this context because of its high protein content, suitability for cultivation in temperate climates and potential contribution to more locally based protein production systems [1,2]. Despite these advantages, its wider use in food products remains limited by characteristic beany, green and bitter sensory notes and by the presence of compounds that may reduce consumer acceptance or raise nutritional concerns [3,4].
Among the characteristic non-volatile compounds of faba bean, the pyrimidine glycosides vicine and convicine are of particular interest. Their hydrolysis products can induce favism in individuals with glucose-6-phosphate dehydrogenase deficiency, making their reduction an important consideration in the development of faba bean-based foods [5]. Vicine has also been associated with bitterness in faba bean products [6,7]. Faba bean additionally contains L-3,4-dihydroxyphenylalanine (L-DOPA), a biologically active compound whose concentration may also change substantially during processing [1]. At the same time, the sensory quality of faba bean is strongly influenced by its volatile fraction, including aldehydes and alcohols associated with green, grassy and beany aromas, such as hexanal, nonanal as well as alcohols associated with mushroom-like and earthy notes, such as 1-octen-3-ol [3,8,9,10].
Fermentation with Rhizopus spp. offers a potential strategy to modify both the nutritional and sensory properties of legumes [11,12]. Tempeh is traditionally produced from soybean by solid-state fermentation with Rhizopus species, particularly R. oligosporus [11,12]. During fermentation, fungal enzymatic activity promotes the degradation of macromolecules, including proteins, leading to the formation of peptides and free amino acids, while simultaneously modifying antinutritional and flavour-active compounds [12,13]. Previous studies have demonstrated that R. oligosporus fermentation can reduce vicine, convicine and L-DOPA in faba bean and substantially modify its nutritional composition [14,15]. More recently, faba bean has also been investigated as a substrate for tempeh-like products, including studies of their volatile and sensory characteristics [16]. However, the development of aroma during fermentation remains strongly dependent on substrate characteristics, fungal metabolism and processing conditions [11,12,16].
Ozone is a strong oxidizing agent increasingly investigated in food processing because of its antimicrobial activity and its rapid decomposition to oxygen without leaving conventional chemical residues [17,18]. Beyond microbial inactivation, ozone may also affect proteins, lipids and other food constituents and consequently alter physicochemical and sensory properties [17,18]. Its effects are highly matrix- and process-dependent [18,19]. In lipid-rich matrices, ozone treatment has been shown to modify volatile profiles, including compounds associated with green, grassy and other characteristic aroma notes [19]. Such effects suggest that ozonation prior to fungal fermentation could modify the substrate available to Rhizopus and consequently influence both metabolic transformations and aroma development.
Nevertheless, information on the combined effects of ozone pretreatment and Rhizopus fermentation of faba bean is very limited. In particular, it remains unclear whether ozonation modifies the kinetics of changes in free amino acids, pyrimidine glycosides and L-DOPA during fermentation and whether these chemical changes are accompanied by alterations in the volatile and sensory profiles of the resulting tempeh-like product. The interaction with fermentation time is particularly relevant because the biochemical transformations occurring during early fungal growth may differ substantially from those occurring during prolonged fermentation. To our knowledge, ozone pretreatment has not previously been systematically investigated in relation to the chemical and volatile development of faba bean tempeh.
Therefore, the aim of this study was to investigate the effect of ozone pretreatment on the chemical and aroma-related changes occurring during Rhizopus oligosporus NRRL 2710 fermentation of faba bean (Vicia faba L. minor, var. Amigo). Free amino acids, vicine, convicine and L-DOPA were monitored throughout fermentation, while changes in volatile compound profiles were evaluated using SPME–GC–MS and multivariate analysis. In addition, the volatile compounds were classified according to their reported aroma descriptors and complemented by sensory evaluation of the resulting tempeh. Particular attention was given to whether the influence of ozone pretreatment changed with fermentation time.
Throughout the manuscript, non-ozonated and ozonated samples are referred to as NO and O, respectively. Numbers following these abbreviations indicate the fermentation time in hours.
2. Results
2.1. Free Amino Acid Profile During Fermentation
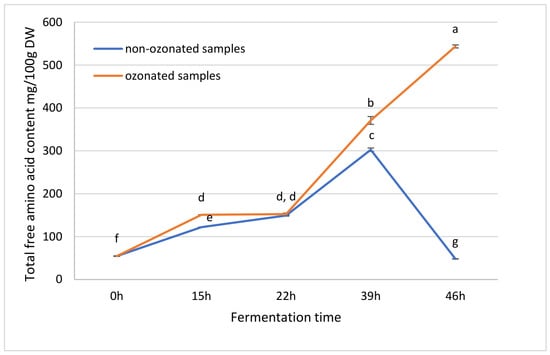
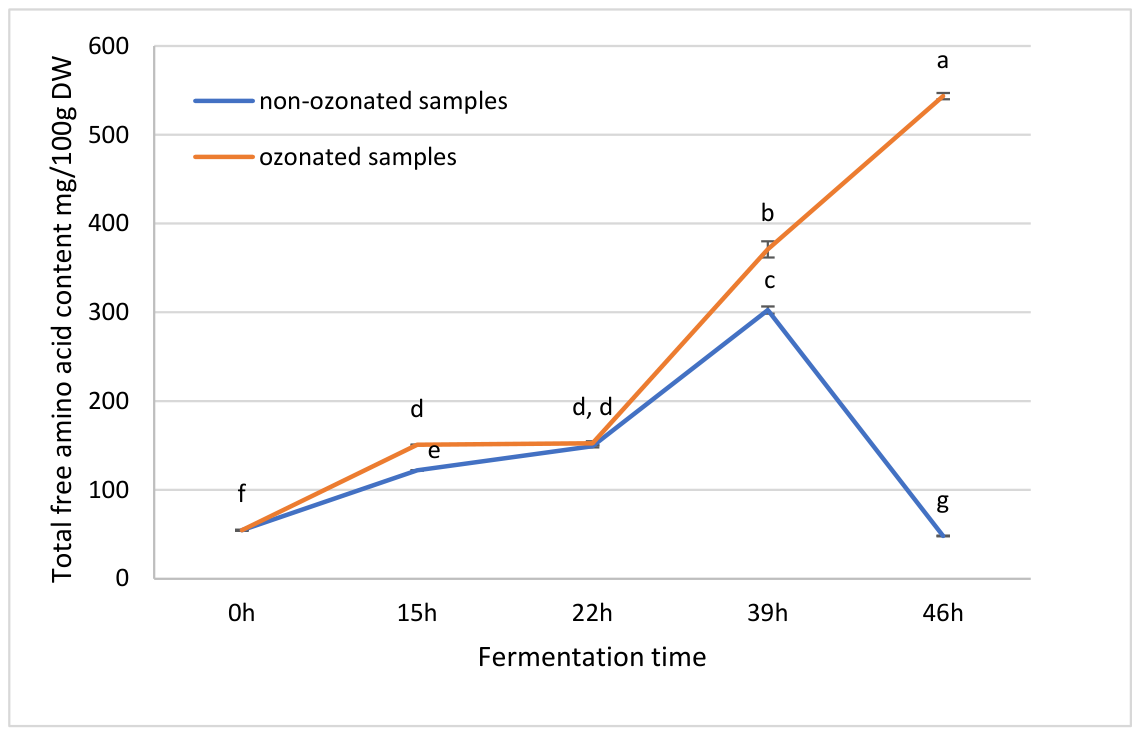
The total free amino acid (FAA) content changed markedly during Rhizopus oligosporus fermentation, with distinct temporal patterns observed in NO and O samples (Figure 1). The unfermented sample contained 54.59 ± 0.58 mg/100 g DW of total FAA. In NO samples, total FAA increased to 122.10 ± 0.16 and 149.33 ± 1.34 mg/100 g DW after 15 and 22 h of fermentation, respectively, and reached 302.67 ± 4.04 mg/100 g DW at 39 h. Prolongation of fermentation to 46 h resulted in a pronounced decrease to 48.20 ± 0.36 mg/100 g DW, which was significantly lower than in the unfermented sample (p < 0.05).
Figure 1.
Changes in total free amino acid (FAA) content during Rhizopus oligosporus fermentation of non-ozonated (NO) and ozonated (O) faba bean samples. Values are expressed as mg/100 g dry weight (DW) and presented as mean ± SD (n = 3). Different letters indicate statistically significant differences between samples (one-way ANOVA followed by Tukey’s HSD test, p < 0.05). The 0 h point represents the common unfermented baseline. The effects of ozone pretreatment, fermentation time and their interaction were evaluated separately using two-way ANOVA, excluding the common baseline (Supplementary Table S3).
Ozonated samples showed a different pattern, particularly during prolonged fermentation. Total FAA content reached 150.77 ± 0.32 and 152.51 ± 2.32 mg/100 g DW after 15 and 22 h, respectively, followed by a substantial increase to 370.93 ± 9.07 mg/100 g DW at 39 h and 543.55 ± 3.58 mg/100 g DW at 46 h. At 22 h, the total FAA contents of O and NO samples did not differ significantly, whereas significantly higher concentrations were observed in ozonated samples at 15, 39 and 46 h. The largest difference between treatments occurred after 46 h, when the total FAA content of the ozonated samples was more than eleven-fold higher than that of the corresponding non-ozonated samples.
Two-way ANOVA of log-transformed total FAA concentrations revealed significant effects of ozone pretreatment, fermentation time, and their interaction (all p < 0.0001; Supplementary Table S3). The significant interaction indicates that the effect of ozone pretreatment on total FAA depended on fermentation time.
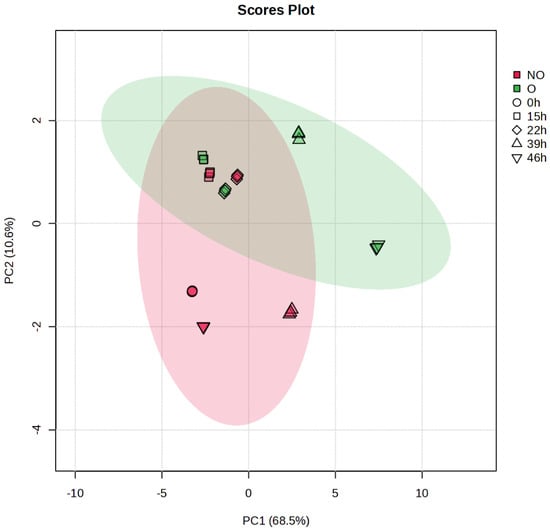
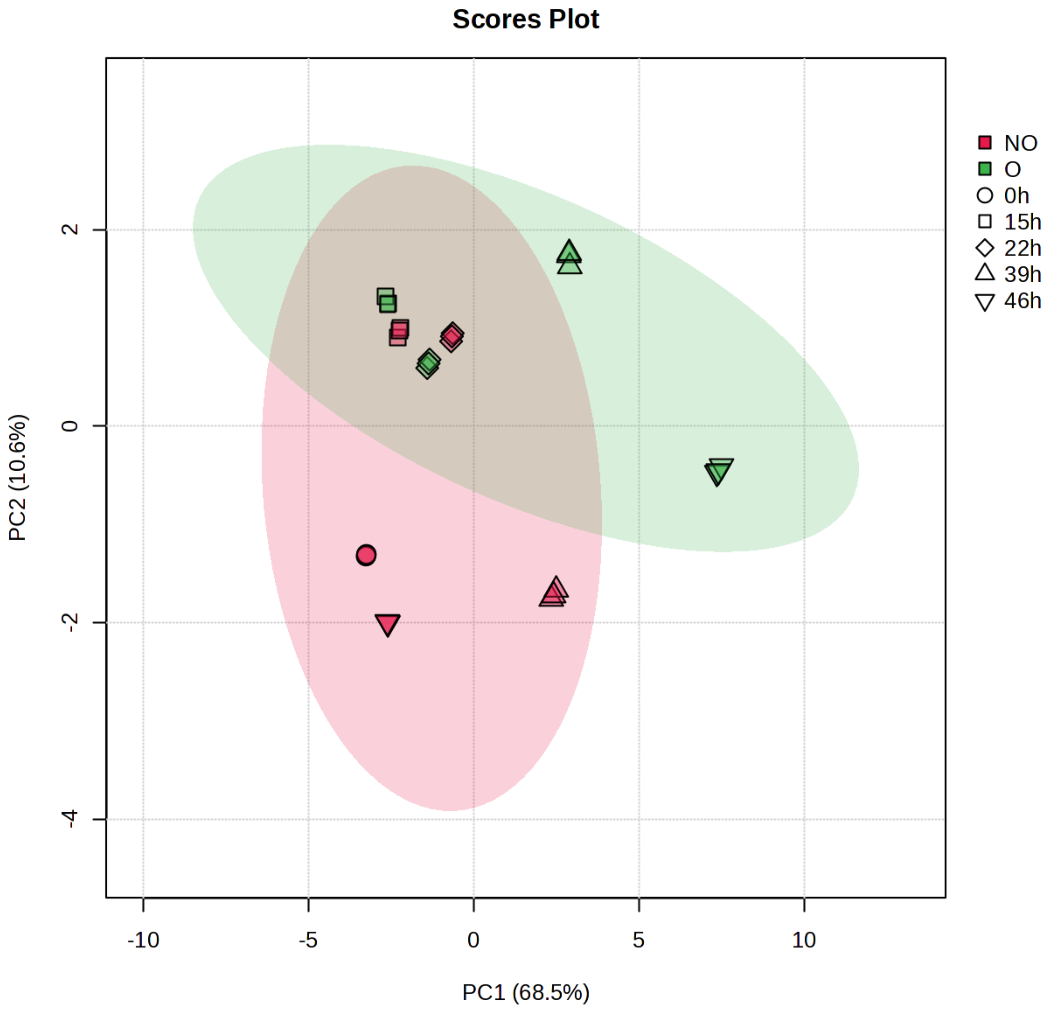
Principal component analysis further demonstrated substantial changes in FAA composition during fermentation (Figure 2). The first two principal components accounted for 79.1% of the total variance, with PC1 and PC2 explaining 68.5% and 10.6%, respectively. Samples collected after 15 and 22 h were positioned relatively close to each other, whereas greater differentiation between NO and O samples became apparent after 39 and 46 h. In particular, the O samples collected at 39 and 46 h occupied positions distinct from the corresponding NO samples.
Figure 2.
Principal component analysis (PCA) scores plot of free amino acid profiles in non-ozonated (NO) and ozonated (O) faba bean samples during Rhizopus oligosporus fermentation. Colours indicate ozone pretreatment, while symbols indicate fermentation time (0, 15, 22, 39 and 46 h). PC1 and PC2 explained 68.5% and 10.6% of the total variance, respectively. Shaded ellipses summarize the spread of samples within the displayed groups.
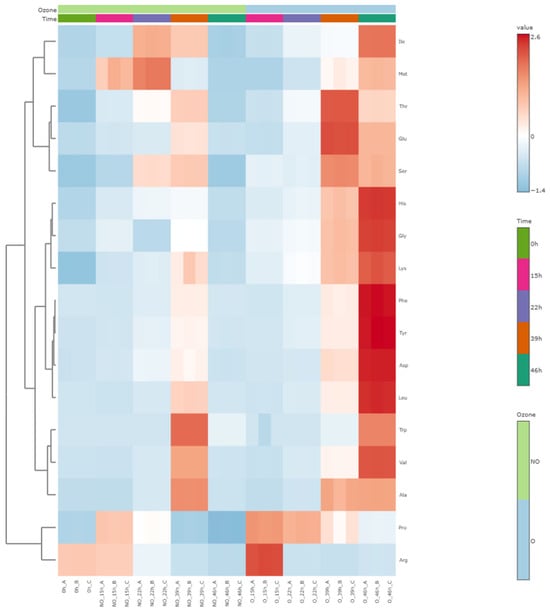
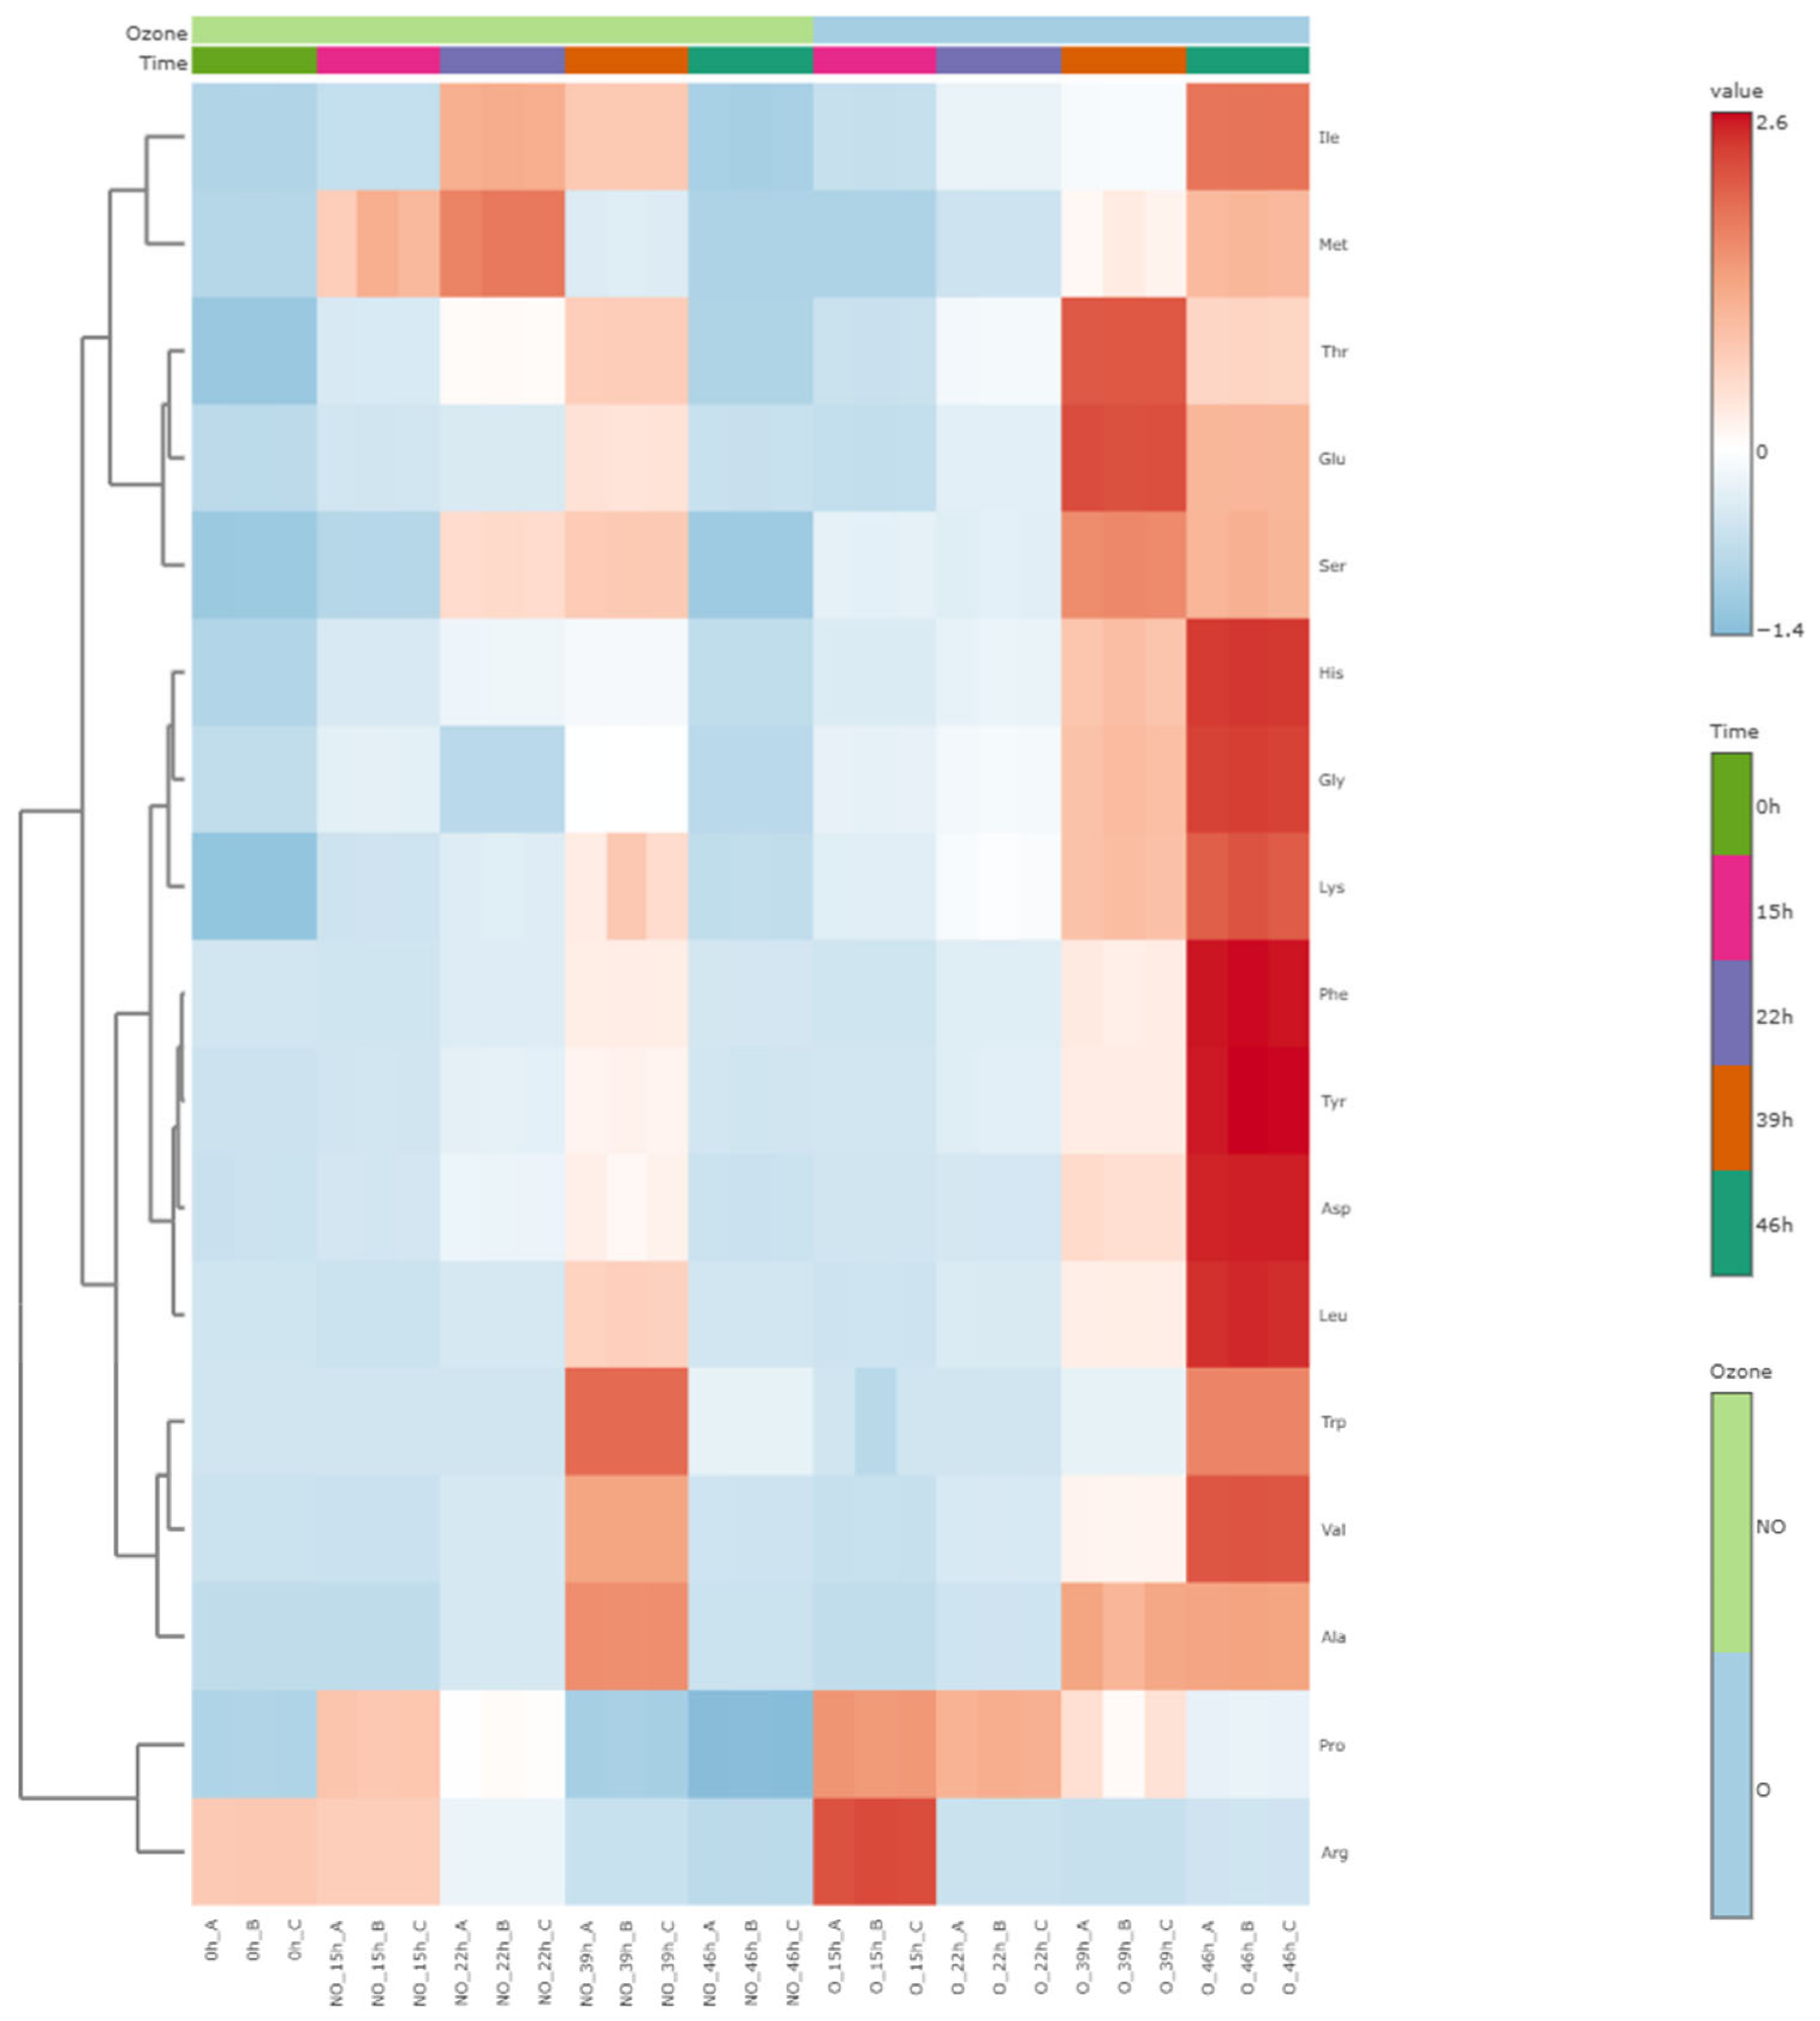
Hierarchical clustering of the autoscaled FAA data was consistent with the PCA results and showed pronounced changes in individual amino acid profiles at the later fermentation stages (Figure 3). The O 46 h sample was characterised by relatively high levels of several FAA, particularly phenylalanine, tyrosine, aspartic acid, leucine, histidine, glycine and lysine. O 39 h sample was associated with comparatively high relative levels of glutamic acid, serine and threonine. In contrast, proline and arginine displayed different temporal patterns from most other FAA, with relatively high abundance during the earlier stages of fermentation. Overall, the multivariate analyses indicate that the greatest changes in FAA composition occurred during prolonged fermentation and that these changes differed markedly between ozonated and non-ozonated samples.
Figure 3.
Heatmap of autoscaled free amino acid profiles in non-ozonated (NO) and ozonated (O) faba bean samples during Rhizopus oligosporus fermentation. Rows represent individual free amino acids and columns represent biological replicates collected at 0, 15, 22, 39 and 46 h of fermentation. Amino acids were grouped by hierarchical clustering. The annotation bars indicate ozone pretreatment and fermentation time. Red and blue colours represent relatively higher and lower autoscaled values, respectively.
2.2. Changes in Vicine, Convicine and L-DOPA During Fermentation
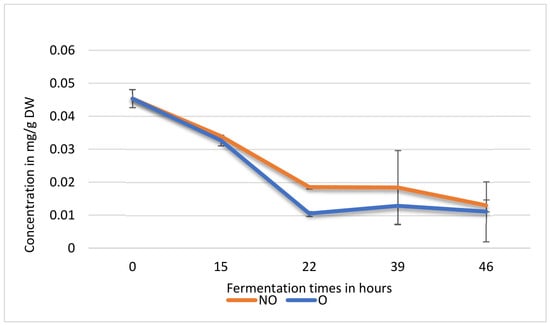
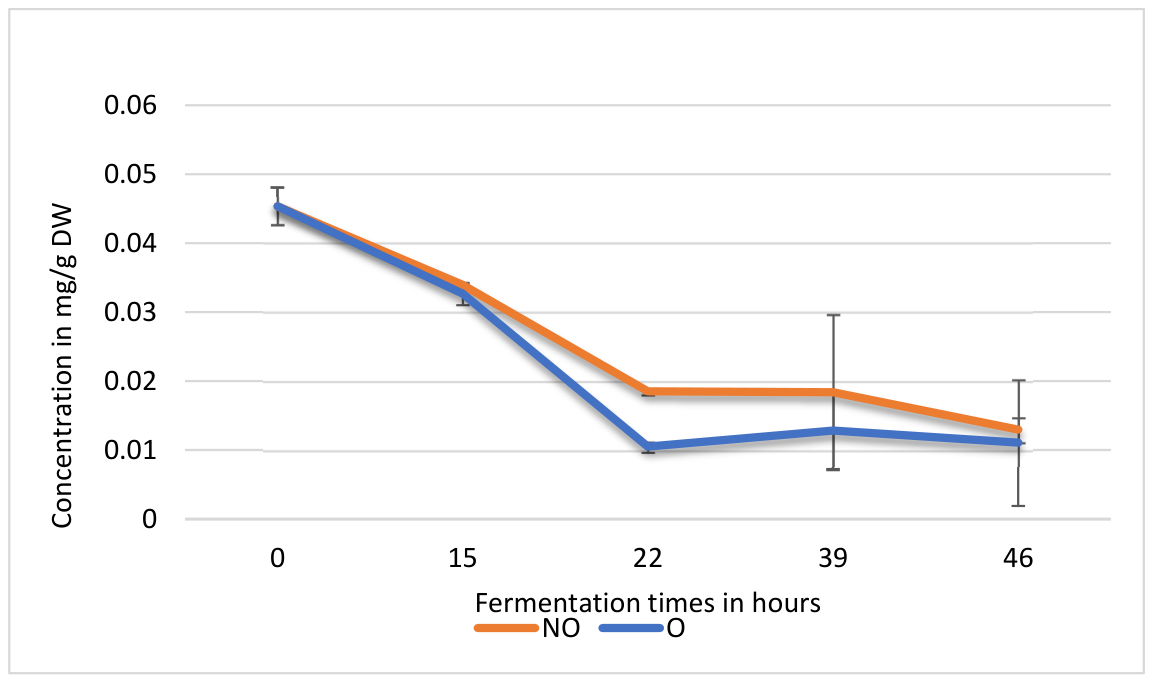
L-DOPA concentration decreased markedly during Rhizopus oligosporus fermentation in both NO and O samples (Figure 4). The common unfermented baseline contained approximately 0.045 mg/g DW L-DOPA. After 15 h of fermentation, concentrations remained relatively high and were similar between treatments, reaching approximately 0.034 mg/g DW in NO samples and 0.033 mg/g DW in O samples. A further decrease was observed after 22 h, with mean concentrations of approximately 0.019 mg/g DW in NO samples and 0.011 mg/g DW in O samples. At 39 and 46 h, L-DOPA remained at relatively low levels in both treatments. Overall, L-DOPA concentrations showed a general decreasing trend during fermentation, although the magnitude and temporal pattern of the changes differed between treatments.
Figure 4.
Changes in L-DOPA concentration during Rhizopus oligosporus fermentation of non-ozonated (NO) and ozonated (O) faba bean samples. Values are expressed as mg/g dry weight (DW) and presented as mean ± SD (n = 3). The 0 h point represents the common unfermented baseline.
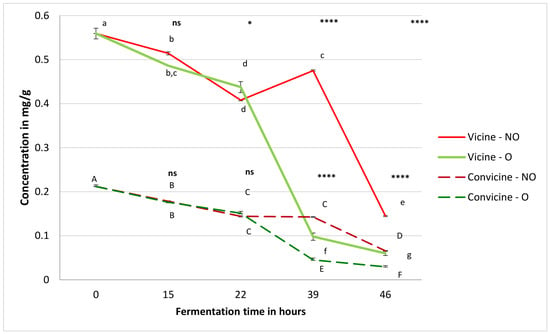
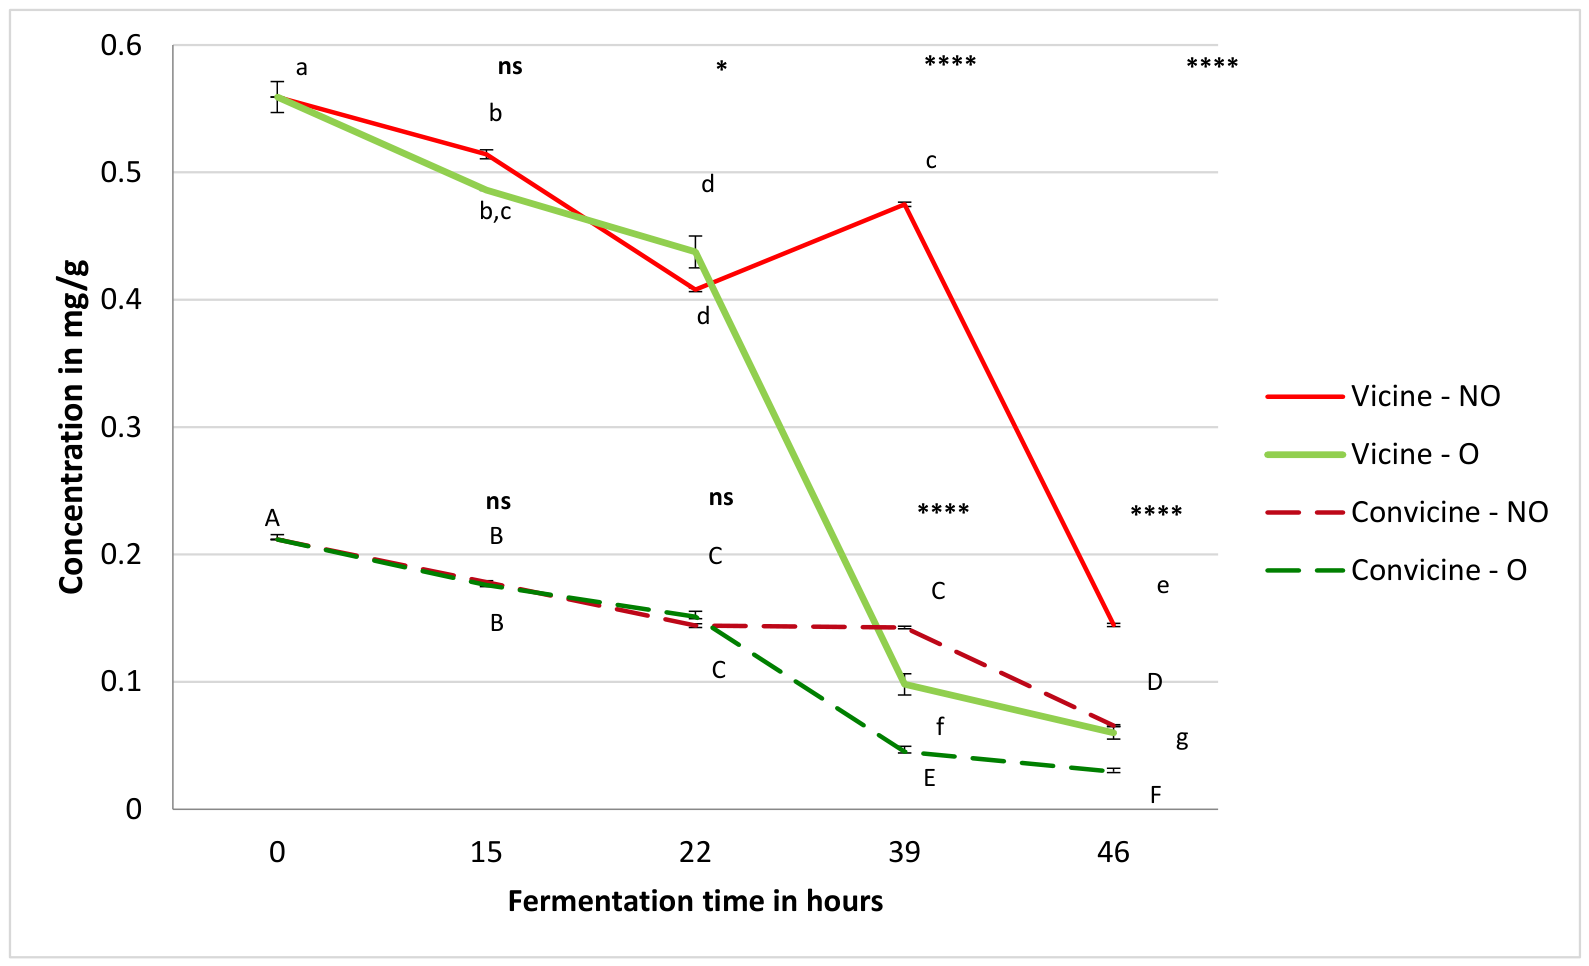
Pyrimidine glucosides’ results are presented in Figure 5. Vicine concentration decreased only moderately during the first 22 h of fermentation. At 39 h, however, a pronounced difference between treatments was observed: vicine remained at approximately 0.47 mg/g DW in NO samples, whereas its concentration decreased to approximately 0.10 mg/g DW in O samples. After 46 h, vicine concentration decreased further in both treatments, reaching approximately 0.14 mg/g DW in NO samples and 0.06 mg/g DW in O samples.
Figure 5.
Changes in vicine and convicine concentrations during Rhizopus oligosporus fermentation of non-ozonated (NO) and ozone-pretreated (O) faba bean samples. Vicine concentrations are expressed as mg/g dry weight (DW), whereas convicine concentrations are expressed as mg vicine equivalents/g DW. Values are presented as mean ± SD (n = 3). Different lowercase letters (vicine) and uppercase letters (convicine) indicate significant differences among the nine groups according to one-way ANOVA followed by Tukey’s HSD test (p < 0.05); vicine data were natural-log transformed before analysis. Asterisks indicate Tukey-adjusted comparisons between NO and O at the same fermentation time based on the separate two-way ANOVA models, excluding the common 0 h baseline (* p < 0.05; **** p < 0.0001; ns, not significant).
Convicine showed a broadly similar pattern. Its concentration decreased gradually during the early stages of fermentation, followed by a substantially greater reduction in ozonated samples during prolonged fermentation. At 39 h, convicine concentration was approximately 0.14 mg of vicine equivalent/g DW in NO samples compared with approximately 0.045 mg of vicine equivalent/g DW in O samples. At 46 h, concentrations decreased to approximately 0.066 and 0.029 mg of vicine equivalent/g DW in NO and O samples, respectively.
Two-way ANOVA performed on fermented samples (15–46 h) showed significant effects of fermentation time, ozone pretreatment and their interaction for both vicine and convicine (p < 0.0001). For vicine, analysed after natural-log transformation, Tukey-adjusted post-hoc comparisons showed no significant difference between NO and O samples at 15 h (p = 0.1604), a significant difference at 22 h (p = 0.0453), and highly significant differences at 39 and 46 h (p < 0.0001). For convicine, no significant differences between NO and O samples were observed at 15 h (p = 0.9869) or 22 h (p = 0.1960), whereas significant differences were observed at 39 and 46 h (p < 0.0001). Overall, treatment-related differences in vicine and convicine were most pronounced during the later stages of fermentation, consistent with the significant time × ozone interactions observed for both pyrimidine glycosides.
2.3. Volatile Compound Profile During Fermentation
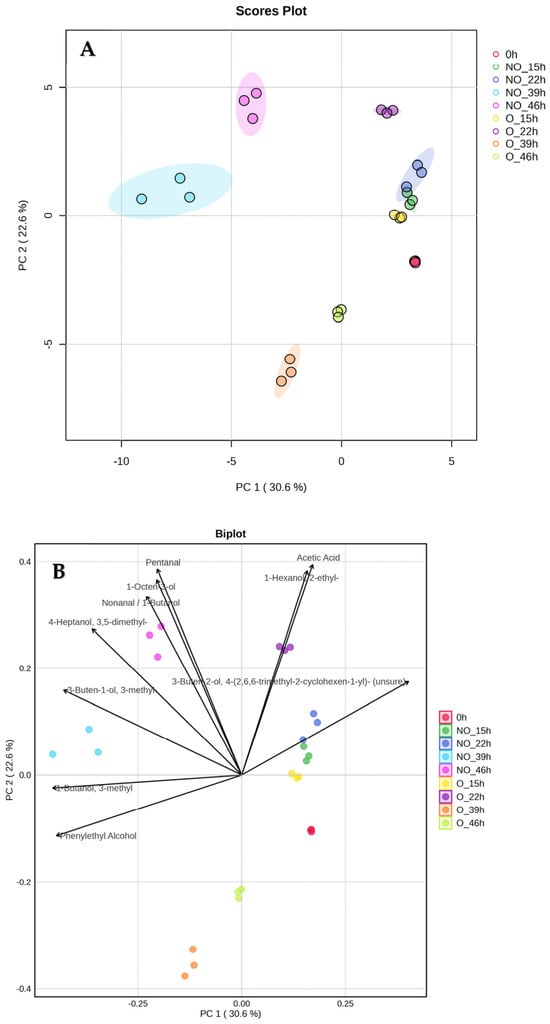
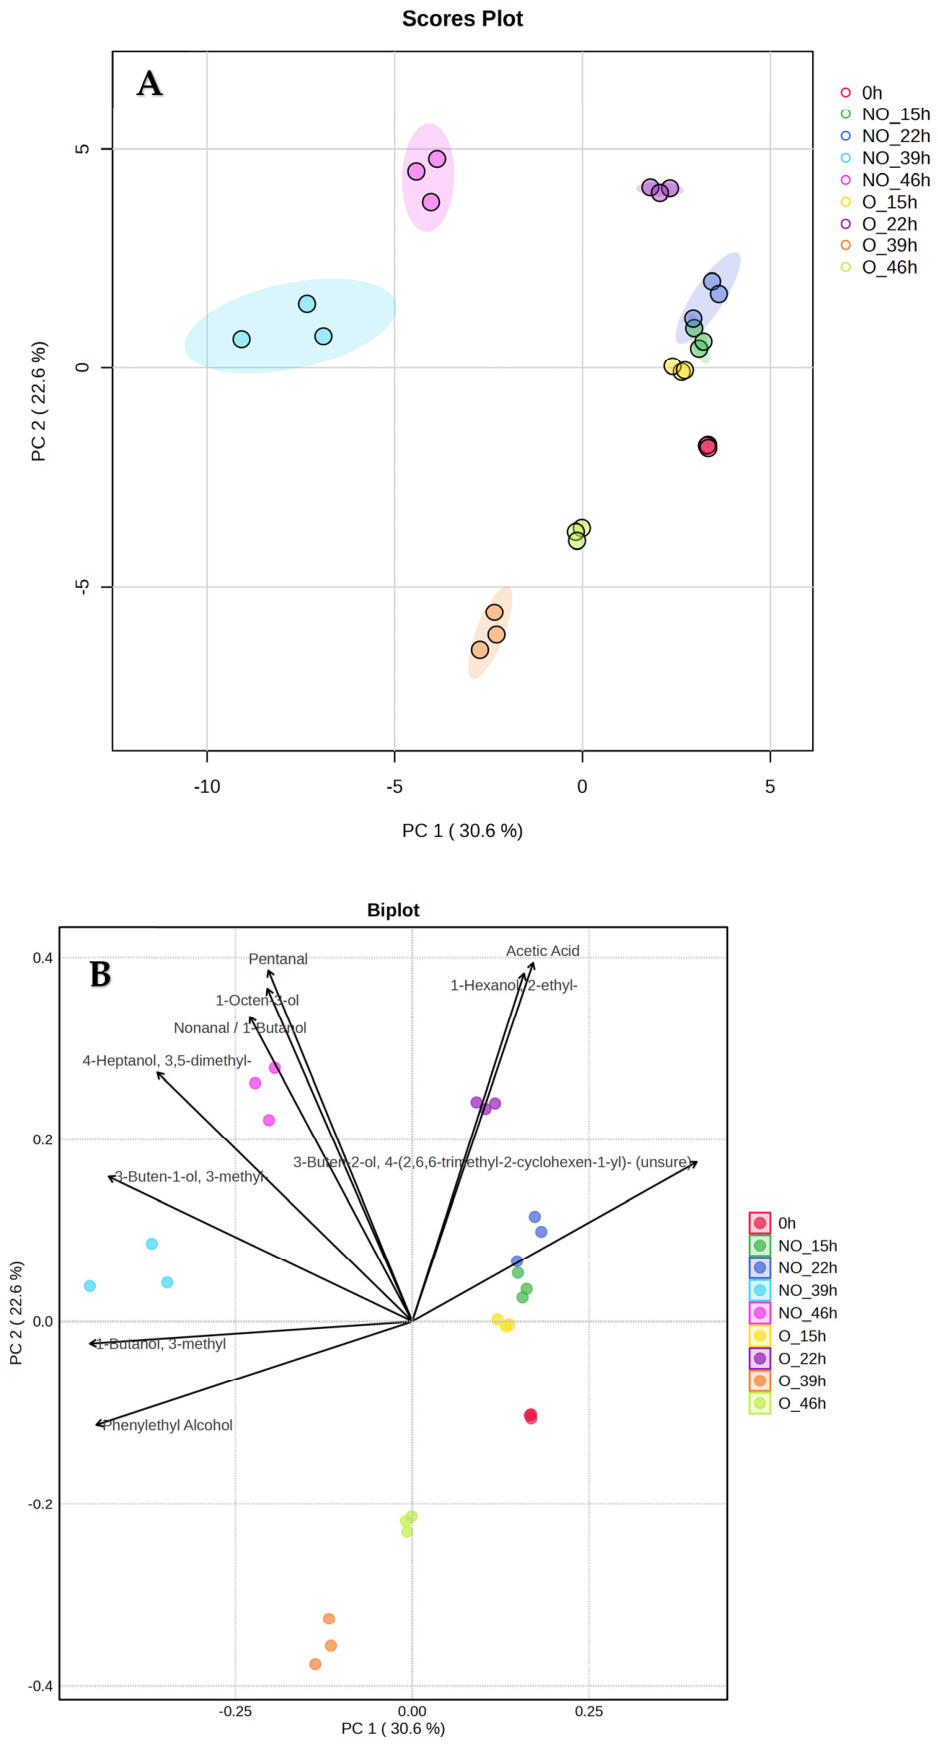
The volatile compound profile changed markedly during Rhizopus oligosporus fermentation, with increasingly pronounced differences between NO and O samples at the later fermentation stages. Principal component analysis showed clear differentiation among the treatment–time groups (Figure 6A). PC1 and PC2 explained 30.6% and 22.6% of the total variance, respectively, accounting together for 53.2% of the variability in the volatile dataset. Biological replicates clustered closely within individual groups, indicating good within-group reproducibility.
Figure 6.
Principal component analysis (PCA) scores plot (A) and biplot (B) of volatile compound profiles in faba bean samples during Rhizopus oligosporus fermentation. Samples represent the common unfermented baseline (0 h) and non-ozonated (NO) and ozonated (O) treatments collected after 15, 22, 39 and 46 h of fermentation. PC1 and PC2 explained 30.6% and 22.6% of the total variance, respectively. Shaded ellipses indicate the distribution of biological replicates within individual treatment–time groups.
The unfermented samples formed a distinct cluster, while samples fermented for 15 and 22 h occupied relatively similar regions of the PCA space. In contrast, substantially greater separation was observed at 39 and 46 h. In particular, NO39, O39, NO46 and O46 occupied clearly different regions of the scores plot, indicating that the effect of ozone pretreatment on the overall volatile profile became more apparent with prolonged fermentation. The biplot further indicated that the separation of the late-fermentation samples was associated with different groups of volatile compounds (Figure 6B). Phenylethyl alcohol and 3-methyl-1-butanol were oriented towards the region occupied by NO39 samples, whereas 1-octen-3-ol, pentanal, 2-butanol and 3,5-dimethyl-4-heptanol were more closely associated with the NO46 profile.
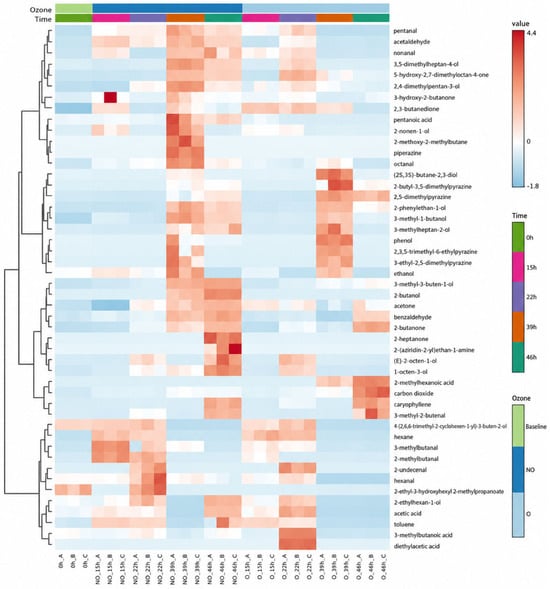
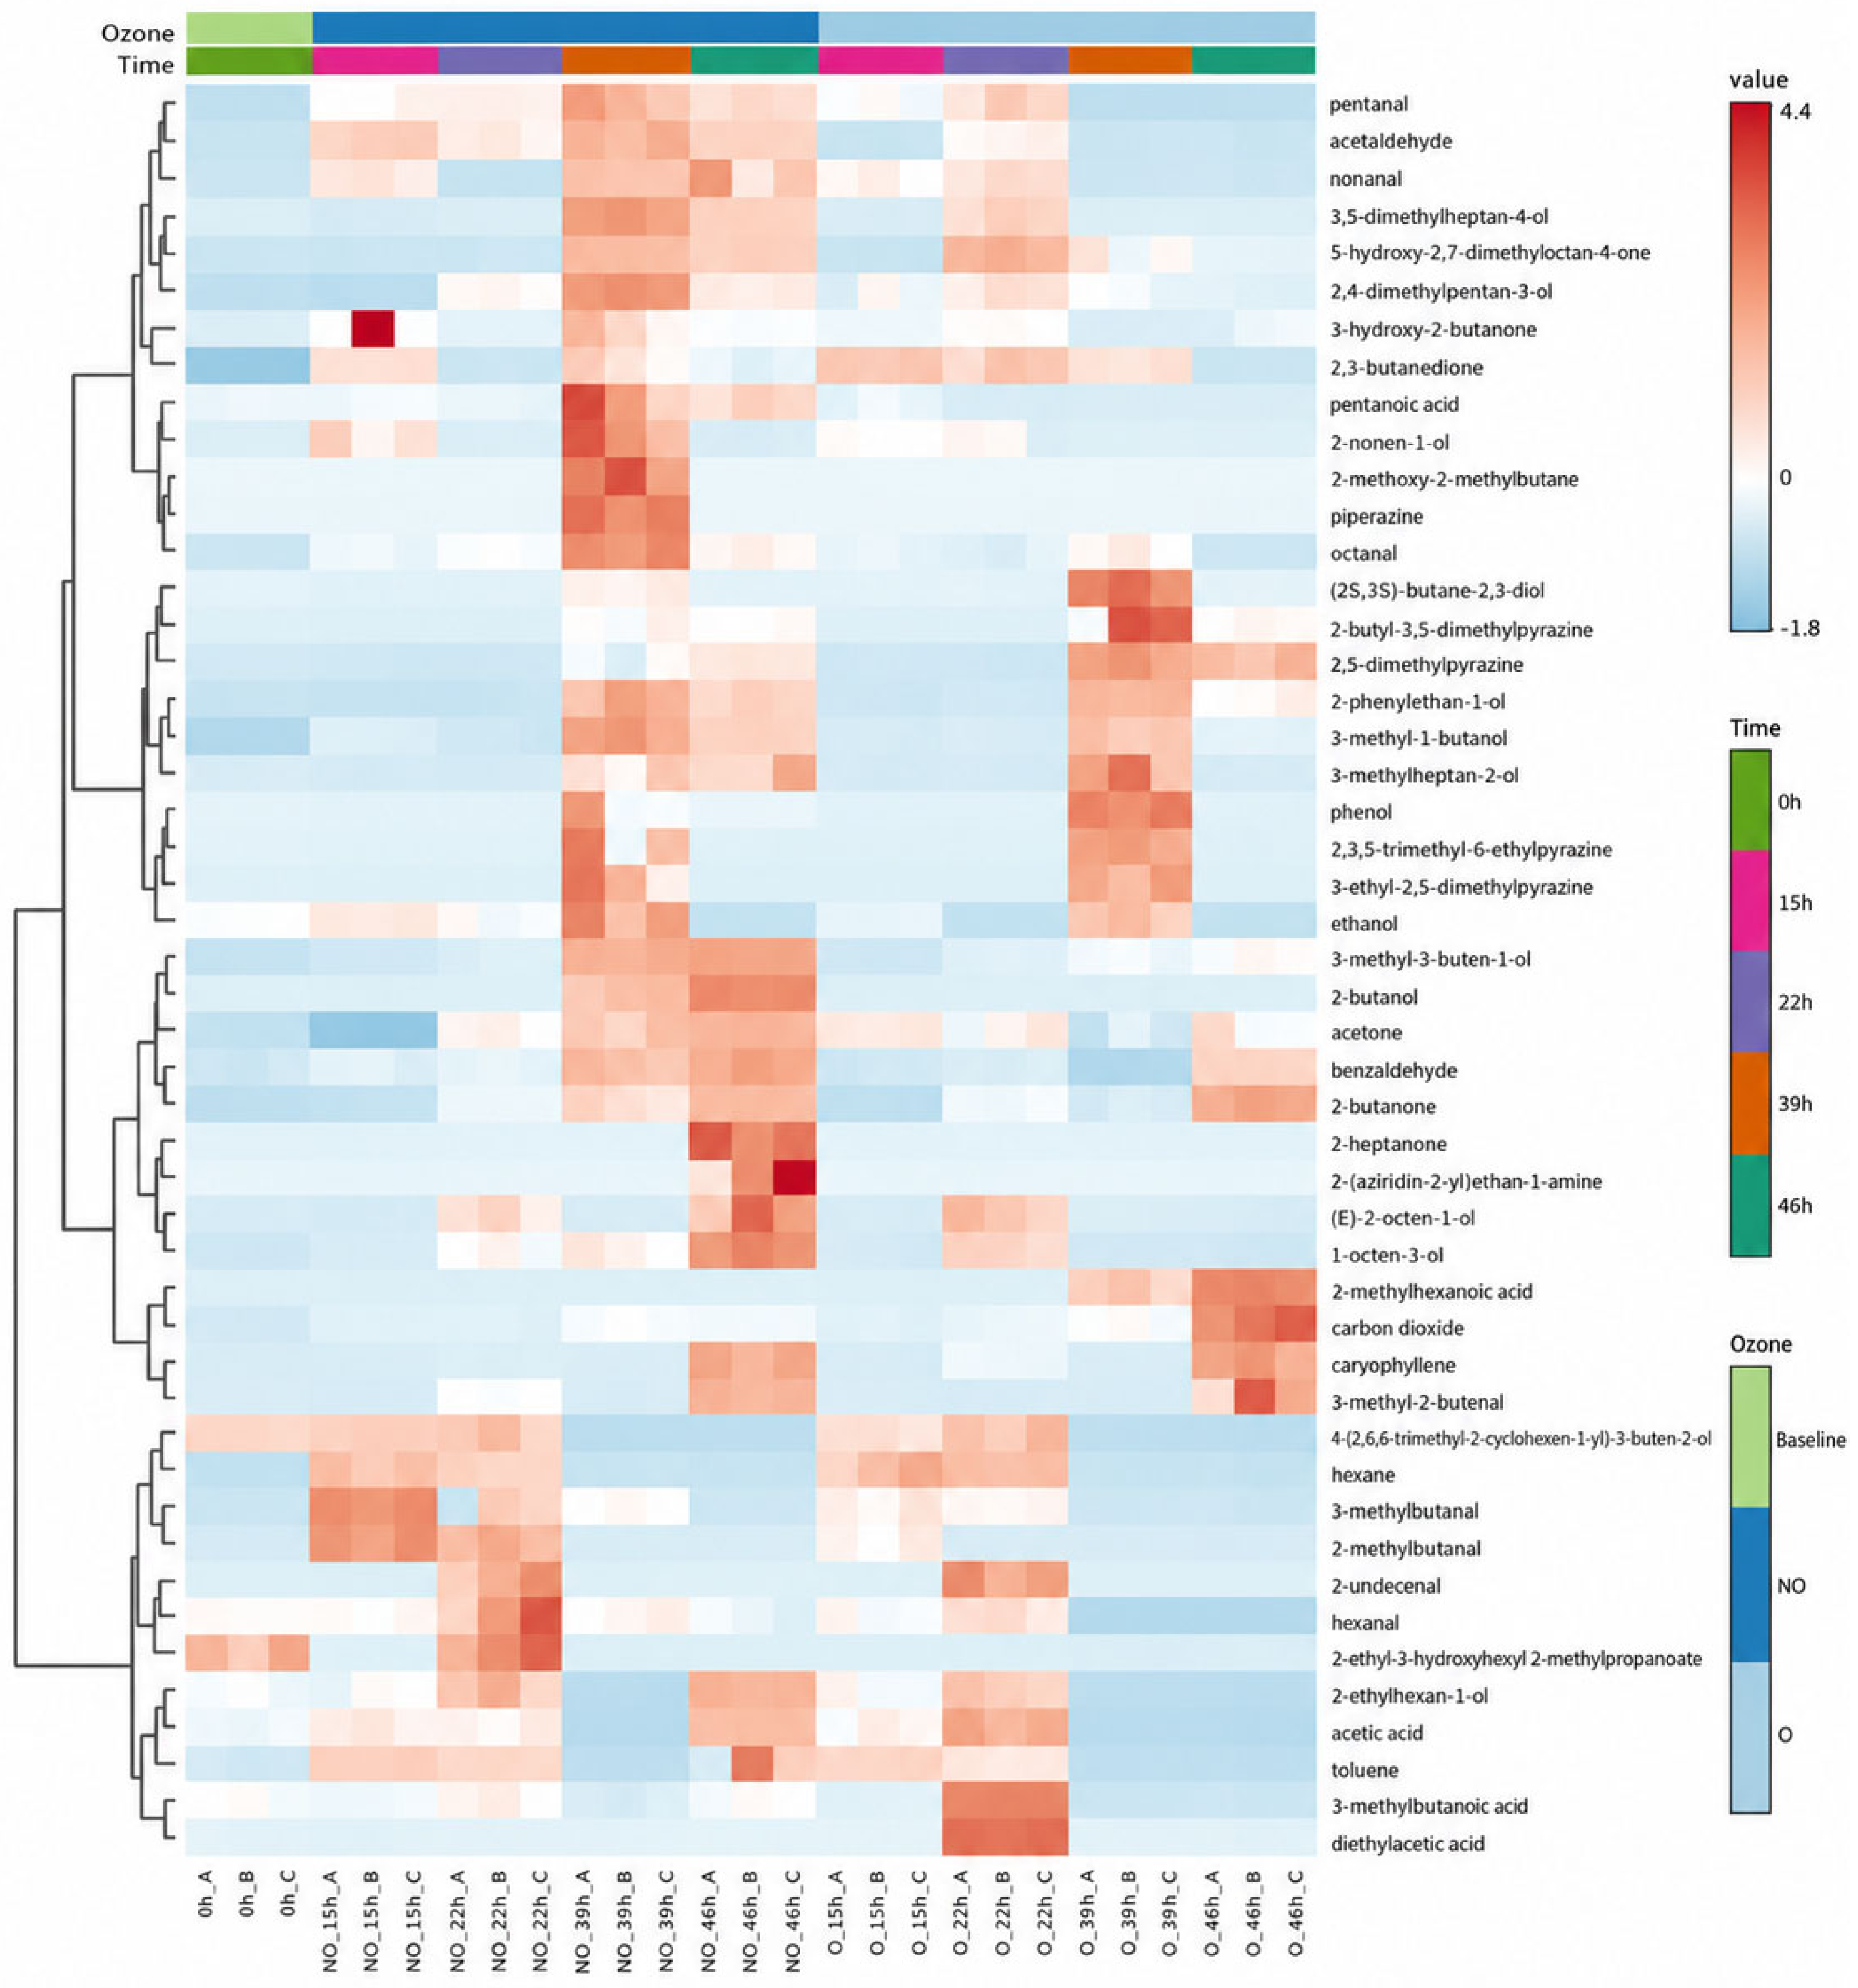
Hierarchical clustering of autoscaled volatile abundances supported the PCA results (Figure 7). Samples collected after 39 and 46 h showed the most pronounced treatment-dependent differences. Several compounds consistently detected in non-ozonated samples during prolonged fermentation were not consistently detected in the corresponding ozonated samples, according to the criterion of detection in at least two of three biological replicates (Table S1). These included pentanal, hexanal and nonanal, compounds associated predominantly with grassy/green aroma notes, as well as 1-octen-3-ol, associated with earthy and mushroom-like notes, and 2-butanol and the acids pentanoic acid and 3-methylbutanoic acid. Acetic acid was also not consistently detected from O39 and O46 samples, while remaining detectable at later fermentation stages in the non-ozonated treatment. In addition, 2-heptanone was detected only in NO46 among the late-fermentation samples.
Figure 7.
Heatmap of autoscaled volatile compound profiles in faba bean samples during Rhizopus oligosporus fermentation. Columns represent biological replicates of the common unfermented baseline (0 h) and non-ozonated (NO) and ozonated (O) samples collected after 15, 22, 39 and 46 h of fermentation. Rows represent individual volatile compounds grouped by hierarchical clustering. Annotation bars indicate ozone pretreatment and fermentation time. Red and blue colours represent relatively higher and lower autoscaled abundances, respectively.
Conversely, some volatile compounds were characteristic of the ozonated samples during prolonged fermentation. For example, 2-methylhexanoic acid was detected in O39 and O46 but not in the corresponding NO samples. Several pyrazines, including 2,5-dimethylpyrazine and 2-butyl-3,5-dimethylpyrazine, were primarily associated with the later fermentation stages in both treatments. Additionally, 2,5-Dimethylpyrazine was identified as a compound associated with later fermentation stages (39 and 46 h), while compounds such as phenylethyl alcohol, 2-butanone, 2,3-butanedione and 3-methyl-3-buten-1-ol were mainly associated with fermented rather than unfermented samples.
The tentatively identified volatile compounds were further classified according to their reported aroma descriptors (Table 1). Based on the revised classification, the largest groups comprised compounds associated with fruity/sweet and pungent/ammonia notes (8 compounds each), followed by grassy/green and nutty notes (5 compounds each). Four compounds each were assigned to earthy, malty/fermented and sweaty/cheesy categories, while three compounds were associated with buttery/creamy notes and two with floral notes. Individual compounds could be assigned to more than one aroma category.
Table 1.
Classification of tentatively identified volatile compounds according to their reported aroma descriptors. Individual compounds may be assigned to more than one category based on their reported odour characteristics.
The compositional changes observed during prolonged fermentation were therefore reflected not only in the multivariate separation of the samples but also in the distribution of compounds with different reported aroma characteristics. In particular, the O39 and O46 profiles were characterized by lack of consistent detection of several grassy/green, earthy and sweaty/cheesy-associated volatiles detected in the corresponding NO samples, together with the presence of other compounds characteristic of the late ozonated samples.
2.4. Sensory Aroma Profile
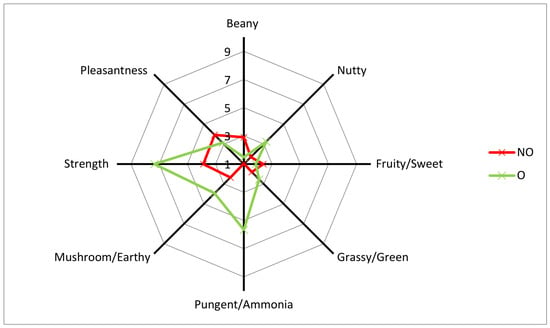
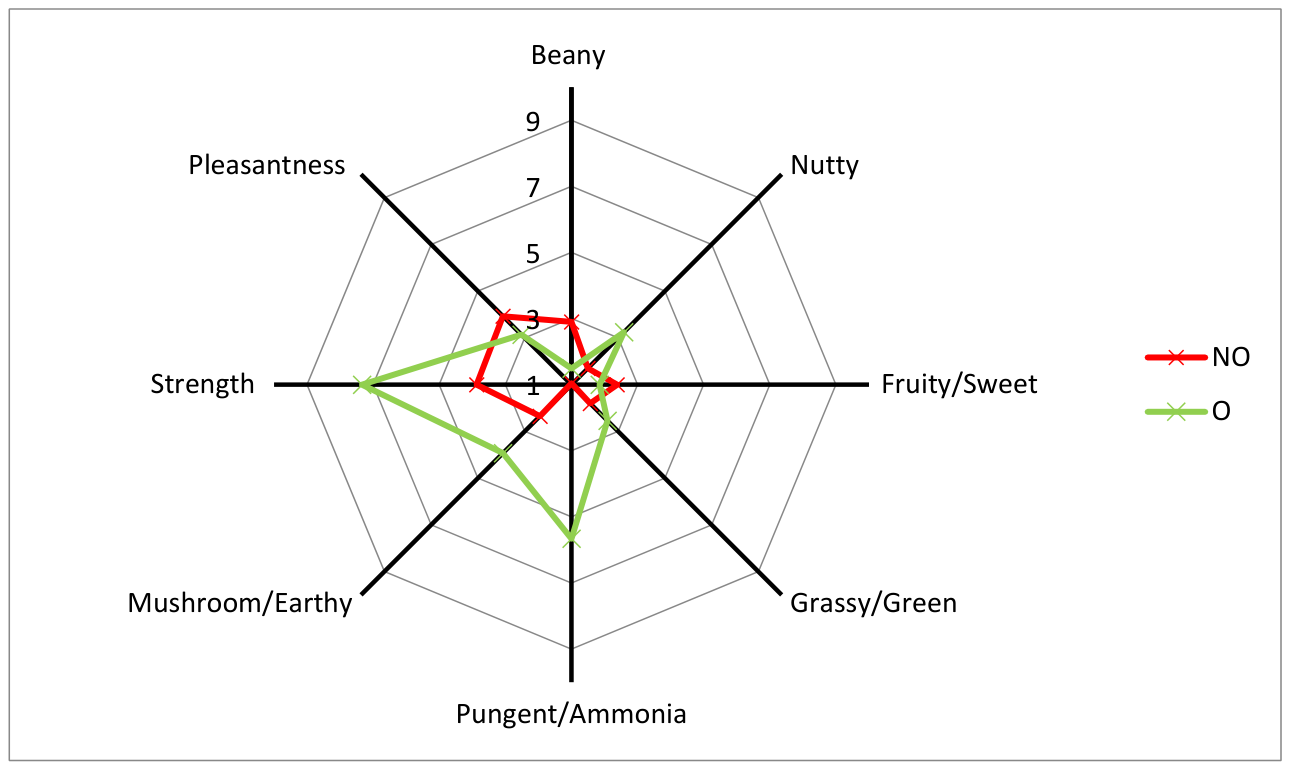
The sensory profiles of uncooked faba bean tempeh differed between NO and O samples (Figure 8).
Figure 8.
Descriptive aroma profiles of uncooked faba bean tempeh after 24 h of fermentation, with (O) and without (NO) ozone pretreatment. Mean scores from ten assessors are presented for aroma attributes, overall aroma strength and pleasantness. Aroma intensity was evaluated on a 0–10 scale, from not perceivable to extremely intense, while pleasantness was assessed from extremely unpleasant (0) to extremely pleasant (10). Standard deviations are provided in Supplementary Table S4. Samples originated from one production batch per treatment.
The ozonated sample received higher mean scores for overall aroma strength and pungent/ammonia notes. Higher mean scores were also observed for nutty and mushroom/earthy attributes, whereas beany and fruity/sweet notes received lower scores in the ozonated sample. Pleasantness scores were similar between treatments. However, these observations are descriptive, and no statistical inference regarding treatment effects was performed.
3. Discussion
The present study demonstrates that ozone pretreatment modified the chemical and volatile changes occurring during Rhizopus oligosporus fermentation of faba bean, but its effect was strongly dependent on fermentation time and on the group of compounds considered. Fermentation time was the predominant factor affecting L-DOPA, whereas significant time × ozone interactions were observed for vicine and convicine. A similarly time-dependent response was evident for FAA and volatile compounds, for which the greatest differences between ozonated and non-ozonated samples developed during prolonged fermentation. Thus, ozone pretreatment did not produce a uniform shift in composition but rather altered the subsequent biochemical changes occurring during fermentation.
The marked changes in FAA are consistent with the proteolytic activity associated with Rhizopus fermentation [12,13]. Proteolysis during tempeh fermentation releases peptides and free amino acids from seed storage proteins, and increases in FAA and protein digestibility during fermentation have previously been reported for tempeh and faba bean-based products [13,20]. In the present study, however, the temporal pattern differed substantially between NO and O samples. In NO samples, total FAA increased until 39 h but subsequently decreased sharply at 46 h, whereas ozonated samples showed continued accumulation, reaching their highest FAA concentration after 46 h. The more pronounced FAA accumulation in O samples may reflect altered fermentation dynamics following ozone pretreatment. One possible hypothesis is that ozone pretreatment may have temporarily modified oxygen availability or substrate properties, potentially influencing subsequent fungal metabolism. However, neither oxygen availability nor fungal growth was measured, and this hypothesis cannot be confirmed by the present results [17,18]. Increased oxygen transfer has previously been associated with higher biomass production during Rhizopus oryzae fermentation [21], but whether a similar mechanism contributed to the present observations remains to be established. The pronounced decrease in FAA in NO46, observed across all three replicates, may reflect increased amino acid utilization by R. oligosporus during prolonged fermentation. Previous studies have shown that individual FAA concentrations may increase or decrease depending on fermentation time and fungal activity [14], while Sparringa and Owens (1999) [22] demonstrated that R. oligosporus utilizes hydrolysed proteins for biomass formation and metabolism. In contrast, the continued FAA accumulation in ozonated samples suggests that ozone pretreatment may have modified substrate properties and fungal metabolic activity, shifting the balance towards amino acid release rather than utilization. However, these mechanisms remain hypothetical, as fungal metabolism and oxygen availability were not directly measured.
The decrease in vicine and convicine during fermentation agrees with previous observations showing that R. oligosporus fermentation effectively reduces pyrimidine glycosides in faba bean [15]. In the present study, this reduction was strongly influenced by ozone pretreatment during the later stages of fermentation. Particularly large differences between O and NO samples were observed at 39 and 46 h, and the significant time × ozone interactions confirmed that the effect of ozone depended on fermentation time. However, the observed reduction in vicine and convicine concentrations should not be interpreted as complete detoxification, as their degradation products, including divicine and isouramil, were not analysed. Consequently, the fate of these compounds and the overall reduction in favism-related risk cannot be established from the present results. This finding may also be relevant from a sensory perspective, since vicine and its derivatives have been associated with bitterness in faba bean, including activation of bitter taste receptors [6,7]. However, taste was not evaluated in the present study, and therefore a direct relationship between the reduction in pyrimidine glycosides and sensory perception cannot be established.
L-DOPA followed a slightly different pattern. Its concentration decreased substantially during fermentation in both treatments, and the decrease was observed mainly with increasing fermentation time. Consequently, the reduction in L-DOPA was observed in both treatments, although the relative contribution of fermentation time and ozone pretreatment was not established statistically. This is generally consistent with Polanowska et al. (2020), who also reported a decrease in L-DOPA during R. oligosporus fermentation of faba bean [15]. This contrasts with vicine and convicine and further supports the observation that the measured compounds exhibited different temporal profiles.
The volatile profile also showed that the effect of ozone became more evident during prolonged fermentation. PCA and hierarchical clustering indicated relatively limited differentiation during the early fermentation stages but pronounced separation of O and NO samples after 39 and 46 h. Several compounds associated with grassy, green and earthy or other potentially undesirable aroma notes, including pentanal, hexanal, nonanal and 1-octen-3-ol, were detected in the prolonged-fermentation NO samples but were not consistently detected from the corresponding ozonated samples. Hexanal is frequently reported as an important green and beany volatile in faba bean and tempeh products and is associated with oxidation of linoleic acid, while nonanal has been linked to oleic acid oxidation [8,9,10,16,23,24,25]. Similarly, 1-octen-3-ol is associated with lipid-derived reactions and has been reported in raw faba bean and fermented products [8,9,16,23,24,25].
These changes should not, however, be interpreted as a simple direct removal of volatile compounds by ozone. Ozone was applied before inoculation, whereas the largest differences in volatile composition became apparent only after prolonged fermentation. The resulting profiles therefore may reflect an interaction between ozone-induced changes in the substrate and subsequent fungal metabolism [17,18,19]. This interpretation is also consistent with previous observations that ozone can modify volatile profiles in other food matrices, including vegetable oils, although the direction of these changes is strongly matrix-dependent [19]. An additional limitation is that the non-ozonated control samples were not subjected to equivalent gas flow or handling conditions. Therefore, potential contributions of aeration and handling to the observed differences cannot be excluded. Moreover, not all changes observed in ozonated samples can necessarily be regarded as favourable. For example, 2-methylhexanoic acid was characteristic of late-fermentation ozonated samples and has previously been described as having cheesy, fatty and sweaty aroma characteristics in faba bean tempeh. The closest available comparison is the study by Fernandez Castaneda et al. (2025) [16], although that work used a different Rhizopus species and a different faba bean type, limiting direct comparison.
The sensory results further demonstrate that changes in volatile composition cannot be translated directly into perceived aroma. Although several compounds associated with undesirable aroma notes were not detected from ozonated samples during prolonged fermentation, the ozonated tempeh evaluated after 24 h received higher mean scores for overall aroma strength and pungent/ammonia notes. Mean nutty and mushroom/earthy scores were also higher, while beany and fruity/sweet scores were lower. Importantly, sensory evaluation was performed after 24 h, whereas volatile compound profiling was conducted at 15, 22, 39 and 46 h, and the strongest differences in volatile profiles occurred at 39 and 46 h. Moreover, the analysis characterised the overall volatile profile rather than identifying key aroma-active compounds. In addition, sensory perception depends not only on the presence of individual compounds but also on their odour thresholds, concentrations, matrix effects and interactions between volatiles [24,25,26]. Therefore, the non-detection of individual compounds cannot by itself be interpreted as an improvement in overall aroma. Synergistic and antagonistic interactions among volatile compounds may strongly influence their sensory expression [26]. Consequently, the sensory findings should be considered complementary to the instrumental results rather than directly correlated with individual volatile compounds.
Overall, the results indicate that ozone pretreatment can substantially modify the chemical and volatile development of faba bean during R. oligosporus fermentation, with the strongest effects becoming apparent during prolonged fermentation. At the same time, the response was compound-specific and did not consistently correspond to improved sensory perception. Further work should therefore focus on linking instrumental volatile analysis with odour activity. GC–olfactometry, as previously applied to faba bean by Ritter et al. (2024) [25], would be particularly useful for identifying which of the detected compounds actually contribute to the aroma of the product. Additional evaluation of flavour and texture would also be required to determine whether the compositional changes induced by ozone translate into an overall improvement in product quality.
Sensory evaluation conducted at 24 h revealed differences in mean aroma intensity scores between treatments; however, these findings were descriptive and cannot be directly related to the volatile profiles measured at other fermentation times. Furthermore, the mechanisms underlying the observed compositional changes and the fate of vicine and convicine degradation products were not investigated.
Overall, the findings indicate that ozone pretreatment can influence the development of faba bean tempeh during fermentation. Further studies should investigate the underlying mechanisms, assess the safety implications of pyrimidine glycoside degradation and evaluate sensory properties at matched fermentation times.
4. Materials and Methods
4.1. Materials and Fungal Strain
Dried and dehulled faba beans (Vicia faba L. minor, var. Amigo) were obtained from Spójnia Hodowla i Nasiennictwo Ogrodnicze Sp. z o.o. (Poland). Rhizopus oligosporus NRRL 2710 was obtained from the Northern Regional Research Laboratory (Peoria, IL, USA) and maintained on potato dextrose agar (Merck KGaA, Darmstadt, Germany). Cultures were revived for 72 h at 32 °C prior to inoculum preparation.
The liquid growth medium contained glucose (2%), yeast extract (0.5%), peptone (1%), MgCl2·6H2O (0.05%) and KH2PO4 (0.15%) (Merck KGaA, Darmstadt, Germany). Media and laboratory materials used for cultivation were sterilized by autoclaving at 120 °C for 15 min. Dry matter content was determined gravimetrically by drying samples at 105 °C until constant weight.
4.2. Inoculum Preparation
A suspension of revived R. oligosporus NRRL 2710 was prepared using 5 mL of sterile 0.9% NaCl solution and transferred to 100 mL of liquid medium in a baffled flask fitted with a gas-permeable, filtered cap to allow gas exchange while maintaining aseptic conditions. The culture was incubated for 18 h at 32 °C and 162 rpm in a shaking incubator (Heidolph, Schwabach, Germany). The resulting inoculum contained 3.5 g DM/L of fungal biomass. The prepared inoculum was stored at 4 °C for a maximum of 3 h before use.
4.3. Faba Bean Pretreatment, Ozonation and Fermentation
Dried, dehulled faba beans were soaked in water at a bean-to-water ratio of 1:2.5 (w/v) for 24 h at 4 °C. The beans were subsequently cooked in boiling water for 45 min, drained and allowed to cool.
The cooked material was divided into two portions. One portion was used without ozone pretreatment (NO), whereas the second portion was subjected to gaseous ozone treatment (O). Ozonation was performed using a commercially available ozone generator (Malatec 10700, Legnica, Poland) with a nominal ozone output of 400 mg/h. Approximately 300 g of cooked faba beans were placed in a covered 1 L glass beaker. Ozone-containing gas was introduced at the bottom of the beaker and allowed to flow upward through the bulk of the beans. The treatment was carried out for 30 min at room temperature. Based on the nominal generator output, the theoretical ozone production during treatment was 200 mg. However, the actual ozone concentration within the treatment vessel and the amount of ozone absorbed by the beans were not measured. Therefore, the nominal ozone production should not be interpreted as the actual ozone dose received by the material. The gas flow rate and relative humidity inside the treatment vessel were not monitored. The non-ozonated control samples were not subjected to equivalent gas flow and were handled without the additional steps associated with ozonation.
Approximately 50 g of cooked beans were transferred to sterile 600 mL beakers and inoculated with 0.9 mL of the prepared R. oligosporus inoculum and mixed with a sterile spoon. The inoculated material was divided into 10 g portions and placed in sterile Petri dishes (approx. 1 cm layer). The fermentation was carried out at 30 °C with no forced aeration. Samples were collected after 15, 22, 39 and 46 h of fermentation.
The common 0 h baseline consisted of cooked, uninoculated faba beans collected before ozone pretreatment. This baseline was used to characterize the initial substrate composition. Separate samples immediately following ozone pretreatment were not collected for chemical analysis. Consequently, the immediate effects of ozonation could not be distinguished from changes occurring during subsequent fermentation.
Three independent batches of cooked faba beans were prepared for each treatment (NO and O). Each batch was processed and inoculated separately and constituted one biological replicate. Following inoculation, separate Petri dishes were prepared for each fermentation time point. Sampling was destructive, with individual dishes collected after 15, 22, 39 and 46 h. Samples intended for chemical analyses were frozen at −50 °C immediately after collection to terminate fermentation and subsequently freeze-dried. The freeze-dried samples were stored in sealed containers under refrigerated conditions until analysis. Fresh, non-freeze-dried samples were used for sensory evaluation and SPME–GC–MS analysis.
4.4. Free Amino Acid Determination
Free amino acids were extracted twice from 0.25 g of ground sample using 2.5 mL of 80% (v/v) aqueous ethanol. Each extraction involved sonication for 30 min followed by centrifugation at 10,000 rpm for 10 min at 4 °C. The combined extracts were transferred to a 5 mL volumetric flask and adjusted to volume with 80% ethanol.
For derivatization, 2 mL of extract were evaporated under vacuum in the presence of 30 µL of norleucine (0.731 mg/mL) as an internal standard. Subsequently, 80 µL of coupling reagent consisting of methanol, water and triethylamine (2:2:1, v/v/v) were added and the sample was dried under vacuum. Derivatization was carried out with 160 µL of methanol/PITC/triethylamine/water (7:1:1:1, v/v/v/v) for 30 min at room temperature. After removal of excess PITC under vacuum, the derivatives were dissolved in 1.5 mL of a 1:1 (v/v) mixture of buffer A and methanol and filtered prior to HPLC analysis.
FAA were analysed using an Agilent Technologies 1200 Rapid Resolution LC system (Agilent Technologies, Inc., Santa Clara, CA, USA) equipped with a UV–Vis DAD 1260 detector and a Zorbax Eclipse Plus C18 column (4.6 × 150 mm, 5 µm). Gradient elution was performed using 0.1 M ammonium acetate, pH 5.12 (solvent A), and water/acetonitrile (40:60, v/v; solvent B). The flow rate was 0.9 mL/min. The gradient programme was as follows: 0 min, 100% A; 15 min, 70% A; 25 min, 65% A; 40 min, 40% A; and 45 min, 100% A. The column temperature was maintained at 39 °C, the injection volume was 10 µL and detection was carried out at 254 nm. Amino acids were identified by comparison of retention times with analytical standards. Supplementary Table S6 presents the concentrations of individual amino acids (mean ± SD; mg/100 g DW).
Analytical precision was evaluated by analysing three independently prepared sample extracts (n = 3) and expressed as relative standard deviation (RSD, %). Recovery was assessed by spiking the faba bean matrix with known amounts of analytical standards before extraction and calculating the percentage of the added analyte recovered. Limits of detection (LOD) and quantification (LOQ) were estimated using chromatographic signal-to-noise ratios of approximately 3 and 10, respectively. The corresponding LOD and LOQ values were expressed in mg/100 g DW. Analytical performance characteristics are presented in Supplementary Table S2.
4.5. L-DOPA Determination
Ground samples (0.25 g) were extracted twice with 5 mL of 0.2% aqueous acetic acid. Each extraction included sonication for 10 min at room temperature followed by centrifugation for 10 min at 1000× g.
L-DOPA was analysed using an Agilent 1200 Rapid Resolution LC system equipped with a UV–Vis DAD 1260 detector and a Zorbax Eclipse Plus C18 column. Isocratic separation was performed using a mobile phase consisting of 3% methanol and 97% 0.2% aqueous acetic acid (v/v) at a flow rate of 1 mL/min. Detection was performed at 280 nm and L-DOPA was quantified using external calibration.
4.6. Vicine and Convicine Determination
Approximately 0.5 g of finely ground sample were extracted twice with 7.5 mL of 7% (v/v) perchloric acid. Samples were vortexed for 1 min and centrifuged at 10,000 rpm for 10 min at 4 °C. The supernatants were filtered through 0.45 µm syringe filters prior to chromatographic analysis.
Vicine and convicine were analysed using an Agilent 1200 Rapid Resolution LC system equipped with a UV–Vis DAD 1260 detector and a Zorbax Eclipse Plus C18 column. Separation was performed under isocratic conditions using 0.1% formic acid at a flow rate of 0.8 mL/min and a column temperature of 30 °C.
Vicine was identified and quantified using an analytical standard and external calibration. Due to the unavailability of a commercial convicine standard, convicine was quantified using the external calibration curve established for vicine, following the approach described by Pulkkinen et al. (2015, 2019) [27,28]. The use of vicine as a surrogate standard is supported by the similar relative UV response factors reported for vicine (1.53) and convicine (1.63) by Pulkkinen et al. (2015) [27]. No compound-specific response factor was experimentally determined for convicine in the present study, and the vicine calibration curve was applied without an additional response correction. Consequently, the reported convicine concentrations represent estimates expressed as vicine equivalents (mg/g DW) and may be subject to systematic quantitative bias.
The analytical performance characteristics of the HPLC methods, including calibration ranges, linearity (R2), precision (RSD), recovery, limits of detection (LOD), and limits of quantification (LOQ), are presented in Supplementary Table S2.
4.7. Volatile Compound Analysis
Volatile compounds were analysed by solid-phase microextraction coupled with gas chromatography–mass spectrometry (SPME–GC–MS) using an Agilent 7890A GC system coupled to an Agilent 7000 GC/MS Triple Quad (Agilent Technologies, Inc., Santa Clara, CA, USA). One gram of homogenized sample was placed in a 20 mL headspace vial and mixed with 2 mL of saturated NaCl solution. Samples were vortexed to obtain a homogeneous mixture.
Headspace volatiles were extracted using a 2 cm DVB/CAR/PDMS SPME fibre (Supelco, Bellefonte, PA, USA) for 40 min at 50 °C. Injection was performed in splitless mode. Chromatographic separation was achieved on a DB-FFAP column (30 m × 0.25 mm × 0.25 µm) using helium at a constant flow rate of 1 mL/min. The oven temperature was initially set at 40 °C and held for 1 min, increased at 6 °C/min to 200 °C and subsequently at 25 °C/min to 220 °C, which was maintained for 5 min. Total run time was 33 min. Potentially overlapping chromatographic peaks were evaluated by examining peak shapes and the corresponding mass spectra. The GC oven temperature programme was selected to improve chromatographic separation. Procedural blanks, consisting of empty headspace vials subjected to the extraction procedure, were analysed after every four samples to monitor background contamination and potential carry-over. Procedural blanks were used exclusively to monitor background contamination and potential carry-over; no blank-based quantitative criterion was applied to exclude chromatographic signals.
Mass spectra were acquired under electron ionization at 70 eV, with the ion source maintained at 230 °C and an acquisition range of m/z 33–330. Compounds were tentatively identified by comparison of their mass spectra with the NIST Mass Spectral Library 2.0. Additionally, the volatile compounds were identified by comparing their experimentally determined retention indices (RI). The indices were calculated using a homologous series of n-alkanes (C7–C25) analyzed under the exact same chromatographic conditions, and subsequently compared with values available in the literature and mass spectral databases such as NIST Mass Spectral Library 2.0, using a spectral match criterion of ≥90%. An RI deviation of ±10 units was accepted as a criterion for agreement with reference values, where applicable. Compounds eluting before n-heptane were outside the calibrated range of the C7–C25 n-alkane series, and their RI values could not be reliably determined using this series. Hexane was analysed separately. Experimental retention indices (RI) of the tentatively identified volatile compounds, together with corresponding literature-reported RI values and their references, are provided in Supplementary Table S5. The identification of nonanal remained tentative because, despite agreement with the reference RI, the corresponding mass spectrum did not allow unambiguous confirmation. Chromatographic peak areas were used to represent the relative abundance of individual volatile compounds. For the qualitative comparison of volatile-compound detection across treatments and fermentation times, compounds were classified as detected when a corresponding chromatographic signal was identified in at least two of three biological replicates. Compounds detected in only one replicate did not meet this reporting criterion and were classified as not consistently detected. The relative abundances of volatile compounds were assessed using chromatographic peak areas without internal standard-based quantification. The peak areas were subsequently used for multivariate statistical analysis.
CAS numbers and reported aroma descriptors were subsequently assigned using The Good Scents Company database and the Leibniz-LSB@TUM Odorant Database. As identification was based on library matching without confirmation using authentic analytical standards, the reported compounds were considered tentatively identified.
4.8. Sensory Evaluation
Sensory evaluation was performed in individual booths under white light at room temperature. Aroma descriptors were selected during a preliminary evaluation. No reference odour standards were used during panel preparation or sensory evaluation. Ten semi-trained assessors aged 25–54 years (seven women and three men) evaluated six aroma attributes: beany, nutty, fruity/sweet, grassy/green, pungent/ammonia and mushroom/earthy. Prior to sensory evaluation, assessors were familiarized with the evaluation procedure, aroma descriptors and the use of the intensity scale. The descriptors were discussed to ensure a common understanding of their meaning. Overall aroma strength and pleasantness were also evaluated. Sensory evaluation was performed on tempeh fermented for 24 h. Samples were obtained from one production batch per treatment (NO and O). The 24 h fermentation time was selected for sensory assessment as a representative stage of tempeh production. As chemical and volatile analyses were performed at different fermentation times (15, 22, 39 and 46 h), sensory results were interpreted independently rather than directly correlated with the instrumental data.
The intensity of individual aroma attributes and overall aroma strength was evaluated using a 10 cm unstructured linear scale anchored at 0 (not perceivable) and 10 (extremely intense). Aroma pleasantness was assessed separately on a 0–10 scale, with 0 indicating extremely unpleasant and 10 indicating extremely pleasant. Samples were evaluated uncooked to maintain conditions comparable with those used for GC–MS analysis. The distance from the origin of the scale to the assessor’s mark was converted into a numerical score. The sensory scores were expressed as mean ± standard deviation (SD) based on the evaluations of 10 assessors (Table S4). Sensory results were analysed descriptively; no inferential statistical comparisons between treatments were performed. Aroma descriptors were established by the research team during a preliminary evaluation. Samples were presented using anonymous codes, without disclosing the treatment applied (ozonated or non-ozonated), and their presentation order was randomized for sensory assessment. For the sensory analysis, ethical permission was not required, and all panellists gave their consent.
4.9. Statistical and Multivariate Analysis
Three independently prepared and fermented batches were used as biological replicates for each treatment (n = 3). Samples were collected destructively from separate Petri dishes at each fermentation time point. Results are presented as mean ± standard deviation (SD). Statistical significance was considered at p < 0.05. The cooked, unfermented sample collected at 0 h constituted a common baseline for both NO and O treatments and was presented descriptively and excluded from the two-way factorial analyses.
For total FAA, vicine and convicine, differences among the common unfermented baseline (0 h) and the eight fermented treatment–time combinations were evaluated using one-way ANOVA followed by Tukey’s honestly significant difference (HSD) test. These comparisons were used to assign significance letters in Figure 1 and Figure 5.
The effects of ozone pretreatment (NO and O), fermentation time (15, 22, 39 and 46 h), and their interaction on total FAA, vicine and convicine were additionally evaluated using two-way ANOVA, with both factors treated as fixed categorical variables. The common 0 h baseline was excluded from these factorial analyses. Free amino acid concentrations below the LOQ were treated as zero in the calculation of total FAA and subsequent statistical analyses.
To assess the potential influence of shared batch origin, an additional sensitivity analysis was performed using a factorial ANOVA model including biological batch nested within ozone treatment. Accounting for batch effects did not alter the statistical significance of ozone pretreatment, fermentation time, or their interaction (all p < 0.0001), supporting the robustness of the primary two-way ANOVA results.
For total FAA, vicine and convicine, model assumptions were assessed separately for the one-way and two-way ANOVA models using the Shapiro–Wilk test for residual normality and the median-centred Levene’s test for homogeneity of variance. Natural-log transformation was applied to total FAA and vicine to improve compliance with model assumptions, whereas convicine was analysed without transformation. Pairwise comparisons between NO and O samples at individual fermentation times were performed using Tukey-adjusted post-hoc comparisons. Complete ANOVA tables and residual diagnostics are provided in Supplementary Table S3. L-DOPA concentrations were analysed descriptively and are presented as mean ± SD (n = 3), as residual normality was not adequately satisfied for the factorial ANOVA model, even after logarithmic transformation.
Multivariate analyses were performed separately for the FAA and volatile-compound datasets. For volatile compounds, chromatographic peak areas were used as input data. No sample-wise normalization or data transformation was applied to the volatile-compound dataset. Missing and zero values were replaced using the limit-of-detection (LoD) replacement option in MetaboAnalyst 6.0, corresponding to one-fifth of the minimum positive value for each variable. This software-based replacement was performed solely for statistical preprocessing and did not represent an experimentally determined limit of detection. Variables were autoscaled by mean-centering and division by their standard deviation prior to principal component analysis (PCA) and hierarchical clustering. PCA was used to visualize differences associated with fermentation time and ozone pretreatment, while hierarchical clustering was visualized using heatmaps. For the volatile dataset, PCA scores plots and biplots were additionally used to evaluate sample separation and the contribution of individual volatile compounds.
Univariate statistical analyses were performed using Statistica 14, whereas multivariate analyses were performed using MetaboAnalyst 6.0.
4.10. Use of Artificial Intelligence Tools
ChatGPT (OpenAI) was used to support the selection of appropriate statistical methods and to assist with language editing and improvement of the manuscript text. All statistical procedures, results, and interpretations were independently verified by the authors.
5. Conclusions
Ozone pretreatment modified the chemical and volatile profiles of faba bean during Rhizopus oligosporus fermentation, with the magnitude and direction of these changes depending on fermentation time and the compounds analysed. The most pronounced differences between ozonated and non-ozonated samples were observed during prolonged fermentation (39–46 h).
Ozone-pretreated samples showed substantially greater accumulation of free amino acids at 46 h, whereas vicine and convicine concentrations were lower than in the corresponding non-ozonated samples. L-DOPA decreased during fermentation in both treatments, with fermentation time being the predominant factor associated with these changes. Ozone pretreatment also altered volatile profiles, particularly during prolonged fermentation, although these differences cannot be directly interpreted as improvements in aroma quality.
Supplementary Materials
The following supporting information can be downloaded at: https://www.mdpi.com/article/10.3390/molecules31224123/s1, Table S1: Detection of tentatively identified volatile compounds (VCs) during tempeh fermentation. “+” indicates detection in at least two of three biological replicates, whereas “−” indicates detection in fewer than two replicates (zero or one of three). NO denotes non-ozonated samples, and O denotes ozone-pretreated samples; Table S2: Analytical performance characteristics of the HPLC methods used for the determination of free amino acids, L-DOPA, vicine, and convicine; Table S3: One-way and two-way ANOVA results and model assumption diagnostics for total FAA, vicine and convicine; Table S4: Descriptive sensory evaluation of uncooked faba bean tempeh after 24 h of fermentation. Results are expressed as mean ± standard deviation (SD) of ratings from ten assessors. Aroma attributes and overall aroma strength were rated from 0 (not perceivable) to 10 (extremely intense), whereas pleasantness was rated from 0 (extremely unpleasant) to 10 (extremely pleasant). Samples were obtained from one production batch per treatment; Table S5. Experimental and literature-reported retention indices (RI) of tentatively identified volatile compounds in faba bean tempeh determined by SPME–GC–MS. Literature RI values were obtained from the Leibniz-LSB@TUM Odorant Database [29], NIST Chemistry WebBook [30], and Flavornet [31]. Table S6: Individual free amino acid (FAA) concentrations in non-ozonated (NO) and ozone-pretreated (O) faba bean samples during tempeh fermentation (FT). Results are expressed as mean ± standard deviation (SD) from three independent biological replicates (n = 3), in mg/100 g dry weight (DW). Values below the limit of quantification (LOQ) were reported as 0.00 and treated as zero in the calculation of total FAA and subsequent statistical analyses.
Author Contributions
Conceptualization, K.P. and I.P.; methodology, K.P.; software, K.P. and I.P.; validation, K.P., I.P. and M.A.M.; formal analysis, K.P.; investigation, I.P., K.P. and M.A.M.; resources, K.P.; data curation, I.P. and K.P.; writing—original draft preparation, K.P. and I.P.; writing—review and editing, K.P., I.P., M.A.M.; visualization, K.P. and I.P.; supervision, K.P.; project administration, K.P.; funding acquisition, K.P. All authors have read and agreed to the published version of the manuscript.
Funding
Development and Implementation of a Technology for Processing Faba Bean Seeds to Produce a Protein-Enriched Source Free from Antinutritional Factors for Human Nutrition” („Opracowanie i wdrożenie technologii przetworzenia ziaren bobiku w celu wytworzenia wzbogaconego źródła białka pozbawionego czynników antyżywieniowych do zastosowań w żywieniu człowieka”) (NUTRITECH1/003A/2022), funded by the National Centre for Research and Development (NCBR) under the government programme NUTRITECH—Nutrition in the Context of Challenges Related to Improving Societal Well-Being and Climate Change.
Institutional Review Board Statement
Not applicable.
Informed Consent Statement
Informed consent was obtained from all participants involved in the sensory evaluation.
Data Availability Statement
The data will be made available on a request.
Conflicts of Interest
The authors declare no conflicts of interest.
Abbreviations
The following abbreviations are used in this manuscript:
| ANOVA | Analysis of variance |
| CAS | Chemical Abstracts Service |
| DAD | Diode-array detector |
| DVB/CAR/PDMS | Divinylbenzene/carboxene/polydimethylsiloxane |
| DW | Dry weight |
| EI | Electron ionization |
| FAA | Free amino acids |
| GC–MS | Gas chromatography–mass spectrometry |
| HPLC | High-performance liquid chromatography |
| HSD | Honestly significant difference |
| L-DOPA | L-3,4-Dihydroxyphenylalanine |
| NIST | National Institute of Standards and Technology |
| NO | Non-ozonated |
| O | Ozonated |
| PC1 | Principal component 1 |
| PC2 | Principal component 2 |
| PCA | Principal component analysis |
| PITC | Phenyl isothiocyanate |
| SD | Standard deviation |
| SPME | Solid-phase microextraction |
| SPME–GC–MS | Solid-phase microextraction coupled with gas chromatography–mass spectrometry |
| UV–Vis | Ultraviolet–visible |
References
- Martineau-Côté, D.; Achouri, A.; Karboune, S.; L’Hocine, L. Faba Bean: An Untapped Source of Quality Plant Proteins and Bioactives. Nutrients 2022, 14, 1541. [Google Scholar] [CrossRef] [Scilit] [PubMed]
- Karolkowski, A.; Martin, C.; Bouzidi, E.; Albouy, J.-F.; Levavasseur, L.; Briand, L.; Salles, C. Heat Treatment, Cultivar and Formulation Modify the Sensory Properties and Consumer Acceptability of Gels Containing Faba Bean (Vicia faba L. minor) Protein Concentrates. Foods 2022, 11, 3018. [Google Scholar] [CrossRef] [Scilit] [PubMed]
- Badjona, A.; Bradshaw, R.; Millman, C.; Howarth, M.; Dubey, B. Faba Bean Flavor Effects from Processing to Consumer Acceptability. Foods 2023, 12, 2237. [Google Scholar] [CrossRef] [Scilit] [PubMed]
- Lippolis, A.; Roland, W.S.U.; Bocova, O.; Pouvreau, L.; Trindade, L.M. The Challenge of Breeding for Reduced Off-Flavor in Faba Bean Ingredients. Front. Plant Sci. 2023, 14, 1286803. [Google Scholar] [CrossRef] [Scilit] [PubMed]
- Cappellini, M.D.; Fiorelli, G. Glucose-6-Phosphate Dehydrogenase Deficiency. Lancet 2008, 371, 64–74. [Google Scholar] [CrossRef] [Scilit] [PubMed]
- Karolkowski, A.; Belloir, C.; Lucchi, G.; Martin, C.; Bouzidi, E.; Levavasseur, L.; Salles, C.; Briand, L. Activation of Bitter Taste Receptors by Saponins and Alkaloids Identified in Faba Beans (Vicia faba L. minor). Food Chem. 2023, 426, 136548. [Google Scholar] [CrossRef] [Scilit] [PubMed]
- Karolkowski, A.; Meudec, E.; Bruguière, A.; Mitaine-Offer, A.-C.; Bouzidi, E.; Levavasseur, L.; Sommerer, N.; Briand, L.; Salles, C. Faba Bean (Vicia faba L. minor) Bitterness: An Untargeted Metabolomic Approach to Highlight the Impact of the Non-Volatile Fraction. Metabolites 2023, 13, 964. [Google Scholar] [CrossRef] [Scilit] [PubMed]
- Akkad, R.; Kharraz, E.; Han, J.; House, J.D.; Curtis, J.M. Characterisation of the Volatile Flavour Compounds in Low and High Tannin Faba Beans (Vicia faba var. minor) Grown in Alberta, Canada. Food Res. Int. 2019, 120, 285–294. [Google Scholar] [CrossRef] [Scilit] [PubMed]
- Lampi, A.-M.; Yang, Z.; Mustonen, O.; Piironen, V. Potential of Faba Bean Lipase and Lipoxygenase to Promote Formation of Volatile Lipid Oxidation Products in Food Models. Food Chem. 2020, 311, 125982. [Google Scholar] [CrossRef] [Scilit] [PubMed]
- Oomah, B.D.; Razafindrainibe, M.; Drover, J.C. Headspace Volatile Components of Canadian Grown Low-Tannin Faba Bean (Vicia faba L.) Genotypes. J. Sci. Food Agric. 2014, 94, 473–481. [Google Scholar] [CrossRef] [Scilit] [PubMed]
- Ahnan-Winarno, A.D.; Cordeiro, L.; Winarno, F.G.; Gibbons, J.; Xiao, H. Tempeh: A Semicentennial Review on Its Health Benefits, Fermentation, Safety, Processing, Sustainability, and Affordability. Compr. Rev. Food Sci. Food Saf. 2021, 20, 1717–1767. [Google Scholar] [CrossRef] [Scilit] [PubMed]
- Nout, M.J.R.; Kiers, J.L. Tempe Fermentation, Innovation and Functionality: Update into the Third Millenium. J. Appl. Microbiol. 2005, 98, 789–805. [Google Scholar] [CrossRef] [Scilit] [PubMed]
- Matsumoto, I.; Imai, S. Changes of Chemical Composition of Tempe during Fermentation. Nippon Shokuhin Kogyo Gakkaishi 1990, 37, 130–138. [Google Scholar] [CrossRef] [Scilit]
- Polanowska, K.; Grygier, A.; Kuligowski, M.; Rudzińska, M.; Nowak, J. Effect of Tempe Fermentation by Three Different Strains of Rhizopus oligosporus on Nutritional Characteristics of Faba Beans. LWT 2020, 122, 109024. [Google Scholar] [CrossRef] [Scilit]
- Polanowska, K.; Szwengiel, A.; Kuligowski, M.; Nowak, J. Degradation of Pyrimidine Glycosides and L-DOPA in the Faba Bean by Rhizopus oligosporus. LWT 2020, 127, 109353. [Google Scholar] [CrossRef] [Scilit]
- Fernandez Castaneda, L.A.; Saini, S.; Laaksonen, O.; Kårlund, A.; Leong, S.L.L.; Newson, W.R.; Passoth, V.; Hanhineva, K.; Langton, M.; Zamaratskaia, G. Sensory and Volatile Compound Profiles in Tempeh-Like Products from Faba Bean and Oats. Curr. Res. Food Sci. 2025, 10, 101029. [Google Scholar] [CrossRef] [Scilit] [PubMed]
- Guzel-Seydim, Z.B.; Greene, A.K.; Seydim, A.C. Use of Ozone in the Food Industry. LWT 2004, 37, 453–460. [Google Scholar] [CrossRef] [Scilit]
- Xue, W.; Macleod, J.; Blaxland, J. The Use of Ozone Technology to Control Microorganism Growth, Enhance Food Safety and Extend Shelf Life: A Promising Food Decontamination Technology. Foods 2023, 12, 814. [Google Scholar] [CrossRef] [Scilit] [PubMed]
- Majcher, M.; Fahmi, R.; Misiak, A.; Grygier, A.; Rudzińska, M. Influence of Ozone Treatment on Sensory Quality, Aroma Active Compounds, Phytosterols and Phytosterol Oxidation Products in Stored Rapeseed and Flaxseed Oils. Food Chem. 2025, 469, 142551. [Google Scholar] [CrossRef] [Scilit] [PubMed]
- Thulesen, L.; Duque-Estrada, P.; Zhang, L.; Martin, M.S.; Aaslyng, M.D.; Petersen, I.L. Faba Bean Tempeh: The Effects of Fermentation and Cooking on Protein Nutritional Quality and Sensory Quality. Food Chem. Adv. 2025, 6, 100894. [Google Scholar] [CrossRef] [Scilit]
- Rodríguez-Torres, M.; Romo-Buchelly, J.; Orozco-Sánchez, F. Effects of Oxygen Transfer Rate on the L(+) Lactic Acid Production by Rhizopus oryzae NRRL 395 in Stirred Tank Bioreactor. Biochem. Eng. J. 2022, 187, 108665. [Google Scholar] [CrossRef] [Scilit]
- Sparringa, R.A.; Owens, J.D. Protein utilization during soybean tempe fermentation. J. Agric. Food Chem. 1999, 47, 4375–4378. [Google Scholar] [CrossRef] [Scilit] [PubMed]
- Jeleń, H.; Majcher, M.; Ginja, A.; Kuligowski, M. Determination of Compounds Responsible for Tempeh Aroma. Food Chem. 2013, 141, 459–465. [Google Scholar] [CrossRef] [Scilit] [PubMed]
- Karolkowski, A.; Gourrat, K.; Bouzidi, E.; Albouy, J.-F.; Levavasseur, L.; Briand, L.; Guichard, E.; Salles, C. Origins of Volatile Compounds and Identification of Odour-Active Compounds in Air-Classified Fractions of Faba Bean (Vicia faba L. minor). Food Res. Int. 2023, 163, 112260. [Google Scholar] [CrossRef] [Scilit] [PubMed]
- Ritter, S.W.; Ensslin, S.; Gastl, M.I.; Becker, T.M. Identification of Key Aroma Compounds of Faba Beans (Vicia faba) and Their Development during Germination—A SENSOMICS Approach. Food Chem. 2024, 435, 137610. [Google Scholar] [CrossRef] [Scilit] [PubMed]
- Arias-Pérez, I.; Sáenz-Navajas, M.P.; de-la-Fuente-Blanco, A.; Ferreira, V.; Escudero, A. Insights on the Role of Acetaldehyde and Other Aldehydes in the Odour and Tactile Nasal Perception of Red Wine. Food Chem. 2021, 361, 130081. [Google Scholar] [CrossRef] [Scilit] [PubMed]
- Pulkkinen, M.; Gautam, M.; Lampi, A.-M.; Ollilainen, V.; Stoddard, F.; Sontag-Strohm, T.; Salovaara, H.; Piironen, V. Determination of Vicine and Convicine from Faba Bean with an Optimized High-Performance Liquid Chromatographic Method. Food Res. Int. 2015, 76, 168–177. [Google Scholar] [CrossRef] [Scilit]
- Pulkkinen, M.; Coda, R.; Lampi, A.-M.; Varis, J.; Katina, K.; Piironen, V. Possibilities of Reducing Amounts of Vicine and Convicine in Faba Bean Suspensions and Sourdoughs. Eur. Food Res. Technol. 2019, 245, 1507–1518. [Google Scholar] [CrossRef] [Scilit]
- Kreissl, J.; Mall, V.; Steinhaus, P.; Steinhaus, M. Leibniz-LSB@TUM Odorant Database; Version 1.2; Leibniz Institute for Food Systems Biology at the Technical University of Munich: Freising, Germany, 2022; Available online: https://www.leibniz-lsb.de/en/databases/leibniz-lsbtum-odorant-database.
- Linstrom, P.J.; Mallard, W.G. (Eds.) NIST Chemistry WebBook, NIST Standard Reference Database Number 69; National Institute of Standards and Technology: Gaithersburg, MD, USA. [Google Scholar] [CrossRef] [Scilit]
- Arn, H.; Acree, T.E. Flavornet: A Database of Aroma Compounds Based on Odor Potency in Natural Products. In Gas Chromatography-Olfactometry: The State of the Art; Developments in Food Science, Volume 40; Elsevier: Amsterdam, The Netherlands, 1998; pp. 27–32. [Google Scholar] [CrossRef] [Scilit]

Disclaimer/Publisher’s Note: The statements, opinions and data contained in all publications are solely those of the individual author(s) and contributor(s) and not of MDPI and/or the editor(s). MDPI and/or the editor(s) disclaim responsibility for any injury to people or property resulting from any ideas, methods, instructions or products referred to in the content. |
© 2026 by the authors. Licensee MDPI, Basel, Switzerland. This article is an open access article distributed under the terms and conditions of the Creative Commons Attribution (CC BY) license.