


Abstract
Wastewater pollution is a global challenge in the field of environmental remediation, and advanced oxidation processes using functional biochar catalysts are receiving increasing attention. In this study, a microcrystalline−amorphous catalyst (CCF 0.3) containing Fe2O3 microcrystalline structures was prepared from cellulose and ferric chloride hexahydrate via ball milling and low-temperature calcination for phenol degradation using activated hydrogen peroxide (H2O2) under light conditions. The results revealed that CCF 0.3 contained both Fe2O3 microcrystalline and amorphous structures, with clear grain boundaries between the two. Additionally, numerous spherical structures and abundant functional groups were observed on the surface of CCF 0.3, providing a large number of active sites. When the dosage of CCF 0.3 was 0.2 g/L and the concentration of H2O2 was 4 mM, 100% removal of 20 mg/L of phenol was achieved within 30 min. Cyclic experiments and X-ray photoelectron spectroscopy (XPS) comparative analyses showed that CCF 0.3 exhibited good stability. When applied to real water matrices, the phenol degradation performance of CCF 0.3 was reduced, particularly in river water, highlighting the influence of water matrix effects and the need for further optimization to improve its practical applicability. Quenching experiments, probe tests, and electron paramagnetic resonance (EPR) experiments confirmed that the main radical in the system was hydroxyl radicals (·OH), and a possible reaction mechanism was proposed. These findings highlight the potential of the microcrystalline−amorphous catalyst for efficient photo-Fenton removal of phenol, providing new ideas and solutions for the development of water treatment technologies and pollutant removal.
1. Introduction
With the development of society, a large number of pollutants continue to be released into the environment, causing significant harm to both ecosystems and human health [1]. Growing awareness and concern about environmental pollution in many countries have driven the demand for new environmental remediation technologies [2]. Phenol, a common phenolic compound, is frequently found in wastewater from various industries [3,4]. Phenols in the environment pose potential risks to human health, including damage to the nervous system and liver [1,5]. Due to its toxicity, many environmental protection agencies have classified phenol as a priority pollutant and established strict concentration limits to safeguard human health and protect ecological balance [6].
In recent years, advanced oxidation processes (AOPs) have been widely investigated for the removal of organic pollutants from water due to their ability to generate highly reactive species for contaminant degradation. Among these processes, the activation of hydrogen peroxide (H2O2), peroxydisulfate (PDS), and peroxymonosulfate (PMS) has attracted considerable attention [7]. However, limitations associated with oxidant activation have promoted the development of enhanced oxidation technologies, including photo-Fenton, electro-Fenton, and photo-electro-Fenton processes [8]. Recent studies have also highlighted the importance of comparing different treatment strategies for phenolic pollutants. For instance, Vaigankar et al. [9] evaluated adsorption, photocatalysis, photo-Fenton oxidation, catalytic ozonation, and plasma-assisted processes for p-nitrophenol degradation using CuO-Fe2O3 mixed oxide catalysts, emphasizing the influence of catalytic materials and treatment pathways on pollutant removal [10]. Among these technologies, photo-Fenton processes utilize light-assisted H2O2 activation to generate reactive oxygen species for organic pollutant degradation. Therefore, developing catalysts with high catalytic activity and structural stability is crucial for improving photo-Fenton performance [11,12].
Among various photocatalytic materials, semiconductor photocatalysts such as TiO2 and ZnO have attracted considerable attention for the degradation of organic pollutants in wastewater. TiO2 is widely recognized for its excellent chemical stability, low cost, and photocatalytic activity [13]. However, its relatively wide band gap limits the efficient utilization of visible light. Similarly, ZnO exhibits promising photocatalytic performance, although rapid recombination of photogenerated charge carriers and photocorrosion may restrict its practical applications [14]. Therefore, developing alternative catalytic materials with efficient charge transfer and enhanced generation of reactive oxygen species remains an important research direction. In this context, iron-based photo-Fenton catalysts have attracted increasing interest because of their ability to activate H2O2 and promote pollutant degradation under light irradiation.
Carbon materials are widely used in the preparation of catalysts as green materials, with activated carbon, biomass carbon, carbon nanotubes, graphene, and other carbon materials being particularly favored [15]. Cellulose is one of the most abundant and widely distributed polysaccharides in nature, accounting for more than 50% of the carbon content in the plant kingdom. Due to its unique properties, cellulose is extensively used to reinforce polymer composites in the fabrication of green materials [5,16]. Xu et al. [17] first carried out electrostatic self-assembly of bismuth yttrium oxide (BiYO3) and graphitic carbon nitride (g−C3N4) and then used cellulose as the carrier to prepare heterojunction material BiYO3/g-C3N4/CNFs recyclable porous composites by chemical crosslinking. These composites can be used as catalysts for the efficient photocatalytic degradation of tetracycline, benefiting from the synergistic effects of adsorption and catalysis. In addition, cellulose plays an important role as a carbon carrier in Fenton reactions [18,19]. Chen et al. [8] constructed graphite-biochar (G-BC) from graphite and cellulose via a carbothermal reaction. This graphite-biochar was then mixed with zero-valent iron (ZVI) by ball milling to synthesize a graphite-biochar-supported ZVI (ZVI/G-BC) catalyst, which was subsequently used for the heterogeneous Fenton degradation of tetracycline. Although cellulose has a wide range of applications, catalysts prepared from it still face challenges related to activity and stability in catalytic reactions [20,21].
Therefore, the preparation of composite catalysts with high active sites and good stability using cellulose has become one of the major research focuses [22,23]. Among these, microcrystalline–amorphous catalysts, which combine both microcrystalline and amorphous structures, have garnered significant attention [24]. This microcrystalline–amorphous composite structure can not only effectively enhance the catalyst’s reactivity but also improve its stability in complex reaction systems [25,26]. Wang et al. [27] reported an amorphous/crystalline Cu catalyst, which maintained stable ammonia production for up to 300 h due to the presence of well-stabilized amorphous Cu domains. This study highlighted the promising applications and performance of microcrystalline–amorphous catalysts. In a related development, Hong et al. [28] proposed a strategy for the controlled synthesis of hexagonal bipyramidal α-Fe2O3 microcrystals (HB-α-Fe2O3 MCs) using iron oxyhydroxide (FeOOH) nanorods as precursors. HB-α-Fe2O3 MCs demonstrated remarkable sensor response, selectivity, and response/recovery characteristics as a gas sensor. Additionally, Zhu et al. [29] chemically synthesized an amorphous iron-based catalyst supported on polypyrrole-modified carbon nanotubes. The synthesized catalyst, composed of amorphous FeOOH and microcrystalline Fe2O3, exhibited high electrocatalytic activity and robust stability. Therefore, exploring novel microcrystalline–amorphous composite catalysts based on cellulose holds great theoretical significance and potential for applications in advanced oxidation technologies, such as the photo-Fenton reaction, to provide more efficient catalytic materials [11,30].
In this paper, a microcrystalline–amorphous composite catalyst (CCF 0.3) containing Fe2O3 microcrystals was prepared from cellulose and ferric chloride hexahydrate through ball milling and low-temperature calcination. The catalyst was then used to activate hydrogen peroxide for the degradation of phenol under light conditions. The optimal conditions for phenol degradation via the CCF 0.3 photo-Fenton reaction were determined, and the catalyst’s stability and applicability in natural water were further explored. In addition, the main radical species in the CCF 0.3/H2O2 system under light conditions were identified as hydroxyl radicals (·OH) through quenching experiments, furfuryl alcohol (FFA) probe experiments, and electron paramagnetic resonance (EPR) spectroscopy. Based on these findings, a reaction mechanism for phenol degradation by CCF 0.3 activated hydrogen peroxide under light conditions was proposed.
2. Results and Discussion
2.1. Characterization of Materials
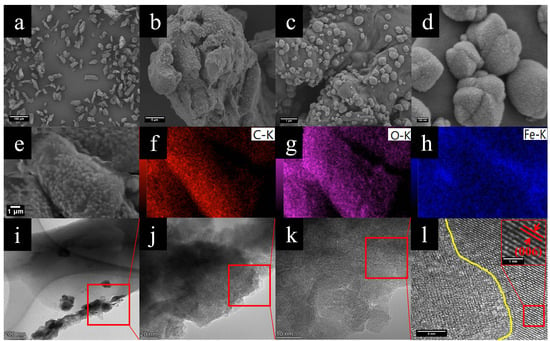
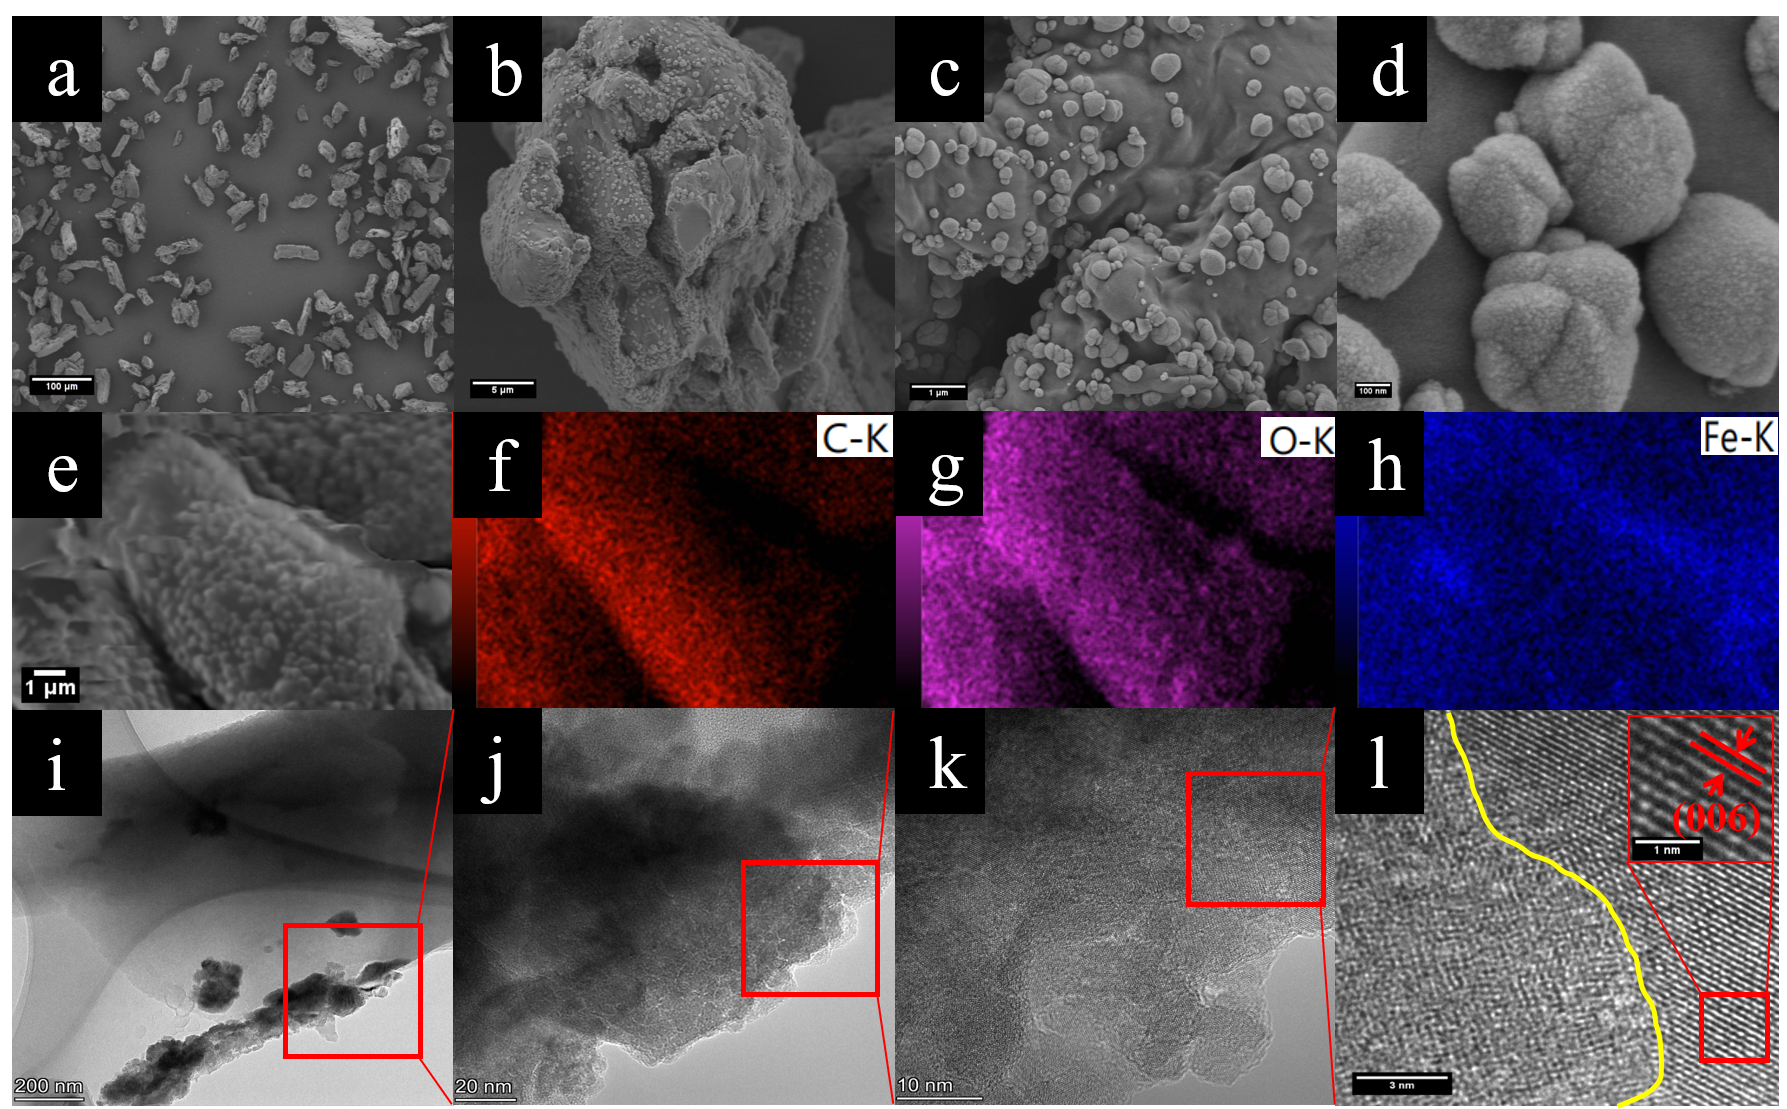
Scanning electron microscopy (SEM) and transmission electron microscopy (TEM) were employed to study the morphology of the catalyst (Figure 1). From Figure S1a,b, it can be observed that the CC surface has a complex structure, with blocks stacked on top of each other, which is attributed to the incomplete carbonization of cellulose. In the digital photographs of Figure S2, it is evident that CC is not fully carbonized and appears as a brownish-yellow powder, while the prepared CCFx msamples are fully carbonized and appear as black powders. In Figure S1c,d, the carbon layers and pores of CCF 0.2 are shown to be internally distributed with spherical structures of varying sizes and similar shapes. The diameters of these spherical structures are generally less than 150 nm. These spherical structures are formed by the interaction of iron with cellulose. Figure 1a shows that CCF 0.3, as a whole, adopts a rod-like form with varying sizes, while Figure 1b reveals that spherical structures are distributed on the surface and within the crevices of the carbon layer. Figure 1c demonstrates that the spherical structures tend to be more uniform in size overall, although a small number of smaller structures remain. The diameters of the spherical structures were measured to range from 300 to 400 nm. In Figure S1e,f, it can be seen that the carbon layer of CCF 0.4 is densely covered with spherical structures, nearly completely covering the carbon layer. The diameters of the spherical structures decrease due to mutual compression, with a size of approximately 150 nm. Notably, no spherical structures are observed in the cross-section in Figure S1e, which is likely caused by physical fracture during calcination. Furthermore, quantitative analysis of the XPS survey spectrum was performed to evaluate the surface elemental composition of CCF 0.3. The corresponding atomic concentrations and calculated mass fractions are summarized in Table S2. The presence of a substantial Fe signal, together with the elemental mapping results, confirms the successful incorporation of iron into the catalyst. The elemental distribution of CCF 0.3 is shown in Figure 1e–h, which reveals that the elements C, O, and Fe are uniformly distributed, confirming the successful incorporation of iron and the successful preparation of the catalyst.
Figure 1.
(a–d) Scanning electron microscopy (SEM) images of CCF 0.3 at different magnifications, (e–h) energy-dispersive X-ray spectroscopy (EDS) mapping images of CCF 0.3, and (i–l) transmission electron microscopy (TEM) images of CCF 0.3 at different magnifications.
In Figure 1i–k, it can be seen that the thickness of CCF 0.3 is not uniform, and some areas are darkened due to excessive stacking. A clear lattice structure is observed in Figure 1l, which corresponds to the (006) crystalline plane of Fe2O3, as confirmed by measuring the lattice spacing. However, no distinct lattice structure is visible in Figure 1k, which is attributed to the microcrystalline nature of the Fe2O3 formed in CCF 0.3. Notably, the lattice structure exists only locally within CCF 0.3, while the majority of the material is amorphous. A clear grain boundary is observed between these two regions (highlighted by the yellow underline), with visible dislocation lines near the boundary [27]. In summary, CCF 0.3 is a microcrystalline–amorphous catalyst composed of microcrystalline regions and amorphous regions with distinct grain boundaries. The microcrystalline regions exhibit a well-defined crystal structure and more stable chemical properties, while the amorphous regions contain highly dispersed iron, which has higher surface energy and more active sites. This allows for easier interaction with reactants and enhances the catalytic activity [29]. Additionally, the microcrystalline and amorphous regions work synergistically to improve the photo-Fenton-like performance of the catalyst [31].
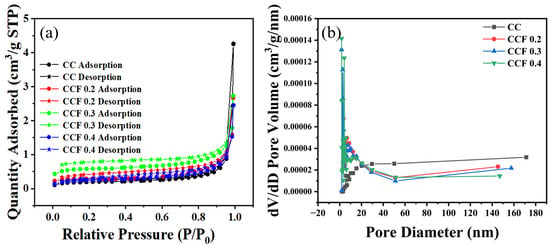
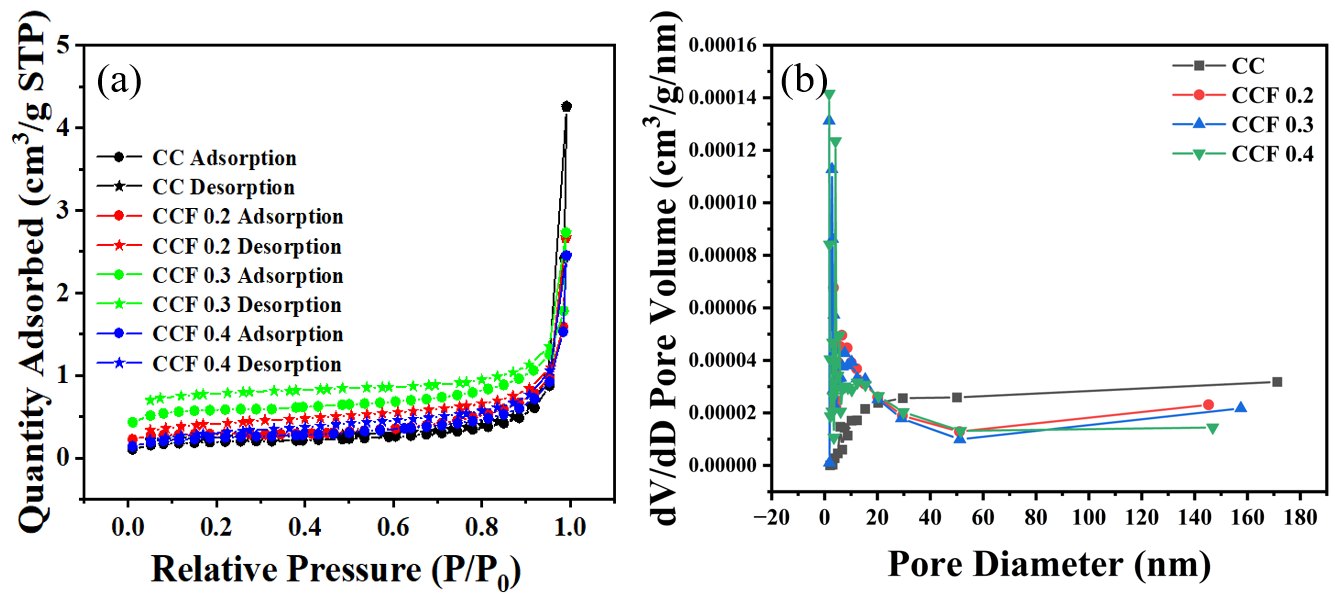
The Brunauer–Emmett–Teller (BET) method is an important technique for studying the physical properties of different materials. The BET specific surface areas of CC, CCF 0.2, CCF 0.3, and CCF 0.4 were 0.72, 1.13, 2.21, and 0.88 m2/g, respectively (Table 1). Among these samples, CCF 0.3 exhibited the highest measured specific surface area, approximately 3.1 times that of the CC reference sample. After the introduction of iron, the surface area of CCF 0.2 increases compared to that of CC, which is attributed to the formation of spherical structures on the surface of CCF 0.2, thereby increasing its surface area. With an increase in iron content, the surface area of CCF 0.3 is further enhanced due to the growth in the number and size of the spherical structures. However, when the iron content is further increased, the surface area of CCF 0.4 decreases. This is because the spherical structures in CCF 0.4 become densely packed on the surface of the carbon layer, which masks some of the pores. Correspondingly, the average pore sizes decrease from 36.56 nm for CC to 14.56 nm for CCF 0.2 and 7.65 nm for CCF 0.3, before increasing to 17.27 nm for CCF 0.4, which may be related to changes in the distribution and packing of spherical structures on the carbon surface. From the pore volume and pore distribution of the four catalysts, it can be seen that the spherical structures contribute to the pore volume, which is consistent with the SEM observations. In particular, the nitrogen adsorption and desorption profiles shown in Figure 2 reveal that the adsorption and desorption curves for CCFx do not close, which is due to the ink-bottle-like structure formed by the spherical structures and the gaps in the carbon layer [32]. This results in rapid nitrogen adsorption, but the gas cannot be completely desorbed during the desorption phase.
Table 1.
BET analyses of CC, CCF 0.2, CCF 0.3, and CCF 0.4.
Figure 2.
(a) N2 adsorption–desorption isotherms and (b) pore size distribution curves of CC and CCFx.
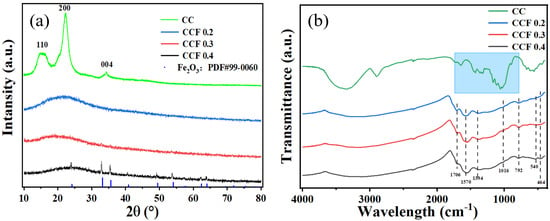
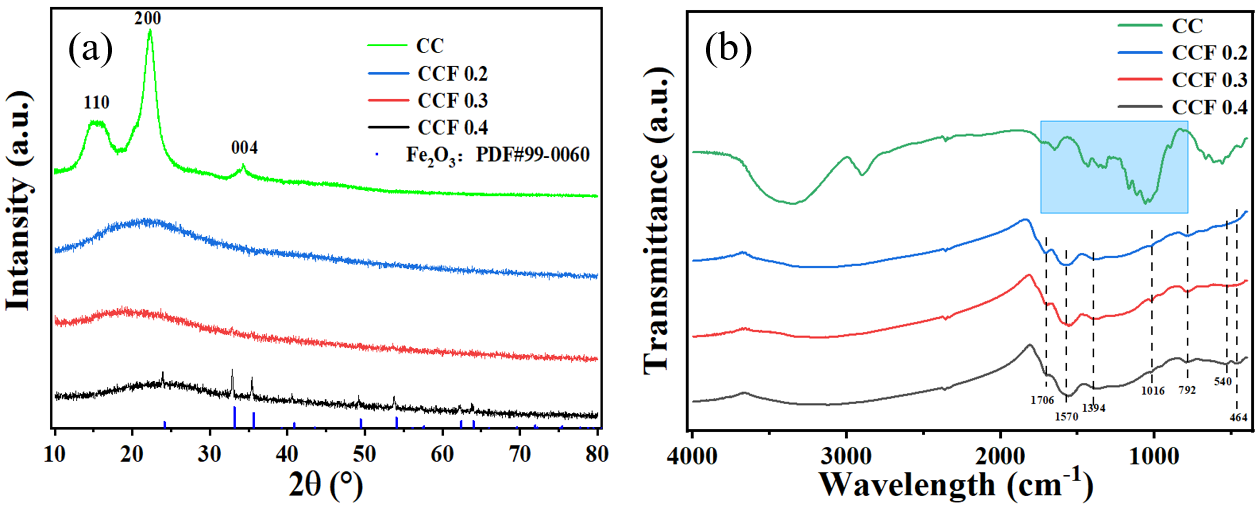
Figure 3a shows the X-ray diffraction (XRD) spectra of the four materials. It can be observed that the prepared CC exhibits distinct cellulose characteristics, with a peak at 15° corresponding to the (110) crystal plane of cellulose, a peak at 22° corresponding to the (200) crystal plane, and a peak at 34° corresponding to the (004) crystal plane [17,33]. Notably, CCFx (x = 0.2, 0.3, 0.4) shows a broad peak typical of amorphous carbon and lacks the characteristic peaks of cellulose, which can be attributed to the disruption of the cellulose structure upon the introduction of iron. In addition, no clear metallic phase was detected in the XRD pattern of CCF 0.2. However, the characteristic peak of Fe2O3 appears in the XRD pattern of CCF 0.3, though it is not prominent. This is because the Fe2O3 formed in CCF 0.3 is a microcrystalline structure with fewer crystalline domains, which results in weaker characteristic peaks [23]. In the XRD pattern of CCF 0.4, the Fe2O3 peaks become more pronounced due to the increased iron content and the formation of more iron oxide structures [34].
Figure 3.
(a) XRD patterns and FT-IR spectra (b) of CC, CCF 0.2, CCF 0.3, and CCF 0.4.
To compare the surface groups of CC, CCF 0.2, CCF 0.3, and CCF 0.4, FTIR spectra were measured, and the results are shown in Figure 3b. The prepared CC samples exhibit distinct characteristic peaks of cellulose (blue region in the Figure), which is consistent with previous reports in the literature [33,35]. The absorption peak at 3300 cm−1 corresponds to the −OH group in water, which is physically adsorbed by the material, while the broad absorption peak at 2900 cm−1 is attributed to the asymmetric stretching vibration of the methyl (−CH3) and methylene (−CH2) groups [36,37]. The absorption peak at 1730 cm−1 is due to the presence of gluconic or glucuronic acid formed during the calcination of cellulose [5]. Additionally, the absorption peaks at 1600 cm−1, 1120 cm−1, and 1050 cm−1 correspond to the stretching vibrations of −OH, C−C, and C−O, respectively, which are associated with aromatic, hydroxyl, and ether groups [38]. The peak at 1330 cm−1 corresponds to the angular deformation vibration of the H−C−H plane, while the peak at 1450 cm−1 is linked to the asymmetric deformation of the methyl group and the aromatic C−C bond stretching. After the introduction of iron, the characteristic peaks of cellulose in the blue region completely disappear, indicating that the introduced iron alters the characteristic structure of cellulose, which is consistent with the XRD results [39]. The FTIR spectra of CCF 0.2, CCF 0.3, and CCF 0.4 all show a peak at 1706 cm−1 for the C=O stretching vibration and a peak at 1570 cm−1 for the C=C bending vibration [33]. The peak at 1394 cm−1 is attributed to O−H, the peak at 1016 cm−1 corresponds to the C−O−C stretching vibration, and the peak at 792 cm−1 is associated with the bending vibration of the aromatic C−H bond [21,40,41]. Notably, CCF 0.4 exhibits two peaks that are absent in both CCF 0.2 and CCF 0.3: the Fe−O peak at 540 cm−1 and the Fe3+O2− peak at 464 cm−1 [42]. These peaks are attributed to the formation of Fe2O3 grains caused by excess iron. However, these peaks are not observed in CCF 0.3 due to the microcrystalline structure of Fe2O3 and its lower iron content.
2.2. Kinetic Experiment
2.2.1. Removal of Phenol Under Different Conditions
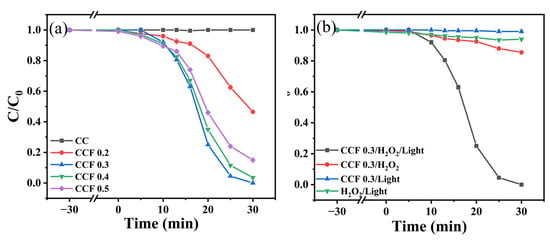
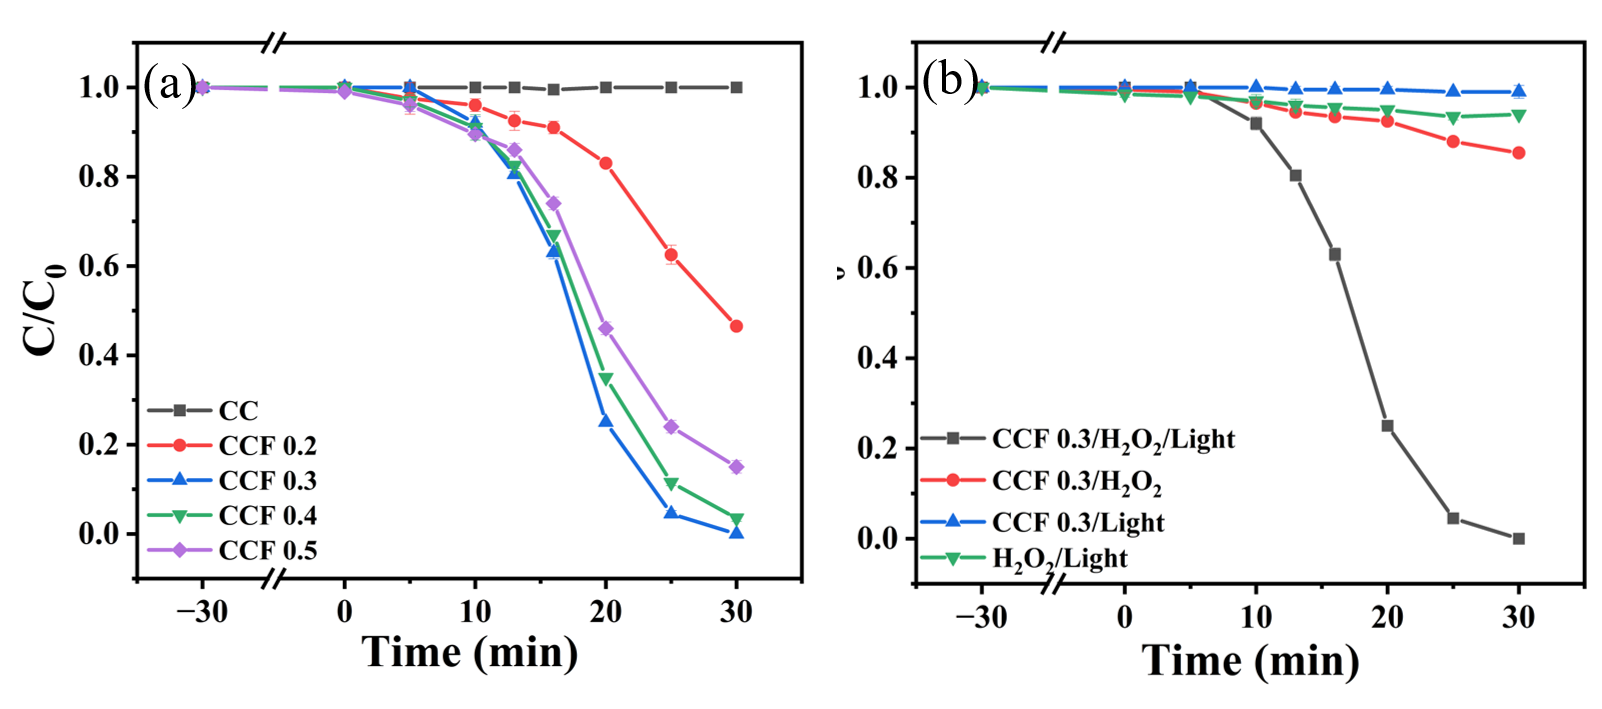
The catalysts with different iron contents had a significant effect on the degradation of phenol. To evaluate the photo-Fenton activity of these catalysts, phenol (20 mg/L, 50 mL) was used as the target pollutant, and the adsorption and photo-Fenton performance of the different materials are shown in Figure 4a. None of the materials in the system exhibited significant adsorption of phenol, and CC was unable to activate hydrogen peroxide to degrade the pollutant under light conditions. In contrast, CCF 0.2 showed good degradation performance. This is because the iron in CCF 0.2 is highly dispersed and exists in an amorphous structure, providing a large number of active sites for hydrogen peroxide activation and pollutant degradation [22]. The degradation of phenol by CCF 0.3 was significantly accelerated by increasing the iron content. This is due to CCF 0.3′s microcrystalline–amorphous structure, where the amorphous region, with its high surface energy, activates hydrogen peroxide, while the microcrystalline region provides a stable iron phase [22]. The microcrystalline and amorphous regions work synergistically to further enhance pollutant degradation [43]. Additionally, CCF 0.3 contains obvious grain boundaries, which act as reaction sites for pollutant adsorption, activation, and desorption. These grain boundaries also promote the reaction and improve the catalytic activity, significantly accelerating phenol degradation. However, as the iron content continued to increase, the degradation of phenol by CCF 0.4 decreased. This decline is due to the formation of crystalline grains in CCF 0.4 caused by the higher iron content, which reduced its photo-Fenton performance.
Figure 4.
(a) Comparison of the effects of different catalysts on phenol adsorption and photo-Fenton degradation. (b) Effect of CCF 0.3 on phenol adsorption and photo-Fenton degradation under various conditions. Reaction conditions: [Phenol]0 = 20.0 mg/L, [Catalyst]0 = 0.2 g/L, [H2O2]0 = 4.0 mM.
To fully understand the photo-Fenton performance of the catalysts, the effect of various reaction conditions on phenol degradation was investigated, as shown in Figure 4b. In the absence of H2O2, the CCF 0.3/Light system exhibited negligible phenol removal within 30 min under the investigated conditions, indicating that light irradiation of CCF 0.3 alone was insufficient for effective phenol degradation. Without CCF 0.3, hydrogen peroxide degraded only 6% of the phenol under light conditions. This is because H2O2 has certain oxidative properties and can degrade a small amount of phenol. Under dark conditions, CCF 0.3 can activate hydrogen peroxide to degrade 15% of the phenol. This is due to the fact that the microcrystalline–amorphous structure of CCF 0.3 is not fully utilized under dark conditions, resulting in limited hydroxyl radical generation and thus affecting phenol degradation. Figure S3 presents the results of an extended degradation experiment conducted with CCF 0.3 under dark conditions, revealing that while the catalyst achieved nearly complete phenol removal (≈100%) after 180 min of reaction, its degradation efficiency remained substantially inferior to that obtained under light irradiation conditions [43]. In summary, the three factors, CCF 0.3, hydrogen peroxide, and light, are indispensable in the phenol degradation process, and they work synergistically to achieve the degradation effect.
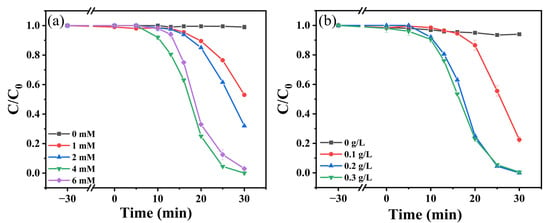
Different concentrations of hydrogen peroxide (1 mM, 2 mM, 4 mM, and 6 mM) were added to the system to study the effect of the initial hydrogen peroxide concentration on phenol degradation (Figure 5a). In the absence of hydrogen peroxide, CCF 0.3 was unable to degrade phenol. The degradation of phenol by CCF 0.3 was significantly accelerated as the initial hydrogen peroxide concentration increased from 1 mM to 4 mM, with the fastest degradation occurring at 4 mM, when the active sites in CCF 0.3 were fully utilized. However, when the initial H2O2 concentration was further increased to 6 mM, the phenol degradation rate decreased slightly. This may be attributed to the scavenging of ·OH by excess, which reduces the availability of ·OH for phenol oxidation [40]. Therefore, an appropriate H2O2 concentration is necessary to balance radical generation and consumption, with 4 mM providing the highest degradation rate under the investigated condition.
Figure 5.
Influences of H2O2 dosage (a) and catalyst dosage (b) on phenol degradation. Reaction conditions: [Phenol]0 = 20.0 mg/L, [Catalyst]0 = 0.2 g/L, [H2O2]0 = 4.0 mM.
In Figure 5b, the effect of CCF 0.3 on phenol degradation was investigated with a fixed phenol concentration (20 mg/L) and a fixed initial hydrogen peroxide concentration (4 mM). The phenol degradation rate was significantly accelerated when the CCF 0.3 concentration increased from 0.1 to 0.2 g/L. At 0.2 g/L, and 100% phenol degradation was achieved within 30 min. When the CCF 0.3 dosage was further increased to 0.3 g/L, the phenol degradation rate was enhanced by the first 20 min due to the higher content of CCF 0.3. However, after 20 min, the degradation rate decreased because excess CCF 0.3 formed agglomerates, which hindered the reaction [44]. Therefore, 0.2 g/L was chosen as the optimal catalyst concentration, and 4 mM was selected as the ideal initial hydrogen peroxide concentration for subsequent experiments.
2.2.2. Effect of Different Conditions on Phenol Removal
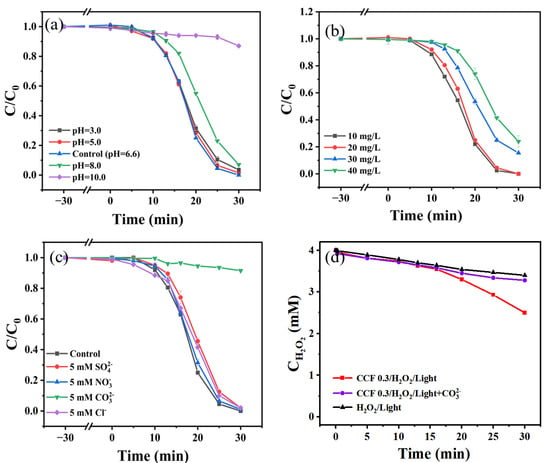
In Fenton-like systems, the initial pH is a crucial factor that must be considered [45]. The degradation of phenol at different initial pH values (pH = 3, 5, 8, 10) is shown in Figure 6a. It is clear that phenol degradation is strongly influenced by pH. At pH = 8, the degradation effect was somewhat weakened. At pH = 10, phenol degradation was almost completely inhibited. This inhibition occurs for two main reasons: first, the pKa of phenol is 9.95, and when pH > 9.95 (i.e., pH = 10), phenol exists as the phenoxide ion (C6H5O−), which is more stable and hydrophilic [3,46]. This affects its interaction with the catalyst. Secondly, hydrogen peroxide is less stable in alkaline environments, which leads to a decrease in the production of hydroxyl radicals, subsequently reducing photo-Fenton activity [7]. At pH = 5, phenol degradation was largely unaffected. However, at pH = 3, phenol removal was slightly hindered, though the effect was negligible. In summary, phenol degradation is largely unaffected under acidic and neutral conditions, but is partially inhibited in weakly alkaline environments. When the pH is too high (greater than 9.95), phenol exists as phenoxide ions, which negatively impacts phenol degradation [39].
Figure 6.
Phenol removal efficiency under different conditions: (a) varying initial pH; (b) varying initial pollutant concentration; (c) varying inorganic anion species. (d) variation of hydrogen peroxide concentration in different systems. Reaction conditions: [Phenol]0 = 20.0 mg/L, [Catalyst]0 = 0.2 g/L, [H2O2]0 = 4.0 mM.
In Figure 6b, the effect of initial phenol concentration on phenol degradation was investigated by varying the initial phenol concentration. When the initial phenol concentration was reduced to 10 mg/L, the molar ratio of hydrogen peroxide to phenol increased, resulting in an accelerated phenol degradation rate. In contrast, when the initial phenol concentration was increased to 40 mg/L, the molar ratio of hydrogen peroxide to phenol decreased, slowing down the degradation rate. At this concentration, 100% removal was not achieved within 30 min; however, the reaction continued, suggesting that extending the reaction time might further improve phenol degradation [47]. When the phenol concentration was further increased to 80 mg/L, CCF 0.3 still exhibited a good degradation effect [34]. By adjusting the initial concentration of phenol in the reaction system, which changes the molar ratio of hydrogen peroxide to phenol, it was demonstrated that CCF 0.3 could effectively degrade high concentrations of phenol [38].
In natural aquatic environments, the complexity of the water matrix may introduce various anions (e.g., Cl−, SO42−, NO3−, CO32−, etc.), which can interfere with the activation process of hydrogen peroxide by scavenging free radicals or through other mechanisms [48]. In this study, different concentrations of anions were added before the reaction to simulate the degradation of phenol in real wastewater. The results are shown in Figure 6c. It is clear that all the anions affect phenol degradation to some extent. Among them, the presence of Cl−, SO42−, and NO3− ions had a minimal effect on phenol degradation, and phenol could still be nearly completely removed after 30 min. However, in the presence of CO32−, phenol degradation was almost completely inhibited. This is because the pH of the solution increased to 11.67 after the addition of CO32−. As a result, phenol was converted into phenoxide ions, which hindered its degradation [39]. In addition, hydrogen peroxide is unstable under alkaline conditions, leading to a reduction in the generation of hydroxyl radicals. In Figure 6d, the changes in hydrogen peroxide concentration in the CCF 0.3/H2O2/Light and CCF 0.3/H2O2/Light + CO32− systems are compared, with the H2O2/Light system serving as the control. The results show that while the CCF 0.3/H2O2/Light + CO32− system still consumes hydrogen peroxide, it does so at a reduced rate. This suggests that the presence of CO32− hinders the interaction between the active site and hydrogen peroxide. The results also indicate that phenol can still be removed in the presence of CO32−; however, only 9% of the phenol was removed, suggesting that CO32− interferes with hydroxyl radical generation. In Figure S4, the degradation process in the CCF 0.3/H2O2/Light + CO32− system was extended to 300 min. Overall, phenol degradation occurred, but at a much slower rate. An additional pH-matched control at pH 11.67 was conducted, and the result (Figure S9) further confirmed that strongly alkaline conditions markedly suppress phenol degradation. Therefore, we conclude that the inhibitory effect observed in the presence of CO32− is mainly associated with the elevated alkalinity, with possible additional contributions from carbonate-related radical reactions.
2.3. Catalyst Stability and Suitability
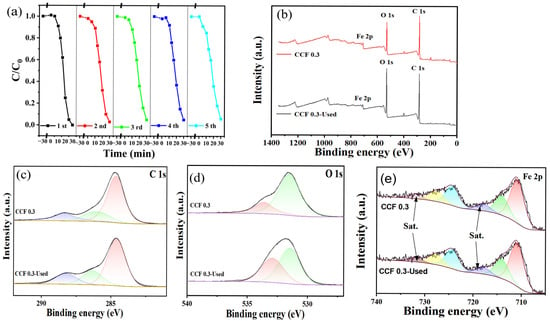
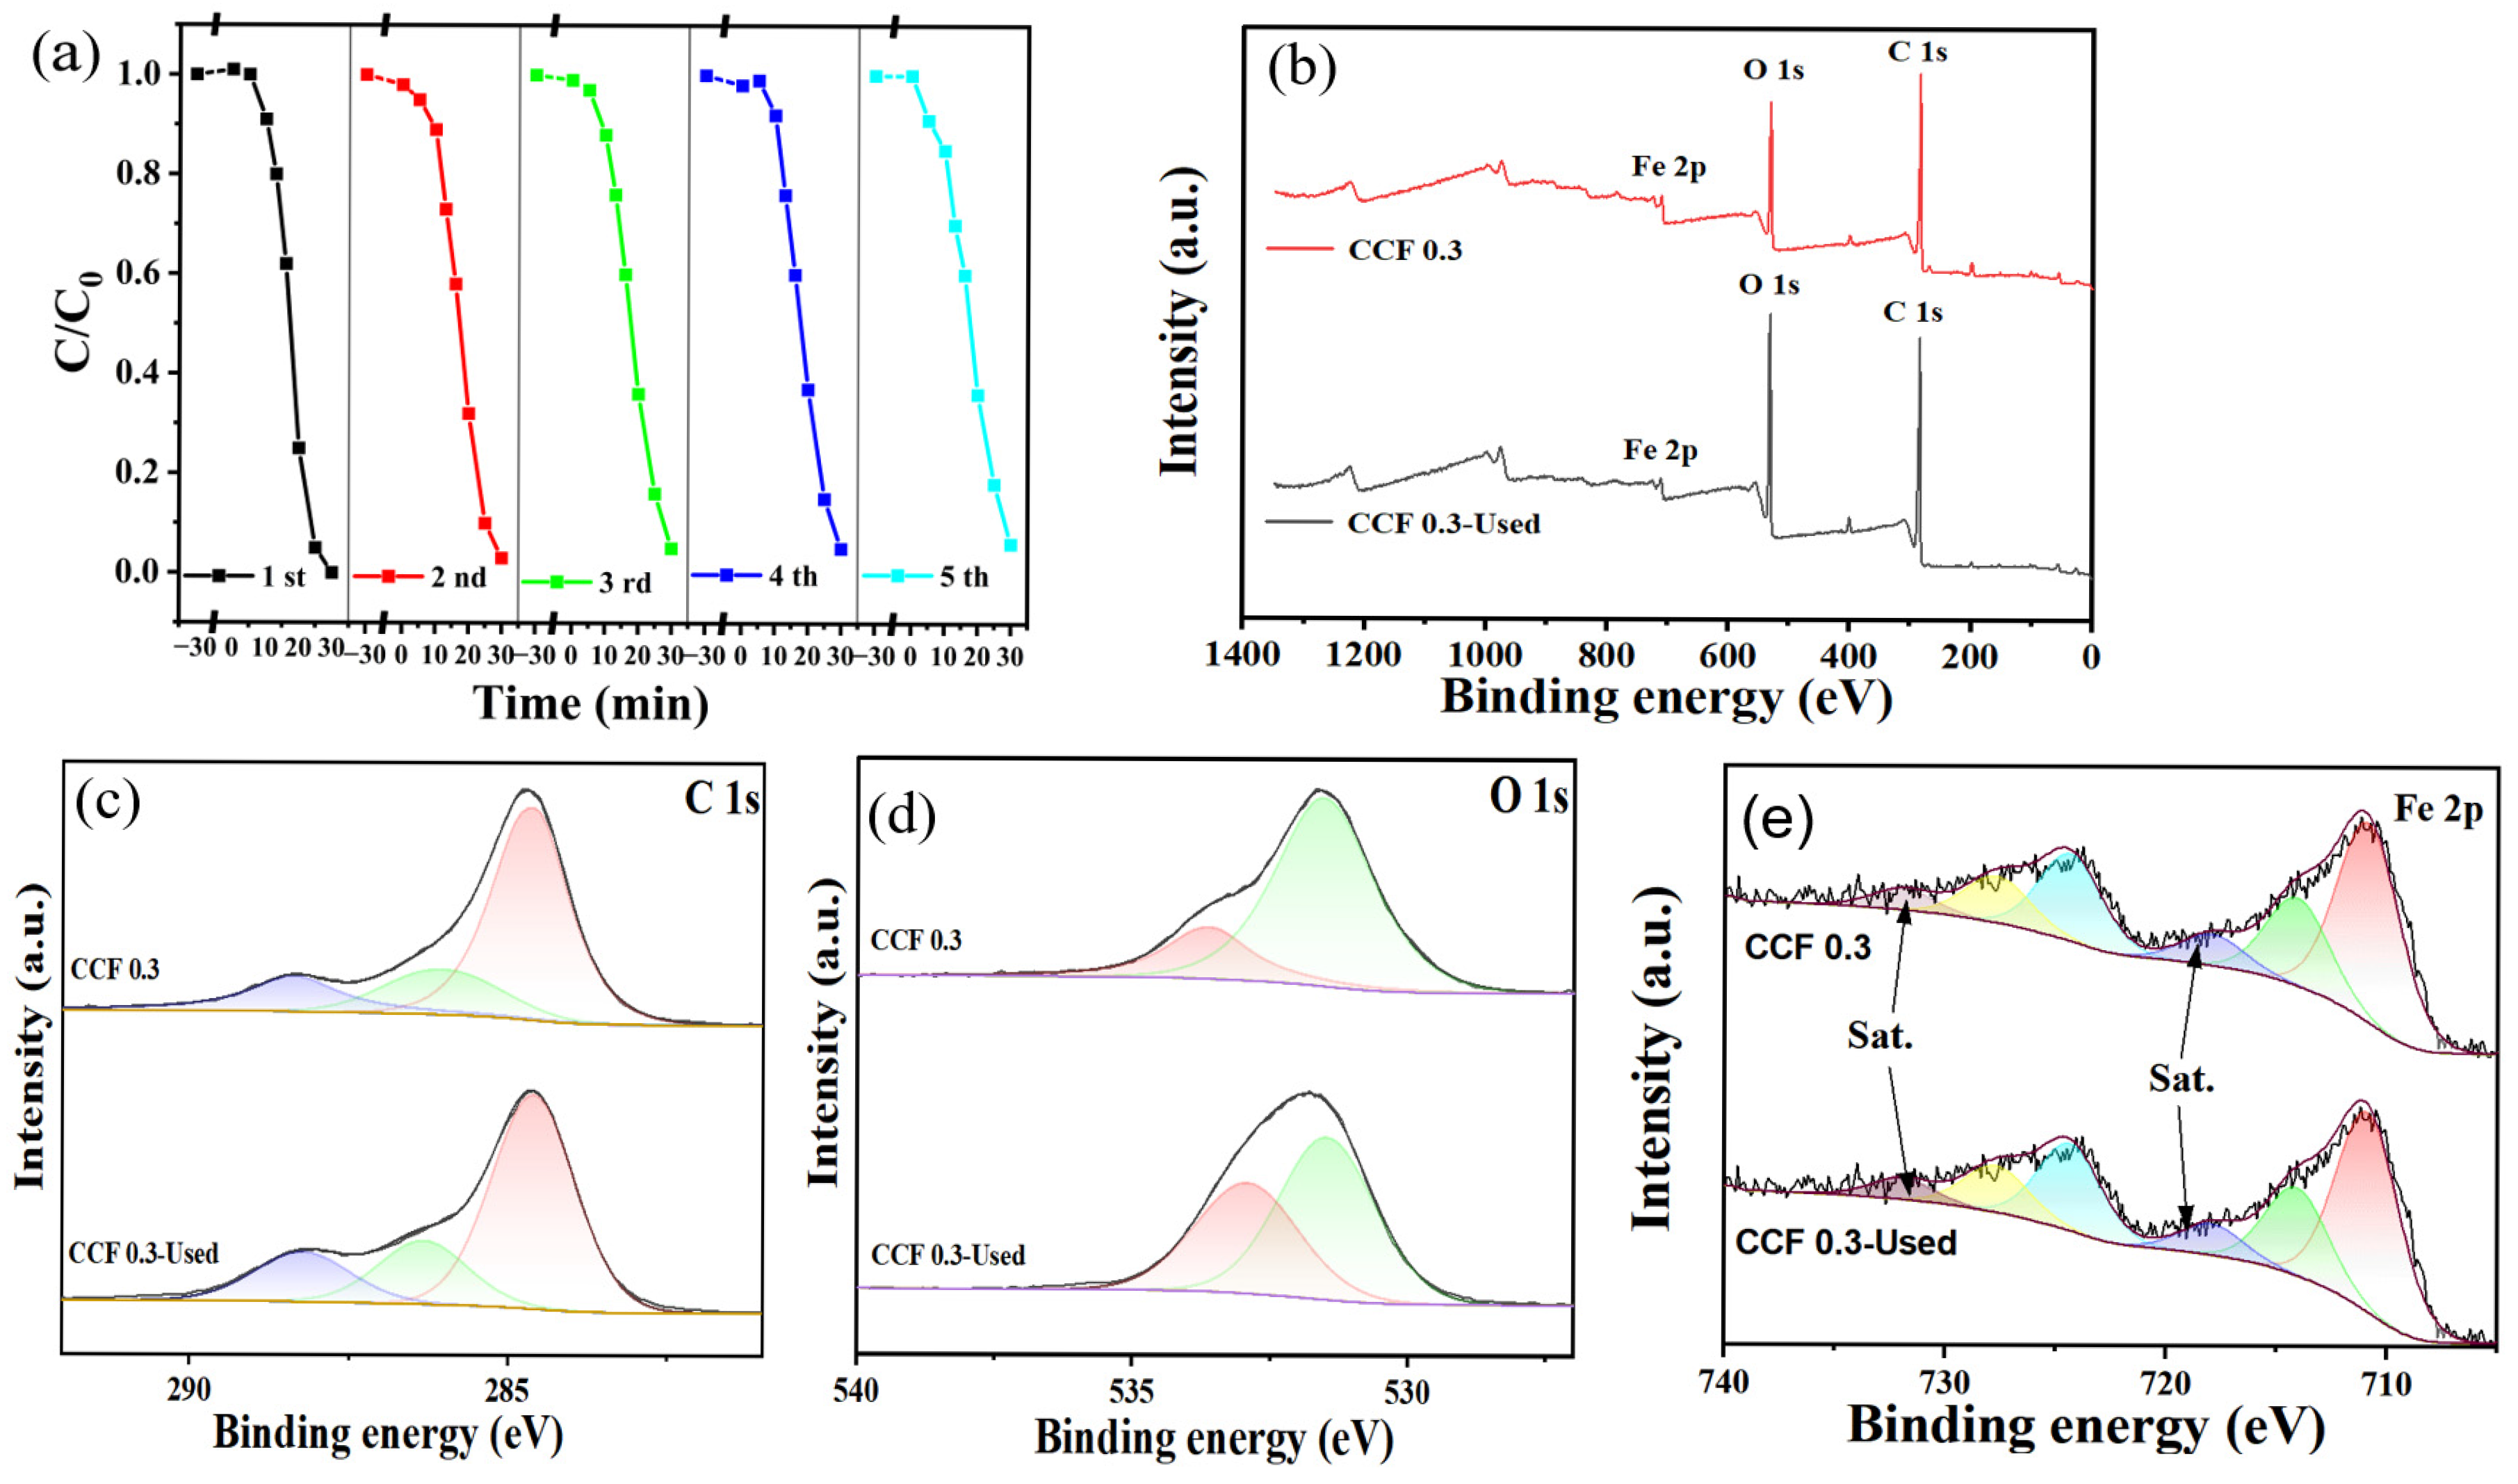
The reusability of the catalyst is a key factor in evaluating the stability of the material and an important consideration in practical water treatment applications. To assess the stability of the catalyst, we conducted five cycles of experiments with CCF 0.3 and performed XPS analysis on both the fresh and used catalysts. The results are shown in Figure 7. It is evident that the phenol degradation efficiency of CCF 0.3 slightly decreased after five cycles; however, there was no significant change overall, indicating that CCF 0.3 retains good stability.
Figure 7.
Cycling experiment of CCF 0.3 (a). Reaction conditions: [Phenol]0 = 20.0 mg/L, [Catalyst]0 = 0.2 g/L, [H2O2]0 = 4.0 mM. XPS spectral scans of CCF 0.3 (b) and high-resolution scans with curve-fitting analysis of C 1s (c), O 1s (d), and Fe 2p (e).
Additionally, XPS analysis of the fresh and used catalysts was performed to examine changes in the catalyst’s valence states before and after use, with the results shown in Figure 7b. The total XPS spectra of the fresh and used catalysts were almost identical, showing minimal differences. High-resolution XPS analysis of the C 1s spectra revealed three peaks for both fresh and recycled catalysts: C=C (284.6 eV), C−O (285.86 eV), and C=O (288.36 eV) [49]. For the fresh catalyst, the peak areas corresponded to 64.5%, 19.4%, and 16.1%, respectively, while the peak areas for the catalyst after five cycles were 62.9%, 20.1%, and 17.0%. The slight increase in the peak areas of C−O and C=O after multiple cycles suggests oxidation of the carbon layer surface, likely due to repeated reactions with hydrogen peroxide, as well as cumulative effects from the repeated use of the catalyst, which alter the distributions and contents of C−O and C=O. In the high-resolution O 1s spectrum, both the fresh material and the material after five cycles showed two peaks: C=O/O−C=O (531.48 eV) and -OH (533.54 eV) [50]. The peak areas for the fresh catalyst were 78.1% and 21.9%, respectively, while the peak areas for the catalyst after five cycles were 57.8% and 42.2%, respectively. This change is likely due to the surface catalytic reaction, which results in a relative increase in the −OH peak area and a relative decrease in the peak area of C=O/O−C=O [51]. In addition, high-resolution O 1s spectra analysis showed a significant decrease in the binding energy of −OH groups in the used CCF 0.3 samples compared to the fresh CCF 0.3. This phenomenon can be attributed to a chemical reaction between water molecules or hydroxyl groups adsorbed on the surface of the material and the reactants, which results in a shift in its electronic binding energy [50]. In the high-resolution Fe 2p spectra, two prominent peaks corresponding to Fe 2p3/2 (711.1 eV) and Fe 2p1/2 (724.0 eV) were observed. In addition, two satellite peaks at approximately 718 eV and 731 eV were identified, corresponding to the shake-up satellite features associated with Fe 2p3/2 and Fe 2p1/2, respectively [40]. The peaks at 711.15 eV and 724.37 eV correspond to Fe3+, while the peaks at 713.81 eV and 727.40 eV correspond to Fe2+ [52]. For the fresh catalyst, the peak areas at 711.15 eV, 713.81 eV, 724.37 eV, and 727.40 eV were 44.2%, 23.8%, 21.6%, and 10.4%, respectively. After five cycles, the corresponding peak areas were 48.3%, 22.9%, 19.6%, and 11.2%. It can be seen that there is basically no significant change between the fresh catalyst and the catalyst after five uses [37].
To further evaluate the stability and reusability of CCF 0.3, iron leaching, the catalytic contribution of dissolved iron species, and catalyst recovery efficiency were systematically investigated. Figure S10a shows the variation in dissolved Fe concentration during phenol degradation by CCF 0.3. The concentration of leached Fe gradually increased with reaction time, reaching a maximum of approximately 0.24 mg L−1. Since dissolved Fe ions may also catalyze phenol degradation, their contribution to the overall catalytic performance was further investigated. To evaluate this contribution, CCF 0.3 was first stirred in the phenol solution for 30 min and subsequently removed by filtration. H2O2 was then added to initiate the degradation reaction under light irradiation, and the variation in phenol concentration in the filtrate was monitored (Figure S10b). The results of five independent experiments showed that the filtrates achieved only approximately 8–11% phenol removal within 30 min, which was considerably lower than that achieved by the complete CCF 0.3/H2O2/light system. These results suggest that the catalytic contribution of dissolved Fe species was limited and that heterogeneous catalysis played a dominant role in the overall degradation process.
To further assess the iron leaching behavior of CCF 0.3 during repeated use, the dissolved Fe concentration was monitored after each reaction cycle. As shown in Figure S10c, the dissolved Fe concentration gradually decreased from approximately 0.24 mg L−1 in the first cycle to 0.16 mg L−1 in the fifth cycle. Furthermore, the single-cycle catalyst recovery efficiency remained within the range of 91.22–94.56% over five consecutive cycles (Figure S10d), indicating good recoverability of CCF 0.3. Combined with the recycling performance, iron leaching measurements, filtrate control experiments, and catalyst recovery results, the XPS analyses further support the good stability and reusability of CCF 0.3.
The applicability of the catalyst is an important performance indicator. To assess this, degradation experiments were conducted in different types of water, and the results are shown in Figure S5. The CCF 0.3/H2O2/light system was tested for phenol degradation using tap water. Initially, phenol degradation was minimal, but after an extended reaction time, phenol was rapidly degraded. This slower initial degradation rate can be attributed to the presence of various substances in the tap water that interfere with free radical generation, which in turn slows the phenol degradation process. When phenol was tested with the Ba River water, only a small amount of phenol was degraded over an extended period. The physicochemical characteristics of the Ba River water used in this study are summarized in Table S1. This is likely due to the more complex composition of river water, which may require a longer time for phenol degradation.
2.4. Reaction Mechanism
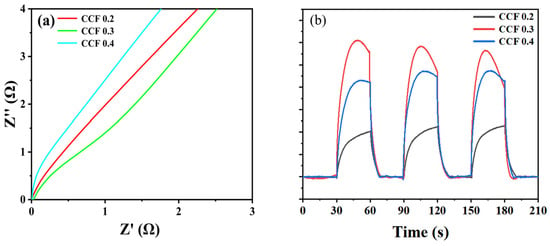
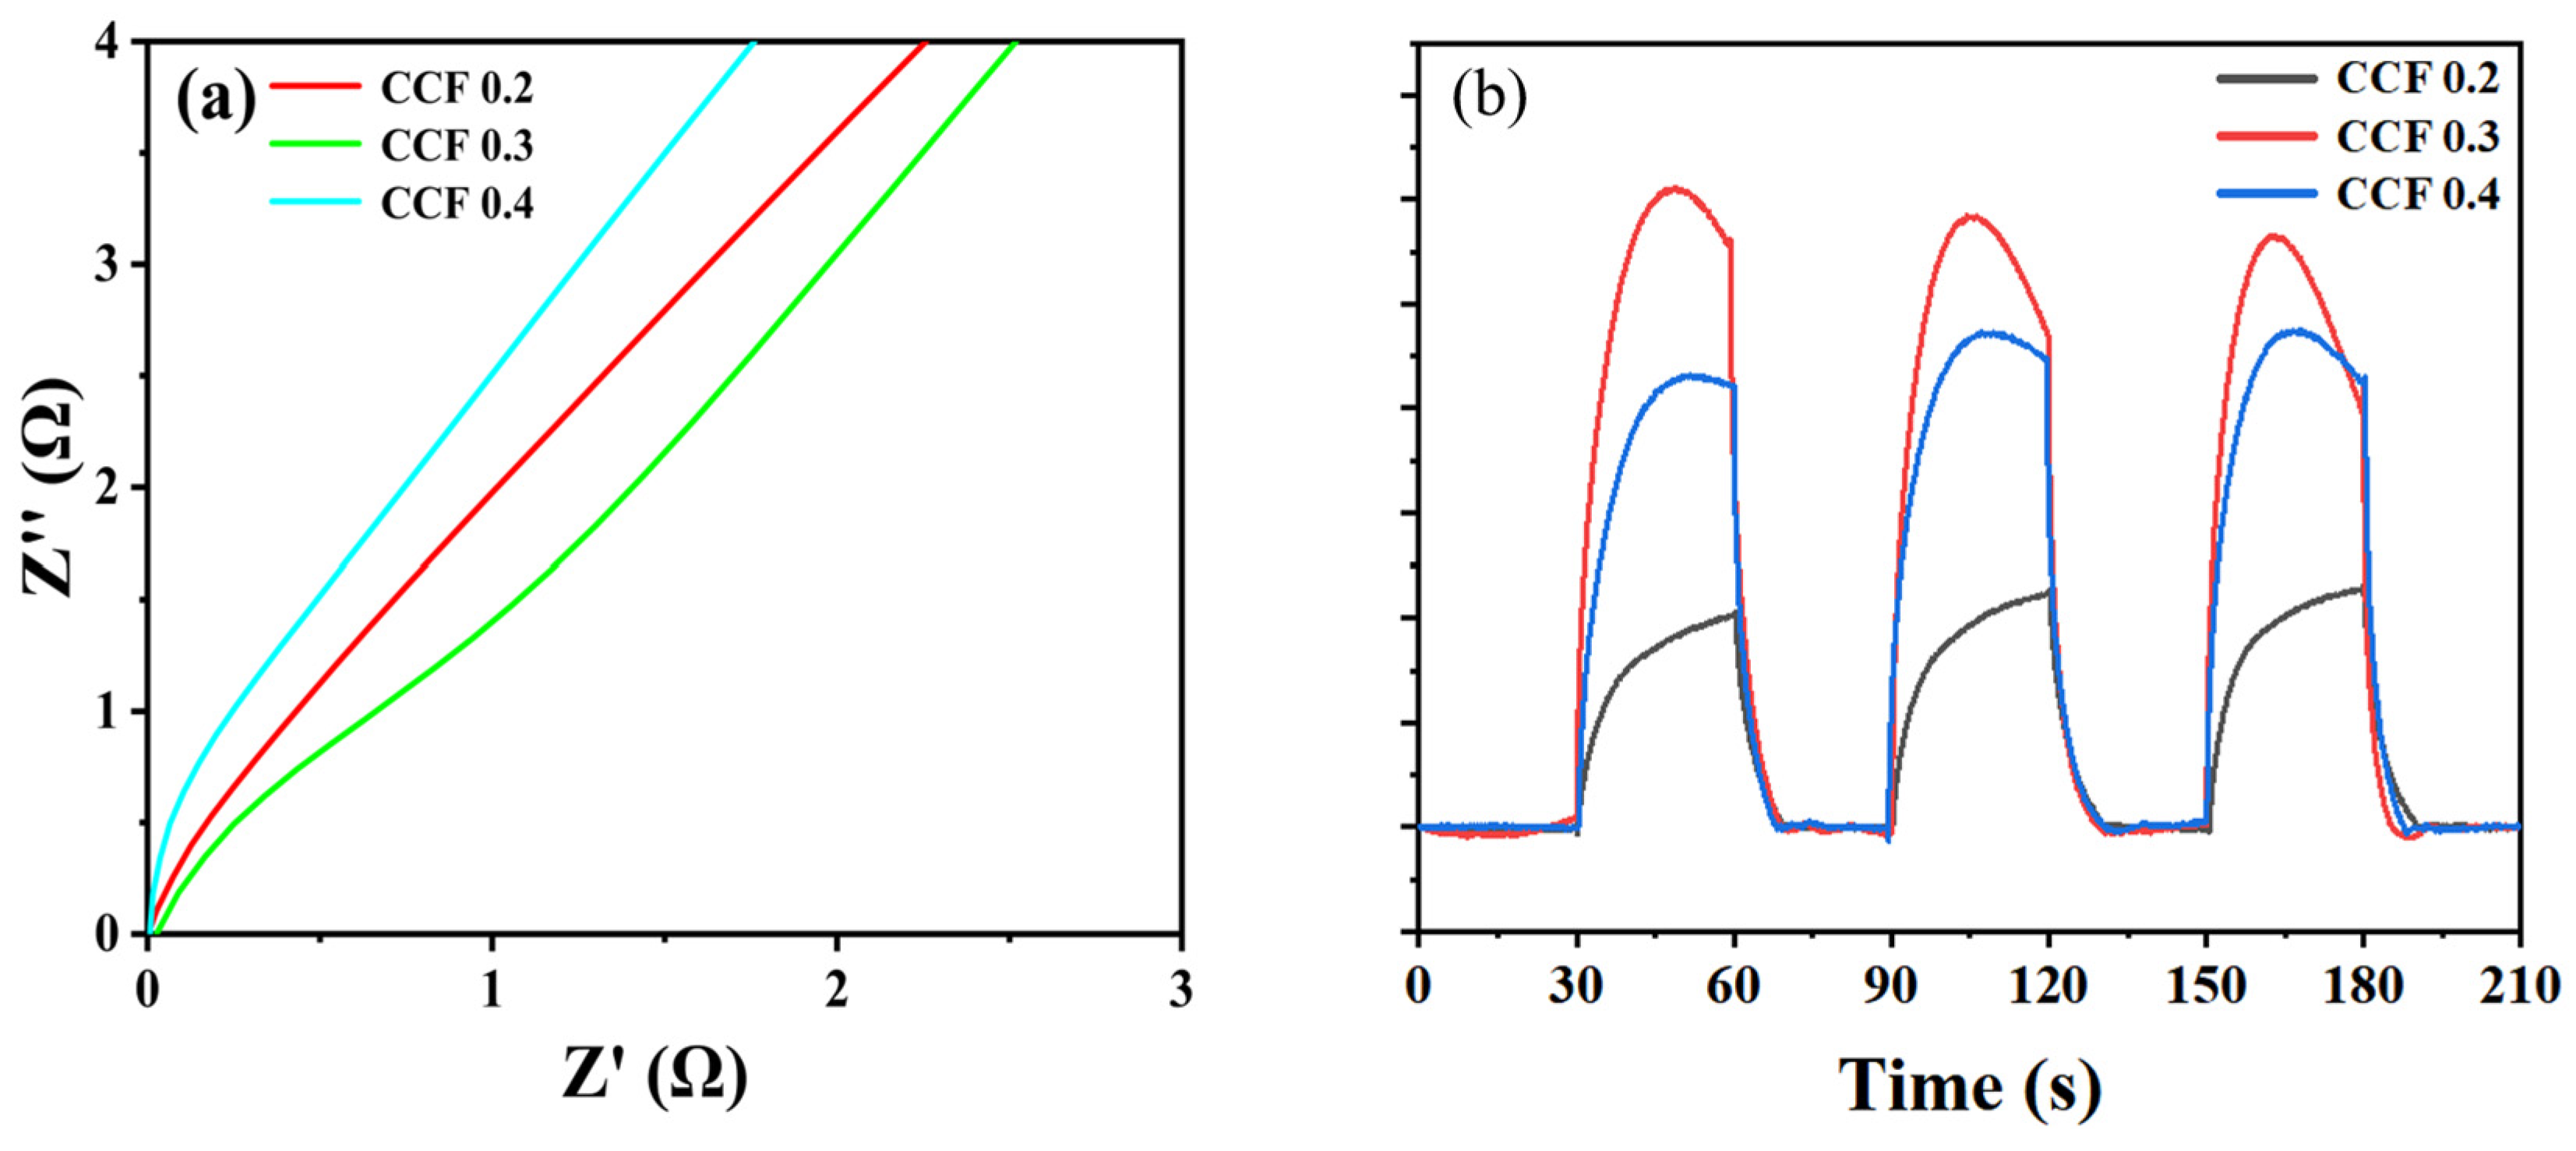
In order to elucidate the reaction mechanism of CCF 0.3 for degradation of phenol by hydrogen peroxide activation under light, electrochemical impedance spectroscopy and photocurrent measurements were carried out on CCFx (x = 0.2, 0.3, 0.4). Figure 8a shows that CCF 0.3 has the smallest radius of the semicircle, the lowest charge transfer resistance and the highest charge transfer kinetic efficiency among all samples. Figure 8b shows that CCF 0.3 produced the highest transient photocurrent intensity, while CCF 0.2 had the lowest response. This variation in performance is related to the different iron structural configurations in each catalyst: CCF 0.2 contains amorphous iron, CCF 0.3 has a microcrystalline–amorphous composite structure, and CCF 0.4 has crystalline iron. The excellent electrochemical performance of CCF 0.3 can be attributed to its unique microcrystalline–amorphous structure, which promotes rapid electron transfer and enhances photogenerated charge separation efficiency.
Figure 8.
Electrochemical impedance spectroscopy (a) and transient photocurrent analysis (b) of CCF 0.2, CCF 0.3, and CCF 0.4.
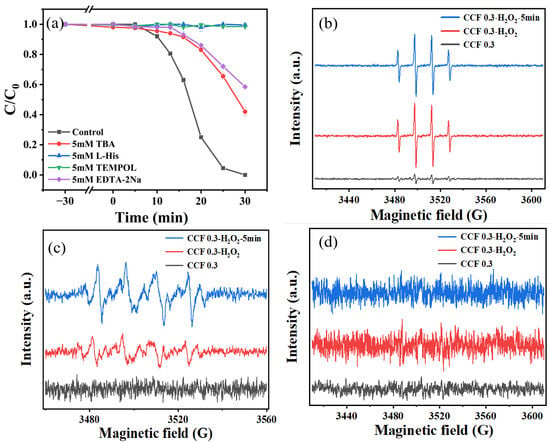
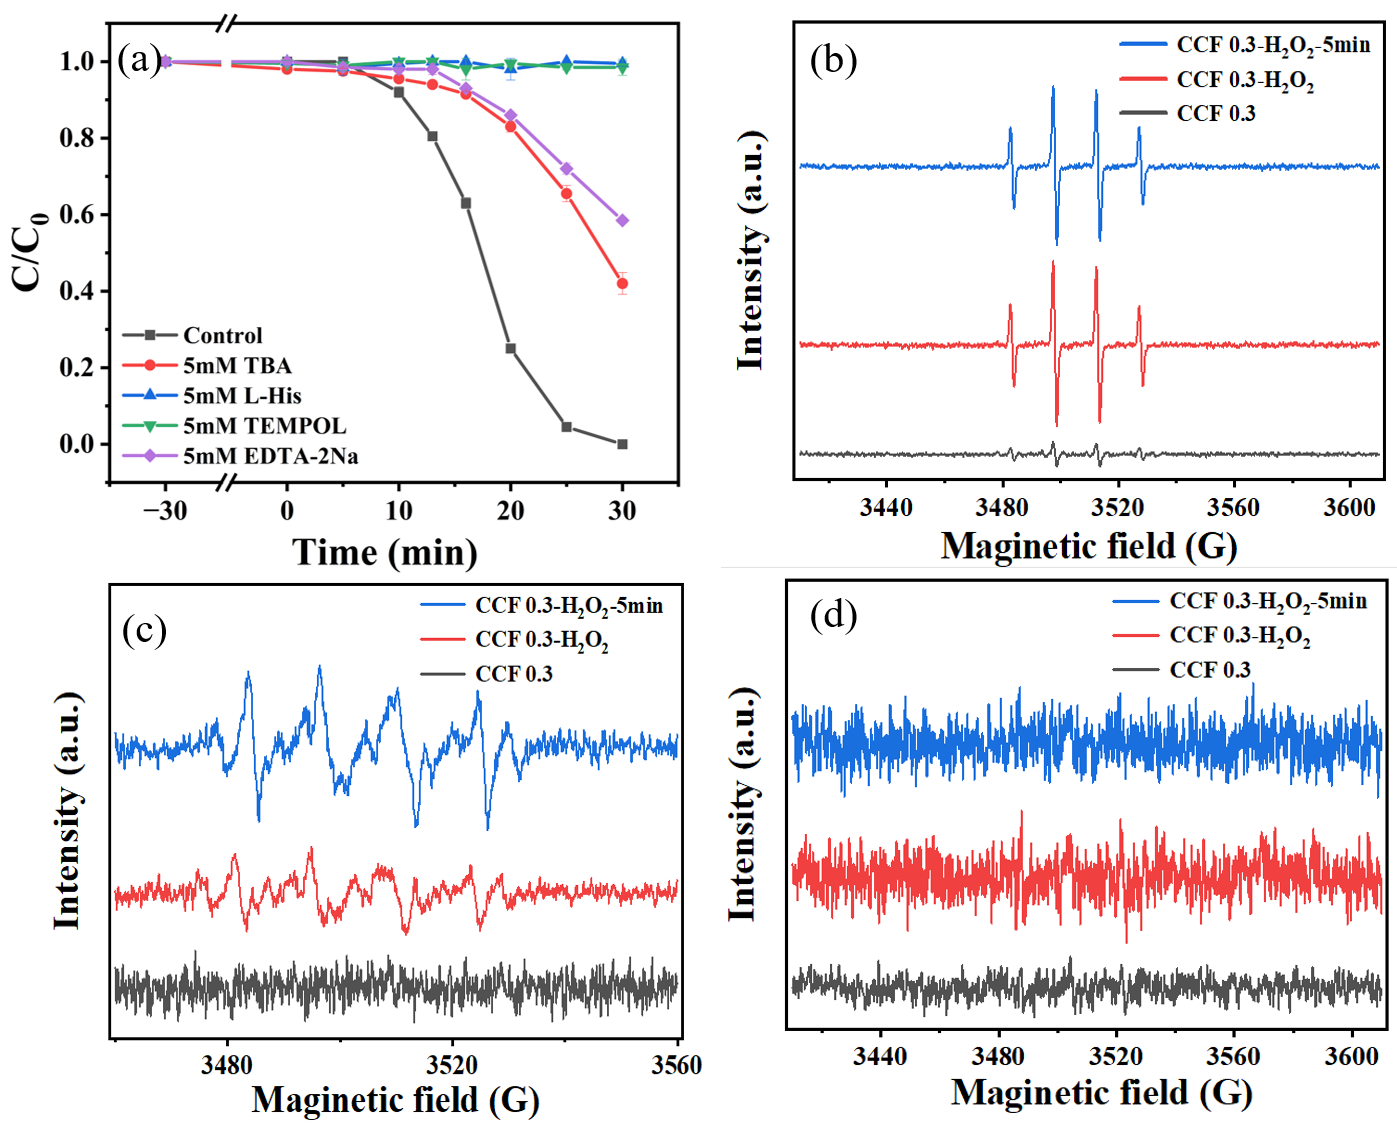
To determine the reactive oxygen species (ROS) involved in the reaction process, different quenching agents were introduced during the dark reaction to ensure adequate mixing and observe their effect on phenol removal rates (Figure 9a). To assess the impact of hydroxyl radicals (·OH) on phenol removal, tert-butyl alcohol (TBA) was used as a quenching agent. After adding 5 mM TBA to the reaction system, phenol degradation was significantly inhibited, and after 30 min of light exposure, the degradation rate was only 58%. To investigate the role of singlet oxygen (1O2) in phenol removal, histidine (L-His) was used as a quenching agent. The removal of phenol was almost completely inhibited by the addition of 5 mM L-His, and phenol was essentially not degraded after 30 min of light exposure. To evaluate the effect of superoxide radicals (·O2−) on phenol removal, 4-hydroxy-TEMPO (TEMPOL) was used as a quenching agent. The addition of 5 mM TEMPOL to the reaction system significantly inhibited phenol removal, and phenol degradation was completely suppressed after 30 min of light exposure, with almost no degradation occurring. Finally, EDTA-2Na was used to complex ferric ions and investigate their effect on phenol degradation. After adding 5 mM EDTA-2Na to the system, the phenol removal rate was only 42% after 30 min of light exposure, indicating the important role of ferric ions in the reaction. In addition, control experiments were conducted using different concentrations of quenching agents, as shown in Figure S6. Increasing the concentrations of L-His and TEMPOL did not result in significant differences. However, when the concentration of TBA was increased, its inhibitory effect was enhanced, and phenol was almost completely undegraded after 30 min of light exposure. This suggests that when TBA at a concentration of 5 mM was used as the quenching agent, the quenching process was incomplete, and some hydroxyl radicals remained involved in the reaction.
Figure 9.
Effect of different quenchers on phenol degradation (a). Reaction conditions: [Phenol]0 = 20.0 mg/L, [Catalyst]0 = 0.2 g/L, [H2O2]0 = 4.0 mM. EPR signals for ·OH (b), ·O2− (c), and 1O2 (d).
Electron paramagnetic resonance (EPR) experiments were performed to determine which reactive oxygen species are more active during phenol degradation. ·OH and ·O2− radicals were detected using 5,5−dimethyl−1−pyrroline N−oxide (DMPO) as a trapping agent, and 1O2 was detected using 2,2,6,6-tetramethylpiperidine (TEMP) as a trapping agent. As shown in Figure 9, the CCF 0.3 sample exhibits a weak DMPO−OH spin-trapping signal. This phenomenon suggests that the formation of DMPO−OH adducts primarily originates from the reaction between DMPO and CCF 0.3, rather than from the direct production of hydroxyl radicals (·OH) by the CCF 0.3 material itself. To verify this hypothesis, a 300-min phenol degradation experiment was conducted with CCF 0.3, as shown in Figure S7. As expected, phenol was not degraded, suggesting that CCF 0.3 does not have the ability to degrade phenol. Therefore, the detected ·OH signals are likely generated by the reaction between the CCF 0.3 surface and DMPO. Additionally, in the CCF 0.3/H2O2 system, a clear ·OH signal appeared, and this signal was further enhanced under light conditions, although the increase was not as pronounced. This enhancement is attributed to the fact that light can excite the active centers in the microcrystalline–amorphous catalysts, accelerating the electron transfer rate and promoting the interconversion between Fe2+ and Fe3+, leading to the generation of more reactive oxygen species [53]. In addition, CCF 0.3 alone does not show ·O2− signals, while weaker signals were observed in the CCF 0.3/H2O2 system. These signals were further enhanced in the CCF 0.3/H2O2/Light system. During the photo-Fenton degradation of phenol, the strong inhibitory effect of ·O2− on the reaction mainly arises from the following mechanisms: On the one hand, the involvement of ·O2− in the Fenton reaction, which reduces Fe3+ (Equation (5)), is essential for maintaining catalyst activity. When ·O2− is quenched, the Fe2+/Fe3+ cycle is disrupted, leading to a decrease in H2O2 decomposition efficiency and, consequently, a reduction in ·OH production. On the other hand, in the photo-Fenton system, ·O2− and ·OH tend to exhibit a synergistic degradation effect. ·O2− can attack phenol molecules, forming intermediates that are more susceptible to further oxidative degradation by ·OH. This synergistic effect disappears when ·O2− is quenched. However, no 1O2 signals were detected under light conditions in the CCF 0.3/H2O2 system, which contradicts the results from the quenching experiments. This discrepancy may be explained by the simultaneous quenching of ·OH and 1O2 by L-His. In Figure S8, 0.1 mM furfuryl alcohol (FFA) was used as a probe to determine whether 1O2 was present in the CCF 0.3/H2O2/Light system. Since ·OH in the system could also degrade FFA, TBA was used to scavenge ·OH. It was observed that FFA was rapidly degraded in the CCF 0.3/H2O2/Light system [54]. When TBA was used to scavenge ·OH, the FFA degradation was almost completely inhibited, similar to the light-only condition. Therefore, it was concluded that 1O2 does not exist in the CCF 0.3/H2O2/Light system, and that L-His primarily scavenges ·OH in this system [55].
Under dark conditions, the iron-containing active sites of CCF 0.3 may activate H2O2 through Fenton-like reactions involving Fe2+/Fe3+ redox cycling, generating ·OH radicals that contribute to phenol degradation. The detection of ·OH signals in the CCF 0.3/H2O2 system without irradiation (Figure 9b) supports this interpretation. However, the relatively slow reaction under dark conditions suggests that the generation of reactive oxygen species is less efficient. Under light irradiation, photoinduced electron transfer may facilitate the regeneration of Fe2+ from Fe3+, thereby accelerating H2O2 activation and ·OH production. Meanwhile, ·O2− may participate in the iron redox cycle and contribute to the overall oxidation process. The enhanced ·OH and ·O2− EPR signals under illumination (Figure 9b,c), together with the photocurrent response (Figure 8b), are consistent with this proposed mechanism. Therefore, light irradiation primarily accelerates the Fenton-like reaction rather than being an essential prerequisite for phenol degradation.
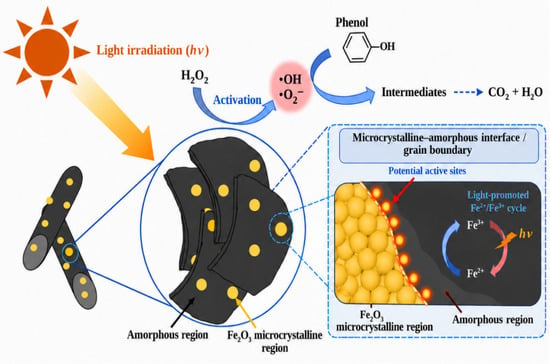
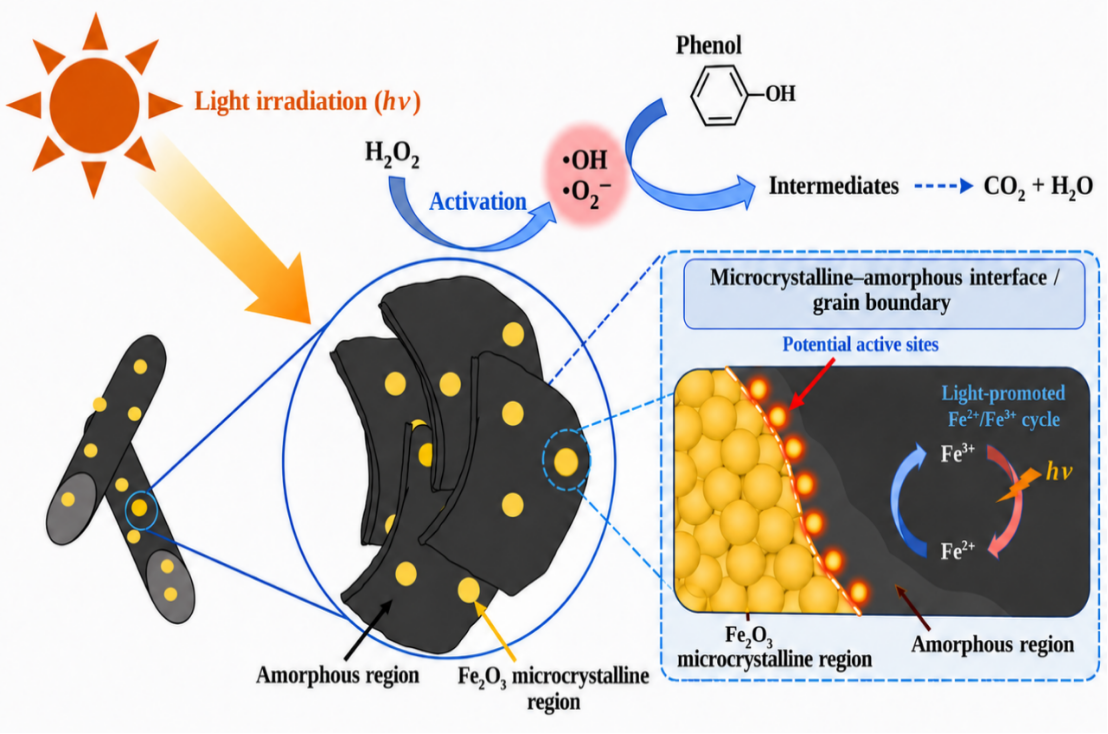
Based on the exploratory experiments mentioned above, it was determined that the main active species in the system was ·OH. A possible reaction mechanism, based on these results, is proposed in Figure 10. CCF 0.3 is a strip-like structure of varying sizes, with a large number of spherical structures distributed on the surface of the carbon layer and within the crevices. Under light conditions, these structures stimulate the active centers in the microcrystalline–amorphous catalysts, accelerating electron transfer rates and promoting the interconversion between Fe2+ and Fe3+. This generates more reactive oxygen species, facilitating the rapid degradation of pollutants. The possible reactions involved in the process are shown in Equations (1)–(6). The generated reactive oxygen species, particularly ·OH, can promote the oxidative transformation of phenol, potentially leading to the formation of various oxidation products:
Fe2+ + H2O2 → Fe3+ + ·OH + OH−
·OH + H2O2 → ·OOH + H2O
·OOH → ·O2− + H+
Fe3+ + ·OOH → Fe2+ + O2 + H+
Fe3+ + ·O2− → Fe2+ + O2
Fe2+ + O2 → Fe3+ + ·O2−
Figure 10.
Mechanism of phenol degradation by the CCF 0.3/H2O2/light system.
2.5. Proposed Phenol Degradation Pathway
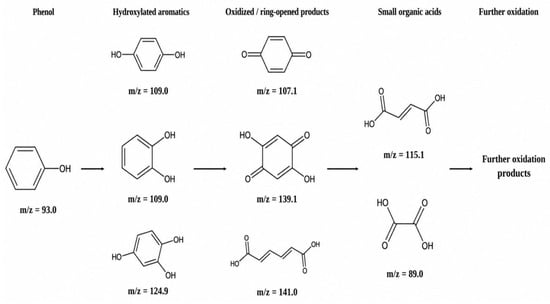
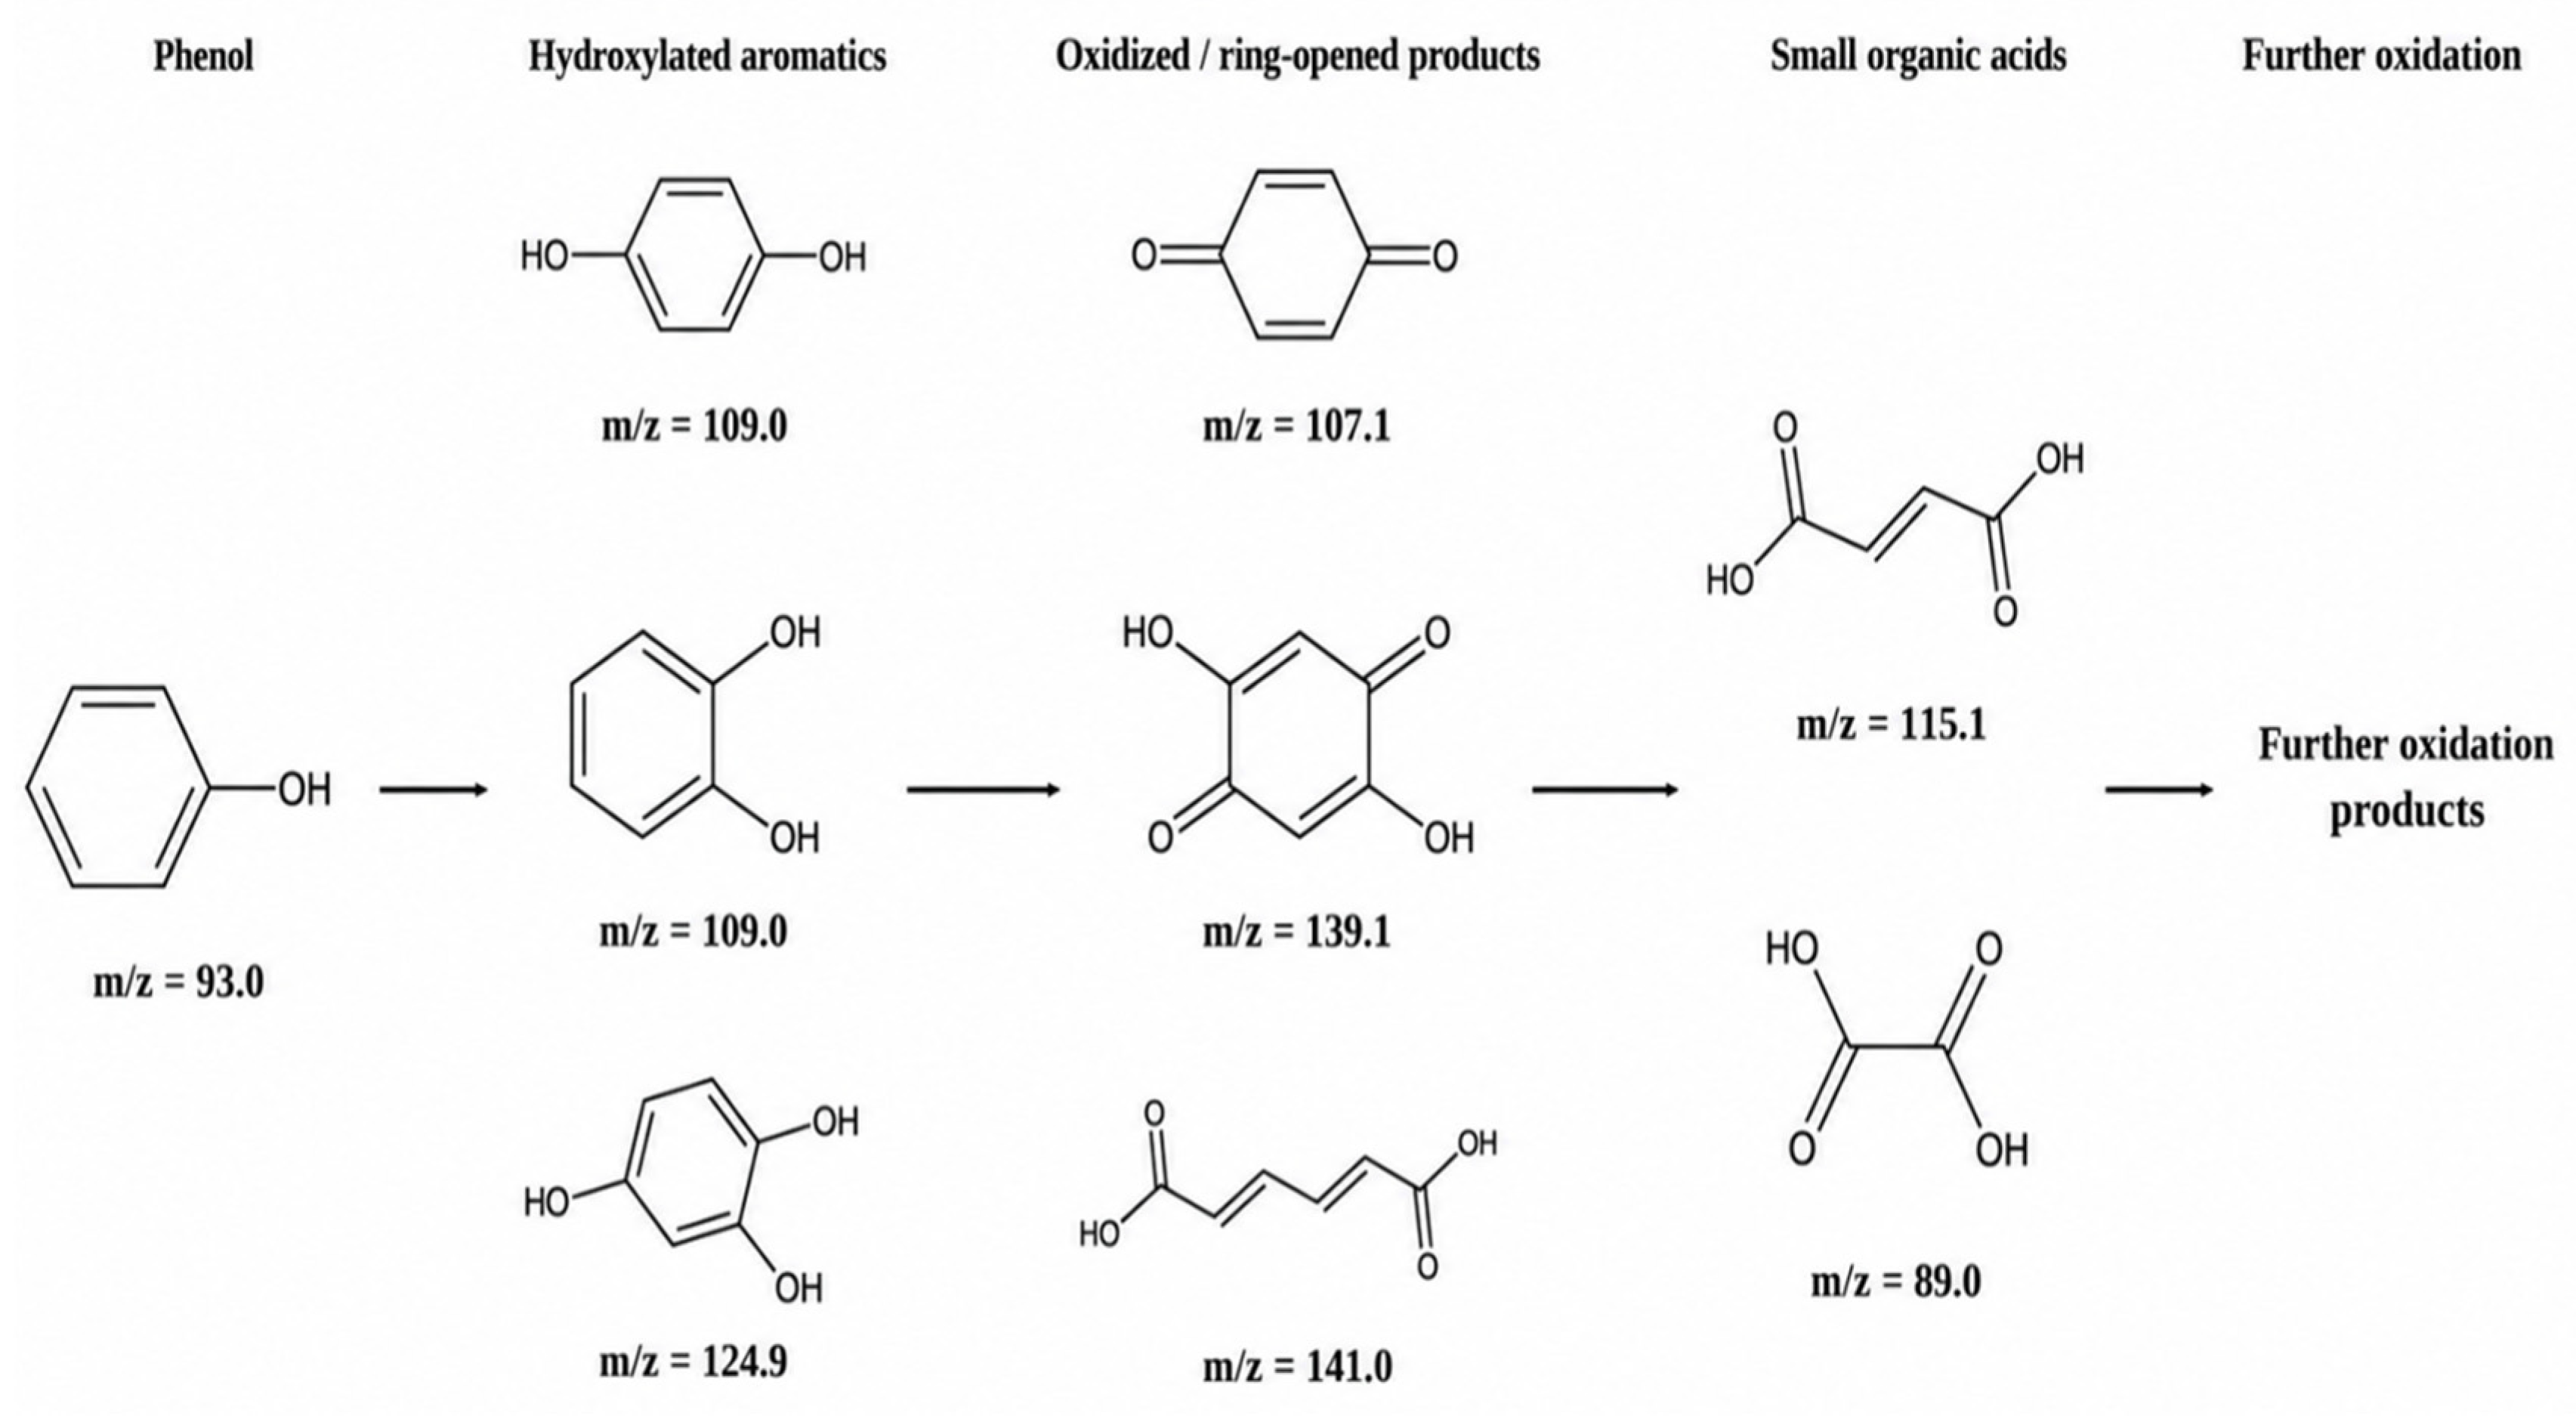
To further investigate the possible degradation pathway of phenol in the CCF 0.3/H2O2/light system, a high-performance liquid chromatography–mass spectrometry (HPLC-MS) analysis was performed in negative electrospray ionization (ESI−) mode. Samples were collected after 30 min of reaction for analysis. Based on the observed mass-to-charge ratios (m/z) (Figures S11 and S12), several degradation intermediates were tentatively assigned (Table S3). Combined with the radical scavenging and EPR results, which indicated that ·OH played a dominant role in phenol degradation, a possible degradation pathway was proposed, as illustrated in Figure 11. Initially, phenol may undergo hydroxylation by ·OH to form dihydroxybenzene intermediates. Subsequently, these aromatic intermediates may undergo further hydroxylation or oxidation to generate trihydroxybenzene and quinone-type compounds, including p-benzoquinone and dihydroxybenzoquinone. Under continued oxidative attack, cleavage of the aromatic ring may occur, leading to the formation of ring-opening products such as muconic acid. Further oxidation and fragmentation of these intermediates may result in the formation of low-molecular-weight organic acids, including maleic/fumaric acid and oxalic acid. However, the extent of mineralization and the residual toxicity of the treated solution were not evaluated in this study. Therefore, complete mineralization and detoxification cannot be concluded from the present results. Further investigations involving total organic carbon (TOC) measurements and toxicity assessments are necessary to comprehensively evaluate the environmental implications of this treatment process.
Figure 11.
Proposed transformation pathway of phenol in the CCF 0.3/H2O2/visible light system.
3. Materials and Methods
3.1. Materials and Chemicals
Cellulose (25 μm), ferric chloride hexahydrate (FeCl3·6H2O), sodium carbonate (Na2CO3), sodium chloride (NaCl), sodium nitrate (NaNO3), sodium sulfate (Na2SO4), methanol (CH3OH), hydrogen peroxide (H2O2), L-histidine (L-His), furfuryl alcohol (FFA), titanium potassium oxalate, sulfuric acid (H2SO4), tertiary butyl alcohol (TBA), and 5,5−dimethyl−1−pyrrolidine (DMPO) (97%) were obtained from McLean Biochemicals Ltd. (Shanghai, China). Ultrapure water was obtained from an ultrapure water machine (Chengdu Haokang Technology Co., Ltd., Chengdu, China).
3.2. Preparation of CCFx
A total of 1 g of cellulose powder and 0.3 g of ferric chloride hexahydrate were mixed and then ground in a 50 mL agate ball mill jar for 20 min. The ratio of onyx balls to the material mixture was 4:1, and the ball mill was operated at 500 revolutions per minute in air. The powder obtained after ball milling was then transferred to a 30 mL crucible and heated to 250 °C under air conditions at a rate of 2.5 °C/min. The temperature was maintained at 250 °C for two hours, and then the material was allowed to cool naturally to room temperature. The calcined catalyst was thoroughly ground, then sequentially washed with deionized water and absolute ethanol via centrifugation at 8000 rpm (repeated 3–5 times) to remove residual impurities. After centrifugation, the catalysts were dried in an oven at 40 °C and stored in airtight containers. The dried catalysts were labeled CCFx (where x indicates the amount of ferric chloride hexahydrate used prior to ball milling: x = 0.1, 0.2, 0.3, 0.4, 0.5). For comparison, the CC reference sample was prepared using the same procedure without adding FeCl3·6H2O. Specifically, 1.0 g of cellulose powder was ball-milled at 500 rpm for 20 min with a ball-to-material mass ratio of 4:1. The obtained powder was then calcined in air at 250 °C for 2 h with a heating rate of 2.5 °C/min. After natural cooling, the sample was washed sequentially with deionized water and absolute ethanol by centrifugation at 8000 rpm (repeated 3–5 times), dried at 40 °C, and designated as CC.
3.3. Characterization and Analyses
Scanning electron microscopy (SEM, Zeiss Sigma 300,Carl Zeiss Microscopy GmbH, Jena, Germany) was used to observe the microscopic morphology of the materials, while transmission electron microscopy (TEM, Talos F200X, FEI Company, Hillsboro, OR, USA) was employed to examine their lattice structure and analyze their particle size. The functional groups and chemical bonds in the prepared materials were analyzed using Fourier-transform infrared spectroscopy (FT-IR, INVENIO-R, Bruker Optics GmbH & Co. KG, Ettlingen, Germany). Chemical bonding was further investigated by X-ray photoelectron spectroscopy (XPS, AXIS Ultra DLD, Kratos Analytical Ltd., Manchester, UK), with comparative analyses performed before and after the use of the materials. The crystal structure of the materials was characterized by X-ray diffraction (XRD, D8, Bruker AXS GmbH, Karlsruhe, Germany). The specific surface area and pore structure were evaluated through nitrogen adsorption–desorption experiments. In addition, the active species of the catalysts were examined using an electron paramagnetic resonance spectrometer (EPR).
3.4. Experimental Procedures and Analysis Methods
In this experiment, phenol was used as the target pollutant, and the entire experiment was conducted in a 100 mL beaker. Initially, the mixture was stirred in the dark for 30 min to reach adsorption equilibrium. After reaching adsorption equilibrium in the dark, hydrogen peroxide was added to initiate the photo-Fenton reaction under visible-light irradiation. A 300 W xenon lamp (PLS-SXE300D, Beijing China Education Au-light Co., Ltd., Beijing, China, operating current: 15 A) equipped with a 420 nm cutoff filter was employed as the light source, providing irradiation at wavelengths above 420 nm. The distance between the xenon lamp and the reactor was maintained at 12 cm throughout the experiments. The reaction temperature was maintained at 30 °C, with a constant stirring speed of 400 rpm. At regular intervals under light conditions, 1 mL of the sample was taken, mixed with 1 mL of methanol, filtered through a membrane, and then analyzed using liquid chromatography (LC-16, Shimadzu Corporation, Kyoto, Japan). The mobile phase consisted of a 1:1 mixture of ultrapure water and methanol, with a flow rate of 0.7 mL/min. The column temperature was maintained at 40 °C, the injection volume was 20 μL, and the detection wavelength was set to 271 nm. FFA probe experiments were also analyzed using liquid chromatography. However, for the FFA analysis, the mobile phase flow rate was increased to 1 mL/min, and the detection wavelength was set to 219 nm. A heated magnetic stirrer (MSH-R-03P, Hangzhou Qitai Technology Co., Ltd., Hangzhou, China) was used to maintain the reaction temperature at 30 °C, with a constant stirring speed of 400 rpm throughout the experiments. The degradation intermediates were analyzed using a high-performance liquid chromatography–mass spectrometry (HPLC-MS) system (Agilent 1290/6460, Agilent Technologies, Santa Clara, CA, USA) equipped with a Kromasil C18 column (250 × 4.6 mm, 5 μm). The injection volume was 10 μL. The mobile phase consisted of solvent A (water containing 0.1% formic acid) and solvent B (acetonitrile), with a flow rate of 0.2 mL/min. The column temperature was maintained at 30 °C. Mass spectra were acquired over an m/z range of 50–300. The capillary voltage was set to 3.0 kV. The source temperature was maintained at 100 °C, and the gas flow rate was 150.0 L/h.
The concentration of hydrogen peroxide was determined using potassium titanium oxalate. A 4 mL sample of the reaction filtrate was mixed with 0.5 mL of 0.05 mol/L potassium titanium oxalate and 0.5 mL of 3 mol/L sulfuric acid. After color development for 8 min, the absorbance was measured at 420 nm using a UV-Vis spectrophotometer (Shanghai Instrument Co., Ltd., UV2365, Shanghai, China). The concentration of hydrogen peroxide was then calculated from the standard curve.
4. Conclusions
In this paper, a novel cellulose-based microcrystalline–amorphous composite catalyst was developed, and its degradation performance for pollutants in water was investigated in the photo-Fenton reaction. First, the novel microcrystalline–amorphous catalyst CCF 0.3 was prepared by adjusting the ratio of cellulose to ferric chloride hexahydrate, followed by ball milling and low-temperature calcination. Characterization analysis of CCF 0.3 revealed that the catalyst predominantly exhibited a rod-like morphology, with numerous spherical nanostructures distributed across its surface, which significantly enhanced the catalyst’s specific surface area. Additionally, CCF 0.3 exhibited both microcrystalline and amorphous structures, with distinct grain boundaries between the two phases. This unique structure contributes to its enhanced photo-Fenton activity. Using phenol as the target pollutant, the photo-Fenton activity of CCF 0.3 was investigated under various conditions. The five-cycle experiments, iron leaching measurements, filtrate control tests, catalyst recovery assessments, and XPS analyses demonstrated that CCF 0.3 not only exhibited high photocatalytic activity but also showed excellent stability. In real water matrices, CCF 0.3 exhibited reduced phenol degradation efficiency, achieving approximately 71% removal in tap water but only 13% in river water after 300 min. These results suggest that the water matrix’s effects significantly influence its catalytic performance, and further optimization is required to enhance its applicability in complex aquatic environments. The excellent photo-Fenton performance of CCF 0.3 can be attributed to the Fe2+/Fe3+ redox cycle, the special microcrystalline–amorphous structure, and the presence of grain boundaries, which enhance the rate of electron transfer and ·OH generation under light conditions, leading to faster phenol degradation. Furthermore, the main active species involved in phenol degradation were identified, and a possible reaction mechanism was proposed. Finally, this study proposes that this novel microcrystalline–amorphous catalyst offers an efficient material for the photo-Fenton reaction. It provides new ideas and solutions for the development of water treatment technologies and pollutant removal.
Supplementary Materials
The following supporting information can be downloaded at: https://www.mdpi.com/article/10.3390/molecules31224120/s1, Figure S1: SEM of CC, CCF0.2, CCF0.4 at different magnifications; Figure S2: Digital photographs of CC, CCF 0.2, CCF 0.3, CCF 0.4; Figure S3: Degradation of phenol by CCF0.3/H2O2 system; Figure S4: Degradation of phenol by CCF 0.3/H2O2/Light+ CO32− system; Figure S5: Degradation of phenol in different water bodies by CCF 0.3/H2O2/Light system; Figure S6: Effect of different quenchers on the phenol degradation; Figure S7: Effect of CCF0.3 on phenol degradation; Figure S8: FFA probe experiment; Figure S9: Effect of initial pH on phenol degradation; Figure S10: Fe leaching and catalyst reusability: (a) dissolved Fe during reaction; (b) phenol degradation by leached Fe; (c) dissolved Fe over five cycles; (d) catalyst recovery over five cycles; Figure S11: HPLC−MS spectra of phenol-related species: (a) m/z 93.0; (b) 89.0; (c) 107.1; (d) 109.0; Figure S12: HPLC−MS spectra of proposed intermediates: (a) m/z 115.1; (b) 124.9; (c) 141.0; (d) 139.1; Table S1: Parameters of Ba River water; Table S2: Surface elemental composition of CCF 0.3 determined by XPS; Table S3: Tentative identification of phenol degradation intermediates by HPLC–MS.
Author Contributions
H.L.: Data curation, formal analysis, and writing—original draft. X.H.: Conceptualization, writing—review and editing, and funding acquisition. Z.L.: Formal analysis, investigation, and methodology. C.L.: Software and methodology; H.D.: Software and validation. All authors have read and agreed to the published version of the manuscript.
Funding
This work was financially supported by the National Natural Science Foundation of China (No. 22376132).
Institutional Review Board Statement
Not applicable.
Informed Consent Statement
Not applicable.
Data Availability Statement
Data will be made available on request.
Acknowledgments
This manuscript is contributed to the Special Issue in honor of Wanhong Ma, who offered me valuable academic guidance when I was a student in the same research group at the Institute of Chemistry, Chinese Academy of Sciences (ICCAS).
Conflicts of Interest
The authors declare no conflicts of interest.
References
- Ahmaruzzaman, M.; Mishra, S.R.; Gadore, V.; Yadav, G.; Roy, S.; Bhattacharjee, B.; Bhuyan, A.; Hazarika, B.; Darabdhara, J.; Kumari, K. Phenolic Compounds in Water: From Toxicity and Source to Sustainable Solutions—an Integrated Review of Removal Methods, Advanced Technologies, Cost Analysis, and Future Prospects. J. Environ. Chem. Eng. 2024, 12, 112964. [Google Scholar] [CrossRef] [Scilit]
- Zhu, Y.; Chen, X.Y.; Li, T. Current Application of TiO2 Nanomaterials in Wastewater Degradation. J. Liaocheng Univ. (Nat. Sci. Ed.) 2025, 38, 756–763. [Google Scholar] [CrossRef]
- Mumtaz, F.; Li, B.; Al Shehhi, M.R.; Feng, X.; Wang, K. Treatment of Phenolic-Wastewater by Hybrid Technologies: A Review. J. Water Process Eng. 2024, 57, 104695. [Google Scholar] [CrossRef] [Scilit]
- Boualam, O.; Benjelloun, M.; Miyah, Y.; El Khalfaouy, R.; Addaou, A.; Laajeb, A. Efficient Visible-Light-Driven Photo-Fenton Degradation of Phenol Using Fe2O3@Illite Catalyst: Process Optimization, Application to Olive Mill Wastewater, and Environmental Assessment. J. Indian Chem. Soc. 2026, 103, 102339. [Google Scholar] [CrossRef] [Scilit]
- Kabir, S.M.F.; Sikdar, P.P.; Haque, B.; Bhuiyan, M.A.R.; Ali, A.; Islam, M.N. Cellulose-Based Hydrogel Materials: Chemistry, Properties and Their Prospective Applications. Prog. Biomater. 2018, 7, 153–174. [Google Scholar] [CrossRef] [Scilit] [PubMed]
- Tavakoli Moghadam, M.; Qaderi, F. Modeling of Petroleum Wastewater Treatment by Fe/Zn Nanoparticles Using the Response Surface Methodology and Enhancing the Efficiency by Scavenger. Results Phys. 2019, 15, 102566. [Google Scholar] [CrossRef] [Scilit]
- Li, J.F.; Shi, Y.X.; Wei, L.S.; Sang, S.; Xia, X.X.; Li, S.Y.; Liu, Y.Z.; Zhao, K.Y.; Zan, G.T. Emerging Fe-Based Catalysts for Heterogeneous Fenton-Like Reactions: From Nanoparticles to Clusters and Single-Atom Catalysts. Rare Met. 2025, 44, 9588–9636. [Google Scholar] [CrossRef] [Scilit]
- Chen, S.; Zhao, Y.; Gao, G.; Dong, H.; Yuan, F.; Lin, D.; Guan, J.; Nesic, A.; Xu, J.; Belver, C.; et al. Zero-Valent Iron on Graphite-Cellulose Biochar Catalysts for the Fenton Degradation of Tetracycline From Water. Process Saf. Environ. Prot. 2024, 191, 2104–2112. [Google Scholar] [CrossRef] [Scilit]
- Vaigankar, C.; Agadyekar, V.G.; Kakodkar, E.; Kunkalekar, R.; Joshi, N. Comparative Evaluation of Plasma-Assisted and Photochemical Advanced Oxidation Processes for P-Nitrophenol Degradation in Water. J. Photochem. Photobiol. A Chem. 2026, 478, 117237. [Google Scholar] [CrossRef] [Scilit]
- Magdy, M.; Gar Alalm, M.; El-Etriby, H.K. Comparative Life Cycle Assessment of Five Chemical Methods for Removal of Phenol and Its Transformation Products. J. Clean. Prod. 2021, 291, 125923. [Google Scholar] [CrossRef] [Scilit]
- Wu, Y.; Wang, C.; Wang, L.; Hou, C. Recent Advances in Iron Oxide-Based Heterojunction Photo-Fenton Catalysts for the Elimination of Organic Pollutants. Catalysts 2025, 15, 391. [Google Scholar] [CrossRef] [Scilit]
- Wang, X.; Zhang, D.; Cheng, Y.; Wu, B.; Sun, L. Progress in the Application of Iron-Based Plant Derived Biochar Catalyst for Fenton-Like Remediation of Organic Wastewater: A Review. Molecules 2025, 30, 4549. [Google Scholar] [CrossRef] [Scilit] [PubMed]
- Tomić, J.; Malinović, N. Titanium Dioxide Photocatalyst: Present Situation and Future Approaches. AIDASCO Rev. 2023, 1, 26–30. [Google Scholar] [CrossRef] [Scilit]
- Ong, C.B.; Ng, L.Y.; Mohammad, A.W. A Review of ZnO Nanoparticles as Solar Photocatalysts: Synthesis, Mechanisms and Applications. Renew. Sustain. Energy Rev. 2018, 81, 536–551. [Google Scholar] [CrossRef] [Scilit]
- Wu, C.; Li, J.; Zhang, Y.; Li, X.; Wang, S.; Li, D. Cellulose Dissolution, Modification, and the Derived Hydrogel: A Review. ChemSusChem 2023, 16. [Google Scholar] [CrossRef] [Scilit] [PubMed]
- Qin, Q.; Zeng, S.; Duan, G.; Liu, Y.; Han, X.; Yu, R.; Huang, Y.; Zhang, C.; Han, J.; Jiang, S. “Bottom-Up” and “Top-Down” Strategies Toward Strong Cellulose-Based Materials. Chem. Soc. Rev. 2024, 53, 9306–9343. [Google Scholar] [CrossRef] [Scilit] [PubMed]
- Xu, H.; Zhang, Y.; Wang, Y.; Zhang, L.; Zhang, Z.; Zhong, L.; He, Z.; Zheng, Y.; Shen, Y. Heterojunction Material BiYO3/G-C3N4 Modified With Cellulose Nanofibers for Photocatalytic Degradation of Tetracycline. Carbohydr. Polym. 2023, 312, 120829. [Google Scholar] [CrossRef] [Scilit] [PubMed]
- Pedrosa, M.F.F. An Overview of Bio-Cellulose Derived Materials for Catalytic Water Treatment. Int. J. Biol. Macromol. 2024, 258, 128789. [Google Scholar] [CrossRef] [Scilit] [PubMed]
- Pan, S.; Yuan, D.; Li, J.; Wang, Z.; Zhang, Q.; Tang, S. Electron Shuttle of Carboxyl Boosted Fe(III)-Anchored Carboxylated Cellulose Activating Sodium Perborate for Organic Pollutant Abatement. Appl. Catal. B Environ. Energy 2024, 356, 124225. [Google Scholar] [CrossRef] [Scilit]
- Abdelhamid, H.N. Nanocellulose-Based Materials for Water Pollutant Removal: A Review. Int. J. Mol. Sci. 2024, 25, 8529. [Google Scholar] [CrossRef] [Scilit] [PubMed]
- Mbisana, M.; Keroletswe, N.; Nareetsile, F.; Mogopodi, D.; Chibua, I. Nanocellulose Composites: Synthesis, Properties, and Applications to Wastewater Treatment. Cellulose 2024, 31, 10651–10678. [Google Scholar] [CrossRef] [Scilit]
- Zhang, M.; Chong, Y.; Khan, A.; Li, W.; Xu, A.; Wei, H.; Liu, X.; Zhao, S.; Li, X. Synthesis of Amorphous-Crystalline Transition Metal Oxides via an Al2O3-Assisted Amorphization Strategy to Promote Fenton-Like Catalytic Activity. Fuel 2026, 405, 136662. [Google Scholar] [CrossRef] [Scilit]
- Wu, G.; Bian, S.; Wang, J.; Wu, F.; Sun, W.; Pan, Y.; Zhao, C.; Xing, W.; Huang, Y. Construction of Biochar Modified Multi-Morphologies Fe2O3 for Efficient Boosting Photo-Fenton Organic Antibiotic Pollutants Degradation: Mechanism and Toxicity Evaluation in Degradation Pathways. Ind. Crops Prod. 2024, 222, 119726. [Google Scholar] [CrossRef] [Scilit]
- Huo, S.; Zhao, Q.; Wang, Y.; Su, R.; Gao, M. Amorphous/Crystalline Mn-Fe Spinel-Modified Floatable Biochar Cathode for Energy-Efficient Photo-Electro-Fenton Degradation of Antibiotic: Self-Sustained Aeration and Fast Photocarriers Separation. Appl. Surf. Sci. 2025, 712, 164183. [Google Scholar] [CrossRef] [Scilit]
- Liu, X.; Wang, W.; Lin, H.; Shen, Y.; Fang, Q.; Liu, F. Construction of Hierarchical Prussian Blue Microcrystal With High Sunlight Absorption for Efficient Photo-Thermal Degradation of Organic Pollutants. Sep. Purif. Technol. 2021, 269, 118724. [Google Scholar] [CrossRef] [Scilit]
- Patial, S.; Sonu; Thakur, S.; Van Le, Q.; Ahamad, T.; Singh, P.; Nguyen, V.H.; Khan, A.A.P.; Hussain, C.M.; Raizada, P. Facile Synthesis of Co, Fe-Bimetallic MIL-88A/Microcrystalline Cellulose Composites for Efficient Adsorptive and Photo-Fenton Degradation of RhB Dye. J. Taiwan Inst. Chem. Eng. 2023, 153, 105189. [Google Scholar] [CrossRef] [Scilit]
- Wang, Y.; Wang, S.; Fu, Y.; Sang, J.; Wei, P.; Li, R.; Gao, D.; Wang, G.; Bao, X. Ammonia Electrosynthesis from Nitrate Using a Stable Amorphous/Crystalline Dual-Phase Cu Catalyst. Nat. Commun. 2025, 16, 897. [Google Scholar] [CrossRef] [Scilit] [PubMed]
- Hong, J.; Yang, F.; Sun, Z. Hexagonal Bi-Pyramid α-Fe2O3 Microcrystals: Unusual Formation, Characterization and Application for Gas Sensing. J. Alloys Compd. 2021, 889, 161515. [Google Scholar] [CrossRef] [Scilit]
- Zhu, K.N.; Qin, H.Y.; Liu, B.H.; Li, Z.P. Carbon Nanotubes Supported Fe-Based Compounds as the Electrode Catalyst for Oxygen Reduction Reaction. J. Power Sources 2011, 196, 182–185. [Google Scholar] [CrossRef] [Scilit]
- Huang, W.; Bai, R.; Chen, L.; Wang, X.; Li, Z.; Tian, Y. Iron-Based Lignocellulosic Biochar for Fenton-Like Treatment of Organic Wastewater: A Review on Progress and Prospects. Environ. Res. 2026, 290, 123488. [Google Scholar] [CrossRef] [Scilit] [PubMed]
- Wang, Z.; Meng, S.; Li, J.; Guo, D.; Fu, S.; Zhang, D.; Yang, X.; Sui, G. Oxygen Vacancy Engineering and Constructing Built-in Electric Field in Fe-G-C3N4/Bi2MoO6 Z-Scheme Heterojunction for Boosting Photo-Fenton Catalytic Degradation Performance of Tetracycline. Small 2024, 20, e2406125. [Google Scholar] [CrossRef] [Scilit] [PubMed]
- Morris, R.E.; Wheatley, P.S. Gas Storage in Nanoporous Materials. Angew. Chem. Int. Ed. 2008, 47, 4966–4981. [Google Scholar] [CrossRef] [Scilit] [PubMed]
- Sun, K.; Guo, T.; Li, Y.; Wang, W.; Li, Z.; Geng, P.; Fu, P. Rapid Pyrolysis of Cellulose: Revealing the Role of Volatile Matter and Char Structure Evolution. J. Anal. Appl. Pyrolysis 2024, 182, 106704. [Google Scholar] [CrossRef] [Scilit]
- Liu, X.; Xu, H.; Fu, X.; Chen, J. Steam-Assisted Synthesis of Hectorite Loaded With Fe2O3 and Its Catalytic Fenton Degradation of Phenol. Catalysts 2024, 14, 521. [Google Scholar] [CrossRef] [Scilit]
- Etale, A.; Onyianta, A.J.; Turner, S.R.; Eichhorn, S.J. Cellulose: A Review of Water Interactions, Applications in Composites, and Water Treatment. Chem. Rev. 2023, 123, 2016–2048. [Google Scholar] [CrossRef] [Scilit] [PubMed]
- Sun, R.; Li, C.; Kong, L.; Zhang, L.; Zhang, S.; Cui, Z.; Wang, D.; Leng, C.; Hu, X. Torrefaction and Hydrothermal Carbonization of Cellulose Make Marked Difference in Subsequent Pyrolysis. J. Energy Inst. 2025, 119, 101978. [Google Scholar] [CrossRef] [Scilit]
- Cheng, Z.; Ma, Z.; Wu, Y.; Yang, T.; Cui, J.; Wu, D.; Li, J. Tangyuan-Like Structure N-Doped C Shell Fe0 as an Efficient Catalyst for Organic Degradation in Groundwater: N–Fe Synergistic Strengthening Effect, and Activation Mechanism. Appl. Surf. Sci. 2023, 631, 157552. [Google Scholar] [CrossRef] [Scilit]
- Zhang, Y.; Zhang, H.; Yao, J.; Song, Y.; Li, W.; Xuan, X. Coordination Tuning of Fe2+ Ions Concentration in Fe-Doped Black Phosphorus-Carbonized Cotton Fiber (Fe-BP-CCF) Composites to Regulate Photocatalysis and Peroxymonosulfate (PMS) Activation Towards Highly Efficient Degradation of Organic Pollutants. Chem. Eng. J. 2024, 483, 149326. [Google Scholar] [CrossRef] [Scilit]
- Fan, X.; Cao, Q.; Meng, F.; Song, B.; Bai, Z.; Zhao, Y.; Chen, D.; Zhou, Y.; Song, M. A Fenton-Like System of Biochar Loading Fe–Al Layered Double Hydroxides (FeAl-LDH@BC)/H2O2 for Phenol Removal. Chemosphere 2021, 266, 128992. [Google Scholar] [CrossRef] [Scilit] [PubMed]
- More, S.; Raut, S.; Premkumar, S.; Bhopale, S.; Bhoraskar, S.; More, M.; Mathe, V. Structural and Morphological Tuning of Iron Oxide Polymorphs by ECR Plasma-Assisted Thermal Oxidation. RSC Adv. 2020, 10, 32088–32101. [Google Scholar] [CrossRef] [Scilit] [PubMed]
- Pi, Z.; Li, X.; Wang, D.; Xu, Q.; Tao, Z.; Huang, X.; Yao, F.; Wu, Y.; He, L.; Yang, Q. Persulfate Activation by Oxidation Biochar Supported Magnetite Particles for Tetracycline Removal: Performance and Degradation Pathway. J. Clean. Prod. 2019, 235, 1103–1115. [Google Scholar] [CrossRef] [Scilit]
- Boualam, O.; Mardi, L.; El Alami, S.; Ibaghline, H.; Tanji, K.; El Gaidoumi, A.; Belaabed, R.; El Knidri, H.; Addaou, A.; Laajeb, A. Innovative Use of Iron-Impregnated Natural Illite as a Catalyst for Phenol Purification Through Fenton, Sono-Fenton, Photo-Fenton, and Sono-Photo-Fenton Technologies. J. Environ. Chem. Eng. 2025, 13, 117333. [Google Scholar] [CrossRef] [Scilit]
- Shoeman, R.L.; Hartmann, E.; Schlichting, I. Growing and Making Nano- and Microcrystals. Nat. Protoc. 2023, 18, 854–882. [Google Scholar] [CrossRef] [Scilit] [PubMed]
- Ren, X.; Ding, S.; Chen, R.; Yang, Z.; Tian, M.; Fu, N. Preparation of a Novel Ag/CFOOVs Composite Catalyst and Efficient Degradation of Phenol in a H2O2-Based Fenton-Like System. J. Alloys Compd. 2024, 973, 172853. [Google Scholar] [CrossRef] [Scilit]
- Xue, Q.; Song, B.; Feng, Q.; Yu, Z.; Hu, K.; Yang, Y.; Shen, X. Efficiently Removal of Tetracycline via Synergistic Photocatalysis With Fenton Reaction With Biochar/FeOOH. Appl. Surf. Sci. 2024, 645, 158869. [Google Scholar] [CrossRef] [Scilit]
- Garcia-Segura, S.; Brillas, E. Redesigning Electrochemical-Based Fenton Processes: An Updated Review Exploring Advances and Innovative Strategies Using Phenol Degradation as Key Performance Indicator. Appl. Catal. O Open 2024, 194, 206980. [Google Scholar] [CrossRef] [Scilit]
- Kavian, N.; Asadollahfardi, G.; Hasanbeigi, A.; Delnavaz, M.; Samadi, A. Degradation of Phenol in Wastewater Through an Integrated Dielectric Barrier Discharge and Fenton/Photo-Fenton Process. Ecotoxicol. Environ. Saf. 2024, 271, 115937. [Google Scholar] [CrossRef] [Scilit] [PubMed]
- Xu, K.; Lin, Q.; Fan, X.; Zheng, J.; Liu, Y.; Ma, Y.; He, J. Enhanced Degradation of Sulfamethoxazole by Activation of Peroxodisulfate With Red Mud Modified Biochar: Synergistic Effect Between Adsorption and Nonradical Activation. Chem. Eng. J. 2023, 460, 141578. [Google Scholar] [CrossRef] [Scilit]
- Vinayagam, R.; Murugesan, G.; Sudarsan, S.; Varadavenkatesan, T.; Selvaraj, R. Synthesis of Magnetic Biochar Using Bauhinia Variegata Leaves Through One-Pot Hydrothermal Process to Degrade Malachite Green Dye by Fenton-Like Catalysis. PLoS ONE 2026, 21, e0344933. [Google Scholar] [CrossRef] [Scilit] [PubMed]
- Li, J.; Yang, J.; Wang, P.; Cong, Z.; Shi, F.; Wei, L.; Wang, K.; Tong, Y. NiCo2S4 Combined 3D Hierarchical Porous Carbon Derived From Lignin for High-Performance Supercapacitors. Int. J. Biol. Macromol. 2023, 232, 123344. [Google Scholar] [CrossRef] [Scilit] [PubMed]
- Lima, K.V.L.; Nogueira, R.F.P.; Sousa, É.M.L.; Simões, M.M.Q.; Lima, D.L.D.; Calisto, V. Magnetic Activated Carbon for Improving the Removal of Antibiotics by Heterogeneous Solar Photo-Fenton at Circumneutral pH. Water Res. 2025, 281, 123679. [Google Scholar] [CrossRef] [Scilit] [PubMed]
- Jiang, Y.; Chen, X.; Yan, S.; Ou, Y.; Zhou, T. Mechanochemistry-Induced Recycling of Spent Lithium-Ion Batteries for Synergistic Treatment of Mixed Cathode Powders. Green Chem. 2022, 24, 5987–5997. [Google Scholar] [CrossRef] [Scilit]
- Wu, P.-Y.; Hsu, J.-C.; Lin, T.-Y.; Zhu, Y.-L.; Chang, Y.-R.; Keng, P.Y. Synergistic Properties of Single-Component Hexagonal Iron Borate for Superior and Sustainable Photo-Fenton Catalysis. J. Environ. Chem. Eng. 2025, 13, 115558. [Google Scholar] [CrossRef] [Scilit]
- Appiani, E.; Ossola, R.; Latch, D.E.; Erickson, P.R.; McNeill, K. Aqueous Singlet Oxygen Reaction Kinetics of Furfuryl Alcohol: Effect of Temperature, pH, and Salt Content. Environ. Sci. Process. Impacts 2017, 19, 507–516. [Google Scholar] [CrossRef] [Scilit] [PubMed]
- Hu, X.; Zhu, M. Were Persulfate-Based Advanced Oxidation Processes Really Understood? Basic Concepts, Cognitive Biases, and Experimental Details. Environ. Sci. Technol. 2024, 58, 10415–10444. [Google Scholar] [CrossRef] [Scilit] [PubMed]

Disclaimer/Publisher’s Note: The statements, opinions and data contained in all publications are solely those of the individual author(s) and contributor(s) and not of MDPI and/or the editor(s). MDPI and/or the editor(s) disclaim responsibility for any injury to people or property resulting from any ideas, methods, instructions or products referred to in the content. |
© 2026 by the authors. Licensee MDPI, Basel, Switzerland. This article is an open access article distributed under the terms and conditions of the Creative Commons Attribution (CC BY) license.