


Abstract
Wine adulteration with inexpensive fruit juices remains a significant authenticity issue. Apple juice, due to its neutral sensory properties, can be added to white wines without visual detection. While elemental analysis is widely applied in wine authentication, its suitability for detecting adulteration with low-mineral juices has not been systematically evaluated. In this study, 60 commercial white wines representing seven grape varieties and 45 Riesling samples intentionally adulterated with 5%, 10%, and 20% (v/v) apple juice were analyzed for 24 elements using ICP–OES. The data were evaluated using nonparametric statistical tests, including Mann–Whitney U, Wilcoxon signed-rank, and Friedman tests, with Holm correction for multiple comparisons, as well as Pearson correlation analysis and principal component analysis. Apple juice addition caused a decrease in most evaluated elements, especially Ca, Mg, Mn, P, S, and Sr, reflecting dilution of the wine matrix, whereas Na showed an opposite trend, particularly at the highest adulteration level. The reduced PCA model based on selected diagnostic variables provided clearer visualization of the adulteration-related pattern than the model based on all variables and highlighted the separation of samples adulterated at 20% (v/v). Apple juice addition also increased wine pH. The results demonstrate that ICP–OES data combined with statistical and chemometric analysis can reveal compositional changes associated with apple juice adulteration in a Riesling wine model.
1. Introduction
Wine is one of the most popular alcoholic beverages worldwide, and its significance on the Polish market has been steadily increasing. According to data published by Polish. Wine, the average annual consumption of wine and mead in Poland reached 6.8 L per person in 2023, confirming a continuous upward trend compared with previous years [1]. Between 2018 and 2022, the total value of wine sales in Poland increased by approximately 28% [2]. Wine is also becoming more common in on-premise consumption, with around 42% of Polish consumers choosing it when drinking outside their homes [3]. Although the Polish wine market remains dominated by red wines, there is a clear and growing interest in white wines, which are gradually gaining a larger share of sales. Consumer preferences are shifting toward dry styles and well-known international grape varieties such as Chardonnay and Sauvignon Blanc are among the most frequently chosen [4]. Riesling, which is gaining in popularity, is a variety traditionally cultivated in cooler regions of Europe, including Poland. Wines produced from Riesling are characterized by their high acidity, fresh aroma, and considerable aging potential, making them an increasingly appreciated choice among both producers and consumers [5].
Wine is a chemically complex beverage composed of water, ethanol, and residual sugars, as well as a broad range of organic and inorganic constituents, including amino acids, organic acids, polyphenolic compounds, vitamins, and mineral elements [6,7]. It cannot be overlooked that wine consumption has been associated with certain health benefits, partly due to the presence of bioactive compounds and essential trace elements that may contribute to the human dietary intake [6,8]. However, wine may also contain undesirable concentrations of toxic metals and metalloids such as arsenic (As), cadmium (Cd), and lead (Pb), which can pose potential health risks [6]. Moreover, the mineral composition of wine can significantly affect its sensory characteristics—aroma, color, and mouthfeel—as well as important physicochemical parameters such as alcohol content and total acidity.
The elemental profile of each wine is influenced by a wide variety of factors. These are associated with every stage of the winemaking process—from grape cultivation, through production and maturation, to transportation and storage. They include the grape variety, soil type, and climatic conditions characteristic of the cultivation region, the use of plant protection agents, as well as technological aspects of vinification such as applied techniques and processing conditions. Additional factors include the use of fining agents and the conditions under which the final product is stored [9,10,11,12,13]. The main sources of individual elements in wines are summarized in Table 1.
Table 1.
Sources of selected elements in wine [14,15,16,17,18,19].
Different elements can influence wine characteristics, including aroma, color, and mouthfeel. Some metals are essential for yeast metabolism, whereas others can cause haze, browning, or instability. Table 2 summarizes the effects of selected elements on wine quality.
Table 2.
Examples of elements present in wines and their impact on this product [14,17,19].
Numerous studies have applied multi-elemental analysis combined with chemometric tools to investigate geographical origin, varietal differentiation, and technological influences in wines. Selected representative studies are summarized in Table 3.
Wine adulteration is a growing concern in the global food market, as it can affect not only the authenticity and economic value of the product but also consumer safety. The most common types of wine adulteration include water dilution [20], the addition of sugars or other sweetening agents [21,22], the use of exogenous organic acids, alcohols, preservatives, or artificial flavor compounds [23,24], as well as blending with cheaper wines or fruit juices [25,26] and mislabeling related to grape variety or geographical origin [26,27,28]. In the case of white wines, one of the potential adulterants is apple juice, which can alter the chemical composition, color, and acidity of the beverage while remaining difficult to detect visually. Although the elemental composition of both red and white wines has been extensively investigated, only limited studies have focused on the adulteration of white wines with apple juice. Previous research mainly addressed this issue by determining chlorogenic acid content [29] or using electrochemical measurements [30]. In comparison with approaches based on a single chemical marker, multi-element ICP–OES analysis provides simultaneous information on a broad set of inorganic constituents and enables evaluation of coordinated compositional changes in the wine matrix. When combined with statistical and chemometric tools, multi-element ICP–OES data may provide complementary information on adulteration-related compositional changes and support the screening-oriented assessment of wine authenticity. Against this background, the present study combined multi-element ICP–OES analysis with statistical and chemometric methods to examine the response of Riesling wines to controlled apple juice addition. The aim was to characterize changes in their elemental composition and pH at three addition levels (5%, 10%, and 20% v/v) and to explore the resulting patterns within this model system.
Table 3.
Overview of selected studies employing ICP-based techniques for wine analysis.
2. Result and Discussion
2.1. Elemental Profile of Authentic White Wines
To evaluate whether the Riesling wines selected for the adulteration experiment differed from the broader background of authentic white wines, their elemental profile was compared with that of the remaining white wine samples using the Mann–Whitney U test. After Holm correction for multiple comparisons, significant differences were observed for Ca, Cu, K, Ni, and Zn (Table 4). These elements were generally higher in Riesling wines than in the remaining white wines, indicating that the Riesling samples exhibited some variety-related elemental characteristics. Therefore, the subsequent adulteration experiment should be interpreted as a controlled Riesling-based model, while the remaining white wines provide a reference background for the natural elemental variability of authentic white wines.
The higher concentrations of Ca, Cu, K, Ni, and Zn observed in Riesling wines should not be interpreted solely as a varietal effect, because the Riesling group consisted of wines from Germany, whereas the remaining white wines represented different grape varieties and countries of origin. Previous studies have shown that the elemental profile of wine is influenced by multiple overlapping factors, including wine type, geographical origin, grape variety, vineyard soil, local environmental conditions, and winemaking practices [13,14,15,16,17]. In particular, Ca and K may reflect differences related to grape mineral composition, soil properties, climatic conditions, and technological factors [15,16,17]. Higher Cu and Zn levels may reflect both vineyard-related and technological sources, including soil composition, agrochemical inputs, and winemaking or storage conditions [13,14,17,37]. Therefore, the differences observed between Riesling and the remaining white wines most likely reflect the combined influence of varietal, geographical, soil-related, and technological factors rather than a purely varietal effect.
2.2. Effect of Apple Juice Addition on Riesling Wines
In the ICP–OES analysis, 60 white wine samples and 45 Riesling wine samples intentionally adulterated with apple juice, as well as the apple juice used for adulteration, were analyzed for the content of 24 elements: silver (Ag), aluminum (Al), barium (Ba), beryllium (Be), calcium (Ca), cadmium (Cd), cobalt (Co), chromium (Cr), copper (Cu), iron (Fe), potassium (K), magnesium (Mg), manganese (Mn), sodium (Na), nickel (Ni), phosphorus (P), lead (Pb), sulfur (S), antimony (Sb), tin (Sn), strontium (Sr), titanium (Ti), vanadium (V), and zinc (Zn). In all analyzed samples, the concentrations of Ag, Be, Co, Cd, and Sb were below the limit of quantification (LOQ; see Section 3.2.1) and therefore were excluded from further statistical evaluation.
To provide an overview of the effect of apple juice addition on the elemental composition of Riesling wines, the changes in elemental concentrations between unadulterated and adulterated samples are summarized in Table 5. The table presents the direction of changes observed after apple juice addition, together with the corresponding statistical significance. This approach allows a clear identification of elements whose concentrations decreased or increased in response to adulteration.
Table 4.
Comparison of elemental concentrations between unadulterated Riesling wines and other authentic white wines.
Table 5.
Basic statistics of elemental concentrations determined by ICP–OES in Riesling wine samples (n = 15), Riesling wine samples adulterated with apple juice (n = 45; 5%, 10%, and 20% v/v), and apple juice used for adulteration (n = 3). Values are expressed in mg/L.
The generally lower concentrations of most elements in apple juice compared to white wine samples can be attributed to differences in the raw material, production technology, and absence of fermentation processes, which in wines contribute to the enrichment of the matrix with microelements originating from yeast activity, fermentation lees, and contact with winemaking equipment [38]. The higher sodium (Na) content observed in the analyzed apple juice can be explained by both natural and technological factors. Apples are often cultivated in soils with increased salinity [39]. Moreover, apple juices are frequently produced by reconstituting concentrated juice with process water, which is sometimes softened using sodium chloride (NaCl), thereby increasing the final sodium concentration in the product. In addition, the juice industry commonly employs preservative or antioxidant additives in the form of sodium salts, such as sodium benzoate (E211) and sodium ascorbate (E301), which also contribute to the overall Na+ content [40]. Consequently, although the total elemental content in apple juices is generally lower than in white wines, the sodium concentration may be relatively higher due to the influence of the raw material, process water, and technological additives. It should be noted that the elemental composition of apple juice may vary depending on apple cultivar, geographical origin, growing conditions, and processing technology, as previously observed for apple-based beverages [41]. Therefore, the findings of the present study should be interpreted in relation to the specific commercial clarified apple juice used in this model experiment.
To provide a general comparison between unadulterated wine samples and wine samples adulterated with apple juice, the Wilcoxon signed-rank test for paired samples was applied (Table 6). The choice of this test was based on the experimental design, as the compared samples did not represent independent groups. Each Riesling sample was analysed both in its unadulterated form and after the addition of apple juice. For each sample and each element, the value obtained for the L0 level was used to represent the unadulterated wine, whereas the mean value calculated from the L5, L10, and L20 levels was used to represent the adulterated wine. This approach allowed the comparison to account for changes occurring within the same samples, rather than treating the different adulteration levels as independent observations.
Table 6.
Statistically significant differences in elemental analysis between Riesling wine samples with and without apple juice adulteration (↓, decrease; ↑, increase).
After applying the Holm correction, statistically significant differences between unadulterated wines and wines adulterated with apple juice were observed for 14 out of 19 analysed elements.
The effect of apple juice addition level on elemental concentrations in Riesling wine samples was evaluated using Friedman’s test. When significant differences were found, post hoc Wilcoxon signed-rank tests with Holm correction were performed. The results are summarized in Table 7, which presents the median concentrations at L0, L5, L10, and L20; the p-values obtained from Friedman’s test; and the significant pairwise differences between adulteration levels (* pHolm < 0.05, ** pHolm < 0.01, *** pHolm < 0.001). Detailed Holm-adjusted p-values obtained from post hoc Wilcoxon signed-rank tests for all pairwise comparisons are provided in Table S1 (Supplementary Materials).
Table 7.
Statistically significant differences between samples in elemental analysis for Riesling wine samples depending on the adulteration level (* pHolm < 0.05, ** pHolm < 0.01, *** pHolm < 0.001).
For most of the analyzed elements, the level of apple juice addition had a significant effect on their concentrations. The clearest gradual decrease with increasing adulteration level was observed for Ca, Mg, Mn, P, S, and Sr. For these elements, all pairwise comparisons remained statistically significant after Holm correction, indicating a strong relationship between the proportion of apple juice added and the decrease in their concentrations in the wine matrix.
For some elements, such as Al, Sn, and Ti, significant differences were mainly observed between unadulterated samples and samples containing apple juice, whereas further increases in the apple juice proportion did not result in significant differences among the L5, L10, and L20 levels. The concentrations of these elements were lower in the apple juice than in the unadulterated Riesling wines, and therefore the initial decrease after apple juice addition is consistent with a dilution-related effect. However, the absence of a clear concentration-dependent trend indicates that Al, Sn, and Ti are less suitable as indicators of adulteration level than elements showing a consistent gradual response, such as Ca, Mg, Mn, P, S, and Sr. A more complex pattern was observed for Ba, K, Na, and Zn, for which selected pairwise differences were significant, but the changes did not follow a simple monotonic trend. In the case of Ni, Pb, and V, Friedman’s test did not indicate significant differences among the adulteration levels. As some pairwise differences were significant only before adjustment, the final interpretation was based exclusively on Holm-adjusted p-values.
Although Ca, K, Mg, Mn, P, and S decreased in all 15 paired comparisons between L0 and L5, the 5% (v/v) addition level should not be interpreted as a detection limit for adulteration in unknown wines, as lower addition levels and classification performance were not evaluated. The Riesling samples originated from two German wine-producing regions, Mosel (n = 6) and Palatinate (n = 9), and the decreases observed between L0 and L5 occurred in samples from both regions. Nevertheless, all Riesling samples were from the 2023 vintage, and the experimental design did not allow the independent effects of region, vintage, or winemaking practices to be determined. In addition, further studies involving other fruit juices would be needed to evaluate the specificity of the observed elemental pattern.
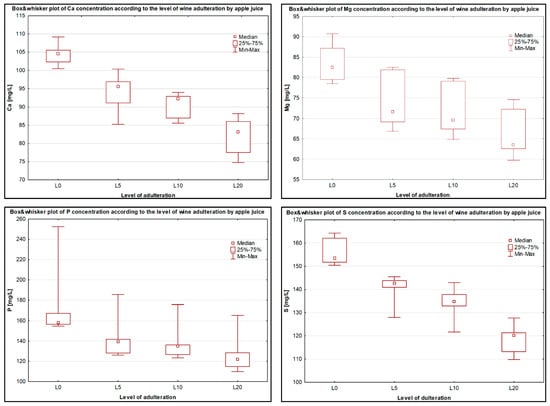
To visualize the distribution of selected elemental concentrations across the individual adulteration levels, box-and-whisker plots were prepared for elements showing the most evident and consistent changes, namely Ca, Mg, P, and S (Figure 1). These plots correspond to the L0, L5, L10, and L20 groups summarized in Table 7. These elements were chosen as representative examples because their concentrations showed clear downward shifts with increasing levels of apple juice addition. The use of box-and-whisker plots enables visualization not only of median changes, but also of the variability within each adulteration level. Overall, the graphical presentation shows a pronounced decrease in Ca, Mg, P, and S concentrations from unadulterated wines to samples containing increasing proportions of apple juice, supporting the interpretation of a dilution effect caused by the addition of apple juice.
Figure 1.
Box-and-whisker plots of calcium (Ca), magnesium (Mg), phosphorus (P) ad sulphur (S) concentrations in the Riesling wine samples at different levels of apple juice adulteration (L0–L20).
Pearson correlation analysis was used to evaluate the relationships among the determined elements and to verify whether elements showing similar changes after apple juice addition formed common correlation groups. The full correlation matrix is presented in Table S2 in the Supplementary Materials.
The correlation matrix showed strong positive relationships between selected elements whose concentrations decreased with increasing adulteration level. Particularly high correlation coefficients were obtained for Mg–Mn (r = 0.861), Ca–S (r = 0.805), Mg–S (r = 0.762), and Ca–Mg (r = 0.761). These relationships indicate similar behaviour of these elements in Riesling wine samples and support the interpretation that their decrease was mainly associated with the dilution of the wine matrix caused by apple juice addition.
A different behaviour was observed for sodium. In contrast to most elements, whose concentrations decreased after apple juice addition, Na increased, particularly at the highest adulteration level. This was reflected in negative correlations between Na and elements representing the dilution-related trend, including Ca (r = −0.607), Mg (r = −0.588), S (r = −0.609), and Mn (r = −0.492). This correlation pattern indicates that sodium did not follow the typical decreasing trend observed for the main mineral components of wine, but behaved differently, which is consistent with its higher concentration in apple juice.
A very strong positive correlation was also observed between Al and Sn (r = 0.982), together with positive relationships between these elements and Ti. This may indicate similar behaviour of these elements in the analyzed system; however, their interpretation should be made with caution due to their low concentration levels and the possible influence of matrix-related or analytical factors. Strong positive correlations were also found for Cu–Fe (r = 0.856) and Cu–Sr (r = 0.823), suggesting that some elements may be associated not only with the dilution effect, but also with technological factors or the specific characteristics of the wine matrix.
PCA performed using all determined elements showed only partial separation of Riesling wine samples according to the level of apple juice addition (Figure S1, Supplementary Materials). In this model, the first two principal components explained 50.46% of the total variance, with PC1 accounting for 28.68% and PC2 for 21.78%. Although unadulterated samples were generally shifted towards positive PC1 values and samples with the highest apple juice addition were more frequently located at negative PC1 values, a considerable overlap between the adulteration levels was observed. This suggests that the inclusion of all elements, including variables with weak or non-systematic responses to apple juice addition, obscured the structure related to adulteration level in the PCA score plot.
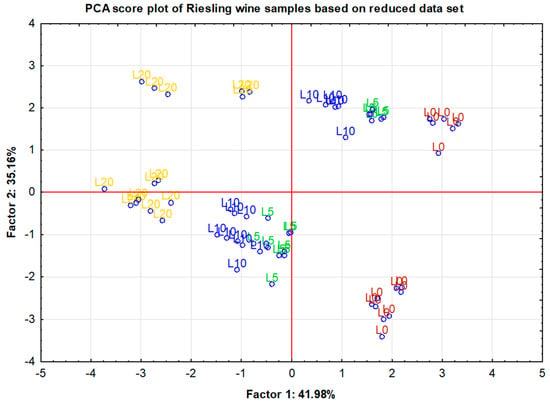
Therefore, a reduced PCA model was constructed using selected elements: Ca, Cu, Fe, Mg, Mn, Na, P, Sr, and S. The selection was based on statistically significant changes across adulteration levels, consistent concentration trends, and correlation patterns associated with apple juice addition. The reduced data set included elements representing the main dilution-related pattern, such as Ca, Mg, Mn, P, S, and Sr, together with Na, which exhibited an opposite behaviour, and Cu and Fe, which showed significant changes and were associated with matrix- or technology-related variation. PCA performed on the reduced elemental data set yielded three components with eigenvalues greater than 1 according to the Kaiser criterion, explaining 92.55% of the total variance (Table S3, Supplementary Materials). For visualization and interpretation purposes, the first two principal components were presented in Figure 2, as they accounted for 77.14% of the total variance, with PC1 explaining 41.98% and PC2 explaining 35.16%.
Figure 2.
PCA score plot showing the projection of Riesling wine samples (n = 60) onto the factor plane based on selected diagnostic elements: Ca, Mg, Mn, Na, P, S, and Sr.
In the reduced PCA model, samples with the highest adulteration level (20% v/v) were clearly shifted towards negative PC1 values, whereas unadulterated samples were mainly located on the positive side of PC1. Samples adulterated at lower levels, especially 5% and 10% (v/v), occupied intermediate positions and partially overlapped with unadulterated wines. This suggests that low levels of apple juice addition caused more subtle changes in the elemental profile, which may be partly masked by the natural variability of the wine samples. In contrast, the more pronounced shift in the 20% samples along PC1 indicates a stronger change in their elemental composition. Overall, the reduced PCA model provided a clearer visualization of the changes associated with apple juice addition than the model based on the full elemental data set.
The factor loadings of the reduced PCA model (Table S4, Supplementary Materials) supported the interpretation of the sample distribution observed in the score plot. PC1 was mainly associated with elements showing dilution-related behaviour, with high positive loadings for Mg (0.936), Ca (0.902), S (0.849), and Mn (0.698), whereas Na showed a strong negative loading (−0.764). This indicates that PC1 reflected the main contrast between elements decreasing with apple juice addition and sodium, which exhibited an opposite trend. PC2 was primarily characterized by strong negative loadings for Cu (−0.962), Fe (−0.953), and Sr (−0.773), suggesting the contribution of additional matrix- or technology-related variability among Riesling samples. PC3 was mainly associated with P (0.799) and, to a lesser extent, Sr (−0.622), but it was not used for graphical interpretation in the score plot. Overall, the loading structure of the reduced PCA model was consistent with the concentration trends observed for the selected elements.
2.3. pH Analysis
The effect of apple juice addition on the pH of wines was evaluated by measuring the pH of adulterated samples. For Riesling wines, three levels of apple juice adulteration were examined: 5%, 10%, and 20% (v/v). The obtained results for pure wines and for samples with the respective levels of adulteration are summarized in Table 8.
Table 8.
pH values obtained for Riesling wines with different levels of apple juice adulteration.
The results obtained in this study indicate an increase in the pH of Riesling wines following the addition of apple juice, which can be directly attributed to the difference in acidity between these two products. The pH values determined for the pure Riesling wines ranged narrowly between 3.08 and 3.13, which is consistent with literature data for white wines. According to the previous studies, the pH of white wines usually falls within the range of 3.0–3.3 (the average pH of white wines ~3.01), while red wines exhibit slightly higher values (around 3.33) due to malolactic fermentation, which reduces their overall acidity [16].
The pH value of the apple juice analyzed in this work was 3.57, which also agrees with the recent literature data. Reported pH values for apple juices typically range from 3.04 to 3.69, and in some commercial varieties may reach up to 4.0 [42,43]. Cai et al. (2020) reported a pH of 3.53 ± 0.01 for freshly pressed apple juice, with values remaining stable between 3.50 and 3.57 after various filtration and storage treatments [44]. Similar findings were presented by Gajek et al. (2021), who compared the physicochemical properties of several apple juices and the ciders produced from them, obtaining median pH of 3.47 [41].
The difference in pH between the Riesling wines and the apple juice used for adulteration fully explains the observed increase in pH in the adulterated samples, particularly at the highest level of addition (20% v/v). This behaviour is entirely consistent with expectations, as the incorporation of a less acidic component such as apple juice leads to a reduction in the overall acidity of the mixture and a corresponding increase in pH.
3. Material and Methods
3.1. Samples
The study was conducted on 60 white wines representing seven grape varieties: Riesling, Chardonnay, Sauvignon Blanc, Gewürztraminer, Solaris, Soave, and Moscato. The samples originated from nine countries—Germany, Poland, Italy, Hungary, Australia, Moldova, Chile, the United States, and Spain. The analyzed wines differed in their residual sugar content, ranging from dry to sweet styles. All wines were commercially available and purchased from retail stores in Poland. Wine samples were collected immediately after bottle opening and stored under refrigeration at 4 °C until analysis. A brief description of the analyzed samples is provided in Table 9. Detailed information for each individual sample, including grape variety, country and region of origin, vintage, alcohol content, and residual sugar category, is provided in Table S5 in the Supplementary Materials.
Table 9.
Brief characteristics of examined wine samples.
The full set of authentic white wines was used to provide a reference background for the natural elemental variability of white wines and to compare the elemental profile of Riesling wines with that of the remaining wine samples. However, the intentional adulteration experiment was performed only on Riesling wines, which were selected as a controlled wine matrix. The selection of the adulterant was guided by literature data [30]. Intentional adulteration of wines was performed using commercially available, 100% clarified apple juice. Fifteen samples of Riesling wine were chosen, and measured volumes of apple juice were added to each to achieve three adulteration levels of 5, 10, and 20% (v/v) (a total of 45 samples were obtained).
The apple juice used for adulteration was a commercially available 100% clarified apple juice purchased from a retail store in Poland. According to the product information, the juice was produced from a mixture of different commonly available cultivated apple varieties originating from Poland. The same juice batch was used for all adulteration experiments. The elemental composition of the juice was determined using the same ICP–OES procedure as for the wine samples and is presented in Table 5.
3.2. Research Procedures
3.2.1. ICP-OES Measurement
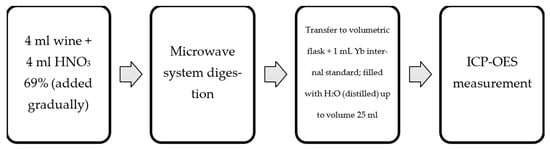
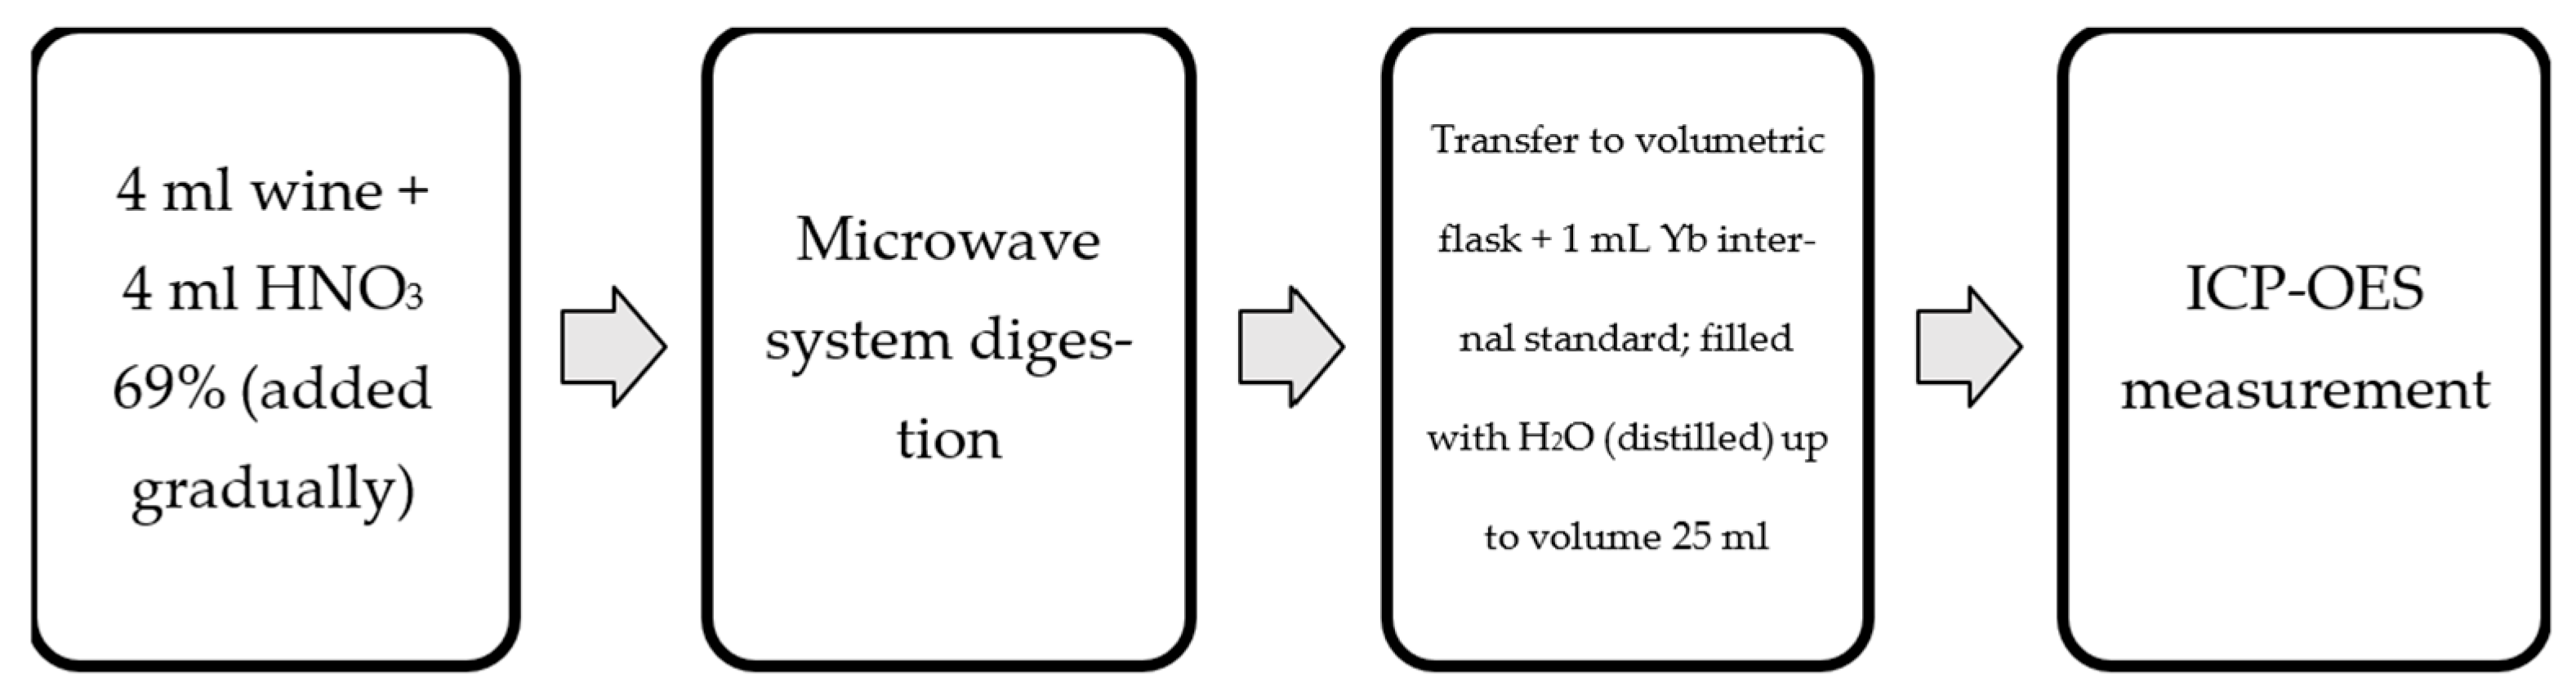
A crucial step preceding ICP analysis involved the mineralization of samples using an Ultrawave system (Milestone, Via Fatebenefratelli, Sorisole, Italy), carried out following the scheme depicted in Figure 3. The analytical procedure applied in this study was adapted from the methodology previously reported by Gajek et al. (2021) [16].
Figure 3.
Procedure of sample preparation.
Determination of elemental content was carried out using Inductively Coupled Plasma Optical Emission Spectrometry (ICP-OES; Thermo Scientific, iCAP 7000 Series, Waltham, MA, USA). Measurements of Ca, K, Mg, and Na were performed in radial plasma configuration, whereas the remaining elements (Ag, Al, Ba, Cd, Co, Cr, Cu, Fe, Mn, Mo, Ni, P, Pb, S, Sb, Sn, Sr, Ti, V, Zn) were determined using an axial plasma view. Each wine sample was analyzed in triplicate. Signal reproducibility and instrumental stability were monitored through the Yb internal standard line. Argon served as the plasma and carrier gas, while a quartz torch and concentric nebulizer were employed.
Due to the fact that the certified wine material (THX012RM, Fera Science Ltd., Sand Hutton, York, UK) was limited to only four elements (Cd, Cu, Fr, Pb), the accuracy of the analytical method was further evaluated using TMDA-64 (fortified lake water, National Water Research Institute, Burlington, ON, Canada) characterized by a broad elemental profile, and the human hair Certified Reference Material NCS ZC 81002b (China National Analysis Center for Iron & Steel, Beijing, China), which was applied to assess elements not included in the wine material. All analytes exhibited very good linearity, with regression coefficients ranging from 0.998 to 1.000. The sensitivity of the developed method was expressed as limits of detection (LOD) and quantification (LOQ), calculated from the variability of blank samples following the relationships LOD = mean × 3SD and LOQ = 3 × LOD [45]. The resulting values are presented in Table 10.
Table 10.
Basic validation parameters obtained for each analyte for the developed method (n, number of standards in three replicates, R2, coefficient of determination, CRM’s values).
The preparation and analytical procedure for the wine samples containing apple juice followed the same protocol as that used for the non-adulterated wine samples.
3.2.2. pH Measurement
The pH of the analyzed wine samples was determined using a Basic 20+ pH meter (Crison Instruments S.A., Barcelona, Spain) equipped with a magnetic stirrer and automatic temperature compensation. Measurements were performed with a combined electrode incorporating both a glass and a silver chloride reference electrode in a single probe. Prior to analysis, the instrument was calibrated daily with standard buffer solutions of pH 4.01, 7.00, and 9.21 (Hach Company, Düsseldorf, Germany). The pH of each wine sample was measured within the same analytical session, and all determinations were carried out in triplicate. The reported pH values represent the arithmetic mean of the three independent measurements.
3.2.3. Data Analysis
Statistical and chemometric analyses were performed using STATISTICA software, version 12.5 (New York, NY, USA). Descriptive statistics, including mean, median, minimum, maximum, and standard deviation, were calculated for the analyzed groups. Elements with concentrations below the limit of quantification in all examined samples were excluded from further statistical evaluation.
Prior to statistical testing, the normality of the data distribution was assessed using the Shapiro–Wilk test at a significance level of 0.05. Since the normality assumption was not met for most variables, nonparametric statistical tests were applied. To evaluate whether the Riesling wines selected for the adulteration experiment differed from the broader background of authentic white wines, elemental concentrations in unadulterated Riesling samples were compared with those in the remaining authentic white wine samples using the Mann–Whitney U test for independent groups.
The effect of apple juice addition on the elemental profile of Riesling wines was assessed using tests for dependent samples, as each wine sample was analyzed in its unadulterated form and after the addition of apple juice. For the general comparison between unadulterated and adulterated Riesling wines, the Wilcoxon signed-rank test was applied. In this analysis, the L0 sample represented the unadulterated wine, whereas the mean value calculated from the L5, L10, and L20 levels represented the adulterated variant of the same wine sample. To evaluate the influence of the adulteration level, Friedman’s test was used to compare elemental concentrations across four related groups: L0, L5, L10, and L20.
Since statistical analyses were performed separately for 19 elements, the Holm correction was applied to adjust for multiple comparisons. This correction was used to reduce the risk of false-positive results associated with multiple statistical testing. Differences were considered statistically significant when the Holm-adjusted p-value was below 0.05.
Pearson correlation analysis was performed to evaluate relationships among the determined elements in Riesling wine samples across all adulteration levels. Principal component analysis (PCA) was used as an unsupervised chemometric tool to visualize the structure of the data set, evaluate sample distribution, and identify variables contributing to the observed patterns. Principal component analysis (PCA) was performed on standardized data using the correlation matrix to visualize sample distribution and identify variables contributing to the observed patterns. PCA was first carried out using all determined elements, followed by a reduced model based on selected diagnostic elements. These variables were selected according to their statistical significance, concentration trends, and correlation patterns. Components with eigenvalues greater than 1 were retained according to the Kaiser criterion, and factor loadings were used for interpretation.
4. Conclusions
The present study showed that controlled addition of apple juice caused measurable changes in the multi-elemental profile of Riesling wines. The most consistent response was a gradual decrease in Ca, Mg, Mn, P, S, and Sr, consistent with a dilution-related change resulting from the lower concentrations of these elements in the apple juice used in this experiment. In contrast, Na showed a different behaviour, with a marked increase particularly at the 20% (v/v) addition level, consistent with its higher concentration in the apple juice matrix.
The statistical analyses identified changes across the investigated addition levels. In the paired comparison between L0 and L5, Ca, K, Mg, Mn, P, and S decreased in all 15 Riesling samples. The reduced PCA model provided a clearer visualization of compositional changes than the model based on all determined elements, particularly through the shift in samples containing 20% (v/v) apple juice along PC1. Samples at the lower addition levels partially overlapped with unadulterated wines.
Alongside the elemental changes revealed by ICP–OES, pH increased with increasing apple juice addition, providing complementary physicochemical information on the studied Riesling–apple juice system. In an assessment of wine authenticity, these measurements should be considered alongside other analytical indicators, such as organic-acid and sugar profiles, since decreases in elemental concentrations alone do not identify the added liquid. Comparisons involving other wines and juice sources, water and other fruit-juice additions, and lower addition levels would help assess how broadly the observed patterns apply and whether they can distinguish apple juice addition from other changes to wine.
Supplementary Materials
The following supporting information can be downloaded at https://www.mdpi.com/article/10.3390/molecules31203655/s1: Figure S1: Projection of Riesling wine samples (n = 60) onto the PCA factor plane based on the full elemental data set, grouped according to apple juice adulteration level; Table S1: Holm-adjusted p-values for pairwise comparisons between apple juice adulteration levels obtained using post hoc Wilcoxon signed-rank tests; Table S2: Pearson correlation matrix for all analyzed elements in wine and adulterated samples; Table S3: Eigenvalues and explained variance of principal components derived from the elemental correlation matrix; Table S4: Factor loadings for all principal components obtained from PCA of the reduced elemental data set; Table S5: Detailed information on the authentic white wine samples included in the study.
Author Contributions
Conceptualization, M.I.S.-J.; methodology, M.G.; validation, M.G.; formal analysis, M.G. and J.Ś.; investigation, M.G. and J.Ś.; resources, J.Ś.; data curation, M.G. and J.Ś.; writing—original draft preparation, M.G.; writing—review and editing, M.G., J.Ś. and M.I.S.-J.; visualization, M.G.; supervision, M.I.S.-J. All authors have read and agreed to the published version of the manuscript.
Funding
This research received no external funding.
Institutional Review Board Statement
Not applicable.
Informed Consent Statement
Not applicable.
Data Availability Statement
The original contributions presented in the study are included in the article/Supplementary Material, further inquiries can be directed to the corresponding author.
Acknowledgments
During the preparation of this manuscript, the authors used Writefull for Word for language editing and grammar correction. The tool was not used for generating scientific content, data analysis, interpretation of results, or drawing conclusions. The authors have reviewed and edited the output and take full responsibility for the content of this publication.
Conflicts of Interest
The authors declare no conflicts of interest.
Abbreviations
The following abbreviations are used in this manuscript:
| ICP-OES | Inductively Coupled Plasma Optical Emission Spectrometry |
| ICP-MS | Inductively Coupled Plasma Mass Spectrometry |
| CVAAS | Cold Vapor Atomic Absorption Spectroscopy |
| PCA | Principal component analysis |
| OIV | International Organisation of Vine and Wine |
| LOD | Limit of detection |
| LOQ | Limit of quantification |
References
- Wine Consumption in Poland—Statistics—Polish Wine. Available online: https://polish.wine/wine-consumption-in-poland-statistics/ (accessed on 23 October 2025).
- Polish Wine Market Sipping on Growth. Available online: https://www.vinetur.com/en/2024091881753/polish-wine-market-sipping-on-growth.html (accessed on 23 October 2025).
- Poland’s State of the Nation: Five on Premise Insights from CGA by NIQ—CGA. Available online: https://cgastrategy.com/polands-state-of-the-nation-five-on-premise-insights-from-cga-by-niq/ (accessed on 23 October 2025).
- Williams & Marshall Strategy. White Wine Market—Analysis, Size, Trends, Consumption, and Forecast. Available online: https://www.wm-strategy.com/poland-white-wine-market-analysis-size-trends-consumption-and-forecast (accessed on 23 October 2025).
- Riesling Grape Variety—Why Is It So Popular in Poland?—Polish Wine. Available online: https://winopolskie.com/wino-szczep-riesling-popularny-w-polsce/ (accessed on 23 October 2025).
- Dragusha, B.; Zogaj, M.; Ramadani, X. Determination of some heavy metals in some wines of Kosovo. Int. J. Ecosyst. Ecol. Sci. 2017, 7, 635–638. [Google Scholar]
- Deng, Z.-H.; Zhang, A.; Yang, Z.-W.; Zhong, Y.-L.; Mu, J.; Wang, F.; Liu, Y.-X.; Zhang, J.-J.; Fang, Y.-L. A human health risk assessment of trace elements present in Chinese wine. Molecules 2019, 24, 248. [Google Scholar] [CrossRef] [Scilit] [PubMed]
- Fermo, P.; Comite, V.; Sredojević, M.; Ćirić, I.; Gašić, U.; Mutić, J.; Baošić, R.; Tešić, Ž. Elemental analysis and phenolic profiles of selected Italian wines. Foods 2021, 10, 158. [Google Scholar] [CrossRef] [Scilit] [PubMed]
- Dumitriu, G.-D.; Teodosiu, C.; Morosanu, I.; Jitar, O.; Cotea, V.V. Quantification of toxic metals during different winemaking stages. BIO Web Conf. 2019, 15, 02024. [Google Scholar] [CrossRef] [Scilit]
- Liu, D.; Zhang, P.; Chen, D.; Howell, K. From the vineyard to the winery: How microbial ecology drives regional distinctiveness of wine. Front. Microbiol. 2019, 10, 2679. [Google Scholar] [CrossRef] [Scilit] [PubMed]
- Mladenova, E.; Voyslavov, T.; Bakardzhiyski, I.; Karadjova, I. From the soil to the wine—Elements’ migration in monovarietal Bulgarian wines. Molecules 2025, 30, 475. [Google Scholar] [CrossRef] [Scilit] [PubMed]
- Pavloušek, P.; Kumšta, M. Authentication of Riesling wines from the Czech Republic on the basis of the non-flavonoid phenolic compounds. Czech J. Food Sci. 2013, 31, 474–482. [Google Scholar] [CrossRef] [Scilit]
- Pohl, P. What do metals tell us about wine? TrAC Trends Anal. Chem. 2007, 26, 941–949. [Google Scholar] [CrossRef] [Scilit]
- Tariba, B. Metals in wine—Impact on wine quality and health outcomes. Biol. Trace Elem. Res. 2011, 144, 143–156. [Google Scholar] [CrossRef] [Scilit] [PubMed]
- Castiñeira Gómez, M.D.M.; Brandt, R.; Jakubowski, N.; Andersson, J.T. Changes of the metal composition in German white wines through the winemaking process. A study of 63 elements by inductively coupled plasma–mass spectrometry. J. Agric. Food Chem. 2004, 52, 2953–2961. [Google Scholar] [CrossRef] [Scilit] [PubMed]
- Gajek, M.; Pawlaczyk, A.; Szynkowska-Jozwik, M.I. Multi-elemental analysis of wine samples in relation to their type, origin, and grape variety. Molecules 2021, 26, 214. [Google Scholar] [CrossRef] [Scilit] [PubMed]
- Jakkielska, D.; Dasteridis, I.; Kubicki, M.; Frankowski, M.; Zioła-Frankowska, A. Determination of metal content by inductively coupled plasma-mass spectrometry in Polish red and white wine samples in relation to their type, origin, grape variety and health risk assessment. Foods 2023, 12, 3205. [Google Scholar] [CrossRef] [Scilit]
- Vongluanngam, I.; Zhang, X.; Blackman, J.W.; Schmidtke, L.M.; Wilkinson, K.L.; Clark, A.C. Impact of light on protective fractions of Cu in white wine: Influence of oxygen and bottle colour. Food Chem. 2024, 452, 139504. [Google Scholar] [CrossRef] [Scilit] [PubMed]
- Torović, L.; Lukić, D.; Majkić, T.; Beara, I. Elemental profile and health risk of Fruška Gora wines. Foods 2023, 12, 2848. [Google Scholar] [CrossRef] [Scilit] [PubMed]
- Geana, E.I.; Popescu, R.; Costinel, D.; Dinca, O.R.; Stefanescu, I.; Ionete, R.E.; Bala, C. Verifying the red wines adulteration through isotopic and chromatographic investigations coupled with multivariate statistic interpretation of the data. Food Control 2016, 62, 1–9. [Google Scholar] [CrossRef] [Scilit]
- Preti, R. Progress in beverages authentication by the application of analytical techniques and chemometrics. In Quality Control in the Beverage Industry; Elsevier: Amsterdam, The Netherlands, 2019; Volume 17, pp. 85–121. [Google Scholar] [CrossRef] [Scilit]
- Hencz, A.; Nguyen, L.L.P.; Baranyai, L.; Albanese, D. Assessment of wine adulteration using near infrared spectroscopy and laser backscattering imaging. Processes 2022, 10, 95. [Google Scholar] [CrossRef] [Scilit]
- Langen, J.; Wegmann-Herr, P.; Schmarr, H.G. Quantitative determination of α-ionone, β-ionone, and β-damascenone and enantiodifferentiation of α-ionone in wine for authenticity control using multidimensional gas chromatography with tandem mass spectrometric detection. Anal. Bioanal. Chem. 2016, 408, 6483–6496. [Google Scholar] [CrossRef] [Scilit] [PubMed]
- Sagandykova, G.N.; Alimzhanova, M.B.; Nurzhanova, Y.T.; Kenessov, B. Determination of semi-volatile additives in wines using SPME and GC–MS. Food Chem. 2017, 220, 162–167. [Google Scholar] [CrossRef] [Scilit] [PubMed]
- Mac, H.X.; Pham, T.T.; Ha, N.T.T.; Nguyen, L.L.P.; Baranyai, L.; Friedrich, L. Current techniques for fruit juice and wine adulterant detection and authentication. Beverages 2023, 9, 84. [Google Scholar] [CrossRef] [Scilit]
- Geana, I.; Iordache, A.; Ionete, R.; Marinescu, A.; Ranca, A.; Culea, M. Geographical origin identification of Romanian wines by ICP-MS elemental analysis. Food Chem. 2013, 138, 1125–1134. [Google Scholar] [CrossRef] [Scilit] [PubMed]
- Azcarate, S.M.; Martinez, L.D.; Savio, M.; Camiña, J.M.; Gil, R.A. Classification of monovarietal Argentinean white wines by their elemental profile. Food Control 2015, 57, 268–274. [Google Scholar] [CrossRef] [Scilit]
- Rodrigues, N.P.; Rodrigues, E.; Celso, P.G.; Kahmann, A.; Yamashita, G.H.; Anzanello, M.J.; Manfroi, V.; Hertz, P.F. Discrimination of sparkling wines samples according to the country of origin by ICP-OES coupled with multivariate analysis. LWT 2020, 131, 109760. [Google Scholar] [CrossRef] [Scilit]
- Burda, K.; Collins, M. Adulteration of wine with sorbitol and apple juice. J. Food Prot. 1991, 54, 381–382. [Google Scholar] [CrossRef] [Scilit] [PubMed]
- Liveri, M.; Tsantili-Kakoulidou, A.; Tsopelas, F. Identification of white wine adulteration with apple juice and apple cider using cyclic voltammetry on a screen-printed electrode aided by chemometric analysis. J. Food Compos. Anal. 2024, 136, 106751. [Google Scholar] [CrossRef] [Scilit]
- Avram, V.; Voica, C.; Hosu, A.; Cimpoiu, C.; Măruţoiu, C. ICP-MS characterization of some Romanian white wines by their mineral content. Rev. Roum. Chim. 2014, 12, 1009–1019. [Google Scholar]
- Drava, G.; Minganti, V. Mineral composition of organic and conventional white wines from Italy. Heliyon 2019, 5, e02464. [Google Scholar] [CrossRef] [Scilit] [PubMed]
- Pasvanka, K.; Kostakis, M.; Tarapoulouzi, M.; Nisianakis, P.; Thomaidis, N.S.; Proestos, C. ICP–MS analysis of multi-elemental profile of Greek wines and their classification according to variety, area and year of production. Separations 2021, 8, 119. [Google Scholar] [CrossRef] [Scilit]
- Pořízka, J.; Diviš, P.; Dvořák, M. Elemental analysis as a tool for classification of Czech white wines with respect to grapevine varieties. J. Elem. 2018, 23, 709–727. [Google Scholar] [CrossRef] [Scilit]
- Šelih, V.S.; Šala, M.; Drgan, V. Multi-element analysis of wines by ICP-MS and ICP-OES and their classification according to geographical origin in Slovenia. Food Chem. 2014, 153, 414–423. [Google Scholar] [CrossRef] [Scilit] [PubMed]
- Slavíková, Z.; Pořízka, J.; Diviš, P. Elemental analysis of Czech wines including wines from organic production. J. Microbiol. Biotechnol. Food Sci. 2024, 13, e10219. [Google Scholar] [CrossRef] [Scilit]
- Wang, J.; Ma, T.; Wei, M.; Lan, T.; Bao, S.; Zhao, Q.; Fang, Y.; Sun, X. Copper in grape and wine industry: Source, presence, impacts on production and human health, and removal methods. Compr. Rev. Food Sci. Food Saf. 2023, 22, 1794–1816. [Google Scholar] [CrossRef] [Scilit] [PubMed]
- Zeiner, M.; Juranovic-Cindric, I.; Kröppl, M.; Stingeder, G. Reference concentrations of major, minor and trace elements in apple juices. In Proceedings of the 5th Central European Congress on Food, Bratislava, Slovakia, 19–22 May 2010. [Google Scholar]
- Aras, S.; Eşitken, A. Responses of apple plants to salinity stress. Yüzüncü Yıl Univ. J. Agric. Sci. 2019, 29, 253–257. [Google Scholar] [CrossRef] [Scilit]
- Mahdy, E.M.; Elsayed, H.H.; Mohamed, L.M.; Abdel Salam, H.A.; Soliman, A.F. Evaluation of sodium benzoate as a preservative in apple juice after different periods of storage in sunlight on rats’ liver. Bull. Natl. Nutr. Inst. Arab Repub. Egypt 2020, 56, 133–153. [Google Scholar] [CrossRef] [Scilit]
- Gajek, M.; Pawlaczyk, A.; Wysocki, P.; Szynkowska-Jozwik, M.I. Elemental characterization of ciders and other low-percentage alcoholic beverages available on the Polish market. Molecules 2021, 26, 2186. [Google Scholar] [CrossRef] [Scilit] [PubMed]
- Lončarić, A.; Flanjak, I.; Kovač, T.; Tomac, I.; Skoko, A.-M.G.; Babojelić, M.S.; Fruk, G.; Zrinušić, S.Z.; Čiček, D.; Babić, J.; et al. Unveiling apple diversity: The quality of juice produced from old vs. commercial apple cultivars. Plants 2023, 12, 3733. [Google Scholar] [CrossRef] [Scilit] [PubMed]
- Marinoni, D.T.; Ruffa, P.; Pavese, V.; Giuggioli, N.R. Apple juice evaluation: Qualitative analysis and microsatellite traceability. AIMS Agric. Food 2022, 7, 819–830. [Google Scholar] [CrossRef] [Scilit]
- Cai, M.; Xie, C.; Lv, Y.; Yang, K.; Sun, P. Changes in physicochemical profiles and quality of apple juice treated by ultrafiltration and during its storage. Food Sci. Nutr. 2020, 8, 2913–2919. [Google Scholar] [CrossRef] [Scilit] [PubMed]
- Konieczka, P.; Namieśnik, J. Walidacja procedur analitycznych. In Ocena i Kontrola Jakości Wyników Pomiarów Analitycznych; Wydawnictwa Naukowo-Techniczne: Warszawa, Poland, 2007; pp. 225–300. [Google Scholar]

Disclaimer/Publisher’s Note: The statements, opinions and data contained in all publications are solely those of the individual author(s) and contributor(s) and not of MDPI and/or the editor(s). MDPI and/or the editor(s) disclaim responsibility for any injury to people or property resulting from any ideas, methods, instructions or products referred to in the content. |
© 2026 by the authors. Licensee MDPI, Basel, Switzerland. This article is an open access article distributed under the terms and conditions of the Creative Commons Attribution (CC BY) license.