


Abstract
Digital service environments generate extensive longitudinal behavioral data that can reveal meaningful differences in how customers engage with services over time. This study investigates customer heterogeneity through a multidimensional behavioral segmentation approach that integrates service usage intensity, behavioral variability, temporal trajectories, engagement, and relationship maturity, and examines whether the resulting segments differ in observed purchase behavior. Using longitudinal customer data from a telecommunications service environment covering 2023–2025, billing and service usage records were transformed into customer-level behavioral features. After data quality assessment and preprocessing, 974 customers with sufficient behavioral histories and complete information were included in the analysis. Cluster tendency was assessed using the Hopkins statistic, while alternative clustering algorithms and cluster solutions were evaluated through internal validity criteria, stability analysis, resampling, and PCA-based robustness checks. A three-cluster K-means solution yielded stable, balanced, and behaviorally interpretable segments. Purchase rates differed significantly across the segments (χ2(2) = 9.783, p = 0.0075), ranging from 22.18% to 33.43%. The findings indicate that rapidly increasing service usage does not necessarily correspond to higher observed purchase rates; rather, established, high-intensity multi-service engagement is associated with higher observed purchase rates.
1. Introduction
The rapid expansion of digital service ecosystems has fundamentally transformed the ways in which firms observe, understand, and respond to customer behavior. Contemporary service providers continuously generate large volumes of customer-level data through transactions, subscriptions, billing activities, and service interactions. These digital traces create opportunities to move beyond broad customer classifications and develop more behaviorally grounded representations of customers. This capability has become increasingly important as personalization, customer engagement, and technology-mediated interactions assume central roles in electronic commerce and digital service delivery. Recent studies have accordingly examined customer engagement in immersive digital services, customer responses to AI-enabled shopping technologies, and the relationships among personalization, trust, privacy perceptions, and purchase intentions [1,2,3]. Collectively, these developments reinforce the importance of deriving meaningful customer knowledge from increasingly heterogeneous digital interactions.
Customer segmentation represents one of the principal analytical approaches for addressing such heterogeneity. By identifying groups of customers with similar characteristics, segmentation can support differentiated customer management, personalized targeting, and more efficient allocation of marketing resources. Clustering techniques have therefore been extensively applied to customer segmentation across retail, electronic commerce, and digital service settings. K-means, in particular, has remained a widely used approach for identifying interpretable customer groups from behavioral and transactional data [4,5]. At the same time, comparative research has increasingly evaluated alternative clustering methods rather than relying exclusively on a single algorithm, reflecting recognition that segmentation outcomes can depend on both the representation of customers and the analytical method employed [6,7]. Earlier studies have similarly explored soft-clustering and multi-stage clustering approaches to accommodate heterogeneous customer characteristics and more complex segmentation structures [8,9].
Foundational segmentation research has established the importance of identifying heterogeneous customer groups on the basis of meaningful differences in needs, characteristics, and behavior [10]. Other studies have integrated customer profiling, segmentation, and predictive analytics to support direct-marketing decisions [11], while demographic and psychographic information has been incorporated into customer profiling in mobile financial services [12]. More recent work has extended this perspective through dynamic and longitudinal approaches that use behavioral data to capture evolving customer patterns [13,14]. Particularly relevant to data-intensive mobile environments, Rodrigues et al. [15] demonstrate how behavioral patterns derived from mobile-phone data can be combined with clustering techniques to construct distinct user profiles. Their work illustrates the potential of observed digital traces for revealing latent behavioral heterogeneity in mobile-service environments. Taken together, these studies indicate a progression toward increasingly data-rich representations of customers and highlight that the usefulness of segmentation depends not only on the clustering technique employed but also on how customer behavior is represented before clustering.
Despite these advances, an important analytical challenge concerns the temporal representation of customer behavior. Segmentation based predominantly on static or aggregated behavioral measures can conceal differences in how customer behavior develops over time. Recent studies have therefore emphasized dynamic customer representations and time-series-based clustering to capture evolving behavioral patterns that may be obscured by conventional static segmentation approaches [16,17,18]. Two customers may exhibit similar average levels of service usage while following substantially different trajectories: one may maintain a relatively stable level of activity, whereas another may reach a comparable level only after a period of rapid growth. Likewise, similar average expenditure may coexist with markedly different levels of billing variability, and customers displaying comparable current activity may differ substantially in the maturity of their relationship with the service provider. Behavioral intensity alone may therefore provide an incomplete representation of customer heterogeneity. Incorporating variability and temporal trajectories alongside average behavioral levels offers an opportunity to distinguish customers not only according to how intensively they use services, but also according to how consistently and in what direction their behavior evolves over time [16,17,18].
This issue is particularly relevant in telecommunications, which provides a rich empirical setting for longitudinal behavioral analysis. Telecommunications service providers routinely generate repeated customer-level observations through billing activity, voice communication, mobile data consumption, messaging activity, and subscription histories, providing multiple behavioral signals for characterizing customer relationships over time [19,20]. Customer segmentation has long been recognized as an important analytical approach in the telecommunications industry [19], while more recent research has extended this perspective through machine-learning-based behavioral segmentation [20] and data-driven dimensionality reduction and clustering approaches [21]. Research based on anonymized mobile-phone records further demonstrates the potential of telecommunications-derived behavioral traces for constructing multidimensional user profiles and uncovering heterogeneous patterns of customer behavior [15].
Beyond segmentation itself, temporal customer behavior may also contain commercially relevant information. Recent electronic-commerce research has examined behavioral dynamics for personalized marketing [22] and temporally informed customer representations for purchase prediction [23]. However, predictive modeling and behavioral segmentation address different analytical questions. Whereas supervised models identify variables that distinguish predefined outcomes, unsupervised segmentation seeks latent configurations of customers independently of those outcomes. This distinction makes it possible to examine whether behavioral profiles derived from longitudinal customer activity are associated with commercially relevant outcomes.
Against this background, the theoretical problem addressed in this study is that customer heterogeneity is often represented primarily through differences in the level or composition of observed behavior, although longitudinal customer relationships may differ simultaneously in behavioral intensity, variability, temporal trajectory, service engagement, and relationship maturity. These dimensions capture complementary aspects of customer behavior: intensity reflects the level of service use, variability its stability, trajectory its direction of development, engagement the breadth and regularity of service interaction, and relationship maturity the duration of the customer–provider relationship. The present study therefore investigates customer heterogeneity through a multidimensional longitudinal representation that integrates these dimensions using billing, voice, mobile data, messaging, and subscription information. Purchase status is excluded from segment construction and introduced only after the behavioral segmentation has been established, allowing the commercial relevance of independently identified behavioral profiles to be assessed.
Methodologically, the study adopts a multi-stage validation strategy in which alternative clustering algorithms and cluster solutions are evaluated using complementary internal validity criteria, repeated-initialization stability, resampling, and principal component analysis (PCA)-based robustness assessment. Purchase behavior is subsequently used as an external outcome rather than as an input to segment formation. This design provides a rigorous basis for identifying reproducible and behaviorally interpretable customer profiles while preserving the distinction between behavioral segmentation and purchase outcomes.
Accordingly, the study addresses the following research questions:
RQ1. What distinct customer segments emerge from longitudinal patterns of digital service usage, billing behavior, engagement, and customer relationship maturity?
RQ2. How do the identified customer segments differ in terms of usage intensity, behavioral variability, and temporal trajectories?
RQ3. To what extent is behavioral segment membership associated with observed customer purchase behavior?
This study makes three main contributions. First, it advances behavioral customer representation by jointly incorporating behavioral intensity, variability, temporal trajectories, service engagement, and relationship maturity, enabling customers with similar average activity levels to be differentiated according to behavioral stability and development over time. Second, it strengthens the methodological basis of behavioral segmentation through a multi-layer validation framework combining alternative clustering solutions, internal validity measures, stability analyses, and PCA-based robustness assessment. Third, it maintains an explicit analytical separation between behavioral segment discovery and purchase outcomes, enabling the commercial relevance of independently derived behavioral profiles to be evaluated without using purchase information to define the segments. Collectively, these contributions support a more dynamic and methodologically robust understanding of customer heterogeneity in digital service environments.
The remainder of the paper is organized as follows: Section 2 presents the materials and methods, including the dataset, data preprocessing, longitudinal behavioral feature construction, clustering methodology, and validation framework. Section 3 reports the empirical results, including cluster selection, segment characterization, robustness analyses, and the external validation of the identified segments using purchase behavior. Section 4 discusses the findings in relation to the existing literature and elaborates on their theoretical and managerial implications, limitations and directions for future research. Finally, Section 5 concludes the study by summarizing its main contributions.
2. Materials and Methods
2.1. Data Source and Empirical Context
This study employed longitudinal customer data from a telecommunications service environment to investigate behavioral heterogeneity and its association with purchasing behavior. The original data comprised 1044 unique customers and were organized into three complementary data sources: customer information, invoice records, and service-usage records. The same 1044 customers were represented across all three sources, enabling billing and service-usage behavior to be linked at the individual customer level.
The customer-level data were provided by the collaborating telecommunications company under specific authorization for academic research. Before the data were made available to the research team, direct personal identifiers were removed by the data provider. The research team therefore accessed and analyzed only anonymized customer-level records and had no access to directly identifiable personal information. The dataset was used exclusively for the purposes of the present research.
The CUSTOMER dataset contained one record per customer and included the anonymized customer identifier (CUSTOMER_ID), subscription date (SUBSCRIPTION_DATE), and observed purchase status (PURCHASED). PURCHASED was a binary indicator representing the outcome of a customer contact in which a new product or service package was offered (1 = the customer accepted and purchased the offered product or service package; 0 = the customer did not purchase). The behavioral records used for customer segmentation represented customer activity observed prior to this customer contact and the resulting purchase decision. The available dataset did not include the specific type or monetary value of the offered product or service package, the exact transaction date, or information on additional purchases. Accordingly, PURCHASED was treated as an observed binary purchase outcome rather than as an estimate of purchase propensity. Of the 1044 customers, 279 (26.72%) were classified as purchasers and 765 (73.28%) as non-purchasers.
The INVOICE dataset contained 24,946 invoice-level records and provided information on invoice identifiers, billing dates, due dates, and billed amounts. The USAGE dataset comprised 24,031 records describing customer service activity through voice usage (VOICE_TOTAL), messaging activity (SMS_TOTAL), and mobile data consumption (DATA_TOTAL). Both billing and usage records covered the period from January 2023 to October 2025, providing up to 34 months of longitudinal observations for individual customers. Table 1 summarizes the structure and analytical role of the three original data sources.
Table 1.
Overview of the original data sources.
The three data sources provide complementary dimensions of customer behavior. Invoice records capture the monetary dimension of the customer relationship, whereas voice, mobile data, and messaging records characterize patterns of service engagement. Subscription history provides information on relationship maturity. Their longitudinal structure makes it possible to represent customers not only in terms of average behavioral intensity but also in terms of behavioral variability and temporal evolution, which are central to the segmentation framework developed in this study.
A key methodological distinction concerns the role and temporal ordering of purchase information. The PURCHASED variable was not included among the variables used to construct the customer segments. Segment formation was based exclusively on behavioral and relationship-related characteristics derived from customer activity observed prior to the customer contact and resulting purchase decision. Purchase status was retained separately and introduced only after the segmentation solution had been established, as an external outcome for assessing whether independently identified behavioral profiles were associated with differences in observed purchasing behavior. Thus, neither the purchase outcome nor post-purchase behavioral information was used in cluster formation. This separation prevents the purchase outcome from directly influencing cluster formation and allows the commercial relevance of the resulting behavioral segments to be evaluated independently.
The overall methodological framework of the study is presented in Figure 1, illustrating the progression from longitudinal data preparation and behavioral feature engineering to customer segmentation, robustness assessment, and external validation using purchase behavior.
Figure 1.
Overall methodological framework for longitudinal behavioral customer segmentation and external purchase validation.
2.2. Data Preprocessing and Monthly Panel Construction
A systematic preprocessing procedure was applied before constructing the customer-level behavioral features. The objective was to harmonize the invoice and usage records at a common customer-month level, while preserving the longitudinal structure of the data and avoiding multiple observations for the same customer and billing period. Data quality checks were first performed separately for the CUSTOMER, INVOICE, and USAGE datasets to examine customer coverage, duplicate observations, missing values, temporal coverage, and the distributions of the principal behavioral variables.
The invoice data required particular attention because multiple invoice records could occur for the same customer within the same billing month. Of the customer-month combinations represented in the invoice data, 369 contained more than one invoice, with the number of invoices in these affected customer-months ranging from 2 to 36. These observations were retained because multiple invoice records could reflect billing adjustments or other within-month billing activity rather than duplicate customer observations. Accordingly, invoice records were aggregated at the customer-month level by summing valid BILL_AMOUNT values within each combination of CUSTOMER_ID, BILL_YEAR, and BILL_MONTH. The number of invoice records contributing to each customer-month was also retained during panel construction as an auxiliary indicator of within-month billing multiplicity.
An additional data-quality check identified 30 invoice records with an exact BILL_AMOUNT value of −100,000. All 30 occurred in March 2023 and involved 30 different customers. Moreover, each affected customer-month contained at least one additional invoice record. The concentration of an identical extreme negative value within a single billing period was inconsistent with the broader distribution of billed amounts and was therefore treated as a sentinel or non-substantive system value rather than a valid monetary observation. These 30 values were converted to missing values before monthly invoice aggregation. Other negative billing amounts were not automatically removed, as the data alone did not provide sufficient grounds for treating all negative amounts as invalid observations.
As a sensitivity analysis, the complete preprocessing, feature-engineering, and K = 3 clustering procedure was repeated after entirely excluding these 30 invoice records rather than treating their BILL_AMOUNT values as missing. The analytical sample remained unchanged (N = 974), the Silhouette coefficient was virtually unchanged (0.1475 vs. 0.1488 in the main analysis), and cluster assignments showed very high agreement with the main solution (ARI = 0.9876), indicating that the treatment of these observations had negligible influence on the segmentation results.
The usage data were similarly harmonized at the customer-month level. Although the USAGE dataset was predominantly monthly in structure, 27 customer-months contained two usage records. Because these records contained different voice, SMS, and/or mobile-data values rather than exact duplicate observations, they were consolidated at the customer-month level. Monthly totals were calculated separately for voice, SMS, and mobile-data activity, resulting in a single usage observation for each customer and month. Missing usage values were preserved during this stage rather than automatically interpreted as zero activity, because the source data did not establish that an absent value necessarily represented non-use.
Following these procedures, the monthly invoice and usage datasets contained 24,091 and 24,004 customer-month observations, respectively. They were subsequently merged using the common keys CUSTOMER_ID, BILL_YEAR, and BILL_MONTH. The resulting longitudinal panel contained 24,099 unique customer-month observations for 1044 customers, with no remaining duplicate customer-month combinations. Customer-level subscription dates and purchase-status information were then linked from the CUSTOMER dataset. The resulting panel covered the complete study period from January 2023 to October 2025 and served as the basis for the subsequent construction of longitudinal behavioral features.
Table 2 summarizes the principal preprocessing decisions and the resulting data structure.
Table 2.
Description of the original datasets and variables.
2.3. Longitudinal Behavioral Feature Engineering
Following the construction of the monthly panel, the longitudinal records were transformed into customer-level features for behavioral segmentation. The feature-engineering strategy was designed to capture multiple dimensions of customer behavior rather than relying solely on cumulative or static measures of service usage. Specifically, the customer representation incorporated five complementary dimensions: behavioral intensity, behavioral variability, temporal trajectory, service engagement, and relationship maturity. Features were derived from billing, voice, mobile-data, messaging, and subscription information.
Behavioral intensity was represented by the mean monthly level of the corresponding activity over each customer’s observed history. For customer i, the mean of a behavioral variable was calculated as
where denotes the behavioral value observed for customer i in month t, and denotes the number of available monthly observations for that customer. Accordingly, BILL_MEAN, VOICE_MEAN, and DATA_MEAN_GB represented average monthly billing amount, voice usage, and mobile-data consumption, respectively. Mobile-data usage was converted to gigabytes before customer-level feature construction to improve interpretability. These features characterize the typical level of activity exhibited by each customer during the observation period. Means were calculated using only the available non-missing monthly observations for the corresponding behavioral variable. Missing customer-month values were excluded from the calculation and were neither imputed nor interpreted as zero.
Behavioral variability was quantified using the coefficient of variation (CV), which expresses within-customer dispersion relative to the corresponding average level of activity. For customer i, the coefficient of variation was calculated as
where denotes the standard deviation of the customer’s available monthly observations and denotes the corresponding mean. This procedure produced BILL_CV, VOICE_CV, and DATA_CV. The CV was preferred to absolute dispersion because customers differed substantially in their overall levels of billing and service consumption. Consequently, these features capture relative behavioral stability or fluctuation while accounting for differences in activity intensity. CV calculations similarly used only available non-missing monthly observations. At least two valid observations were required, and the CV was treated as undefined when the corresponding customer-specific mean was zero. No additional near-zero threshold was imposed. For billing, the exact −100,000 sentinel values identified during preprocessing were excluded, whereas other negative billing values were retained as observed.
To incorporate the temporal evolution of customer behavior, customer-specific linear trends were estimated for billing, voice usage, and mobile-data consumption. For each customer, the available monthly observations were ordered chronologically and represented using the following linear trend:
where denotes the behavioral value for customer i at observation t, is the customer-specific intercept, t represents the sequential order of the available customer-month observations after chronological ordering, is the estimated temporal slope, and denotes the residual term. The resulting slope coefficients were retained as BILL_SLOPE, VOICE_SLOPE, and DATA_SLOPE_GB. Positive slope values indicate an increasing behavioral trajectory, negative values indicate a declining trajectory, and values closer to zero indicate comparatively stable behavior over time. These trajectory features complement the intensity measures by distinguishing customers who may exhibit similar average levels of activity but different directions of behavioral development. Slopes were estimated separately for each behavioral variable using its available non-missing observations, with at least three valid observations required. Missing values were not replaced by zero, and unobserved months were not artificially inserted into the series. Accordingly, the slope index reflects the chronological sequence of available observations rather than elapsed calendar-month distance across gaps.
Messaging behavior was represented differently because SMS records exhibited substantially greater sparsity than the other service-usage dimensions. Missing SMS observations were not automatically interpreted as zero consumption because the source data did not establish that missing values necessarily represented non-use. Instead, messaging engagement was represented through SMS_ACTIVE_RATIO, defined for customer i as
where denotes the number of observed months in which SMS activity was recorded and denotes the total number of observed customer-months for the customer. Thus, SMS_ACTIVE_RATIO reflects the regularity with which SMS activity was represented in the observed records rather than assuming that missing SMS observations corresponded to zero usage.
Finally, relationship maturity was represented by TENURE_MONTHS, calculated as the number of months between each customer’s subscription date and the customer’s last observed month in the longitudinal panel. This dimension complements the behavioral measures by distinguishing relatively recent customer relationships from longer-established ones.
Before defining the final clustering specification, alternative representations of the behavioral dimensions were examined, including median values and recent-period averages. Preliminary feature diagnostics revealed substantial redundancy between several of these measures and their corresponding mean-based representations. To avoid overrepresenting particular behavioral dimensions in the clustering process, redundant measures were excluded from the final feature set. The resulting customer representation consisted of 11 features, summarized in Table 3.
Table 3.
Longitudinal behavioral features used for customer segmentation.
Together, these features provide a multidimensional representation of longitudinal customer behavior that distinguishes behavioral level, relative variability, temporal evolution, service engagement, and relationship maturity.
2.4. Analytical Sample and Data Transformation
To ensure that the longitudinal features reflected a sufficient behavioral history, customers were required to have at least six months of observed records in the constructed monthly panel. Of the original 1044 customers, 1025 (98.2%) satisfied this criterion and were considered eligible for the main analysis. The six-month threshold was selected to reduce the influence of extremely short customer histories while retaining the large majority of the available sample and allowing variability- and trajectory-based features to be estimated from repeated observations. Sensitivity to the minimum observation threshold was examined by repeating the complete preprocessing and K = 3 clustering procedure using minimum histories of nine and twelve observed months. The nine-month specification retained 966 customers and produced virtually identical cluster separation (Silhouette = 0.1489) and very high agreement with the six-month solution among common customers (ARI = 0.9882). Under the more restrictive twelve-month threshold, the analytical sample decreased to 644 customers; the Silhouette coefficient remained comparable (0.1551), whereas assignment agreement with the six-month solution decreased to ARI = 0.5014. These results indicate that the segmentation was stable to a moderate increase in the eligibility threshold, while a substantially more restrictive observation requirement altered the composition of the analytical sample and the resulting individual cluster assignments.
The availability of the 11 clustering features was subsequently examined within the eligible sample. Missingness was concentrated primarily in the mobile-data-derived variables: DATA_MEAN_GB contained 44 missing observations, DATA_CV contained 49, and DATA_SLOPE_GB contained 51. No missing observations were present for the remaining clustering features. Given the limited extent of missingness, a complete-case approach was adopted, resulting in a final analytical sample of 974 customers, corresponding to 95.02% of the eligible sample and 93.30% of the original customer population. Of these customers, 272 (27.93%) had a positive purchase status and 702 (72.07%) had a negative purchase status. Table 4 summarizes the analytical sample construction.
Table 4.
Construction of the final analytical sample.
Before clustering, the distributions and pairwise associations of the candidate behavioral features were examined to identify distributional irregularities and potentially redundant representations. The preliminary feature set included alternative measures such as medians and recent-period averages. Strong associations were observed among several measures representing the same underlying behavioral dimension, particularly between mean, median, and recent-period measures of billing, voice usage, and mobile-data consumption. To avoid disproportionately weighting particular behavioral dimensions through highly overlapping variables, the final feature space was restricted to the 11 variables defined in Table 3.
Because the clustering variables were measured on substantially different scales and several exhibited skewed distributions, a Yeo–Johnson [22] power transformation was applied to all 11 clustering features prior to clustering. The Yeo–Johnson transformation was selected because it can accommodate zero and negative values, which was particularly relevant for the trajectory features, while reducing distributional skewness and the influence of extreme observations. The transformation was performed without internal standardization. Subsequently, all transformed features were standardized using z-score scaling to obtain a mean of zero and a standard deviation of one. This two-stage preprocessing procedure improved comparability across behavioral dimensions and prevented variables expressed on larger numerical scales from dominating the distance-based clustering procedure. The resulting standardized 974 × 11 feature matrix constituted the final input to the unsupervised clustering analyses. The transformation parameters were estimated using the complete analytical sample and were subsequently applied to the same sample before clustering. After transformation and standardization, 69 of the 974 customers (7.08%) had at least one feature with an absolute standardized value greater than 3. No additional trimming or winsorization was applied at this stage.
2.5. Cluster Tendency and Clustering Strategy
Before applying the clustering algorithms, the tendency of the transformed behavioral data to form non-random group structures was assessed using the Hopkins statistic [23]. This step was performed to determine whether the observed feature space exhibited sufficient clustering tendency to justify subsequent segmentation. The Hopkins statistic compares nearest-neighbor distances among observed data points with those obtained from artificially generated points distributed across the same feature space, with values closer to 1 indicating stronger departure from spatial randomness and greater cluster tendency.
To reduce dependence on a single random sample, the Hopkins statistic was estimated repeatedly rather than from a single realization. In each iteration, 10% of the analytical sample was randomly selected from the standardized feature matrix. An equal number of artificial observations was generated independently within the observed minimum–maximum range of each feature. Nearest-neighbor distances were then calculated for both the observed and artificial points. The procedure was repeated across 20 random seeds, and the mean, standard deviation, minimum, and maximum Hopkins statistics were recorded to assess the consistency of the cluster-tendency evidence.
Following the cluster-tendency assessment, multiple unsupervised learning approaches were evaluated rather than selecting a clustering algorithm a priori. Three clustering families with different underlying assumptions were considered: K-means clustering, agglomerative hierarchical clustering with Ward linkage, and Gaussian mixture modeling (GMM). K-means represents customers through distance-based partitioning around cluster centroids, Ward hierarchical clustering progressively combines observations while minimizing increases in within-cluster variance, and GMM provides a probabilistic model-based representation in which the observed data are assumed to arise from a mixture of underlying multivariate distributions. Comparing these approaches allowed the robustness of the segmentation structure to be examined across alternative clustering paradigms.
All analyses were conducted in Python 3.12.7 using NumPy 1.26.4, pandas 3.0.3, scikit-learn 1.5.1, SciPy 1.13.1, and statsmodels 0.14.2. Randomness was controlled through explicitly specified random seeds. K-means clustering used k-means++ initialization, the Lloyd algorithm, 50 initializations, a maximum of 300 iterations, and a convergence tolerance of 10−4. Gaussian mixture models were estimated with full covariance matrices, k-means initialization, 10 initializations, a maximum of 100 iterations, a convergence tolerance of 10−3, and covariance regularization of 10−6. Ward hierarchical clustering was implemented using agglomerative clustering with Ward linkage and Euclidean distance. A random seed of 42 was used for the principal clustering analyses.
For each algorithm, candidate solutions ranging from two to eight clusters (K = 2–8) were estimated using the same transformed and standardized 11-dimensional behavioral feature space. The candidate range was deliberately evaluated rather than imposing a predetermined number of customer segments. Each solution was subsequently assessed using complementary internal validation criteria and cluster-size diagnostics. Particular attention was given to whether increasing the number of clusters produced meaningful improvements in separation without generating excessively small or potentially unstable customer groups. The subsequent validation procedures used to compare the candidate solutions are detailed in Section 2.6.
2.6. Cluster Validation and Robustness Assessment
Candidate clustering solutions were evaluated using a multi-layer validation framework designed to assess cluster separation, compactness, stability, and robustness rather than relying on a single criterion. The evaluation combined three complementary internal validation indices with repeated-initialization stability, subsampling-based reproducibility, and principal component analysis (PCA)-based robustness assessment. This approach was adopted because different validation criteria capture different properties of a clustering solution and may therefore favor different numbers of clusters.
First, three commonly used internal validation measures were calculated for each algorithm and each candidate solution from K = 2 to K = 8: the Silhouette coefficient, Calinski–Harabasz index, and Davies–Bouldin index [24,25,26]. The Silhouette coefficient evaluates the extent to which observations are more similar to members of their assigned cluster than to observations in neighboring clusters, with higher values indicating stronger separation and cohesion. The Calinski–Harabasz index evaluates the ratio of between-cluster dispersion to within-cluster dispersion, with higher values indicating a more distinct partition. In contrast, the Davies–Bouldin index assesses within-cluster scatter relative to between-cluster separation, with lower values indicating a more favorable clustering structure. Cluster sizes were additionally examined to identify solutions that produced disproportionately small groups.
Because internal validation indices alone do not establish whether a solution is reproducible under changes in model initialization, the stability of the K-means solutions was evaluated across repeated independent runs. Candidate solutions for K = 2, K = 3, and K = 4 were each estimated 50 times using different random seeds, with 50 initial centroid configurations evaluated within each run. Agreement among the resulting cluster assignments was quantified by calculating the Adjusted Rand Index (ARI) for all pairwise combinations of the 50 solutions [27]. ARI measures similarity between alternative partitions while correcting for agreement expected by chance; values approaching 1 indicate highly consistent cluster assignments. Because ARI is invariant to permutations of cluster labels, no manual label alignment was required when comparing alternative cluster assignments.
A more stringent resampling-based stability analysis was subsequently conducted to evaluate whether the identified cluster structures persisted when the analytical sample was perturbed [28]. For each of the K = 2, K = 3, and K = 4 solutions, K-means clustering was repeatedly estimated using random 80% subsamples of the analytical dataset across 100 repetitions. Cluster assignments obtained from each subsample were compared with the corresponding reference solution for the same observations using ARI. The distribution of ARI values across repetitions—including the mean, median, standard deviation, minimum, and selected percentiles—was used to assess the reproducibility of each candidate solution under changes in sample composition.
Finally, PCA-based robustness analysis was conducted to examine whether the clustering structure depended excessively on the original 11-dimensional feature representation. PCA was applied to the transformed and standardized clustering features, and the number of principal components required to retain approximately 85% of the total variance was determined. The first seven principal components, which together accounted for approximately 85% of the variance, were retained. K-means solutions for K = 2, K = 3, and K = 4 were then re-estimated in this reduced-dimensional space and evaluated using the same internal validation indices. This analysis provided an additional assessment of whether the principal clustering patterns remained observable after reducing feature redundancy and dimensionality.
The final number of clusters was determined through the joint interpretation of internal validity, cluster-size adequacy, initialization stability, resampling stability, PCA-based robustness, and substantive interpretability of the resulting behavioral profiles. No single validation index was treated as a definitive selection criterion. Instead, preference was given to a solution that provided a reproducible and behaviorally informative representation of customer heterogeneity while avoiding unnecessary fragmentation of the customer population.
Importantly, the final K = 3 solution was selected exclusively on the basis of the unsupervised validation criteria and substantive interpretability described above, before purchase-status results were examined. Purchase information therefore played no role in determining the number of clusters or the final segmentation solution.
2.7. External Validation Using Purchase Behavior
Following the identification and validation of the behavioral segments, their external relevance was assessed using the binary purchase-status variable (PURCHASED). As described in Section 2.1, the behavioral information used to construct the segments preceded the customer contact from which the purchase outcome was obtained. Because PURCHASED was excluded from segment construction, this analysis provided an external assessment of whether the independently derived behavioral profiles were associated with differences in observed purchasing behavior.
For each identified cluster, the number and proportion of customers with positive and negative purchase status were calculated. Cluster-specific purchase rates were then compared with the overall purchase rate of the analytical sample. To facilitate interpretation of the commercial relevance of each segment, purchase lift was calculated as the ratio between the purchase rate within a given cluster and the overall purchase rate:
where represents the purchase lift for cluster k. A value greater than 1 indicates a purchase rate above the overall sample average, whereas a value below 1 indicates a comparatively lower purchase rate.
The overall association between behavioral segment membership and purchase status was evaluated using Pearson’s chi-square test of independence. Because statistical significance alone does not indicate the magnitude of an association, Cramér’s V was additionally calculated as an effect-size measure. This allowed the analysis to distinguish between evidence of an association and the substantive strength of that relationship.
Following the overall chi-square test, pairwise comparisons of purchase proportions were conducted to determine which cluster pairs differed in their observed purchase rates. Two-sample tests of proportions were applied to each pair of clusters. Because multiple pairwise comparisons increase the probability of Type I error, the resulting p-values were adjusted using the Holm procedure. Statistical significance was evaluated at an alpha level of 0.05 after adjustment.
This external validation framework was intended to assess the criterion-related relevance of the behavioral segmentation rather than to optimize the clusters for purchase prediction. Accordingly, differences in purchase rates were interpreted as an external characteristic of independently identified behavioral profiles, not as evidence that purchase status contributed to their construction. This distinction preserves the unsupervised nature of the segmentation while enabling its relationship with a commercially relevant customer outcome to be evaluated.
3. Results
3.1. Cluster Tendency and Comparative Validation Results
Before estimating the customer segments, the transformed and standardized behavioral feature space was assessed for cluster tendency. The Hopkins statistic produced a mean value of 0.7904 across 20 repetitions, with a standard deviation of 0.0065 and values ranging from 0.7753 to 0.8018. The consistently elevated Hopkins values indicated that the customer data exhibited a clear non-random structure and therefore provided empirical support for proceeding with cluster analysis.
Candidate solutions containing between 2 and 8 clusters were subsequently estimated using K-means, agglomerative clustering with Ward linkage, and Gaussian mixture modeling (GMM). Table 5 presents the corresponding Silhouette, Calinski–Harabasz, and Davies–Bouldin indices together with the minimum and maximum cluster sizes for each solution.
Table 5.
Internal validation results for alternative clustering algorithms and numbers of clusters.
Across the candidate solutions, K-means consistently provided stronger internal validation performance than the alternative clustering approaches, particularly in terms of Silhouette and Calinski–Harabasz values. The two-cluster K-means solution achieved the highest overall Silhouette coefficient (0.1587) and Calinski–Harabasz index (198.3310). Increasing the number of K-means clusters to three produced only a modest reduction in these indices, with a Silhouette coefficient of 0.1488 and a Calinski–Harabasz value of 161.5547. The three-cluster solution also produced highly balanced segment sizes, ranging from 293 to 352 customers, corresponding to approximately 30–36% of the analytical sample.
The Davies–Bouldin criterion exhibited a somewhat different pattern. Its lowest value among all candidate solutions was obtained for the eight-cluster K-means solution (1.8493). However, increasing the number of clusters progressively fragmented the sample: the smallest K-means cluster decreased from 293 customers at K = 3 to 103 at K = 4, 92 at K = 5, and 48 at K = 8. Similar fragmentation was evident for the higher-order Ward and GMM solutions, including minimum cluster sizes of only 6 and 10 customers, respectively, at K = 8 and K = 7.
Taken together, the comparative results identified K-means as the strongest candidate algorithm, while the number of clusters required further evaluation. Although the two-cluster solution provided the strongest performance on two internal indices, the three-cluster solution retained comparable internal validity while providing a more differentiated and balanced representation of customer heterogeneity. Accordingly, K = 2, K = 3, and K = 4 were subjected to the additional stability and robustness analyses reported in Section 3.2 before selecting the final segmentation solution.
3.2. Selection and Robustness of the Final Three-Cluster Solution
Following the comparative internal validation, the K-means solutions for K = 2, K = 3, and K = 4 were subjected to additional stability and robustness analyses. Repeated-initialization analysis indicated a high degree of reproducibility across all three candidate solutions. The two-cluster solution was perfectly stable across independent runs, with a mean ARI of 1.0000. Stability also remained very high for the three- and four-cluster solutions, with mean ARI values of 0.9887 and 0.9788, respectively. For K = 3, the median ARI was 0.9941, with values ranging from 0.9509 to 1.0000, indicating that the three-cluster structure was highly insensitive to changes in random initialization.
A more demanding assessment was provided by the 80% subsampling analysis, which evaluated the extent to which cluster assignments were preserved when the composition of the analytical sample was perturbed. As expected, the two-cluster solution exhibited the highest stability, with a mean ARI of 0.9711 across 100 repetitions. The three-cluster solution produced a mean ARI of 0.8752 and a median of 0.9051, with the 5th and 95th percentiles equal to 0.7123 and 0.9631, respectively. The four-cluster solution yielded a slightly higher mean ARI of 0.8861 but a lower median of 0.8908 and a substantially lower minimum value of 0.4683. Thus, although the additional clusters introduced some sensitivity to sample perturbation relative to K = 2, both K = 3 and K = 4 retained substantial reproducibility, with the three-cluster solution exhibiting a comparatively consistent stability profile. The initialization and resampling stability results for the three candidate solutions are summarized in Table 6.
Table 6.
Stability assessment of candidate K-means solutions.
The robustness of the candidate solutions was further examined after reducing the 11-dimensional feature space using PCA. The first seven principal components explained 85.00% of the total variance. When K-means clustering was repeated using these seven components, the internal validation results improved relative to those obtained in the original feature space. The two-cluster solution again achieved the highest Silhouette coefficient (0.1875) and Calinski–Harabasz index (241.7760). However, the three-cluster solution remained close, with a Silhouette coefficient of 0.1800 and a Calinski–Harabasz index of 201.6793, while maintaining balanced cluster sizes ranging from 290 to 350 customers. The four-cluster solution achieved the lowest Davies–Bouldin value (1.6956), but again contained a substantially smaller cluster of 103 customers. The corresponding PCA-based internal validation results are presented in Table 7.
Table 7.
Internal validation results for K-means solutions in the PCA-reduced feature space.
To clarify the additional behavioral differentiation provided by K = 3, the two-cluster and three-cluster solutions were also compared directly. The K = 2 solution primarily separated a higher-engagement group (N= 520), characterized by greater billing, voice and data usage, messaging engagement, and positive usage trajectories, from a longer-tenure, lower-engagement group (N = 454). When moving to K = 3, the latter group largely corresponded to Cluster 0, whereas the higher-engagement K = 2 group was further differentiated between Clusters 1 and 2: 57.3% were assigned to Cluster 1 and 42.7% to Cluster 2. Thus, the third cluster primarily revealed additional heterogeneity within the broader higher-engagement group, separating an established high-intensity multi-service profile from a shorter-tenure profile characterized by stronger positive usage trajectories. As examined further below, however, the stability of this temporal distinction was partly sensitive to observation-window length.
Considering the validation evidence jointly, the three-cluster K-means solution was retained as the final segmentation. The two-cluster solution provided the strongest statistical separation and stability, but represented a comparatively coarse partition of the behavioral space. In contrast, moving from two to three clusters introduced an additional behavioral distinction while preserving balanced cluster sizes, very high initialization stability, substantial resampling reproducibility, and comparable performance after PCA-based dimensionality reduction. Moving to four or more clusters provided no consistent improvement across the validation criteria and increasingly fragmented the customer population.
Assignment agreement between the original-space and PCA-based K = 3 solutions was also very high (ARI = 0.9583), indicating that the three-cluster structure was largely preserved after dimensionality reduction. Figure 2 provides a two-dimensional visualization of the final K = 3 assignments using the first two principal components, which together explain 41.49% of the total variance. The visualization shows differentiated regions of the behavioral space while also revealing substantial overlap, particularly near the cluster boundaries. This pattern is consistent with the relatively low Silhouette coefficients and indicates that the segments should not be interpreted as sharply separated or compact customer groups.
Figure 2.
Two-dimensional PCA visualization of the final K = 3 customer segments. The first two principal components explain 41.49% of the total variance.
Accordingly, the choice of K = 3 should be interpreted as a balance between statistical adequacy, reproducibility, and behavioral differentiation, rather than as the numerical optimum of any single internal validation index. The final three-cluster solution comprised 352 customers (36.14%), 329 customers (33.78%), and 293 customers (30.08%), respectively. The behavioral characteristics distinguishing these three segments are examined in Section 3.3.
The mean numbers of observed customer-months were 26.74, 27.98, and 14.26 for Clusters 0, 1, and 2, respectively, with corresponding medians of 34, 34, and 11 months. Given the shorter observation history of Cluster 2, an additional sensitivity analysis was conducted to examine whether unequal observation histories influenced the segmentation. A common window consisting of the six most recent observed customer-month records was used for each customer in the original analytical sample. After reconstructing the behavioral features using this fixed observation window, 963 customers had complete information for all features. The resulting three-cluster solution produced a Silhouette coefficient of 0.1433, similar to that of the original three-cluster solution (0.1488). However, agreement between the original and fixed-window cluster assignments was modest (ARI = 0.3083). Cluster-specific retention rates were also heterogeneous: 87.5% of customers originally assigned to Cluster 0 remained together in the corresponding fixed-window grouping, whereas the original Clusters 1 and 2 showed greater redistribution. These findings indicate that the overall degree of three-cluster separation was similar under a common observation window, but individual segment membership was sensitive to observation-window length.
3.3. Behavioral Profiles of the Identified Customer Segments
The final three-cluster solution produced three relatively balanced customer segments comprising 352 (36.14%), 329 (33.78%), and 293 (30.08%) customers. Examination of the raw feature distributions and standardized cluster centroids revealed distinct patterns across relationship maturity, billing behavior, voice and mobile-data usage, temporal trajectories, and messaging engagement.
The descriptive names assigned to the three clusters are interpretive labels based on their dominant behavioral characteristics and are used to facilitate discussion; they should not be regarded as objectively established customer categories.
Table 8 summarizes the raw means, medians and interquartile ranges (IQRs), together with the standardized centroids of the 11 behavioral features across the three segments. The within-cluster dispersion further indicates that the identified segments represent overlapping behavioral profiles rather than sharply separated customer groups.
Table 8.
Behavioral profiles and within-cluster dispersion of the final three-cluster solution.
Cluster 0 (C0) was characterized primarily by long-established customer relationships combined with relatively low service intensity. Customers in this segment had the highest average tenure (91.39 months) but the lowest average billing amount (320.26), voice usage (16,916.16), mobile-data consumption (4.78 GB), and SMS active ratio (0.349). Mobile-data variability was also markedly higher than in the other segments (DATA_CV = 0.874; standardized centroid = 0.823). The standardized profile therefore suggests a mature but comparatively low-engagement customer group, particularly with respect to digital service usage. On this basis, Cluster 0 can be characterized as Established Low-Engagement Customers.
Cluster 1 (C1) exhibited the highest overall levels of customer activity and monetary engagement. Its members had the highest average billing amount (689.98), voice usage (35,194.64), and mobile-data consumption (26.03 GB), together with the highest SMS active ratio (0.748). Billing behavior was also distinguished by both greater relative variability (BILL_CV = 0.604) and a stronger positive trajectory (BILL_SLOPE = 34.164). Although these customers had long-established relationships with the provider (mean tenure = 73.92 months), their defining characteristic was the consistently elevated intensity of activity across multiple service dimensions. Cluster 1 was therefore characterized as High-Intensity Multi-Service Customers.
Cluster 2 (C2) displayed a substantially different temporal profile. Customers in this segment had by far the shortest average tenure (14.51 months) but already exhibited relatively high voice usage (25,844.38), mobile-data consumption (22.94 GB), and messaging engagement (SMS active ratio = 0.624). Most notably, Cluster 2 exhibited substantially stronger positive trajectories in voice usage (VOICE_SLOPE = 777.68) and mobile-data consumption (DATA_SLOPE_GB = 0.765) than the other two segments. At the same time, billing and data variability were comparatively low. These characteristics indicate a relatively recent customer group whose service engagement was developing rapidly over the observed period. Cluster 2 was therefore characterized as Emerging High-Growth Customers. Accordingly, the shorter observation histories of Cluster 2 should be regarded as part of its empirical profile, while its strong positive trajectories should be interpreted cautiously because the sensitivity analysis indicates that temporal segment membership is partly dependent on observation-window length.
Overall, the three-cluster solution differentiated customers in terms of relationship maturity, service-use intensity, behavioral variability, and temporal trajectory. Cluster 0 was characterized by longer tenure and comparatively low service usage, Cluster 1 by high multi-service activity and relatively stable behavioral patterns, and Cluster 2 by shorter tenure and strongly positive usage trajectories.
3.4. Association Between Behavioral Segments and Purchase Behavior
After establishing the three behavioral segments independently of purchase status, the segments were compared in terms of observed purchasing behavior. The overall purchase rate in the final analytical sample was 27.93%, corresponding to 272 purchasers among 974 customers. Purchase rates differed across the three behavioral segments, ranging from 22.18% to 33.43% (Table 9).
Table 9.
Purchase behavior across the identified customer segments.
As an additional robustness analysis, a binary logistic regression was estimated to examine whether the association between segment membership and purchase behavior could be attributed to differences in customer tenure. With Cluster 0 as the reference category, neither Cluster 1 (OR = 1.328, 95% CI [0.955, 1.846], p = 0.092) nor Cluster 2 (OR = 0.768, 95% CI [0.517, 1.139], p = 0.189) differed significantly from Cluster 0 after controlling for tenure. Customer tenure itself was not significantly associated with purchase behavior (OR = 1.0003, 95% CI [0.9983, 1.0024], p = 0.767). These findings indicate that differences in relationship duration do not explain the observed segment-level variation in purchase behavior and further support interpreting the association as modest rather than strong.
The High-Intensity Multi-Service Customers (Cluster 1) exhibited the highest purchase rate, with 33.43% of customers having a positive purchase status. This corresponded to a purchase lift of 1.20, indicating a purchase rate approximately 20% above the overall sample rate. In contrast, the Emerging High-Growth Customers (Cluster 2) exhibited the lowest purchase rate at 22.18%, corresponding to a lift of 0.79. The purchase rate among Established Low-Engagement Customers (Cluster 0) was 27.56%, closely matching the overall sample rate and producing a lift of 0.99.
The overall association between behavioral segment membership and purchase status was statistically significant, χ2(2) = 9.783, p = 0.0075. However, the corresponding Cramér’s V of 0.100 indicated that the magnitude of the association was modest. Thus, although purchase behavior was not distributed uniformly across the three independently derived behavioral segments, segment membership was associated with only a limited degree of differentiation in purchase status.
Pairwise comparisons provided further insight into the source of the overall association (Table 10). After Holm correction for multiple comparisons, a statistically significant difference was observed only between the High-Intensity Multi-Service Customers (Cluster 1) and the Emerging High-Growth Customers (Cluster 2). Their purchase rates differed by 11.25 percentage points (33.43% vs. 22.18%; z = 3.115, Holm-adjusted p = 0.0055). The difference between Clusters 0 and 1 (27.56% vs. 33.43%; adjusted p = 0.1913) and that between Clusters 0 and 2 (27.56% vs. 22.18%; adjusted p = 0.1913) was not statistically significant after adjustment.
Table 10.
Pairwise comparisons of purchase rates with Holm correction.
Overall, purchase behavior differed significantly across the three behavioral segments, although the magnitude of the association was modest. The largest difference was observed between High-Intensity Multi-Service Customers and Emerging High-Growth Customers, whose purchase rates differed by 11.25 percentage points.
4. Discussion
4.1. Interpretation of the Main Findings
The findings of this study demonstrate that meaningful customer heterogeneity can be identified when longitudinal service behavior is represented through multiple complementary dimensions rather than through average activity levels alone. The final segmentation distinguished three behaviorally coherent customer profiles—Established Low-Engagement Customers, High-Intensity Multi-Service Customers, and Emerging High-Growth Customers—that differed in relationship maturity, service-use intensity, behavioral variability, temporal trajectories, and messaging engagement. These findings are consistent with the broader customer-segmentation literature demonstrating that clustering can reveal heterogeneous customer structures from behavioral, transactional, demographic, and service-related information [4,5,6,7,8,9,10,11,12,13,14,15]. Prior studies have applied K-means and alternative clustering approaches across retail, e-commerce, direct marketing, fintech, and mobile-service contexts [4,5,6,7,8,9,10,11,12,13,14,15], collectively illustrating that multidimensional customer representations can provide a richer basis for profiling than undifferentiated aggregate customer populations.
The most important distinction in the present findings concerns the difference between behavioral intensity and behavioral development. High-Intensity Multi-Service Customers exhibited the highest billing levels and the most intensive voice, mobile-data, and messaging activity while also maintaining relatively mature customer relationships. Emerging High-Growth Customers, in contrast, had substantially shorter relationships but already displayed comparatively high service usage together with markedly stronger positive trajectories in voice and mobile-data activity. Consequently, these two groups might appear more similar if customer behavior were represented predominantly by average consumption, whereas their longitudinal profiles reveal fundamentally different behavioral states: one reflects established intensive engagement, while the other reflects rapidly developing engagement.
This distinction aligns closely with research emphasizing the temporal dimension of customer behavior. Wang et al. [16] combined LRFMS-based customer characteristics with multivariate time-series clustering to capture dynamic customer segmentation, while Abbasimehr and Shabani [17] developed a time-series clustering methodology specifically for analyzing changing customer behavior. Wilson et al. [18] similarly examined short temporal behavioral sequences for customer segmentation. Beyond clustering itself, recent studies have emphasized the analytical value of representing customer behavior dynamically for personalization and real-time purchase-related analytics [29,30]. Together, these studies indicate that customer behavior should not necessarily be conceptualized as a fixed state and that temporal information can reveal differences that may be obscured by static representations [16,17,18,29,30].
The present study complements this stream of research through a different but related longitudinal representation strategy. Rather than directly clustering complete behavioral sequences, each customer’s longitudinal history was transformed into an interpretable feature space combining behavioral intensity, relative variability, and customer-specific temporal trajectory, together with messaging engagement and relationship maturity. This approach retains information about behavioral development while preserving direct interpretability at both the feature and segment levels. The empirical distinction between established intensive engagement and emerging behavioral growth demonstrates the value of this representation: customers with comparatively high service activity could still be differentiated according to whether that activity reflected an established behavioral pattern or a rapidly developing one. The findings therefore complement dynamic and temporal approaches in prior research [16,17,18,29,30] by demonstrating the usefulness of interpretable longitudinal behavioral descriptors for customer segmentation.
The Established Low-Engagement Customers provide complementary insight into the relationship between customer maturity and service engagement. Despite having the longest customer relationships, these customers exhibited the lowest billing, voice, mobile-data, and messaging activity, together with comparatively high variability in mobile-data consumption. Longer relationship duration therefore did not necessarily correspond to more intensive or stable service engagement. This finding is particularly relevant to telecommunications and mobile-service segmentation, where multidimensional customer information has long been recognized as important for identifying heterogeneous customer profiles [15,19,20,21]. Bayer [19] established the relevance of segmentation specifically within telecommunications, while Sharaf Addin et al. [20] demonstrated the use of machine-learning-based behavioral segmentation in a telecom context. Alkhayrat et al. [21] further showed the relevance of dimensionality reduction and multidimensional representations in telecom customer segmentation, and Rodrigues et al. [15] recently demonstrated how behavioral patterns extracted from mobile-phone data can support differentiated profile construction. Viewed alongside these studies, the present findings suggest that relationship maturity is most informative when interpreted jointly with the intensity, stability, and temporal development of observed service behavior.
The external validation results further demonstrate that the identified behavioral heterogeneity has commercial relevance. Purchase rates differed significantly across the three behavioral segments. High-Intensity Multi-Service Customers exhibited the highest purchase rate (33.43%), compared with 27.56% among Established Low-Engagement Customers and 22.18% among Emerging High-Growth Customers. The overall association was statistically significant but modest in magnitude, and the pairwise results showed that the principal difference occurred between the High-Intensity Multi-Service and Emerging High-Growth segments, whose purchase rates differed by 11.25 percentage points.
Although purchase rates differed significantly across the segments, the small effect size (Cramér’s V = 0.100), overlapping confidence intervals, and tenure-adjusted analysis indicate that segment membership provides only modest differentiation in purchase behavior. The segments should therefore be interpreted as behavioral customer profiles with complementary commercial relevance rather than as strong predictors of individual purchasing decisions.
This result is particularly informative because both segments displayed comparatively high service activity. High current usage or rapid usage growth therefore did not correspond to equivalent observed purchasing behavior. Previous customer analytics research has connected customer profiling and segmentation with purchase behavior and commercially relevant outcomes [5,10,11,30], while research in digital commerce has also emphasized the importance of understanding heterogeneous customer responses, engagement, personalization, and purchase-related behavior [1,2,3].
At the same time, the modest effect size is important for interpreting this relationship appropriately. The segmentation should not be understood as a purchase-prediction model. Rather, it identifies underlying behavioral heterogeneity that is subsequently shown to have an association with purchase status. This distinction is consistent with the broader analytical separation between customer profiling and outcome prediction: segmentation seeks to uncover meaningful structures among customers, whereas predictive models are optimized toward a predefined outcome [11,30]. Moreover, because the present analysis is observational, the differences between segments cannot establish that tenure, service intensity, variability, or behavioral growth causes purchasing behavior.
Overall, the findings address the three research questions by identifying distinct longitudinal customer profiles that differ in behavioral intensity, variability, temporal development, and relationship maturity, while also exhibiting differences in observed purchase behavior. Taken together, the results suggest that customer heterogeneity in longitudinal digital-service environments can be more comprehensively understood by considering not only how much customers engage, but also how consistently their behavior develops, how it changes over time, and how mature their service relationships are.
4.2. Theoretical Implications
First, this study advances a multidimensional conceptualization of longitudinal customer behavior by distinguishing behavioral intensity, variability, and trajectory. While established segmentation research demonstrates the value of behavioral and transactional information for identifying heterogeneous customer groups [4,5,6,7,8,9,10,11,12,13,14,15], dynamic customer analytics increasingly shows that temporal information can reveal differences obscured by static representations [16,17,18,29,30]. The present framework builds on this perspective by representing not only the level of customer activity, but also its stability and direction of development. These dimensions are related but not interchangeable: customers with similar average activity may differ substantially in behavioral consistency or trajectory. This provides an interpretable representation of temporal customer heterogeneity without requiring complete behavioral sequences to be clustered directly.
The findings further show that relationship maturity provides important context for interpreting these longitudinal behavioral patterns. Similar levels of service activity represented different customer states depending on whether they reflected established high-intensity engagement or shorter-tenure behavioral growth. Likewise, the longest customer relationships did not necessarily correspond to the highest levels of service engagement. Relationship maturity and behavioral engagement should therefore be treated as distinct but complementary dimensions of customer heterogeneity. This extends multidimensional perspectives in telecommunications and mobile-service segmentation [15,19,20,21] by showing how behavioral level, stability, trajectory, engagement, and relationship maturity can jointly characterize customer states.
Second, the study reinforces the conceptual separation between behavioral segmentation and outcome-oriented prediction. Purchase and monetary characteristics are frequently incorporated directly into customer representations [5,10,11], while predictive customer analytics explicitly optimize models toward purchase-related outcomes [30]. By excluding purchase status from segment construction and introducing it only as an external validation criterion, the present framework treats behavioral heterogeneity and commercial outcomes as related but analytically distinct constructs. Segmentation seeks to uncover underlying structures in customer behavior, whereas predictive models are optimized toward predefined outcomes. Maintaining this distinction allows the commercial relevance of independently derived behavioral segments to be evaluated without defining those segments through the outcome itself.
Third, the study contributes methodologically by adopting a multidimensional view of cluster validity. Previous research has emphasized the comparison of alternative clustering methods and validation criteria [6,7,8,9,21]. The present framework extends this approach by combining internal validity, cluster-size adequacy, repeated-initialization stability, resampling-based reproducibility, PCA-based robustness, and substantive interpretability. This supports the view that the selection of a customer-segmentation solution should not be reduced to the optimization of a single numerical index, but should reflect the joint consideration of statistical adequacy, reproducibility, parsimony, and behavioral interpretability.
Finally, the findings qualify the assumption that increasing service activity necessarily represents a commercially stronger customer state. The Emerging High-Growth segment exhibited strong positive usage trajectories but the lowest observed purchase rate, whereas the High-Intensity Multi-Service segment showed the highest purchase rate. Although this association was modest and should not be interpreted causally, it suggests that behavioral growth and commercial response represent related but non-equivalent dimensions of customer development. Thus, customer heterogeneity is better understood in terms of behavioral state and development over the customer relationship rather than behavioral magnitude alone.
4.3. Managerial Implications
The findings provide practical implications for customer relationship management in telecommunications and other digital service environments. Most importantly, the identified segments can support differentiated customer-management strategies by distinguishing customers according to the nature and developmental stage of their service relationship. Behavioral segmentation has similarly been proposed as a means of translating heterogeneous customer information into actionable groups for targeted customer management [11,19,20].
For Established Low-Engagement Customers, the combination of long tenure and relatively low service usage suggests a need to better understand the reasons for their limited engagement. The available behavioral data do not indicate whether this pattern is related to plan characteristics, secondary-line usage, customer preferences, or other factors. Therefore, additional customer- or service-level information may be needed before developing targeted strategies for this segment. Importantly, long tenure should not by itself be interpreted as evidence of strong engagement.
For High-Intensity Multi-Service Customers, managerial attention may instead focus on maintaining and developing an already broad service relationship. Their pattern of engagement makes retention initiatives, loyalty programs, service bundling, and carefully targeted cross-selling particularly relevant managerial options. Previous research has emphasized the role of customer profiling and segmentation in supporting differentiated marketing and sales strategies [5,10,11], while personalization research highlights the importance of tailoring customer interactions to heterogeneous customer characteristics and responses [1,2,3]. The present segmentation provides a behavioral basis upon which such differentiated strategies could be developed.
The Emerging High-Growth Customers require a different managerial interpretation. Their rapidly developing service behavior should not automatically be treated as equivalent to established commercial engagement. Instead, this segment may represent an opportunity for relationship-development strategies, including onboarding support, progressive service introduction, and timely engagement designed to accompany the customer’s developing usage pattern. The distinction is practically important because targeting customers solely according to current usage intensity could lead managers to treat established intensive users and rapidly developing customers as equivalent, despite their different relationship stages and observed purchase patterns.
More broadly, the results support the use of trajectory-aware customer management. Customer analytics systems could incorporate indicators of behavioral direction and stability alongside conventional measures of current activity, enabling managers to distinguish customers whose engagement is stable, increasing, declining, or highly variable. Such information may help organizations determine not only which customers differ, but also how their relationships are developing, thereby providing a more informative basis for timing retention, engagement, cross-selling, and personalization initiatives.
Finally, behavioral segments should be regarded as decision-support tools rather than deterministic indicators of future purchasing. The modest association observed between segment membership and purchase status indicates that the segmentation can enrich commercial customer understanding but does not provide a complete basis for individualized marketing decisions. In practice, longitudinal segmentation can provide interpretable customer profiles for strategic decision making, while supervised models can be used when the objective is to predict a specific customer outcome [11,30,31,32,33,34]. The actionability of these profiles could be further improved by combining behavioral information with demographic, plan-level, or customer-feedback data.
4.4. Limitations and Future Research
This study has several limitations that provide directions for future research. First, the analysis was conducted within a single industry context—telecommunications—and using data from one service environment. Customer usage patterns and relationship dynamics may differ across industries, providers, and geographic markets; therefore, the specific segment structure identified here should not be assumed to generalize directly to other contexts. Future studies could apply the proposed framework across different industries and service environments to assess its broader applicability.
Second, longitudinal behavior was represented through interpretable customer-level measures of intensity, variability, and linear temporal trajectory. Although this representation facilitates behavioral interpretation, it may not fully capture non-linear, seasonal, episodic, or abrupt behavioral changes. Future research could compare this approach with non-linear trajectories, rolling indicators, change-point methods, sequence representations, or direct time-series clustering.
Third, the analysis was limited to the behavioral and relationship variables available in the underlying datasets, while purchase behavior was represented only by a binary purchase outcome. The available data did not include product-level or monetary information, detailed purchase histories, or additional customer characteristics such as demographics, service plans, pricing, channel interactions, and satisfaction. Incorporating such information in future research could provide a richer representation of customer heterogeneity and enable a more comprehensive examination of the relationship between behavioral profiles and commercial outcomes.
Finally, the framework identifies customer segments from their observed longitudinal histories but does not explicitly model transitions between behavioral states over time. Future research could construct customer representations across successive observation windows to examine movement between segments and determine whether customers systematically transition between low-engagement, emerging-growth, and established high-intensity states. Such an extension would provide a more explicitly dynamic perspective on customer relationship development.
5. Conclusions
This study investigated customer heterogeneity through a longitudinal behavioral segmentation framework incorporating behavioral intensity, variability, temporal trajectories, service engagement, and relationship maturity. Using longitudinal telecommunications data, the analysis identified three distinct customer profiles: Established Low-Engagement Customers, High-Intensity Multi-Service Customers, and Emerging High-Growth Customers. The findings demonstrate that customer heterogeneity cannot be fully characterized by average service activity alone.
By representing longitudinal behavior in terms of level, stability, and direction of change, the proposed framework differentiated customers with similar levels of activity according to their behavioral development and relationship maturity. The external validation further showed that the independently derived segments differed in observed purchase behavior, although the magnitude of the association was modest.
Overall, the findings support a shift from predominantly static or intensity-based customer profiling toward a more trajectory-aware understanding of customer relationships. Incorporating how consistently and in what direction customer behavior develops can provide an interpretable basis for longitudinal customer segmentation and differentiated customer relationship management.
Author Contributions
Conceptualization, B.O.K. and V.C.; methodology, B.O.K. and V.C.; software, V.C.; validation, B.O.K. and V.C.; formal analysis, B.O.K. and V.C.; investigation, B.O.K., V.C., L.O. and H.A.M.; resources, L.O.; data curation, V.C. and L.O.; writing—original draft preparation, B.O.K. and V.C.; writing—review and editing, B.O.K. and V.C.; visualization, B.O.K.; supervision, V.C. and H.A.M.; project administration, V.C., L.O. and H.A.M. All authors have read and agreed to the published version of the manuscript.
Funding
This research received no external funding.
Institutional Review Board Statement
The study involved secondary analysis of customer-level data provided by the collaborating telecommunications company under authorization for academic research. Direct personal identifiers were removed by the data provider before the dataset was made available to the research team, and the researchers had no access to directly identifiable personal information. The analysis was conducted exclusively on the anonymized dataset provided for the study.
Informed Consent Statement
Not applicable. The study was based on anonymized secondary customer records and involved no direct interaction with individual customers.
Data Availability Statement
The data supporting the findings of this study were provided by a telecommunications company under permission for research use. The dataset is not publicly available due to confidentiality and commercial restrictions. All customer-level records used in the analysis were anonymized.
Acknowledgments
The authors would like to thank the telecommunications company that provided the anonymized data used in this study.
Conflicts of Interest
L.O. is an employee of the telecommunications company that provided the anonymized dataset used in this study. Her involvement included investigation, resources, data curation, and project administration, as reported in the Author Contributions statement. The analytical methodology, statistical analyses, and interpretation of the results were conducted independently by the academic research team. The remaining authors declare no conflicts of interest.
References
- Subawa, N.S.; Nariswari, N.P.C.A.; Dewi, M.M.; Wiranata, A.A.G.; Mimaki, C.A.; Utami, M.S.M. Understanding Customer Engagement Behavior in Virtual Try-On Services: Evidence from Indonesia. J. Theor. Appl. Electron. Commer. Res. 2026, 21, 155. [Google Scholar] [CrossRef] [Scilit]
- Jattamart, A.; Nusawat, P.; Kwangsawad, A. Dual Customer Responses to AI Chatbots in Online Shopping: An Integrated AIDUA–SOR Framework. J. Theor. Appl. Electron. Commer. Res. 2026, 21, 146. [Google Scholar] [CrossRef] [Scilit]
- Magano, J.; Rebelo, S. Trust-First Personalization in Fashion E-Commerce: An Association-Based Model Linking Perceived Personalization, Surveillance, Privacy-Violation, and Purchase Intention. J. Theor. Appl. Electron. Commer. Res. 2026, 21, 139. [Google Scholar] [CrossRef] [Scilit]
- Kansal, T.; Bahuguna, S.; Singh, V.; Choudhury, T. Customer Segmentation Using K-Means Clustering. In Proceedings of the 2018 International Conference on Computational Techniques, Electronics and Mechanical Systems (CTEMS), Belagavi, India, 21–23 December 2018; pp. 135–139. [Google Scholar]
- Tabianan, K.; Velu, S.; Ravi, V. K-Means Clustering Approach for Intelligent Customer Segmentation Using Customer Purchase Behavior Data. Sustainability 2022, 14, 7243. [Google Scholar] [CrossRef] [Scilit]
- John, J.M.; Shobayo, O.; Ogunleye, B. An Exploration of Clustering Algorithms for Customer Segmentation in the UK Retail Market. Analytics 2023, 2, 809–823. [Google Scholar] [CrossRef] [Scilit]
- Ling, L.S.; Weiling, C.T. Enhancing Segmentation: A Comparative Study of Clustering Methods. IEEE Access 2025, 13, 47418–47439. [Google Scholar] [CrossRef] [Scilit]
- Wu, R.S.; Chou, P.H. Customer Segmentation of Multiple Category Data in E-Commerce Using a Soft-Clustering Approach. Electron. Commer. Res. Appl. 2011, 10, 331–341. [Google Scholar] [CrossRef] [Scilit]
- Namvar, M.; Gholamian, M.R.; KhakAbi, S. A Two Phase Clustering Method for Intelligent Customer Segmentation. In Proceedings of the 2010 International Conference on Intelligent Systems, Modelling and Simulation, Liverpool, UK, 27–29 January 2010; pp. 215–219. [Google Scholar]
- Wedel, M.; Kamakura, W.A. Market Segmentation: Conceptual and Methodological Foundations, 2nd ed.; Springer: Boston, MA, USA, 2000. [Google Scholar]
- Kasem, M.S.; Hamada, M.; Taj-Eddin, I. Customer Profiling, Segmentation, and Sales Prediction Using AI in Direct Marketing. Neural Comput. Appl. 2024, 36, 4995–5005. [Google Scholar] [CrossRef] [Scilit]
- Koziel, A.M.; Shen, C.W. Psychographic and Demographic Segmentation and Customer Profiling in Mobile Fintech Services. Kybernetes 2025, 54, 1262–1288. [Google Scholar] [CrossRef] [Scilit]
- Abbasimehr, H.; Bahrini, A. An analytical framework based on the recency, frequency, and monetary model and time series clustering techniques for dynamic segmentation. Expert Syst. Appl. 2022, 192, 116373. [Google Scholar] [CrossRef] [Scilit]
- Luo, L.; Li, B.; Fan, X.; Wang, Y.; Koprinska, I.; Chen, F. Dynamic customer segmentation via hierarchical fragmentation-coagulation processes. Mach. Learn. 2023, 112, 281–310. [Google Scholar] [CrossRef] [Scilit]
- Rodrigues, C.; Alves, A.; Veloso, M.; Bento, C.L. Profile Segmentation: Clustering Approach Based on Behavioral Patterns Extracted from Mobile Phone Data. J. Ambient Intell. Smart Environ. 2025, 17, 265–285. [Google Scholar] [CrossRef] [Scilit]
- Wang, S.; Sun, L.; Yu, Y. A Dynamic Customer Segmentation Approach by Combining LRFMS and Multivariate Time Series Clustering. Sci. Rep. 2024, 14, 17491. [Google Scholar] [CrossRef] [Scilit] [PubMed]
- Abbasimehr, H.; Shabani, M. A New Methodology for Customer Behavior Analysis Using Time Series Clustering: A Case Study on a Bank’s Customers. Kybernetes 2021, 50, 221–242. [Google Scholar] [CrossRef] [Scilit]
- Wilson, J.; Chaudhury, S.; Lall, B. Clustering Short Temporal Behaviour Sequences for Customer Segmentation Using LDA. Expert Syst. 2018, 35, e12250. [Google Scholar] [CrossRef] [Scilit]
- Bayer, J. Customer Segmentation in the Telecommunications Industry. J. Database Mark. Cust. Strategy Manag. 2010, 17, 247–256. [Google Scholar] [CrossRef] [Scilit]
- Sharaf Addin, E.H.; Admodisastro, N.; Mohd Ashri, S.N.S.; Kamaruddin, A.; Chong, Y.C. Customer Mobile Behavioral Segmentation and Analysis in Telecom Using Machine Learning. Appl. Artif. Intell. 2022, 36, 2009223. [Google Scholar] [CrossRef] [Scilit]
- Alkhayrat, M.; Aljnidi, M.; Aljoumaa, K. A Comparative Dimensionality Reduction Study in Telecom Customer Segmentation Using Deep Learning and PCA. J. Big Data 2020, 7, 9. [Google Scholar] [CrossRef] [Scilit]
- Yeo, I.K.; Johnson, R.A. A new family of power transformations to improve normality or symmetry. Biometrika 2000, 87, 954–959. [Google Scholar] [CrossRef] [Scilit]
- Hopkins, B.; Skellam, J.G. A new method for determining the type of distribution of plant individuals. Ann. Bot. 1954, 18, 213–227. [Google Scholar] [CrossRef] [Scilit]
- Rousseeuw, P.J. Silhouettes: A graphical aid to the interpretation and validation of cluster analysis. J. Comput. Appl. Math. 1987, 20, 53–65. [Google Scholar] [CrossRef] [Scilit]
- Caliński, T.; Harabasz, J. A dendrite method for cluster analysis. Commun. Stat. 1974, 3, 1–27. [Google Scholar] [CrossRef] [Scilit]
- Davies, D.L.; Bouldin, D.W. A cluster separation measure. IEEE Trans. Pattern Anal. Mach. Intell. 1979, PAMI-1, 224–227. [Google Scholar] [CrossRef] [Scilit]
- Hubert, L.; Arabie, P. Comparing partitions. J. Classif. 1985, 2, 193–218. [Google Scholar] [CrossRef] [Scilit]
- Ben-Hur, A.; Elisseeff, A.; Guyon, I. A stability based method for discovering structure in clustered data. Pac. Symp. Biocomput. 2002, 7, 6–17. [Google Scholar] [CrossRef] [Scilit]
- Ebadi Jalal, M.; Elmaghraby, A. Analyzing the Dynamics of Customer Behavior: A New Perspective on Personalized Marketing through Counterfactual Analysis. J. Theor. Appl. Electron. Commer. Res. 2024, 19, 1660–1681. [Google Scholar] [CrossRef] [Scilit]
- Alves Gomes, M.; Wönkhaus, M.; Meisen, P.; Meisen, T. TEE: Real-Time Purchase Prediction Using Time Extended Embeddings for Representing Customer Behavior. J. Theor. Appl. Electron. Commer. Res. 2023, 18, 1404–1418. [Google Scholar] [CrossRef] [Scilit]
- Yan, L.; Wolniewicz, R.H.; Dodier, R. Predicting customer behavior in telecommunications. IEEE Intell. Syst. 2004, 19, 50–58. [Google Scholar] [CrossRef]
- Khodabandehlou, S.; Zivari Rahman, M. Comparison of supervised machine learning techniques for customer churn prediction based on analysis of customer behavior. J. Syst. Inf. Technol. 2017, 19, 65–93. [Google Scholar] [CrossRef] [Scilit]
- Alves Gomes, M.; Meisen, T. A Review on Customer Segmentation Methods for Personalized Customer Targeting in E-Commerce Use Cases. Inf. Syst. E-Bus. Manag. 2023, 21, 527–570. [Google Scholar] [CrossRef] [Scilit]
- Salminen, J.; Mustak, M.; Sufyan, M.; Jansen, B.J. How Can Algorithms Help in Segmenting Users and Customers? A Systematic Review and Research Agenda for Algorithmic Customer Segmentation. J. Mark. Anal. 2023, 11, 677–692. [Google Scholar] [CrossRef] [Scilit]
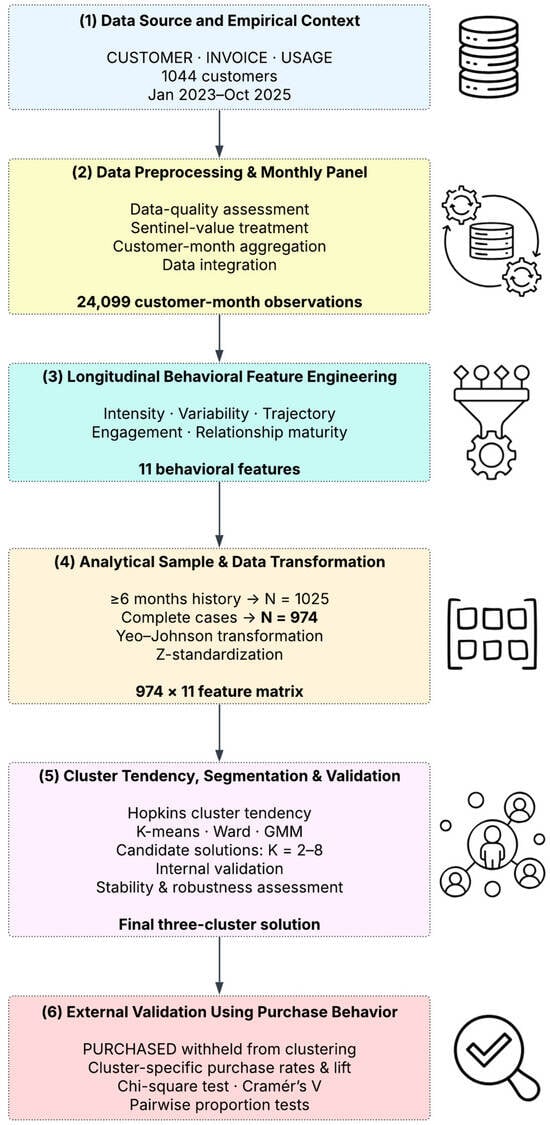
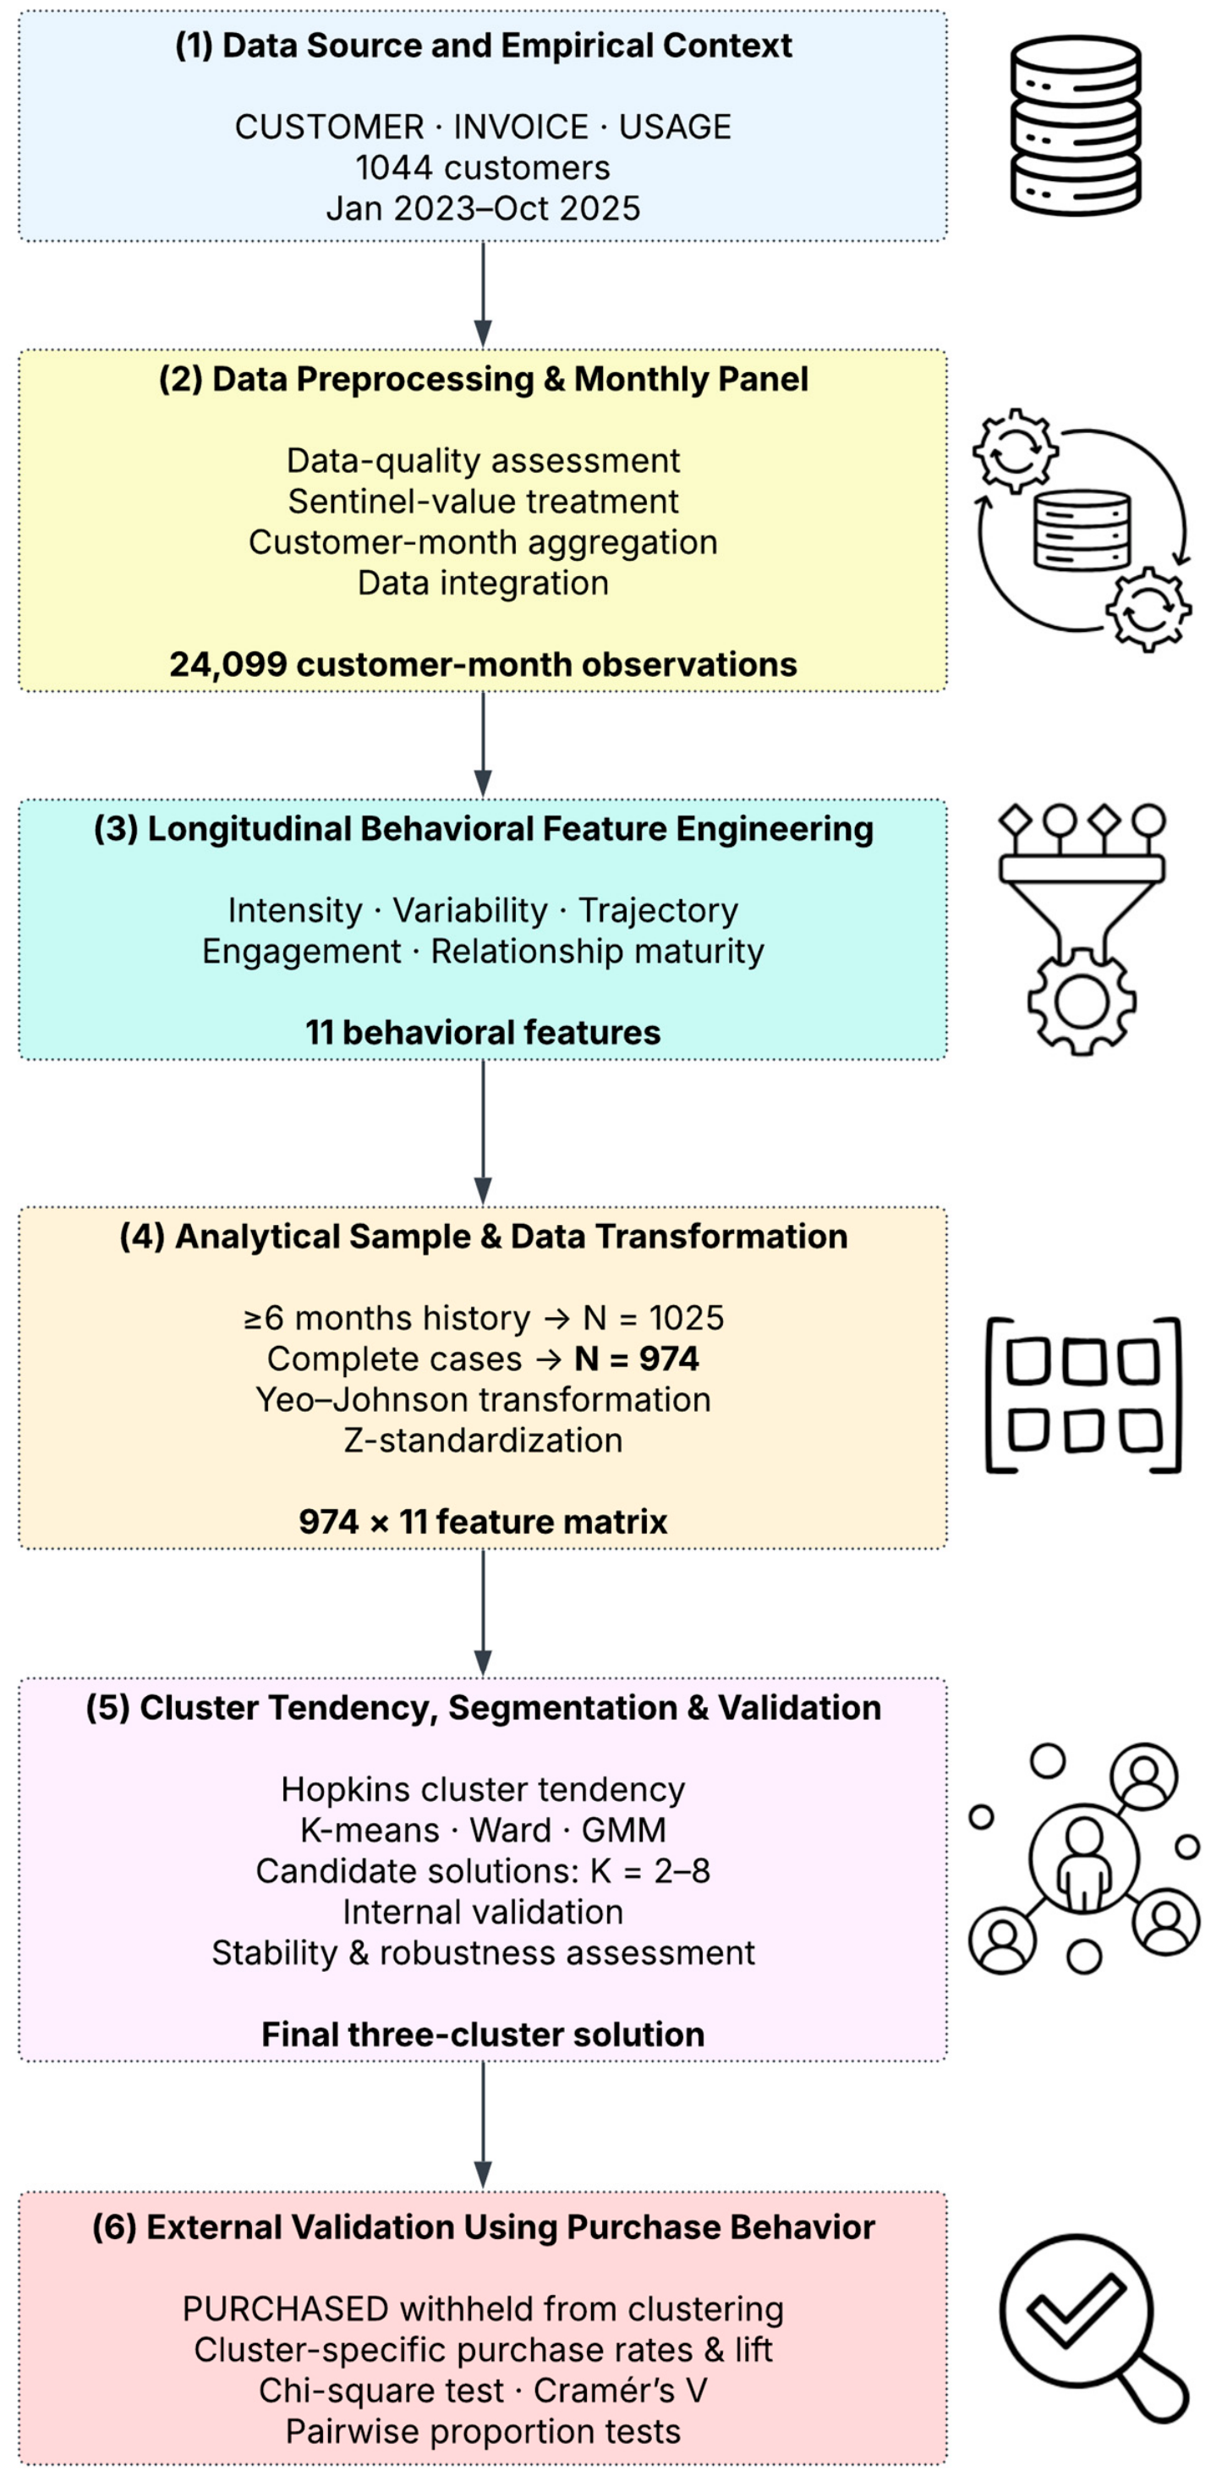
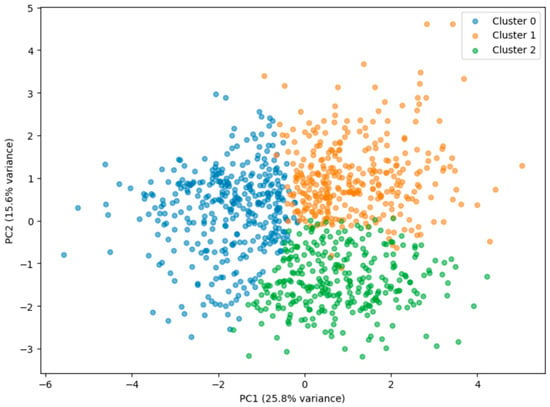
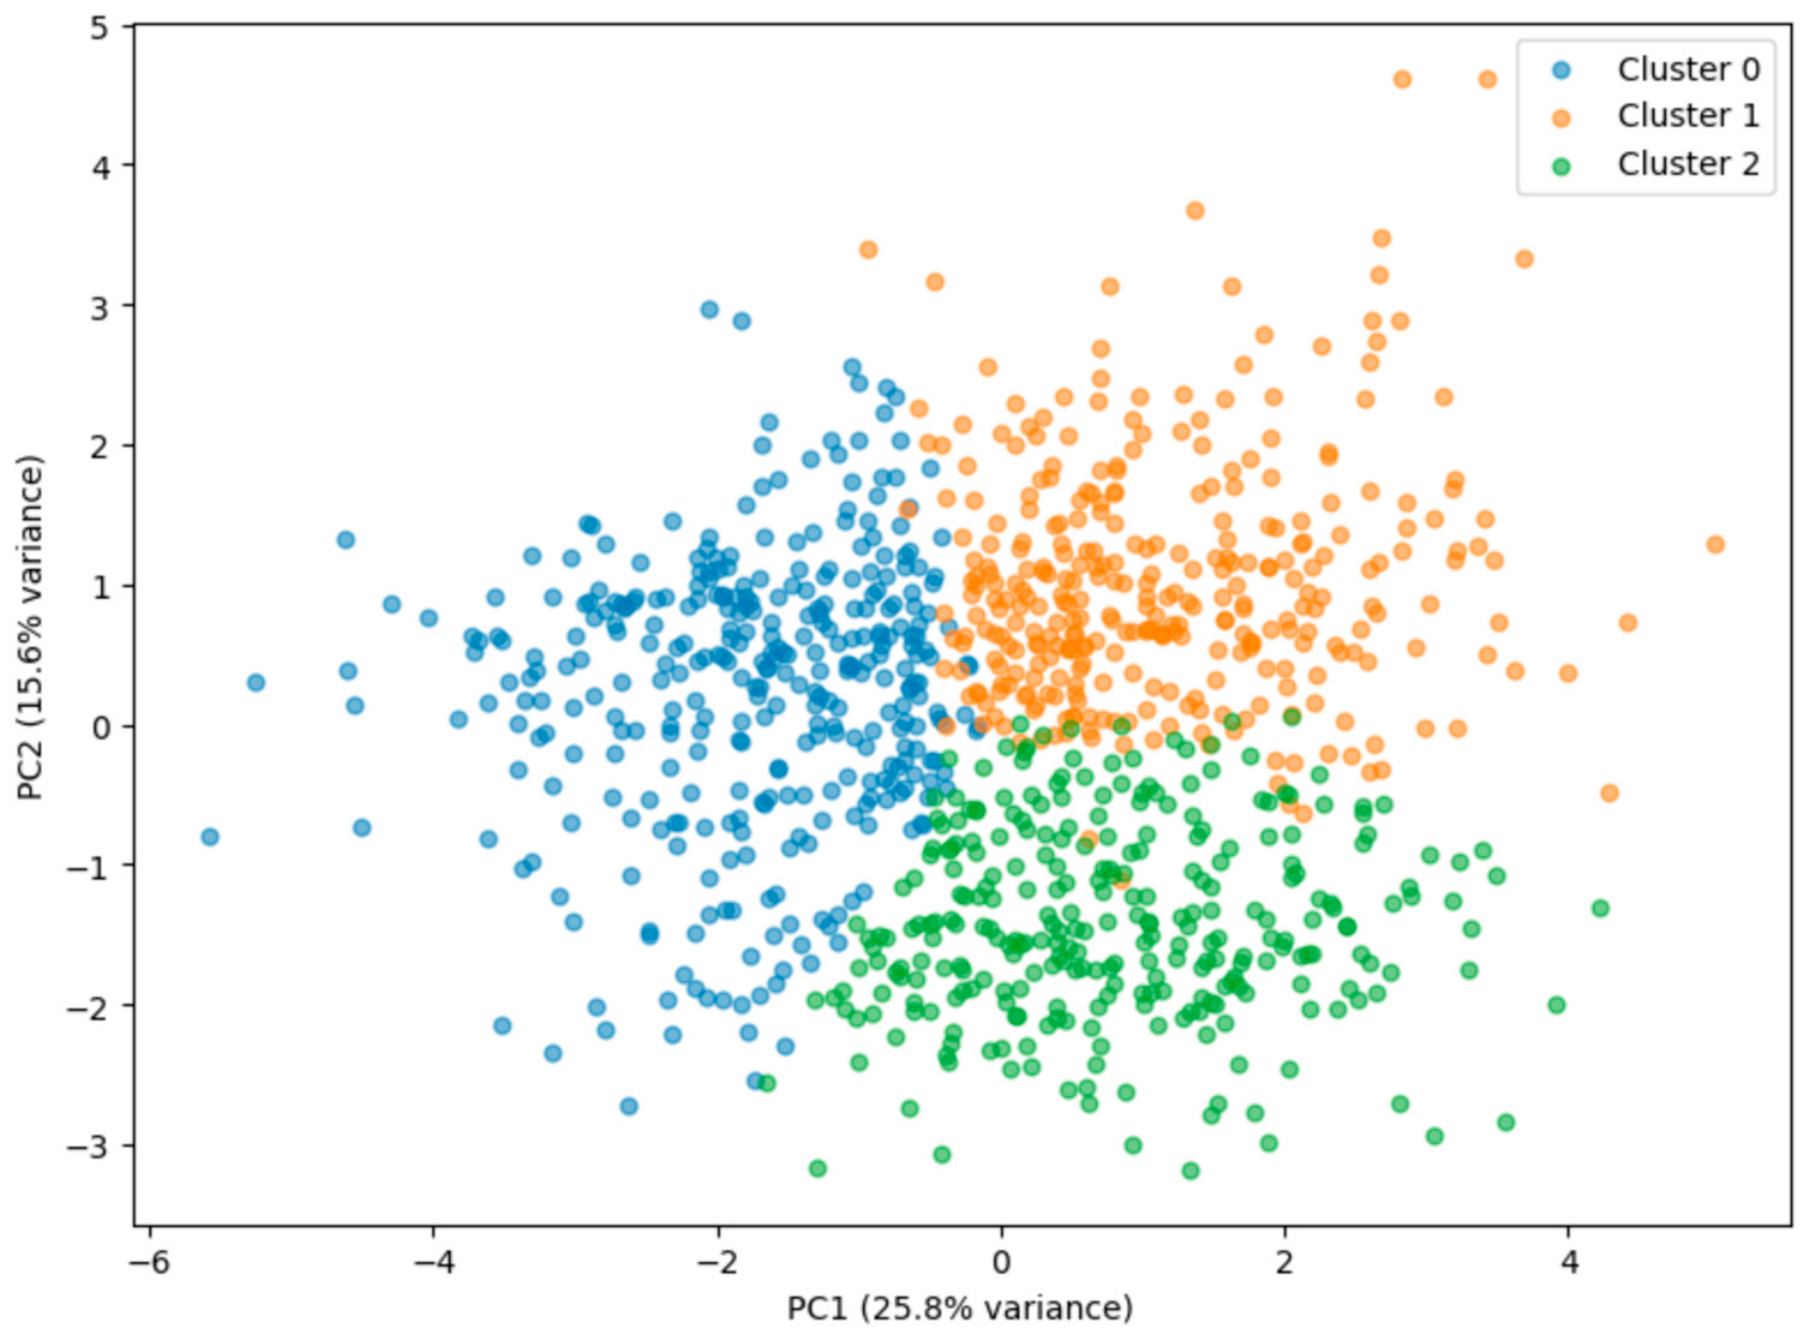

Disclaimer/Publisher’s Note: The statements, opinions and data contained in all publications are solely those of the individual author(s) and contributor(s) and not of MDPI and/or the editor(s). MDPI and/or the editor(s) disclaim responsibility for any injury to people or property resulting from any ideas, methods, instructions or products referred to in the content. |
© 2026 by the authors. Licensee MDPI, Basel, Switzerland. This article is an open access article distributed under the terms and conditions of the Creative Commons Attribution (CC BY) license.