


Abstract
Business-to-business digital service platforms increasingly automate routine information and coordination tasks once handled by account managers, yet suppliers keep investing in dedicated contacts and proactive communication. This raises a resource allocation question: does routine relational service investment retain incremental loyalty value as platform electronic service quality improves? Drawing on transaction cost economics, uncertainty reduction theory, and service quality theory, this study examines two electronic service quality thresholds—an enabling threshold below which platform quality constrains loyalty formation, and a substitution threshold beyond which routine relational investment ceases to generate loyalty increments through behavioral predictability and satisfaction. Two-wave data from nearly five hundred enterprise clients across more than twenty business-to-business platforms were analyzed using partial least squares structural equation modeling with disjoint two-stage estimation, two one-sided tests, and necessary condition analysis. The enabling threshold lies well below the substitution threshold, supporting a three-zone service structure. Complex exception-handling capability retains positive associations with satisfaction regardless of platform quality. These findings reframe electronic service quality as a boundary condition for relational resource allocation rather than a direct antecedent of satisfaction, offering implications for how service firms restructure account manager roles as platforms mature.
1. Introduction
B2B digital service platforms have changed the way enterprise buyers obtain information on order tracking, shipment details, invoice management, post-sales assistance, and contract details, which could otherwise be accessed only through interactions with account managers [1,2,3]. The use of such platforms in the construction materials, industrial equipment, and manufacturing input industries has grown substantially as buyers seek real-time visibility and reduced administrative burden [4,5]. Yet suppliers keep devoting considerable effort to dedicated liaisons, proactive updates, and daily communication in conjunction with their digital efforts [6]. The combination of platform and human investments creates an important resource-allocation problem that current theories do not fully address: When the platform reliably and transparently handles routine service operations in real time, do routine relational efforts still add value for customer satisfaction and loyalty?
Previous studies in the domain of B2B digital platforms have mostly been centered around the topics of platform adoption, efficiency, and network effect [7,8]. Research on platform ecosystems has covered issues relating to governance, architecture and service co-evolution and value creation [9,10,11,12,13,14]. There has recently been some research into how platforms have impacted business models and supplier–customer relationships [15,16,17,18]. Nevertheless, this research has infrequently considered whether improvements in platform quality would affect the marginal value of person-based service investments, treating digital and relational services as additive rather than overlapping, even when both address the same information and coordination problems. Hence, contemporary research does not sufficiently analyze situations where investment in routine relational service assets generates decreasing loyalty effects rather than sustained complementarity.
Studies on electronic service quality (ESQ) have mainly reported positive and linear influences on satisfaction and loyalty [19,20,21,22]. Research on service automation and human–AI interaction has posed the issue of how digital labor replaces humans, but empirical studies on that matter are mainly conducted in B2C situations and at a transactional level [23,24]. Studies on professional services enhanced by AI have shown that technology handles those tasks which follow rules, while human judgment is useful in those cases where there is no precedent [25]. What is missing is a framework that identifies both the ESQ level at which routine relational investment stops adding indirect loyalty value, and the minimum platform quality required for higher loyalty.
This study examines when routine relational service investment ceases to add loyalty as ESQ increases, using two theoretically derived thresholds. The first threshold is the enabling threshold and it is derived using the necessary condition analysis method. The second threshold is the substitution threshold and it is determined using two one-sided equivalence tests [26]. It defines the point at which the conditional sequential indirect effect of routine relational service investments on loyalty, based on behavioral predictability and satisfaction, becomes practically equivalent to zero. The three contributions are discussed below. First, ESQ is recast from a direct antecedent of satisfaction into a boundary condition that governs how much value routine relational investment creates. Second, behavioral predictability, based on the transaction cost economics approach [27,28] and uncertainty reduction theory [29], is introduced as the means through which value is created via routine relational services provided, clarifying that platforms first substitute the codifiable information and coordination function rather than trust, goodwill, or complex judgment. Thirdly, the combination of PLS-SEM adequacy tests [30,31], TOST equivalence tests, and NCA necessity tests [32,33] creates the structure of two thresholds, enabling and substitution, and the application thereof is clear to service firms when it comes to account manager transitions [34,35,36].
2. Theoretical Framework
2.1. Core Constructs, Theoretical Origins, and Conceptual Boundaries
Three theories jointly inform this framework: transaction cost economics explains why behavioral uncertainty raises coordination costs in exchange relationships, uncertainty reduction theory explains how repeated communication lowers that uncertainty, and service quality theory provides the evaluative lens through which customers judge platform- and person-delivered services [37]. ESQ measures customers’ perceptions of four capabilities of the platform: efficiency and reliability, information transparency and traceability, digital order completion, and data security and standardization. Even though there is a relationship among the four dimensions, they are not exchangeable, because information transparency does not make up for system downtime and digital order completion does not take the place of data security. For this reason, four first-order reflective dimensions are specified as formative indicators of a second-order ESQ construct, where each dimension captures a distinct aspect of platform capability that contributes to but does not fully determine overall quality.
The three lenses are complementary rather than interchangeable. Transaction cost economics identifies behavioral uncertainty as a cost driver but says little about the channel through which that uncertainty is reduced; uncertainty reduction theory supplies the channel by treating repeated and patterned communication as the mechanism through which a counterparty becomes predictable [29]; and service quality theory specifies how customers evaluate the two delivery channels once information reaches them [34]. Read together, these lenses locate the present problem at the level of the task rather than at the level of the relationship. Digital platform research has established that platforms reduce coordination and search costs in business markets and can absorb functions previously performed by intermediaries [7,13], while digital servitization research has established that supplier personnel continue to carry adaptive and relational functions that resist codification [6,17]. What neither body of literature specifies is the point at which the two channels stop being complementary because both treat platform capability and relational effort as parallel inputs rather than as inputs whose relative value shifts. The framework developed below therefore treats platform quality as a condition on the value of relational effort, and the constructs defined above are specified so that this conditional relationship can be tested at the level of the task category.
Routine relational service investment (RSI) refers to customer evaluation of the dedicated liaison, proactive status reporting, and process coordination provided by the supplier. This variable specifically concerns tasks that have rules, stable past history, and scope for standardization, such as order status reporting, reminder for routine processes, and solutions to common problems. These correspond to the standardized, documentable relational activities identified in key account management research [38]. Complex exception-handling capability (CEA) is the term used to describe the assessment that the client makes regarding the provider’s ability to marshal resources across departments, use unconventional authority, and resolve important disputes. CEA is theoretically distinct from RSI and is included so that the moderating role of ESQ can be tested on a task category that requires human judgment and authority.
Behavioral predictability (PBP) is based mainly on the idea of behavioral uncertainty in transaction cost economics. However, uncertainty reduction theory is used additionally when dealing with communication. When the customers know how to predict the reaction of the supplier step-by-step, costs associated with monitoring, search, and communication become lower. PBP is different from uncertainty of outcome, which refers to whether or not the outcomes of delivery are predictable, and from platform transparency, which refers to one of the information-based characteristics of the platform. The visibility of the information about the status of orders by itself does not mean that the customer is able to predict the escalation paths in unusual situations. Thus, PBP is an inferred process built on the availability of information and the interpretability of behavioral patterns.
This study operationalizes the failure of routine relational investment to add value as the point at which the conditional sequential indirect effect of RSI on loyalty, through PBP and satisfaction, becomes practically equivalent to zero, so that the claim rests on demonstrated practical equivalence rather than on a merely non-significant estimate. The formal equivalence criterion, the reasoning behind it, and the tolerance band adopted are set out in Section 2.3, where the substitution mechanism is developed. Point estimates and trends are reported alongside the formal threshold criterion.
2.2. Platform Value, Relational Investment, and Loyalty Formation
The hypotheses in this section are developed in the order of perceived platform value, platform quality, and relational investment, that is H1, H3 and H2. This numbering follows the structural model rather than the order of exposition, and Table 1 lists every hypothesis in numerical order. From the perspectives of service quality theory and the information systems success model, a reliable, precise, and user-friendly system lowers the customer’s cost of transacting and increases the sense of control over the purchase process [34,35]. Perceived platform value (PVP) is the customer’s overall judgment of how much value the platform delivers relative to what it costs to use [39]. Studies of digital platform adoption in business markets report that firms deriving higher value from platform use record higher process efficiency, lower coordination cost, and stronger intentions to continue [13], although this evidence is drawn largely from adoption and performance outcomes rather than from evaluative satisfaction, so the enterprise customer’s own evaluation remains comparatively under-examined. Therefore, H1 asserts that PVP is positively related to customer satisfaction.
Table 1.
Summary of hypotheses, theoretical basis, and tests.
ESQ represents the quality of the technology that supports such value. Consumer-oriented electronic service quality research reports a consistent positive association between electronic service quality and satisfaction, and a subsequent association between satisfaction and loyalty, across retail, banking, and tourism settings [19,20,21], and comparable results have been obtained for automated interfaces such as service chatbots [22]. Two features of the literature in this area limit its transferability to business markets. First, the studies have been conducted in settings where the platform is effectively the only service channel, so no human alternative competes with it for the same informational function. Second, it treats platform quality as a direct driver of evaluation rather than as a condition under which other inputs retain value. H3 therefore asserts that ESQ is positively related to customer satisfaction, while the framework anticipates that the magnitude of this direct path will be modest in a setting where a parallel human channel remains available.
Routine relational service investment supplies personalized and timely information that complements platform-based information. Relational research in business markets reports that dedicated liaison arrangements, proactive updates, and coordinated processes raise relationship quality and continuation intentions [6], and the key account management literature treats these standardized activities as a core and costly component of the supplier’s service offering rather than as discretionary goodwill [38]. H2 accordingly asserts that routine RSI is positively related to customer satisfaction. Prior work in B2B platform settings confirms that digital capability shapes loyalty, but the conditions under which person-based effort retains marginal value remain unclear [40].
Customer satisfaction is a cumulative evaluation of the entire service process and is the immediate means by which both platform and personal services affect the continuation of the relationship. In electronic service settings, satisfaction is repeatedly reported as the mediator that converts service quality perceptions into loyalty rather than as an outcome parallel to loyalty [19,21]. H4a states that customer satisfaction is positively related to customer loyalty, and H4b states that customer satisfaction mediates the influence of PVP, ESQ, and routine RSI on loyalty.
H2 concerns the total association between routine RSI and satisfaction, whereas H5a, H5b, and H5c examine whether that association operates predominantly through PBP. The form of mediation is not predefined: complementary, competitive, and indirect-only mediation are distinguished according to the significance of the direct and indirect effects. This distinction carries the argument. If routine relational investment reaches satisfaction only through predictability then any platform capability that supplies predictability directly should erode the value of that investment. If it also reaches satisfaction directly, through reassurance or perceived attentiveness that the platform cannot reproduce, the erosion should be partial and bounded. The mediation form is therefore treated as an empirical question whose answer determines how far the substitution logic can be extended.
2.3. Task Overlap, Behavioral Predictability, and the Substitution Mechanism
Routine RSI generates predictability by keeping customers informed about updates proactively, by maintaining consistent response patterns, and by coordinating daily operations. The same predictability can be generated through a platform by means of real-time status updates, consistent process flows, and auditable records. Because the two channels supply the same class of input, each can be expected to raise predictability on its own: H5a states that there exists a positive relationship between routine RSI and PBP, and H5b states that there exists a positive relationship between ESQ and PBP. H5c states that PBP is positively related to customer satisfaction, and thereby to loyalty through satisfaction.
Task overlap occurs where the account manager and the platform convey identical information content. When the account manager confirms that an order has been accepted and will ship on Friday, and the platform displays the same information, the marginal value of that communication approaches zero. Where, on the other hand, contextual intelligence such as a warning about tightness of factory capacity and a recommendation to order early is supplied by the manager but cannot yet be encoded in the platform, incremental value remains.
The asymmetry between these two cases rests on the codifiability of the underlying task. Research on information technology in professional service operations distinguishes tasks that are automated, because their inputs and decision rules can be specified in advance from tasks that are only augmented, and because they require situated judgment and discretionary authority [25]. Routine relational service investment falls largely into the first category: status reporting, reminders, and the resolution of recurring problems are documentable and rule-governed, which is precisely what makes them programmable. Evidence from business platform settings is consistent with this reading, in that platform use has been found to substitute for intermediary functions and to reduce buyer transaction costs [7], while service research reports that customers accept automated delivery for standardized encounters yet continue to prefer human handling when the encounter departs from the standard case [23,24]. What this body of work establishes is that substitution is task-specific rather than wholesale. What it does not establish is the level of platform quality at which substitution actually binds, and it is this quantity that the present study estimates.
Accordingly, H5d states that ESQ negatively moderates the relationship between routine RSI and PBP, such that the incremental contribution of routine relational services to behavioral predictability diminishes as ESQ grows. H5e posits that the conditional sequential indirect effect of routine RSI on loyalty through PBP and satisfaction diminishes as ESQ increases. This logic follows the resource orchestration view that resource combinations must be reconfigured, not merely accumulated, as capabilities evolve [41]. The prediction is directional rather than descriptive: it implies that the same relational activity carries different value at different levels of platform capability, and that the appropriate managerial response is the reallocation of relational effort rather than its reduction.
Equivalence testing uses the TOST method. If the 90% confidence interval of the conditional sequential indirect effect based on the bootstrap method falls completely within the range of ±0.02 and continues in higher ESQ intervals, routine relational investments have moved into an area of practical equivalence to zero. The threshold value of ±0.02 was determined using the median assessment of 12 subject-matter experts with experience in purchasing, customer management, or operation of the service platform. Sensitivity analysis results for ±0.01 and ±0.03 threshold values are also provided. Exception handling capability is used as the boundary condition since its influence on user satisfaction should not attenuate as much as RSI with increasing ESQ.
2.4. Necessity, Non-Sufficiency, and the Dual-Threshold Logic
The necessity logic asks what the minimum ESQ level is, below which customers cannot reach higher levels of loyalty, thereby setting an enabling threshold. The sequential indirect effect logic asks at what ESQ level the marginal effect of investment in routine relational manpower on loyalty becomes negligible, thereby setting a substitution threshold. The two questions are not variants of a single test. Necessity concerns whether an outcome is attainable at all in the absence of a condition and is therefore evaluated on the ceiling of the data rather than on its average trend [33]; average-effects estimation cannot answer it, which is why necessity and sufficiency analyses are recommended as complements rather than as substitutes [32]. H6 accordingly proposes that a certain level of ESQ is a necessary condition for achieving higher customer loyalty [42,43].
ESQ is an inadequate indicator of high loyalty since the latter also requires factors such as relational investments, trust, switching costs, competitive pricing, and capability of supply. NCA ceiling lines were constructed separately using the empirical scope and the theoretical scope of the construct scores. The empirical scope makes up the core within-sample conclusion, while the theoretical scope is used to determine whether there is any dependency of conclusions on the empirical scope and scale coding. No extrapolation beyond the observed range is made.
The two thresholds are expected to be ordered, with the enabling threshold falling below the substitution threshold, and this expectation follows from what each threshold denotes. The enabling threshold marks the point at which the platform ceases to obstruct loyalty formation: below it, basic transactional functions are unreliable, so neither channel delivers dependable predictability and relational effort is consumed by remediation rather than by value creation. The substitution threshold marks a later and more demanding condition, namely that the platform discharges the routine informational function completely enough that a parallel human supply of the same information adds nothing further. A platform can therefore be adequate without being comprehensive, and the interval between the two thresholds is precisely the range within which both channels still contribute. Because the second condition presupposes the first, the ordering is a theoretical expectation rather than an artefact of estimation. The expectation is nevertheless falsifiable: if the two thresholds were to coincide, or if their confidence intervals were to overlap or to be ordered in reverse, the intermediate zone would disappear and the dual-threshold structure would not hold.
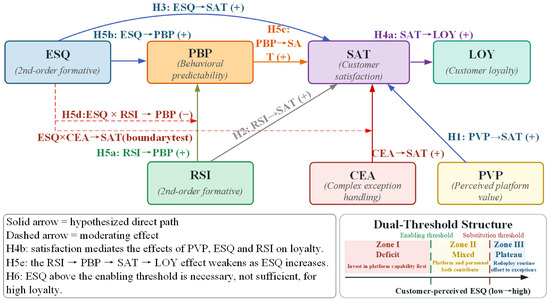
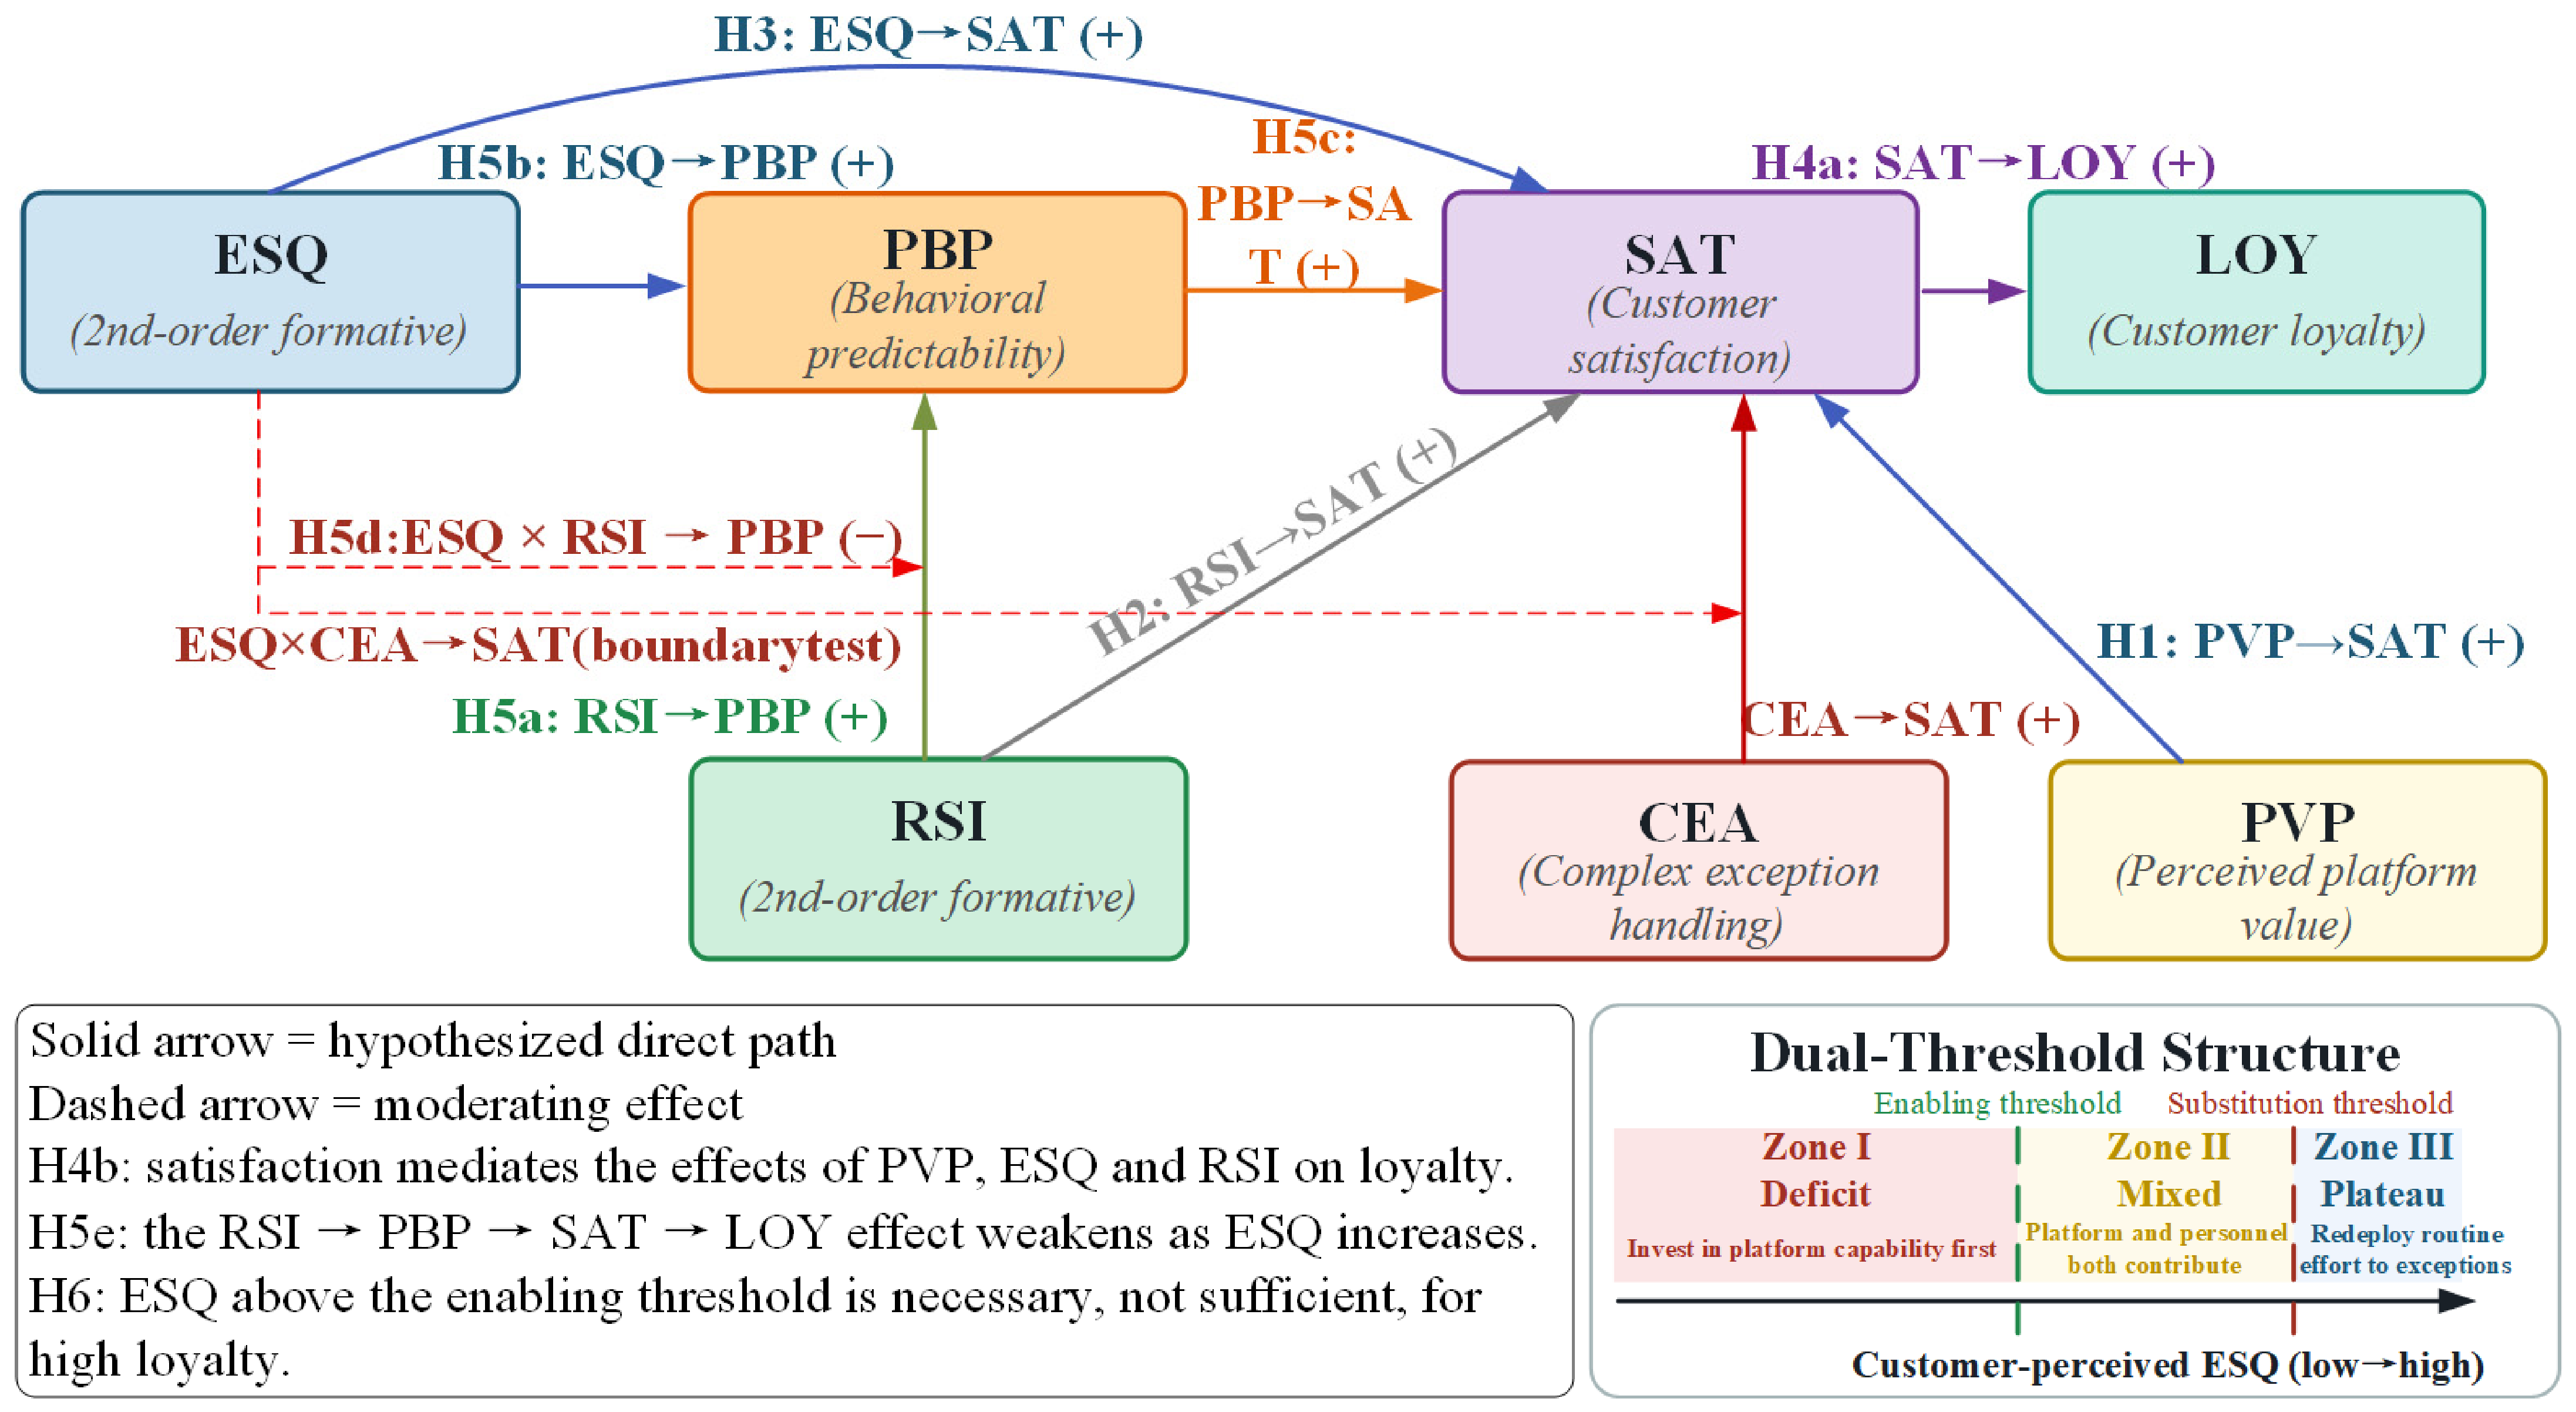
When the enabling threshold is lower than the substitution threshold, the three-zone model becomes operational: the digital foundation deficit zone, whereby the loyalty development process is hampered by low-quality platforms; the mixed services zone, where loyalty creation is achieved through the interaction between the platform and people; and the routine relational investment plateau zone, where loyalty is no longer generated through increased routine relational investment of people. Figure 1 addresses one question: as platform quality rises, does routine relational investment still add loyalty value, and from what ESQ level onward does it stop? The upper panel shows the mechanism, and the lower panel translates it into three allocation zones. Threshold positions are illustrative and are estimated in Section 4.
Figure 1.
Conceptual framework: how platform quality changes the loyalty value of routine relational service investment. Upper panel: routine RSI raises loyalty through behavioral predictability and satisfaction, and ESQ is hypothesized to weaken the RSI–PBP link (H5d), making this value conditional rather than fixed. Solid arrows denote hypothesized direct paths; dashed arrows denote moderating effects; mediation and necessity hypotheses (H4b, H5e, H6) appear in the notes panel. Lower panel: the resulting three service zones along the customer-perceived ESQ continuum, separated by the enabling and substitution thresholds. Threshold positions are illustrative and estimated in Section 4. ESQ—electronic service quality; RSI—routine relational service investment; PBP—behavioral predictability; SAT—customer satisfaction; LOY—customer loyalty; PVP—perceived platform value; CEA—complex exception-handling capability.
3. Materials and Methods
3.1. Research Context, Sample, and Survey Procedure
The construction supply chain is a suitable setting for the research, given that supplier interactions are long-lasting, order size is considerable, exceptions occur frequently, and post-purchase share may be modified. Meanwhile, purchasing, transportation, and settlement operations are being digitized, thus allowing one to identify platform substitution of standard information activities and personnel involvement in complicated coordination activities. There was a wide variation of platform maturity among the suppliers under study, thus providing adequate ESQ exposure at low, medium, and high levels [44].
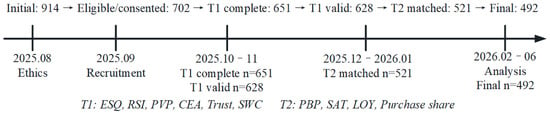
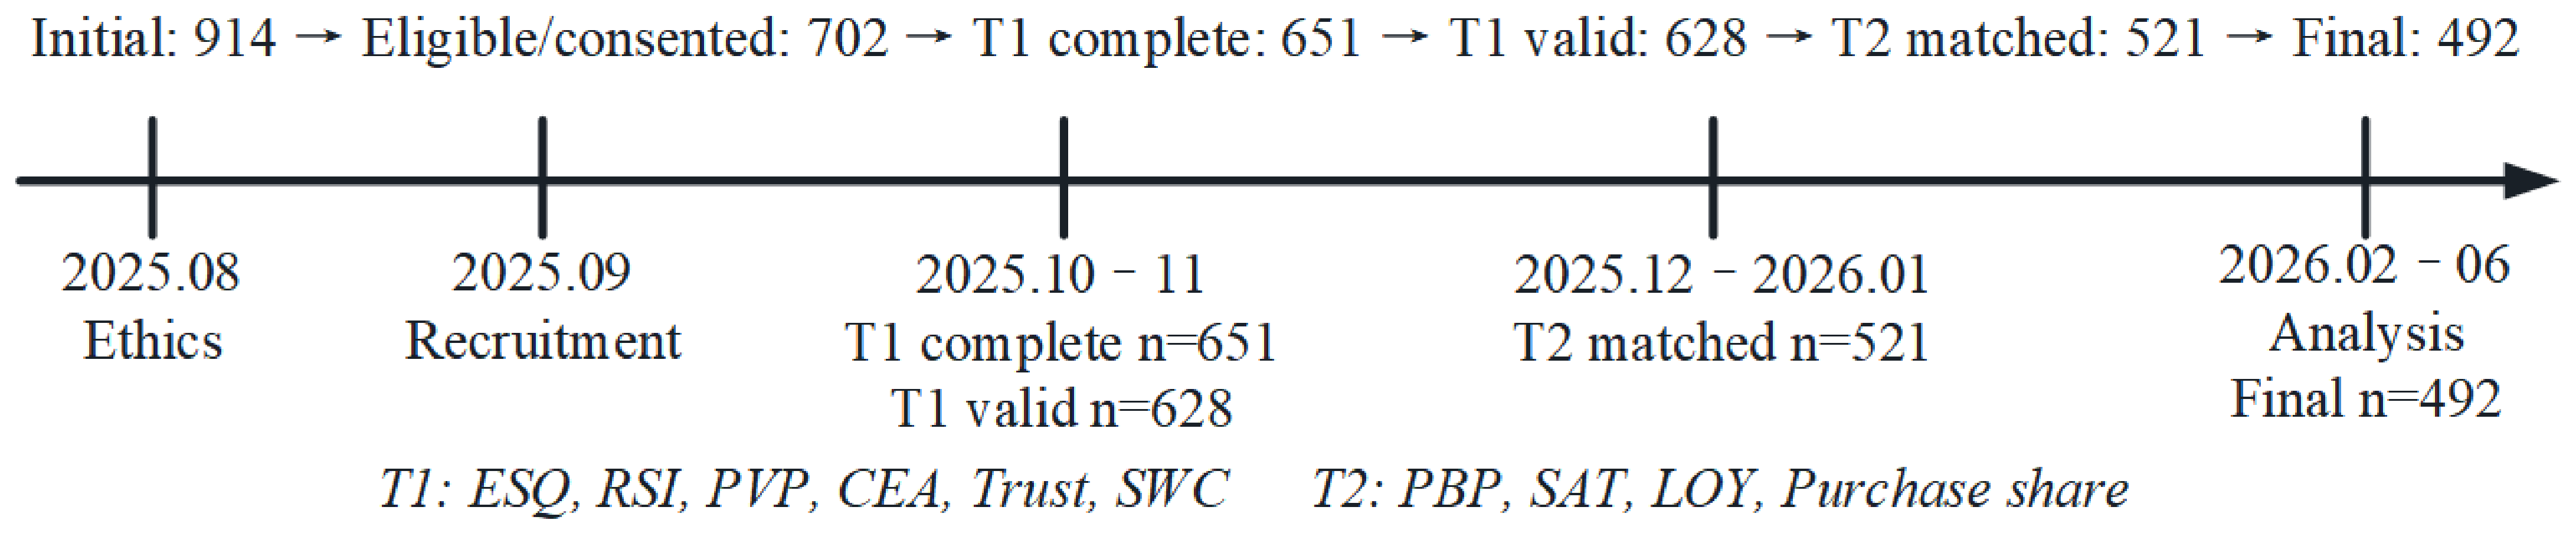
Participants in the research included key informants who had utilized a digital service platform for construction materials, engineering equipment, or industrial goods for at least six months and who were associated with activities relating to procurement, contract, projects, or supplier management. The sampling strategy used was based on stratified sampling among the different levels of maturity of the platforms to cover the ESQ range, while ESQ was retained as a continuous variable in all analyses. The sampling process started with 914 subjects contacted initially, where 702 fit the inclusion criteria and consented to participate. There were 651 filled-out questionnaires at Wave 1 (T1), with 628 passing quality checks at T1. Wave 2 (T2) had 521 respondents, with 492 remaining after omitting those not fitting the conditions of the primary analysis. The purchase shares variable was available for 488 cases.
The final sample was drawn from 23 platforms. The largest single platform accounted for 34 respondents (6.9% of the sample), indicating that no platform dominated the data. Platform maturity distribution was: emerging 217 (44.1%), developing 162 (32.9%), and advanced 113 (23.0%). Firm size distribution was: fewer than 100 employees 90 (18.3%), 100–499 employees 196 (39.8%), 500–999 employees 112 (22.8%), and 1000 or more employees 94 (19.1%). Role distribution was: procurement 202 (41.1%), project management 132 (26.8%), supply chain and operations 104 (21.1%), and senior management 54 (11.0%). Figure 2 illustrates the sample composition across these three stratification dimensions. T1 data were collected between October 7 and November 28, 2025, while T2 occurred between November 24, 2025, and January 16, 2026. The average inter-wave time period was 45.88 days (SD = 6.22 days). Table 2 presents the sample structure based on these stratification dimensions.
Figure 2.
Sample recruitment, retention, and analysis flow.
Table 2.
Sample profile and descriptive statistics.
T1 measured ESQ, routine RSI, CEA, PVP, trust, switching costs, and control variables. T2 measured PBP, outcome uncertainty, satisfaction, loyalty, and purchase expectation in the next procurement cycle. Major platform changes, changes in supplier, and changes in account managers were controlled for separately in robustness tests. Because PBP, satisfaction, and loyalty were collected in T2, the mediation estimates should be interpreted as temporally separated from T1 predictors but not as a fully lagged causal chain among the T2 mediator and outcomes.
3.2. Variable Operationalization and Measurement Model
The formal survey included 49 items measured on a 1-to-7 point Likert scale. Scale construction was conducted via expert content validation (five academics and six industry managers), cognitive interviewing with ten clients of the platform, and a pretest conducted among 52 respondents. Expert rater panels (comprising 12 experts who have expertise in purchasing or client management or platform operation) decided on the smallest practically important effect size. Eight of them chose 0.02, making ±0.02 as the primary equivalence range. Sensitivity analysis is presented for ±0.01 and ±0.03 alongside the main results.
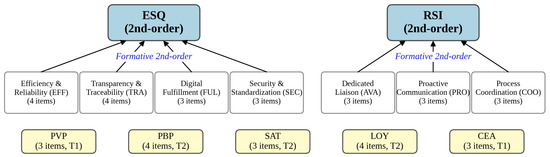
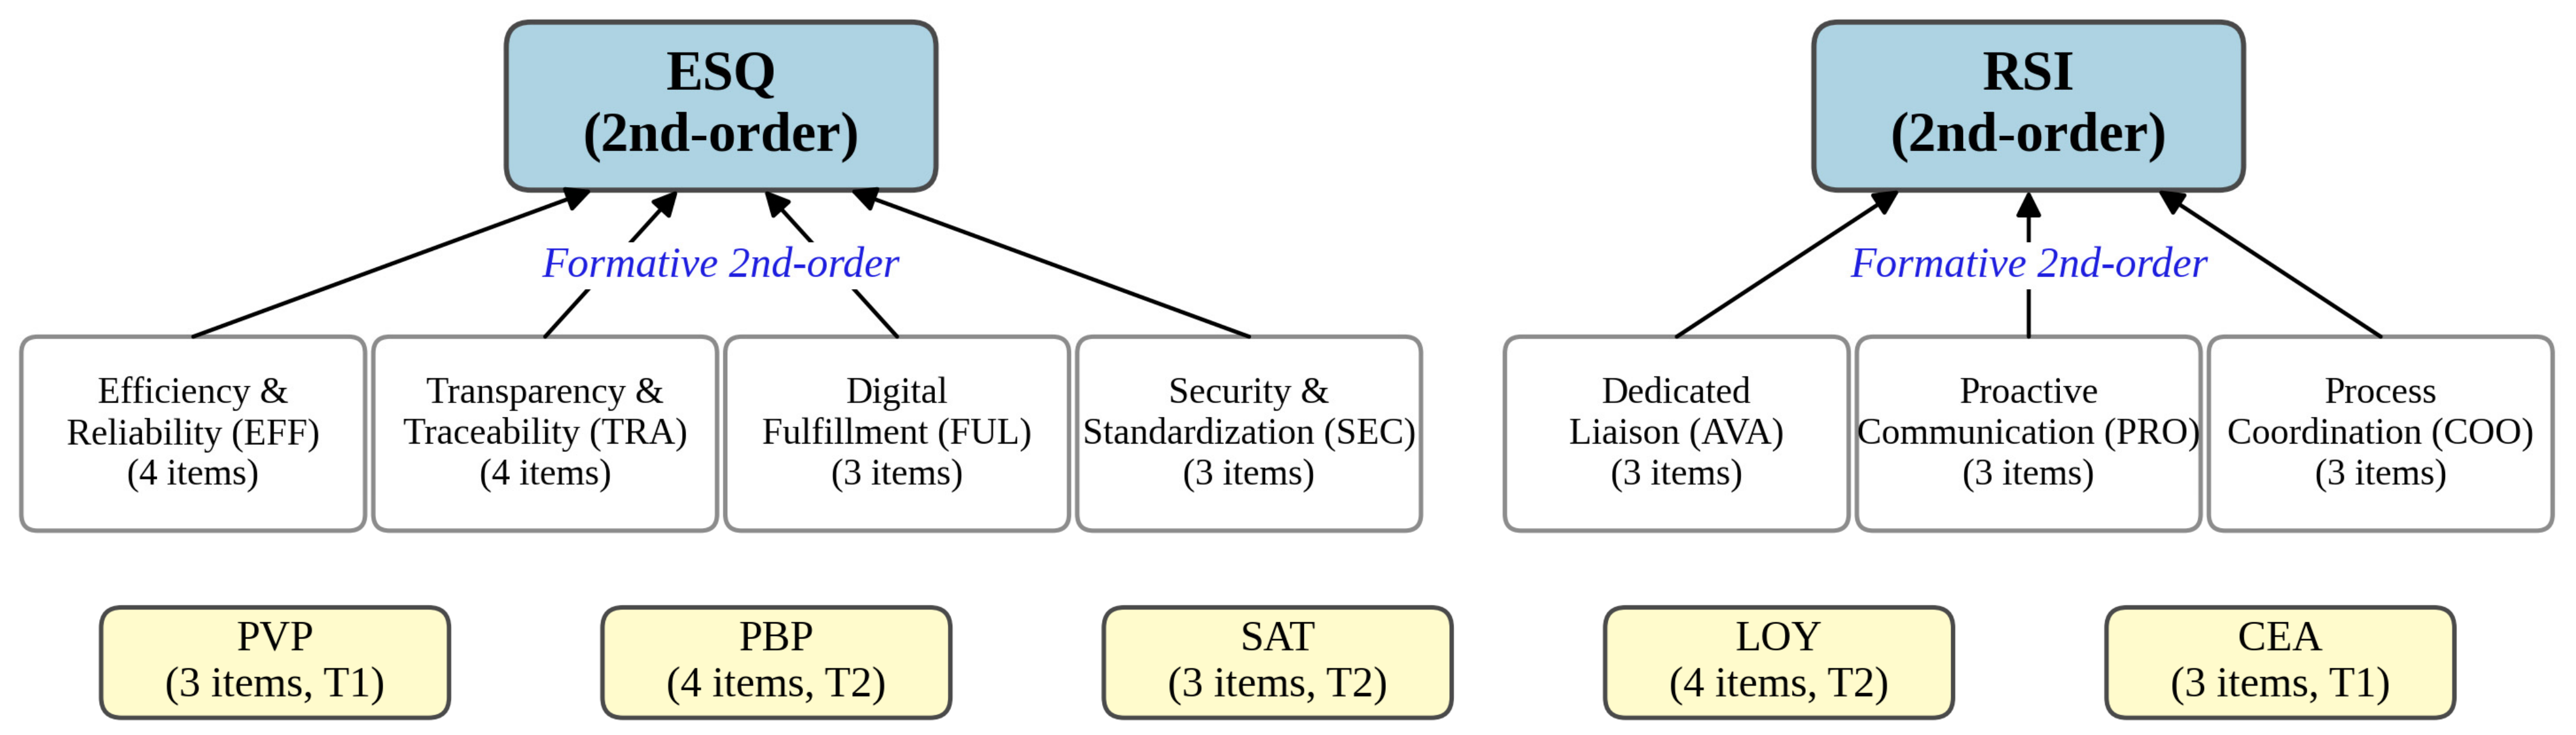
The ESQ variable was evaluated through 14 items divided into four first-order reflective dimensions namely efficiency and reliability (EFF, 4 items), information transparency and traceability (TRA, 4 items), digital fulfillment (FUL, 3 items), and data security and standardized responsiveness (SEC, 3 items). All four dimensions together make up the second-order ESQ dimension. A global single-item measure of ESQ was used for redundancy analysis. The routine RSI dimension was represented by nine items that were divided into three dimensions such as availability of dedicated liaison (AVA, 3 items), proactive status communication (PRO, 3 items), and process coordination (COO, 3 items). Figure 3 depicts the measurement model, showing the second-order structure of ESQ and RSI and their first-order dimensions. The CEA variable was represented by 3 reflective items covering cross-departmental resource mobilization, non-standard authorization, and significant dispute resolution.
Figure 3.
Measurement model: second-order formative structure of ESQ and RSI with first-order reflective dimensions.
PBP was measured with 4 items related to the predictability of the sequence of responses, consistency in processing, pathways of escalation, and next-step actions. The measurement of outcome uncertainty involved 3 items for the discriminant validation of PBP. Satisfaction and PVP were measured through 3 items each, while loyalty was measured through 4 items. Trust and switching cost were also measured using 3 items each. Expected purchase share for the following procurement cycle was scaled between 0 and 100%. Table 3 summarizes the construct definitions, measurement items, and data collection wave for all focal variables. Discriminant validity of PBP from trust, transparency of the trading platform, and outcome uncertainty was established with HTMT with bootstrap confidence intervals, cross-loadings, and alternative measurement models. Item selection took into consideration both statistical criteria and content representation without mechanical adherence to individual loading thresholds [30,31,45,46].
Table 3.
Construct definitions and measurement overview.
3.3. Interpretive Interviews and Task Classification Validation
After completing the quantitative analysis, 14 respondents from procurement, project, contract, and supplier management disciplines were selected through maximum variation sampling based on the ESQ level, routine RSI, and complex exception experience. The interviews lasted between 32 to 47 min. Respondents talked about both routine tasks and complex exceptions, indicating if they were based on the set of rules, cross-functional, off-standard, and independently processable by the platform.
Two separate coders assessed 28 tasks according to five dimensions: codifiability, standardization level, history of consistent processing, interdependence among departments, and need for non-standard authorization. The agreement between coders reached 89.3% (Cohen’s κ = 0.786). Three disagreements were reconciled via discussion. Interviews were analyzed on five emerging themes, namely, the use of platform for substitution of routine information, difficult exceptions that still require personnel authorization, failure of the platform that triggers contact with the personnel, shift of account manager’s function toward resolving exceptions, and transparency does not mean predictability of behavior. Anonymized excerpts were labeled by respondent role, ESQ group, and task type.
Interviews were only employed to confirm the boundaries of routine-complex tasks and provide the context for the quantitative method. Frequency counts of themes were not performed to test hypotheses statistically, nor were causal statements made based on the interview data alone. The qualitative study took a complementary theory-confirming approach, where primary inference was drawn from the two-wave quantitative research. The research design that incorporated a two-wave survey and interviews was reviewed and approved by Bansomdejchaopraya Rajabhat University, Bangkok, Thailand (REC-BSRU COA No. 680907). All respondents were briefed on the research procedure before taking part in it and signed an informed consent form. Respondents gave their consent voluntarily, and their identities were kept anonymous throughout the survey and interviews.
3.4. Statistical Analysis, Equivalence Testing, and NCA Scaling
The initial analyses were performed using R 4.4.3 (R Foundation for Statistical Computing, Vienna, Austria). For the estimation of the ESQ and RSI second order constructs, the disjoint two-step method of PLS-SEM was applied. The score of Stage 2 constructs was utilized to calculate the ESQ × RSI interaction term. The non-parametric bootstrap technique was used to resample 10,000 times to estimate path coefficients, direct effects, indirect effects, moderated mediation effects, and sequential indirect effects based on ESQ.
Measurement model reporting included outer loadings, Cronbach’s α, composite reliability (CR), rho_A, AVE, HTMT with bootstrap confidence intervals, cross-loadings, formative weights, VIF, and redundancy analysis coefficients. Structural model reporting included path coefficients, 95% bootstrap confidence intervals, R2, adjusted R2, Cohen’s f2, Q2predict, and indicator-level PLSpredict results. The Johnson–Neyman technique identified the ESQ value at which the simple slope of routine RSI on PBP ceased to be statistically significant. The substitution criterion, however, was defined primarily by the TOST equivalence test [26,32,47].
In the TOST equivalence test, practical equivalence was concluded when the 90% bootstrap CI of the conditional sequential indirect effect fell entirely within ±0.02. A 95% CI was employed in conventional significance tests. The substitution point was defined as the lowest ESQ for which the 90% CI of the conditional sequential indirect effect fell into the ±0.02 region and remained there for higher ESQ values. Empirical scope of NCA analysis was based on the PLS construct scores’ scope, translating bottleneck scores to the 1–7 ESQ scale. Theoretical scope analysis relied on the ESQ index composite converted to a 0–100 scale through 100(x − 1)/6. Effect size and bottleneck scores were provided separately in each scope without combining their interpretations. For NCA analysis, the methods used included CR-FDH for ceiling analysis, CE-FDH for robustness, and 10,000 iteration permutations for significance tests while deleting 1% extreme observations. [48,49].
In the robustness tests, there were platform-cluster-robust standard errors, platform fixed-effects, removal of largest platform, event marker, inverse probability weighting, reinclusion of nine event-change observations, and replacement of attitudinal loyalty with expected purchase share as the dependent variable.
4. Results
4.1. Sample Formation, ESQ Coverage, and Threshold Identifiability
The final sample of respondents consisted of 492 enterprise customers across 23 B2B platforms. Expected purchase share was available for 488 respondents. The proportion of procurement department respondents was 41.1%, of project managers was 26.8%, of supply chain and operations was 21.1%, and of top management was 11.0%. Platform maturity spanned all levels. ESQ had a mean of 4.832 (SD = 1.011), with an observed range of 1.757 to 6.938. The 25th, 50th, 75th, and 95th percentiles were 4.147, 4.840, 5.533, and 6.524, respectively, confirming full coverage of low, medium, and high platform quality.
Within ±0.10, ±0.20, and ±0.25 of the substitution threshold of 5.917, there were 22, 44, and 55 observations, respectively, indicating that the high-ESQ tail was not determined by a handful of extreme cases. T1 attrition analysis resulted in standardized mean differences for ESQ, RSI, and PVP of −0.003, 0.066, and 0.044, respectively, none statistically significant. Differences in the distributions of firm size between T1 participants and the matched sample were also not statistically significant. Intraclass correlations for PBP, satisfaction, and loyalty were 0.074, 0.113, and 0.044, respectively, demonstrating moderate platform-level clustering that was addressed through cluster-robust standard errors and platform fixed effects in robustness analyses.
4.2. Measurement Model and Discriminant Validity
All reflective first-order indicators met the recommended thresholds. The outer loadings for the constructs were between 0.712 and 0.916. For Cronbach’s α, it was between 0.847 and 0.890, for composite reliability between 0.846 and 0.892, and for average variance extracted (AVE), between 0.627 and 0.735. The specific reliability estimates for the reflective constructs are summarized in Table 4. By construct: EFF (α = 0.881, CR = 0.880, AVE = 0.648), TRA (α = 0.871, CR = 0.871, AVE = 0.630), FUL (α = 0.855, CR = 0.855, AVE = 0.663), SEC (α = 0.890, CR = 0.892, AVE = 0.735), AVA (α = 0.847, CR = 0.846, AVE = 0.647), PRO (α = 0.849, CR = 0.849, AVE = 0.652), COO (α = 0.861, CR = 0.863, AVE = 0.678), PVP (α = 0.866, CR = 0.867, AVE = 0.685), PBP (α = 0.875, CR = 0.875, AVE = 0.638), SAT (α = 0.887, CR = 0.887, AVE = 0.724), and LOY (α = 0.869, CR = 0.870, AVE = 0.627).
Table 4.
Measurement model summary.
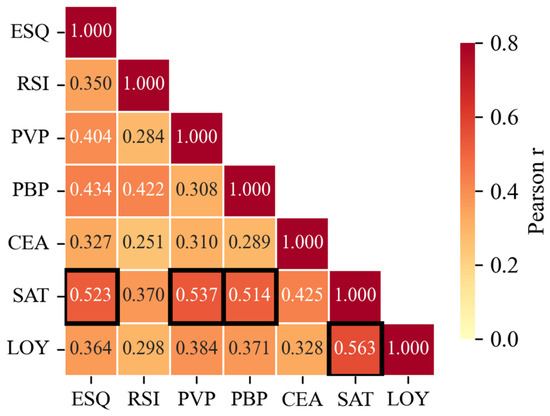
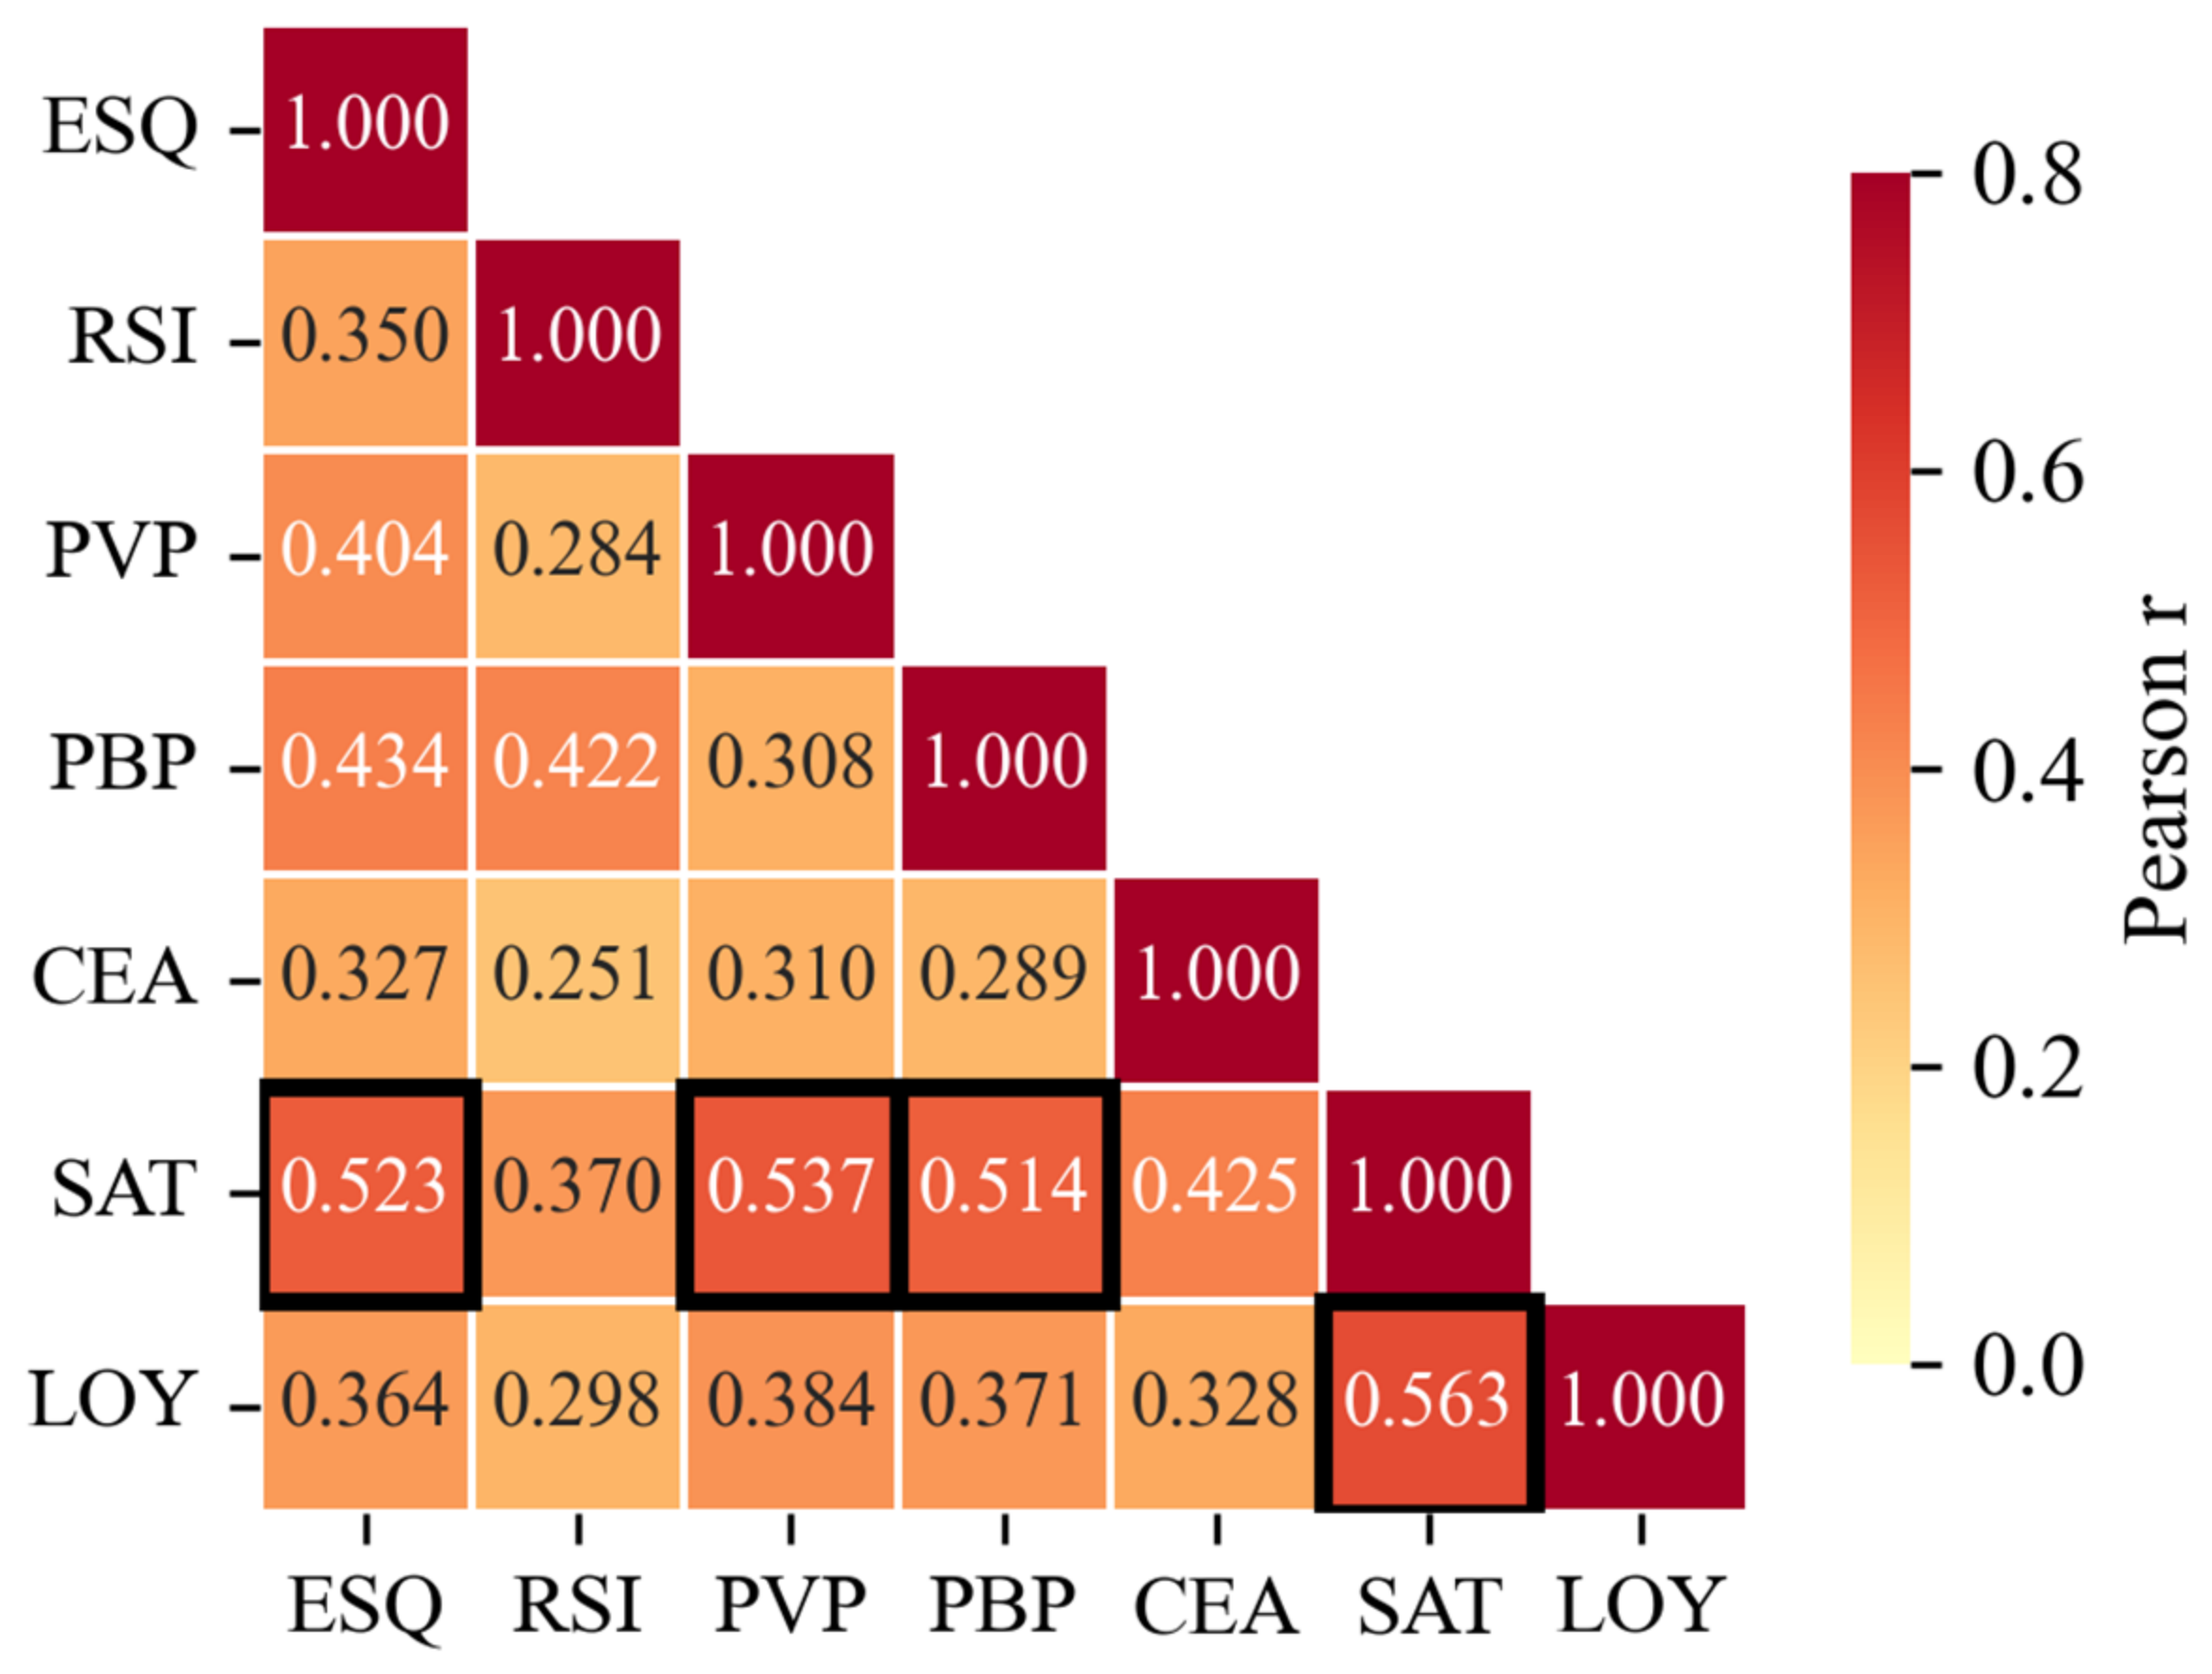
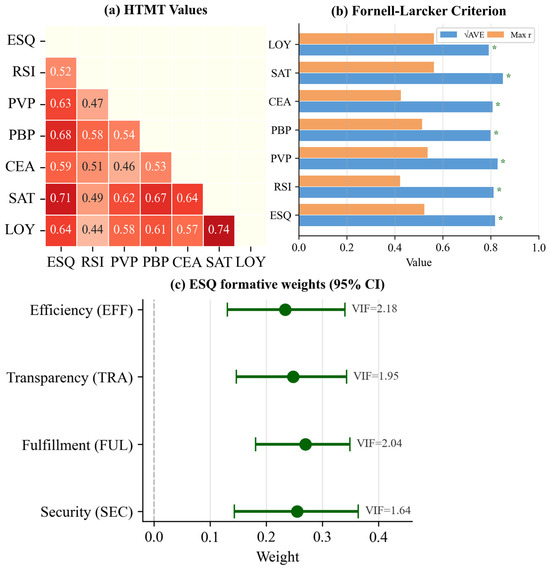
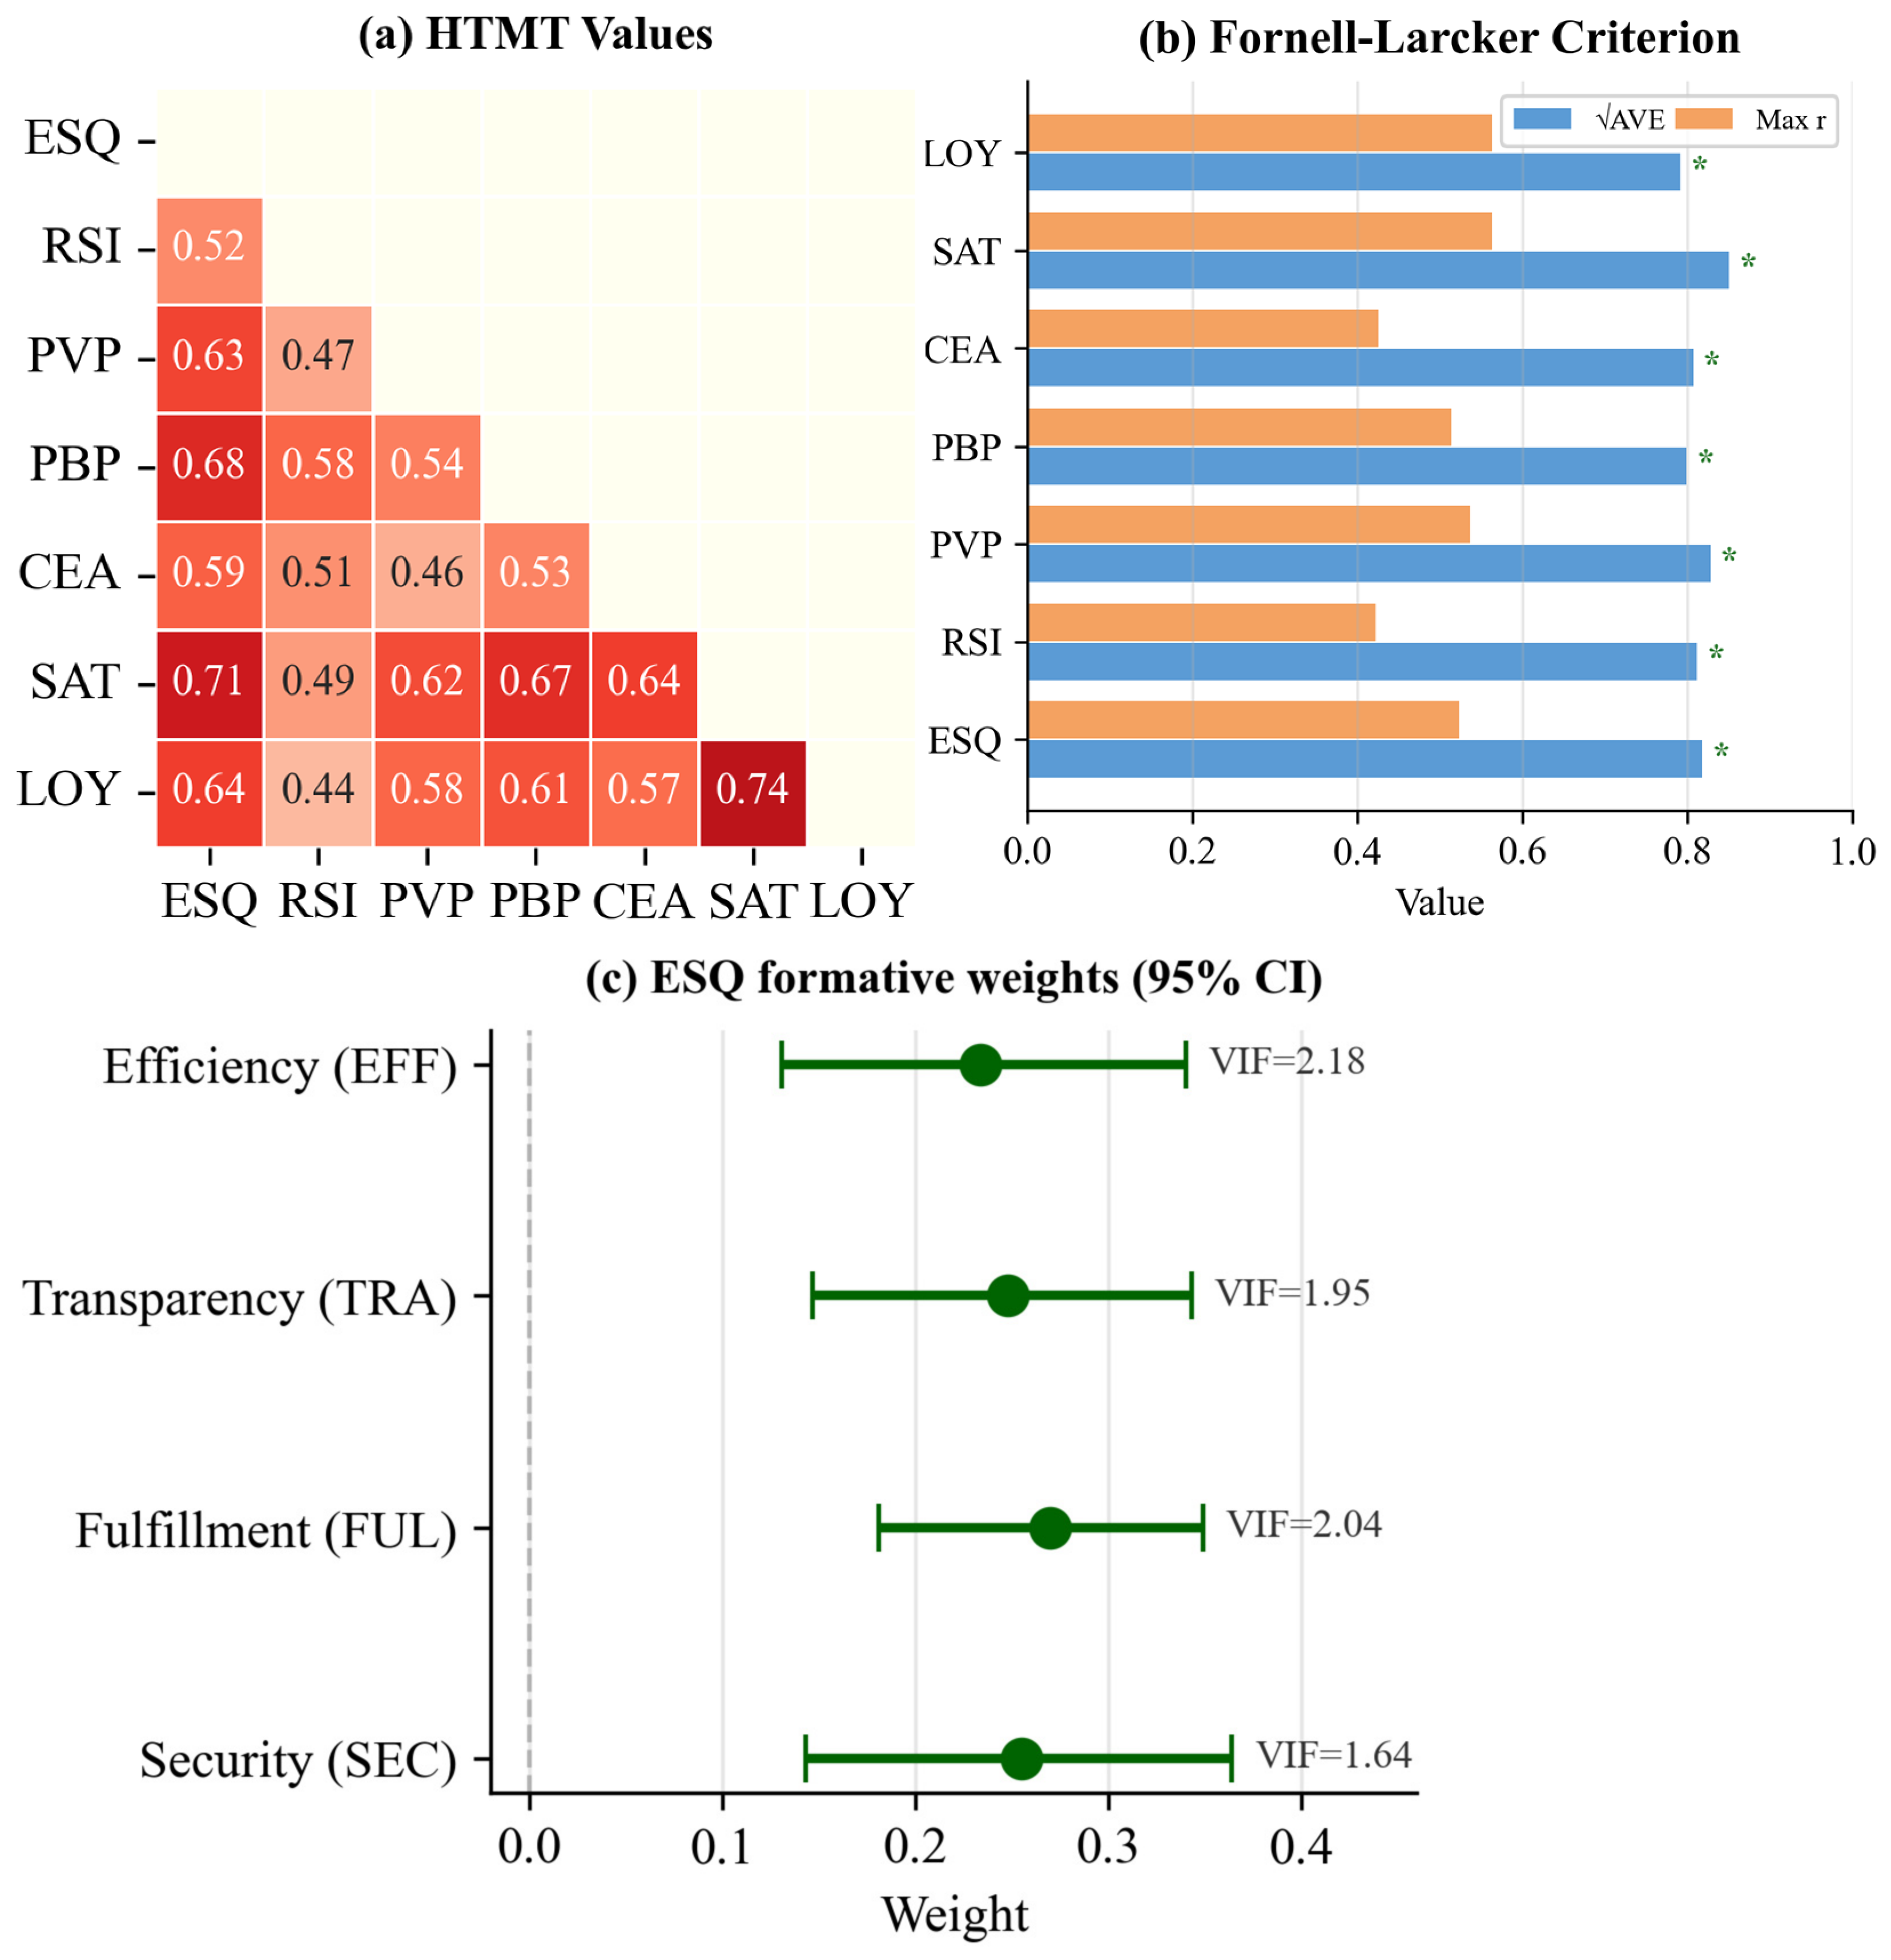
Weights in formative measurement model for the four ESQ dimensions varied between 0.229 and 0.275 (VIF 1.64 to 2.18), and for the three RSI dimensions between 0.253 and 0.384 (VIF 1.51 to 2.04). The paths for redundancy analysis in case of ESQ and RSI with respect to their global evaluation criteria were 0.902 and 0.874, respectively. The HTMT values for PBP regarding platform transparency, trust, and uncertainty of outcome were 0.430, 0.566, and 0.550, respectively, with all upper bounds at the 95% CI lower than 0.85. Alternative measurement models combining PBP with the other constructs showed a poor fit compared to the four-construct discriminant model (CFI = 0.991, RMSEA = 0.031, SRMR = 0.049). The correlation matrix among the core constructs is shown in Figure 4.
Figure 4.
Correlation matrix heatmap of core constructs. Bold borders indicate r > 0.50.
4.3. Structural Paths, Mediation Type, and Dual-Threshold Results
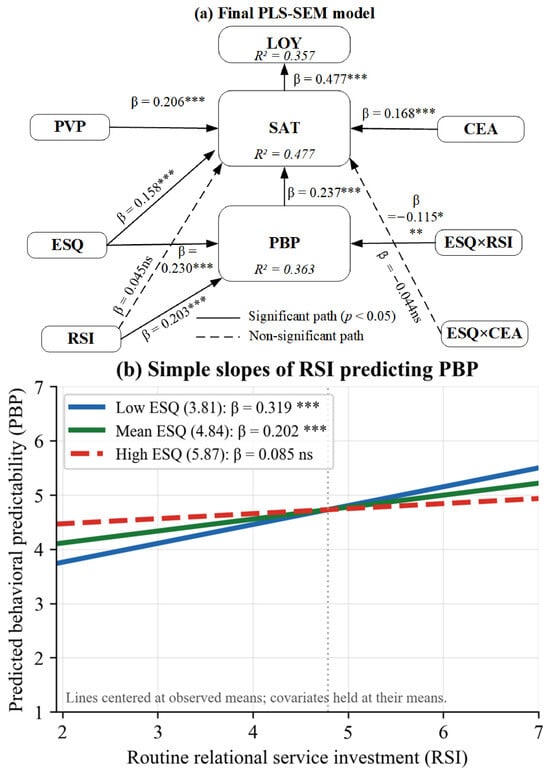
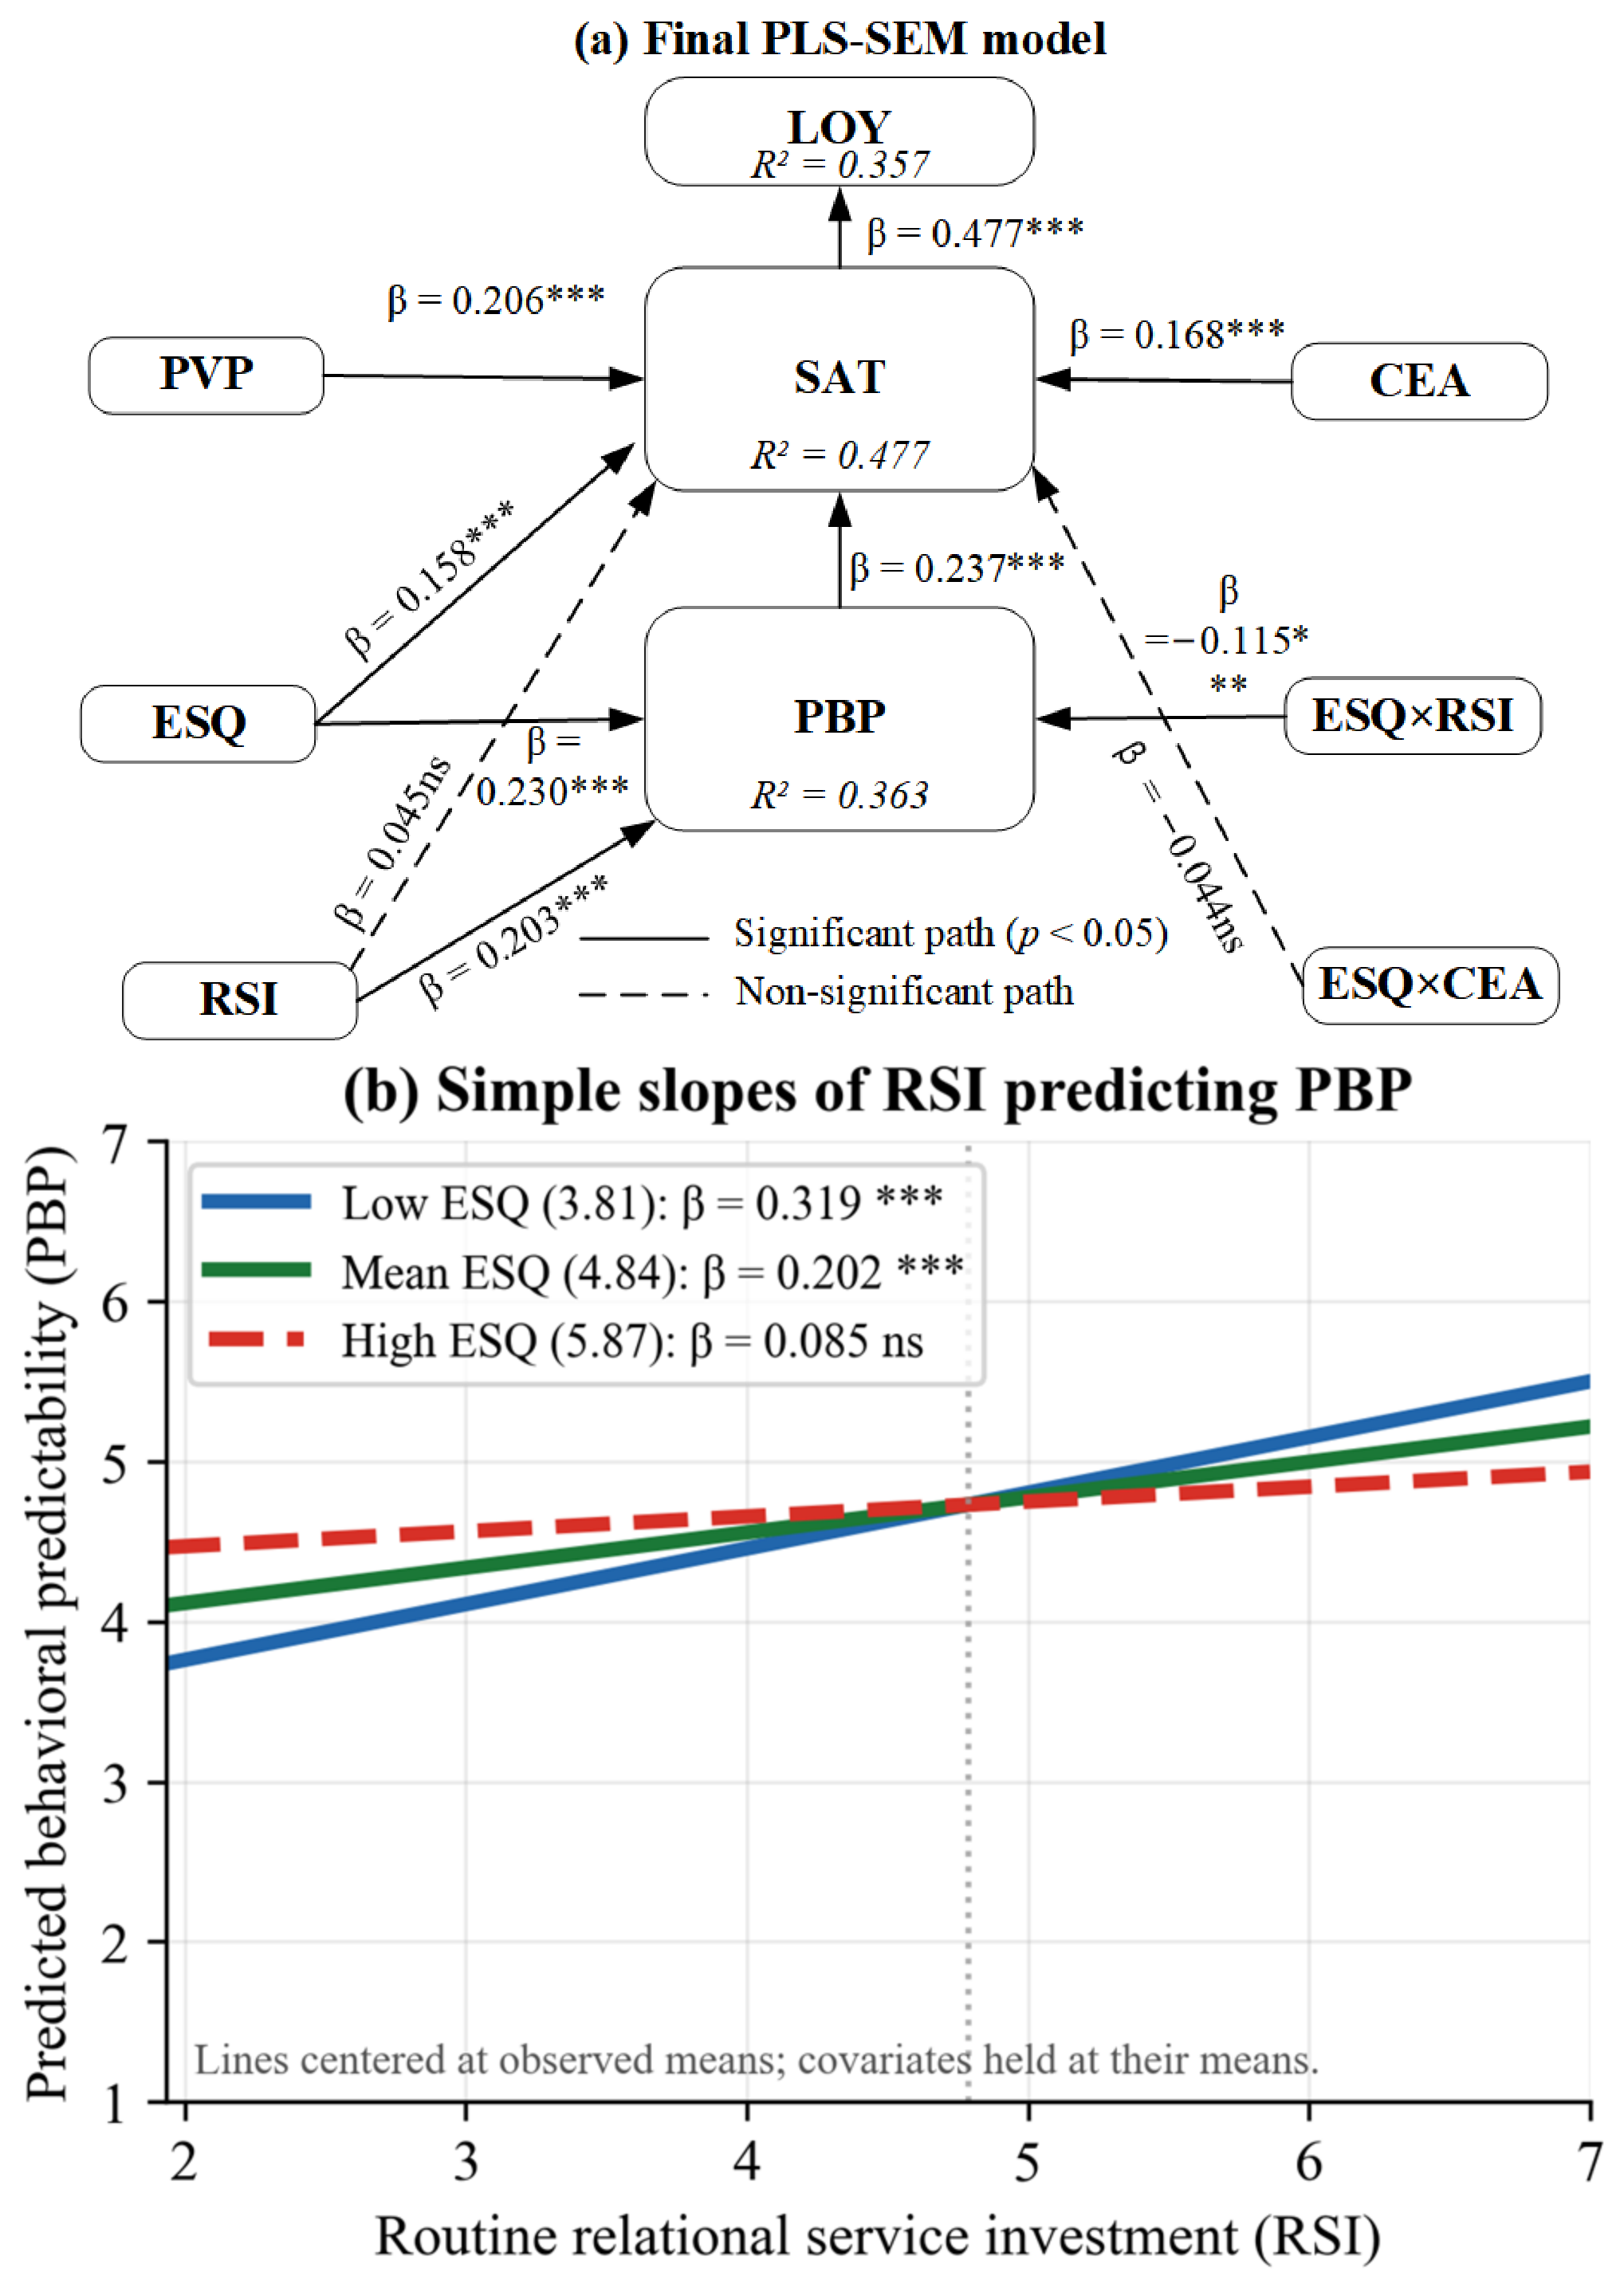
Figure 5 presents the discriminant validity and formative weight diagnostics, and Table 5 reports the structural path coefficients with 95% bootstrap confidence intervals. PVP was significantly positively associated with satisfaction (β = 0.206, 95% CI [0.121, 0.290], p < 0.001, f2 = 0.052), supporting H1. ESQ was significantly positively associated with satisfaction (β = 0.158, 95% CI [0.067, 0.248], p < 0.001, f2 = 0.026), supporting H3. Routine RSI showed a positive but non-significant direct effect on satisfaction (β = 0.045, 95% CI [−0.033, 0.121], p = 0.276), so H2 was not directly supported. Satisfaction was strongly positively associated with loyalty (β = 0.477, 95% CI [0.393, 0.562], p < 0.001, f2 = 0.260), supporting H4a. The indirect effects of PVP and ESQ on loyalty through satisfaction were 0.098 (95% CI [0.056, 0.143], p < 0.001) and 0.075 (95% CI [0.031, 0.124], p < 0.001), respectively. The indirect effect of RSI on loyalty through the satisfaction direct path was 0.022 (95% CI [−0.016, 0.058], p = 0.247), non-significant. H4b received partial support.
Figure 5.
Measurement model diagnostics: (a) HTMT values among core constructs, with colour intensity proportional to the magnitude of the HTMT value (darker shades indicate higher values), (b) Fornell–Larcker criterion comparing the square root of AVE (blue bars) with the highest correlation of each construct with any other construct (orange bars), where green asterisks indicate that √AVE exceeds the maximum correlation, and (c) ESQ formative weights with 95% bootstrap confidence intervals and VIF values.
Table 5.
Structural model path coefficients.
RSI was significantly positively associated with PBP (β = 0.203, 95% CI [0.122, 0.285], p < 0.001, f2 = 0.047), supporting H5a. ESQ was significantly positively associated with PBP (β = 0.230, 95% CI [0.145, 0.317], p < 0.001, f2 = 0.060), supporting H5b. PBP was significantly positively associated with satisfaction (β = 0.237, 95% CI [0.163, 0.310], p < 0.001, f2 = 0.069), and the indirect effect of RSI on satisfaction through PBP was 0.048 (95% CI [0.025, 0.076]). The sequential indirect effect of RSI on loyalty via PBP and satisfaction was found to be 0.023 (95% CI [0.012, 0.037]). This indicates that routine RSI affects satisfaction and loyalty mainly through PBP rather than directly, thereby supporting the indirect-only mediation framework. H5c was supported.
The ESQ × RSI interaction on PBP was significant and negative (β = −0.115, 95% CI [−0.184, −0.049], p = 0.001, f2 = 0.024), supporting H5d. Simple slopes of RSI on PBP were 0.319 at low ESQ (3.81, p < 0.001), 0.202 at mean ESQ (4.84, p < 0.001), and 0.085 at high ESQ (5.87, p = 0.184). The Johnson–Neyman statistical boundary was ESQ = 5.747. The moderated mediation index was −0.013 (95% CI [−0.023, −0.005]), supporting H5e. Figure 6 illustrates the interaction pattern and simple slopes.
Figure 6.
Structural model and moderation results. (a) Final PLS-SEM model with standardized path coefficients; solid lines denote statistically significant paths (p < 0.05) and dashed lines denote non-significant paths, and arrows point from predictor to outcome; R2 values appear inside the construct boxes. All coefficients correspond to those reported in Table 5. (b) Simple slopes of routine relational service investment (RSI) predicting behavioral predictability (PBP) at low ESQ (3.81), mean ESQ (4.84) and high ESQ (5.87); the vertical dotted line marks the sample mean of RSI, and covariates are held at their means. The Johnson–Neyman boundary is reported on the ESQ scale in Figure 7c. ESQ = electronic service quality; SAT—customer satisfaction; LOY—customer loyalty; PVP—perceived platform value; CEA—complex exception-handling capability. *** p < 0.001; ns—not significant.
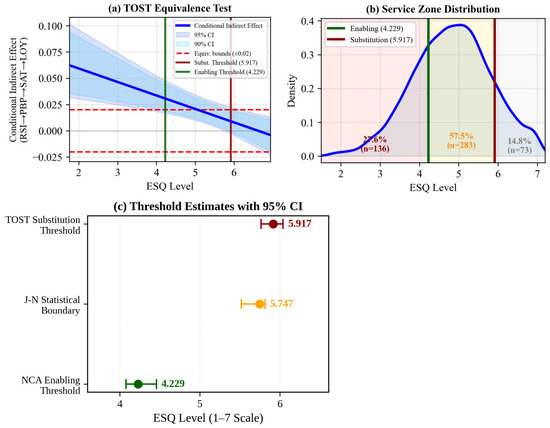
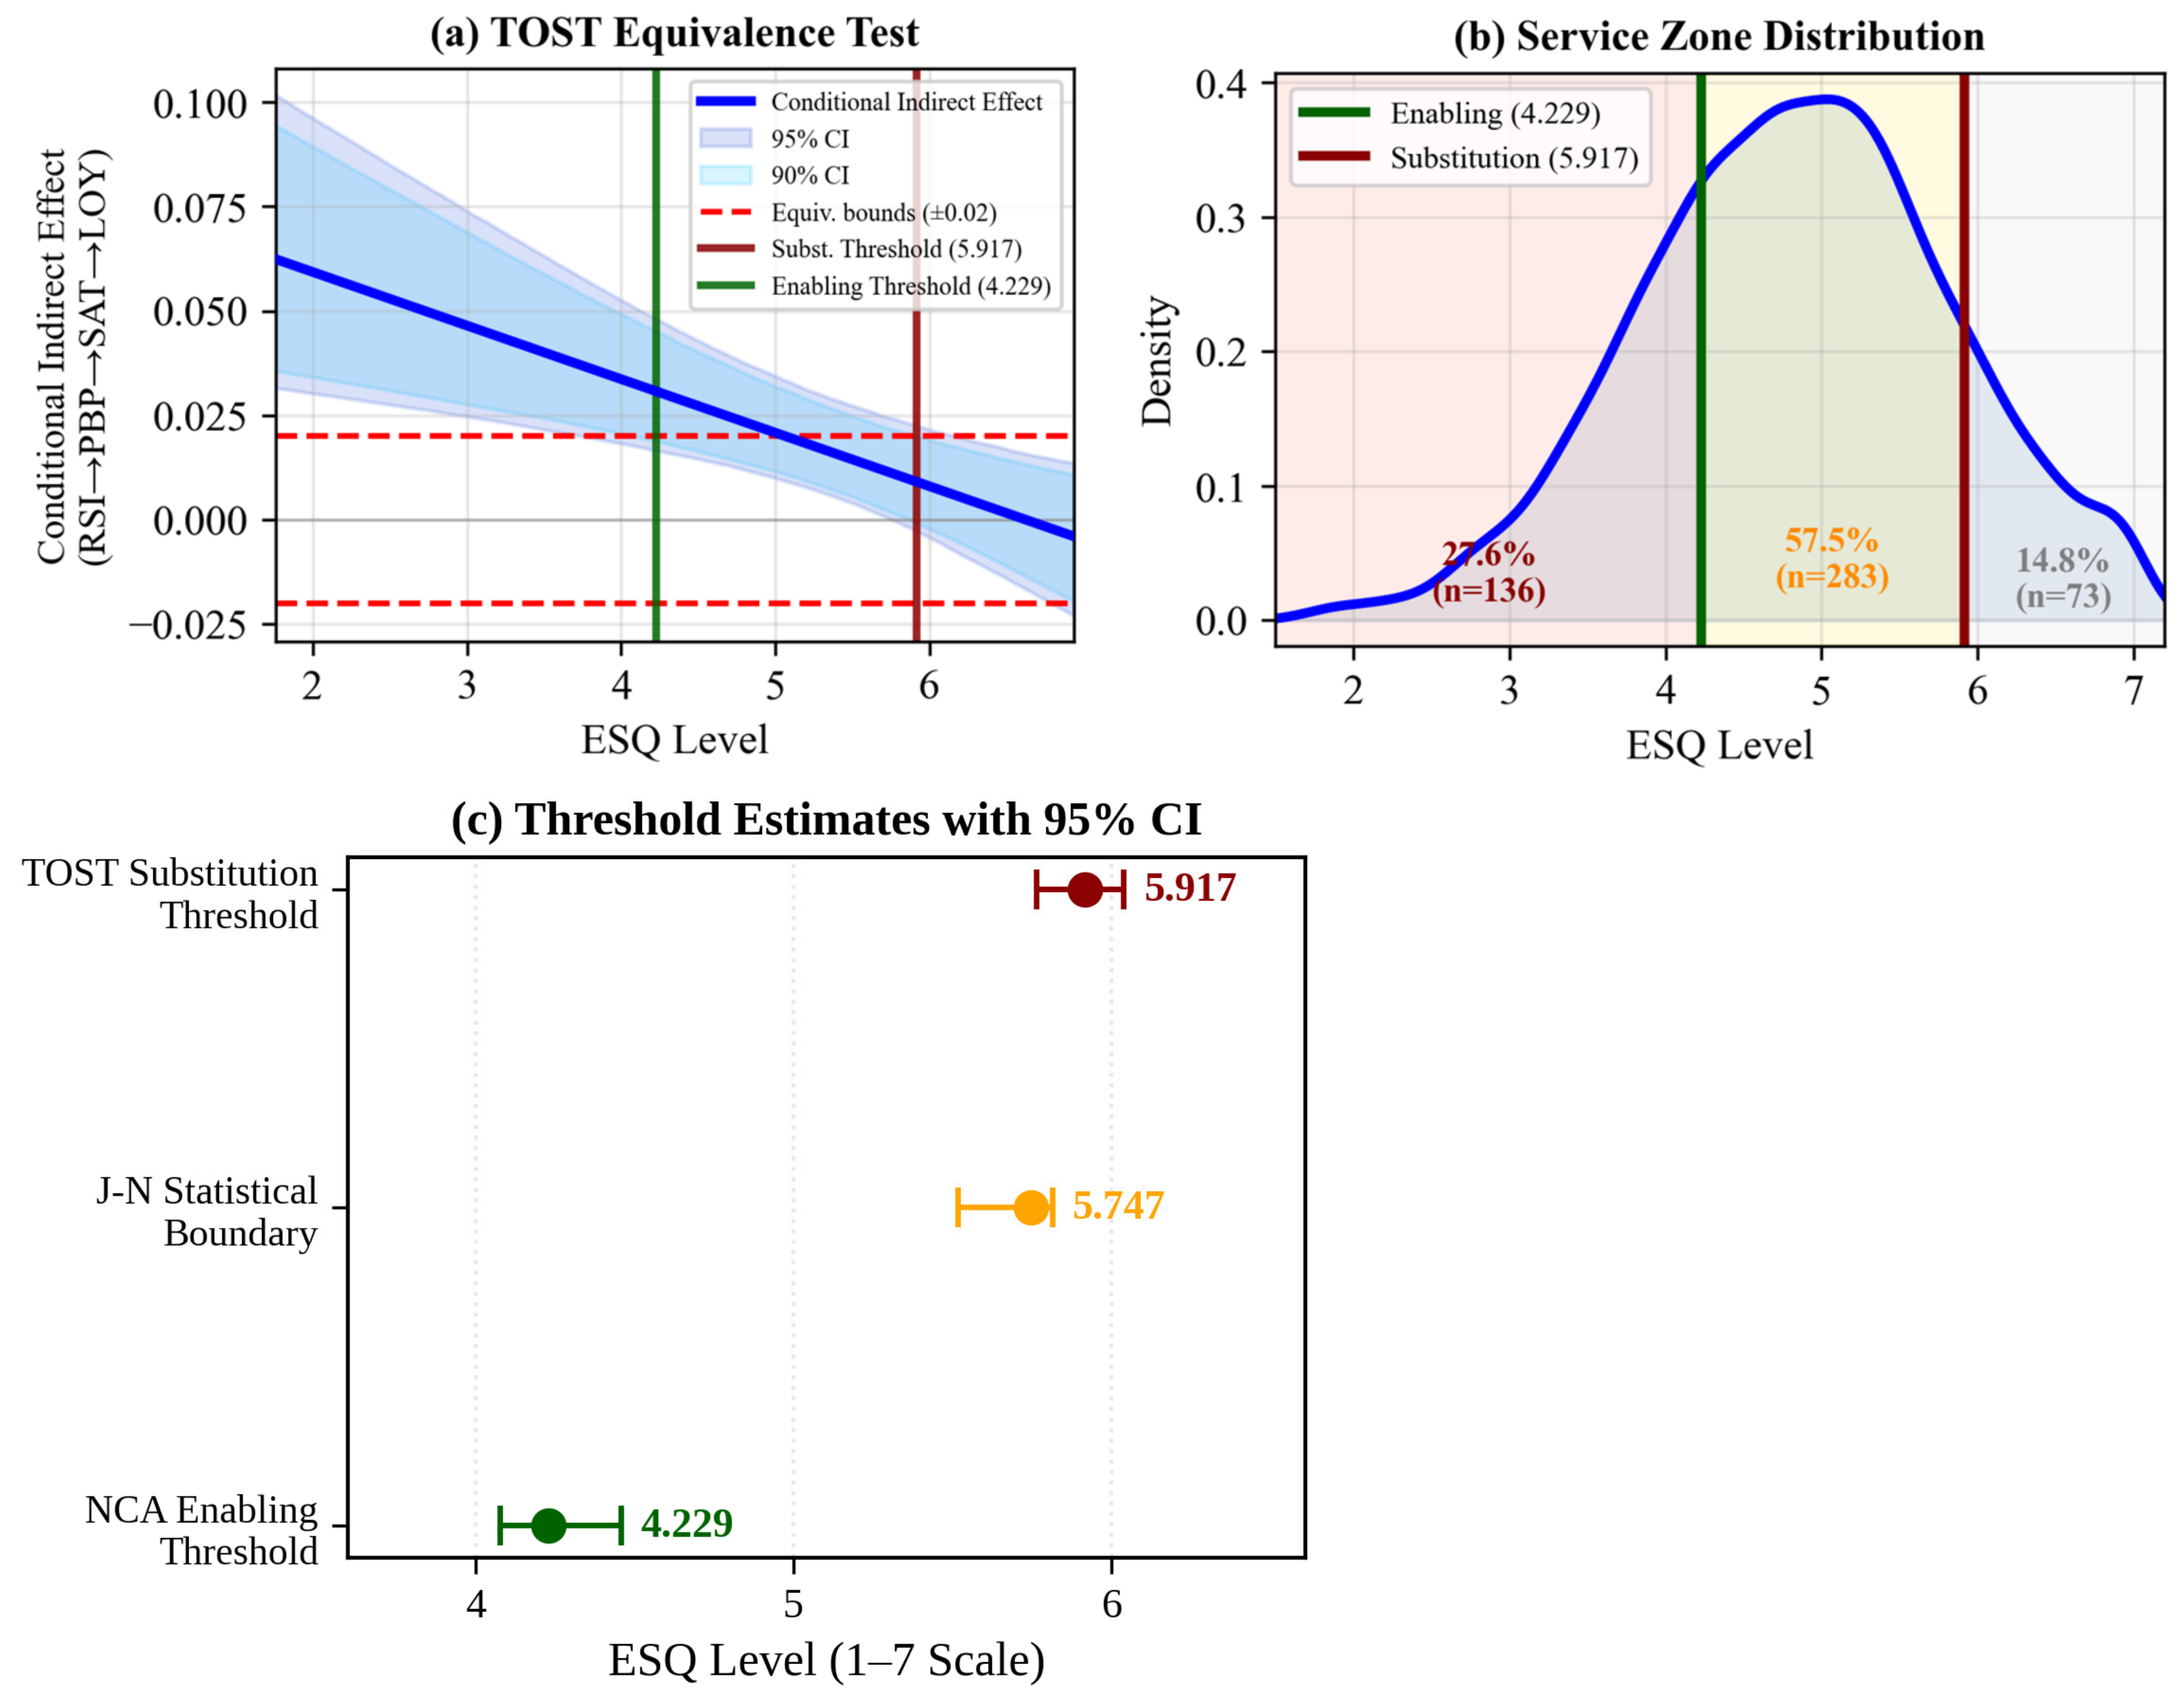
According to the TOST test of equivalence, the sequential indirect effect became part of the equivalence range ±0.02 starting from the ESQ of 5.917, which is considered the substitution threshold. According to the NCA analysis with empirical scope, the CR-FDH effect size of d is 0.234 (permutation p < 0.001). The ESQ of the bottleneck that corresponds to the 80% loyalty outcome is 4.229, which is considered the enabling threshold. Bottleneck analysis in theoretical scope yielded a bottleneck of 4.123 and d = 0.274. The results were consistent in terms of direction and conclusion. H6 was therefore supported within the limits of the observed sample and scaling choices. According to the thresholds of enabling at 4.229 and substitution at 5.917, the sample group was categorized into a zone of digital foundation deficit with 136 observations (27.6%), mixed services zone with 283 observations (57.5%) and routine relational investment plateau with 73 observations (14.8%). The 95% bootstrap confidence intervals of the two thresholds did not overlap and were correctly ordered (enabling threshold 4.229, 95% CI [4.07, 4.47]; substitution threshold 5.917, 95% CI [5.76, 6.05]), which satisfies the pre-specified condition stated in Section 2.4 for imposing the three-zone structure. Figure 7 presents the dual-threshold analysis.
Figure 7.
Dual-threshold analysis. (a) TOST equivalence test of the conditional sequential indirect effect (RSI→PBP→SAT→LOY) across the observed ESQ range, showing 90% and 95% bootstrap confidence bands, the ±0.02 equivalence bounds (red dashed lines), the enabling threshold (green) and the substitution threshold (dark red). (b) Distribution of the sample across the three service zones defined by the two thresholds. (c) Point estimates and 95% confidence intervals for the NCA enabling threshold, the Johnson–Neyman statistical boundary and the TOST substitution threshold, all expressed on the seven-point ESQ scale.
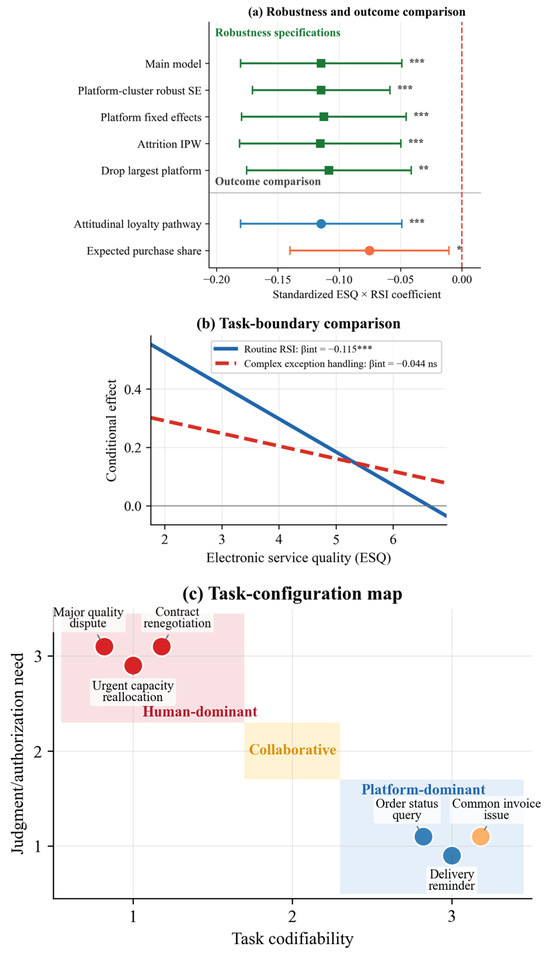
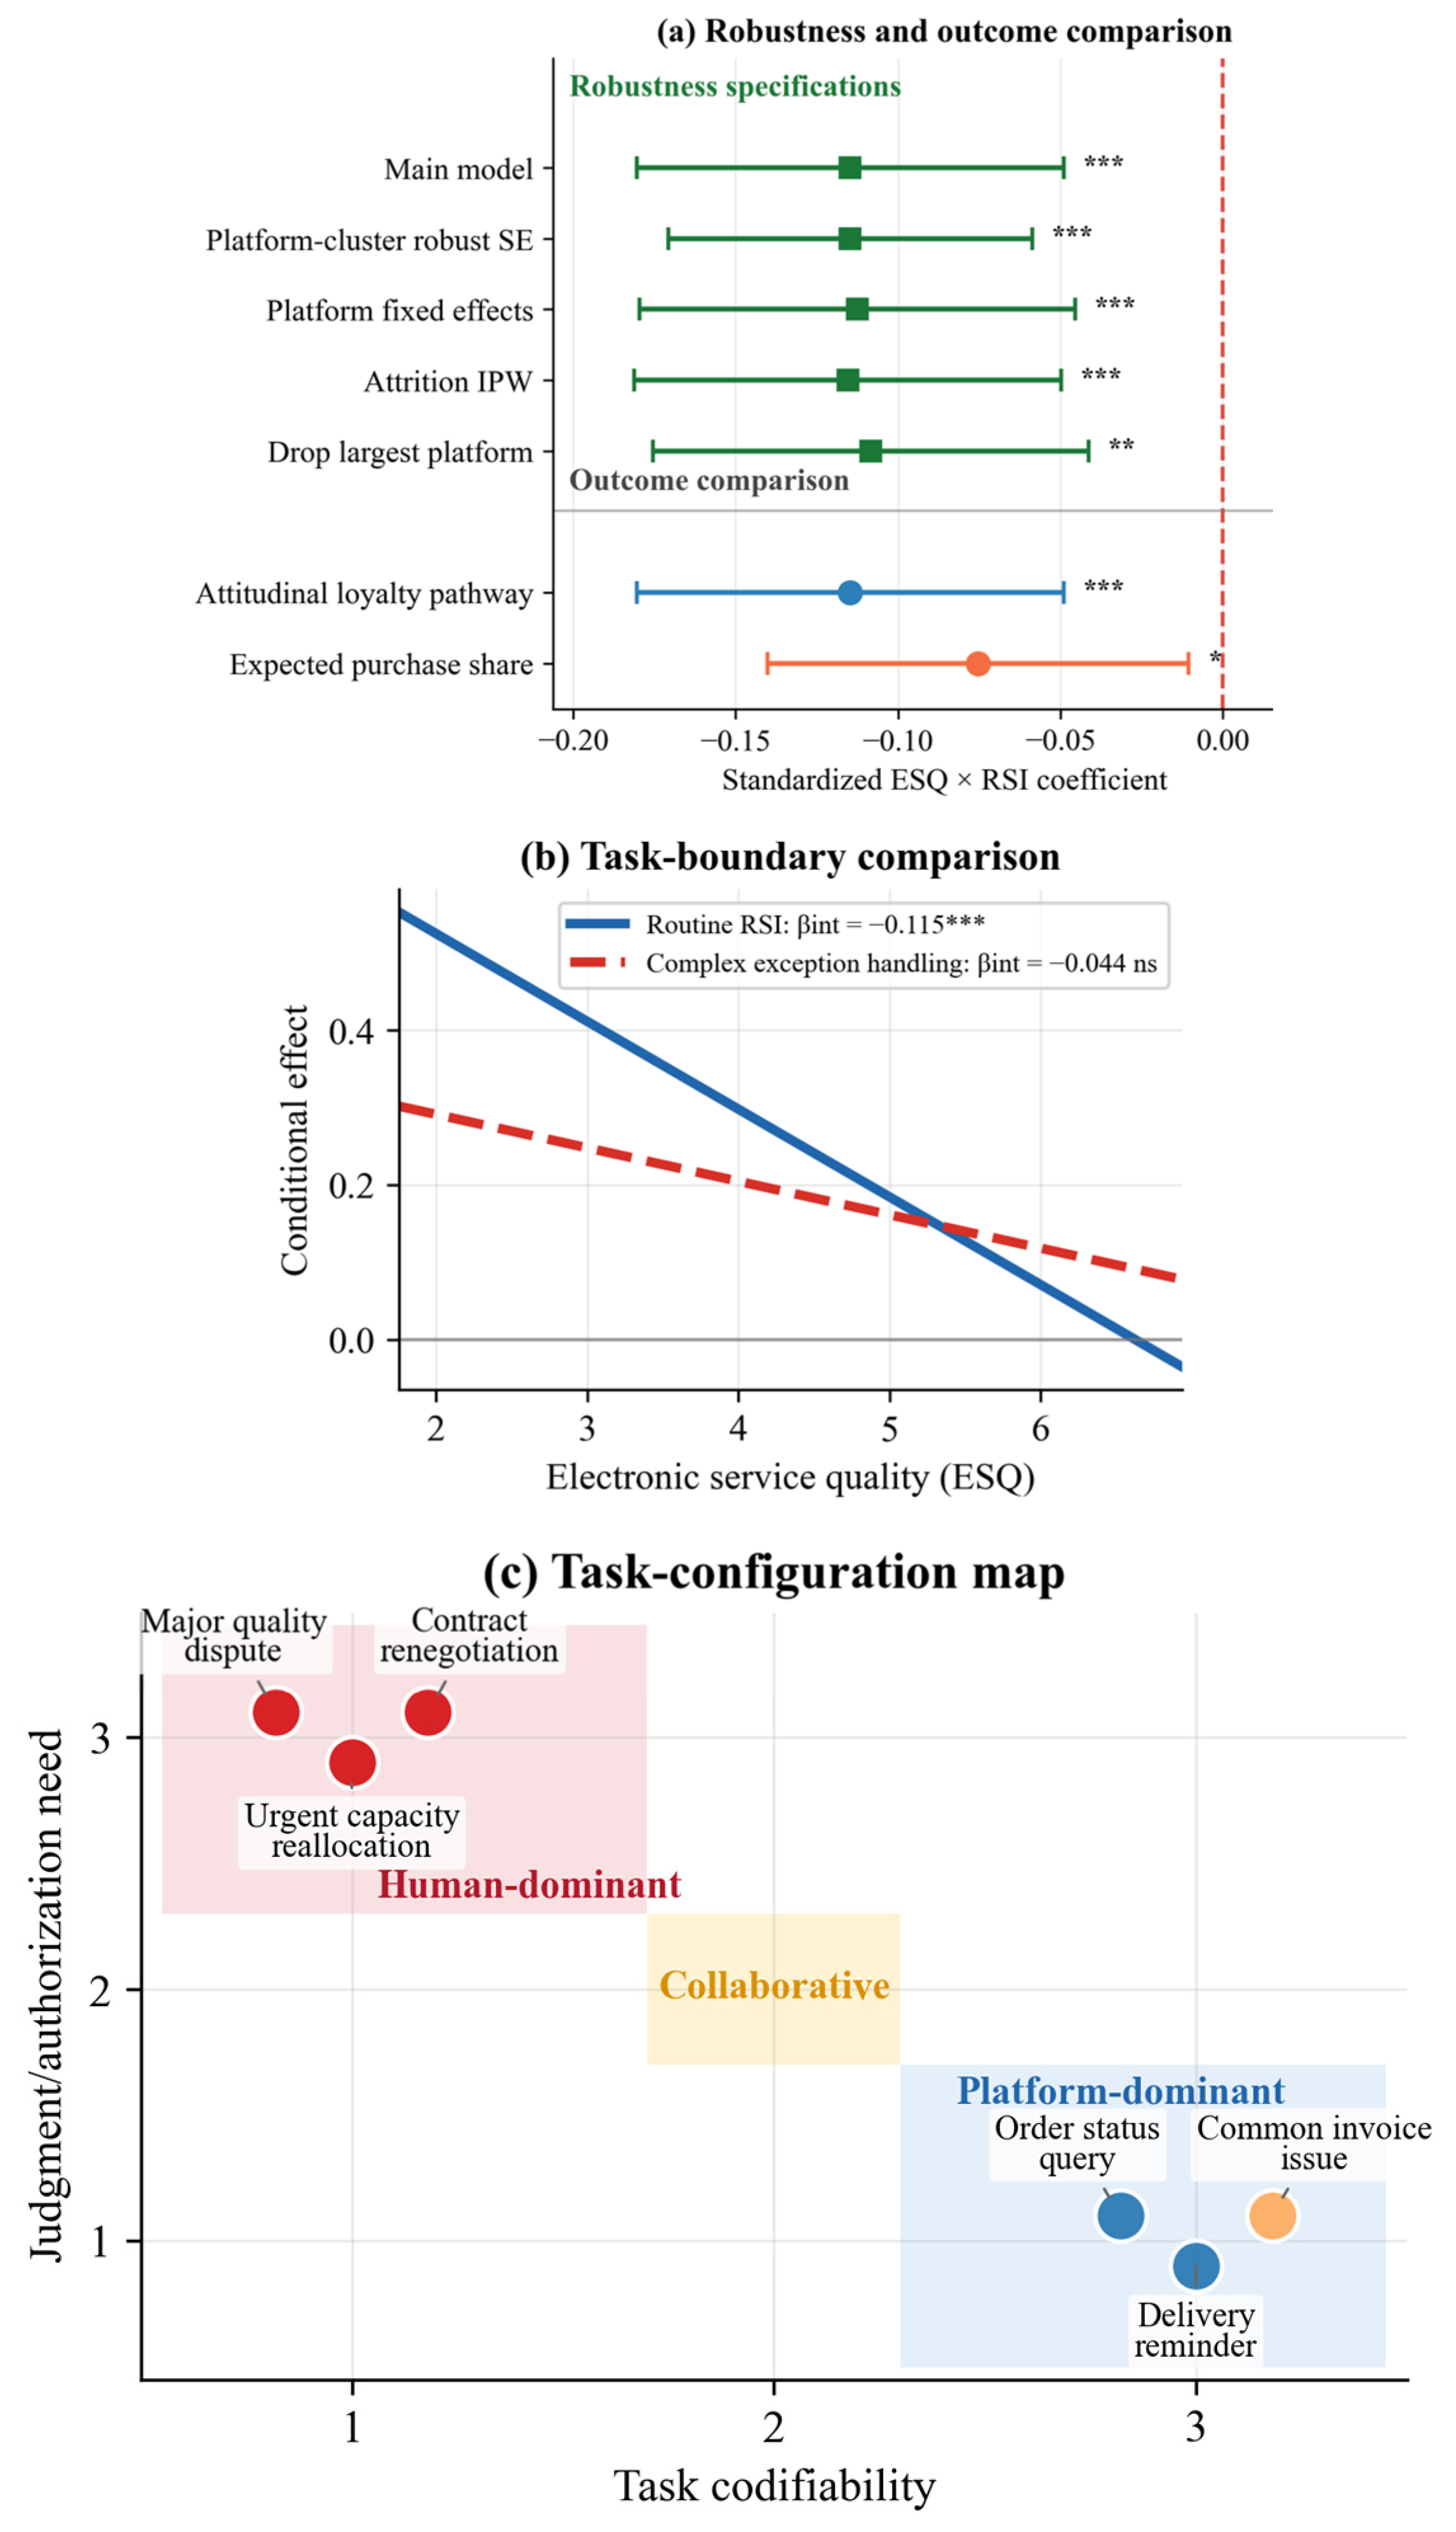
CEA was significantly positively associated with satisfaction (β = 0.168, 95% CI [0.083, 0.255], p < 0.001). The ESQ × CEA interaction on satisfaction was negative and non-significant (β = −0.044, 95% CI [−0.114, 0.021], p = 0.167). This is consistent with the task-boundary argument: complex exception handling retains positive value regardless of platform quality. In the direct difference test of the interaction terms, there was no significant difference (difference = −0.071, 95% CI [−0.173, 0.033], p = 0.188), so the conclusion is stated as pattern-level support rather than a confirmed differential moderation.
4.4. Robustness Checks and Interview Validation
The model performance statistics are as follows: R2 = 0.363 for PBP, R2 = 0.477 for satisfaction, and R2 = 0.357 for loyalty. The values of Q2predict are 0.331, 0.444, and 0.331, respectively. The number of indicators for which the prediction error is lower than that of the linear benchmark is 10 out of 11 (90.9%), supporting modest but consistent predictive precision. Figure 8 presents robustness, outcome-comparison, and task-boundary diagnostics.
Figure 8.
Robustness, outcome-comparison, and task-boundary diagnostics. * p < 0.05, ** p < 0.01, *** p < 0.001.
Across all six robustness checks, including platform-cluster-robust standard errors, platform fixed effects, deleting largest platforms, event marker control, inverse probability weighting, and event change case reinclusion, the coefficient on ESQ × RSI remained in the range −0.108 to −0.115, consistent in sign and significance. When deleting 1% of the most extreme values, the effect size for the NCA necessary condition was d = 0.166 (p < 0.001). The moderated sequential indirect effect using expected purchase share was negative and statistically different from zero (estimate = −0.095, 95% CI [−0.165, −0.037]). The negative result suggests that the substitution mechanism is not limited to attitudinal loyalty.
The categorization of task coding under the qualitative analysis showed that routine tasks were highly codifiable and standardized, while complex tasks were highly interdependent with cross-functional departments and required non-standardized authorization. Five themes in interviews were consistent with the pattern identified in the quantitative analysis: platforms replacing routine information dissemination, complicated exceptions still needing human intervention, platform errors triggering contact between people, account managers moving towards handling exceptions, and platform transparency not meaning behavioral predictability. Table 6 reports the indirect, sequential, and conditional indirect effects.
Table 6.
Indirect, sequential, and conditional indirect effects.
5. Discussion
5.1. Main Findings and Dual-Threshold Implications
The research provides two ESQ thresholds with their respective substantive significance. The first is the NCA enabling threshold with a value of 4.229. It implies that when the ESQ level is below this threshold, platform quality is a limitation to the development of loyalty among the respondents. The other threshold is the TOST substitution threshold with a value of 5.917. It implies that when ESQ is above the threshold, conditional sequential indirect effect of routine relational investment on loyalty through behavioral predictability and satisfaction becomes practically equivalent to zero. The gap between the two thresholds suggests a mixed service zone of 1.69 units where platform quality and routine relational investment contribute to loyalty together. The three-zone structure is therefore consistent with the observed threshold pattern [50,51].
Below the enabling threshold, 27.6% of the sample is constrained by platform quality. While more personnel-to-personnel communication may partly compensate for lack of platform knowledge, it cannot wholly replace the assurance offered by platform activities. In the hybrid service environment (57.5% of the sample), technology creates a common digital foundation, while people increase the predictability of behavior through proactive explanation and coordination of processes which goes beyond what the technology alone can reveal. Above the substitution threshold (14.8% of the sample), the conditional indirect effect of routine RSI on loyalty is practically equivalent to zero, but that does not imply that all relational value has vanished [52,53].
The positive connection between CEA and satisfaction remained constant irrespective of the ESQ value, as was anticipated given that the processing of exceptions using cross-departmental resource allocation and conflict resolution was yet to be automated on the platform. The non-significant ESQ × CEA interaction is consistent with the task-boundary interpretation, but the difference between the ESQ × RSI and ESQ × CEA coefficients was not statistically significant. Thus, the statement is made on the pattern level, not differential moderation. Exception handling of this kind corresponds to the encounters that the service quality and recovery literature identifies as disproportionately consequential for customer evaluations, which is consistent with the persistence of the CEA–satisfaction association [54,55]. The results are also consistent with research demonstrating that technology automation affects rule-based tasks before situational judgment and authority [25,56,57].
5.2. Theoretical Contributions
The concept of service quality under the traditional view of service quality and the IS success paradigm is considered an antecedent to satisfaction and loyalty. The current study builds on both models through the addition of ESQ as a moderating variable in terms of behavioral predictability. The fact that there is no significant effect of RSI on satisfaction but a significant effect via PBP confirms that the value added by frequent communication by account managers happens because of reduction in behavioral uncertainty rather than through an improvement in evaluative judgment as such [27,29]. This pattern differs from electronic service quality research in consumer settings, where platform quality is typically reported as a strong direct driver of satisfaction. In the present B2B context the direct ESQ–satisfaction path is comparatively weak (f2 = 0.026), suggesting that platform quality functions more as a precondition than as a primary driver of evaluative satisfaction in enterprise relationships. This reframes ESQ from a direct antecedent of satisfaction into a boundary condition that governs when relational effort still creates value.
The moderated mediation model indicates that ESQ and routine RSI do not merely act as additive factors in forming loyalty. If ESQ is low, routine RSI acts as a substitute for the lack of platform information and thus contributes to the gain in predictive power about behavior. On the other hand, if ESQ is high, then the platform provides the very same informational input provided by the routine personnel, leaving minimal contribution to predictability of additional routine personnel interaction. Such functional overlap mechanism is in line with the resource orchestration view, according to which firms must reconfigure resource combinations as capabilities evolve [41,58]. Platforms and personnel are not permanently complementary; their marginal value relationship co-evolves with platform maturity and with the governance and capability changes that accompany it. Earlier work on B2B platform substitution reports that platform usage lowers transaction costs and improves buyer performance as a general effect. The present results qualify this by locating substitution at the level of specific task categories and only above a certain level of platform quality, rather than treating it as a uniform property of platform adoption. The substitution is therefore functional rather than relational: platforms displace the codifiable information function first, while judgment and authority remain with people.
The dual-threshold logic makes a distinction between the necessary and sufficient conditions for loyalty. The ESQ of 4.229 is a necessary condition for loyalty rather than a sufficient condition because loyalty is based on trust, switching cost, price, and supply capacity. The substitution threshold of 5.917 is not a point of switching from having any relational value to not having it. On the contrary, it indicates the ESQ when the contribution of RSI in terms of behavioral predictability becomes inconsequential, whereas the complex exception handling remains significant. This differentiation takes a step further from earlier models that viewed the human-digital complementarity condition as a binary or static condition [59,60]. Research on professional service automation reaches a similar conclusion that rule-based work is displaced before judgment-based work, but treats the boundary as a fixed attribute of the task. The threshold results indicate instead that the same task can retain or lose incremental value depending on platform quality, which is why the boundary is reported here as a range rather than a classification. Complementarity is thus better modelled as a range bounded by two thresholds than as a single on-or-off condition.
5.3. Managerial Implications and Operational Diagnostics
The three-zone structure offers a stage-wise model to allocate efforts of account managers depending on how platforms have developed. The number of account managers need not be reduced merely because the platform is in place. It depends upon where the customers perceive their ESQ in the three zones [61]. Zone assignment should be based on customer-reported ESQ rather than internal platform metrics, since the thresholds in this study were estimated on perceived quality.
With regard to customers in the digital foundation deficit zone, efforts should be made to improve the reliability of the platform, transparency of the status, digital delivery capability, and the security of the information before moving on to routine personnel communication. Improved routine communication can partly offset platform shortcomings, but it cannot remove the ceiling that platform quality imposes on loyalty. Investing efforts to improve the platform pay off in higher gains in loyalty relative to increased account management activity. Practically, this means prioritizing order-status accuracy, system availability, and digital document delivery before adding contact frequency, since additional communication cannot lift loyalty past the ceiling imposed by platform quality.
For customers in the mixed service zone, value is jointly created by both the platform and the person. The suppliers need to continue with their proactive approach, milestone reminders, and key-node cooperation, but reduce their mechanical communication activities because these can now be performed by the platform. The position of the account manager changes from being an information mediator to an interpretation and escalation pathway communicator. Explaining how exceptions will be processed adds behavioral predictability that cannot yet be read directly from platform records [62]. A workable rule is to retain proactive contact at exception-prone milestones such as schedule changes, specification revisions, and delivery deviations, while allowing routine status queries to be served by the platform.
With regard to the plateau in routine relational investments, suppliers can gradually shift account managers from order enquiries, reminders, and status reporting toward authorization, coordination, negotiation, and relationship repair. The plateau does not suggest that account managers do not play any role. Instead, it implies that there are no further information handling jobs worth the marginal manpower resources and that manpower resources should be utilized for exception handling [63]. Reallocation should also be gradual, since exception handling requires cross-departmental authority that takes time to develop and cannot be transferred as quickly as routine reporting duties. Four indicators can be tracked at the account level to locate a customer within the three zones: customer-reported ESQ, platform availability and order-status update latency, the share of enquiries escalated to a person, and the share of routine enquiries that bypass the platform. A rising bypass share together with low reported ESQ indicates the deficit zone, whereas a low bypass share combined with a stable escalation profile indicates the plateau zone. Because the thresholds reported here were estimated in one industry, firms should calibrate trigger values against their own service-level history rather than adopting the sample values directly.
5.4. Limitations and Future Research
Several limitations remain. Most reflect design choices made to keep the two thresholds identifiable rather than oversights, and the reasoning behind each is explained below. First, this research is limited to the setting of construction supply chain. ESQ thresholds might be varying in other industries where informational environment is different, regulatory regime is distinct, or there is another pattern of maturity of the platform. A single industry was chosen deliberately, because threshold estimation requires ESQ to carry the same meaning across respondents; pooling industries with different platform functions would have confounded the ESQ scale and made both thresholds uninterpretable. Second, intended purchase share is a future intention rather than a record of transactions that makes the study vulnerable to the common method variance problem despite two waves of observation [64]. Actual allocation records are held in buyer procurement systems and were not releasable by the participating firms for confidentiality reasons, so expected share was included as a secondary outcome to test whether the substitution pattern extends beyond attitudinal loyalty. Third, a two-wave observational framework cannot reveal the causal effect of platform improvements on relational resource value. A three-wave design would separate the mediator from the outcomes, but the inter-wave interval was set at roughly six weeks to balance temporal separation against attrition; a longer interval would have reduced the matched sample below the size needed to estimate thresholds in the high-ESQ range. Fourth, there are only 73 observations in the high ESQ segment while the threshold neighborhood has adequate density, replication with larger high-quality platform samples is warranted [65]. The stratified design targeted platform maturity rather than the plateau zone itself, since zone membership is defined by thresholds that could not be known before analysis.
Because customer-perceived RSI does not measure supplier labor or cost directly, the results identify the point at which perceived relational value approaches zero, not a return-on-investment estimate. Supplier cost records were not comparable across 23 platforms, and customer-perceived investment is in any case the construct that theoretically drives predictability. The difference test between ESQ x RSI and ESQ x CEA interaction coefficient was not significant. Detecting a difference between two interaction coefficients requires considerably more power than detecting each one separately, so the study was powered for the focal interaction but not for the contrast; the CEA comparison was therefore specified in advance as a boundary check rather than as a hypothesis. Thus, the task boundary hypothesis needs to be confirmed through a larger sample and a task-based experiment design [66]. Future research should verify whether this substitute hypothesis exists in behavioral metrics as well. Replication in procurement of SaaS, supply chain finance, and industrial commodities trading platforms would provide for generalizability of the dual-threshold architecture. Task-level contrasts among information transmission, decision-making, negotiation, and exception authority would determine differential substitutability along the general routine-complex dimension [67].
6. Conclusions
This research investigates the ESQ level beyond which further investment in routine relational services is unlikely to yield additional loyalty gains in B2B online service platforms. Two-wave data from enterprise clients across multiple B2B online service platforms, analyzed by PLS-SEM conditional indirect effects, TOST equivalence testing, and NCA, suggest two theoretically motivated ESQ-based thresholds. The enabling threshold indicates the empirical bottleneck level associated with a high loyalty target in the NCA. The substitution threshold is the point beyond which the conditional sequential indirect effect of RSI on loyalty through behavioral predictability and satisfaction approaches practical zero.
The gap between the two threshold levels can justify the existence of a three-level service system. Below the enabling threshold, loyalty is constrained by platform quality. Between the two thresholds, platform and personnel effects combine, and account managers should move from being simply responsible for transferring information to interpreting and explaining behavior. Above the substitution threshold, routine personnel interactions no longer increase loyalty through predictability, whereas exception handling remains positively associated with satisfaction.
These findings suggest that ESQ should be viewed not only as a precursor of satisfaction but also as a boundary condition under which further routine relational investment can lead to increased loyalty. Behavioral predictability is the mechanism through which platform quality shapes the value of routine relational services. Platforms start by displacing standardized information and coordination tasks. Human judgment, interdepartmental clearance, and relationship repair remain the space where account managers still matter. The two-threshold approach serves as a roadmap that helps suppliers manage the shift from human-only coordination to hybrid coordination, using platforms and specialized human judgment according to task codifiability.
Author Contributions
Conceptualization, H.C. and C.M.; methodology, H.C.; software, H.C.; validation, H.C., T.S. and N.M.; formal analysis, H.C.; investigation, H.C.; resources, C.M.; data curation, H.C.; writing—original draft preparation, H.C.; writing—review and editing, C.M., T.S. and N.M.; visualization, H.C.; supervision, C.M.; project administration, C.M. All authors have read and agreed to the published version of the manuscript.
Funding
This research received no external funding.
Institutional Review Board Statement
The two-wave survey and interview procedure was reviewed and approved by the Research Ethics Committee of Bansomdejchaopraya Rajabhat University, Bangkok, Thailand (REC-BSRU COA No. 680907).
Informed Consent Statement
All respondents received study information, gave informed consent, and were anonymized in the survey and interview files.
Data Availability Statement
The anonymized survey records, instrument items, sample-flow file, interview coding files, task-coding files, analysis scripts, analysis workbook, and software-version file are available from the corresponding author upon reasonable request. The data are not publicly deposited because platform and respondent identifiers must remain protected for reasons of commercial confidentiality and participant privacy; all files provided are anonymized at the platform and respondent level.
Conflicts of Interest
The authors declare no conflicts of interest.
References
- Hein, A.; Schreieck, M.; Riasanow, T.; Setzke, D.S.; Wiesche, M.; Böhm, M.; Krcmar, H. Digital platform ecosystems. Electron. Mark. 2020, 30, 87–98. [Google Scholar] [CrossRef] [Scilit]
- Shree, D.; Singh, R.K.; Paul, J.; Hao, A.; Xu, S. Digital platforms for business-to-business markets: A systematic review and future research agenda. J. Bus. Res. 2021, 137, 354–365. [Google Scholar] [CrossRef] [Scilit]
- Kowalkowski, C.; Wirtz, J.; Ehret, M. Digital service innovation in B2B markets. J. Serv. Manag. 2024, 35, 280–305. [Google Scholar] [CrossRef] [Scilit]
- Loux, P.; Aubry, M.; Tran, S.; Baudoin, E. Multi-sided platforms in B2B contexts: The role of affiliation costs and interdependencies in adoption decisions. Ind. Mark. Manag. 2020, 84, 212–223. [Google Scholar] [CrossRef] [Scilit]
- Marzi, G.; Marrucci, A.; Vianelli, D.; Ciappei, C. B2B digital platform adoption by SMEs and large firms: Pathways and pitfalls. Ind. Mark. Manag. 2023, 114, 80–93. [Google Scholar] [CrossRef] [Scilit]
- Kamalaldin, A.; Linde, L.; Sjödin, D.; Parida, V. Transforming provider-customer relationships in digital servitization: A relational view on digitalization. Ind. Mark. Manag. 2020, 89, 306–325. [Google Scholar] [CrossRef] [Scilit]
- Zhou, L.; Mao, H.; Zhao, T.; Wang, V.L.; Wang, X.; Zuo, P. How B2B platform improves Buyers’ performance: Insights into platform’s substitution effect. J. Bus. Res. 2022, 143, 72–80. [Google Scholar] [CrossRef] [Scilit]
- Jovanovic, M.; Sjödin, D.; Parida, V. Co-evolution of platform architecture, platform services, and platform governance: Expanding the platform value of industrial digital platforms. Technovation 2022, 118, 102218. [Google Scholar] [CrossRef] [Scilit]
- Kapoor, K.; Bigdeli, A.Z.; Dwivedi, Y.K.; Schroeder, A.; Beltagui, A.; Baines, T. A socio-technical view of platform ecosystems: Systematic review and research agenda. J. Bus. Res. 2021, 128, 94–108. [Google Scholar] [CrossRef] [Scilit]
- Peruchi, D.F.; de Jesus Pacheco, D.A.; Todeschini, B.V.; ten Caten, C.S. Moving towards digital platforms revolution? Antecedents, determinants and conceptual framework for offline B2B networks. J. Bus. Res. 2022, 142, 344–363. [Google Scholar] [CrossRef] [Scilit]
- Veile, J.W.; Schmidt, M.-C.; Voigt, K.-I. Toward a new era of cooperation: How industrial digital platforms transform business models in Industry 4.0. J. Bus. Res. 2022, 143, 387–405. [Google Scholar] [CrossRef] [Scilit]
- Kohtamäki, M.; Parida, V.; Oghazi, P.; Gebauer, H.; Baines, T. Digital servitization business models in ecosystems: A theory of the firm. J. Bus. Res. 2019, 104, 380–392. [Google Scholar] [CrossRef] [Scilit]
- Cenamor, J.; Sjödin, D.R.; Parida, V. Adopting a platform approach in servitization: Leveraging the value of digitalization. Int. J. Prod. Econ. 2017, 192, 54–65. [Google Scholar] [CrossRef] [Scilit]
- Kowalkowski, C.; Gebauer, H.; Oliva, R. Service growth in product firms: Past, present, and future. Ind. Mark. Manag. 2017, 60, 82–88. [Google Scholar] [CrossRef] [Scilit]
- Suuronen, S.; Ukko, J.; Saunila, M.; Rantala, T.; Rantanen, H. The implications of multi-sided platforms in managing digital business ecosystems. J. Bus. Res. 2024, 175, 114544. [Google Scholar] [CrossRef] [Scilit]
- Tian, J.; Vanderstraeten, J.; Matthyssens, P.; Shen, L. Developing and leveraging platforms in a traditional industry: An orchestration and co-creation perspective. Ind. Mark. Manag. 2021, 92, 14–33. [Google Scholar] [CrossRef] [Scilit]
- Tronvoll, B.; Sklyar, A.; Sörhammar, D.; Kowalkowski, C. Transformational shifts through digital servitization. Ind. Mark. Manag. 2020, 89, 293–305. [Google Scholar] [CrossRef] [Scilit]
- Raddats, C.; Kowalkowski, C.; Benedettini, O.; Burton, J.; Gebauer, H. Servitization: A contemporary thematic review of four major research streams. Ind. Mark. Manag. 2019, 83, 207–223. [Google Scholar] [CrossRef] [Scilit]
- Rodríguez, P.G.; Villarreal, R.; Valiño, P.C.; Blozis, S. A PLS-SEM approach to understanding E-SQ, e-satisfaction and e-loyalty for fashion e-retailers in Spain. J. Retail. Consum. Serv. 2020, 57, 102201. [Google Scholar] [CrossRef] [Scilit]
- Goutam, D.; Ganguli, S.; Gopalakrishna, B. Technology readiness and e-service quality–impact on purchase intention and loyalty. Mark. Intell. Plan. 2022, 40, 242–255. [Google Scholar] [CrossRef] [Scilit]
- Alnaim, A.F.; Sobaih, A.E.E.; Elshaer, I.A. Measuring the mediating roles of e-trust and e-satisfaction in the relationship between e-service quality and e-loyalty: A structural modeling approach. Mathematics 2022, 10, 2328. [Google Scholar] [CrossRef] [Scilit]
- Shahzad, M.F.; Xu, S.; An, X.; Javed, I. Assessing the impact of AI-chatbot service quality on user e-brand loyalty through chatbot user trust, experience and electronic word of mouth. J. Retail. Consum. Serv. 2024, 79, 103867. [Google Scholar] [CrossRef] [Scilit]
- Le, K.B.; Sajtos, L.; Kunz, W.H.; Fernandez, K.V. The future of work: Understanding the effectiveness of collaboration between human and digital employees in service. J. Serv. Res. 2025, 28, 186–205. [Google Scholar] [CrossRef] [Scilit]
- McLeay, F.; Osburg, V.S.; Yoganathan, V.; Patterson, A. Replaced by a robot: Service implications in the age of the machine. J. Serv. Res. 2021, 24, 104–121. [Google Scholar] [CrossRef] [Scilit]
- Spring, M.; Faulconbridge, J.; Sarwar, A. How information technology automates and augments processes: Insights from Artificial-Intelligence-based systems in professional service operations. J. Oper. Manag. 2022, 68, 592–618. [Google Scholar] [CrossRef] [Scilit]
- Lakens, D.; Scheel, A.M.; Isager, P.M. Equivalence testing for psychological research: A tutorial. Adv. Methods Pract. Psychol. Sci. 2018, 1, 259–269. [Google Scholar] [CrossRef] [Scilit]
- Williamson, O.E. The economics of organization: The transaction cost approach. Am. J. Sociol. 1981, 87, 548–577. [Google Scholar] [CrossRef] [Scilit] [PubMed]
- Akbar, Y.H.; Tracogna, A. The digital economy and the growth dynamics of sharing platforms: A transaction cost economics assessment. J. Digit. Econ. 2022, 1, 209–226. [Google Scholar] [CrossRef] [Scilit]
- Berger, C.R.; Calabrese, R.J. Some explorations in initial interaction and beyond: Toward a developmental theory of interpersonal communication. Hum. Commun. Res. 1974, 1, 99–112. [Google Scholar] [CrossRef] [Scilit]
- Hair, J.F., Jr.; Howard, M.C.; Nitzl, C. Assessing measurement model quality in PLS-SEM using confirmatory composite analysis. J. Bus. Res. 2020, 109, 101–110. [Google Scholar] [CrossRef] [Scilit]
- Sarstedt, M.; Hair, J.F., Jr.; Cheah, J.-H.; Becker, J.-M.; Ringle, C.M. How to specify, estimate, and validate higher-order constructs in PLS-SEM. Australas. Mark. J. 2019, 27, 197–211. [Google Scholar] [CrossRef] [Scilit]
- Richter, N.F.; Schubring, S.; Hauff, S.; Ringle, C.M.; Sarstedt, M. When predictors of outcomes are necessary: Guidelines for the combined use of PLS-SEM and NCA. Ind. Manag. Data Syst. 2020, 120, 2243–2267. [Google Scholar] [CrossRef] [Scilit]
- Dul, J. Necessary condition analysis (NCA) logic and methodology of “necessary but not sufficient” causality. Organ. Res. Methods 2016, 19, 10–52. [Google Scholar]
- Parasuraman, A.; Zeithaml, V.A.; Malhotra, A. ES-QUAL: A multiple-item scale for assessing electronic service quality. J. Serv. Res. 2005, 7, 213–233. [Google Scholar]
- DeLone, W.H.; McLean, E.R. The DeLone and McLean model of information systems success: A ten-year update. J. Manag. Inf. Syst. 2003, 19, 9–30. [Google Scholar] [CrossRef] [Scilit]
- Jarvis, C.B.; MacKenzie, S.B.; Podsakoff, P.M. A critical review of construct indicators and measurement model misspecification in marketing and consumer research. J. Consum. Res. 2003, 30, 199–218. [Google Scholar] [CrossRef] [Scilit] [PubMed]
- Cuypers, I.R.; Hennart, J.-F.; Silverman, B.S.; Ertug, G. Transaction cost theory: Past progress, current challenges, and suggestions for the future. Acad. Manag. Ann. 2021, 15, 111–150. [Google Scholar] [CrossRef] [Scilit]
- Sandesh, S.P.; Paul, J. Key account management in B2B marketing: A systematic literature review and research agenda. J. Bus. Res. 2023, 156, 113541. [Google Scholar] [CrossRef] [Scilit]
- Kharlamov, A.A.; Parry, G. The impact of servitization and digitization on productivity and profitability of the firm: A systematic approach. Prod. Plan. Control 2021, 32, 185–197. [Google Scholar] [CrossRef] [Scilit]
- Belhadi, A.; Kamble, S.; Benkhati, I.; Gupta, S.; Mangla, S.K. Does strategic management of digital technologies influence electronic word-of-mouth (eWOM) and customer loyalty? Empirical insights from B2B platform economy. J. Bus. Res. 2023, 156, 113548. [Google Scholar] [CrossRef] [Scilit]
- Zeng, J.; Yang, Y.; Lee, S.H. Resource orchestration and scaling-up of platform-based entrepreneurial firms: The logic of dialectic tuning. J. Manag. Stud. 2023, 60, 605–638. [Google Scholar] [CrossRef] [Scilit]
- Dul, J.; Hauff, S.; Bouncken, R.B. Necessary condition analysis (NCA): Review of research topics and guidelines for good practice. Rev. Manag. Sci. 2023, 17, 683–714. [Google Scholar] [CrossRef] [Scilit]
- Bokrantz, J.; Dul, J. Building and testing necessity theories in supply chain management. J. Supply Chain Manag. 2023, 59, 48–65. [Google Scholar] [CrossRef] [Scilit]
- Battistoni, E.; Gitto, S.; Murgia, G.; Campisi, D. Adoption paths of digital transformation in manufacturing SME. Int. J. Prod. Econ. 2023, 255, 108675. [Google Scholar] [CrossRef] [Scilit]
- Hair, J.F.; Risher, J.J.; Sarstedt, M.; Ringle, C.M. When to use and how to report the results of PLS-SEM. Eur. Bus. Rev. 2019, 31, 2–24. [Google Scholar] [CrossRef] [Scilit]
- Becker, J.-M.; Cheah, J.-H.; Gholamzade, R.; Ringle, C.M.; Sarstedt, M. PLS-SEM’s most wanted guidance. Int. J. Contemp. Hosp. Manag. 2023, 35, 321–346. [Google Scholar] [CrossRef] [Scilit]
- Tofighi, D.; Kelley, K. Indirect effects in sequential mediation models: Evaluating methods for hypothesis testing and confidence interval formation. Multivar. Behav. Res. 2020, 55, 188–210. [Google Scholar] [CrossRef] [Scilit] [PubMed]
- Dul, J.; Van der Laan, E.; Kuik, R. A statistical significance test for necessary condition analysis. Organ. Res. Methods 2020, 23, 385–395. [Google Scholar] [CrossRef] [Scilit]
- Vis, B.; Dul, J. Analyzing relationships of necessity not just in kind but also in degree: Complementing fsQCA with NCA. Sociol. Methods Res. 2018, 47, 872–899. [Google Scholar] [PubMed]
- Caliskan, F.; Idug, Y.; Gligor, D.; Hong, S.-J. Blockchain technology for building buyer-supplier trust and transparency in supply chains: An experimental study on P2P online marketplace vendors. Ind. Mark. Manag. 2025, 124, 239–253. [Google Scholar] [CrossRef] [Scilit]
- Zhang, Y.; Huo, B.; Haney, M.H.; Kang, M. The effect of buyer digital capability advantage on supplier unethical behavior: A moderated mediation model of relationship transparency and relational capital. Int. J. Prod. Econ. 2022, 253, 108603. [Google Scholar] [CrossRef] [Scilit]
- Swani, K.; Labrecque, L.; Markos, E. Are B2B data breaches concerning? Consequences of buyer’s or firm’s data loss on buyer and supplier related outcomes. Ind. Mark. Manag. 2024, 119, 43–61. [Google Scholar] [CrossRef] [Scilit]
- Choi, S.; Mattila, A.S.; Bolton, L.E. To err is human (-oid): How do consumers react to robot service failure and recovery? J. Serv. Res. 2021, 24, 354–371. [Google Scholar] [CrossRef] [Scilit]
- Zeithaml, V.A.; Berry, L.L.; Parasuraman, A. The behavioral consequences of service quality. J. Mark. 1996, 60, 31–46. [Google Scholar] [CrossRef] [Scilit]
- Smith, A.K.; Bolton, R.N.; Wagner, J. A model of customer satisfaction with service encounters involving failure and recovery. J. Mark. Res. 1999, 36, 356–372. [Google Scholar] [CrossRef] [Scilit]
- Huang, D.; Markovitch, D.G.; Stough, R.A. Can chatbot customer service match human service agents on customer satisfaction? An investigation in the role of trust. J. Retail. Consum. Serv. 2024, 76, 103600. [Google Scholar] [CrossRef] [Scilit]
- Ranieri, A.; Di Bernardo, I.; Mele, C. Serving customers through chatbots: Positive and negative effects on customer experience. J. Serv. Theory Pract. 2024, 34, 191–215. [Google Scholar] [CrossRef] [Scilit]
- Sirmon, D.G.; Hitt, M.A.; Ireland, R.D.; Gilbert, B.A. Resource orchestration to create competitive advantage: Breadth, depth, and life cycle effects. J. Manag. 2011, 37, 1390–1412. [Google Scholar]
- Huang, M.-H.; Rust, R.T. Engaged to a robot? The role of AI in service. J. Serv. Res. 2021, 24, 30–41. [Google Scholar] [CrossRef] [Scilit]
- Robinson, S.; Orsingher, C.; Alkire, L.; De Keyser, A.; Giebelhausen, M.; Papamichail, K.N.; Shams, P.; Temerak, M.S. Frontline encounters of the AI kind: An evolved service encounter framework. J. Bus. Res. 2020, 116, 366–376. [Google Scholar] [CrossRef] [Scilit]
- Heikinheimo, M.; Hautamäki, P.; Julkunen, S.; Koponen, J. Dynamic capabilities and multi-sided platforms: Fostering organizational agility, flexibility, and resilience in B2B service ecosystems. Ind. Mark. Manag. 2025, 125, 179–194. [Google Scholar] [CrossRef] [Scilit]
- Meier, P.; Friederici, N.; Krell-Sun, T.; Trabucchi, D. Strategies for designing and growing business-to-business platforms A study of six cases across industrial sectors in Germany. Res.-Technol. Manag. 2024, 67, 44–56. [Google Scholar] [CrossRef] [Scilit]
- Vorobeva, D.; El Fassi, Y.; Costa Pinto, D.; Hildebrand, D.; Herter, M.M.; Mattila, A.S. Thinking skills don’t protect service workers from replacement by artificial intelligence. J. Serv. Res. 2022, 25, 601–613. [Google Scholar] [CrossRef] [Scilit]
- Podsakoff, P.M.; Podsakoff, N.P.; Williams, L.J.; Huang, C.; Yang, J. Common method bias: It’s bad, it’s complex, it’s widespread, and it’s not easy to fix. Annu. Rev. Organ. Psychol. Organ. Behav. 2024, 11, 17–61. [Google Scholar]
- Ostrom, A.L.; Field, J.M.; Fotheringham, D.; Subramony, M.; Gustafsson, A.; Lemon, K.N.; Huang, M.-H.; McColl-Kennedy, J.R. Service research priorities: Managing and delivering service in turbulent times. J. Serv. Res. 2021, 24, 329–353. [Google Scholar] [CrossRef] [Scilit]
- Lu, V.N.; Wirtz, J.; Kunz, W.H.; Paluch, S.; Gruber, T.; Martins, A.; Patterson, P.G. Service robots, customers and service employees: What can we learn from the academic literature and where are the gaps? J. Serv. Theory Pract. 2020, 30, 361–391. [Google Scholar] [CrossRef] [Scilit]
- Wirtz, J.; Stock-Homburg, R. Generative AI meets service robots. J. Serv. Res. 2025, 28, 527–543. [Google Scholar] [CrossRef] [Scilit]

Disclaimer/Publisher’s Note: The statements, opinions and data contained in all publications are solely those of the individual author(s) and contributor(s) and not of MDPI and/or the editor(s). MDPI and/or the editor(s) disclaim responsibility for any injury to people or property resulting from any ideas, methods, instructions or products referred to in the content. |
© 2026 by the authors. Licensee MDPI, Basel, Switzerland. This article is an open access article distributed under the terms and conditions of the Creative Commons Attribution (CC BY) license.