


Abstract
Digital sport platforms increasingly mediate consumer experience through AI-driven interfaces, yet it remains unclear which interactive elements consumers treat as baseline expectations versus genuine engagement drivers. An integrated Kano-SERVQUAL model was applied to evaluate the service quality of virtual cycling platforms in this context. An online survey was conducted with 458 adults who regularly used a virtual cycling platform. Service quality attributes demonstrated a five-dimensional structure: tangibles, reliability, responsiveness, assurance, and empathy. Twenty service attributes were classified following Kano’s model, and Better–Worse coefficients and a combined impact score were calculated to identify strategic priorities. Twenty attributes clustered into four distinct regions based on Timko’s Better–Worse matrix. One-Dimensional Quality (High Better, High Worse) included technical infrastructure attributes such as content updates, platform composition, data consistency, connection stability, and server stability under large-scale connections. Attractive Quality (High Better, Low Worse) was characterized by differentiating features, including event diversity, reflection of user suggestions, tutorial guide clarity, verified workout programs, and post-ride reports. Must-Be Quality (Low Better, High Worse) comprised graphics quality, UI convenience, and avatar design baseline attributes whose absence triggers high dissatisfaction, along with pedal resistance response (Reverse quality). Indifferent Quality (Low Better, Low Worse) encompassed attributes including technical support, testing tools, competitive systems, reward systems, and personalized recommendations, representing lower priority features. Thus, consumer engagement with AI-mediated digital sport platforms is structurally non-linear, requiring attribute-differentiated management strategies that distinguish trust-critical interface reliability from engagement-driving personalization. These findings offer theoretical implications for consumer decision-making in interactive digital commerce, though trust, engagement, and decision-making were not directly measured as outcome variables in this study.
1. Introduction
With the recent acceleration of digital transformation, how people participate in sports has been rapidly reconfigured to transcend the constraints of physical space [1]. Virtual cycling platforms combine immersive digital content, real-time competitive elements, and global community features within the training environment, transforming conventional indoor cycling into an interactive sports experience [2]. Virtual cycling platforms have experienced rapid user growth since the COVID-19 pandemic and now serve a broad user base, ranging from elite athletes to general recreational participants, with industry reports indicating that the global virtual cycling and connected fitness market has expanded substantially in user adoption and revenue over this period. Furthermore, virtual cycling provides aerobic exercise benefits without requiring physical travel, thereby creating points of convergence with environmental values, such as reduced carbon emissions and sustainable leisure participation. As these platforms increasingly mediate the sport experience through algorithmic feedback and personalized digital content rather than physical facilities alone, the quality of this AI-mediated interaction becomes a direct driver of whether users continue engaging with the platform. In this context, systematically measuring the interactive service quality of virtual cycling platforms and understanding how consumers evaluate these AI-mediated interactions have emerged as important tasks for platform operators, users, and researchers.
Virtual cycling has evolved beyond being a simple substitute for indoor cycling into a platform-based form of exercise that integrates digital technology with the sports experience, a trajectory that parallels the broader diffusion of immersive digital technologies across service contexts, from digital games [3] to interactive virtual reality experiences more generally [4] and virtual reality tourism [5]. Although these domains differ in user motivation and interaction mechanism, they collectively illustrate how immersive digital technologies reshape service experience across sectors—a pattern directly relevant to connected fitness platforms, where algorithmic feedback similarly substitutes for physically embodied service delivery. This trajectory mirrors developments in virtual reality-based education, where simulation technologies have similarly transitioned from novelty tools to platform-based learning experiences [6]. Within the cycling domain specifically, dedicated virtual reality cycling simulators have been developed to replicate real-world terrain physics and resistance dynamics [7], embedding real-time algorithmic feedback—such as resistance calibration and personalized workout recommendations—within a recurring subscription-commerce model. This positions the platform’s responsiveness to user input, rather than physical infrastructure alone, as a core determinant of continued engagement, and reframes virtual cycling as a form of algorithmically mediated digital commerce rather than a purely fitness-oriented activity.
SERVQUAL, the dominant paradigm in service quality research, quantifies the gap between customer expectations and perceptions across five dimensions: reliability, responsiveness, assurance, empathy, and tangibles [8]. These five dimensions structure the questionnaire used to measure virtual cycling service attributes (Section 2.2) and thereby determine which attributes are subsequently classified under the Kano model in Section 3. This model has been widely applied across diverse service industries [9] and has been used in the sports and recreation service sector to examine its relationship with facility quality, program satisfaction, and member retention [10,11]. However, SERVQUAL has been criticized for implicitly assuming that service attributes symmetrically affect satisfaction and dissatisfaction, which presupposes a simplified relationship in which fulfilling a given attribute linearly increases satisfaction—that is, an assumption that the presence and absence of an attribute produce a proportionally equal, linear change in satisfaction, rather than the asymmetric effects observed in practice [12]. In digital sports service environments, attributes such as system stability, the absence of which triggers immediate dissatisfaction, coexist with those such as immersive racing content or AI-based personalized feedback, which generate additional appeal only when provided. These two types of attributes play fundamentally different roles in the structure of customer responses and, more broadly, in how consumers form trust in and engagement with algorithmically mediated digital platforms. Therefore, a strategic research approach that moves beyond a simple linear satisfaction structure is required.
Service quality is a multidimensional concept formed by comparing the service consumers expect and that which they actually experience, and is among the most widely applied core theories in service research [13,14]. However, as digital transformation accelerates, service quality has expanded beyond the scope of traditional face-to-face services to encompass system quality, information quality, interface convenience, real-time responsiveness, and AI-driven personalized experience [15,16]. In digital environments, platform operational stability, information accuracy, access convenience, and user customization are more critical criteria for quality judgment than physical facilities. Thus, each dimension of SERVQUAL must be reinterpreted to fit the platform context [17]. This reinterpretation is part of a broader pattern in which digitalization reshapes the sources of competitive advantage across service industries [18]. Although traditional information system success models [19] offer frameworks for evaluating technical quality, they often overlook the complex interplay between physical exertion, immersive content, and socioemotional interaction unique to digital sports platforms.
An integrated Kano–SERVQUAL approach can address this limitation by enhancing analytical precision, simultaneously capturing the current fulfillment level of a service attribute and its position within the customer response structure [20]. Whereas SERVQUAL measures service quality through the gap between expectations and perceptions, Kano classifies the type of influence each attribute exerts on satisfaction and dissatisfaction [21]. Specifically, SERVQUAL by itself only measures the size of the expectation–perception gap for each dimension, implicitly treating every attribute as contributing to satisfaction in the same linear way; Kano instead classifies each attribute into a distinct quality type—for example, a “must-be” attribute whose absence causes dissatisfaction but whose presence is merely expected, versus an “attractive” attribute that delights customers when present but causes no dissatisfaction when absent. Combining the two approaches enables a simultaneous analysis of the current level of a service attribute and the structure of customer responses, allowing a more precise derivation of service improvement strategies. The usefulness of this integrated approach has already been demonstrated in studies of automotive service quality [22] and digital library service quality evaluation [23], and Materla et al. [24] emphasized the strong theoretical validity for strategic service design that the combined Kano-SERVQUAL model possesses. Given this established applicability across service contexts, the integrated framework is expected to extend similarly to virtual cycling platforms. In virtual cycling platforms, elements such as system stability, record accuracy, and connectivity are likely to function as must-be or one-dimensional quality, whereas immersive content, personalized coaching feedback, and competitive rewards may function as attractive quality; these examples are illustrative and are examined empirically in Section 3.
However, empirical studies applying this integrated framework to digital sports platforms, including virtual cycling, remain scarce, and how consumers distinguish trust-critical interface reliability from engagement-driving personalization within the user satisfaction structure remains largely unexplored. To fill this academic gap, this study applies the integrated Kano-SERVQUAL model to virtual cycling services as a representative case of digital sports platforms. Accordingly, it systematically classifies the quality attributes of virtual cycling services and empirically analyzes the influence of each attribute on user satisfaction. Specifically, this study addresses the following research questions: (RQ1) Into which Kano quality types do the service attributes of a virtual cycling platform fall? (RQ2) Which attributes represent the highest strategic priority for platform operators, based on their Better–Worse coefficients?
This study aims to multidimensionally evaluate the service quality of virtual cycling platforms using the combined Kano-SERVQUAL model. First, this study categorizes the service attributes of virtual cycling platforms into five dimensions based on the SERVQUAL model: tangibles, reliability, responsiveness, assurance, and empathy. Second, it applies an augmented SERVQUAL-based perception-expectation gap analysis to diagnose the current fulfillment level and relative strengths and weaknesses of each attribute. Third, it classifies each attribute as attractive, one-dimensional, must-be, indifferent, or reverse quality using the Kano model, and, fourth, integrates this classification with Better–Worse coefficients into a combined impact index (see Section 3.1), aiming to strategically distinguish attributes that platform operators should prioritize maintaining from attributes capable of generating differentiated competitive advantage. Furthermore, by distinguishing attributes that function as baseline trust conditions of the platform’s AI-driven interface from those that function as engagement-driving personalization features, this study offers a new theoretical contribution to consumer decision-making research in interactive digital commerce.
2. Materials and Methods
2.1. Participants and Procedure
The participants were adults aged 18 years or older who had used Zwift, a virtual cycling platform that is the world leader in terms of market share and has the largest user base, at least once per week in the previous six months. Zwift was selected not only for its market position but also for its comprehensive AI-enabled service ecosystem, including algorithmic resistance calibration, personalized workout recommendations, and a broad range of interactive social and competitive features, making it a representative context for evaluating interactive service quality in digital sport platforms. Recruitment and the data collection process proceeded as follows: a survey link was distributed through an online survey using Google Forms, and 480 questionnaires were distributed through online communities related to virtual cycling (Zwift, Facebook, and cycling club websites); interested members accessed the link voluntarily and completed the questionnaire without researcher intervention. The collection period spanned approximately 56 days, from 15 March to 15 May 2026, and respondents completed the questionnaire through self-administration, meaning that participants read and answered all items independently online without an interviewer present, which reduces interviewer bias but relies on respondents’ own comprehension of the items. After excluding 22 questionnaires with insincere responses (e.g., consistent patterned answers, omissions, or non-responses), the final sample included 458 valid questionnaires. All participants were informed in advance of the purpose of the study, and their anonymity was guaranteed. The study was conducted with the approval of the Institutional Review Board (IRB) of the authors’ affiliated institution (Approval No. HYU-2026-182). Table 1 presents the participant characteristics.
Table 1.
Demographic characteristics.
2.2. Measurement
A questionnaire was used as the survey instrument, with all items and variables constructed based on prior research, consistent with this study’s purpose. The questionnaire comprised two main parts: (1) positively and negatively worded Kano-type questions assessing the 20 service quality attributes, each presented in both a functional (positive) and dysfunctional (negative) format, and (2) demographic characteristics. After closely comparing and analyzing prior research on satisfaction and immersive experience related to virtual cycling service quality [25,26] and the potential customer satisfaction index [27,28], the five-dimensional structure of SERVQUAL proposed by Parasuraman et al. [29] was modified and applied to fit the context of virtual cycling platforms. These five SERVQUAL dimensions define the service quality attributes evaluated in this study; the Kano-type questions described above were then applied to each of these attributes to enable the Kano-based classifications reported in Section 3. An initial pool of items was then extracted by adding items deemed necessary to achieve this study’s purpose. Following a review of prior literature and consultation with platform experts, each dimension was operationalized as described below. Specifically, an initial item pool was generated from the reviewed literature, after which three researchers with expertise in sport service management independently reviewed the items for content relevance and clarity; items retained by consensus were then finalized into the 20-item instrument described below.
The Tangibles dimension comprised attributes related to the visual environment and user interface (UI) and included four items: graphics quality, UI convenience, avatar implementation, and platform design. Two of these items (graphics quality and visual realism; UI convenience and readability) combine closely related sub-facets into a single item; this approach was adopted because pilot feedback indicated that respondents evaluated these paired facets jointly rather than as separable judgments, and the high factor loadings for both items on a single factor (Table 2) support their treatment as a unified construct. The Reliability dimension reflected system stability and accuracy and was measured using four items: connection stability, physics engine, data consistency, and server stability. The Responsiveness dimension was related to content and operational response and comprised four items: content updates, event diversity, technical support, and community communication. The Assurance dimension measured expertise and personalized training using four items: training expertise, fitness assessment, data analysis, and guide clarity. The Empathy dimension, which was related to social activity and algorithmically personalized motivation, included four items: social interaction, competitive system, achievement rewards, and personalization.
Table 2.
Questionnaire items and factor loadings from EFA: Kano-SERVQUAL.
The survey instrument comprised 45 items: 20 service quality attributes, each evaluated through a paired functional (positive) and dysfunctional (negative) Kano-type question—yielding 40 items—from which the Kano quality type and Better–Worse coefficients for each attribute were subsequently calculated (see Section 3.1), and 5 items concerning personal demographic characteristics. Each service attribute item was presented in positive and negative question formats and rated on the five-point scale provided by the Kano model: “I like it that way,” “It must be that way,” “I am neutral,” “I can live with it that way,” and “I dislike it that way.” Table 2 presents the Kano-SERVQUAL factor analysis results for the virtual cycling platforms; the factors were extracted using principal axis factoring with varimax (orthogonal) rotation, retaining factors with eigenvalues greater than 1, and sampling adequacy was confirmed via the Kaiser-Meyer-Olkin (KMO) measure and Bartlett’s test of sphericity prior to extraction. Cronbach’s α values ranged from 0.814 to 0.882, verifying the internal consistency reliability for each derived factor.
2.3. Data Analysis
SPSS version 25.0 was used to analyze the data obtained from 458 questionnaires. First, a frequency analysis was conducted on the demographic characteristics and general tendencies of the participants. Second, to examine the validity and reliability of the questionnaire as a survey instrument, exploratory factor analysis and reliability analysis using Cronbach’s α coefficient were conducted. Third, each item was classified and evaluated according to Kano’s method into the following quality elements: attractive, must-be, one-dimensional, indifferent, and reverse quality.
3. Results
3.1. Service Quality Attributes Classification Using the Kano Model and Combined Impact Score Analysis
Each item was classified according to the Kano method into attractive, must-be, one-dimensional, indifferent, and reverse quality using the Kano model to examine how users perceive the quality attributes of virtual cycling platform service quality. Table 3 presents the analysis results. Each virtual cycling platform service quality attribute was classified based on these results. The Better and Worse coefficients used in the analysis were calculated following Timko and Walden [30]. Because item-level current-satisfaction ratings (P) were not collected in this study, a combined impact score was calculated as the sum of the absolute Better and Worse coefficients (Better + |Worse|) for each attribute; this score reflects the overall magnitude of an attribute’s combined influence on satisfaction and dissatisfaction, rather than room for improvement relative to current satisfaction levels as in the original PCSI formulation.
Table 3.
Customer satisfaction coefficients and combined impact score for virtual cycling platform service quality attributes.
3.2. Better–Worse Matrix Results
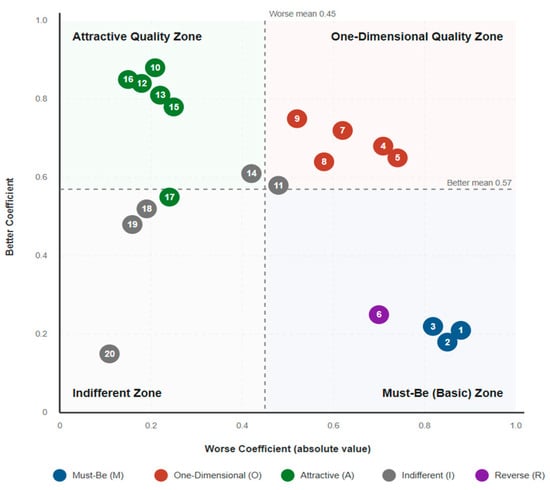
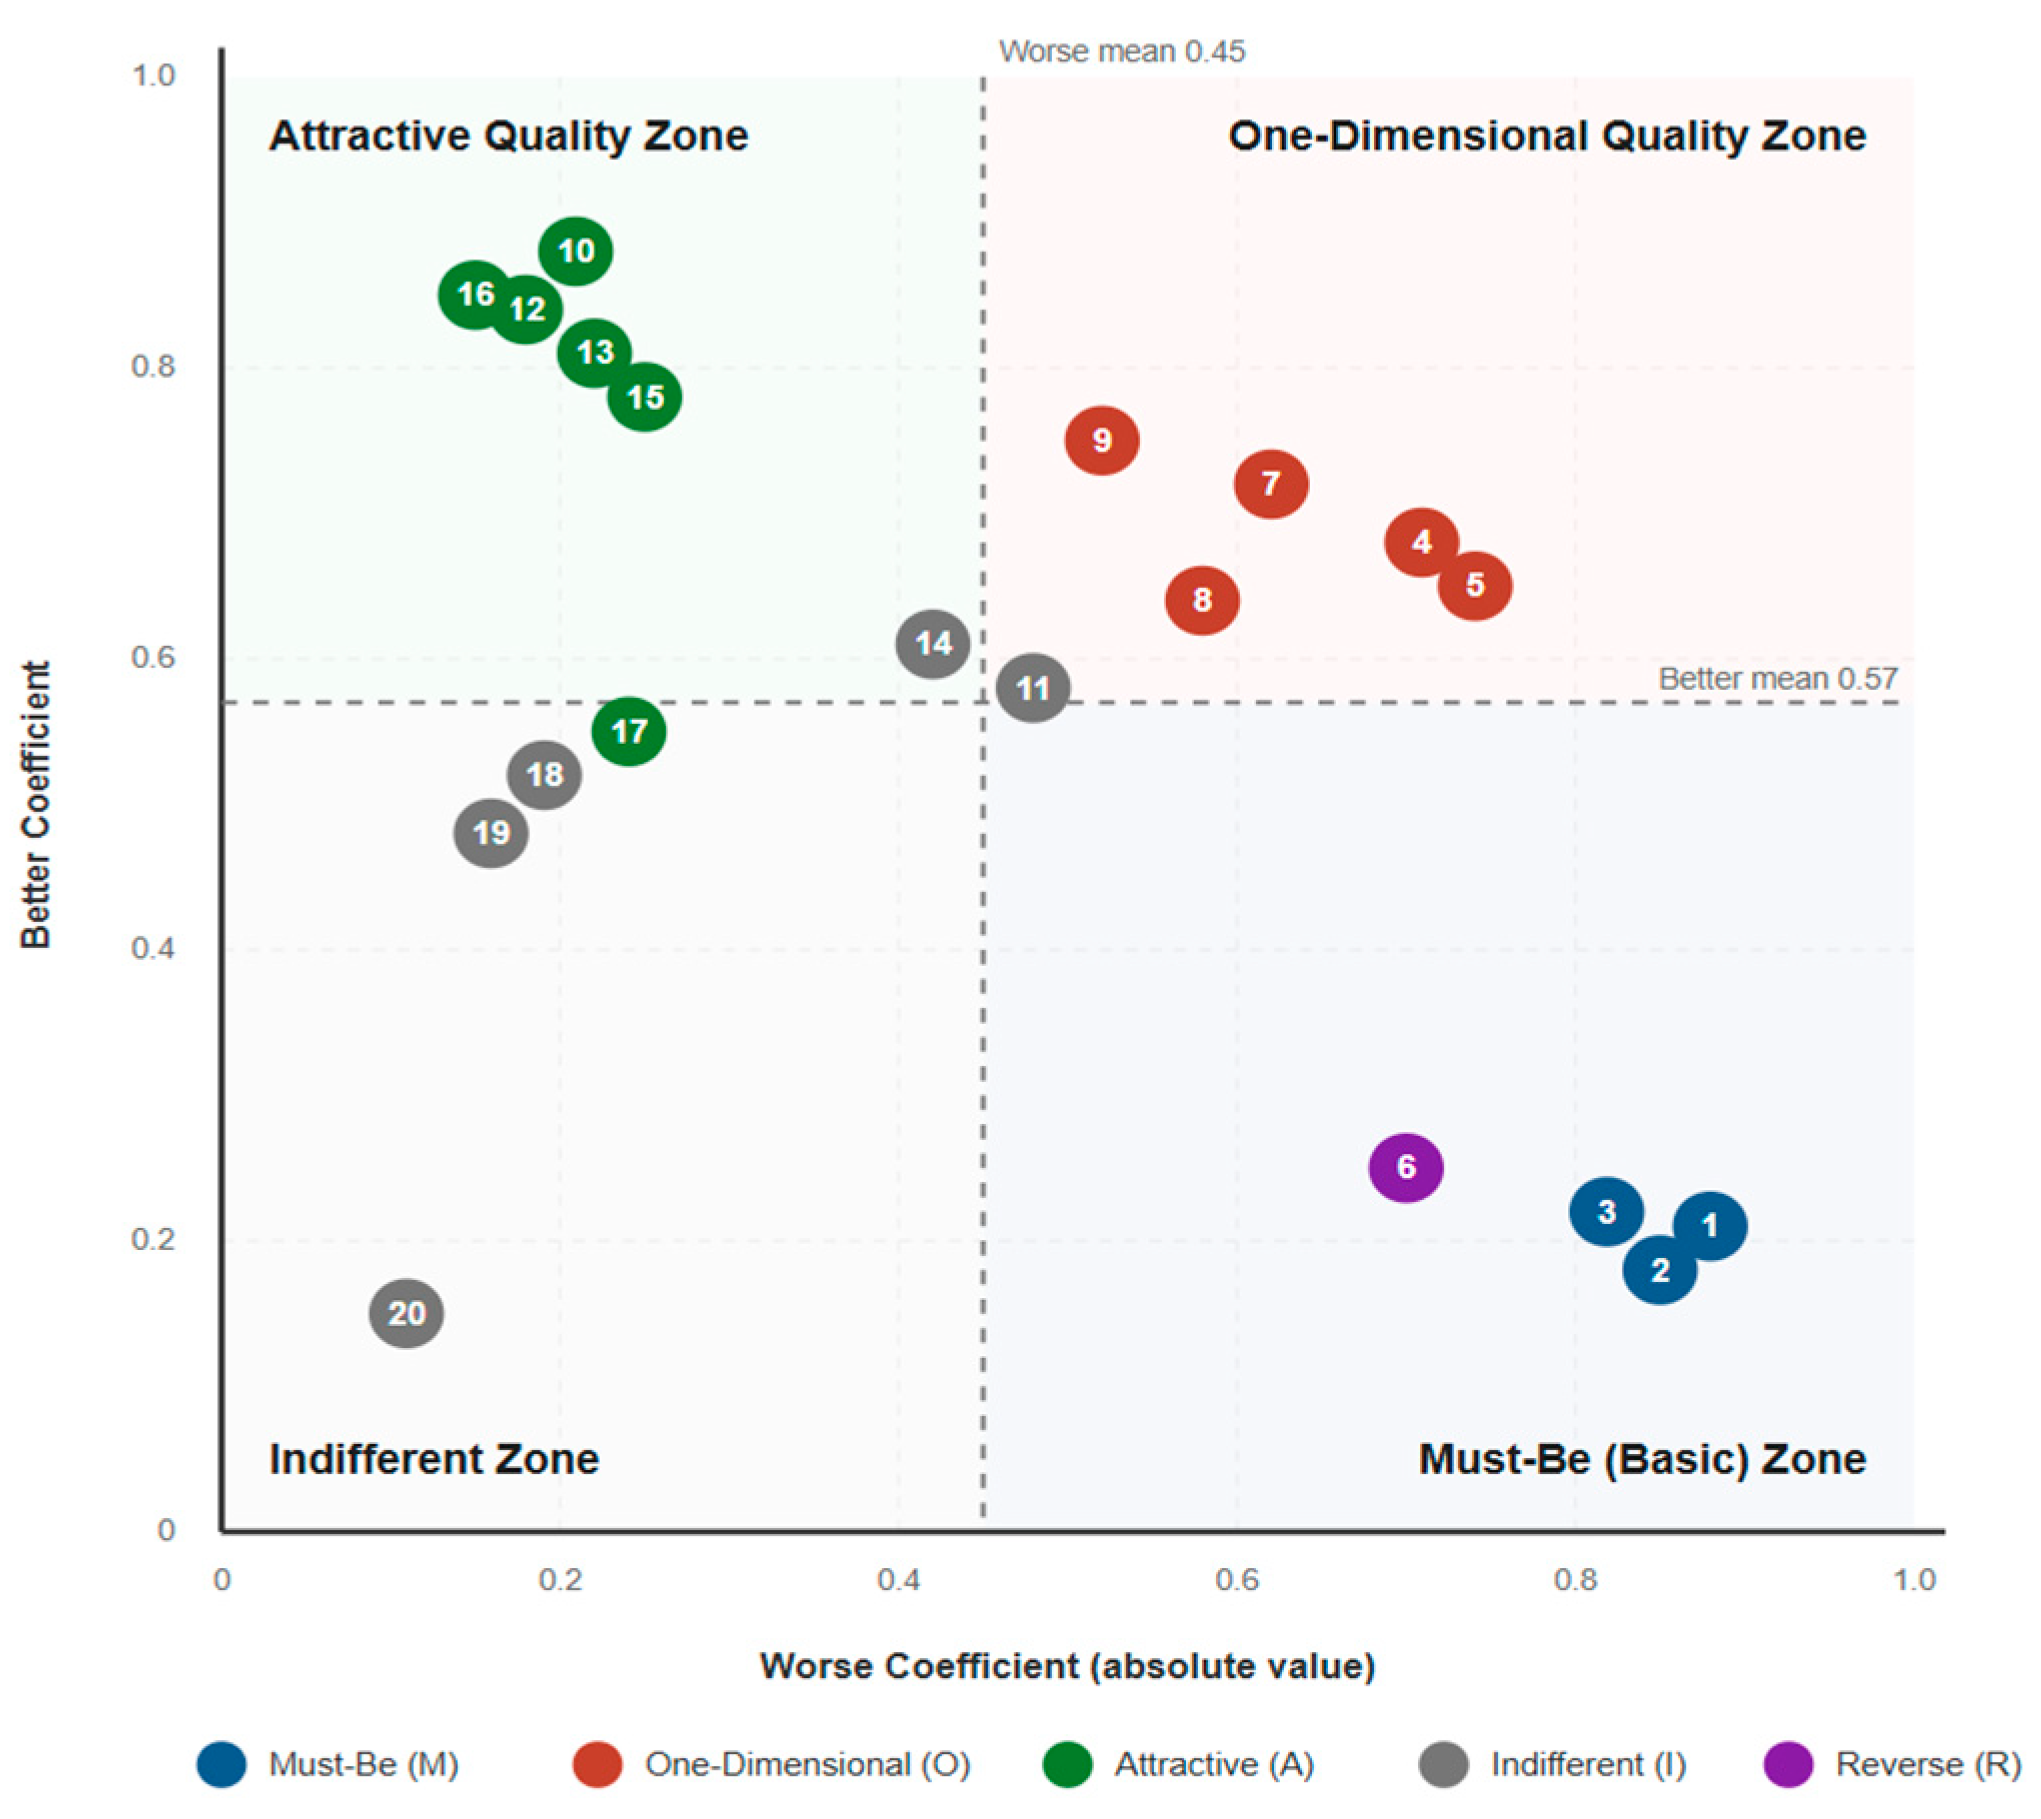
Based on the mean values of the Better and Worse indices (x-axis: Better = 0.57; y-axis: Worse = 0.45), the 20 service attributes were categorized into a standard Timko’s [30] (1993) quadrant matrix, revealing a clear clustering pattern across four regions (Figure 1).
Figure 1.
Quadrant matrix visualization of the Better–Worse coefficients.
It should be noted that the quality-type labels reported in the Kano column of Table 3 (M, O, A, I, R) were determined using the standard Kano evaluation table based on the modal response category for each item [30,31], whereas the quadrant regions described below are based on each item’s Better and Worse coefficient values relative to the sample means. Because these two classification approaches rely on different decision rules, a small number of items whose Better or Worse coefficients lie close to the sample means—technical support, tools for measuring individual performance, social interaction, and the reward system—show some divergence between their Kano-based quality type and their quadrant position relative to the mean thresholds. For these borderline items, the Kano-based quality type reported in Table 3 is retained as the primary classification in the discussion below, and this divergence is noted here for transparency.
First, the One-Dimensional Quality Zone (Top-Right: High Better, High Worse) included content updates (9), sophistication of platform composition (4), data consistency (7), connection stability (5), and server stability under large-scale simultaneous connections (8). These attributes exhibited strong effects on increasing satisfaction when fulfilled and triggering dissatisfaction when absent. This suggests that technical infrastructure elements function not only as basic requirements but also as core drivers of satisfaction that require continuous performance enhancement and strategic resource investment.
Second, the Attractive Quality Zone (Top-Left: High Better, Low Worse) included differentiating factors, such as event diversity (10), reflection of user suggestions (12), clarity of tutorial guides (16), verified workout programs (13), and provision of post-ride reports (15). Their Worse indices were low, meaning that although their absence did not lead to major dissatisfaction, when provided, they substantially increased user satisfaction. Notably, the highest Better index (0.88) among all items was event diversity (10), indicating that content and event planning served as a primary lever for establishing the platform’s competitive advantage. Social interaction (17) was also classified as an Attractive quality; its Better coefficient (0.55) lies close to the sample mean, so it is discussed here as a latent attractive factor rather than a strongly differentiating one.
Third, the Must-Be Quality Zone (Bottom-Right: Low Better, High Worse) included graphics quality and visual realism (1), UI convenience and readability (2), and sophistication of avatar design (3). These attributes exhibited very high Worse indices (−0.88, −0.85, and −0.82, respectively), meaning that their absence triggers severe dissatisfaction, whereas their fulfillment yields only a limited increase in satisfaction. This indicates that users have internalized graphics and UI completeness as implicit baseline expectations. Additionally, pedal resistance response to gradient changes (6, Reverse) was in this region with a high Worse index (−0.70), highlighting that inappropriate technical resistance feedback can cause significant dissatisfaction, thereby requiring precise calibration.
Fourth, the Indifferent Quality Zone (Bottom-Left: Low Better, Low Worse) comprised attributes in which both Better and Worse indices were relatively low, including technical support for system errors (11), testing tools (14), competitive systems (18), reward systems (19), and personalized recommendations (20). As noted above, technical support (11), testing tools (14), and the reward system (19) have Better coefficients slightly above the sample mean; nonetheless, their Kano-based classification as Indifferent quality is retained here. Currently, these elements function as lower-priority supplementary features in shaping user responses.
4. Discussion
4.1. Technical Infrastructure: Moving Beyond Minimum Requirements
The Better–Worse matrix analysis results are theoretically grounded in the two-way classification theory of quality attributes proposed by Kano et al. [31] and in the customer satisfaction coefficient methodology developed by Timko and Walden [30], which quantified this theory. Based on the premise that the relationship between performance and satisfaction is non-linear, the Kano model classifies attributes into must-be (M), one-dimensional (O), attractive (A), indifferent (I), and reverse (R) quality. By combining this with the Better and Worse index coefficients proposed by Shahin et al. [32], this study addressed the information-loss problem inherent in simple frequency-based classification, that is, its failure to reflect the response distribution beyond the modal value [12], and continuously visualized the magnitude of each attribute’s influence on satisfaction and dissatisfaction.
First, regarding the direction of the mixed one-dimensional/must-be region (technical infrastructure), power/speed data consistency (7), server stability (8), connection stability (5), and content updates (9) exhibited a mixed pattern of M and O attributes. This mixed classification pattern suggests that virtual cycling platforms should reframe technical infrastructure as an object of continuous performance enhancement rather than only meeting the minimum requirements. Thus, platform operators should approach server stability and data consistency not from a one-off bug-fix perspective but as targets for incremental, continuous technical investment, such as minimizing latency under large-scale simultaneous connection environments and improving the precision of the real-time physics engine. This continuous-investment strategy is consistent with Chin et al. [15], who noted that in digital service quality, system quality functions as a precondition preceding information quality, suggesting that a platform’s technical reliability serves as the structural foundation for attractive quality elements (content, community features) to function properly. Therefore, in terms of strategic direction, rather than foregrounding technical infrastructure as a marketing element, the likely optimal strategy is to maintain a level of completeness that remains imperceptible to users.
4.2. Content and Community: Strategy for Differentiating Platform Experience
Regarding the direction of the differentiating factor region (content and community), the attractive quality characteristics exhibited by event diversity (10), reflection of user suggestions (12), tutorial guides (16), and workout programs (13) clearly indicate the direction that the platform should take to secure a future competitive advantage. Event diversity (10), which recorded the highest Better index among all items, suggests that virtual cycling platforms should transition from simple exercise tools to content platforms. This content-centric shift is consistent with the trend toward expanding immersive experience noted by Hudson et al. [4] and calls for a content-cycle operation strategy involving the regular release of new courses, seasonal challenges, and the establishment of a system for incorporating user-generated content. Furthermore, the actual reflection of user suggestions (12) showed a high Better index, indicating that platforms should adopt a participatory governance structure rather than functioning as one-directional service providers. This could be concretized by integrating online community-based user feedback loops into the formal development process.
4.3. Graphics and UI: Baseline Management and Optimization
Regarding the direction of the must-be quality region (graphics and UI), the typical must-be quality characteristics exhibited by graphics quality (1), UI convenience (2), and avatar design (3) suggest that platforms should focus on maintaining the industry baseline in this area rather than investing excessive differentiation resources. This does not imply that investment in graphics is meaningless, but that the marginal utility of graphic completeness has already reached perceived saturation. Therefore, in terms of strategic direction, it is reasonable to prioritize the allocation of graphics resources toward maintenance and cross-platform compatibility (interoperability with various devices and smart trainers) rather than new feature development, which is consistent with the discussion of Talwar et al. [5] regarding the expansion of accessibility in technology-mediated sports services.
4.4. Personalization and Adaptive Systems (Addressing Reverse and Indifferent Qualities)
Regarding the direction of the reverse-quality attribute, “accurate pedal resistance response to gradient changes” (6) was intriguingly categorized as a Reverse Quality attribute. This finding challenges the technological assumption that higher physical fidelity directly yields greater satisfaction. In practical virtual cycling environments (e.g., Zwift), platforms provide users with a “Trainer Difficulty” setting, allowing them to scale the mechanical resistance induced by simulated gradients. For recreational users or beginners, replicating a 1:1 real-world incline resistance can induce excessive physical exertion, compromise cadence fluidity, and diminish overall exercise enjoyment. Conversely, experienced cyclists may seek high accuracy for training realism. Therefore, platform developers should not treat resistance precision as a uniform requirement but rather implement adaptive resistance calibration options tailored to individual proficiency levels and fitness goals.
Regarding the direction of personalized features, “personalized goal-setting and customized riding recommendations” (20) registered the lowest combined impact score (0.26) and was within the Indifferent Quality Zone. Although artificial intelligence and personalized analytics are widely regarded as crucial drivers in modern digital services, the virtual cycling users in this study did not perceive current algorithmic recommendations as a primary source of satisfaction or dissatisfaction. This low responsiveness can be attributed to two key factors. First, current platform recommendations may remain superficial (e.g., basic route suggestions), failing to meet users’ latent expectations for truly dynamic, bio-data-driven coaching. Second, highly engaged cyclists frequently rely on specialized third-party platforms (e.g., Strava or TrainingPeaks) for advanced performance tracking and goal setting. Consequently, in-platform recommendation features currently serve as secondary auxiliary functions, requiring operators to prioritize structural algorithm upgrades or seamless integration with external training ecosystems before these attributes can act as core differentiators. These interpretations should be read as directions suggested by the Kano classification and Better–Worse coefficients rather than as evidence of trust, engagement, or usage intention directly, as this study did not measure these constructs as separate outcome variables.
5. Conclusions
This study integrated the Kano model with the Better–Worse coefficient of Timko and Walden [30] to multidimensionally analyze the service quality attributes of virtual cycling platforms and empirically derive the strategic priority of each attribute. This study is significant in that it complements the limitations of categorical classification inherent in conventional Kano analysis and attempts a theoretical and methodological extension by continuously capturing the magnitude of each attribute’s influence on satisfaction and dissatisfaction.
The findings demonstrate that the core competitiveness of virtual cycling platforms lies not in single-dimensional functional improvement, but in differentiated management strategies tailored to each attribute type. Technical infrastructure emerged as a foundational element that is both essential and in need of performance improvement, suggesting that it should be considered a target for continuous investment to secure platform stability and reliability. By contrast, content and community are core attractive factors that expand the user experience and generate a competitive advantage, indicating that platforms should evolve beyond “exercise tools” toward “experience-centered digital sports platforms.”
Furthermore, must-be quality elements, such as graphics and UI, show limited marginal utility beyond a certain level of investment, indicating the need for an efficient resource allocation strategy. In particular, the resistance-response attribute, identified as reverse quality, underscores the importance of user-customized experience design rather than an approach centered solely on technical precision, suggesting that personalization strategies can serve as a key mechanism for enhancing platform satisfaction. Social interaction was identified as a latent attractive element whose effect remains limited at the current level of implementation, while the competitive and reward systems were classified as indifferent quality, indicating comparatively low current influence on satisfaction; both sets of features warrant a phased, longer-term enhancement strategy rather than immediate investment.
These findings suggest that, in research on virtual sports platforms, service quality is more usefully approached from a non-linear, structural perspective than a single-dimensional one. The observed pattern—in which technical-infrastructure attributes cluster as one-dimensional or must-be qualities while content, community, and personalization attributes cluster as attractive or indifferent qualities—offers a descriptive account of how these attribute categories relate to one another in this dataset, rather than a tested hierarchical or causal relationship among system quality, experiential content, and social interaction. Practically, they provide strategic decision-making criteria for platform operators to allocate limited resources efficiently while simultaneously securing short-term performance and long-term competitive advantage. Collectively, these empirical nuances demonstrate that platform optimization requires a segmented resource-allocation strategy. Instead of attempting to uniformly maximize all technical and algorithmic features, operators should prioritize maintaining core infrastructural reliability while strategically refining resistance customization and third-party compatibility to satisfy heterogeneous user segments effectively.
This study has several limitations. First, the cross-sectional design captures user perceptions at a single point in time and cannot account for how service quality perceptions evolve with continued platform use. Second, all data were self-reported, which may be subject to common method bias or social desirability effects. Third, because item-level current-satisfaction ratings were not collected, the combined impact score reported in Section 3.1 reflects the overall magnitude of each attribute’s influence on satisfaction and dissatisfaction rather than the room for improvement relative to current satisfaction levels captured by the original PCSI formulation; future studies collecting current-satisfaction ratings could apply the original PCSI formula directly. Fourth, this study did not directly measure consumer trust, engagement, decision-making, or continued usage intention as separate outcome variables; the associations between Kano quality types and these constructs proposed in the Discussion are conceptual and warrant empirical testing in future research. Fifth, the sample was limited to adult users of a single virtual cycling platform (Zwift), which may limit the generalizability of the findings to other digital sport platforms or to other virtual cycling platforms with different feature sets.
The findings of this study suggest directions for future research. First, studies should refine personalization strategies by comparatively analyzing differences in the perception of Kano attributes across diverse user groups (e.g., beginners versus experienced users). Second, studies should clarify the dynamic process of change in service quality attributes through longitudinal research combined with actual usage behavior data. Third, future research could extend this framework beyond virtual cycling to other digital sport platforms (e.g., connected running or rowing applications), or alternatively examine additional virtual cycling platforms beyond Zwift to assess the consistency of the present findings.
Author Contributions
Conceptualization, J.K.; formal analysis, S.N.; validation, K.Y.; original draft preparation, J.K.; writing—review and editing, S.N.; visualization, J.K.; supervision, K.Y. All authors have read and agreed to the published version of the manuscript.
Funding
This research received no external funding.
Institutional Review Board Statement
This study was conducted with the approval of the Institutional Review Board from Hanyang University (IRB-HYU-2026-182).
Informed Consent Statement
We obtained prior consent from all subjects involved in this study.
Data Availability Statement
The data presented in this study are available on request from the corresponding authors due to privacy and ethical restrictions related to survey respondents.
Conflicts of Interest
The authors declare no conflicts of interest.
References
- Vial, G. Understanding digital transformation: A review and a research agenda. In Managing Digital Transformation; Routledge: London, UK, 2021; pp. 13–66. [Google Scholar]
- Cochoy, F. Platforms or flatforms? Insights from an auto-ethnographic account of a virtual cycling app. J. Cult. Econ. 2025, 18, 175–193. [Google Scholar] [CrossRef] [Scilit]
- Carvalho, B.; Soares, M.M.; Neves, A.; Soares, G.; Lins, A. Virtual Reality devices applied to digital games: A literature review. Ergon. Des. 2016, 125–141. [Google Scholar] [CrossRef] [Scilit]
- Hudson, S.; Matson-Barkat, S.; Pallamin, N.; Jegou, G. With or without you? Interaction and immersion in a virtual reality experience. J. Bus. Res. 2019, 100, 459–468. [Google Scholar] [CrossRef] [Scilit]
- Talwar, S.; Kaur, P.; Nunkoo, R.; Dhir, A. Digitalization and sustainability: Virtual reality tourism in a post pandemic world. J. Sustain. Tour. 2023, 31, 2564–2591. [Google Scholar] [CrossRef] [Scilit]
- Hu-Au, E.; Lee, J.J. Virtual reality in education: A tool for learning in the experience age. Int. J. Innov. Educ. 2017, 4, 215–226. [Google Scholar] [CrossRef] [Scilit]
- Schramka, F.; Arisona, S.; Joos, M.; Erath, A. Development of virtual reality cycling simulator. J. Comput. 2018, 13, 603–615. [Google Scholar] [CrossRef] [Scilit]
- Jain, S.K.; Gupta, G. Measuring service quality: SERVQUAL vs. SERVPERF scales. Vikalpa 2004, 29, 25–38. [Google Scholar] [CrossRef] [Scilit]
- Morrison Coulthard, L.J. A review and critique of research using SERVQUAL. Int. J. Mark. Res. 2004, 46, 479–497. [Google Scholar] [CrossRef] [Scilit]
- Jasinskas, E.; Reklaitiene, D.; Svagzdiene, B. Evaluation of service quality in fitness centres. Transform. Bus. Econ. 2013, 12, 108–124. [Google Scholar]
- Yang, H.; Coates, N. Internal marketing: Service quality in leisure services. Mark. Intell. Plan. 2010, 28, 754–769. [Google Scholar] [CrossRef] [Scilit]
- Matzler, K.; Hinterhuber, H.H. How to make product development projects more successful by integrating Kano’s model of customer satisfaction into quality function deployment. Technovation 1998, 18, 25–38. [Google Scholar] [CrossRef] [Scilit]
- Pratminingsih, S.A.; Astuty, E.; Widyatami, K. Increasing customer loyalty of ethnic restaurant through experiential marketing and service quality. J. Entrep. Educ. 2018, 21, 1–11. [Google Scholar]
- Wahyono, W.; Nurjanah, U. Building customer loyalty through strategy experiential marketing, service quality, and customer satisfaction. Manag. Anal. J. 2020, 9, 122–131. [Google Scholar] [CrossRef] [Scilit]
- Chin, H.; Marasini, D.P.; Lee, D. Digital transformation trends in service industries. Serv. Bus. 2023, 17, 11–36. [Google Scholar] [CrossRef] [Scilit]
- Li, C.; Feng, W.X.; Han, S.; Gupta, S.; Kamble, S. Digital adaptive governance, digital transformation, and service quality in logistics enterprises. J. Glob. Inf. Manag. 2022, 30, 1–26. [Google Scholar] [CrossRef] [Scilit]
- Polyakova, O.; Mirza, M. Perceived service quality models: Are they still relevant? Mark. Rev. 2015, 15, 59–82. [Google Scholar] [CrossRef] [Scilit]
- Nafei, W.A.; Ghoneim, M.A.; Mujtaba, B.G.; Khanfar, N.M. Digitalization as a socioeconomic challenge: Assessing the mediating role of digital service quality on digitalization’s impact on sustainable competitive advantage. SocioEcon. Chall. 2025, 9, 1–20. [Google Scholar] [CrossRef] [Scilit]
- DeLone, W.H.; McLean, E.R. The DeLone and McLean model of information systems success: A ten-year update. J. Manag. Inf. Syst. 2003, 19, 9–30. [Google Scholar] [CrossRef] [Scilit]
- Dewi, S.K. Service quality assessment using SERVQUAL and Kano Models. J. Tek. Ind. 2019, 20, 94–104. [Google Scholar] [CrossRef] [Scilit]
- Andriani, M.; Irawan, H.; Asyura, N.R. Improving quality using the Kano model in overcoming competition in the service industry. Int. J. Eng. Sci. Inf. Technol. 2021, 1, 13–18. [Google Scholar] [CrossRef] [Scilit]
- Kim, H.; Song, H.; Park, Y.T. Customer perception of auto service quality using Kano-SERVQUAL integrated approach—Focusing on the auto service of ‘H’ Company. J. Korean Soc. Qual. Manag. 2016, 44, 965–981. [Google Scholar] [CrossRef] [Scilit]
- Garibay, C.; Gutiérrez, H.; Figueroa, A. Evaluation of a digital library by means of quality function deployment (QFD) and the Kano model. J. Acad. Librariansh. 2010, 36, 125–132. [Google Scholar] [CrossRef] [Scilit]
- Materla, T.; Cudney, E.A.; Antony, J. The application of Kano model in the healthcare industry: A systematic literature review. Total Qual. Manag. Bus. Excell. 2019, 30, 660–681. [Google Scholar] [CrossRef] [Scilit]
- Polechoński, J.; Szczechowicz, B.; Ryśnik, J.; Tomik, R. Recreational cycling provides greater satisfaction and flow in an immersive virtual environment than in real life. BMC Sports Sci. Med. Rehabil. 2024, 16, 31. [Google Scholar] [CrossRef] [Scilit] [PubMed]
- Verma, M.; Awasthi, A. Evaluating bikesharing service quality: A case study for BIXI, Montreal. Int. J. Prod. Qual. Manag. 2020, 29, 45–61. [Google Scholar] [CrossRef] [Scilit]
- Chung, K.S. A study on airline service quality assessment using potential customer satisfaction improvement index based on Kano model—Centered around Chinese passengers. J. Korean Soc. Qual. Manag. 2016, 44, 813–831. [Google Scholar] [CrossRef] [Scilit]
- Kim, S.C. A study on the service quality improvement by Kano model & weighted potential customer satisfaction index. J. Distrib. Sci. 2010, 8, 17–23. [Google Scholar] [CrossRef] [Scilit]
- Parasuraman, A.; Zeithaml, V.A.; Berry, L.L. SERVQUAL: A multiple-item scale for measuring consumer perceptions of service quality. J. Retail. 1988, 64, 12–40. [Google Scholar]
- Timko, M.; Walden, D. Kano’s methods for understanding customer-defined quality. Cent. Qual. Manag. J. 1993, 2, 2–36. [Google Scholar]
- Kano, N.; Seraku, N.; Takahashi, F.; Tsuji, S. Attractive quality and must-be quality. J. Jpn. Soc. Qual. Control 1984, 14, 39–48. [Google Scholar]
- Shahin, A.; Pourhamidi, M.; Antony, J.; Hyun Park, S. Typology of Kano models: A critical review of literature and proposition of a revised model. Int. J. Qual. Reliab. Manag. 2013, 30, 341–358. [Google Scholar] [CrossRef] [Scilit]

Disclaimer/Publisher’s Note: The statements, opinions and data contained in all publications are solely those of the individual author(s) and contributor(s) and not of MDPI and/or the editor(s). MDPI and/or the editor(s) disclaim responsibility for any injury to people or property resulting from any ideas, methods, instructions or products referred to in the content. |
© 2026 by the authors. Licensee MDPI, Basel, Switzerland. This article is an open access article distributed under the terms and conditions of the Creative Commons Attribution (CC BY) license.