1. Introduction
Digital media have reshaped destination marketing by placing promotional communication, peer-generated information, social interaction, and consumer evaluation within the same networked environment [
1,
2,
3,
4]. For tourism destinations, one consequence is an unprecedented capacity to become visible through the rapid circulation of destination-related content. Such visibility matters beyond audience reach. Once prospective visitors encounter, compare, and interpret destination information online, those representations become part of the informational environment against which the destination is subsequently experienced and evaluated. The growing prominence of digitally visible destinations therefore raises a broader tourism question: how are evaluations informed by online destination information connected with visitors’ assessments after actual travel?
Destination-image research provides an established foundation for addressing this question. Cognitive image (CI) and affective image (AI) represent interconnected components of destination evaluation, capturing what visitors know about a destination and how they feel towards it [
5,
6,
7]. These image evaluations have been linked with perceived value (PV), satisfaction (SAT), and behavioural intention across tourism settings [
8,
9,
10]. Recent evidence from city branding and heritage tourism further demonstrates the relevance of cognition–affect–intention relationships and the role of affective evaluation in destination advocacy [
11,
12]. At the same time, research on online representations, tourism photographs, and user-generated content shows that destination meanings are increasingly constructed and circulated through multiple digital sources [
13,
14,
15]. Together, these studies establish both the evaluative importance of destination image and the growing digital context in which such images are formed and reinforced.
A more specific problem emerges when this literature is considered alongside contemporary digital-marketing research. Studies of online tourism communication and influencer marketing have generated substantial knowledge about content characteristics, source credibility, authenticity, social interaction, engagement, and the audience responses associated with digitally circulated destination information [
16,
17,
18,
19,
20,
21,
22,
23,
24,
25]. This literature is particularly effective at explaining how destinations attract attention and how online communication shapes perceptions before or around travel. Destination-evaluation research, by comparison, has developed a mature account of how image, perceived value, satisfaction, and future intentions are associated with one another. The two traditions therefore illuminate different stages of the tourism evaluation process. What requires closer integration is the point at which digitally informed destination meanings meet the realised travel experience: how cognitive and affective evaluations associated with online information remain connected with experiential value, overall satisfaction, and future-oriented intentions after visitors have consumed the destination experience. Addressing this connection shifts the analytical focus from the production of online visibility itself to the post-visit evaluations through which that visibility acquires tourism significance.
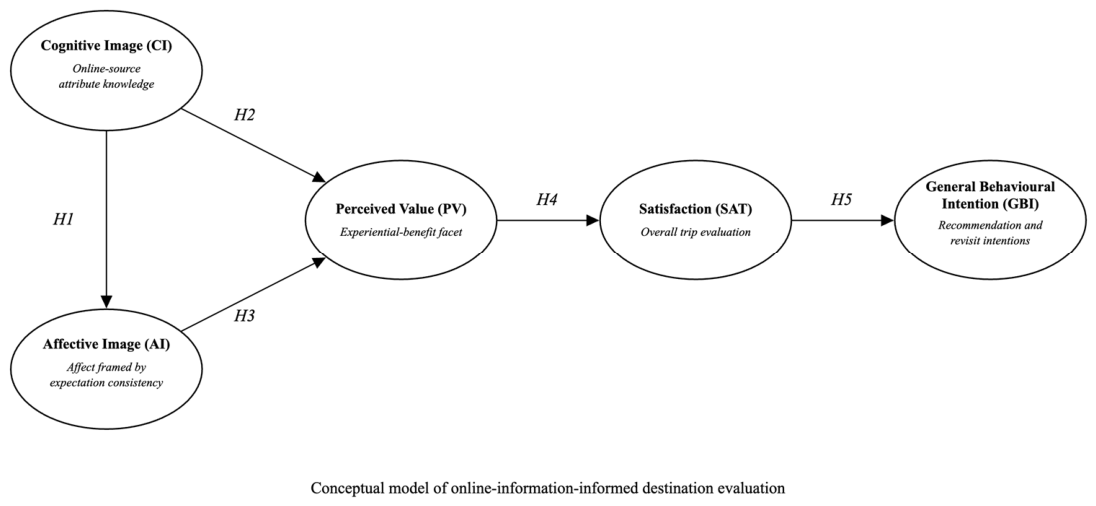
The present study develops this connection by combining destination-image scholarship with the benefit-appraisal logic of Social Exchange Theory (SET). SET conceptualises subsequent responses as related to individuals’ evaluations of benefits and returns associated with an experience [
26,
27]. Within the present framework, destination-image research provides the conceptual basis for CI and AI, while SET informs interpretation of the realised-benefit appraisal represented by the PV–SAT–GBI segment. Experiential benefits such as enrichment, novelty, understanding, curiosity fulfilment, and enjoyment are reflected in PV; SAT represents respondents’ broader evaluation of the trip; and general behavioural intention (GBI) captures recommendation and revisit intentions. This theoretical division links online-information-informed destination image with post-consumption evaluation while giving the experiential-value component a clear benefit-appraisal interpretation.
Zibo, China, provides a particularly informative setting in which to examine this evaluation process. The city emerged rapidly as a phenomenon-driven urban destination associated with food tourism and urban leisure, with its recent tourism prominence closely connected to digital communication, value co-creation, and online consumption [
28,
29]. Unlike destinations whose market position is supported primarily by long-established heritage, natural attractions, or mature tourism brands, Zibo illustrates a setting in which substantial destination visibility developed over a relatively concentrated period of digital circulation. Its trajectory makes the relationship between online-informed destination image and post-visit evaluation especially salient: widespread visibility can bring visitors to a destination, but the continuing tourism relevance of that visibility is ultimately reflected in how those visitors evaluate what they experienced and in their willingness to recommend or revisit the destination.
Digital visibility can place a destination on the tourism map, but visibility alone does not reveal how online-informed evaluations relate to what visitors experience after arrival. This study addresses that problem through three questions. RQ1 examines the association between CI and AI; RQ2 considers how CI and AI relate to PV and how PV corresponds with SAT; and RQ3 examines the association between SAT and GBI, comprising recommendation intention (RCI) and revisit intention (RI). Together, these questions define the prespecified CI–AI–PV–SAT–GBI sequence (M0), which provides the study’s confirmatory basis.
The study makes two contributions. First, it connects digital destination visibility with post-visit destination evaluation by shifting attention from the production of online prominence to the visitor evaluations that follow destination consumption. In doing so, it brings cognitive and affective image, experiential value, satisfaction, and future intentions into a single post-visit framework. Second, it examines this sequence in Zibo, a phenomenon-driven urban destination whose rapid rise through digital circulation makes the persistence of online-informed evaluations especially salient. The results reveal a coherent pattern linking CI, AI, PV, SAT, and GBI, with indirect associations extending through the value–satisfaction sequence. Rather than treating online attention as the endpoint of destination success, the study shows how digitally informed evaluations remain connected with visitors’ responses after travel.
3. Methods
3.1. Research Context, Participant Recruitment and Analytical Sample
Zibo, Shandong Province, China, was selected as a phenomenon-driven, digitally visible urban destination associated with food tourism and urban leisure. Academic accounts relate its recent tourism prominence to digital communication, value co-creation, and online consumption [
28,
29]. This atypical trajectory makes Zibo an informative but contextually bounded setting for examining how online-information-informed destination evaluations are associated with post-visit value, satisfaction, and future intentions.
The target population comprised adults able to evaluate their Zibo travel experience and destination-related online information. Eligibility required participants to be aged 18 years or older, to have visited Zibo, and to meet the destination-information exposure criterion. Using convenience sampling, the questionnaire was hosted on Wenjuanxing (
http://www.wjx.cn; (accessed on 24 August 2024)) and circulated through WeChat and other social platforms from 24 to 31 August 2024. After reading the study information, participants provided informed consent before entering the anonymous and confidential survey and answered with reference to their Zibo travel experience and online information. Participants whose responses passed quality screening received CNY 5. Duplicate submissions from the same device/IP were restricted, and attention checks were embedded. Responses completed in under 3 min or failing attention checks were excluded. Of 440 questionnaires obtained, 10 incomplete responses, 7 with more than 10% missing items, 9 straight-lining cases, and 9 implausibly fast completions were excluded, leaving 405 questionnaires (92.0% retention). The survey did not collect respondents’ residence, previous-visit frequency, specific visit dates, platform-specific exposure, exposure frequency, creator type, or engagement behaviour. Accordingly, the empirical scope is defined at the level of online-information-informed post-visit destination evaluation within a broader digital information environment.
3.2. Measurement
All constructs were measured on five-point Likert scales ranging from 1 (strongly disagree) to 5 (strongly agree). The instrument comprised four CI items, four AI items, five PV items, three SAT items, six GBI items, and six demographic questions. The administered measurement wording is reported with the measurement-model results.
The questionnaire was developed from published tourism and hospitality management measurement scales already cited for the respective constructs. English-language items were adapted to the Zibo context while retaining their original conceptual meaning, translated into Chinese, and then back-translated into English. Two researchers with tourism-research expertise reviewed the translated instrument for clarity, semantic equivalence, and contextual appropriateness. A pilot test was conducted with 40 participants who met the target eligibility criteria to assess item clarity, readability, completion time, and comprehension difficulty. Based on the pilot results, only minor wording adjustments were made. The pilot respondents were independent of the main study sample, and their responses were excluded from the final analysis.
The CI items concerned knowledge obtained from online sources about cultural and historical attractions, cultural diversity, accommodation and dining, and service conditions [
5,
6,
7,
35,
36]. The AI items assessed feeling invigorated, happy, excited, and relaxed in relation to online expectations [
6,
7,
12,
39]. PV captured five experiential benefits: enrichment, curiosity fulfilment, novelty, understanding, and enjoyment [
8,
41,
42]. SAT comprised an excellent experience, a deep impression, and overall trip satisfaction [
8,
41,
42]. GBI comprised two RCI items and four RI items [
43,
44,
45,
46].
These item contents establish the substantive meaning of the study constructs. CI represents online-source attribute knowledge, AI combines affect with expectation consistency, PV captures realised experiential benefits, and the deep-impression item contributes a memorability component to SAT. The analysis follows these administered meanings, including the affective overlap between one PV item and the AI content, the combined accommodation-and-dining CI item, and the two-recommendation/four-revisit composition of GBI. These operational definitions guide interpretation of the reliability, measurement, and structural results.
3.3. Analytical Strategy
The analysis began with record completeness, item distributions, Mardia’s multivariate skewness and kurtosis tests, and Mahalanobis-distance screening at
p = 0.001. Internal consistency was evaluated with Cronbach’s α. Common method variance was examined through complementary procedural, factor-level, and construct-level approaches: Harman’s unrotated component analysis, a confirmatory single-factor comparison, construct-level full-collinearity VIFs, and an unmeasured latent method-factor sensitivity model [
47,
48,
49]. For the VIF assessment, each construct mean was regressed on the remaining four construct means and VIF was calculated as 1/(1 − R
2). In the latent method-factor model, every indicator loaded on its theorised construct and on an orthogonal method factor; the first method loading was fixed to 1 and all method–trait covariances were fixed to zero. Discriminant validity was assessed using latent correlations, the Fornell–Larcker comparison, and the complete heterotrait–monotrait (HTMT) matrix [
50,
51].
The five-factor measurement model and prespecified latent structural model (M0) were estimated by maximum likelihood in IBM SPSS Amos 29.0. Overall model fit was evaluated using χ
2, df, χ
2/df, CFI, TLI, RMSEA, SRMR, AIC, and BIC [
52].M0 comprised H1–H5 and served as the confirmatory structural specification. An expanded same-sample model adding CI → GBI and AI → GBI (M1) was examined subsequently as a post-hoc exploratory comparison and is reported briefly in
Section 4.8 and the
Supplementary Materials. The M0 specification was also re-estimated in semopy 2.3.11 as a supplementary maximum-likelihood robustness check.
GBI dimensionality was assessed by comparing a one-factor model, with E1–E6 loading on GBI, against a correlated two-factor model in which E1–E2 loaded on RCI and E3–E6 on RI. For identification, the first loading of each latent factor was fixed to 1, latent variances were freely estimated, and factor covariances were unrestricted. Under this parameterisation, the two-factor model contained five additional net free parameters; one loading was removed by the second scaling constraint, while the additional factor variance and covariance terms increased model complexity. Sensitivity analyses used standardised construct means and dummy-coded controls for gender, age, education, marital status, occupation, and income, with HC3 robust standard errors. The M0 equations were re-estimated with these controls. RCI and RI were also modelled separately as restricted outcomes predicted by SAT and the same demographic controls. Finally, the seven indirect-effect process tests were estimated within M0 using 5000 nonparametric case-resampling bootstrap samples. All resamples converged successfully, and percentile 95% confidence intervals were calculated for each product term [
53].
4. Results
4.1. Data Distribution and Diagnostic Checks
All 405 records were complete across the 22 measurement items and six demographic variables. Item skewness ranged from −0.997 to −0.629 and excess kurtosis from −0.726 to 0.319. Mardia’s tests rejected multivariate normality for skewness and kurtosis (both p < 0.001). No observation exceeded the Mahalanobis-distance criterion of χ2(22) = 48.268 at p = 0.001. The complete analytical sample was retained, and the normal-theory latent estimates were considered together with bootstrap intervals and HC3 sensitivity analyses.
4.2. Descriptive Analysis
The demographic profile of the 405 respondents is summarised in
Table 1. The sample was almost evenly divided by gender, with men accounting for 52.1% and women 47.9%. Respondents aged 20–39 constituted 57.6% of the sample, and those aged 30–39 formed the largest age group (35.6%). Regarding education, 41.7% held a bachelor’s degree and 14.1% held a master’s degree or above. Most respondents were married (61.5%), followed by those who were single (31.6%) or divorced (6.9%). Office staff (27.7%) and service-industry employees (21.2%) represented the two largest occupational groups. In addition, 54.5% of respondents fell within the two reported monthly-income bands covering CNY 5000–9000. The complete demographic distribution is presented in
Table 1.
On the five-point scales, CI had the highest mean (M = 3.869, SD = 0.930), followed by AI (M = 3.787, SD = 0.980), GBI (M = 3.754, SD = 0.967), PV (M = 3.628, SD = 1.028), and SAT (M = 3.627, SD = 1.134).
4.3. Common Method Variance
Several complementary analyses were conducted to assess shared method variance [
47,
48,
49]. The questionnaire introduced participation as voluntary, anonymous, and confidential, reducing evaluation apprehension and socially desirable responding. Harman’s unrotated analysis yielded five components with eigenvalues above 1, and the first component accounted for 37.180% of total variance. The construct-level full-collinearity VIFs were 1.447 for CI, 1.511 for AI, 1.661 for PV, 1.458 for SAT, and 1.540 for GBI. A confirmatory single-factor model showed poor fit, χ
2(209) = 1672.672,
p < 0.001, CFI = 0.650, TLI = 0.613, RMSEA = 0.132, and SRMR = 0.101, and was substantially inferior to the theorised five-factor measurement model, Δχ
2(10) = 1436.613,
p < 0.001.
An additional latent method-factor model allowed each indicator to load simultaneously on its theorised construct and on an orthogonal common factor. This specification yielded χ2(177) = 190.154, p = 0.236, CFI = 0.997, TLI = 0.996, RMSEA = 0.014, and SRMR = 0.025. The squared standardised method loadings accounted for 3.6% of item variance on average. Substantive loadings changed by 0.025 on average, with a maximum change of 0.062. All substantive loadings remained positive and substantial (0.670–0.795), and no negative residual variances emerged. Taken together, the method-factor estimates indicate that method-related variance accounted for a limited share of item variance and that the five substantive constructs retained differentiated loading patterns in the measurement model.
4.4. Measurement Model
The five-factor measurement model showed a strong fit to the data, χ
2(199) = 236.059,
p = 0.037, χ
2/df = 1.186, CFI = 0.991, TLI = 0.990, RMSEA = 0.021, and SRMR = 0.030 (
Table 2). The GFI (0.946), AGFI (0.938), and NFI (0.946) provided further support for the adequacy of the measurement specification.
Standardised CFA loadings ranged from 0.676 to 0.808 (
Table 3). Cronbach’s α and composite reliability (CR) values ranged from 0.827 to 0.884, and average variance extracted (AVE) ranged from 0.545 to 0.614. These results support internal consistency and convergent validity within the operational definitions and item content described in
Section 3.2.
The five constructs also exhibited clear empirical separation [
50,
51]. As shown in Panel A of
Table 4, the square root of AVE for each construct (0.738–0.784) exceeded all corresponding latent correlations (0.423–0.574). Panel B reports the complete HTMT matrix, with values ranging from 0.422 to 0.575 and remaining below the conservative 0.85 criterion. The Fornell–Larcker and HTMT results therefore provided convergent support for discriminant validity.
The one-factor GBI model yielded χ2(199) = 236.059, p = 0.037, CFI = 0.991, TLI = 0.990, RMSEA = 0.021, and SRMR = 0.030, whereas the correlated RCI–RI model yielded χ2(194) = 231.079, p = 0.035, CFI = 0.991, TLI = 0.989, RMSEA = 0.022, and SRMR = 0.029. The two-factor model did not improve fit, Δχ2(5) = 4.979, p = 0.418, and its standardised RCI–RI correlation of 1.019 constituted an inadmissible solution rather than affirmative evidence of unidimensionality. GBI was retained as a parsimonious primary representation because the two-factor solution was not interpretable and fit did not improve; separate RCI and RI analyses were reported to examine whether the two-versus-four item composition obscured outcome-specific associations.
4.5. Prespecified Structural Model Results
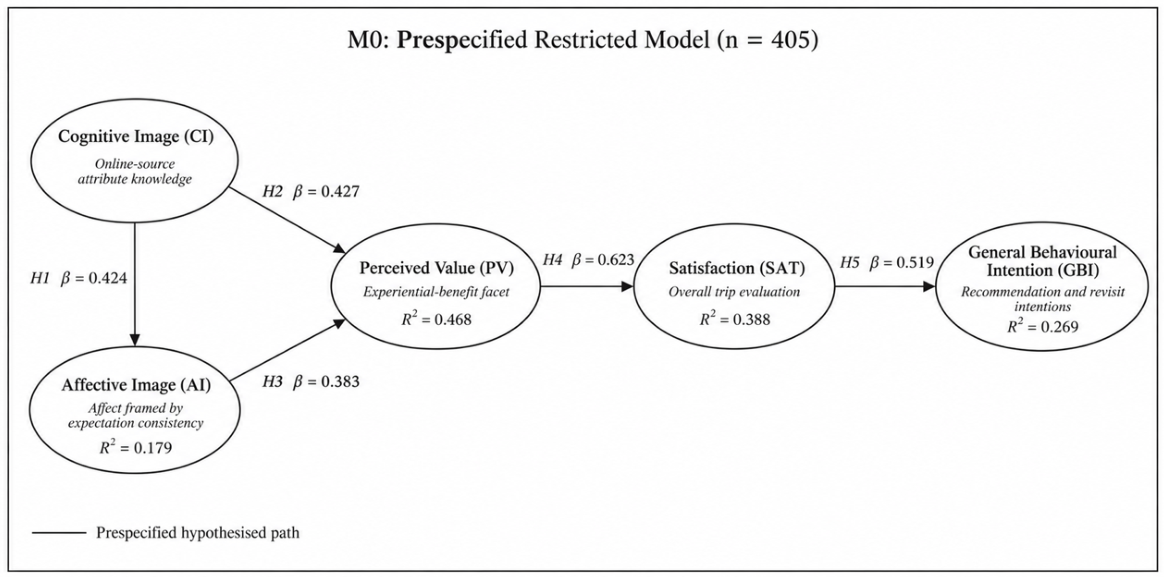
The prespecified restricted model (M0) yielded χ
2(204) = 354.617,
p < 0.001, χ
2/df = 1.738, CFI = 0.964, TLI = 0.959, RMSEA = 0.043, SRMR = 0.102, AIC = 452.617, and BIC = 648.807 (
Table 5). Although CFI, TLI, and RMSEA indicated comparatively favourable fit, the elevated SRMR suggested remaining discrepancy between the model and the observed covariance structure. Within this specification, all five hypothesised structural paths were positive and statistically significant (
Figure 2;
Table 6). M0 explained 17.9% of the variance in AI, 46.8% in PV, 38.8% in SAT, and 26.9% in GBI. Taken together, the path estimates support H1–H5, while the SRMR indicates that the prespecified model does not fully account for the observed covariance structure.
Table 6 reports the structural path estimates for M0. Significant positive associations were observed from CI to AI (β = 0.424,
p < 0.001), from CI and AI to PV (β = 0.427 and 0.383, respectively; both
p < 0.001), from PV to SAT (β = 0.623,
p < 0.001), and from SAT to GBI (β = 0.519,
p < 0.001). These results provide support for H1–H5.
4.6. Robustness and Outcome Sensitivity Analyses
As a robustness check, the prespecified M0 specification was re-estimated in semopy 2.3.11 using the maximum-likelihood Wishart objective. The supplementary estimates were consistent with the primary analysis in both direction and magnitude across the five latent structural relationships.
After controlling for gender, age, education, marital status, occupation, and income, the standardised composite-score coefficients remained positive and statistically significant for CI → AI (β = 0.349), CI → PV (β = 0.387), AI → PV (β = 0.326), PV → SAT (β = 0.464), and SAT → GBI (β = 0.385), all p < 0.001.
Additional outcome-specific sensitivity analyses also showed that SAT remained positively associated with both recommendation intention (RCI) (β = 0.356, HC3 SE = 0.053, 95% CI [0.252, 0.459],
p < 0.001) and revisit intention (RI) (β = 0.373, HC3 SE = 0.050, 95% CI [0.276, 0.470],
p < 0.001). Taken together, these analyses indicate that the main M0 relationships were robust across alternative estimation, demographic adjustment, and outcome specification (
Table 7).
4.7. Indirect-Effect Process Tests
Bootstrap analysis of the seven M0 indirect-effect process tests yielded positive estimates throughout, with all percentile 95% confidence intervals excluding zero (
Table 8). The shorter indirect associations were observed for CI → AI → PV (PT1: estimate = 0.187, 95% CI [0.116, 0.283]), CI → PV → SAT (PT2: 0.317, [0.206, 0.446]), AI → PV → SAT (PT3: 0.251, [0.155, 0.379]), and PV → SAT → GBI (PT4: 0.316, [0.206, 0.464]). The longer sequential associations were likewise positive for CI → PV → SAT → GBI (PT5: 0.156, [0.089, 0.250]), CI → AI → PV → SAT → GBI (PT6: 0.059, [0.028, 0.111]), and AI → PV → SAT → GBI (PT7: 0.124, [0.066, 0.207]). Collectively, these results indicate a consistent pattern of model-conditional indirect associations across the prespecified CI–AI–PV–SAT–GBI sequence.
4.8. Post-Hoc Exploratory Model Comparison
As a secondary assessment of structural adequacy, an expanded specification (M1) incorporating direct CI → GBI and AI → GBI paths was estimated post hoc using the same sample. For transparency, M1 is retained only as a post-hoc exploratory comparison and is not used as a basis for confirmatory inference, theoretical conclusions, managerial implications, or practical recommendations. Because these additional paths were not prespecified, the expanded specification is interpreted separately from the confirmatory M0 results. Full model-fit statistics, structural estimates, and the corresponding path diagram are reported in
Supplementary Figure S1 and Supplementary Tables S1 and S2. Accordingly, all substantive interpretation in the following Discussion is based exclusively on the prespecified M0 results.
5. Discussion
5.1. Research Findings
The M0 results point to a coherent post-visit evaluation pattern rather than a set of isolated structural associations. CI was positively associated with AI and PV, AI with PV, PV with SAT, and SAT with GBI; all seven bootstrap product terms were likewise positive, with percentile 95% confidence intervals excluding zero. Taken together, these findings suggest that digitally informed destination evaluations remain connected to how visitors appraise the realised experience and their subsequent destination intentions. The elevated SRMR (0.102), however, indicates that this prespecified sequence captures an important part, but not the entirety, of the observed covariance structure.
The CI–AI association is consistent with the established view of destination image as an interrelated cognitive–affective system [
6,
7,
11]. In Zibo, attribute knowledge acquired through online sources was positively associated with expectation-framed affective responses, and both dimensions were associated with PV. This pattern accords with prior evidence linking destination image with perceived value and tourist responses [
5,
8,
9,
40], while highlighting a feature of digitally visible destinations: online information remains part of the evaluative frame through which the experienced destination is interpreted after visitation.
The downstream relationships place experiential appraisal at the centre of this post-visit process. PV was positively associated with SAT (β = 0.623), and SAT with GBI (β = 0.519), consistent with research connecting experiential benefits, satisfaction, and future-oriented destination responses [
41,
42,
43,
44,
45,
46]. Within the bounded SET interpretation adopted here, the key insight lies in the correspondence between realised experiential benefits, overall trip appraisal, and subsequent recommendation and revisit intentions. The separate RCI and RI sensitivity analyses reinforce this interpretation by reproducing a positive SAT–outcome association for both components of GBI.
The indirect-effect process tests further show how these relationships operate as a connected evaluative sequence. CI was indirectly associated with PV through AI; CI and AI were indirectly associated with SAT through PV; and both image dimensions were linked with GBI through the PV–SAT sequence. The longer product terms remained positive when the sequence was extended to GBI. Rather than treating destination image as an endpoint of digital visibility, these findings position it as the front end of a broader post-visit appraisal structure connecting online-informed cognition and affect with realised value, satisfaction, and future intentions.
5.2. Theoretical Implications
First, the study shifts attention from digital visibility as an outcome of online circulation to the post-visit evaluations through which that visibility acquires tourism meaning. By locating online-source attribute knowledge and expectation-framed affective responses within the image–value–satisfaction–intention sequence, the study connects digital tourism research with destination-evaluation scholarship in a phenomenon-driven urban context.
Second, the findings sharpen the conceptual role of destination image in digitally visible destinations. CI and AI are not treated simply as perceptual outcomes of online exposure, but as the cognitive and affective starting points of an evaluative structure linking destination meanings with experiential value, satisfaction, and future intentions. This perspective recasts digital visibility as an informational context whose significance extends beyond attention generation to post-consumption appraisal of the destination experience.
Third, the study gives SET a focused interpretive role in this downstream appraisal process. The positive PV–SAT–GBI relationships indicate that evaluations of realised experiential benefits correspond with overall trip appraisal and subsequent recommendation and revisit intentions [
26,
27]. Within this framework, destination-image scholarship explains the cognitive and affective foundations of evaluation, whereas SET helps interpret how experienced benefits are connected with satisfaction and future-oriented responses. The theoretical value therefore lies in linking digitally informed destination meanings with a benefit-appraisal sequence after travel, rather than treating online visibility and post-visit evaluation as separate stages of the tourism process.
5.3. Practical Implications
For digitally visible destinations, the managerial challenge extends beyond sustaining online attention to ensuring that the destination experience can substantiate the meanings formed through digital exposure. The positive associations of CI and AI with PV suggest that destination organisations should treat online communication and on-site experience design as an integrated system: attribute information should be accurate and credible, while affective representation should remain consistent with what visitors can realistically encounter. The strong PV–SAT relationship further indicates that visibility must ultimately be converted into tangible experiential benefits, particularly enrichment, novelty, understanding, curiosity fulfilment, and enjoyment. Satisfaction, in turn, remains closely connected with recommendation and revisit intentions, underscoring the importance of managing the entire visitor journey rather than isolated promotional touchpoints. For phenomenon-driven destinations such as Zibo, the strategic implication is therefore not simply to generate attention, but to sustain alignment between digitally communicated destination meanings and the value visitors actually realise after arrival. The corresponding actor-specific applications are summarised in
Table 9.
5.4. Limitations and Future Research
This study has four main limitations. First, the single-city convenience sample from Zibo limits the transferability of the findings across destination types and cultural settings; comparative research across Chinese and international destinations is therefore needed to assess their contextual stability and broader generalisability. Second, the cross-sectional self-report design captures contemporaneous associations rather than temporal ordering, which future longitudinal and behaviour-based studies could examine. Third, the measures reflect their administered operationalisations: CI emphasises online-source attribute knowledge, AI incorporates expectation congruence, PV captures experiential benefits, and GBI combines recommendation and revisit intentions. More differentiated measures may further clarify these constructs. Finally, M0 retained residual misfit (SRMR = 0.102). Although an expanded model was examined post hoc, its additional image–intention paths remain exploratory. Future research should assess alternative structural specifications using preregistered designs and independent samples.
6. Conclusions
Evidence from Zibo indicates a coherent post-visit evaluation sequence linking online-information-informed cognitive image (CI), affective image (AI), perceived value (PV), satisfaction (SAT), and general behavioural intention (GBI). The findings show that digitally informed destination evaluations remain connected with how visitors appraise realised experiential value, overall satisfaction, and future intentions after travel. The study therefore extends destination-evaluation research into a phenomenon-driven, digitally visible urban context, while using Social Exchange Theory (SET) selectively to interpret the PV–SAT–GBI benefit-appraisal segment. From a managerial perspective, the central implication is that online visibility creates tourism value only when communicated destination meanings are matched by credible and rewarding on-site experiences. Given the single-city, cross-sectional design and residual misfit in M0, the conclusions remain contextually bounded. Ultimately, for digitally visible destinations, the strategic challenge is not merely to be seen, but to remain worth remembering after visitors arrive.