


Abstract
Online review platforms are core infrastructure of digital commerce, yet the business-level determinants of review content remain poorly understood. We examine how service participation intensity, the degree to which a business format requires active customer involvement, relates to the affective–experiential language of reviews and to rating extremity. We analyze 6,151,996 Yelp reviews (2010–2022) with two independently validated instruments: a Business Participation Index, whose 39 attribute and 1263 category weights derive from an independent coding procedure (two large-language-model raters from different model families applying written, hypothesis-blind codebooks; Krippendorff’s –) and a 35-indicator text framework validated against a review sample dual-coded under the same procedure. Participation and hedonic–utilitarian positioning, measured independently for the first time, are negatively entangled across the platform (). Decomposing the two shows that positioning absorbs roughly thirty percent of the raw participation–hedonic association. The remainder survives category, price, geography, and year fixed effects with business-clustered errors (, standardized ), inverse-probability weighting, and Oster bounds (). Extremity analysis reveals an asymmetry: higher participation predicts one-star reviews (odds ratio of 1.13) but not five-star reviews. The hedonic–analytical co-occurrence index, the joint elevation of the two language modes, adds no information beyond its components (incremental ) and is not advanced as a mechanism. Format-based comparisons in review analytics must condition on positioning.
1. Introduction
Online review platforms have become core infrastructure of digital commerce. Consumer-generated ratings and text guide purchase decisions and even shape conformity in subsequent consumer behavior [1,2], and they constitute a primary asset of the platforms that host them [3]. Because a review is, at once, a decision aid for consumers and a data-driven signal for firms’ decisions, a substantial body of electronic-commerce research has sought to explain what reviews contain and why some are more extreme, more helpful, or more informative than others [4,5,6]. User-generated content carries machine-extractable information about consumer needs [7], its drivers vary across consumer segments [8], and its tone responds to firm behavior such as managerial replies [3]. However, a basic business-level question remains underexplored: How does the way a business is operated and, in particular, how much it requires customers to participate in producing the service shape the cognitive content and extremity of the reviews it accumulates?
Answering this question matters for how platform data are analyzed. Review-analytics and platform studies routinely compare businesses that differ in operating format, such as self-service versus full service, co-production versus delivery, or appointment-based versus walk-in, and attribute differences in review outcomes to those formats. Such comparisons implicitly assume that a business’s participation intensity is separable from its hedonic versus utilitarian positioning, that is, from whether it is consumed mainly for experiential pleasure or for functional benefit [9]. Whether that assumption holds in the population of businesses on a real platform is an empirical question with direct consequences for the validity of format-based comparisons. To address it, we draw on dual-process theory, which distinguishes fast, affect-laden experiential processing (System 1) from slow, deliberative analytical processing (System 2) [10,11]. Writing a review is, itself, a dual-activation task, since the consumer must reconstruct experiential memories while organizing them into useful, communicable text, so the resulting text should carry separable traces of the two modes, which we measure at platform scale as affective–experiential and analytical–informational surface language.
These ingredients generate two competing predictions. The first, which we call the participation-paradox view, follows from the intuition that high-participation formats heighten both experiential and analytical engagement during review writing, producing cognitive conflict that pushes ratings toward the extremes. The second, the structural-confound view, holds that participation intensity and hedonic–utilitarian positioning are not independent in real platform populations. We posit that this entanglement plausibly reflects underlying market forces, with utilitarian services facing cost pressures that favor self-service and co-production while hedonic services rely on full-service formats to signal quality and justify price premiums. If positioning is bundled with participation in this way, then any apparent “participation effect” on review content may instead be a positioning effect in disguise. Throughout, we use “structural confound” in a precise, measurement-level sense: the two business-level constructs are empirically non-independent in the platform population, so analyses that include one while omitting the other are exposed to omitted-variable bias. The term makes no causal claim about how the entanglement arose, and we reserve “participation paradox” for the theoretical prediction it competes with.
We adjudicate these predictions on 6,151,996 Yelp reviews spanning 2010–2022 and, in doing so, contribute two measurement instruments built for platform data, both now independently validated. The Business Participation Index (BPI) converts 39 structured service attributes and 1263 business category labels into a continuous measure of participation intensity whose weights are derived from an independent coding procedure instead of author judgment (Section 3.4). A separate, independently coded positioning measure locates every business on the hedonic–utilitarian continuum, so the confound can be demonstrated, not asserted. The 35-indicator natural language processing framework separates affective–experiential from analytical–informational language in review text and is validated against a review sample dual-coded under the same procedure. The evidence favors the structural confound in a quantified form: participation and positioning correlate at across the review panel ( across businesses). Positioning absorbs roughly thirty percent of the raw participation–hedonic association, and the remaining seventy percent survives category, price, geography, and year fixed effects with business-clustered standard errors (), inverse-probability weighting with demonstrated covariate balance, and Oster sensitivity bounds (). Rating-extremity analysis with outcome-appropriate categorical models reveals a pole asymmetry: higher participation raises the odds of one-star reviews (OR ) but leaves five-star odds essentially unchanged. Joint hedonic–analytical elevation, a candidate “conflict” construct, adds no explanatory information beyond its two components (incremental ) and is not advanced as a mechanism.
This paper makes three contributions to electronic-commerce research. First, it delivers two reusable, platform-ready instruments with a complete validation program: the BPI and the text framework ship with written codebooks, independent dual-rater coding with blind human anchoring and adjudication, reliability statistics, criterion and discriminant validity evidence, and full construction code in a public repository. Second, it documents, independently measures, and decomposes a structural confound between participation and positioning in a real platform population. The decomposition converts a methodological caution into a usable quantity: roughly thirty percent of the raw “participation effect” on review language is positioning in disguise, and format-based comparisons that fail to condition on positioning inherit a bias of that order. Third, it offers an asymmetry account of review extremity. Participation-intensive formats carry elevated one-star risk with no offsetting five-star lift, which reframes extremity management as downside-risk management for high-participation businesses; because the design is observational, we present this as a target for controlled experimentation rather than an established causal lever [5,12].
The remainder of the paper proceeds as follows. Section 2 develops the theoretical background and derives one confirmatory hypothesis, stated as a pair of competing predictions, together with two exploratory research questions. Section 3 describes the data, the two measurement instruments, and the estimation strategy. Section 4 reports the results and identification analyses. Section 5 and Section 6 discuss implications for electronic-commerce research and practice and conclude the paper.
2. Theoretical Background and Hypotheses
2.1. Service Co-Creation and Consumer Expression in Participatory Encounters
Interpreting what reviews reveal about a business first requires a business-level account of how much its customers participate in producing the service they later evaluate, and service-dominant logic (S-D logic) supplies that account. S-D logic recast the consumer from passive recipient to active co-creator of value through the integration of firm and consumer resources, including skills, knowledge, and effort [13,14]. Later refinements [15] placed the quality of participatory engagement at the center of value realization, generating a substantial empirical literature on its antecedents and consequences.
A consistent thread across outcome domains is that participation reshapes the psychological stakes of the service encounter. Bendapudi and Leone [16] showed that co-production triggers self-serving attributional biases. Participating customers claim greater credit for favorable outcomes and attribute blame for unfavorable ones. Heidenreich et al. [17] found that failed co-created services generate more negative responses than failed firm-produced services because failure prompts internal self-attribution that heightens customers’ perceived guilt. In hospitality, Yen et al. [18] observed that perceived service innovativeness drives value co-creation through customer engagement, confirming that contextual perceptions shape the participation–outcome relationship.
Digital transformation has amplified both the scope and intensity of customer participation. Digital communication drives value co-creation and customer engagement across business networks [19], customer-to-customer dynamics introduce challenges absent from traditional encounters [20], and service delivery becomes a multi-step process in which value at each stage builds on prior stages [21]. Critically, Barrett et al. [22] showed that customer engagement operates through different features in utilitarian versus hedonic contexts, reinforcing the expectation that positioning systematically shapes the cognitive and affective architecture of consumer–firm interaction.
Despite this body of work, a consequential gap remains. The participation literature has examined effects on satisfaction, perceived value, loyalty, attribution, and behavioral intentions, but it has been largely silent on participation’s cognitive consequences at the expression stage, when consumers translate accumulated experience into evaluative text. Expression is not a neutral readout of stored attitudes. User-generated content carries rich, machine-extractable information about customer needs [7]; its topic-level drivers of star ratings vary across consumer segments [8]; the sentiment it expresses is, itself, heterogeneous and time-varying across contexts [23]; and it is shaped by strategic factors such as managerial responses [3]. de Kerviler et al. [24] further identified distinct “reviewing orientations” that shape how consumers translate experience into text, establishing the cognitive and stylistic character of a review as an object of analysis in its own right. However, no study has examined how customer participation in service production shapes the cognitive character of the resulting review text. The present research addresses this gap.
2.2. Dual-Process Theory in Consumer Evaluation and Online Reviews
Dual-process theories posit two qualitatively distinct modes of information processing that operate in parallel and may produce convergent or conflicting outputs [10,11]. System 1 is fast, automatic, and affect-laden, relying on heuristic cues, associative memory, and experiential knowledge. System 2 is slow, deliberative, and rule-governed, recruiting working memory and sequential reasoning. Stanovich and West [25] provided foundational evidence that individual differences in the deployment of these systems predict systematic departures from normative rationality, establishing them as functionally dissociable rather than only descriptive.
The heuristic–systematic distinction has a long pedigree in consumer research. Chaiken [26] showed that low-involvement consumers rely on source-based heuristic cues (System 1) while high-involvement consumers engage in systematic message processing (System 2). Petty et al. [27] provided complementary evidence through the Elaboration Likelihood Model, showing that peripheral and central routes produce attitude changes of differing durability. These frameworks have shaped consumer decision-making research, yet their application has been confined almost exclusively to the pre-purchase decision stage.
The hedonic–utilitarian distinction maps onto a dual-process architecture. Holbrook and Hirschman [9] described experiential consumption (fantasies, feelings, and fun) as engaging multisensory, emotive processing outside deliberative control. Voss et al. [28] showed that hedonic and utilitarian dimensions are empirically separable and independently assessable, providing measurement foundations for the two-dimensional evaluative space. Hedonic evaluation recruits affect-driven System 1 pathways, whereas utilitarian evaluation recruits System 2 comparisons of functional benefits against costs.
A growing body of work has applied dual-process and information-economics insights to online reviews without sustained theoretical development. Review helpfulness depends on the product class. Review depth raises helpfulness more for search goods, while extreme ratings are less helpful for experience goods [4], and informativeness thresholds for helpfulness differ across the two classes [29]. The heuristic–systematic framework has been applied to online hotel booking, where consumers combine an attraction-search heuristic with systematic value-for-money reasoning and switch flexibly between modes [30], to review–management response dynamics, where managers’ responses regulate the emotional contagion and rating carryover between successive reviews [31], and to transformer-based emotion extraction distinguishing hedonic (fiction) from utilitarian (nonfiction) contexts [32]. These studies establish that cognitive-processing dynamics are operative in the review system, but all focus on how readers process reviews rather than on how writers produce them.
This reader-centric focus is a theoretical omission. Writing a review is not passive retrieval of a pre-formed attitude but a constructive process in which the consumer must reactivate experiential memories, select aspects to foreground, and translate sensory and emotional impressions into text. The communicative demands of coherence, specificity, and informational utility recruit System 2 processing, even when consumption was largely hedonic, while retrieval of consumption memories engages affect-laden System 1 processing, even when the service was largely utilitarian. The review-writing task is therefore a dual-activation environment that creates the conditions under which dual-process theories predict inter-system tension. We carry this dual-activation account forward as a motivating framework: it identifies the expression stage as a theoretically distinctive site of joint experiential and communicative demands, while the validation program of Section 3.4 determines how much of the account our text measures can actually support.
2.3. Ambivalence, Joint Elevation, and Rating Extremity
The co-activation of competing systems during review composition raises the question of what evaluative consequences follow. Research on attitudinal ambivalence provides the foundation. Priester and Petty [33] proposed the gradual threshold model and showed that subjective ambivalence increases with the joint elevation of positive and negative evaluative inputs rather than when one input dominates. We treat the joint elevation of experiential and analytical language strictly as a descriptive text property (RQ1); whether it carries information as an independent construct is an empirical question tested in Section 4.3. Cacioppo et al. [34] provided a broader framework through the evaluative space model, which reconceptualized attitudes as positions in a two-dimensional space of independent positive and negative channels rather than on a single bipolar continuum.
The psychological consequences of ambivalence are well established. Ambivalent attitudes are experienced as aversive and motivate resolution strategies. Antonetti et al. [35] synthesized evidence that consumer emotional ambivalence arises from simultaneous positive and negative emotions toward a consumption object and is distinct from moderate evaluations. Prestini and Sebastiani [36] found that in luxury shopping, hedonic and cognitive elements coexist in ways that generate both approach and avoidance motivations. Chatterjee et al. [37] applied cognitive dissonance theory to online fake-review detection, modeling both heuristic and systematic processing cues as antecedents of the dissonance consumers experience.
A central prediction is that conflicting inputs do not average to moderate judgments but produce unstable attitudes prone to extreme shifts. When ambivalence is high, consumers resolve the discomfort by amplifying the dominant component, pushing judgments toward the scale extremes. Applied to reviews, this predicts that joint hedonic–rational elevation will be associated with more extreme star ratings. The prediction connects to the rating-distribution literature. Hu et al. [5] documented the J-shaped distribution of online ratings and attributed it to selection effects, whereby consumers with extreme experiences are disproportionately motivated to post. Hu et al. [38] formalized this through acquisition bias, whereby favorable predispositions drive purchasing and reviewing, and under-reporting bias, whereby extreme experiences drive writing. Using over 280 million reviews, Schoenmueller et al. [6] confirmed that polarity is pervasive across platforms and that its primary driver, “polarity self-selection”, leaves a sizable residual unexplained by consumer characteristics.
Selection effects provide an incomplete account. Sun [12] showed that rating variance carries information beyond the mean, with higher variance signaling niche products. Karaman [39] provided experimental evidence that review solicitation reduces extremity bias, which implies that the extremity of unsolicited reviews reflects systematic cognitive and motivational factors beyond who chooses to write. The cognitive process of review composition, itself, may contribute to extremity. If conflict during writing amplifies evaluative extremity, it would provide a mechanism complementary to selection, rooted in the dual-process architecture of the expression task. This point has implications for platform design, given that rating manipulation and review fraud already distort the informational value of online reviews [1,40]. Understanding the cognitive origins of rating extremity is essential for the design of platforms that produce reliable quality signals for consumers.
2.4. Hypothesis Development
We separate one confirmatory hypothesis, stated as a pair of competing directional predictions, from two exploratory research questions. The hypothesis concerns the participation–hedonic relationship, the study’s focal test, and was specified before any outcome model was estimated. The two research questions concern joint hedonic–analytical elevation and rating extremity; we label them as research questions rather than hypotheses because, as we disclose below, observed features of the data (the negative correlation between the two language composites and the discrete distribution of the extremity outcome) informed how they are framed and analyzed.
The confirmatory hypothesis concerns participation and hedonic expression. The experiential consumption literature suggests that services designed for sensory engagement and emotional arousal should elicit hedonic cognitive processing during review composition [9]. If participation amplifies experiential engagement, as service-dominant logic implies [14,15], then high-participation services should generate reviews with elevated hedonic content. The participation paradox therefore predicts the following:
H1 (Participation Paradox Prediction).
Higher service participation intensity is associated with greater experiential (hedonic) expression in consumer reviews.
The structural-confound view, however, generates a competing prediction. If high-participation services are systematically less hedonic in their positioning, the observed relationship should be negative, reflecting the confound between participation and positioning rather than a cognitive effect of participation per se.
H1alt (Structural Confound Prediction).
Higher service participation intensity is associated with lower experiential (hedonic) expression in consumer reviews, reflecting the endogenous bundling of participation with utilitarian positioning.
For analytical–informational language, we note that because the analytical and experiential composites are negatively correlated in our data (), any participation effect on analytical language estimated net of experiential content is mechanically small by construction. Conditioning on the negatively correlated outcome absorbs most of the variance that a simple bivariate model would attribute to participation. We therefore report the participation–analytical relationship as a descriptive check rather than a formal hypothesis. This choice was informed by the observed correlation and is therefore exploratory, which we state here explicitly. If the participation paradox were the true mechanism, we would expect a residual positive association. Under the structural-confound view, any residual effect should be small, and its sign should track whichever of the two positioning channels dominates in the remaining variance.
The first research question concerns joint elevation of the two language modes. In their gradual threshold model, Priester and Petty [33] showed that attitudinal ambivalence increases when both positive and negative evaluative inputs are simultaneously elevated. Extending that principle to dual-process dynamics would suggest a “cognitive conflict” construct; the simultaneous appearance of affective and analytical language in a text, however, does not, by itself, demonstrate psychological tension because the two modes are not opposing evaluations, and a co-occurrence index cannot, on its own, license a conflict interpretation. We therefore use the neutral term hedonic–analytical co-occurrence, treat it as a descriptive text property, and pose an exploratory question:
RQ1.
How does service participation intensity relate to the joint elevation (co-occurrence) of experiential and analytical language in review text?
The second research question concerns rating extremity. Research on attitudinal ambivalence suggests that conflicting evaluative inputs are resolved through polarization rather than moderation [33,41,42], and the rating-distribution literature documents pervasive polarity in platform ratings [5,6]. Because rating extremity in a five-point system takes only three values () and is dominated by its extreme category, we analyze it with outcome-appropriate categorical models, examining the one-star and five-star poles separately rather than imposing a common mechanism on both:
RQ2.
How does service participation intensity relate to the probability of extreme ratings, and is the relationship symmetric across the one-star and five-star poles?
Figure 1 summarizes the framework: the two business-level constructs with their independent measurement sources, the hypothesized entanglement between them, and the review-level outcomes through which the competing predictions and the two exploratory questions are examined.
Figure 1.
Conceptual framework. Business-level constructs and their measurement sources appear on the left, with review-level outcomes on the right; solid arrows carry the confirmatory hypothesis pair (H1 versus H1alt) and the positioning path, while dashed arrows indicate the exploratory questions (RQ1 and RQ2). The vertical double arrow denotes the hypothesized empirical non-independence (structural confound) between participation and positioning.
3. Data and Methods
3.1. Data Source and Platform
We draw on the Yelp Academic Dataset, a publicly available corpus of consumer reviews spanning 2005 to 2022. As the dominant local business review platform in North America, Yelp has been widely used in electronic-commerce and information systems research [43,44]. The dataset contains star ratings (1–5), full review text, user metadata (review count and registration date), and structured business attributes (service features, categories, and location).
Several inclusion criteria ensure data quality. We restrict the sample to reviews posted between 2010 and 2022 so that the platform had reached sufficient maturity, retain only reviews with word counts between 20 and 500 to exclude uninformative short posts and anomalous long entries, and require each business to have at least 10 reviews. The threshold is a sample-composition choice that favors established businesses with interpretable metadata rather than a statistical necessity for the index itself, which is computed from attributes alone; results are unchanged at thresholds of 20 and 50 reviews (Section 4.4). After filtering, the working sample contains 6,151,996 reviews of 99,162 businesses by 1,820,519 unique users (from an initial sample of 6,990,280 reviews). Regression models that condition on review- and user-level controls use 6,151,969 reviews after listwise deletion of 27 records with missing control values. One structural limitation of the dataset must be stated at the outset: business attributes and category labels are a single snapshot taken at the 2022 data release, whereas reviews span twelve years. Businesses that changed format over the period are therefore measured with error, which, under classical assumptions, attenuates participation coefficients toward zero; consistent with attenuation, not artifact, the focal estimate is stable across sub-periods and is, if anything, strongest in 2020–2022, the window closest to the attribute snapshot (Section 4.4); reviews of businesses closed by the snapshot date retain their final attribute profiles, and restricting the panel to businesses still open at the snapshot (83.3% of reviews) leaves the estimate essentially unchanged ( versus ). The 12-year span and cross-industry scope provide high statistical power and broad external validity.
3.2. Business Participation Index
To measure service participation intensity at the business level, we develop the Business Participation Index (BPI), a fully documented composite with an independently derived specification. The BPI draws on two information sources from the Yelp business metadata: 39 structured service attributes and all 1263 business category labels present in the analysis sample. Every weight is derived from an independent coding procedure rather than from author judgment: two large-language-model raters from different model families independently rated each attribute and each category label for customer participation intensity on an anchored 1–7 scale, following written, hypothesis-blind codebooks grounded in the service co-production literature [14,16,45]; Section 3.4 details the protocol, reliability, and validity evidence. An item’s weight is its mean rating centered at the scale midpoint, so weights run from (fully firm-produced) to (fully customer-produced), with no selection, trimming, or thresholding of any kind. A business’s raw score is the sum of the weights of its present attributes and listed categories, standardized to a z-score across the 150,346 scored businesses. Illustratively, the coding assigns strongly positive weights to self-service formats such as “Laundromat” and “Farmers Market” and strongly negative weights to full-service formats such as “Hotels” and table-service dining; the complete codebooks, all 1302 item weights, raw rater outputs, and construction code are in the public repository (Section 6). An alternative specification with a compact, author-assigned weight set is used as a robustness variant throughout; the two specifications correlate at , and all conclusions hold under both (Section 4.4).
For descriptive purposes, we classify businesses into three participation groups by z-score thresholds: high participation (; reviews), medium (; ), and low (; ). The review-weighted distribution is right-skewed (mean of and median of ), reflecting the preponderance of traditional, low-participation service formats on the Yelp platform (Figure 2).
Figure 2.
BPI distribution and group sizes. Panel (a) shows the business-level distribution of the z-scored index, with dashed lines at the group boundaries of . Panel (b) shows reviews per group: low participation (3.60 M reviews, 58.5%), medium (1.80 M, 29.3%), and high (0.75 M, 12.2%).
Whether the negative participation–positioning correlation we later document is an artifact of index construction is now an empirically testable question: the positioning measure is coded independently of the participation codebook, the participation codebook assigns zero weight to the amenity attributes most plausibly carrying hedonic signal, and Section 3.4 reports the discriminant evidence.
3.3. Cognitive Feature Extraction
To capture the dual-process character of review expression, we develop a 35-indicator NLP framework that separately measures hedonic (System 1) and rational (System 2) cognitive features in review text. The framework draws on established methods for the automated text analysis of consumer-generated content [46,47] and extends them with custom indicators designed to detect domain-specific manifestations of each processing mode. We retain the System 1/System 2 vocabulary here to describe the design rationale; per the validation evidence, the composites are interpreted throughout as measures of affective–experiential and analytical–informational language content (Section 3.4). The full list of 35 indicators appears in Table 1; we summarize the design logic here.
Table 1.
Cognitive feature indicators by processing system; the system labels describe the design rationale, and the composites are interpreted as surface-language measures (Section 3.4).
System 1 (hedonic) indicators capture automatic, affect-laden processing through six feature categories: VADER compound sentiment (Valence-Aware Dictionary and sEntiment Reasoner) as the affective core; sensory density across taste, sight, touch, sound, and smell [9]; stylistic intensity from exclamation marks and superlatives (“best”, “amazing”, and “terrible”); first-person pronoun density (experiential immersion); and emotion word density from the NRC Emotion Lexicon across eight discrete categories.
System 2 (rational) indicators capture deliberative, analytical processing through six parallel categories: causal connectors (“because” and “therefore”) and conditional clauses (“if…then”) for reasoned argumentation; comparison markers (“compared to” and “unlike”) for evaluative contrast; numeric information density (numbers, prices, and quantities); attribute mentions of concrete service dimensions (wait time, cleanliness, price, and quality); and hedging language (“somewhat” and “perhaps”) for calibrated judgment.
These indicators are aggregated into an experiential (hedonic) score and an analytical (rational) score using z-score standardization within each indicator, followed by mean aggregation. No further re-standardization is applied: because partially uncorrelated components are averaged, the composites’ standard deviations are 0.396 and 0.382, not one (Section 4.1 ), and all standardized effects reported below are computed against these observed standard deviations. Following the validation evidence in Section 3.4, we interpret the two composites as measures of surface language content, i.e., affective–experiential and analytical–informational, not as direct observations of System 1 and System 2 processing.
3.4. Measurement Validation
Both instruments are validated through an independent coding program that follows current methodological guidance on LLM-assisted annotation in management research [48]. Two large-language-model raters from different model families (Anthropic Claude Sonnet and xAI Grok 4.5, July 2026 versions) independently rated five item sets against written, hypothesis-blind codebooks: all 1263 category labels and all 39 attributes, each rated separately for participation intensity and hedonic–utilitarian positioning on anchored 1–7 scales, and a stratified sample of 504 reviews rated for experiential and analytical content. Cross-family agreement is indistinguishable from within-family agreement (a 200-item Claude Opus replication yields with its same-family counterpart versus across families), indicating that agreement reflects the codebooks, not shared model provenance. LLM raters at this reliability level match or exceed crowd and expert human coders on comparable text-annotation tasks [49,50] and have been validated for perceptual measurement in marketing [51]; we nonetheless treat them as raters to be audited, not oracles: items on which the two raters differ by two or more scale points enter a blind human adjudication queue; the construction rule for all derived weights was fixed and hash-stamped before any outcome model was estimated; and the full codebooks, prompts, raw rater outputs, and reliability code are in the public repository. Table 2 reports reliability for all five tasks; every Krippendorff exceeds the 0.80 threshold.
Table 2.
Reliability of the independent coding program (primary rater pair).
The positioning codes yield the independent business-level positioning measure the confound test requires: a business’s positioning score is the mean of its categories’ centered positioning ratings ( for the underlying codes), constructed with no reference to review text. Discriminant evidence comes from the same program: the coding assigned exactly zero participation weight to the amenity attributes one might most plausibly suspect of carrying a signal about something other than co-production (e.g., dogs allowed, Wi-Fi, television, coat check, and appointment-only), and the positioning and participation scores correlate at only across businesses, confirming related but distinct constructs. For the text instruments, rater scores converge with the automated composites (experiential , disattenuated ; analytical ) with the correct discriminant pattern (cross-construct correlations negative) and near-orthogonal rater scales (). The analytical composite’s components are mutually near-uncorrelated (Cronbach’s alpha ), so we characterize it explicitly as a formative index whose validity is assessed at the component level, where numeric density () and causal connectors () carry the association with human-judged analytical content; internal-consistency-based corrections do not apply to formative measurement. A blind human-coded anchor by one author (150 category labels and 100 reviews, both scales each) corroborates the category instruments at near-parity with the model raters (positioning: –, within-one-point agreement of 94–97%; participation: –) and shows moderate rank convergence with compressed scale use on the whole-text review scales (– against the rater mean, with anchor ratings averaging 0.4–0.6 points lower), the familiar signature of single-rater judgments of long free text; all anchor data are deposited with the audit trail. The pre-registered blind adjudication of every contested item (129 items across the four queues) is complete: post-adjudication weights correlate at (participation) and (positioning) with the pre-adjudication versions, the focal decomposition coefficient changes by less than ( to ), and no conclusion changes; both weight versions are in the repository. We accordingly interpret both composites as validated measures of surface language content, i.e., affective–experiential and analytical–informational, and not as direct observations of cognitive processing.
3.5. Hedonic–Analytical Co-Occurrence Index
Because the co-occurrence of affective and analytical language does not, itself, demonstrate psychological tension, we use the neutral term hedonic–analytical co-occurrence throughout and treat the index as a descriptive text property (RQ1). We operationalize co-occurrence as the geometric mean of the experiential and analytical scores:
where and are the positively shifted hedonic and rational scores for review i (shifted so that the minimum value is zero). The geometric mean is well suited to this purpose because it equals zero when either component is zero, increases monotonically when both components increase, and reaches its maximum when the two components are equal at high levels. These properties capture the intuition from the gradual threshold model of Priester and Petty [33] that ambivalence is driven by the joint elevation of opposing evaluative inputs, not by their independent levels.
To guard against operationalization dependence, we compute three alternative co-occurrence indices. The minimum of the two scores, , embodies the “bottleneck” logic that joint elevation is limited by the weaker signal. The product, , is a simple interaction term. The reversed absolute difference, , is maximized when the two scores are equal, regardless of level. Results are qualitatively invariant across all four operationalizations.
3.6. Estimation Strategy
All continuous-outcome models are estimated by ordinary least squares with standard errors clustered at the business level, the level at which the participation treatment varies; the headline specification is also reported with two-way clustering by business and reviewer [52]. Because reviews are nested in businesses, categories, locations, and years, the full specification includes indicator controls for the fifty most frequent category labels (businesses carry multiple labels, so these enter as non-exclusive indicators), state fixed effects, year fixed effects, and price-tier indicators including a missing-price bucket. We emphasize that the effective treatment-level variation resides in 99,155 businesses, not in 6.15 million independent observations, and phrase all claims accordingly.
Two reporting conventions apply throughout. First, tables report unstandardized coefficients (b) with clustered standard errors; where standardized effects are discussed, they are computed explicitly as and labeled as such. The focal participation coefficient of under the full fixed-effects specification corresponds to . Second, because rating extremity takes only three values (), extremity is analyzed with a multinomial logit and with separate binary logits for one-star and five-star outcomes, supplemented by a linear probability model with the full fixed-effects specification; OLS on the three-valued outcome appears only as a benchmark comparison.
The primary independent variable is the standardized BPI. The decomposition models add the independently coded positioning score, the quantity the structural-confound test requires. Every specification includes the log of review word count, controlling for mechanical length effects on feature density, and the log of the reviewer’s cumulative review count, controlling for experience. Given the sample size, statistical significance is uninformative as a filter; interpretation rests on effect magnitudes, explained variance, and the stability of coefficients across specifications.
4. Results
4.1. Descriptive Statistics
Table 3 reports summary statistics for the key variables. The mean star rating of 3.74 () reflects the well-documented positivity bias in online reviews [5], and the mean VADER compound sentiment score of 0.64 () mirrors this positive skew. Reviews are moderately long (mean words, ; interquartile range of 46–137 words). The hedonic and rational composite scores are centered near zero by construction, with standard deviations of about 0.40 and 0.38. The geometric co-occurrence index averages 0.037 (), and rating extremity averages 1.51 ().
Table 3.
Descriptive statistics for key variables ().
The correlation matrix provides an initial view of the structural confound; the full heatmap appears alongside the robustness checks in Section 4.4. The confound is now directly visible, not inferred: BPI and the independently coded positioning measure correlate at (review-weighted; across businesses), participation and experiential language at , and positioning and experiential language at , exactly the triangle the confound account predicts. The analytical score and the co-occurrence index are strongly correlated (), so variation in analytical density contributes disproportionately to the co-occurrence composite, a dependence that motivates the incremental-information test reported below. A modest positive correlation between participation and rating extremity () is examined pole by pole in Section 4.3. We no longer cite the correlation between the experiential composite and VADER sentiment as validation evidence, since VADER is, itself, a component of the composite, validation now rests on the independently coded review sample of Section 3.4. The experiential and analytical composites are right-skewed with heavy tails (skewness of 1.6 and 1.7, excess kurtosis of 41.0 and 10.7, and maxima of 34.5 and 11.5); Section 4.4 shows the focal results are unchanged under winsorization and rank-based transformation.
4.2. The Structural Confound Across the Language Outcomes
Table 4 reports the decomposition at the heart of the analysis. Column M1 gives the unconditional association: a one-standard-deviation increase in BPI corresponds to a decrease in the experiential score (standardized ). Column M2 validates the independent positioning measure in the expected direction: hedonically positioned businesses attract markedly more experiential language (, per SD of the positioning score). Column M3 enters both: the positioning coefficient remains large (, standardized ), and the participation coefficient falls to (), so positioning absorbs roughly thirty percent of the unconditional participation association while seventy percent survives with . Column M4 repeats the decomposition with the author-weighted variant and yields the same structure, so the conclusion does not depend on which instrument is used. The participation paradox (H1) is rejected in its positive form, and the structural-confound prediction is supported, now with the confounder measured independently rather than inferred.
Table 4.
Decomposing the participation–experiential association with the independently coded positioning measure. Dependent variable: experiential (hedonic) score; OLS with standard errors clustered by business.
The decomposition survives the full set of hierarchical controls. Table 5 adds indicator controls for the fifty most frequent category labels, state and year fixed effects, and price-tier indicators, with standard errors clustered by business and, in the headline row, two-way by business and reviewer. The BPI coefficient is (; standardized ) and is numerically indistinguishable under two-way clustering, so the association is not a between-sector, between-state, between-year, or between-price-tier artifact, and inference does not hinge on the clustering dimension. The author-weighted variant behaves consistently (, ). Because participation varies at the business level, the effective evidential base is the 99,155 business clusters, and we phrase all replication claims in those terms rather than in review counts.
Table 5.
Full fixed-effects specification. Dependent variable: experiential score; top-50 category indicators, state and year fixed effects, and price-tier indicators included; standard errors clustered by business (two-way row: business and reviewer).
Group contrasts are pronounced. High-participation businesses (BPI ) have a mean experiential score of , against for low-participation businesses, Cohen’s , corresponding to a small-to-medium and highly systematic contrast across 99,155 businesses and 1263 category labels (Figure 3).
Figure 3.
Mean experiential score (panel (a)), analytical score (panel (b)), and co-occurrence index (panel (c)) by BPI participation group. Markers are group means; 95% confidence intervals are smaller than the markers, given the sample size.
The analytical-language check behaves as the confound account predicts. Net of experiential content, the participation coefficient on the analytical score is negligible (, ; group ), while the experiential score, itself, dominates (, ). No meaningful residual association between participation and analytical language remains once the positioning-linked experiential variance is absorbed.
The co-occurrence index (RQ1) likewise tracks the confound mechanically: because high-participation businesses produce less experiential language and the index requires joint elevation, co-occurrence declines slightly with participation (, ; group ). Section 4.3 tests whether the index carries any information of its own and finds essentially none.
Summarizing the focal test, the participation paradox is rejected, and the structural confound is not merely asserted but measured. Conceptually distinct constructs need not be empirically independent, and in this platform population, they are not: participation and positioning correlate at ; positioning is the stronger single predictor of experiential language, and omitting it inflates the naive “participation effect” by roughly forty percent of the conditional estimate. Format-based comparisons that do not condition on positioning inherit a bias of exactly this kind. We return to the implications in the Discussion.
4.3. Rating Extremity: Pole Asymmetry (RQ2) and the Informational Content of Co-Occurrence (RQ1)
Because rating extremity takes only three values, we analyze it with models appropriate to a bounded categorical outcome (Table 6). The analysis reveals that the extremity association is a one-star phenomenon. A one-standard-deviation increase in BPI raises the odds of a one-star review by a factor of 1.13 (, controlling for positioning, review length, and reviewer experience) but leaves five-star odds essentially unchanged (OR ). The multinomial specification agrees (extreme-versus-midpoint per SD), as does a linear probability model for extreme ratings with the full fixed-effects battery and business-clustered errors (, ). The common practice of pooling one-star and five-star reviews into a single “extremity” outcome imposes a symmetry the data reject: participation-intensive formats face elevated downside-review risk with no offsetting upside concentration. The E-value for the one-star association is 1.52, so an unmeasured confounder would need associations of at least that magnitude with both participation and one-star reviewing to explain it away.
Table 6.
Rating extremity with outcome-appropriate models. All models include the positioning score, log word count, and log reviewer experience.
The co-occurrence index (RQ1) does not survive as an explanatory construct. Across all four operationalizations, the index is positively associated with extremity in benchmark OLS (Table 7), but the association is small once scaled: for the geometric index, with implies a standardized effect of just SD of extremity per SD of co-occurrence. The decisive test is incremental information: adding the co-occurrence index to a model that already contains its two components improves by , and the coefficient falls by two-thirds when a sentiment control enters. The index is an algebraic recombination of the experiential and analytical scores, not an independent construct. We therefore do not advance a co-occurrence mechanism: the informative structure in extremity is the pole asymmetry described above, not a conflict pathway.
Table 7.
Co-occurrence operationalizations: participation association (left) and benchmark extremity association (right), with the incremental information test.
4.4. Robustness and Sensitivity Analyses
The structural confound survives a battery of checks. Restricting the sample to businesses classified as predominantly hedonic or predominantly utilitarian by Yelp category () leaves every coefficient qualitatively unchanged (hedonic , rational , co-occurrence ; all ), which rules out the heterogeneous medium-participation group as the driver. As an external validation, automated VADER sentiment reproduces the same gap, with high-participation businesses scoring below low-participation ones (0.646 vs. 0.698, ), so the participation–hedonic relationship is not an artifact of our bespoke text-analysis pipeline (Figure 4).
Figure 4.
(a) Correlation matrix among BPI, the positioning measure, the two language composites, the co-occurrence index, and rating extremity. (b) VADER compound sentiment density for high- versus low-participation businesses.
Weighting-scheme sensitivity is examined in Table 8. All six index variants, including mean-aggregated categories, category-only, attribute-only, a variant excluding the most plausibly ambiguous amenity attributes, and the author-weighted variant, yield negative and significant participation coefficients under the decomposition specification. Two design facts limit weighting-based researcher degrees of freedom. First, no weight in the BPI is author-assigned, so there is no channel through which a preferred result could be selected. Second, the independent coding assigned exactly zero participation weight to each of the five amenity attributes whose co-production content is least clear (dogs allowed, Wi-Fi, television, coat check, and appointment-only), so excluding them changes the focal coefficient by less than . Leave-one-item-out analysis over all 39 attributes and the 20 highest-leverage categories bounds the coefficient within across 59 variants; no single item drives the result, and uniform equal weighting is inapplicable to coded weights, which are continuous and item-specific by construction.
Table 8.
Index weighting-scheme sensitivity. Dependent variable: experiential score; each row swaps the participation index in the decomposition specification (positioning, log word count, and log reviewer experience controlled); business-clustered standard errors.
Table 9 collects the remaining sensitivity analyses. The focal coefficient is stable across the three sub-periods (2010–2015, 2016–2019, and 2020–2022) and is strongest in the window closest to the attribute snapshot, consistent with attenuation from time-varying formats, not with a snapshot artifact. It is unchanged under winsorization of the outcome at the 1st and 99th percentiles and under a rank-based inverse-normal transformation, which addresses the heavy right tails documented above. It is stable when the minimum-reviews threshold is raised from 10 to 20 or 50, when a chain indicator (businesses whose name appears five or more times) is added, and when analysis is restricted to independent businesses. The same group gap appears in an off-the-shelf sentiment measure computed outside our pipeline (mean VADER compound of 0.547 for high- versus 0.680 for low-participation businesses, ), so the pattern is not an artifact of the bespoke composite.
Table 9.
Temporal, distributional, sampling, and sensitivity analyses for the focal participation coefficient (decomposition specification unless noted).
Given the very large sample size, effect-size interpretation takes precedence over significance testing, and Table 10 states each verdict in effect-size terms. The focal contrast is small to medium at the group level () and modest in standardized slope terms ( unconditional; net of positioning; within the full fixed-effects specification). We characterize magnitudes plainly as systematic, decomposable associations across 99,155 businesses, not large per-review effects, and the Abstract, Discussion, and Conclusion phrase them accordingly.
Table 10.
Summary of verdicts under the revised confirmatory–exploratory structure.
4.5. Balancing and Selection-on-Unobservables Analyses
The estimates above are associations in observational data, and we frame them as such throughout; this subsection quantifies their sensitivity to observed and unobserved confounding without claiming causal identification. Because participation varies across businesses rather than across reviews, the balancing design operates at the business level, where the treatment actually varies.
We define treatment as membership in the top versus bottom BPI tercile (69,379 businesses) and estimate propensity scores by logit on the independently coded positioning score, price tier, state, and business size (log review count). Inverse-probability-of-treatment weights target the average treatment effect on the treated. Balance and support diagnostics meet conventional standards: after weighting, the maximum absolute standardized mean difference across all covariates is 0.087 (threshold of 0.10), propensity distributions overlap across groups, and the effective control sample size is 11,984. The unweighted high–low difference in the business-mean experiential score of becomes an ATT of and with the positioning score retained as a direct control, so balancing on observables leaves the association essentially intact.
Sensitivity to unobserved confounding is reported with the exact inputs required for independent verification. For the Oster analysis, the short model is the unconditional specification (Table 4, M1; ), and the long model is the full fixed-effects specification (Table 5; ), with . Selection on unobservables would need to be times as strong as selection on the full observable set to drive the participation coefficient to zero, and the bias-adjusted coefficient at the conventional is , which is close to the estimated . For the one-star association, converting the logit odds ratio of 1.13 per SD to the risk-ratio scale yields an E-value of 1.52: an unmeasured confounder would need at least that association with both participation and one-star reviewing, above and beyond the measured covariates, to explain the estimate away. Oster diagnostics are reported only for the focal outcome, where the proportional-selection assumption holds; outcomes for which the procedure returns uninterpretable values are assessed through the balancing and categorical analyses instead.
5. Discussion
This research set out to test the participation paradox, the prediction that high-participation services generate jointly elevated experiential and analytical expression with polarizing consequences, and ended up measuring the structure that makes that prediction fail. Three results organize the discussion. First, the paradox is rejected: participation-intensive businesses attract less, not more experiential language. Second, the structural confound behind the reversal is no longer an inference but a measurement: an independently coded positioning score correlates with participation at , absorbs roughly thirty percent of the naive participation association, and leaves a seventy-percent remainder that survives every fixed-effects, balancing, and sensitivity analysis we could bring to bear. Third, the extremity story is an asymmetry, not a conflict pathway: participation predicts one-star risk and nothing at the five-star pole, while the co-occurrence index adds no information beyond its components and is not advanced as a construct.
5.1. Theoretical Contributions
The primary contribution is to measurement and inference in electronic-commerce research. We show that in a real platform population, service participation intensity and hedonic–utilitarian positioning are not orthogonal. High-participation formats cluster in utilitarian contexts while hedonic services adopt low-participation formats. This entanglement matters for review analytics. A growing body of work reads sentiment and aspect emphasis directly from review text and compares them across consumption contexts, for example, across traveler trip modes and purposes [53]. Our results add a supply-side caution. When businesses are instead sorted by operating format, the bundling of participation with positioning means that differences attributed to “participation” may, in fact, be positioning effects. The pattern plausibly reflects market forces, with utilitarian services facing cost pressures that favor self-service and co-production while hedonic services compete on experiential quality and have less incentive to shift effort to the consumer.
At a deeper level, the finding also bears on service classification research. The influential typologies of Lovelock [54] and Bowen [55] implicitly assume independent classification along participation, tangibility, and customization. If two of these dimensions are endogenously correlated, empirical work that includes one without controlling for the other is vulnerable to omitted-variable bias, and studies attributing customer outcomes to “participation effects” may, in fact, be capturing positioning effects. More broadly, conceptually distinct dimensions can be empirically non-independent because the distribution of real services is shaped by economic incentives, technological constraints, and consumer expectations; distinguishing conceptual orthogonality from empirical non-independence is essential for valid inference in observational service research.
The second contribution is a validated instrument pair for the expression stage: the 35-indicator framework measures affective–experiential and analytical–informational language in review text, with reliability and criterion evidence backing that interpretation. What makes the expression stage theoretically distinctive is that it involves the reconstruction of consumption experience for communicative purposes [56]. Unlike the decision stage, which operates on prospective evaluations, the expression stage operates on retrospective accounts that must be organized, prioritized, and articulated, demands that recruit both processing systems simultaneously. The extension connects to the metacognitive model of attitude construction proposed by Schwarz [57], in which judgments are constructed in situ rather than retrieved, and the review-writing context offers a detailed textual trace of those construction processes.
The third contribution is an asymmetry account of review extremity disciplined by an incremental-information test. The ambivalence literature predicts that conflicting evaluative inputs polarize judgments [33,41]; the co-occurrence index, however, adds essentially nothing beyond its two components (), so no conflict mechanism is advanced. What the extremity data do show is a pole asymmetry: participation-intensive formats face elevated one-star risk (OR , E-value of ) with no mirror-image five-star lift. This asymmetry connects the co-production literature’s attribution findings, in which participating customers blame firms more sharply for failures [16,17], to the rating-distribution literature’s selection accounts [5,6]: participation appears to matter for reviews mainly when things go wrong. Testing the attribution channel experimentally is the natural next step.
5.2. Practical Implications
The structural confound carries direct implications for practitioners. Platform designers who introduce participation-related features should expect the cognitive profile of reviews to shift, not because participation changes how people think but because the businesses that adopt high-participation formats are systematically different. Comparing reviews across services with different participation levels without accounting for positioning will yield misleading conclusions—a caution for the data-driven dashboards and analytics that increasingly inform platform and merchant decisions.
Service managers can act directly on the extremity asymmetry. High-participation formats do not face generically “more polarized” reviews; they face asymmetric downside risk, an elevated probability of one-star evaluations with no offsetting concentration of five-star praise. Because the design is observational, we frame the managerial reading as risk exposure rather than causal levers: businesses adopting self-service and co-production formats should treat review management as failure management, investing in expectation-setting before the encounter and service recovery after it, where the co-production literature locates the sharpest attributional penalties [16,17]. For platforms, the asymmetry implies that aggregate scores pool structurally different tail risks across formats, so transparency about rating composition and supplementary signals such as multi-dimensional ratings remain consumer-welfare levers; any intervention on review prompts should be validated experimentally before deployment.
5.3. Limitations and Future Directions
Several limitations warrant discussion. The Business Participation Index is grounded in service co-production theory but built from a single platform (Yelp). Future research could validate it against survey-based participation measures or extend it to platforms with different metadata structures. Four measurement limitations deserve explicit statement. First, business attributes are a 2022 snapshot applied to reviews spanning twelve years; formats that changed over time are measured with error, which plausibly attenuates the estimates, and the coefficient’s stability across sub-periods—strongest closest to the snapshot—is consistent with that reading but cannot rule out residual misclassification. Second, the coding program that generates all index weights uses large-language-model raters. Reliability is high, cross-family agreement matches within-family agreement, contested items pass to blind human adjudication, and the full audit trail is public, but LLM raters may share blind spots that two humans would not, so we characterize the weights as independently coded rather than human-expert-coded; the human anchor’s near-parity agreement on the category instruments (Section 3.4) mitigates this concern for the index weights, though less completely for whole-text review rating. Third, the analytical-language composite is a formative index whose components are nearly uncorrelated; its criterion validity is concentrated in the numeric and causal components, and results involving it should be read at the component level, where precision matters. Fourth, the text measures capture surface language, not cognition: we interpret them as affective–experiential and analytical–informational content, and any dual-process reading remains a motivating framework rather than a demonstrated mechanism. The causal interpretation of our findings is also constrained by the observational design, since we cannot determine whether participation causally influences positioning, the reverse, or whether both are driven by unobserved third variables such as industry norms, regulatory constraints, or market forces. Experimental designs that manipulate participation intensity within a fixed positioning context would provide stronger causal evidence.
Temporal generalization is a boundary condition rather than an internal-validity threat. The dataset ends in 2022, and the review ecosystem has since changed, with AI-generated content, evolving moderation and recommendation regimes, and increasingly technology-mediated commerce formats; recent eWOM work documents that word-of-mouth effects shift across market stages and over time [58], and studies of virtual-agent commerce illustrate how far the post-2022 environment has moved [59]. Year fixed effects and the three-period stability analysis show the focal association is not specific to any historical window within 2010–2022, and the Yelp Open Dataset has no post-2022 release with which to extend the panel; whether the participation–positioning entanglement persists in the current environment is an empirical question we flag for replication. The data are also drawn from a single cultural context (predominantly North American English-language reviews), so the participation–positioning confound may take a different form in other markets, and cross-cultural replication would strengthen generalizability.
6. Conclusions
This research revisits the participation paradox and arrives at a more fundamental finding: in a population of 99,155 businesses, service participation intensity and hedonic–utilitarian positioning, measured independently of each other and of review text, are empirically entangled (). Conceptual orthogonality does not imply empirical independence, and in these data, it fails by enough to matter: omitting positioning inflates the naive participation association by roughly forty percent of the conditional estimate. High-participation services attract systematically less experiential review language, not more, and the association survives independent instrument reconstruction, the full fixed-effects specification, balancing on business-level covariates, and selection-on-unobservables bounds.
The analysis also subtracts. Joint elevation of experiential and analytical language, a natural candidate mechanism under ambivalence theory, adds no information beyond its own components under any of four operationalizations and is therefore not advanced as a construct; what the extremity data support instead is a pole asymmetry in which participation-intensive formats carry elevated one-star risk with no five-star counterpart. Reporting the null in full is part of the contribution: the same measurement program that rules the construct out is the one that validates the instruments the field can now reuse.
Beyond the specific results, the study leaves two durable, fully documented instruments and one methodological imperative. The BPI and the validated text framework, along with their codebooks, weights, reliability evidence, and construction code in the public repository, make business participation and the language content of reviews measurable from data that platforms already hold. The confound they expose makes one requirement non-negotiable for review analytics: any comparison of businesses by operating format must first condition on positioning. As online reviews grow ever more central to digital commerce, treating a platform’s business population as an endogenously organized system rather than a random draw should repay sustained scholarly and managerial attention.
Author Contributions
Conceptualization, C.X. and D.L.E.S.; methodology, C.X.; software, C.X.; formal analysis, C.X.; data curation, C.X.; writing—original draft preparation, C.X.; writing—review and editing, D.L.E.S.; visualization, C.X.; supervision, D.L.E.S.; project administration, D.L.E.S. All authors have read and agreed to the published version of the manuscript.
Funding
This research received no external funding.
Institutional Review Board Statement
Not applicable. The study analyzes a publicly available, de-identified secondary dataset and did not involve human or animal subjects.
Informed Consent Statement
Not applicable.
Data Availability Statement
The Yelp Open Dataset analyzed in this study is publicly available at https://www.yelp.com/dataset (accessed on 8 January 2025); its terms of use prohibit redistribution of review-level content. All other study materials are openly deposited in the study repository: the complete BPI codebooks and all 1302 item weights; the coding prompts and raw rater outputs; the reliability and validity analysis code; the full NLP lexicons and extraction rules; construction code for every composite variable; code for every regression, weighting, and sensitivity analysis; random seeds; software versions; and a deterministic rebuild script that reproduces the analysis data from the public Yelp download. All listed materials are permanently deposited at https://doi.org/10.5281/zenodo.21760011.
Acknowledgments
Large language models were used as measurement instruments in this study: two LLM raters from different model families (Anthropic Claude Sonnet; xAI Grok 4.5; July 2026 versions, with a Claude Opus within-family check) served as independent text-annotation coders under written, hypothesis-blind codebooks, with reliability, human-anchor validation, and blind human adjudication reported in Section 3.4. The authors reviewed, verified, and edited all model outputs and take full responsibility for the content of this publication. Generative AI is not listed as an author.
Conflicts of Interest
The authors declare no conflicts of interest.
References
- Luca, M.; Zervas, G. Fake it till you make it: Reputation, competition, and yelp review fraud. Manag. Sci. 2016, 62, 3412–3427. [Google Scholar] [CrossRef] [Scilit]
- Tan, Y.; Zhang, Y.; Geng, Y.; Liu, S.; Tang, H. How Negative Online Reviews Shape Consumer Conformity: Psychological Mechanisms in Interactive Digital Marketing. J. Theor. Appl. Electron. Commer. Res. 2026, 21, 163. [Google Scholar] [CrossRef] [Scilit]
- Chevalier, J.A.; Dover, Y.; Mayzlin, D. Channels of impact: User reviews when quality is dynamic and managers respond. Mark. Sci. 2018, 37, 688–709. [Google Scholar] [CrossRef] [Scilit]
- Mudambi, S.M.; Schuff, D. What makes a helpful online review? A study of customer reviews on amazon.com. MIS Q. 2010, 34, 185–200. [Google Scholar] [CrossRef] [Scilit]
- Hu, N.; Zhang, J.; Pavlou, P.A. Overcoming the j-shaped distribution of product reviews. Commun. ACM 2009, 52, 144–147. [Google Scholar] [CrossRef] [Scilit]
- Schoenmueller, V.; Netzer, O.; Stahl, F. The polarity of online reviews: Prevalence, drivers and implications. J. Mark. Res. 2020, 57, 853–877. [Google Scholar] [CrossRef] [Scilit]
- Timoshenko, A.; Hauser, J.R. Identifying customer needs from user-generated content. Mark. Sci. 2019, 38, 1–20. [Google Scholar] [CrossRef] [Scilit]
- Kim, S.; Lee, S.; McCulloch, R. A topic-based segmentation model for identifying segment-level drivers of star ratings from unstructured text reviews. J. Mark. Res. 2024, 61, 1132–1151. [Google Scholar] [CrossRef] [Scilit]
- Holbrook, M.B.; Hirschman, E.C. The experiential aspects of consumption: Consumer fantasies, feelings, and fun. J. Consum. Res. 1982, 9, 132. [Google Scholar] [CrossRef] [Scilit]
- Kahneman, D. A perspective on judgment and choice: Mapping bounded rationality. Am. Psychol. 2003, 58, 697–720. [Google Scholar] [CrossRef] [Scilit]
- Evans, J.S.B.T. Dual-processing accounts of reasoning, judgment, and social cognition. Annu. Rev. Psychol. 2008, 59, 255–278. [Google Scholar] [CrossRef] [Scilit]
- Sun, M. How does the variance of product ratings matter? Manag. Sci. 2012, 58, 696–707. [Google Scholar] [CrossRef] [Scilit]
- Vargo, S.L.; Lusch, R.F. Evolving to a new dominant logic for marketing. J. Mark. 2004, 68, 1–17. [Google Scholar] [CrossRef] [Scilit]
- Vargo, S.L.; Lusch, R.F. Service-dominant logic: Continuing the evolution. J. Acad. Mark. Sci. 2008, 36, 1–10. [Google Scholar] [CrossRef] [Scilit]
- Grönroos, C.; Voima, P. Critical service logic: Making sense of value creation and co-creation. J. Acad. Mark. Sci. 2013, 41, 133–150. [Google Scholar] [CrossRef] [Scilit]
- Bendapudi, N.; Leone, R.P. Psychological implications of customer participation in co-production. J. Mark. 2003, 67, 14–28. [Google Scholar] [CrossRef] [Scilit]
- Heidenreich, S.; Wittkowski, K.; Handrich, M.; Falk, T. The dark side of customer co-creation: Exploring the consequences of failed co-created services. J. Acad. Mark. Sci. 2015, 43, 279–296. [Google Scholar] [CrossRef] [Scilit]
- Yen, C.H.; Teng, H.Y.; Tzeng, J.C. Innovativeness and customer value co-creation behaviors: Mediating role of customer engagement. Int. J. Hosp. Manag. 2020, 88, 102514. [Google Scholar] [CrossRef] [Scilit]
- Sashi, C. Digital communication, value co-creation and customer engagement in business networks: A conceptual matrix and propositions. Eur. J. Mark. 2021, 55, 1643–1663. [Google Scholar] [CrossRef] [Scilit]
- Bacile, T.J. Digital customer service and customer-to-customer interactions: Investigating the effect of online incivility on customer perceived service climate. J. Serv. Manag. 2020, 31, 441–464. [Google Scholar] [CrossRef] [Scilit]
- Bellos, I.; Kavadias, S. Service design for a holistic customer experience: A process framework. Manag. Sci. 2021, 67, 1718–1736. [Google Scholar] [CrossRef] [Scilit]
- Barrett, J.A.M.; Jaakkola, E.; Heller, J.; Brüggen, E.C. Customer engagement in utilitarian vs. hedonic service contexts. J. Serv. Res. 2025, 28, 614–633. [Google Scholar] [CrossRef] [Scilit]
- Wang, B.; Zhao, Q.; Zhang, Z.; Xu, P.; Tian, X.; Jin, P. Understanding the Heterogeneity and Dynamics of Factors Influencing Tourist Sentiment with Online Reviews. J. Theor. Appl. Electron. Commer. Res. 2025, 20, 22. [Google Scholar] [CrossRef] [Scilit]
- de Kerviler, G.; Demangeot, C.; Dolbec, P.Y. Why and how consumers perform online reviewing differently. J. Consum. Res. 2025, 51, 1209–1228. [Google Scholar] [CrossRef] [Scilit]
- Stanovich, K.E.; West, R.F. Individual differences in reasoning: Implications for the rationality debate? Behav. Brain Sci. 2000, 23, 645–665. [Google Scholar] [CrossRef] [Scilit]
- Chaiken, S. Heuristic versus systematic information processing and the use of source versus message cues in persuasion. J. Personal. Soc. Psychol. 1980, 39, 752. [Google Scholar] [CrossRef] [Scilit]
- Petty, R.E.; Cacioppo, J.T.; Schumann, D. Central and peripheral routes to advertising effectiveness: The moderating role of involvement. J. Consum. Res. 1983, 10, 135. [Google Scholar] [CrossRef] [Scilit]
- Voss, K.E.; Spangenberg, E.R.; Grohmann, B. Measuring the hedonic and utilitarian dimensions of consumer attitude. J. Mark. Res. 2003, 40, 310–320. [Google Scholar] [CrossRef] [Scilit]
- Sun, X.; Han, M.; Feng, J. Helpfulness of online reviews: Examining review informativeness and classification thresholds by search products and experience products. Decis. Support Syst. 2019, 124, 113099. [Google Scholar] [CrossRef] [Scilit]
- Huang, L.; Shang, Q.; Wang, R.; Wang, H.; He, L. Heuristic and systematic information processing in online hotel booking. J. Hosp. Tour. Manag. 2025, 63, 77–89. [Google Scholar] [CrossRef] [Scilit]
- Hung, H.Y.; Hu, Y.; Lee, N.; Tsai, H.T. Exploring online consumer review-management response dynamics: A heuristic-systematic perspective. Decis. Support Syst. 2024, 177, 114087. [Google Scholar] [CrossRef] [Scilit]
- Lee, S.J.; de Villiers, R. Unveiling emotional intensity in online reviews: Adopting advanced machine learning techniques. Australas. Mark. J. 2025, 33, 75–86. [Google Scholar] [CrossRef] [Scilit]
- Priester, J.R.; Petty, R.E. The gradual threshold model of ambivalence: Relating the positive and negative bases of attitudes to subjective ambivalence. J. Personal. Soc. Psychol. 1996, 71, 431–449. [Google Scholar] [CrossRef] [Scilit]
- Cacioppo, J.T.; Gardner, W.L.; Berntson, G.G. Beyond bipolar conceptualizations and measures: The case of attitudes and evaluative space. Personal. Soc. Psychol. Rev. 1997, 1, 3–25. [Google Scholar] [CrossRef] [Scilit]
- Antonetti, P.; Valor Martínez, C.; Baghi, I.; González-Gómez, H.V. Consumer emotional ambivalence: A state-of-the-art review. J. Mark. Manag. 2026, 42, 355–383. [Google Scholar] [CrossRef] [Scilit]
- Prestini, S.; Sebastiani, R. Embracing consumer ambivalence in the luxury shopping experience. J. Consum. Behav. 2021, 20, 1243–1268. [Google Scholar] [CrossRef] [Scilit]
- Chatterjee, S.; Chaudhuri, R.; Kumar, A.; Lu Wang, C.; Gupta, S. Impacts of consumer cognitive process to ascertain online fake review: A cognitive dissonance theory approach. J. Bus. Res. 2023, 154, 113370. [Google Scholar] [CrossRef] [Scilit]
- Hu, N.; Pavlou, P.A.; Zhang, J. On self-selection biases in online product reviews1. MIS Q. 2017, 41, 449–471. [Google Scholar] [CrossRef] [Scilit]
- Karaman, H. Online review solicitations reduce extremity bias in online review distributions and increase their representativeness. Manag. Sci. 2021, 67, 4420–4445. [Google Scholar] [CrossRef] [Scilit]
- Mayzlin, D.; Dover, Y.; Chevalier, J. Promotional reviews: An empirical investigation of online review manipulation. Am. Econ. Rev. 2014, 104, 2421–2455. [Google Scholar] [CrossRef] [Scilit]
- van Harreveld, F.; van der Pligt, J.; de Liver, Y.N. The agony of ambivalence and ways to resolve it: Introducing the MAID model. Personal. Soc. Psychol. Rev. 2009, 13, 45–61. [Google Scholar] [CrossRef] [Scilit]
- Nordgren, L.F.; van Harreveld, F.; van der Pligt, J. Ambivalence, discomfort, and motivated information processing. J. Exp. Soc. Psychol. 2006, 42, 252–258. [Google Scholar] [CrossRef] [Scilit]
- Luca, M. Reviews, Reputation, and Revenue: The Case of Yelp.com; NOM Unit Working Paper 12-016; Harvard Business School: Boston, MA, USA, 2016. [Google Scholar]
- Hong, H.; Xu, D.; Wang, G.A.; Fan, W. Understanding the determinants of online review helpfulness: A meta-analytic investigation. Decis. Support Syst. 2017, 102, 1–11. [Google Scholar] [CrossRef] [Scilit]
- Meuter, M.L.; Bitner, M.J.; Ostrom, A.L.; Brown, S.W. Choosing among alternative service delivery modes: An investigation of customer trial of self-service technologies. J. Mark. 2005, 69, 61–83. [Google Scholar] [CrossRef] [Scilit]
- Humphreys, A.; Wang, R.J.H. Automated text analysis for consumer research. J. Consum. Res. 2018, 44, 1274–1306. [Google Scholar] [CrossRef] [Scilit]
- Pennebaker, J.W.; Boyd, R.L.; Jordan, K.; Blackburn, K. The Development and Psychometric Properties of LIWC2015; Technical Report; University of Texas at Austin: Austin, TX, USA, 2015. [Google Scholar]
- Carlson, N.A.; Burbano, V.C. The use of LLMs to annotate data in management research: Foundational guidelines and warnings. Strateg. Manag. J. 2026, 47, 699–725. [Google Scholar] [CrossRef] [Scilit]
- Gilardi, F.; Alizadeh, M.; Kubli, M. ChatGPT outperforms crowd workers for text-annotation tasks. Proc. Natl. Acad. Sci. USA 2023, 120, e2305016120. [Google Scholar] [CrossRef] [Scilit]
- Rathje, S.; Mirea, D.M.; Sucholutsky, I.; Marjieh, R.; Robertson, C.E.; Van Bavel, J.J. GPT is an effective tool for multilingual psychological text analysis. Proc. Natl. Acad. Sci. USA 2024, 121, e2308950121. [Google Scholar] [CrossRef] [Scilit]
- Li, P.; Castelo, N.; Katona, Z.; Sarvary, M. Frontiers: Determining the validity of large language models for automated perceptual analysis. Mark. Sci. 2024, 43, 254–266. [Google Scholar] [CrossRef] [Scilit]
- White, H. A heteroskedasticity-consistent covariance matrix estimator and a direct test for heteroskedasticity. Econometrica 1980, 48, 817–838. [Google Scholar] [CrossRef] [Scilit]
- Mokryn, O. Consumer Sentiment and Hotel Aspect Preferences Across Trip Modes and Purposes. J. Theor. Appl. Electron. Commer. Res. 2024, 19, 3017–3034. [Google Scholar] [CrossRef] [Scilit]
- Lovelock, C.H. Classifying services to gain strategic marketing insights. J. Mark. 1983, 47, 9–20. [Google Scholar] [CrossRef] [Scilit]
- Bowen, J. Development of a taxonomy of services to gain strategic marketing insights. J. Acad. Mark. Sci. 1990, 18, 43–49. [Google Scholar] [CrossRef] [Scilit]
- Wilson, T.D.; Schooler, J.W. Thinking too much: Introspection can reduce the quality of preferences and decisions. J. Personal. Soc. Psychol. 1991, 60, 181–192. [Google Scholar] [CrossRef] [Scilit]
- Schwarz, N. Metacognitive experiences in consumer judgment and decision making. J. Consum. Psychol. 2004, 14, 332–348. [Google Scholar] [CrossRef] [Scilit]
- Wang, Q.; Fan, X.; Zhang, W. The dynamic impact of electronic word-of-mouth (eWOM) in the movie market lifecycle: The moderating role of key creators’ activity on movie attendance. J. Retail. Consum. Serv. 2026, 88, 104473. [Google Scholar] [CrossRef] [Scilit]
- Wang, Q.; Wang, Y.; Zhang, W. Effects of realism design in virtual streamers for live commerce: The influence of form, behavior, and voice on consumers’ recommendation and purchase intentions. J. Retail. Consum. Serv. 2026, 93, 104909. [Google Scholar] [CrossRef] [Scilit]
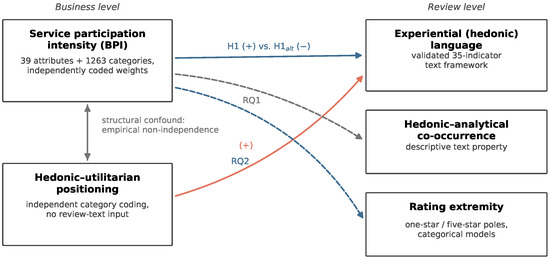
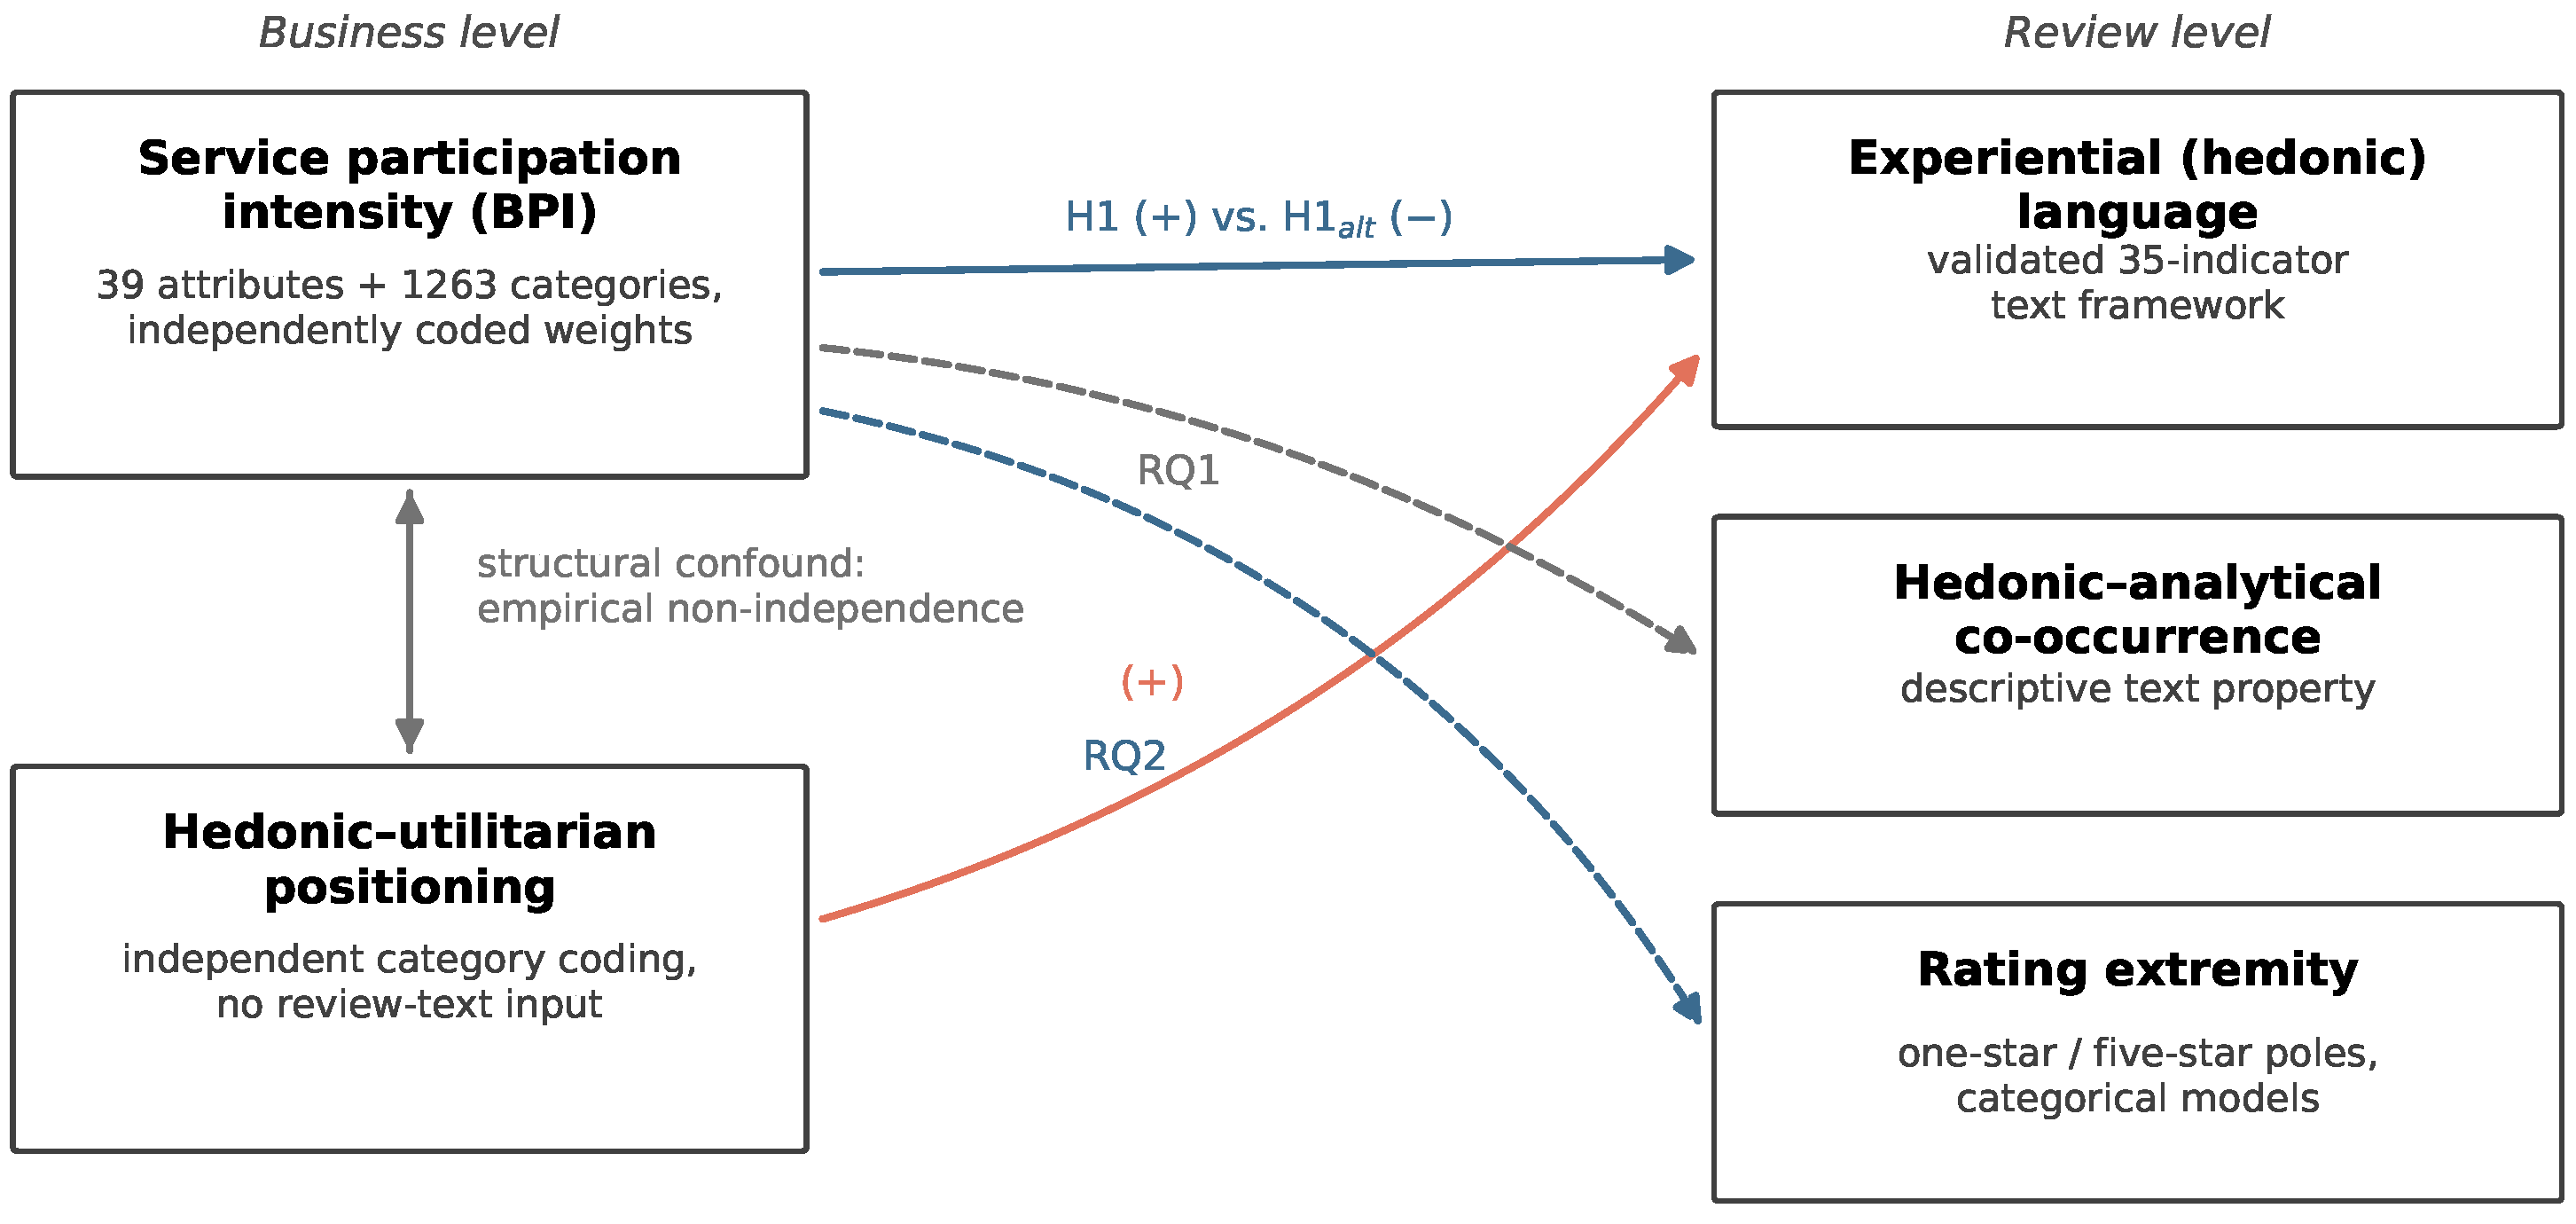
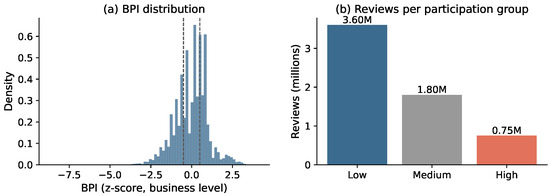
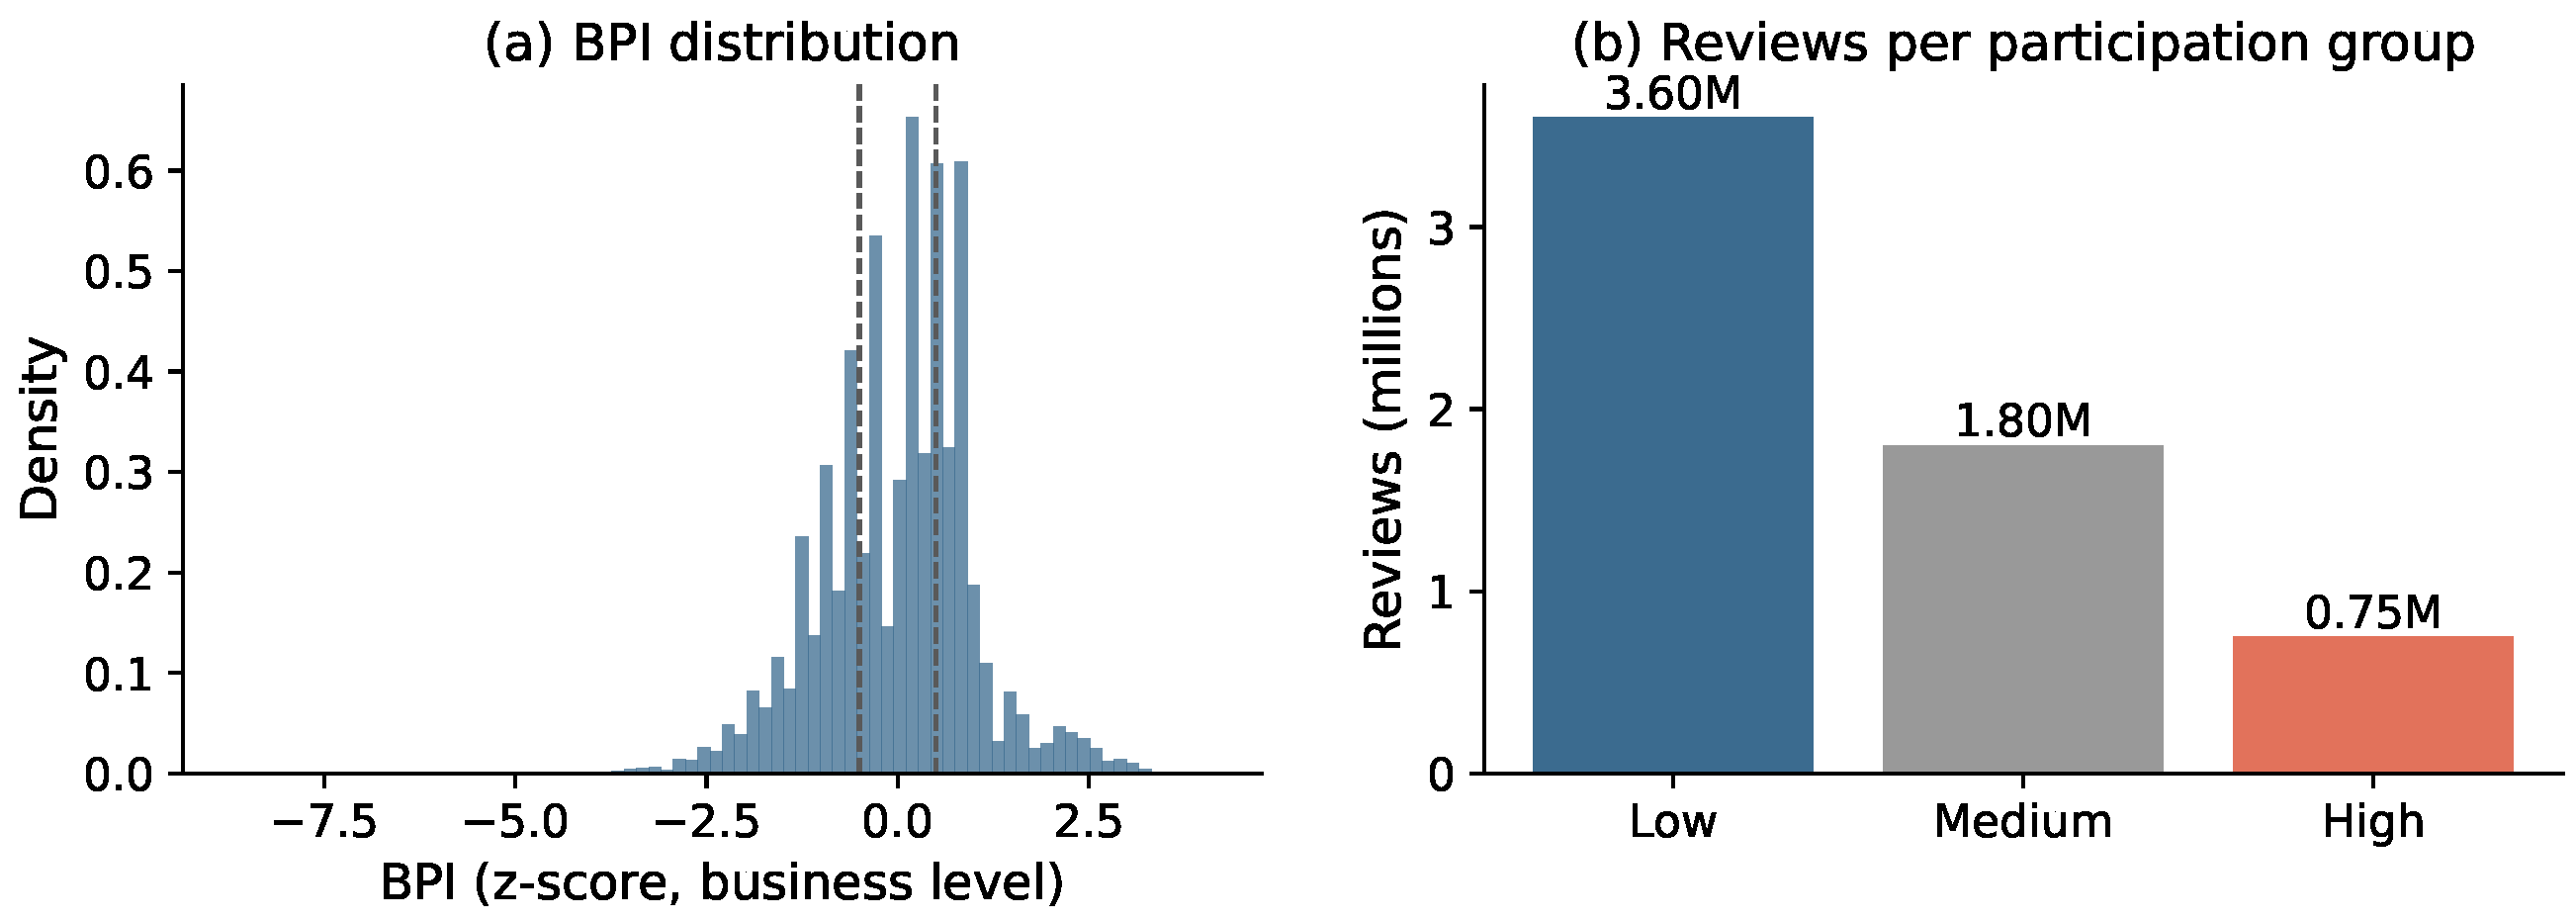
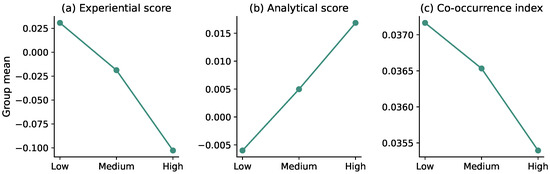
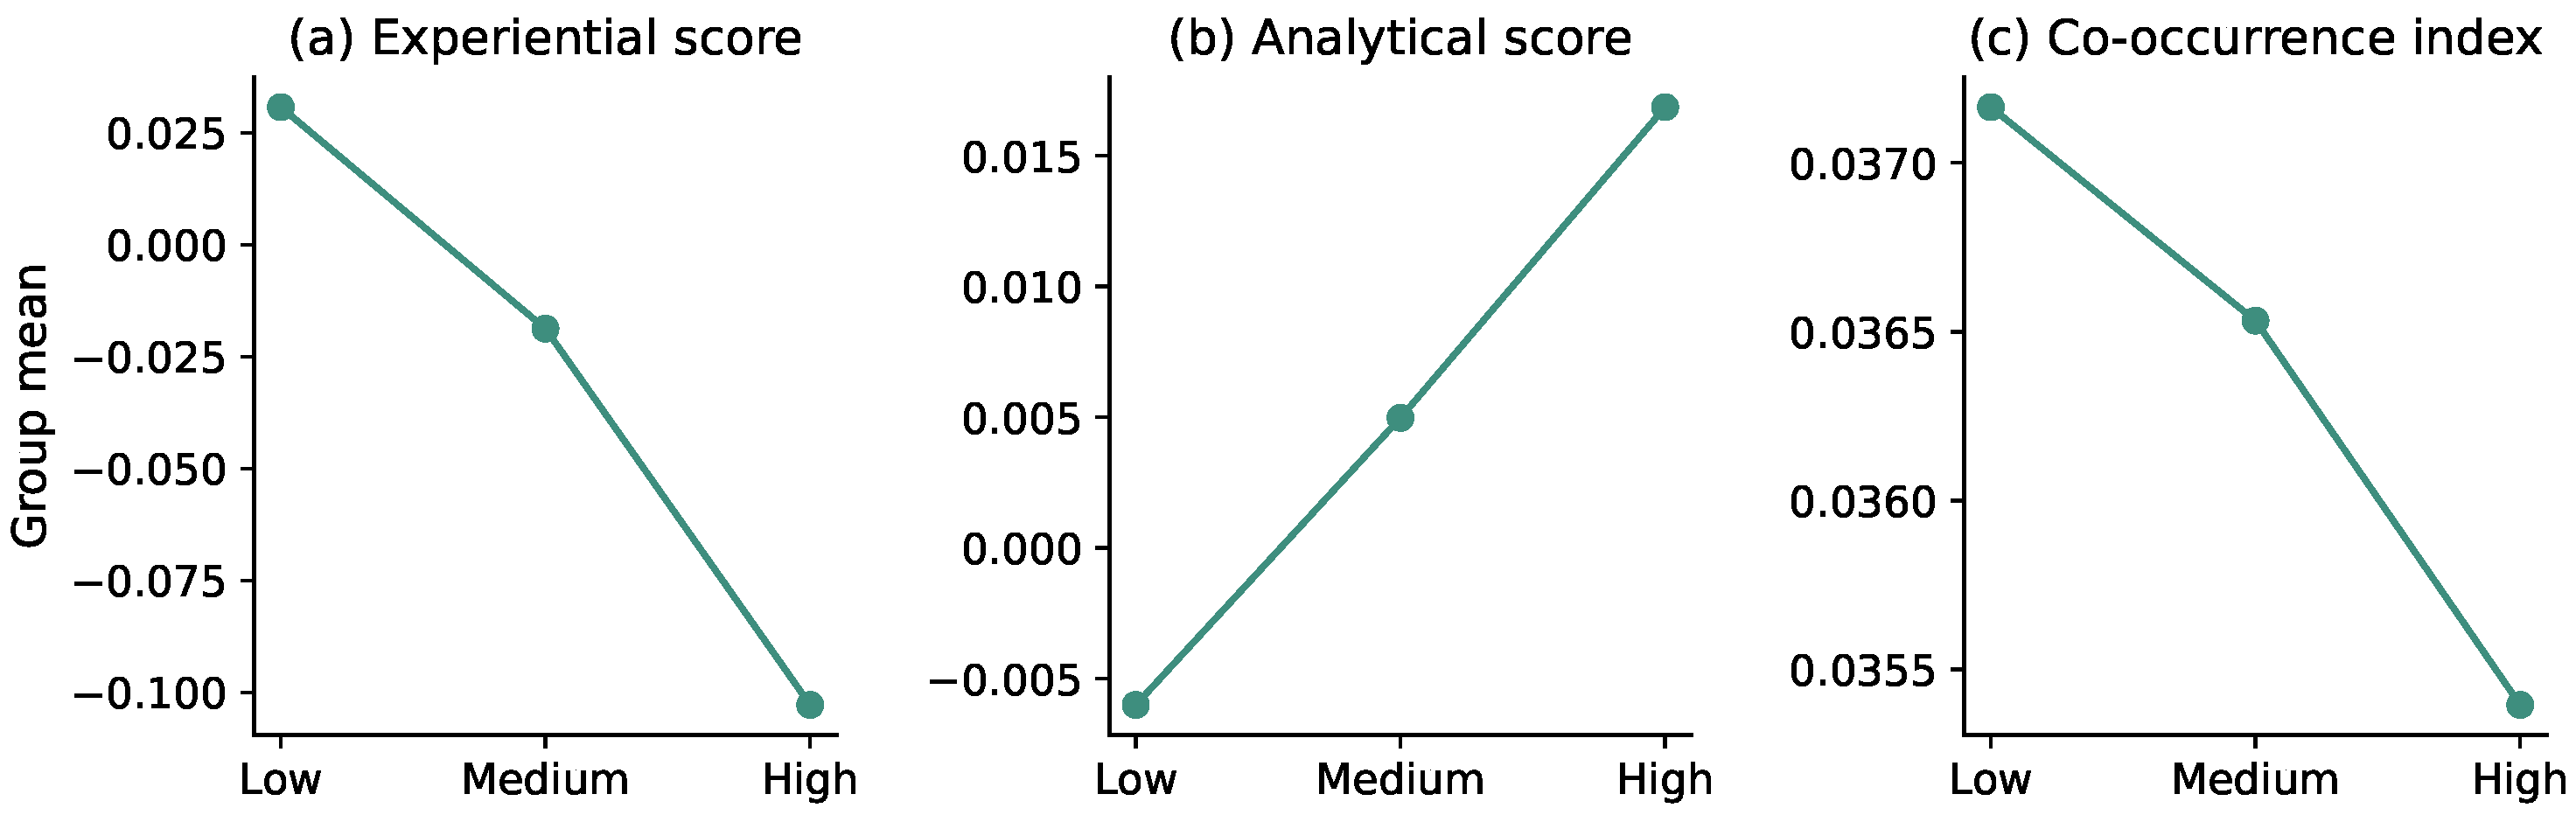
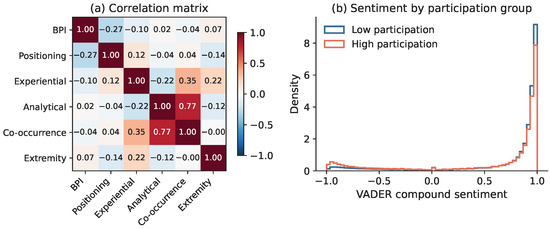
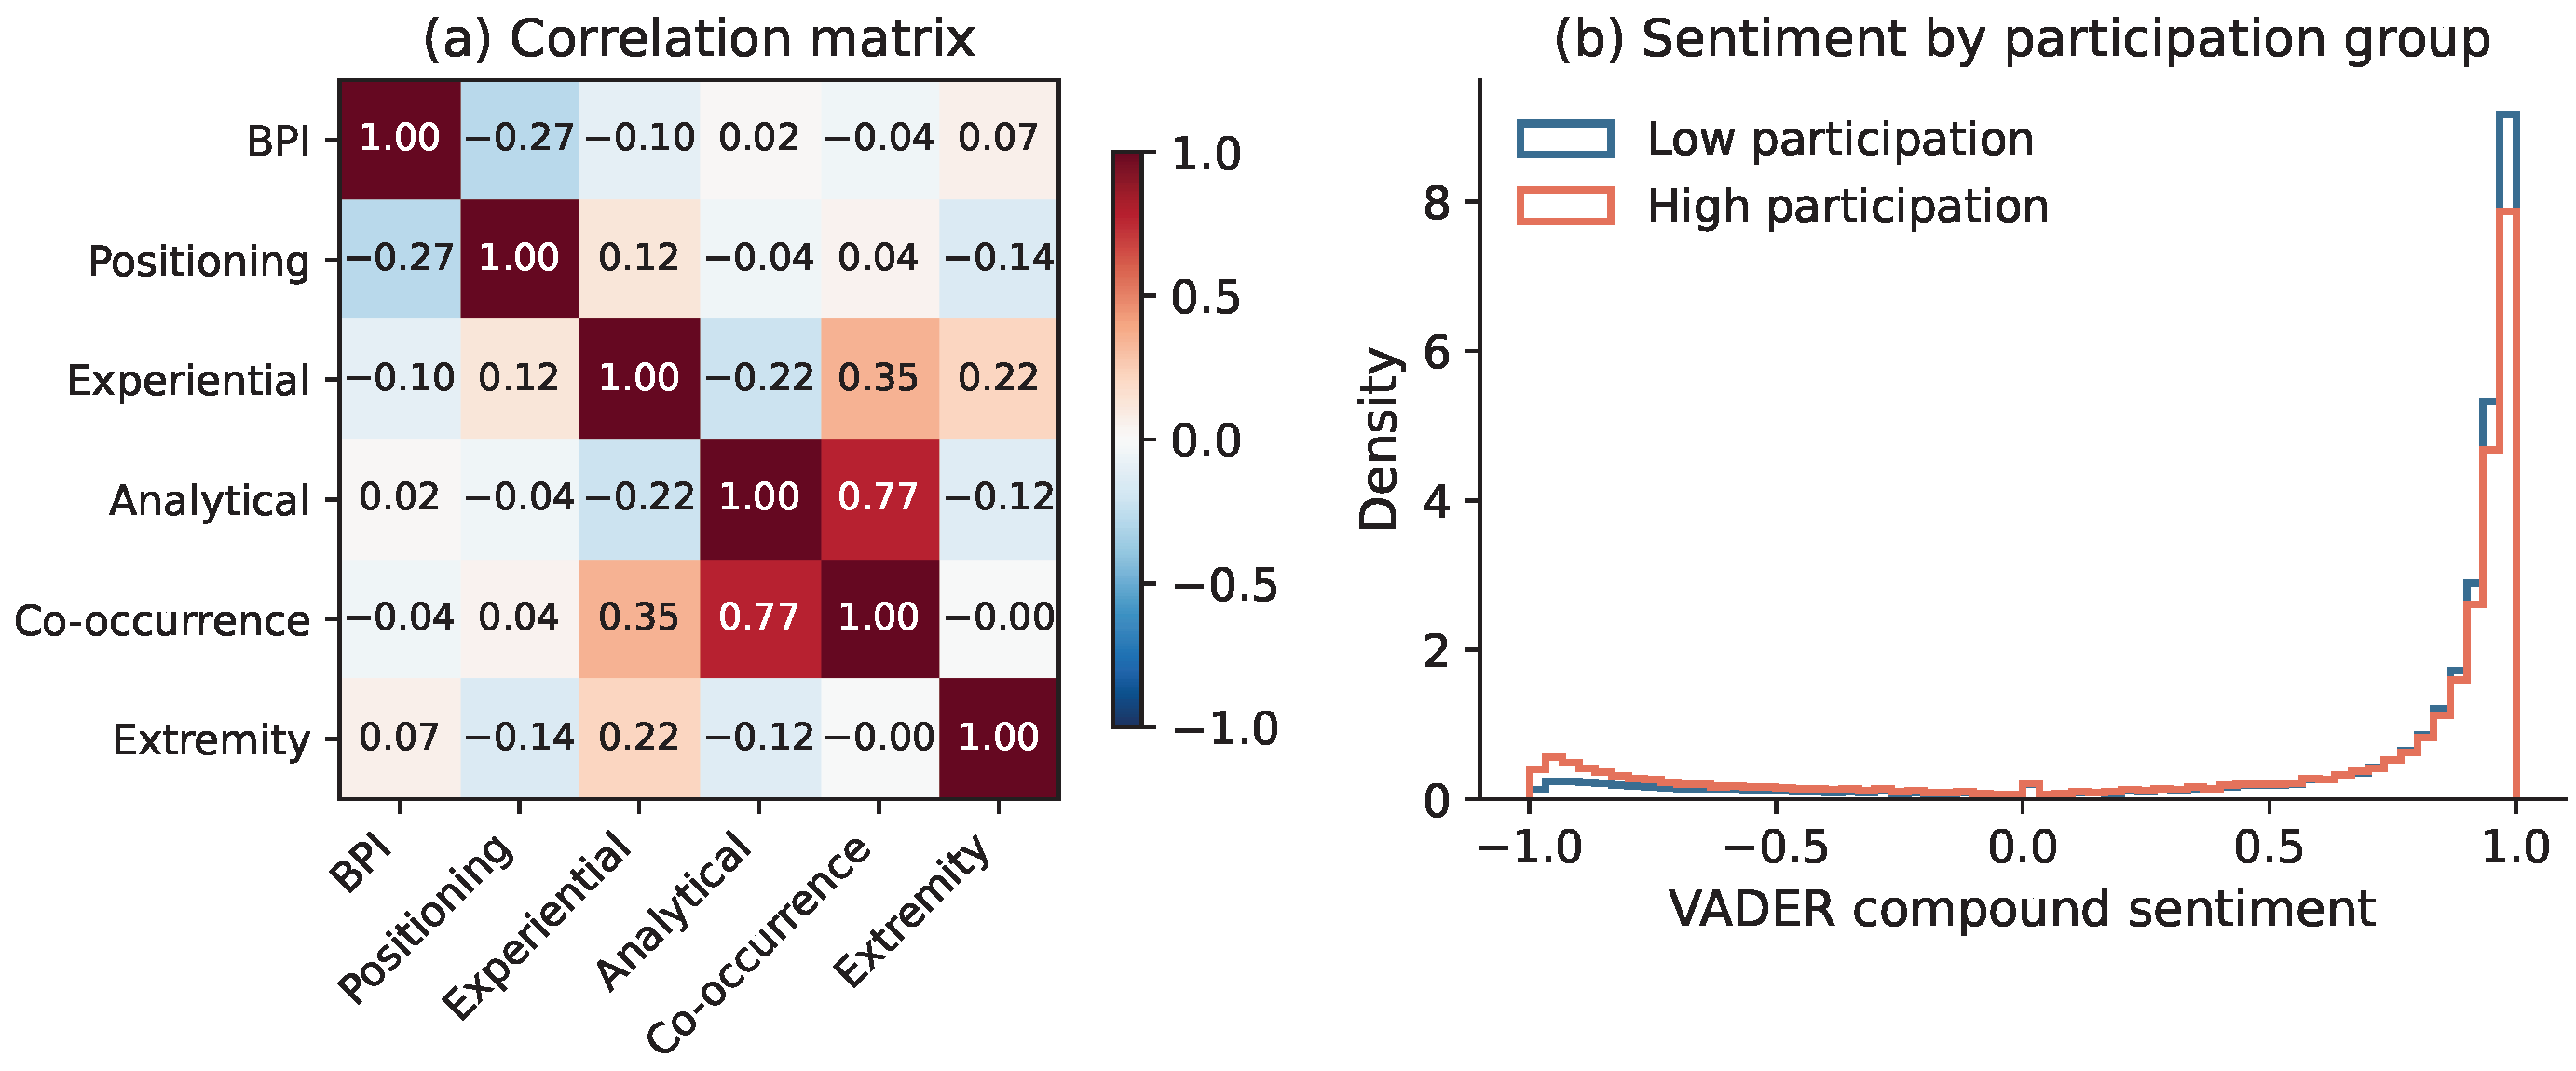

Disclaimer/Publisher’s Note: The statements, opinions and data contained in all publications are solely those of the individual author(s) and contributor(s) and not of MDPI and/or the editor(s). MDPI and/or the editor(s) disclaim responsibility for any injury to people or property resulting from any ideas, methods, instructions or products referred to in the content. |
© 2026 by the authors. Licensee MDPI, Basel, Switzerland. This article is an open access article distributed under the terms and conditions of the Creative Commons Attribution (CC BY) license.