


Abstract
This study examines digital readiness and e-commerce participation across the EU-27 during 2020–2025, combining common-sample two-way fixed-effects models for 2020–2024, one-year-lagged specifications, first-difference and post-break sensitivity analyses, and convergence tests. Household internet access shows the most stable contemporaneous within-country association: in the preferred specification, a one-percentage-point increase in the national access rate is associated with approximately 0.82 percentage points higher online-purchasing participation. The result remains significant under country-specific trends, restricted wild-cluster bootstrap inference, fractional-response models, and first differences, but not in the one-year-lagged models. ICT-specialist employment, treated as an exploratory indicator of national digital-ecosystem capacity, is not statistically significant, including in the post-2021 sensitivity sample; the GDP relationship is also not robust. Sigma-convergence evidence is stronger: in a balanced 26-country sample, the cross-country standard deviation falls from 15.39 percentage points in 2020 to 11.64 in 2025, and the coefficient of variation falls from 0.244 to 0.159, with country-trajectory bootstrap intervals for both the change and the trend remaining below zero. The conventional beta-convergence estimate is negative and significant (β = −0.0998, p < 0.001) but becomes insignificant in ceiling-sensitive logit and headroom-adjusted specifications. The findings therefore support a robust contemporaneous association between basic digital access and e-commerce participation and statistically validated short-run sigma convergence, while beta catch-up remains specification-sensitive.
1. Introduction
The diffusion of electronic commerce has become an increasingly important component of European digitalization, but its recent trajectory cannot be reduced to a single pandemic effect. Online purchasing rose sharply during the COVID-19 shock, yet evidence on persistence is mixed. Cross-country transaction data indicate that much of the pandemic surge subsequently returned toward pre-existing trends, while consumer-level and national studies also identify persistent changes for particular groups and markets [1,2,3,4]. The 2020–2025 interval examined should therefore be characterized as a pandemic-and-recovery window encompassing both the pandemic shock and subsequent recovery. Because the empirical panel begins in 2020, the study does not claim to estimate a structural break relative to a pre-pandemic baseline.
At the same time, the European Union provides a particularly informative setting for studying digital-market participation. Member States share a common single-market framework but remain heterogeneous in household connectivity, income, education, digital use, logistics, payments, and institutional conditions. Existing European research documents persistent differences in e-commerce development and internet purchasing [5,6,7,8,9], while newer work continues to identify substantial heterogeneity in digital access and user profiles across Member States [10]. These differences imply that aggregate increases in online shopping may coexist with meaningful disparities in the conditions that enable households to participate.
The theoretical level of analysis is important in this context. Individual adoption frameworks such as the technology acceptance model and UTAUT explain technology use through perceptions, intentions, social influence, and facilitating conditions [11,12]. These theories remain valuable for consumer-level studies, including research on online purchasing after COVID-19 [3], but their constructs cannot be inferred directly from national averages. A country-level panel requires a macro-comparative framework. The study draws instead on digital-divide research, technology diffusion, and national digital readiness, which distinguish material access from capabilities and usage and explicitly examine how structural conditions vary across places [10,13,14,15,16,17,18,19,20].
Within this framework, household internet access represents a necessary enabling condition, but it does not capture broadband speed or network quality. Previous European and global studies consistently associate connectivity with e-commerce adoption [6,7,8,9,21,22]. National digital-ecosystem capacity is conceptually complementary, but its empirical measurement requires caution. The overall Eurostat Digital Skills Indicator cannot be used here as an independent explanatory variable because online purchasing is itself one of the activities entering its problem-solving component. The empirical model therefore uses ICT-specialist employment as an exploratory indicator of specialized digital-ecosystem capacity and tertiary attainment as a separate human-capital control. Purchasing power-adjusted GDP per capita captures economic resources, while urbanization controls for market density and related structural conditions.
E-commerce participation also depends on mechanisms that are not reducible to access, human capital, or income. Systematic evidence identifies customer trust, security, payment facilities, organizational readiness, and institutional conditions as important elements of the e-commerce ecosystem [23,24]. Cross-border research demonstrates that logistics and delivery conditions continue to shape online demand within European markets [25], while institutional globalization can condition the relationship between digital market activity and cross-border buyers [26]. Most recently, evidence from Central and Eastern Europe highlights digital-payment infrastructure as an important correlate of e-commerce adoption [27]. These findings motivate a deliberately cautious interpretation of the present parsimonious panel: the included variables capture selected dimensions of national readiness, not the full causal architecture of electronic commerce.
The existing literature leaves three issues particularly relevant for the present study. First, recent global and European analyses use different samples, outcome definitions, and methods, making it difficult to distinguish persistent cross-country differences from within-country changes [5,6,7,8,9,21,22]. Second, pooled correlations between connectivity and e-commerce may largely reflect stable differences between countries; they do not necessarily imply that changes in connectivity within a country are associated with changes in online purchasing. Third, the recurring language of “convergence” in European digitalization is often based on group averages or descriptive narrowing, without being supported by formal convergence tests. These issues motivate a design that separates descriptive between-country patterns from two-way fixed-effects evidence, uses a common estimation sample, examines country-specific trends and lagged covariates, and tests beta and sigma convergence directly.
Accordingly, the study addresses four research questions. First, is household internet access positively associated with e-commerce participation within EU Member States after country and year effects are controlled for? Second, do national ICT-specialist intensity, interpreted as an exploratory digital-ecosystem indicator, and purchasing power-adjusted GDP per capita show robust within-country associations? Third, how sensitive are these relationships to common-sample estimation, country-specific trends, lagged explanatory variables, small-cluster inference, bounded-outcome models, first differences, and the 2021 measurement break in ICT-specialist employment? Fourth, do EU Member States exhibit measurable sigma convergence and beta catch-up in online purchasing over 2020–2025, and how sensitive is the latter to the bounded nature of the participation rate?
The study makes four substantive contributions. First, it distinguishes persistent cross-country differences in digital readiness from within-country changes over time, showing that relationships observed across Member States do not necessarily translate into equally strong temporal relationships within countries. Second, it demonstrates that household internet access is associated with contemporaneous changes in e-commerce participation and that this result survives several alternative uses of the short-panel variation, while the absence of a robust one-year-lagged relationship cautions against predictive or causal interpretation. Third, it separates consumer-level digital capability from broader national digital-ecosystem capacity by treating ICT-specialist employment as an exploratory economy-wide indicator; the relationship remains statistically uncertain even after restricting the sample to the post-2021 measurement regime. Fourth, it distinguishes statistically validated compression of cross-country dispersion from conventional beta catch-up, which becomes sensitive once the upper bound of the participation rate is explicitly addressed. Together, these results provide a more differentiated account of access, ecosystem capacity, within-country dynamics, and convergence in European e-commerce development.
The remainder of the paper is organized as follows: Section 2 develops the country-level theoretical framework and empirical expectations. Section 3 describes the data and sample construction. Section 4 sets out the fixed-effects, robustness, and convergence methods. Section 5 presents the results. Section 6 concludes with policy implications, limitations, and directions for future research.
2. Theoretical Background and Empirical Expectations
2.1. Country-Level Digital Readiness and E-Commerce Diffusion
E-commerce participation is an individual behavior, but national adoption rates are shaped by a set of country-level enabling conditions. For this reason, the analysis combines digital-divide theory, technology-diffusion research, and a national digital-readiness perspective. These approaches are aligned with the unit of analysis because they explain why economies differ in the resources and capabilities that make digital participation feasible, without drawing inferences about individual perceptions from country averages.
Digital-divide research distinguishes between access to digital technologies and the capabilities and patterns of use that follow access. Van Dijk conceptualizes digital inequality as a sequence involving motivational, material, skills, and usage access, and later work shows that, as basic connectivity becomes more widespread, inequalities increasingly shift toward differences in skills and types of internet use [16,17]. At the cross-country level, technology-diffusion studies similarly show that internet adoption depends on economic resources, access conditions, education, and the wider technological environment [18,19]. Evidence for the European Union further demonstrates persistent digital disparities associated with income, institutions, and territorial characteristics [20].
This layered interpretation is particularly relevant for e-commerce. Household internet access constitutes a first enabling condition: without access, participation in online markets is impossible. National digital capability represents a complementary layer, reflected in the availability of ICT-intensive labor and broader human capital that support digital services, platforms, firms, and consumer-facing ecosystems. Economic resources affect the capacity to purchase goods and services and to sustain digital investment. Institutional, payment, logistics, consumer-protection, and trust conditions also matter, but their harmonized annual measurement is less complete in the available data panel. Recent e-commerce research confirms the multidimensional character of these conditions. Paun et al. identify technological and economic correlates of adoption in a global panel [21]; EU studies document large cross-country differences in household internet access and online purchasing [7,9]; and recent study evidence highlights digital-payment infrastructure as an additional enabling condition in Central and Eastern Europe [27].
The empirical model estimates country-level associations among observable components of digital readiness and e-commerce participation. Country fixed effects absorb time-invariant differences in culture, geography, and persistent institutional characteristics, while year fixed effects absorb shocks common to Member States. Time-varying institutional, payment, logistics, and trust factors that are not included remain potential omitted variables and are treated explicitly as a limitation. The resulting estimates are interpreted as conditional within-country associations, not as causal effects.
2.2. Household Internet Access as an Enabling Condition
The first level of digital readiness is material access. In the Eurostat household ICT survey, internet access measures the percentage of households in which anyone can access the internet from home [28]. It is an access indicator, not a measure of broadband speed, fiber availability, affordability, service quality, or local network coverage. This distinction is important in a mature digital market: an access rate close to saturation may still vary enough within countries to influence the size of the population able to participate routinely in online commerce, but it cannot reveal the quality of the connection itself.
An additional measurement distinction is important for the interpretation of this relationship. Internet access is measured at the household level, whereas Ecom represents the share of individuals aged 16–74 who purchase goods or services online. Both indicators are aggregated to the country–year level in the empirical analysis, but their underlying observational units and denominators differ. The estimated relationship should be interpreted as an association between national aggregate indicators and does not provide evidence that internet access within a particular household directly changes the purchasing behavior of a particular individual. This distinction limits micro-level inference and requires caution with respect to ecological interpretation.
From a diffusion perspective, broader household access lowers a basic participation barrier and increases the set of consumers who can search, compare, order, and transact online. Existing EU evidence reports a close relationship between household internet access and online purchasing [7,9], while global panel evidence also identifies connectivity as a central correlate of e-commerce adoption [21]. The present analysis asks whether this relationship is visible in within-country changes after common annual shocks and persistent country characteristics are removed.
H1.
Within EU Member States, increases in household internet access are positively associated with e-commerce participation.
2.3. National Digital-Ecosystem Capacity
Access alone does not ensure effective digital-market participation. At the country level, the broader digital ecosystem—including specialized ICT labor supporting platforms, business digitization, cybersecurity, system maintenance, and digital-service delivery—may complement household access. A direct consumer digital-skills indicator must nevertheless be selected carefully. The Eurostat overall Digital Skills Indicator (DSI 2.0) is constructed from activities in five competence domains, and its problem-solving component includes online purchasing itself [29]. Using that composite as an explanatory variable for online purchasing would create mechanical construct overlap. In addition, the DSI methodology was revised from 2021 onward. The overall DSI is therefore excluded from the core regressions.
ICT-specialist employment is used as an economy-wide indicator of specialized digital-ecosystem capacity, while tertiary educational attainment is retained separately as a broader human-capital control. ICTspec does not measure consumers’ shopping skills, confidence, or transaction capability. It captures the intensity of specialized ICT labor able to develop, operate, secure, and maintain digital systems and services that may support platform quality, complementary business adoption, and the wider environment in which consumers transact [30]. Because the measure is derived from the European Union Labor Force Survey, implementation of the Integrated European Social Statistics framework in 2021 generated an official break in series; all core models include year effects, and a separate post-break sensitivity analysis is reported.
Because the link between economy-wide ICT-specialist intensity and consumer online purchasing is indirect, this relationship is treated as exploratory. A positive coefficient would be consistent with a supportive ecosystem mechanism, but a statistically insignificant coefficient would indicate only that this macro-level proxy does not show a robust short-run association with e-commerce participation. It would not constitute evidence against the broader theoretical relevance of consumer digital skills or human capital.
Exploratory expectation (E1): Greater national ICT-specialist intensity may be positively associated with e-commerce participation by reflecting a more developed digital ecosystem.
2.4. Economic Resources and Complementary Structural Conditions
Technology diffusion is also conditioned by economic resources. Cross-country evidence on internet diffusion has long linked adoption to income and access costs [18], while multidimensional digital-divide research identifies economic development as an important correlate of ICT adoption [19,20]. For e-commerce, higher purchasing power-adjusted income may support household demand, payment capacity, device ownership, and complementary private investment. The model uses GDP per capita expressed in purchasing power standards per inhabitant and enters its natural logarithm to reduce scale skewness. It is interpreted as a purchasing power-adjusted measure of economic resources and does not capture short-run real growth.
Urban population share and tertiary educational attainment are included as structural controls and are not treated as primary theoretical constructs. Urbanization can proxy for market density, service availability, and logistics, whereas tertiary attainment captures broad human capital. Their inclusion reduces the risk that the coefficients on the focal digital-readiness variables merely reflect these background characteristics. Other time-varying conditions identified in the literature—including digital payments, logistics, consumer protection, trust, and regulatory quality—are acknowledged but are not all included because a consistent annual EU-27 series is not available for the complete empirical design.
H2.
Higher purchasing power-adjusted GDP per capita is positively associated with e-commerce participation within EU Member States, conditional on digital-readiness variables and fixed effects.
2.5. Convergence in E-Commerce Adoption
Cross-country differences in adoption motivate a separate convergence analysis. Convergence is not inferred from a narrowing EU-14/EU-13 mean gap or from an interaction between a group dummy and an explanatory variable. Following the classical convergence literature, two distinct concepts are examined [31,32]. Sigma convergence occurs when the cross-country dispersion of e-commerce participation declines over time. Beta convergence occurs when countries with lower initial adoption subsequently experience faster growth. The two concepts are complementary: a negative initial-level/growth relationship provides evidence of catch-up, whereas declining dispersion shows whether the distribution of adoption rates is becoming more compressed.
The EU context provides a plausible setting for convergence because Member States operate within a common single-market and regulatory framework but entered the digital transition with markedly different levels of household connectivity and online purchasing. Recent EU research continues to document both persistent disparities and evidence of faster progress in less digitally mature markets [7,9,27]. The empirical tests treat convergence as an outcome to be measured directly instead of an interpretation imposed on the digital-readiness coefficients.
H3a.
Cross-country dispersion in e-commerce participation declines over 2020–2025, consistent with sigma convergence.
H3b.
EU Member States with lower initial e-commerce participation in 2021 experience faster subsequent growth through 2025, consistent with beta convergence.
2.6. Research Contribution and Empirical Structure
The conceptual framework distinguishes three dimensions of national digital readiness: basic household access, specialized digital-ecosystem capacity, and economic resources. Household internet access captures an enabling condition and is evaluated through H1; purchasing power-adjusted GDP reflects economic resources and is evaluated through H2. ICT-specialist employment is retained as an exploratory ecosystem-capacity indicator because its economy-wide labor-market definition is conceptually distant from consumer digital capability. Convergence is assessed separately through H3a and H3b. The empirical strategy therefore separates whether countries differ systematically in these characteristics, whether within-country changes are associated with e-commerce participation, and whether national participation rates are becoming less dispersed or display conventional catch-up. This structure allows access, ecosystem capacity, temporal association, and convergence to be examined as related but analytically distinct dimensions of European e-commerce development.
3. Materials and Methods
3.1. Data Sources and Sample Construction
The empirical analysis covers the 27 current Member States of the European Union over 2020–2025, grouped for descriptive purposes into the EU-14—Austria, Belgium, Denmark, Finland, France, Germany, Greece, Ireland, Italy, Luxembourg, the Netherlands, Portugal, Spain, and Sweden—representing the pre-2004 EU members remaining in the EU-27, and the EU-13—Bulgaria, Croatia, Cyprus, Czechia, Estonia, Hungary, Latvia, Lithuania, Malta, Poland, Romania, Slovakia, and Slovenia—comprising countries that joined the EU from 2004 onward. This six-year window includes the pandemic shock, the subsequent reopening and recovery, and the most recent years for which the e-commerce outcome is available. It is described as a pandemic-and-recovery period, with the analysis extending beyond the immediate post-pandemic phase. Because the window begins in 2020, the study does not estimate a pre-pandemic trend break and does not claim to identify a permanent COVID-19 effect. This qualification is consistent with recent evidence showing that pandemic-related increases in online spending largely returned toward prior trends in many countries [1].
The complete descriptive grid contains 162 potential country–year cells (27 countries × 6 years), but the panel is not balanced for every variable. No missing value is interpolated, extrapolated, or imputed. The main contemporaneous fixed-effects analysis uses 2020–2024 because the structural covariates are consistently available through 2024; after applying a common-sample rule across all core regressors, 133 observations from all 27 countries remain. A separate lagged specification uses outcomes for 2021–2025 and explanatory variables dated t − 1, again yielding 133 observations from all 27 countries. The 2025 e-commerce outcome is retained in the convergence analysis and the lagged robustness design even though contemporaneous 2025 controls are not yet jointly available.
The dependent variable and the principal digital variables are drawn from harmonized Eurostat datasets. Urban population share is obtained from the World Bank World Development Indicators [33]. The analytical dataset was constructed by harmonizing country–year observations across the selected Eurostat and World Bank indicators, with particular attention to dataset definitions, measurement units, temporal coverage, and cross-country comparability. Specialized digital-ecosystem capacity is represented by ICT-specialist employment, while tertiary educational attainment is retained as a broader human-capital control, and economic resources are measured using GDP per capita expressed in purchasing power standards. The overall Eurostat Digital Skills Indicator is not included because its construction incorporates online purchasing among the activities used to assess problem-solving skills, creating conceptual overlap with the dependent variable. All source series were accessed on 20 August 2026; the exact dataset filters, measurement categories, and sample-construction rules are documented in Supplementary File S1.
3.2. Variable Definitions and Measurement Decisions
Table 1 presents the operational definitions, data sources, units of measurement, and analytical roles of the variables included in the empirical model. Variable terminology is aligned with the definitions used in the underlying official statistical sources. In particular, the Eurostat indicator is referred to as household internet access because the dataset indicator (isoc_ci_in_h) measures the share of households with access to the internet from home [28]. The indicator captures basic connectivity but does not provide information on connection speed, fiber availability, affordability, reliability, or service quality.
Table 1.
Variable definitions, sources, and analytical roles.
The dependent and explanatory indicators also differ in their underlying statistical units. Ecom is defined as the percentage of individuals aged 16–74 reporting online purchases, while InternetAccess is defined as the percentage of households with internet access at home. The empirical unit of observation is nevertheless the country–year in both cases, so the regression relates aggregate national rates and does not rely on matched household- and individual-level observations. Consequently, the internet access coefficient captures whether within-country changes in the national household-access rate are associated with changes in the national individual online-purchasing rate. It does not identify a household-level treatment effect or an individual behavioral response to gaining internet access.
The overall Eurostat Digital Skills Indicator is not included as an explanatory variable because its construction creates conceptual overlap with the dependent variable. Under the DSI 2.0 methodology, online purchasing is one of the activities considered within the problem-solving component of digital skills [29]. Since the dependent variable measures the share of individuals purchasing goods or services online, including the composite Digital Skills Indicator on the right-hand side would introduce a mechanical relationship between predictor and outcome. ICT-specialist employment is therefore only retained as an exploratory indicator of economy-wide digital-ecosystem capacity, while tertiary educational attainment provides a broader human-capital control.
GDP per capita is expressed in purchasing power standards per inhabitant and enters the empirical models in natural logarithms. This transformation reduces scale asymmetry across Member States and allows the coefficient to be interpreted as a conditional association between purchasing power-adjusted economic resources and e-commerce participation. The variable is treated as a level measure of economic capacity and does not capture short-run economic growth. ICT specialists are measured as a share of total employment according to the Eurostat/OECD occupational definition [30]. Because the underlying Labor Force Survey series is affected by a methodological break in 2021 following implementation of Regulation (EU) 2019/1700, ICTspec is interpreted as a broad measure of national digital-ecosystem capacity and not as a direct measure of consumer digital skills.
The annual labels of the principal indicators do not represent perfectly synchronized measurement windows. Ecom records whether individuals purchased goods or services online during the previous 12 months, internet access reflects household connectivity around the household ICT survey reference period, and ICTspec is derived from annual Labor Force Survey information [28,30]. Consequently, contemporaneous country–year observations may combine partially overlapping but non-identical reference periods. Shifting the explanatory variables back by one reported year improves temporal ordering but does not guarantee an exact twelve-month separation between all underlying measurement windows. The contemporaneous and lagged estimates are therefore interpreted as alternative temporal alignments of annual aggregate indicators and not as precisely timed causal effects.
3.3. Missing Data, Coverage, and the Common Estimation Sample
Table 2 summarizes the pattern of missing observations across variables and years. Data availability is uneven across indicators, particularly toward the end of the study period. For 2025, contemporaneous observations for GDP per capita, urbanization, tertiary educational attainment, and most ICT-specialist measures are not jointly available for the full EU-27 sample. Accordingly, the main contemporaneous fixed-effects analysis is conducted over 2020–2024, when the core covariates can be combined on a consistent common sample. The 2025 e-commerce observations are nevertheless retained in the analysis through specifications using one-year-lagged explanatory variables and through the beta- and sigma-convergence assessment.
Table 2.
Missing observations in the original 27 × 6 country–year grid.
No missing observations are interpolated, extrapolated, or otherwise imputed; all estimations are based exclusively on observed country–year values.
For comparability across specifications, all contemporaneous fixed-effects models are estimated on the same common sample of 133 country–year observations. This approach ensures that differences in coefficient estimates across the nested specifications reflect changes in model specification while keeping the sample composition constant. The common sample excludes two country–year observations: France in 2020, for which the required e-commerce and household internet-access data are unavailable, and Ireland in 2022, for which household internet-access data are missing. Despite these exclusions, all 27 EU Member States remain represented in each of the reported core specifications.
3.4. EU-14 and EU-13 Analytical Classification
For descriptive purposes, the EU-27 Member States are divided into two analytical groups reflecting different stages of European integration. The EU-13 group comprises Bulgaria, Croatia, Cyprus, Czechia, Estonia, Hungary, Latvia, Lithuania, Malta, Poland, Romania, Slovakia, and Slovenia. The comparison group, hereafter referred to as EU-14, consists of the pre-2004 EU Member States that remain part of the current EU-27: Austria, Belgium, Denmark, Finland, France, Germany, Greece, Ireland, Italy, Luxembourg, the Netherlands, Portugal, Spain, and Sweden. The United Kingdom is excluded because it is not part of the EU-27 sample. This classification is used exclusively for descriptive comparisons of e-commerce trajectories and does not enter the fixed-effects regressions as a separate explanatory variable. Since group membership is time-invariant, any persistent differences associated with this classification are absorbed by the country fixed effects. Formal convergence is assessed separately through beta- and sigma-convergence tests, while differences between the two country groups are used only for descriptive comparison.
3.5. Descriptive Statistics and Identifying Variation
Table 3 reports descriptive statistics for the common contemporaneous estimation sample. In addition to pooled dispersion, the table reports a pooled within-country standard deviation calculated after removing country means. This quantity is particularly informative for a fixed-effects design because it shows the variation from which the coefficients are identified. Household internet access is high on average (92.15%) but still displays a within-country standard deviation of 2.17 percentage points. This within-country variation provides statistical identification for the country-level coefficient, but it does not resolve the difference between the household denominator of internet access and the individual denominator of Ecom. Thus, the variable is close to saturation but is not time-invariant.
Table 3.
Descriptive statistics for the common contemporaneous estimation sample (2020–2024).
4. Empirical Strategy
4.1. Core Two-Way Fixed-Effects Specification
The primary empirical design estimates within-country associations while controlling for shocks common to all Member States. The full contemporaneous specification is as follows:
Ecom_it = β1 InternetAccess_it + β2 ICTspec_it + β3 lnGDPpps_it + β4 Urban_it + β5 Tertiary_it + μ_i + λ_t + ε_it
Here, i indexes countries and t indexes years. μ_i denotes country fixed effects, and λ_t denotes year fixed effects. Country effects absorb time-invariant characteristics such as geography, persistent institutional quality, and long-standing cultural differences. Year effects absorb common developments such as pandemic restrictions, reopening, inflation shocks, and EU-wide regulatory or technological change. The coefficients are identified from deviations in a country’s variables from its own time profile, net of common annual effects.
Four nested contemporaneous specifications are estimated on the same common sample of N = 133 country–year observations. C1 includes internet access and ICTspec; C2 adds logged GDP per capita; and C3 additionally includes Urban and Tertiary and constitutes the preferred full specification. C4 extends C3 by introducing country-specific linear trends, allowing each Member State to follow a distinct secular trajectory. Estimating all four models on an identical sample ensures that changes in the estimated coefficients across specifications reflect differences in model structure, with sample composition held constant.
4.2. Inference with a Limited Number of Country Clusters
Standard errors are clustered at the country level to allow for heteroskedasticity and arbitrary within-country correlation in the regression disturbances. Because the analysis contains only country clusters, the cluster-robust covariance matrix is adjusted using the finite-sample correction
where denotes the number of country clusters, the number of observations, and the number of estimated parameters in the corresponding specification. Statistical inference is based on a -distribution with degrees of freedom, avoiding reliance on the asymptotic normal distribution.
For the preferred contemporaneous model C3, inference on the internet access coefficient is additionally evaluated using a restricted wild-cluster bootstrap-t procedure. The bootstrap uses 9999 replications, Rademacher weights applied at the country-cluster level, and imposes the null hypothesis when generating the bootstrap distribution. A studentized bootstrap-t statistic is used to obtain the two-sided bootstrap p-value and the corresponding 95% bootstrap confidence interval. This procedure provides an additional small-cluster inference check that is less dependent on conventional large-cluster asymptotics [34].
4.3. Lagged Covariates and Country-Specific Trends
Contemporaneous fixed-effects associations may still reflect simultaneity or common short-run movements in digital access and online purchasing. To examine temporal ordering and reduce immediate reverse-causality concerns, a second design relates e-commerce participation over 2021–2025 to structural conditions measured one year earlier:
Ecomit = β1 InternetAccessi,t−1 + β2 ICTspeci,t−1 + β3 lnGDPppsi,t−1
+ β4 Urbani,t−1 + β5 Tertiaryi,t−1 + μi + λt + εit
+ β4 Urbani,t−1 + β5 Tertiaryi,t−1 + μi + λt + εit
The lagged analysis is reported in four nested specifications that parallel the contemporaneous models. L1 includes lagged internet access and ICTspec; L2 adds lagged lnGDP per capita; L3 additionally includes lagged Urban and Tertiary and constitutes the full lagged specification; and L4 further introduces country-specific linear trends. All four models are estimated on the same 133 country–year observations from all 27 Member States.
Lagging the explanatory variables establishes temporal ordering but does not by itself ensure exogeneity or eliminate omitted-variable bias. The lagged specifications are interpreted as robustness tests of whether the contemporaneous relationships persist over a one-year horizon and are not intended to provide causal identification.
4.4. Additional Robustness and Diagnostic Procedures
Several additional procedures assess the sensitivity of the estimates to multicollinearity, residual dependence, influential countries, and the bounded nature of the dependent variable. First, variance inflation factors are calculated using the variation relevant to each fixed-effects specification. For C3, the explanatory variables are residualized with respect to country and year effects before the VIFs are calculated. For C4, the residualization additionally removes country-specific linear trends. This procedure assesses multicollinearity in the variation that identifies the corresponding regression coefficients, with pooled levels excluded from the calculation.
Second, residual diagnostics examine first-order serial correlation and cross-sectional dependence using a Pesaran-type statistic. Given the short time dimension of the panel, these tests are interpreted as sensitivity diagnostics and do not provide definitive evidence that residual dependence is absent.
Third, a leave-one-country-out procedure re-estimates the preferred contemporaneous model C3 27 times, sequentially excluding one Member State. The resulting distribution of the internet access coefficient is used to assess whether the principal contemporaneous association is disproportionately influenced by any single country.
Fourth, because e-commerce participation is bounded between zero and one when expressed as a proportion, fractional-response models are used as bounded-outcome robustness checks. A fractional logit specification with country and year indicators is estimated first. Because nonlinear fixed-effects models with a very short time dimension may be susceptible to incidental-parameters concerns, an additional correlated random-effects fractional logit model based on the Mundlak approach is estimated. This specification includes the contemporaneous explanatory variables, their country-specific time averages, and year effects, with standard errors clustered by country. The Mundlak formulation allows unobserved country heterogeneity to be correlated with the observed regressors without requiring a full set of nonlinear country fixed effects [35,36].
Fifth, descriptive cross-country relationships are distinguished from the within-country variation used by the fixed-effects estimator. Between-country correlations are calculated from country means, while fixed-effects-relevant correlations are calculated after residualizing the variables with respect to country and year effects. This distinction prevents strong pooled cross-sectional relationships from being interpreted as evidence of corresponding within-country associations.
Sixth, the identifying variation in internet access is examined directly because the indicator is close to saturation. Consecutive within-country annual changes are summarized, and an added-variable representation of C3 is constructed by residualizing Ecom and internet access with respect to ICTspec, lnGDPpps, Urban, Tertiary, country fixed effects, and year fixed effects. A first-difference sensitivity model then relates annual changes in Ecom to annual changes in the explanatory variables and ending-year fixed effects. FD1 includes ΔInternetAccess and ΔICTspec, FD2 adds ΔlnGDPpps, and FD3 additionally includes ΔUrban and ΔTertiary. The first-difference models use the 105 consecutive transitions available in the common 2020–2024 sample and country-clustered standard errors with the same finite-sample inference logic as the level specifications.
Finally, because the ICT-specialist series contains an official methodological break in 2021, C1–C4 are re-estimated over 2021–2024 (N = 107) as a post-break sensitivity analysis. This check assesses whether the exploratory ICTspec conclusion is driven by the inclusion of the pre-break 2020 observations.
4.5. Formal Tests of E-Commerce Convergence
Convergence is evaluated independently from the fixed-effects coefficient estimates and is examined using complementary sigma- and beta-convergence approaches. Sigma convergence refers to a reduction in the cross-country dispersion of e-commerce participation over time, whereas beta convergence occurs when Member States with lower initial levels of online purchasing subsequently experience faster growth. Because the two concepts capture different dimensions of catch-up, both are examined separately.
The primary sigma-convergence analysis is based on a balanced sample of 26 Member States observed consistently over 2020–2025. France is excluded from this calculation for all years because its e-commerce observation is unavailable for 2020. Maintaining an identical country composition throughout the period prevents changes in the annual dispersion measures from reflecting changes in sample membership. Sigma convergence is evaluated using both the cross-country standard deviation and the coefficient of variation in e-commerce participation. A sustained decline in these measures is interpreted as evidence consistent with increasing compression of the cross-country distribution.
As a robustness check, sigma convergence is also evaluated for the complete EU-27 over 2021–2025, when valid e-commerce observations are available for all Member States. This alternative window makes it possible to assess whether the observed decline in dispersion is sensitive either to the exclusion of France or to the use of 2020 as the initial year.
Uncertainty around sigma convergence is evaluated with a country-trajectory bootstrap that preserves the repeated-country structure. In each of 9999 replications, the 26 complete 2020–2025 country trajectories are resampled with replacement using seed 167. The change from 2020 to 2025 and the linear annual trend are calculated for both the cross-country standard deviation and the coefficient of variation, and 95% percentile confidence intervals are reported. This procedure provides formal uncertainty estimates for the observed reduction in dispersion.
Absolute beta convergence is examined using 2021 as the primary baseline because valid e-commerce observations are available for all 27 Member States in that year. The annualized log growth rate in e-commerce participation between 2021 and 2025 is regressed on the initial log level:
A statistically significant negative coefficient on the initial log level indicates that Member States with lower initial adoption subsequently experienced faster growth within the conventional absolute beta-convergence specification. Heteroskedasticity-robust HC1 standard errors are used in this cross-sectional model.
Several conventional robustness tests are also reported. The cross-sectional regression is re-estimated using 2020, 2022, and 2023 as alternative baseline years; a leave-one-country-out procedure sequentially excludes each Member State; and a panel-based specification relates annual log growth over 2021–2025 to the lagged log level with year fixed effects and country-clustered standard errors.
In the annual panel specification, year fixed effects absorb shocks common to Member States. A negative coefficient on the lagged adoption level indicates that countries with lower e-commerce participation in one year tend, on average, to experience faster growth in the following year. Given the short time dimension, this is treated as a robustness check and not as a dynamic long-run convergence model.
To address the bounded nature of e-commerce participation and the possibility of mechanical ceiling effects, two additional 2021–2025 sensitivities are estimated. First, the participation proportion is transformed to the logit scale, and annualized change in logit participation is regressed on the initial logit level. Second, annualized progress is expressed as the share of the initial remaining distance to the 100% ceiling that is closed over the period and is regressed on initial participation. Both cross-sectional sensitivities use HC1 standard errors.
The conventional and ceiling-sensitive beta results are interpreted jointly. Alternative baseline years, influence checks, and the annual panel assess the stability of conventional catch-up, while the logit and headroom specifications test whether the negative relationship persists after explicitly accounting for the bounded outcome. The analysis does not claim convergence toward a common long-run steady state, and regression-to-the-mean effects cannot be fully excluded.
5. Results
5.1. Descriptive Trajectories and EU-14/EU-13 Differences
Online purchasing increased in both analytical country groups over the 2020–2025 period. The unweighted mean for the EU-14 group rose from 69.83% in 2020 to 78.54% in 2025, while the corresponding EU-13 mean increased from 56.17% to 68.11%. For 2020, the EU-14 average is based on 13 countries because the observation for France is unavailable; from 2021 onward, annual means are calculated using the complete membership of both groups. The difference between the two group averages narrowed from approximately 13.66 percentage points in 2020 to 10.44 percentage points in 2025, indicating a reduction in the descriptive gap in e-commerce participation over the study period.
Figure 1 provides descriptive evidence of faster progress among the lower-adoption EU-13 group, but this pattern is not treated as a formal convergence test. Group composition, different starting levels, and a single missing 2020 observation can affect mean gaps. Formal sigma- and beta-convergence results are presented in Section 5.5.
Figure 1.
E-commerce adoption trajectories in EU-14 and EU-13, 2020–2025. Source: author calculations from Eurostat data.
5.2. Between-Country and Within-Country Associations
Table 4 separates persistent cross-country associations from the variation most relevant to the two-way fixed-effects estimator. Between-country correlations use country means over the core period. The second column reports correlations between residuals obtained after removing both country and year effects. InternetAccess is strongly related to Ecom in both dimensions: the between-country correlation is 0.716, and the two-way-residuals correlation is 0.516. By contrast, the residuals’ relationship with ICTspec is only 0.106 despite a high between-country correlation of 0.736. This distinction shows why pooled scatterplots cannot be used to validate fixed-effects hypotheses.
Table 4.
Between-country and two-way-fixed-effects-residuals correlations.
The identifying variation is also limited for some controls. InternetAccess has a within-country standard deviation of 2.17 percentage points, ICTspec 0.44 points, Urban 0.28 points, and Tertiary 1.40 points (Table 3). This supports retaining a parsimonious focal interpretation and avoiding strong conclusions from statistically imprecise control coefficients.
5.3. Main Two-Way Fixed-Effects Results
Table 5 presents the contemporaneous two-way fixed-effects estimates across four nested specifications. All models are estimated on the same common sample of 133 country–year observations covering all 27 EU Member States, ensuring direct comparability of coefficient estimates across specifications. The table reports coefficients, country-clustered standard errors, 95% confidence intervals, sample size, number of countries, fixed-effects structure, country-specific trends, and model fit statistics.
Table 5.
Two-way fixed-effects estimates for e-commerce participation, common sample.
The most stable result concerns H1. InternetAccess is positive and statistically significant in C1 (β = 1.034, p = 0.0015), remains significant after logged GDP is introduced in C2 (β = 0.843, p = 0.0123), and is significant in the full model C3 (β = 0.816, p = 0.0089). In C3, a one-percentage-point increase in household internet access is associated with approximately a 0.82-percentage-point increase in the share of individuals purchasing online, conditional on country and year effects and the included controls. The coefficient remains positive when country-specific linear trends are added (C4: β = 0.942, p = 0.0196). H1 is supported in the contemporaneous within-country specifications.
The exploratory ICTspec relationship is not statistically supported. The coefficient is positive in all four contemporaneous models but is estimated imprecisely, with confidence intervals spanning both positive and negative values. This indicates that the economy-wide ICT-specialist measure does not display a robust short-run within-country association with e-commerce participation; it does not test the broader importance of consumer digital skills or human capital.
H2 receives only weak and non-robust support. Logged GDP per capita is positive and marginally significant at the 10% level in C2 (p = 0.079), but it is not significant in C3, and changes sign after country-specific trends are included in C4. Failure to reject a zero coefficient does not establish that macroeconomic resources are irrelevant; instead, the short panel does not provide a stable within-country estimate once common shocks, controls, and heterogeneous trends are considered (Figure 2).
Figure 2.
Household internet-access coefficients across contemporaneous and one-year-lagged fixed-effects specifications. Error bars show 95% confidence intervals based on country-clustered standard errors.
5.4. Robustness, Diagnostics, and the Limits of Identification
The robustness analysis examines whether the contemporaneous internet-access association is sensitive to small-cluster inference, the bounded nature of the dependent variable, temporal ordering, country-specific trends, multicollinearity, and influential observations. For the preferred contemporaneous specification C3, the InternetAccess coefficient remains statistically significant under a restricted wild-cluster bootstrap-t procedure designed for inference with a limited number of clusters. Using 9999 replications, Rademacher weights applied at the country-cluster level, and imposing the null hypothesis the two-sided bootstrap p-value is 0.031. The corresponding 95% bootstrap-t confidence interval is approximately [0.083, 1.545]. The result remains statistically distinguishable from zero under a small-cluster procedure that does not rely exclusively on conventional cluster asymptotics.
Because e-commerce participation is bounded between zero and one when expressed as a proportion, fractional-response models provide an additional specification check. A fractional logit model with country and year indicators yields a positive InternetAccess coefficient of 0.0351 (clustered SE = 0.0158, p = 0.035), corresponding to an average marginal effect of approximately 0.70 percentage points. Because the very short time dimension may create incidental-parameter concerns in a nonlinear model with country indicators, a correlated random-effects fractional logit based on the Mundlak approach is used as an additional check. The InternetAccess coefficient remains positive and statistically significant (β = 0.0336, SE = 0.0135, 95% CI = [0.0057, 0.0614], p = 0.020), corresponding to an average marginal effect of approximately 0.69 percentage points. The similarity of the marginal effects indicates that the positive contemporaneous association is not an artifact of treating the bounded dependent variable as unbounded.
The one-year-lagged specifications provide substantially weaker evidence than the contemporaneous models (Table 6). Household internet access is statistically insignificant in L1 (β = 0.400, p = 0.309), L2 (β = 0.239, p = 0.495), L3 (β = 0.197, p = 0.565), and L4 (β = −0.199, p = 0.493). ICT-specialist employment is also statistically insignificant across all lagged specifications. Logged GDP per capita is only marginally significant in L2 and L3 and changes sign after country-specific trends are included, while the lagged urbanization and tertiary-attainment coefficients are imprecisely estimated. These results do not provide evidence of a stable one-year temporal relationship and reinforce an associational, non-causal interpretation of the contemporaneous estimates.
Table 6.
One-year-lagged two-way fixed-effects estimates for e-commerce participation.
The multicollinearity diagnostics are similarly reassuring. For C3, variance inflation factors calculated after residualizing the explanatory variables with respect to country and year effects range from 1.11 to 1.65, with a maximum of 1.65 for ICT-specialist employment. For C4, the variables are additionally residualized with respect to country-specific linear trends before the VIFs are computed. The resulting VIFs range from 1.04 to 1.40, with a maximum of 1.40. Thus, the inclusion of heterogeneous country trends does not generate problematic multicollinearity among the identifying components of the regressors (sigma convergence verification in Figure 3).
The leave-one-country-out exercise provides an additional influence diagnostic for the preferred contemporaneous specification C3. The InternetAccess coefficient remains positive and statistically significant in all 27 re-estimations, ranging from approximately 0.684 to 1.037, indicating that the contemporaneous association is not driven by any single Member State. Residual diagnostics likewise do not detect first-order serial correlation (ρ = 0.006, p = 0.937) or cross-sectional dependence (Pesaran-type CD = −0.693, p = 0.489). Given the short time dimension, these diagnostics have limited power and are interpreted only as sensitivity checks.
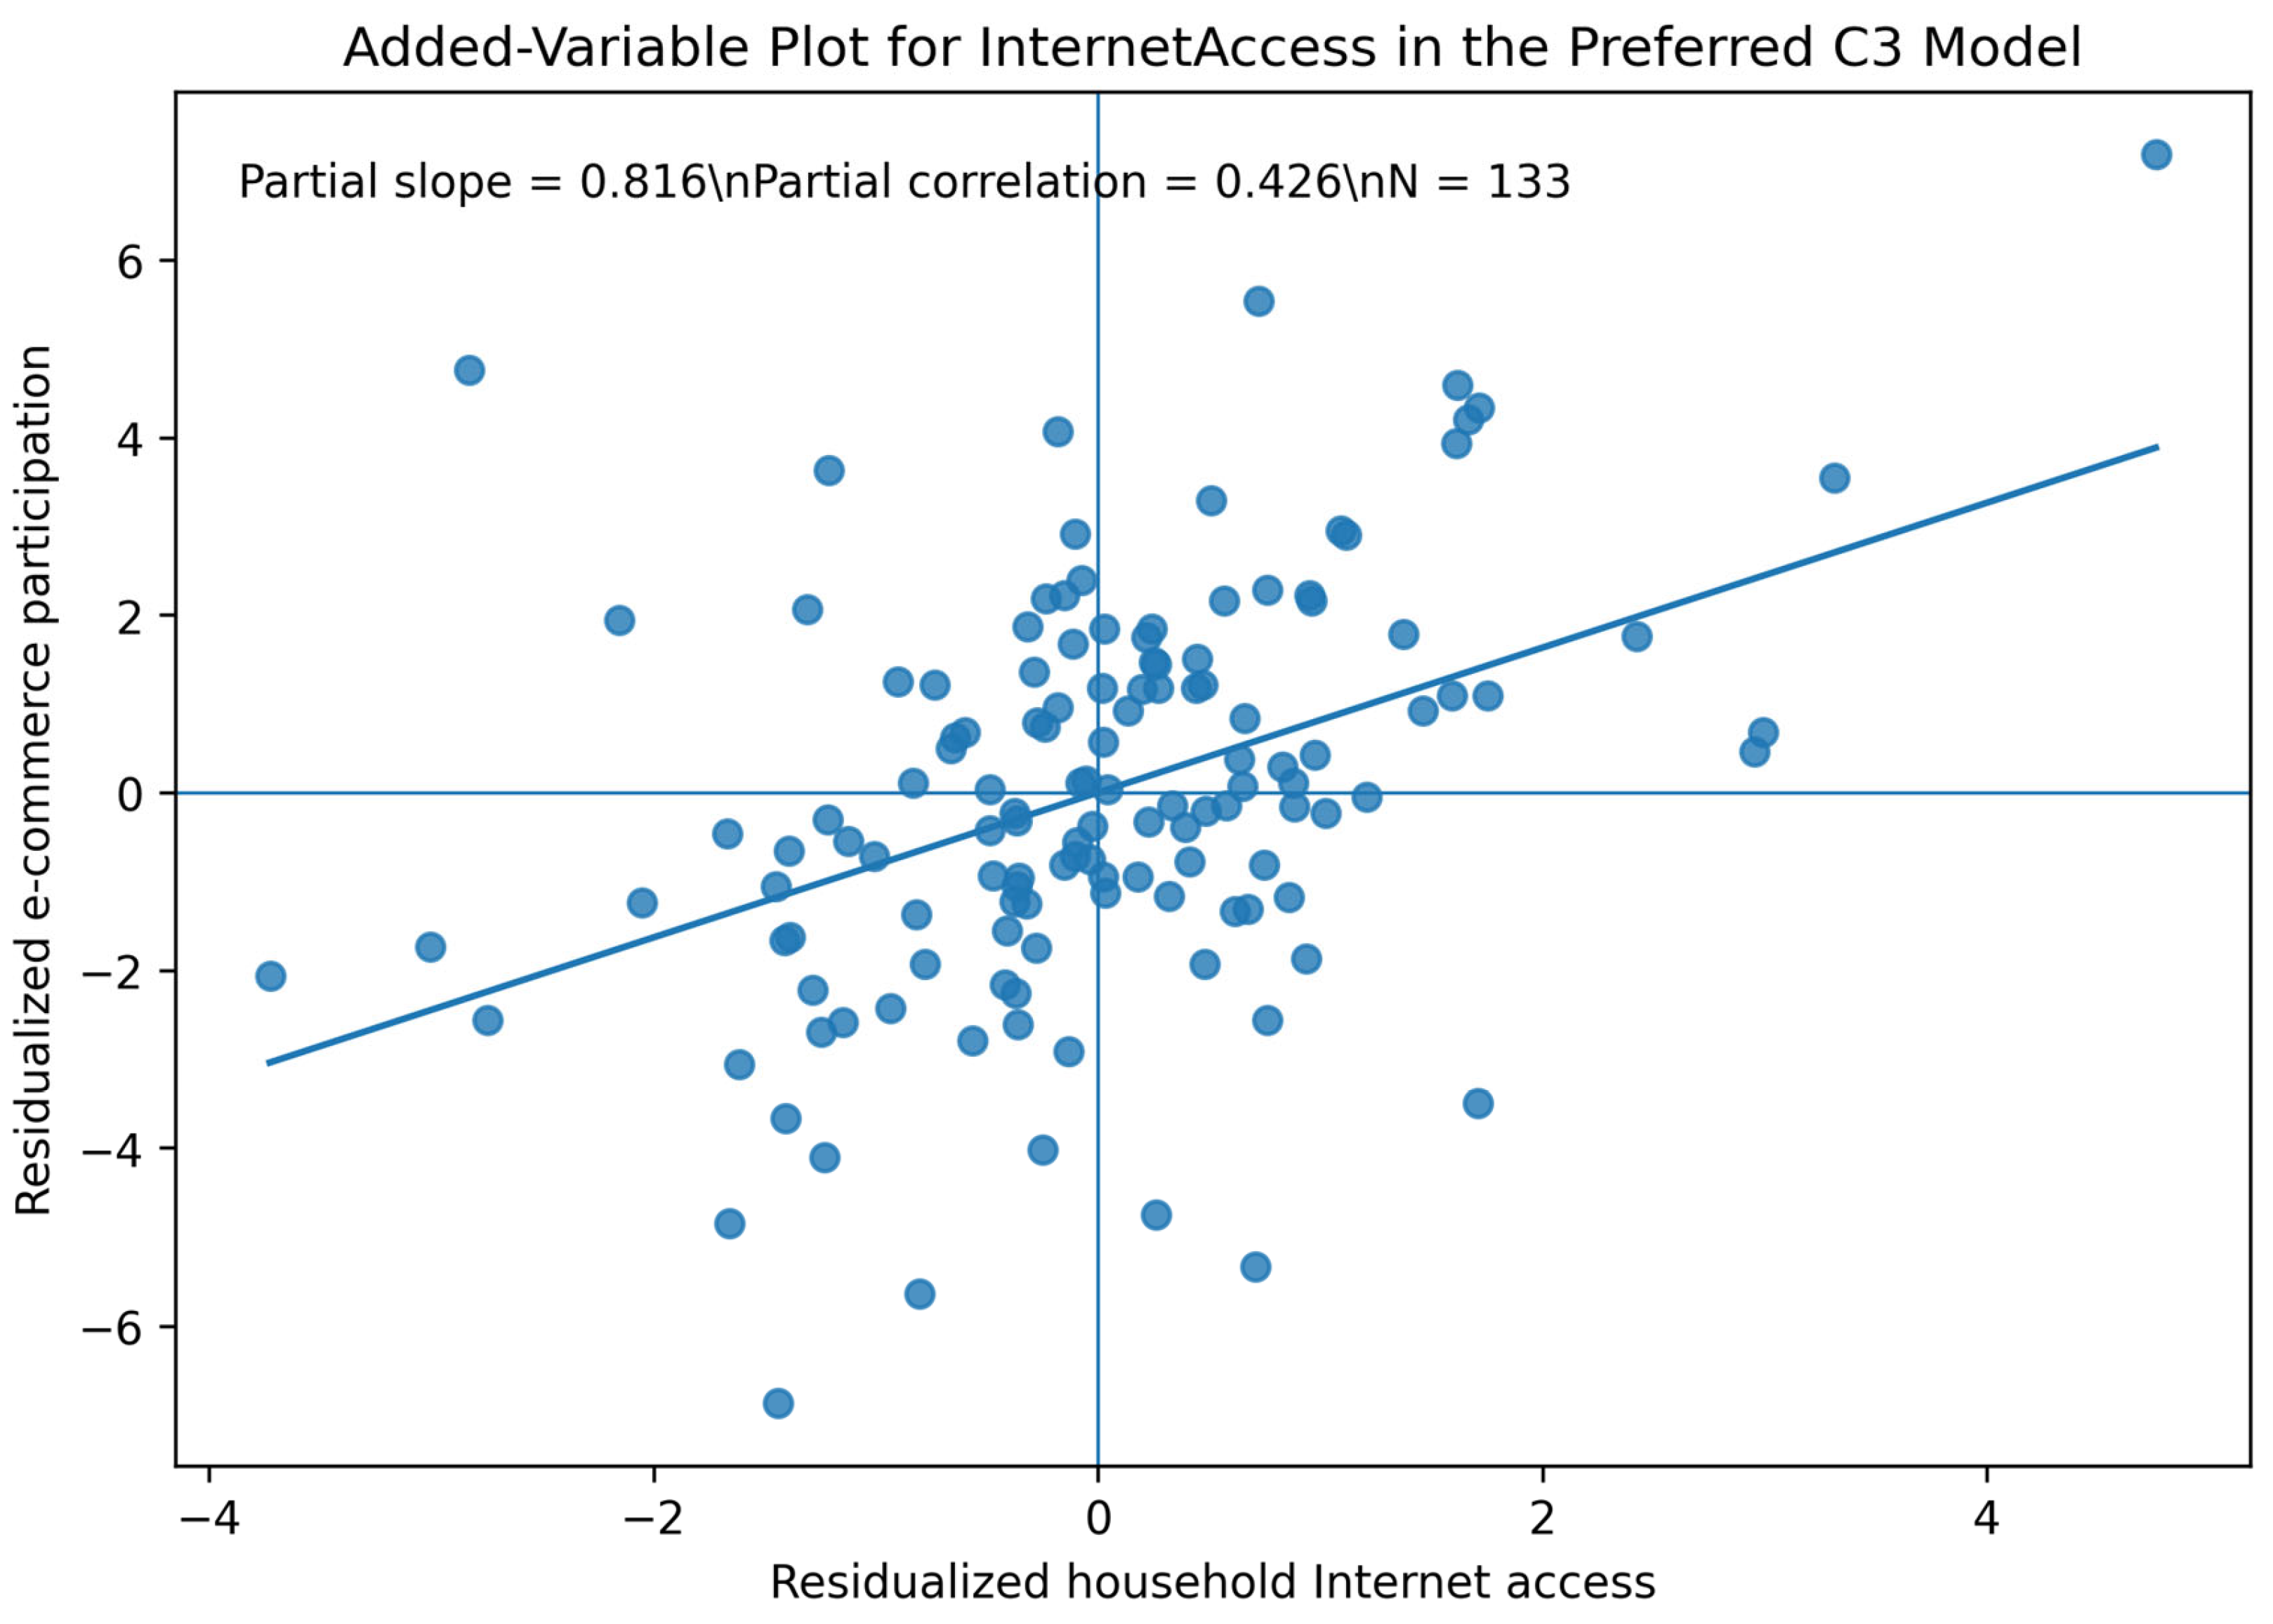
Because InternetAccess is close to saturation, its identifying variation was examined directly. Across 105 consecutive within-country transitions, the mean annual change is 1.128 percentage points, the median 0.910, and the standard deviation 1.595, with values ranging from −3.92 to 5.68 percentage points; 84 transitions are positive, and 21 are negative. In the added-variable representation of C3, the partial slope is 0.816, and the partial correlation between residualized InternetAccess and residualized Ecom is 0.426. The corresponding residualized relationship is displayed in Figure 4.
The first-difference specification provides a further check on the use of short-panel variation. In the full FD3 model, ΔInternetAccess remains positive and statistically significant (β = 0.862, SE = 0.237, 95% CI = [0.374, 1.349], p = 0.0012; N = 105), with similar estimates in the simpler first-difference specifications. The exploratory ICTspec result is also stable to the 2021 measurement break: in the post-break 2021–2024 version of C3, ICTspec remains statistically insignificant (β = 0.322, SE = 1.188, p = 0.788), and it is insignificant in all four post-break specifications.
Overall, the robustness evidence supports a specific and deliberately limited interpretation. The positive internet-access association is stable across contemporaneous fixed-effects specifications, small-cluster inference, fractional-response models, leave-one-country-out estimates, and first differences. It does not persist in the one-year-lagged models. The evidence is therefore consistent with a contemporaneous within-country association, while the timing and causal mechanism remain unidentified in the present short panel (Table 7).
Table 7.
Robustness, diagnostic, and reviewer-requested validation summary.
5.5. Formal Evidence on E-Commerce Convergence
The sigma-convergence results indicate a sustained reduction in cross-country dispersion. In the balanced 26-country sample, the standard deviation declines monotonically from 15.39 percentage points in 2020 to 11.64 in 2025, while the coefficient of variation falls from 0.244 to 0.159, corresponding to reductions of approximately 24.4% and 35.0% (Table 8). Country-trajectory bootstrap inference confirms that this compression is not merely descriptive: the 2020–2025 change in the standard deviation is −3.755 percentage points (95% bootstrap CI = [−5.803, −1.173], p = 0.006), and the change in the coefficient of variation is −0.0855 (95% bootstrap CI = [−0.1249, −0.0415], p < 0.001). The estimated annual trends are also negative, with bootstrap intervals entirely below zero.
Table 8.
Sigma-convergence diagnostics for e-commerce participation: balanced 26-country sample, 2020–2025.
Figure 3.
Sigma convergence in e-commerce participation across EU Member States: balanced 26-country sample, 2020–2025. Note: France is excluded from all years because its 2020 e-commerce observation is unavailable, ensuring a constant country composition throughout the period. Source: author calculations based on Eurostat data.
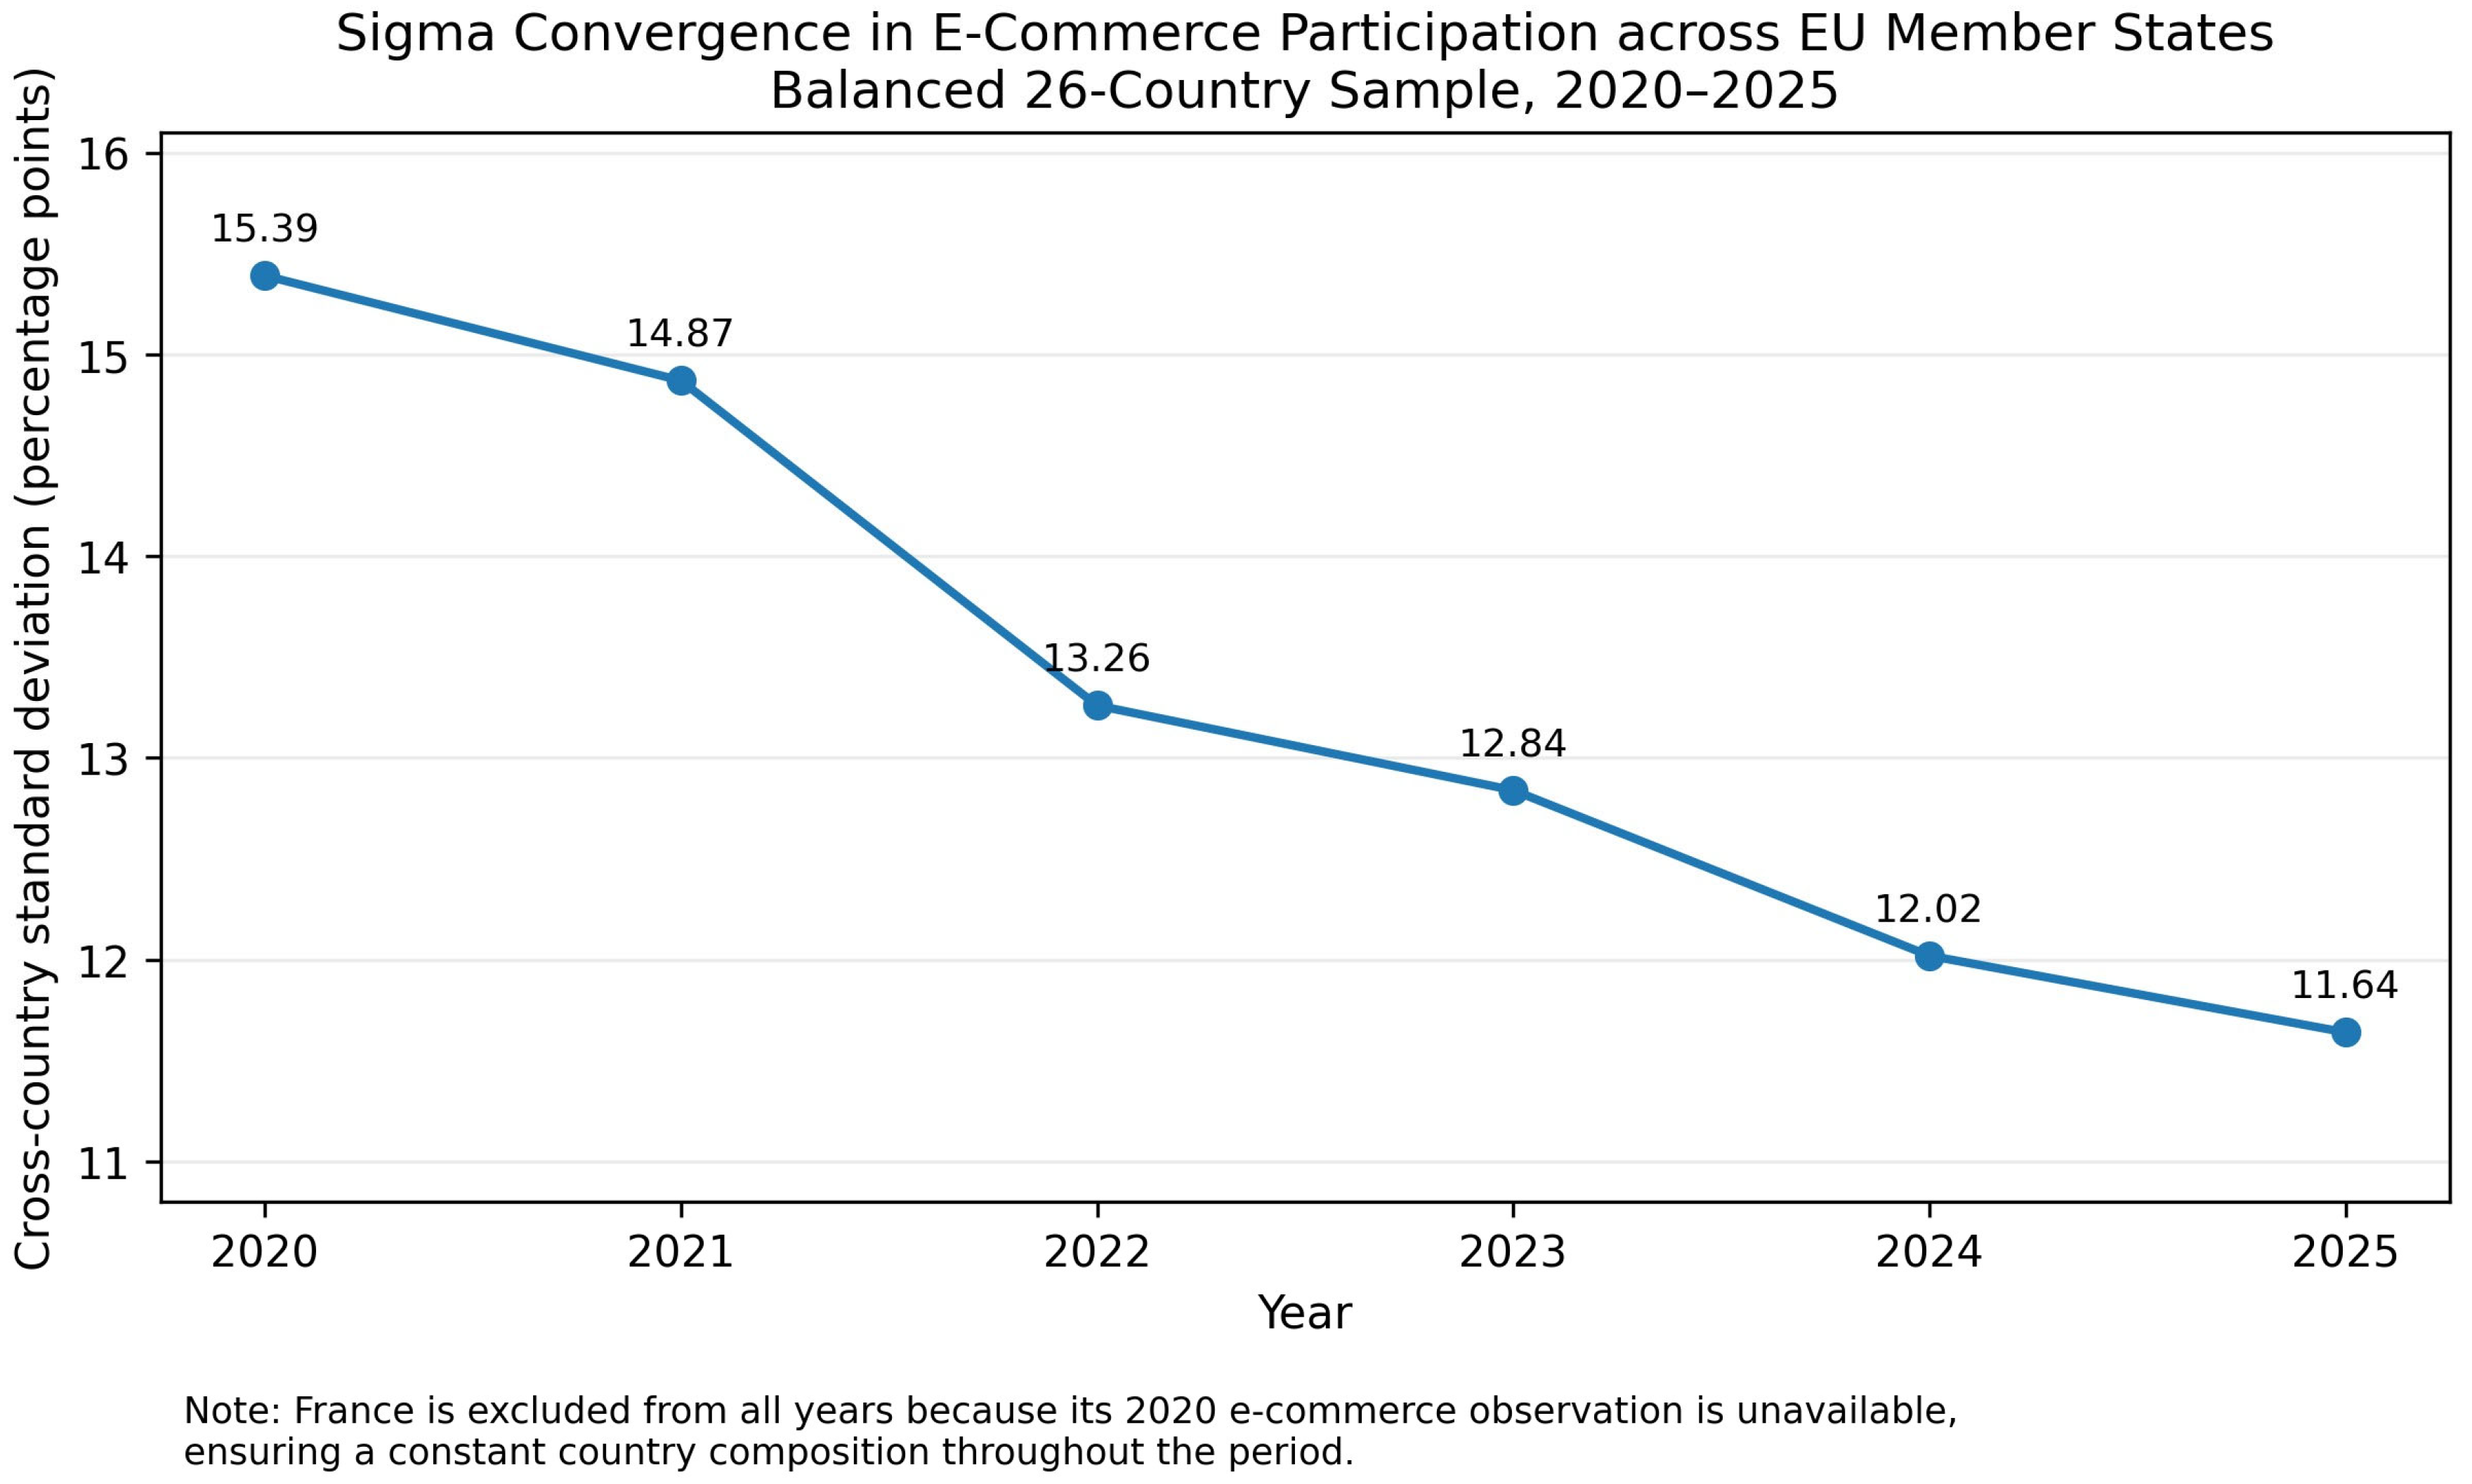
The same qualitative decline is observed when the comparison is restricted to 2021–2025, and all 27 Member States are included: the cross-country standard deviation falls from 14.68 to 11.49 percentage points and the coefficient of variation from 0.218 to 0.156. Together with the country-trajectory bootstrap results, these findings support H3a and provide statistically validated evidence consistent with short-run sigma convergence in the observed e-commerce participation indicator.
The conventional beta-convergence regression for all 27 Member States over 2021–2025 yields a negative coefficient on initial log e-commerce participation (β = −0.0998, HC1 SE = 0.0166, 95% CI = [−0.1340, −0.0656], p < 0.001; R2 = 0.719). Within this conventional log-growth specification, Member States with lower online-purchasing participation in 2021 subsequently experienced faster growth on average through 2025 (Table 9).
Table 9.
Robustness of beta-convergence estimates to alternative baselines and specifications.
Within the conventional log-growth formulation, the beta coefficient remains negative and statistically significant when the baseline year is shifted to 2020, 2022, or 2023, with estimates ranging from approximately −0.089 to −0.100. The sign and inference are therefore not driven solely by the 2021 starting year, although explanatory power declines as the growth horizon shortens.
The leave-one-country-out analysis provides an additional influence check. Re-estimating the 2021–2025 beta-convergence regression after sequentially excluding each Member State produces negative coefficients in all 27 cases, ranging from approximately −0.1047 to −0.0849, and all remain statistically significant. Romania has the largest Cook’s distance in the baseline regression, but excluding it yields β = −0.0849, which remains statistically significant at p < 0.001. At the opposite end of the coefficient range, excluding Ireland produces β = −0.1047, also statistically significant. The convergence estimate does not appear to be driven by a single Member State.
The annual panel robustness specification is consistent with the conventional cross-sectional result. Across 108 annual country–year transitions over 2021–2025, the coefficient on lagged log e-commerce participation is negative and statistically significant (β = −0.1295, country-clustered SE = 0.0279, 95% CI = [−0.1869, −0.0720], p < 0.001; R2 = 0.348). Given the short time dimension, this remains a short-run robustness check and not a dynamic long-run convergence model.
The ceiling-sensitive specifications materially qualify the conventional beta-convergence conclusion. When participation is transformed to the logit scale, the beta coefficient is −0.0198 (HC1 SE = 0.0245, 95% CI = [−0.0703, 0.0306], p = 0.426; R2 = 0.047). The headroom-adjusted specification is also statistically insignificant (β = −0.0000435, SE = 0.0005957, p = 0.942). Thus, conventional beta catch-up is not robust to explicit treatment of the bounded outcome, and H3b is therefore interpreted as conditionally supported; it does not provide robust evidence of beta convergence.
Figure 4.
Added-variable representation of household internet access in the preferred C3 specification. Note: Ecom and InternetAccess are residualized with respect to ICTspec, lnGDPpps, Urban, Tertiary, country fixed effects, and year fixed effects. The partial slope is 0.816, and the partial correlation is 0.426. Source: author calculations based on the model-ready dataset in Supplementary File.
5.6. Hypothesis and Exploratory Assessment
Table 10 summarizes the empirical assessment. H1 is supported for the contemporaneous within-country association: the InternetAccess coefficient remains positive under the principal contemporaneous robustness checks and in the first-difference model, but not in the one-year-lagged specifications. The exploratory ICTspec relationship is not statistically supported in either the main or post-break models and is not interpreted as a test of consumer digital skills. H2 is not robustly supported because the GDP coefficient is sensitive to specification and country-specific trends.
Table 10.
Summary of confirmatory hypotheses and the exploratory ICTspec relationship.
The convergence results require a distinction between the two concepts. H3a is supported by both the monotonic decline in dispersion and country-trajectory bootstrap uncertainty estimates. H3b receives only conditional support: conventional log-growth, alternative-baseline, influence, and annual-panel specifications indicate catch-up, but the coefficient becomes statistically insignificant under logit-transformed and headroom-adjusted ceiling sensitivities. The study therefore treats sigma convergence as the stronger convergence result and beta catch-up as specification-sensitive.
6. Conclusions and Policy Implications
This study evaluates within-country associations between selected dimensions of national digital readiness and e-commerce participation in the EU-27 during 2020–2025 and separately examines whether participation rates became less dispersed across Member States. The short pandemic-and-recovery window and aggregate country–year design require cautious interpretation, but the additional validation exercises clarify which results are stable and which depend on specification.
Household internet access provides the most stable structural result. In C3, a one-percentage-point increase in the national household internet-access rate is associated with approximately 0.82 percentage points higher national e-commerce participation. The association persists under country-specific trends, restricted wild-cluster bootstrap inference, fractional-response models, leave-one-country-out estimation, and first differences, but it is not statistically significant in the one-year-lagged models. ICT-specialist employment, treated as an exploratory indicator of digital-ecosystem capacity, remains statistically insignificant, including after restricting the analysis to the post-2021 measurement regime; H3 for GDP is likewise not robustly supported.
The convergence evidence is asymmetric. Sigma convergence is supported by the monotonic decline in the standard deviation and coefficient of variation and by country-trajectory bootstrap intervals that remain below zero. Conventional beta specifications indicate catch-up among lower-adoption countries, but this result becomes statistically insignificant when the bounded participation rate is addressed through logit and headroom adjustments. The strongest conclusion is therefore one of declining cross-country dispersion in e-commerce participation, accompanied by specification-sensitive evidence of beta catch-up and no claim of robust long-run convergence.
6.1. Policy Implications
The positive contemporaneous association between household internet access and online purchasing indicates that national access rates and e-commerce participation tend to move together within Member States, but it does not establish that expanding access alone would cause higher online purchasing. The variables have different underlying denominators, and InternetAccess measures basic connectivity without distinguishing speed, fiber availability, affordability, reliability, or territorial inequalities. Policy decisions on broadband deployment should therefore combine access indicators with more granular evidence on connection quality and the complementary conditions that enable digital-market participation.
The exploratory ICTspec result likewise does not support treating the national share of ICT specialists as a direct policy lever for consumer e-commerce participation. Specialized digital labor may contribute to productivity, innovation, cybersecurity, platform development, and broader digital inclusion, but the available economy-wide measure does not identify consumer skills or their causal effect on online purchasing. Future policy evaluation would benefit from independent consumer-skill measures combined with micro-level information on age, education, income, employment status, and territorial location [10,13,14,15].
The convergence evidence is most useful as a monitoring signal. Statistically validated sigma convergence indicates that national participation rates became less dispersed during the observed period, while the sensitivity of conventional beta catch-up to ceiling adjustments cautions against attributing this narrowing to a single mechanism. For lower-adoption Member States, the literature supports a coordinated policy mix involving access, payment infrastructure [27], trust and transaction security [23,24], logistics [25], institutional conditions [26], consumer protection, and digital capability. EU monitoring frameworks would also benefit from harmonized annual indicators of broadband quality and affordability, independent consumer digital skills, digital-payment access, logistics performance, and online trust.
6.2. Limitations and Future Research
Several limitations define the scope of the conclusions. First, the 2020–2025 observation window is short and begins with the COVID-19 shock. Comparable indicators do not permit a consistent longer pre-pandemic design, so the analysis cannot identify a structural break relative to a common pre-COVID baseline or determine whether the observed changes represent permanent long-run shifts. The convergence results therefore concern short-run developments within a pandemic-and-recovery period.
Second, the indicators are aggregate and imperfect representations of the underlying mechanisms. Household internet access is near saturation, does not measure connection quality or affordability, and is reported for households while Ecom is reported for individuals aged 16–74. In addition, the annual indicators are not perfectly synchronized: Ecom refers to purchases during the previous 12 months, InternetAccess reflects household connectivity around the household ICT survey reference period, and ICTspec is derived from annual Labor Force Survey data. Same-year measures can therefore contain partially overlapping reference windows, while a one-year shift does not guarantee an exact twelve-month separation. The first-difference and added-variable analyses characterize the available variation but do not resolve these aggregation and timing limitations.
Third, ICT-specialist employment is an economy-wide labor-market indicator and does not directly measure consumer digital capability. Its statistically insignificant coefficient remains unchanged in the post-break 2021–2024 sensitivity analysis, but this result concerns the specific proxy and should not be generalized to consumer digital skills or human capital. The overall Eurostat Digital Skills Indicator is excluded because of construct overlap with online purchasing and methodological comparability concerns. Future research should prioritize independent consumer-level skill measures and microdata that can align digital capability, access quality, trust, payment access, and purchasing behavior at compatible observational levels.
Fourth, fixed effects, country-specific trends, first differences, fractional-response models, small-cluster procedures, and influence diagnostics improve specification robustness but do not provide causal identification. Reverse causality and time-varying omitted factors—including payments, logistics, trust, consumer protection, platform availability, regulation, and prices—remain plausible. Statistical inference is also based on only 27 country clusters and a short time dimension. Future work could exploit infrastructure rollouts, regulatory changes, policy discontinuities, longer panels, or other quasi-experimental designs to strengthen identification.
Finally, convergence inference remains specific to the observed behavioral indicator. Country-trajectory bootstrap results strengthen the sigma-convergence conclusion, but declining e-commerce dispersion does not imply convergence in internet quality, digital skills, income, or institutional capacity. The conventional beta result is sensitive to ceiling-adjusted specifications, and regression-to-the-mean cannot be fully excluded. Longer panels could distinguish temporary catch-up from persistent convergence and permit alternative approaches such as heterogeneous-slope or club-convergence models. The analytical framework is also suitable for external validation beyond the EU-27; future collaborative research could apply the methodology to other country groups, regional integration areas, and longer observation periods to assess whether the relationships identified here are preserved across different institutional and digital-development contexts. The author welcomes collaborative replication and methodological extension of the framework to alternative country settings.
6.3. Final Remarks
Overall, the study identifies a robust contemporaneous association between national household internet access and e-commerce participation, while the exploratory ICT-specialist indicator and GDP do not show comparably stable short-run relationships. Cross-country dispersion in e-commerce participation decreases significantly over the observed period, providing the strongest convergence result. Conventional beta catch-up is visible but becomes specification-sensitive once the upper bound of the participation rate is addressed. These findings support continued analysis of digital access as one component of market participation while emphasizing the need for better-aligned measures of consumer capability, connection quality, payments, logistics, trust, and institutional conditions.
Supplementary Materials
The following supporting information can be downloaded at https://www.mdpi.com/article/10.3390/jtaer21090317/s1. Supplementary File S1 contains the cleaned analytical datasets, data dictionary, source and measurement specifications, sample-construction and transformation procedures, country classifications, article tables and figure source data, and the complete numerical robustness, diagnostic, and convergence results.
Funding
This research received no external funding.
Institutional Review Board Statement
Not applicable.
Informed Consent Statement
Not applicable.
Data Availability Statement
The data and replication code for this study are publicly available in the Supplementary File S1 associated with this article. No missing observations were interpolated, extrapolated, or imputed.
Acknowledgments
During the preparation of this manuscript, the author used OpenAI (GPT-5.6) for language editing and assistance in checking the presentation of the results. The author reviewed all AI-assisted output and takes full responsibility for the content of the publication.
Conflicts of Interest
The author declares no conflicts of interest.
References
- Alcedo, J.; Cavallo, A.; Mishra, P.; Spilimbergo, A. Back to Trend: COVID Effects on E-Commerce in 44 Countries. J. Macroecon. 2025, 85, 103682. [Google Scholar] [CrossRef] [Scilit]
- Genc, I.H.; Arzaghi, M. Did the COVID-19 pandemic permanently impact e-commerce in the US market? Mod. Financ. 2024, 2, 18–30. [Google Scholar] [CrossRef] [Scilit]
- Adomaviciute-Sakalauske, K.; Urbonavicius, S. Understanding online purchasing behaviour after COVID-19: An extended technology acceptance model with motivations learnt from the pandemic. Cogent Bus. Manag. 2024, 11, 2433169. [Google Scholar] [CrossRef] [Scilit]
- Jajić, I.; Pejić Bach, M.; Herceg, T. The COVID-19 Influence on the European Countries’ E-Commerce: Case of Online Consumer Electronics across Generations X and Y Using Fuzzy C-Means Cluster. Procedia Comput. Sci. 2025, 256, 206–213. [Google Scholar] [CrossRef] [Scilit]
- Bucevska, V.; Bucevska, J. E-Commerce and Factors Affecting Its Development: Empirical Evidence from Europe. Ekon. Pregl. 2025, 76, 210–224. [Google Scholar] [CrossRef] [Scilit]
- Bădîrcea, R.M.; Manta, A.G.; Florea, N.M.; Popescu, J.; Manta, F.L.; Puiu, S. E-Commerce and the Factors Affecting Its Development in the Age of Digital Technology: Empirical Evidence at EU–27 Level. Sustainability 2022, 14, 101. [Google Scholar] [CrossRef] [Scilit]
- Bălăcescu, A.; Pătrașcu, A.; Tănăsescu, A. Analysis of Disparities in Internet Purchases by Individuals at the EU State Level. Electronics 2023, 12, 982. [Google Scholar] [CrossRef] [Scilit]
- Cepoi, C.-O.; Ciumara, T. Explaining Online Purchases in the European Union: A Country-Level Perspective. J. Financ. Monet. Econ. 2025, 13, 184–190. [Google Scholar] [CrossRef] [Scilit]
- Gogonea, R.M.; Moraru, L.C.; Bodislav, D.A.; Păunescu, L.M.; Vlăsceanu, C.F. Similarities and Disparities of e-Commerce in the European Union in the Post-Pandemic Period. J. Theor. Appl. Electron. Commer. Res. 2024, 19, 340–361. [Google Scholar] [CrossRef] [Scilit]
- Gomes, A.; Dias, J.G. Digital Divide in the European Union: A Typology of EU Citizens. Soc. Indic. Res. 2025, 176, 149–172. [Google Scholar] [CrossRef] [Scilit]
- Davis, F.D. Perceived Usefulness, Perceived Ease of Use, and User Acceptance of Information Technology. MIS Q. 1989, 13, 319–340. [Google Scholar] [CrossRef] [Scilit]
- Venkatesh, V.; Morris, M.G.; Davis, G.B.; Davis, F.D. User Acceptance of Information Technology: Toward a Unified View. MIS Q. 2003, 27, 425–478. [Google Scholar] [CrossRef] [Scilit]
- Pérez-Amaral, T.; Valarezo, A.; López, R.; Garín-Muñoz, T. Digital Divides across Consumers of Internet Services in Spain Using Panel Data 2007–2019. Narrowing or Not? Telecommun. Policy 2021, 45, 102093. [Google Scholar] [CrossRef] [Scilit]
- Lythreatis, S.; Singh, S.K.; El-Kassar, A.-N. The Digital Divide: A Review and Future Research Agenda. Technol. Forecast. Soc. Change 2022, 175, 121359. [Google Scholar] [CrossRef] [Scilit]
- Dong, Z.; Lin, H.; Li, S. The impact of the second-level digital divide on residents’ consumption. Humanit. Soc. Sci. Commun. 2025, 12, 1938. [Google Scholar] [CrossRef] [Scilit]
- van Dijk, J.A.G.M. Digital Divide Research, Achievements and Shortcomings. Poetics 2006, 34, 221–235. [Google Scholar] [CrossRef] [Scilit]
- van Deursen, A.J.; van Dijk, J.A. The digital divide shifts to differences in usage. New Media Soc. 2014, 16, 507–526. [Google Scholar] [CrossRef] [Scilit]
- Kiiski, S.; Pohjola, M. Cross-Country Diffusion of the Internet. Inf. Econ. Policy 2002, 14, 297–310. [Google Scholar] [CrossRef] [Scilit]
- Billon, M.; Marco, R.; Lera-Lopez, F. Disparities in ICT Adoption: A Multidimensional Approach to Study the Cross-Country Digital Divide. Telecommun. Policy 2009, 33, 596–610. [Google Scholar] [CrossRef] [Scilit]
- Vicente, M.R.; López, A.J. Assessing the Regional Digital Divide across the European Union-27. Telecommun. Policy 2011, 35, 220–237. [Google Scholar] [CrossRef] [Scilit]
- Paun, C.; Ivascu, C.; Olteteanu, A.; Dantis, D. The Main Drivers of E-Commerce Adoption: A Global Panel Data Analysis. J. Theor. Appl. Electron. Commer. Res. 2024, 19, 2198–2217. [Google Scholar] [CrossRef] [Scilit]
- Falk, M.; Hagsten, E. E-Commerce Trends and Impacts across Europe. Int. J. Prod. Econ. 2015, 170, 357–369. [Google Scholar] [CrossRef] [Scilit]
- Hendricks, S.; Mwapwele, S.D. A Systematic Literature Review on the Factors Influencing E-Commerce Adoption in Developing Countries. Data Inf. Manag. 2024, 8, 100045. [Google Scholar] [CrossRef] [Scilit]
- Handoyo, S. Purchasing in the Digital Age: A Meta-Analytical Perspective on Trust, Risk, Security, and e-WOM in E-Commerce. Heliyon 2024, 10, 29714. [Google Scholar] [CrossRef] [Scilit]
- Kim, T.Y.; Dekker, R.; Heij, C. Cross-Border Electronic Commerce: Distance Effects and Express Delivery in European Union Markets. Int. J. Electron. Commer. 2017, 21, 184–218. [Google Scholar] [CrossRef] [Scilit]
- Lee, H.S.; Yalcinkaya, G.; Griffith, D.A. Examining the relationship of country-level digital ad spend and cross-border e-commerce buyers under cultural and political globalization. Int. Mark. Rev. 2024, 41, 1102–1117. [Google Scholar] [CrossRef] [Scilit]
- Păun, C.A.; Păun, N.; Păun, D. Digital Payment Infrastructure and E-Commerce Adoption in Central and Eastern Europe: A Panel Data Analysis. J. Theor. Appl. Electron. Commer. Res. 2026, 21, 152. [Google Scholar] [CrossRef] [Scilit]
- Eurostat. ICT Usage in Households and by Individuals (isoc_i): Statistical Metadata; European Commission: Luxembourg, 2025; Available online: https://ec.europa.eu/eurostat/cache/metadata/en/isoc_i_esms.htm (accessed on 20 August 2026).
- Eurostat. Individuals’ Level of Digital Skills (from 2021 Onwards) (isoc_sk_dskl_i21): Statistical Metadata; European Commission: Luxembourg, 2025; Available online: https://ec.europa.eu/eurostat/cache/metadata/en/isoc_sk_dskl_i21_esmsip2.htm (accessed on 20 August 2026).
- Eurostat. ICT Specialists in Employment (isoc_skslf): Statistical Metadata; European Commission: Luxembourg, 2026; Available online: https://ec.europa.eu/eurostat/cache/metadata/en/isoc_skslf_esms.htm (accessed on 20 August 2026).
- Barro, R.J.; Sala-i-Martin, X. Convergence. J. Political Econ. 1992, 100, 223–251. [Google Scholar] [CrossRef] [Scilit]
- Sala-i-Martin, X.X. The Classical Approach to Convergence Analysis. Econ. J. 1996, 106, 1019–1036. [Google Scholar] [CrossRef] [Scilit]
- World Bank. Urban Population (% of Total Population) (SP.URB.TOTL.IN.ZS), World Development Indicators. Available online: https://data.worldbank.org/indicator/SP.URB.TOTL.IN.ZS (accessed on 20 August 2026).
- Cameron, A.C.; Gelbach, J.B.; Miller, D.L. Bootstrap-Based Improvements for Inference with Clustered Errors. Rev. Econ. Stat. 2008, 90, 414–427. [Google Scholar] [CrossRef] [Scilit]
- Mundlak, Y. On the Pooling of Time Series and Cross Section Data. Econometrica 1978, 46, 69–85. [Google Scholar] [CrossRef] [Scilit]
- Papke, L.E.; Wooldridge, J.M. Panel Data Methods for Fractional Response Variables with an Application to Test Pass Rates. J. Econom. 2008, 145, 121–133. [Google Scholar] [CrossRef] [Scilit]
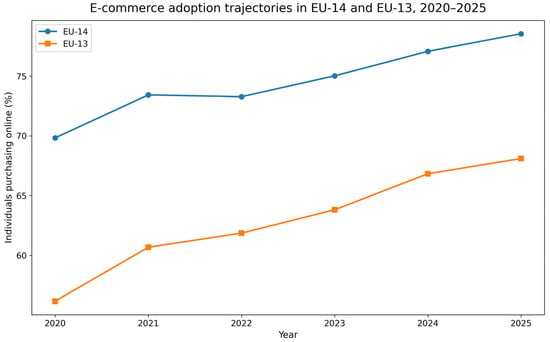
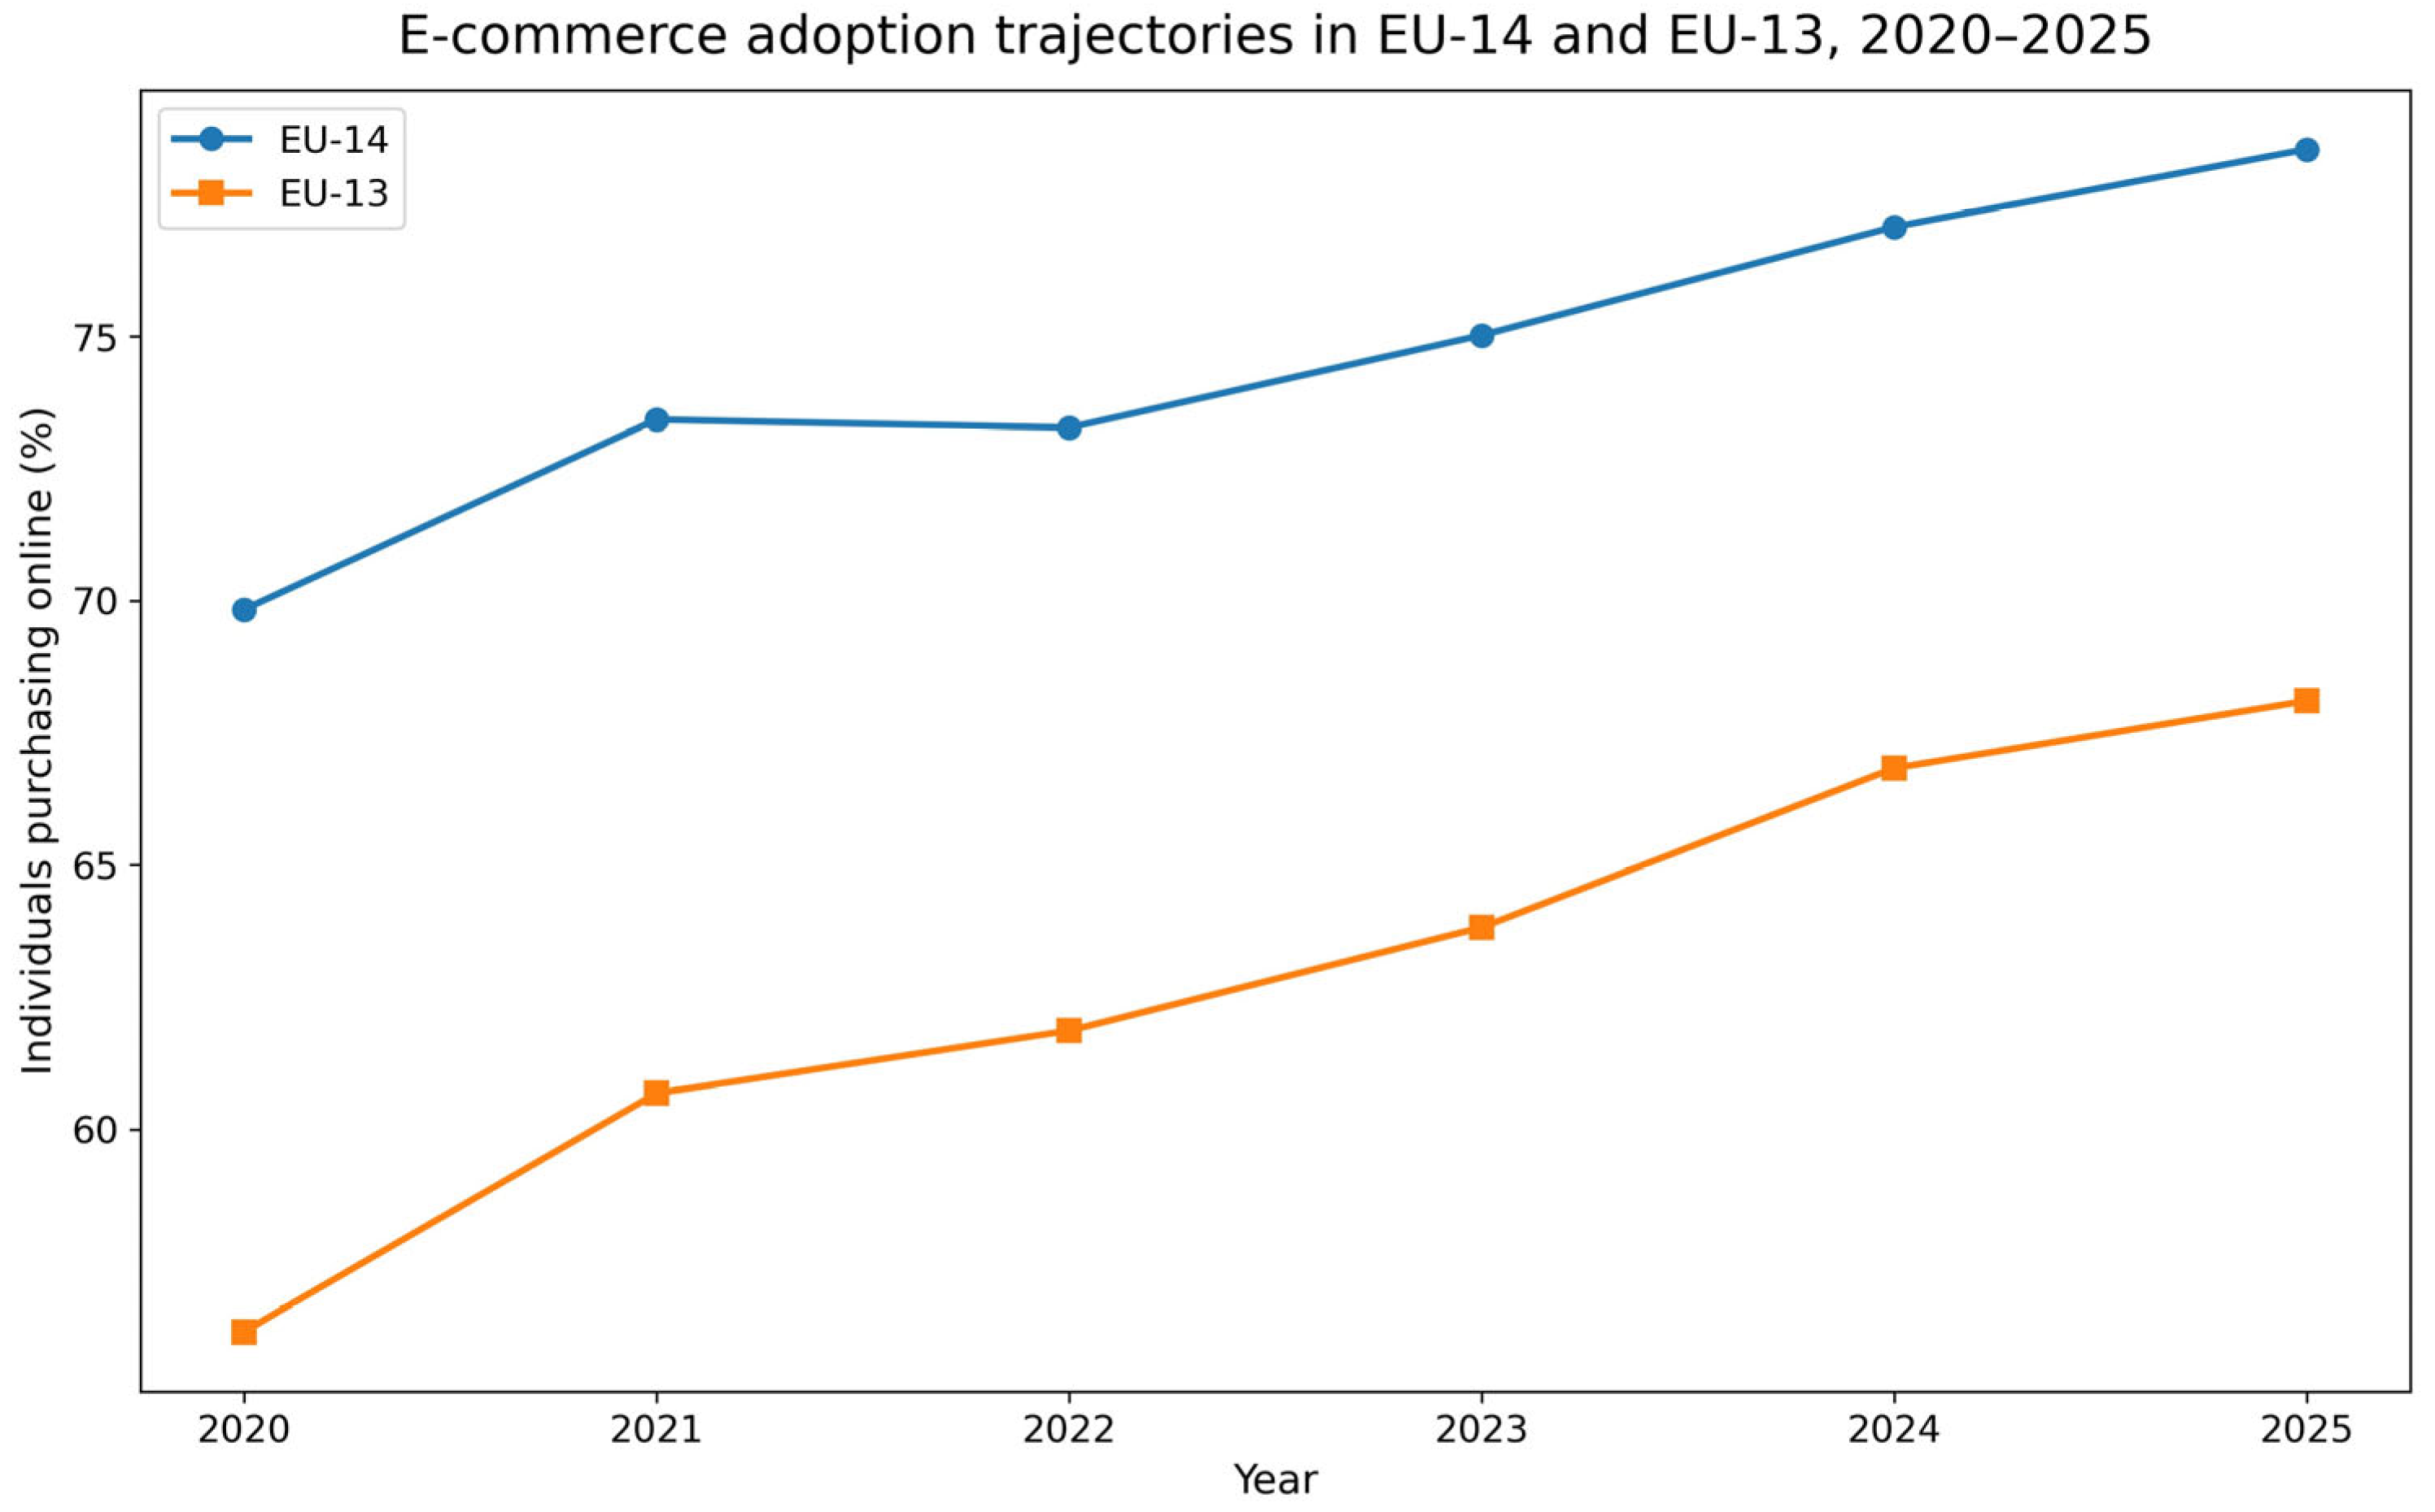
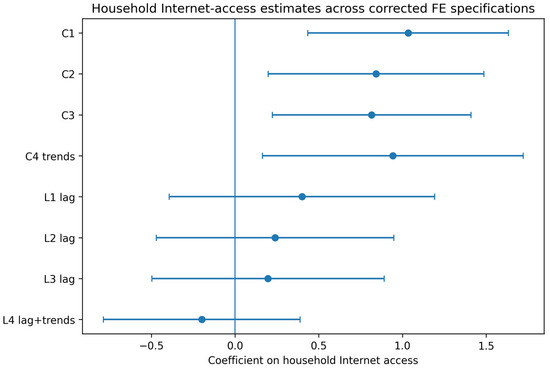
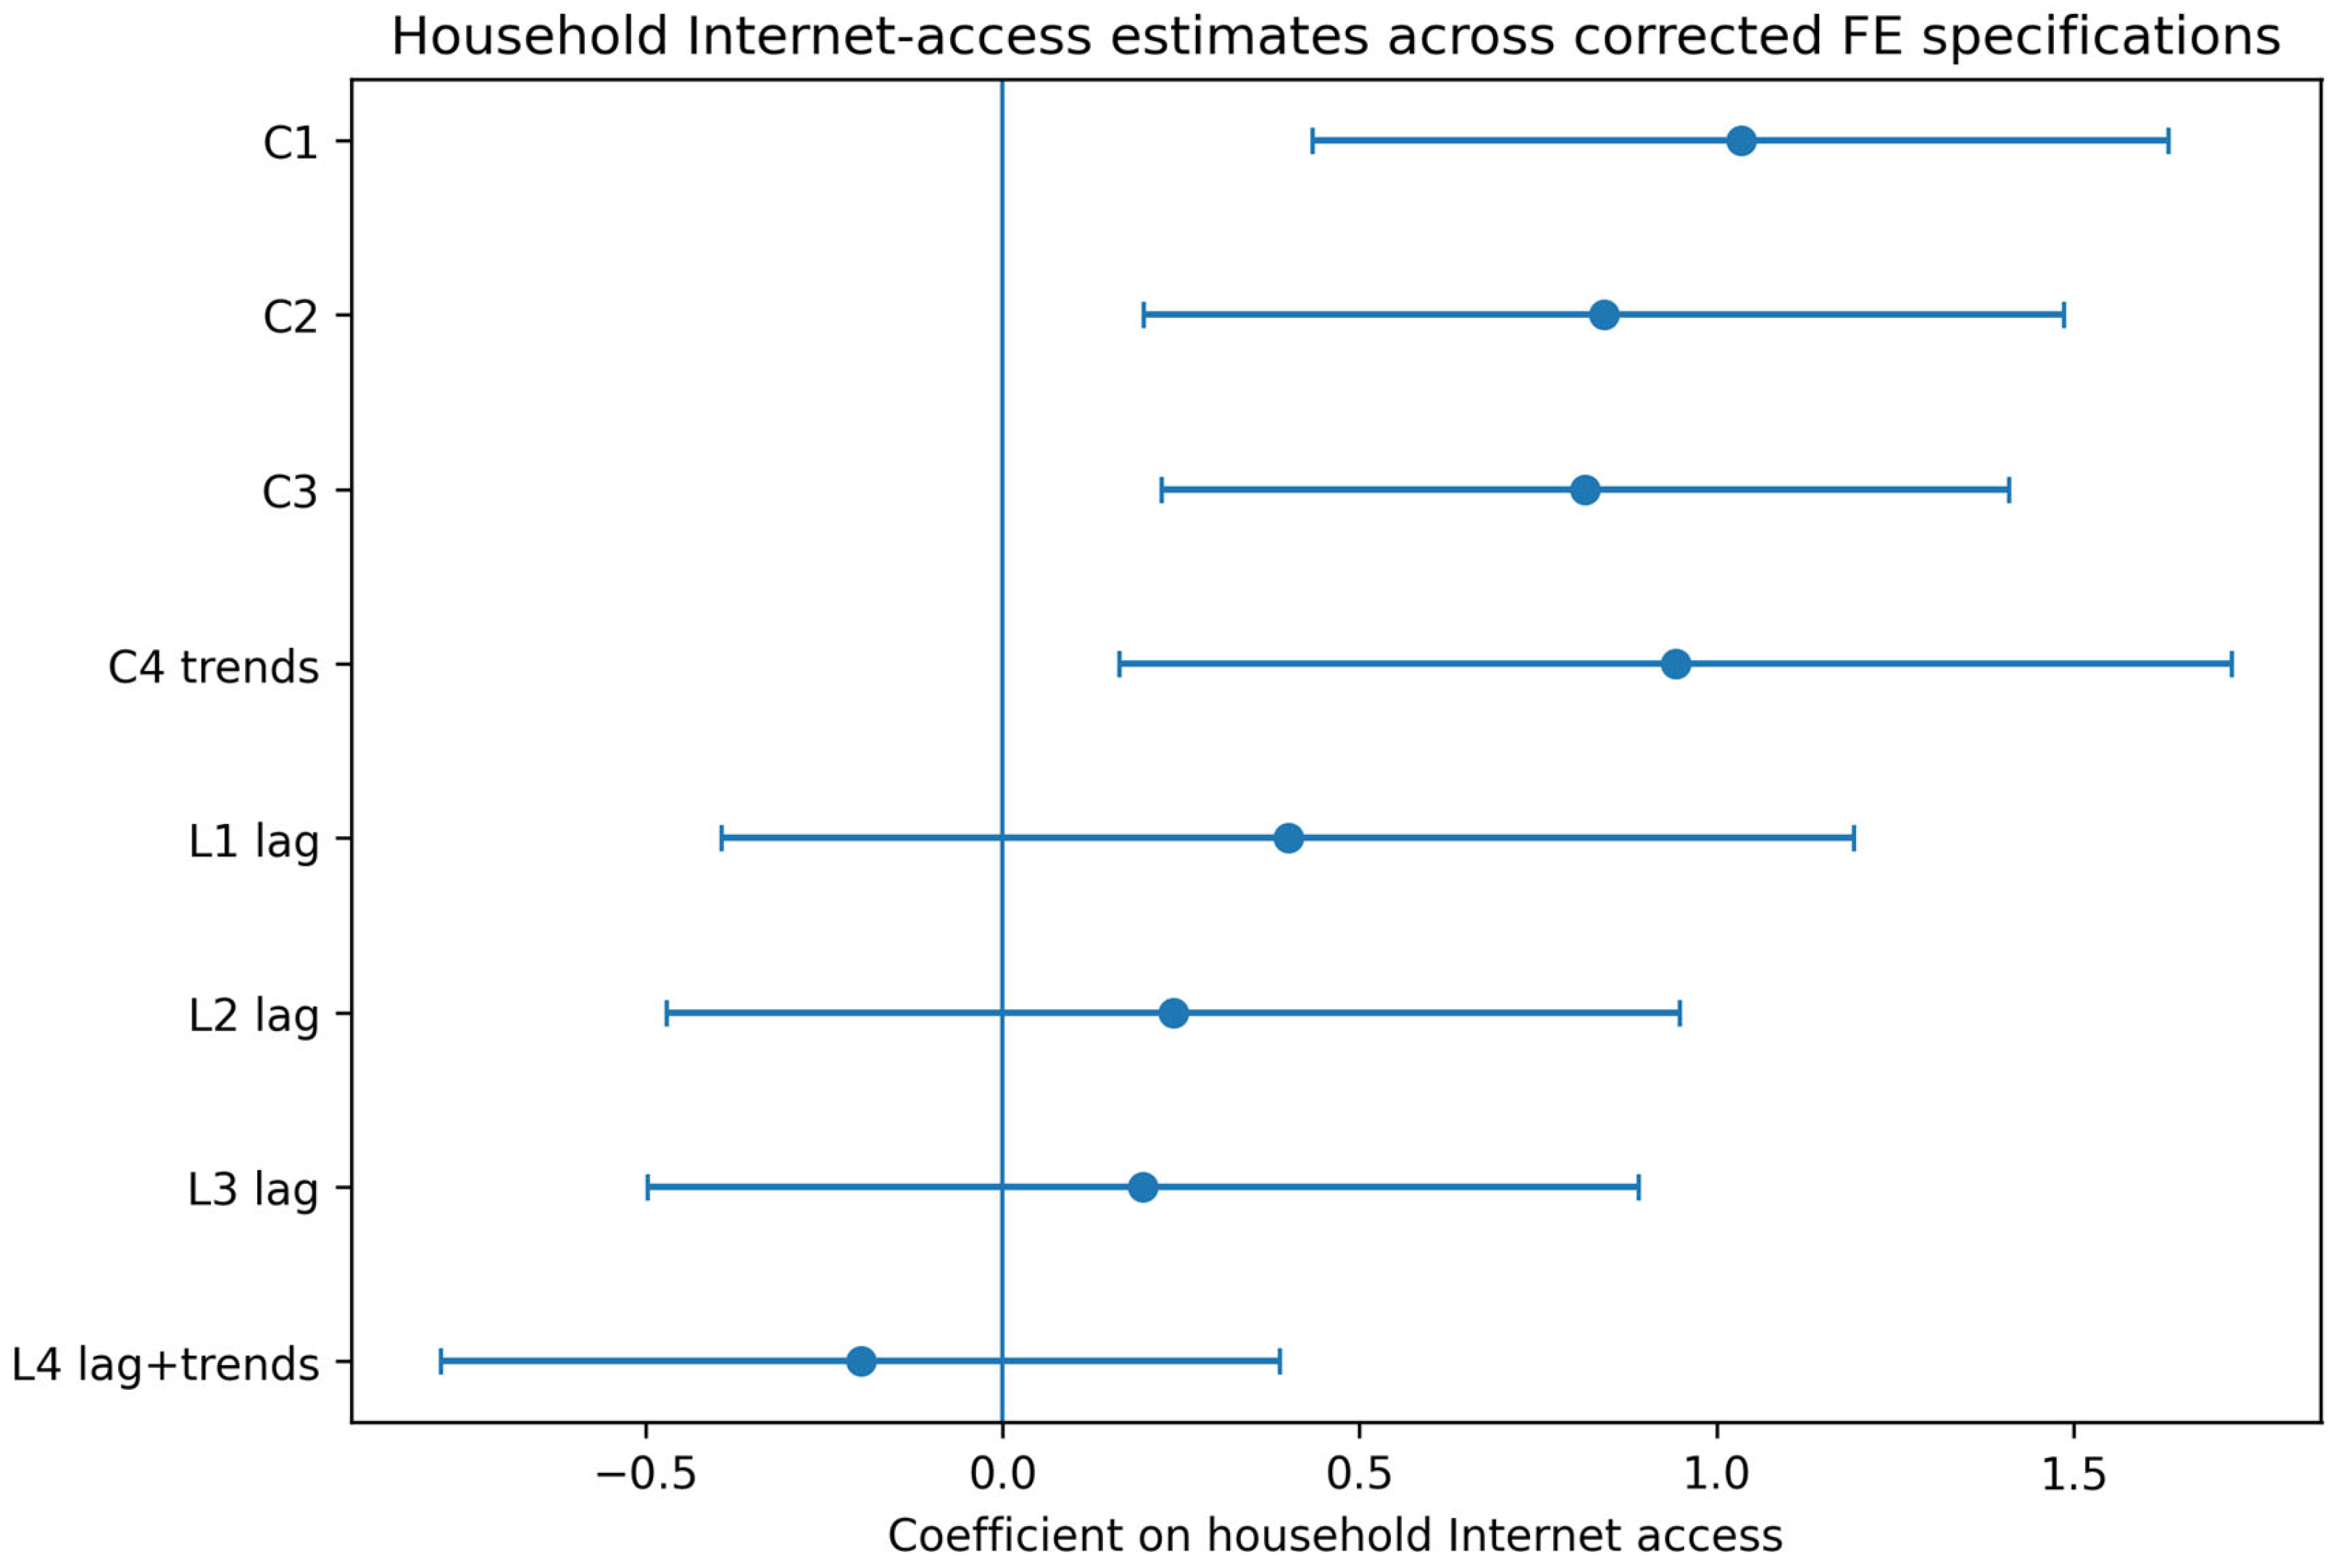

Disclaimer/Publisher’s Note: The statements, opinions and data contained in all publications are solely those of the individual author(s) and contributor(s) and not of MDPI and/or the editor(s). MDPI and/or the editor(s) disclaim responsibility for any injury to people or property resulting from any ideas, methods, instructions or products referred to in the content. |
© 2026 by the author. Licensee MDPI, Basel, Switzerland. This article is an open access article distributed under the terms and conditions of the Creative Commons Attribution (CC BY) license.