


Abstract
While Augmented Reality (AR) places a product visually and spatially inside the consumer’s own environment, it cannot deliver touch. The more faithfully AR renders an object, the more conspicuous its missing tactile channel becomes. We term this the reality–virtuality paradox, and it sits outside the prevailing account in interactive marketing, which has largely equated richer immersion with more favorable consumer response. In this study, we develop and test a chain mediation model explaining how AR, relative to 2D, 3D, or VR interfaces, elicits compensatory behaviors sequentially through perceived haptic gap and haptic craving. Study 1 (N = 80, AR vs. 2D), together with a same-device replication (Study 1b, N = 60), confirms the main effect of AR on compensatory behaviors. Study 2 (N = 228, AR vs. 3D) documents the chain mediation and the moderating effect of need for touch (NFT). Study 3 (N = 160, AR vs. VR × low vs. high haptic accessibility) establishes the moderating effect of haptic accessibility and extends the effect to a cross-context tactile-relevant choice. AR elicits stronger compensatory behaviors than 2D, 3D, and VR; the effect is sequentially mediated by perceived haptic gap and haptic craving; and it is stronger for high-NFT consumers and under low-haptic-accessibility conditions. We identify a perceptual cost that rises with visual fidelity, extend compensatory consumption from resource scarcity to sensory scarcity, and specify the individual and situational conditions under which the paradox binds most tightly.
1. Introduction
The global Augmented Reality (AR) market reached USD 140 billion in 2025 [1], with major applications in furniture, cosmetics, automotive showrooms, and location-based games [2,3,4]. The next phase is already in motion: Apple’s Vision Pro, Meta’s Ray-Ban smart glasses, and a broader spatial-computing stack are driving immersive AR interfaces as the default channels for consumer interaction [5]. Unlike Virtual Reality (VR), which simulates physical surroundings in a digital environment, AR overlays digital information directly onto a live physical view and allows consumers to interact with both the physical and digital components simultaneously [6]. AR interfaces elevate vividness and perceived diagnosticity, leading to lower mental imagery load [7], higher perceived value [8], and higher purchase intention compared with two-dimensional interfaces [9,10,11,12,13].
However, the interaction between visual richness and the absence of sensory input is becoming increasingly important in AR interfaces [14,15,16]. Although the AR interface’s visual and spatial channels can signal when a product is within reach, the system cannot deliver tactile feedback. While conventional e-commerce shoppers are not expecting to touch or rely on textual proxies [17], AR shoppers may experience escalated levels of cross-sensory conflict. The fidelity of AR’s visual rendering raises the expectation of touch to a higher level where its absence becomes critical for decision-making. Physical touch and even vicarious observations of touch shape psychological ownership, purchase confidence, and willingness to pay during shopping [18,19,20,21]. The enhanced visual realism and sense of spatial presence reflect that the digital components in AR remain intangible. Such a lack of physical touch creates a reality–virtuality paradox for AR.
This paradox matters precisely because AR is not a frictionless technology. Commercial AR deployment carries substantial costs and constraints: bespoke three-dimensional assets are expensive to model and maintain; integration with existing catalogue and commerce systems is technically demanding; and rendering quality remains uneven across the installed base of consumer devices. Adoption is further constrained on the demand side: camera access and spatial scanning raise privacy concerns that make a portion of shoppers unwilling to grant permissions; engagement with AR campaigns often decays once novelty fades; returns on investment are difficult to attribute; and using heightened perceptual realism to shape judgement raises its own ethical questions [15,22]. These frictions make it more, not less, important to understand what AR actually does for consumers once it is deployed, including effects that run counter to the benefits that it is meant to provide.
In this study, our aim is to examine the unique sense of missed touch in AR (a perceived gap between what users can see and what they can physically feel) that differs from the traditional sensory interactions in 2D, 3D, or VR online shopping experiences. To address this question, we draw on construal-level theory [23], embodied cognition [24], expectation disconfirmation theory [25], and compensatory consumption research [26] to build a theoretical framework. We argue that, compared with 2D, 3D, or VR interfaces, AR creates a perceived haptic gap (PHG) that intensifies haptic craving (HC), which in turn motivates compensatory behaviors and information reliance.
Accordingly, our research addresses two questions: First, does AR, relative to less immersive or differently immersive interfaces, elicit stronger compensatory behaviors, and through what psychological mechanism? Second, for whom and under what situational conditions is that effect strongest? We pursue three objectives: to articulate and test the reality–virtuality paradox as a property of high-fidelity visual interfaces; to identify the sequential mechanism through which the paradox translates into behavior; and to establish its individual and situational boundary conditions.
The study makes three contributions: First, it identifies a perceptual cost that rises with visual fidelity, qualifying the prevailing assumption in interactive marketing that richer sensory simulation yields uniformly more favorable consumer responses. Second, it extends compensatory consumption research beyond resource scarcity to sensory scarcity, showing that an unmet perceptual expectation, rather than a threatened self-resource, is sufficient to motivate compensatory behavior, and that the compensation is enacted through adaptive information-seeking rather than intra-domain substitution. Third, it specifies when the paradox binds most tightly, identifying the need for touch as an individual-level boundary and situational haptic accessibility as a contextual one, and demonstrating that the resulting compensatory state transfers to an unrelated tactile-relevant choice.
2. Theoretical Background and Hypotheses
2.1. The Reality–Virtuality Paradox: AR Interfaces and Compensatory Behaviors
AR interfaces differ from 2D, 3D, and fully immersive VR in the spatial relationship between the rendered object and consumers’ physical surroundings [2,6]. While 2D images and interactive 3D models live on screen as objects in a symbolic frame and VR draws users into a self-contained synthetic world [9,27], AR superimposes virtual content onto users’ actual space, producing a hybrid in which the virtual and the physical coexist side by side [2,11]. This co-location creates a distinctive mixed reality (MR).
Mixed reality blends virtual and physical content into one space in which users manipulate digital objects alongside physical ones with reciprocal spatial affordances [5]. Visual rendering reaches consumers’ actual space and signals proximity without giving the tactile system anything to act on. When using 2D, 3D, or VR interfaces, consumers tend to relax their haptic expectations due to a lack of physical-world interaction [9], whereas, in MR, co-located physical surrogates supply some of the tactile feedback that the digital objects lack. Thus, visual realism and tactile absence collide directly in AR interfaces.
According to construal-level theory [23], psychological distance determines whether an object is construed abstractly or concretely. The more proximate the object is, the more concretely it is represented, and the more likely that its material and action-relevant attributes become the focus. Because AR places virtual products at a reduced psychological distance by making them appear in mixed reality, it produces a more concrete product representation and activates attention to attributes normally reserved for real-world objects, such as weight and texture. Thus, virtual products in AR tend to trigger “action-preparation circuitry”, which is the mental process of preparing for execution [24,28,29]. When a rendered product appears to be within reach, a desire to interact with it can be expected in AR.
Nonetheless, AR interfaces cannot deliver tactile feedback. In 2D, 3D, or immersive VR environments, consumers tend to relax their haptic expectations, knowing they are in a fully virtual platform [9]. In comparison, the desire to interact and the absence of touch in AR create the reality–virtuality paradox, resulting in psychological deficits. These psychological deficits motivate goal-oriented responses aimed at restoring what is missing [26,30,31]. Consequently, AR’s activated and unfulfilled haptic expectation tends to motivate compensatory behaviors.
H1.
Interaction with a product via an AR interface elicits stronger compensatory behaviors than interaction via a 2D, 3D, or VR interface.
2.2. Perceived Haptic Gap and Haptic Craving as Psychological Mechanisms
Perceived haptic gap: Building on the finding of Citrin, Stem, Spangenberg, and Clark [17] that shoppers experience a subjective sense of deprivation when they cannot physically touch products, we define perceived haptic gap as consumers’ awareness that a visually presented product cannot be touched in AR. Consumers encounter rich visual cues in AR that make them feel that the product is within reach, while online shoppers know not to rely on textual proxies [32]. The visual rendering creates a touch expectation that the tactile channel cannot fulfill, producing cognitive dissonance between the two sensory modalities [33]. Thus, the perceived haptic gap reflects expectation disconfirmation [25].
Haptic craving: Because the perceived haptic gap is a cognitive appraisal, we further define haptic craving as the desire to reduce the perceived haptic gap through tactile contact or tactile-relevant information-seeking. Previous research has shown that unmet touch expectations can influence psychological ownership, purchase confidence, and willingness to pay [21,34,35]. When physical touch is unattainable, consumers tend to engage in compensatory psychological simulation and imagine the tactile experience as a vicarious substitute for direct contact [19,36,37]. Consistent with this, supplying even partial haptic input in a digital retail setting strengthens the link between immersion and purchase intention [38], and multisensory affordances have been shown to offset the psychological shortfalls that otherwise attend purely virtual offerings [39]. Both findings imply that this shortfall is real and that consumers act to close it.
Krishna [18] argued that consumers continuously compare information across their sensory channels, and when one sensory channel creates expectations that another channel cannot satisfy, the mismatches can shape judgments, choices, and substitution decisions. Regarding multisensory online experiences, Petit, Velasco, and Spence [40] showed that visual cues prime expectations across modalities even in the absence of the corresponding physical cue. In view of the reality–virtuality paradox, AR’s visual channel over-delivers on high spatial fidelity and high realism while its tactile channel is unable to provide corresponding feedback, and the resulting mismatch via the perceived haptic gap and haptic craving leads to compensatory behaviors. Sequentially, AR activates the perceived haptic gap, which is the cognitive appraisal that elicits haptic craving; in turn, haptic craving motivates compensatory behaviors.
H2.
The effect of AR (vs. 2D, 3D, or VR) on compensatory behaviors is sequentially mediated by the perceived haptic gap and haptic craving.
2.3. Individual-Level Boundary: Need for Touch
According to Peck and Childers [20], consumers differ in their perceived importance of tactile information. Consumers with a high need for touch (NFT) prefer to acquire product information through the haptic channel, while consumers with a low NFT do not habitually touch products before purchase. NFT influences buying behaviors, including product evaluation, purchase confidence, and impulse response [41,42].
Joy and Sherry [43] found that, during multisensory encounters, high-tactility consumers respond to haptic deprivation with extended information-seeking relative to low-tactility consumers. The reality–virtuality paradox may have a greater impact on high-NFT consumers whose information processing relies on tactile attributes. When AR presents a product with spatial fidelity, high-NFT consumers are more likely to raise touch expectations, widening the gap between visual invitation and tactile denial. Because tactile information is critical in their evaluation process, the absence of touch triggers stronger compensatory responses. We therefore propose a moderated chain mediation effect of NFT: for consumers with higher NFT, an AR shopping experience should yield a larger perceived haptic gap, a stronger haptic craving, and a stronger compensatory response in sequence than for consumers with lower NFT.
H3.
Need for touch positively moderates the chain-mediating path, such that the indirect effect of AR (vs. 2D, 3D, or VR) on compensatory behaviors, via the perceived haptic gap and haptic craving, is stronger for consumers with a higher (vs. lower) need for touch.
2.4. Situational Boundary: Haptic Accessibility
We further identify a situational condition for the effects on compensatory behaviors. Haptic accessibility is defined as the degree to which consumers are permitted to perform touch-related movements (such as reaching, stroking, and grasping) on the channel interface. Psychological reactance theory holds that discouraged behaviors can intensify the motivation to perform them [44,45]. When a desired action is blocked, the resulting tension can increase the motivation to perform that action [46,47]. Under low haptic accessibility, touch-related actions are discouraged or physically constrained, intensifying AR-activated haptic craving, while under high haptic accessibility, touch-related actions are permitted even without tactile contact, attenuating compensatory responses.
Although neither is equipped with real haptic feedback, AR’s visual–spatial co-location with real objects makes it more desirable for potential haptic actions than VR’s fully synthetic space. This asymmetry is consistent with recent evidence that AR and VR operate through distinct forms of presence (local presence for AR, telepresence for VR) and therefore shape beliefs and behavioral intentions through different routes rather than differing only in degree of immersion [48]. When haptic accessibility is low, AR is more likely to induce compensatory behaviors, such as information-seeking from product reviews describing texture and feel, as a substitute for the blocked tactile input [49]. We therefore propose a moderated chain mediation effect of haptic accessibility.
H4.
Haptic accessibility negatively moderates the chain-mediating path, such that the indirect effect of AR (vs. 2D, 3D, or VR) on compensatory behaviors, via the perceived haptic gap and haptic craving, is stronger under lower (vs. higher) haptic accessibility.
2.5. Positioning Relative to Prior Work
Because our claim runs against the prevailing direction of the literature, it is worth stating precisely what is established and what is not. Four streams are relevant to the present study.
AR interfaces and consumer response: A now-substantial body of work establishes that AR improves consumer outcomes relative to conventional online interfaces. AR raises interactivity and vividness [4], affords simulated physical control and decision comfort [11], reduces the imagery load required to evaluate a product [7,10], and improves user experience and willingness to buy [12]; conceptual work has mapped the AR–VR–MR space and the engagement it supports [3,9]. A recent meta-analysis of AR and VR in marketing confirms an overall positive pattern, while noting that the comparative effects of the two technologies, their potential negative impacts, and the mechanisms that produce them remain unresolved [50]. What this stream has not examined is whether the same fidelity that produces these benefits also produces a cost. Its mechanisms (vividness, diagnosticity, imagery, presence) are all mechanisms of sensory sufficiency; none of them can represent a sensory channel that the interface raises expectations for and then fails to supply.
Sensory marketing and touch: Touch research establishes that haptic input carries diagnostic value that vision cannot substitute for, that individuals differ systematically in how much they need it [20,41], and that its absence in online retail depresses confidence and purchase intention [17,32]. This stream, however, treats the absence of touch as a static property of the online channel and does not consider that an interface might vary in how strongly it invites the touch it cannot deliver, which is exactly what distinguishes AR from a photograph.
Compensatory consumption: Work in this tradition shows that a threatened or depleted resource (status, control, belonging, self-concept) motivates compensatory acquisition [26,30,31,51,52]. The triggering deficit in this literature is psychological or material. Whether a purely perceptual deficit is sufficient to set the same machinery in motion has not yet been tested.
New media and spatial computing in interactive marketing: Recent work has begun to examine immersive and spatial interfaces as interactive marketing environments in their own right [6,16,36,53], including how the need for touch shapes movement between online and offline channels [54]. Hsieh and Kumar [54] establish that consumers high in need for touch are more likely to research online and then buy offline. Our contribution involves identifying why an AR interface should intensify that pathway through the perceived haptic gap it uniquely creates, rather than merely documenting that it does.
Table 1 positions the present study against this work. The final row states our marginal contribution: while prior studies attribute AR’s effects to mechanisms of sensory enrichment and assign the technology a uniformly positive valence, we identify a perceptual cost that rises with visual fidelity and show that it produces compensatory behavior rather than only more favorable evaluation.
Table 1.
Positioning of the present study relative to prior work.
Our research model is presented in Figure 1. Four experiments are conducted to test the four hypotheses, and the research design, sample, and dependent variables for the four experiments are summarized in Table 2.
Figure 1.
Research model.
Table 2.
Overview of experiments.
3. Measurement Validation and Analytical Approach
Before testing the hypotheses, we describe how the model was validated and report the measurement properties of all multi-item scales. All analyses were conducted in IBM SPSS Statistics 26, with the confirmatory factor analyses estimated in IBM SPSS Amos 26 (IBM Corp., Armonk, NY, USA).
3.1. Validation Logic
The model is validated at three levels. At the level of design, every study randomly assigns participants to conditions, each manipulation is verified by a manipulation check, and the four hypotheses are examined against three different comparison interfaces (2D, 3D, VR), in two settings (laboratory, mobile), with three stimuli (plush mouse, teddy bear, office chair), and across four classes of outcome (behavioral choice, behavioral intention, information reliance, cross-context purchase intention). Convergence across such heterogeneous operationalizations, rather than repetition of a single paradigm, is what licenses the general claim. At the level of measurement, all multi-item scales are subjected to confirmatory factor analysis (CFA) with tests of convergent and discriminant validity, reported below. At the level of replication, Study 1b repeats Study 1 with the device held constant (Section 4.4), and the mediation model is re-estimated under alternative operationalizations of both mediators (Section 3.4).
3.2. Confirmatory Factor Analysis
We estimated a measurement model for each study containing all multi-item scales using maximum likelihood. Study 2 comprises four factors across 15 items: perceived haptic gap (PHG), haptic craving (HC), compensatory behavioral intention (CBI), and need for touch (NFT). Study 3 comprises five factors across 14 items: PHG, HC, review helpfulness (RH), haptic accessibility (HA), and chair purchase intention (CPI). Studies 1 and 1b are not included: their outcomes are a binary behavioral choice and a single-item intention measure, which do not support a latent-variable model. For the single-item offline visit intention, we follow Bergkvist and Rossiter [55], who show that single-item measures are not inferior for concrete, singular constructs.
Model fit was evaluated using the comparative fit index (CFI), the Tucker–Lewis index (TLI), the root mean square error of approximation (RMSEA), and the standardized root mean square residual (SRMR). As shown in Table 3, both measurement models fit well on every index, and both fit far better than a single-factor alternative.
Table 3.
Measurement model fit: Studies 2 and 3.
Table 4 reports standardized loadings, Cronbach’s α, composite reliability (CR), and average variance extracted (AVE). All loadings are significant. Cronbach’s α and CR exceed 0.70 for every construct in both studies, while AVE exceeds 0.50 for every construct except NFT (0.473), a six-item trait scale whose composite reliability is nonetheless satisfactory (CR = 0.839); for this case, we follow Fornell and Larcker [56], who note that convergent validity remains adequate where composite reliability is satisfactory even if AVE falls somewhat below 0.50. Convergent validity is therefore supported for all constructs in both measurement models.
Table 4.
Standardized loadings, reliability, and convergent validity.
Discriminant validity was assessed with both the Fornell–Larcker criterion and the heterotrait–monotrait (HTMT) ratio, the latter following Henseler, Ringle, and Sarstedt [57], who show it to be more sensitive than the Fornell–Larcker test. As Table 5 shows, all HTMT values fall well below the 0.85 criterion, the largest being 0.782 in Study 2 and 0.675 in Study 3, and the Fornell–Larcker criterion is satisfied throughout Study 3 and for all Study 2 constructs except one: the square root of AVE for haptic craving (0.771) sits marginally below its correlation with compensatory behavioral intention (0.789). Because this is the one comparison where the two criteria diverge, we tested it directly with a constrained-model comparison [58]: merging haptic craving and compensatory behavioral intention into a single factor degrades fit substantially, with and p < 0.001 (CFI falls from 0.954 to 0.908; RMSEA rises from 0.058 to 0.081). The two constructs are therefore empirically distinguishable, and their high correlation reflects the theorized proximity of craving to the intention it motivates rather than a failure of discriminant validity.
Table 5.
Discriminant validity: Fornell–Larcker criterion and HTMT ratios.
3.3. Common Method Variance
Because the mediators and outcomes in Studies 2 and 3 are self-reported by the same participants in a single session, we assessed common method variance in three ways [59]. The first is Harman’s single-factor test: an unrotated principal-component analysis of the 15 Study 2 items returns a first factor accounting for 28.18% of variance, with three factors exceeding an eigenvalue of 1; the corresponding figure for the 14 Study 3 items is 37.11%, with four factors above an eigenvalue of 1. Both are well below the 50% criterion. Second, the single-factor CFA reported in Table 3 fits very poorly in both studies, whereas the hypothesized measurement models fit well. Third, we estimated a common latent factor model in which an unmeasured method factor loads on all items; the average variance attributable to that factor is 10.94% in Study 2 and 26.46% in Study 3, in both cases below the conventional 50% benchmark, and the substantive loadings retain their magnitude.
We further note a structural feature of the design that bounds where the concern can apply. The independent variable in every study is a randomly assigned experimental manipulation, not a self-report; the paths from interface condition to the mediators and to the outcomes therefore cannot arise from a shared measurement method. The concern applies to the mediator-to-outcome segment, where measures do share source and occasion, and it is that segment the above tests address. It is nevertheless a residual limitation: a design that separates the measurement of mediators and outcomes temporally would provide a stronger test, and we return to this in Section 7.3.
3.4. Robustness to Measurement Specification
Although every construct meets conventional reliability standards, PHG is measured with only three items, so we examined whether the chain mediation depends on how the two mediators are scored. We re-estimated the serial indirect effect under every combination of alternative operationalizations (PHG as the full three-item composite, as its single strongest indicator, and as the mean of its two remaining items; HC as its full composite and as a four-item subset), using 5000 bootstrap resamples in each case. In Study 2, the chain indirect effect ranges from 0.114 to 0.163 across the six specifications, with all 95% bias-corrected confidence intervals excluding zero. In Study 3, the corresponding range is 0.116 to 0.166, again with all intervals excluding zero. The mechanism is therefore not an artifact of a particular scoring decision.
4. Study 1: AR Versus 2D
Study 1 tests the main effect in H1 in a controlled laboratory setting, where AR and 2D are operationalized side by side with the same stimulus and minimal confounds. The compensatory behaviors in this experiment include a binary reward choice between a tangible tactile object and its cash equivalent. This behavioral variable is chosen because it assesses whether AR directs consumers toward tactile substitutes rather than abstract resources [26].
4.1. Method
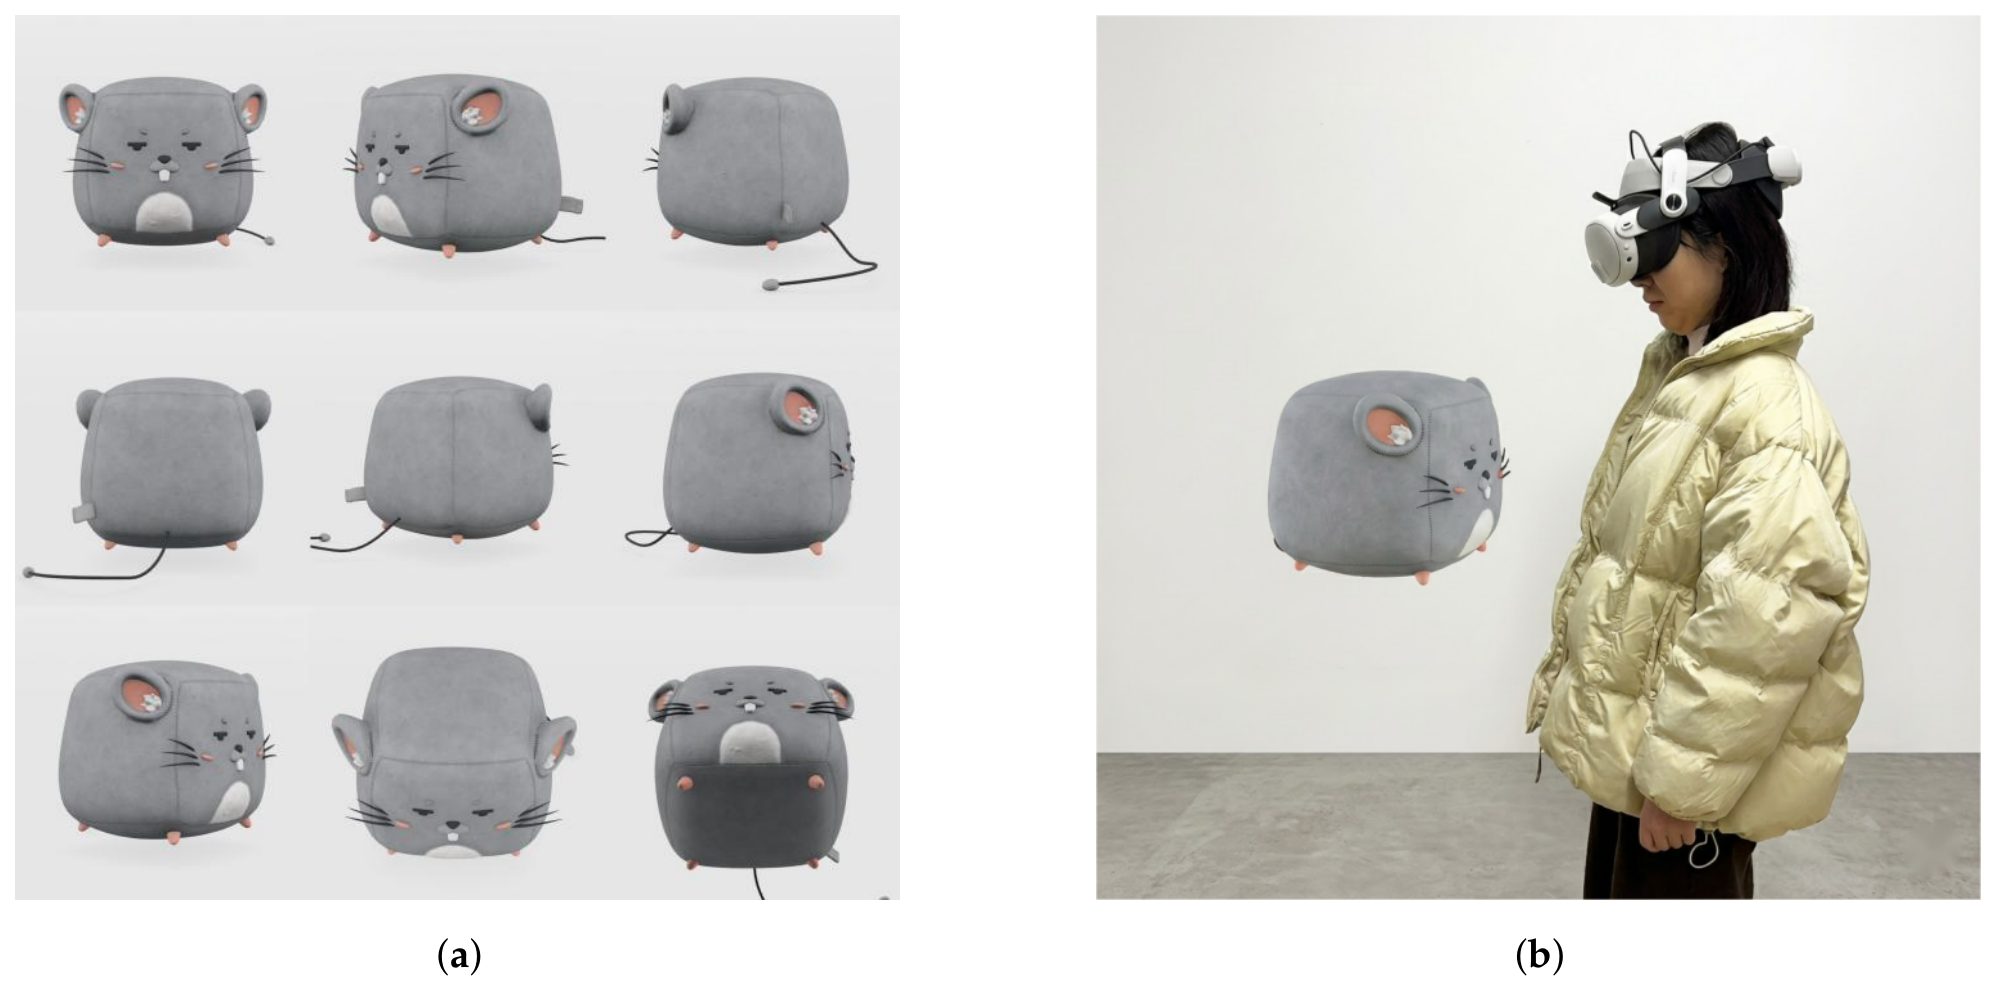
We recruited 80 college students on a university campus (43.75% male; 70% aged 18–25 years). Each participant attended the cognitive behavior laboratory individually, signed informed consent, and was randomly assigned to the AR or the 2D condition, with 40 participants in each condition. The target product was a plush mouse toy, chosen because of its tactile attributes: softness, fabric texture, and weight. In the 2D condition, participants viewed the plush mouse on an iPad through nine rotating photographs. In the AR condition, participants wore a Meta Quest 3 headset in passthrough mode and viewed a virtual rendering of the same plush mouse superimposed onto the laboratory space. The device allows natural head and body movement around the object and provides the spatial co-location that forms AR for the object [2].
After viewing, participants completed three behavioral outcome measures: a binary compensatory reward choice between a CNY 15 cash payment and a plush panda toy of equivalent value [26]; a single-item offline visit intention adapted from Baker, Parasuraman, Grewal, and Voss [60] asking how willing they would be to visit an adjacent mall that stocked the same toy; and a three-item impulse buying scale (α = 0.87) from Rook [61] and Beatty and Ferrell [62]. Full recruitment screening, device calibration protocol, stimulus photographs, complete scale items, and supplementary analyses appear in Appendix A.
4.2. Results
Manipulation check: We used a procedural manipulation check for the viewing device. Each participant’s assigned device and compliance with the viewing protocol were recorded. All 80 participants completed the assigned condition correctly, with no cross-condition spillover.
Compensatory reward choice: Consistent with H1, AR participants were more likely than 2D participants to select the tactile plush reward over cash, with , p = 0.029, and Cramer’s V = 0.24. The choice distribution was asymmetric: 32.5% of AR participants selected the plush panda, compared with 10.0% of 2D participants. The likelihood of choosing the tactile reward was more than four times greater in the AR condition (OR = 4.33, 95% CI ).
Offline visit intention: AR participants reported a greater willingness to visit the mall to look over the same toy in person, with , p = 0.033, Cohen’s d = 0.49, mean difference = 0.70, and 95% CI . The results show a compensation effect for AR over 2D: the use of AR increases consumers’ behavioral intention to continue haptic information processing that AR itself cannot provide.
Impulse buying intention: AR participants showed marginally higher impulse buying intention (M = 4.19, SD = 1.22) than 2D participants (M = 3.72, SD = 1.04), with , p = 0.065, d = 0.42, mean difference = 0.48, and 95% CI . This result marginally supports H1.
4.3. Discussion
Study 1 provides initial evidence for H1. AR exposure increases compensatory reward choice, raises offline visit intention, and marginally elevates impulse buying intention to a greater degree than the 2D experience does. The results reveal that AR provides more than advanced visual and spatial channels for product viewing: it elicits offline intent and tactile-substitute choices, indicating that AR can be paired with proximate offline channels such as showrooms, in-store visits, and sample requests.
4.4. Study 1b: A Same-Device Replication
Study 1 operationalized the AR condition through a head-mounted display and the 2D condition through a tablet, so that device and presentation mode varied together. The compensatory effect might therefore reflect the novelty or the production value of the headset rather than the spatial co-location of the virtual product with the physical environment. Study 1b was designed specifically to rule out that alternative.
Method: Sixty undergraduate students (2D condition n = 33; AR condition n = 27) participated individually in a university laboratory and were randomly assigned to one of two conditions in a single-factor between-subjects design. Both conditions were administered on the same iPad. In the 2D condition, participants viewed the same nine rotating photographs of the plush mouse used in Study 1; in the AR condition, participants viewed the same product model rendered in AR and anchored to their physical surroundings. The presentation mode was thus the only difference between conditions; hardware, screen, and stimulus were held constant. Participants then completed the same three outcome measures used in Study 1. A two-item manipulation check verified whether participants had perceived the product as located in their actual environment and which viewing mode they had experienced; all 60 participants answered consistently with their assigned condition.
Results: All three effects were replicated. Consistent with H1, AR participants were more likely than 2D participants to select the tactile plush reward over the cash equivalent (37.0% vs. 12.1%), with , p = 0.050, Cramer’s V = 0.25, OR = 4.26, and 95% CI . AR participants reported higher offline visit intention (M = 5.22, SD = 1.15) than 2D participants (M = 4.15, SD = 1.15), with , p = 0.001, Cohen’s d = 0.93, mean difference = 1.07, and 95% CI . Impulse buying intention (α = 0.86) was also higher in the AR condition (M = 4.15, SD = 1.08) than in the 2D condition (M = 3.56, SD = 1.05), with , p = 0.036, and d = 0.56. Table 6 provides a comparison of the two studies.
Table 6.
Comparison of Study 1 and Study 1b outcomes.
Discussion: With the device held constant, the compensatory effect not only persists but is larger on all three outcomes, and the impulse buying effect that was marginal in Study 1 reaches conventional significance. Device novelty is therefore not a plausible account of the pattern. Together with the manipulations in Studies 2 and 3, each of which likewise varies presentation mode within a single device, Study 1b locates the effect in the spatial co-location of the virtual product with the physical environment rather than in the hardware used to deliver it.
5. Study 2: AR Versus 3D
Study 2 examines the proposed mediation chain mechanism for compensatory behaviors. Using a larger mobile sample, this experiment tests whether the effects of AR in Study 1 can be replicated against a more advanced medium: an interactive 3D model rather than the static 2D interface used in Study 1. The 3D model supports visual inspection and rotation but does not overlay the product in the actual environment, isolating spatial co-location as the source of any incremental effect. Study 2 also examines the moderated chain mediation effect of need for touch proposed in H3.
5.1. Method
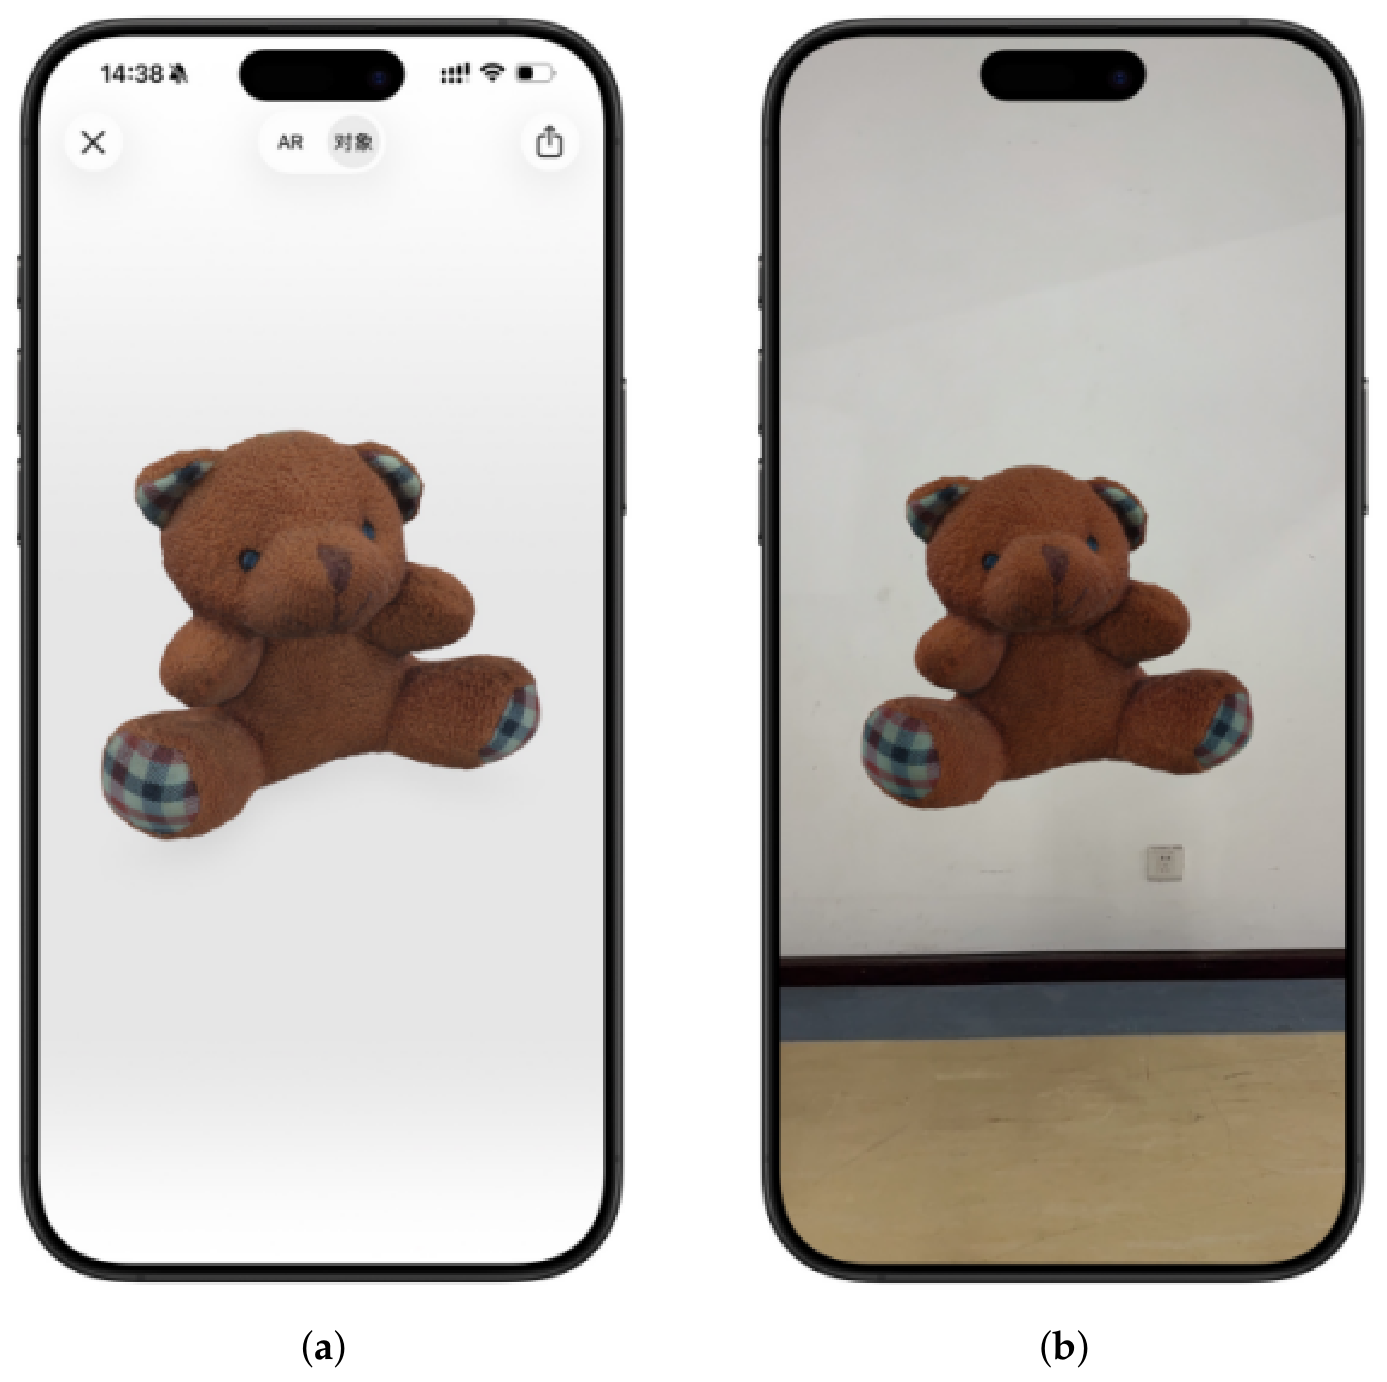
We recruited 280 participants on the behavioral research platform Credamo. To standardize AR rendering quality, all participants used an iPhone 14 or later for this experiment. Participants downloaded an identical teddy-bear 3D model file and were randomly assigned to one of two viewing conditions. In the AR condition, they opened the file using iOS AR Quick Look, which rendered the bear as a virtual object superimposed onto their real environment. In the 3D condition, they opened the same file in iOS Object view, which displayed an identically scaled 3D model on screen against a blank background, supporting rotation and zoom but not environmental overlay. After a standardized viewing period, participants completed a questionnaire containing four measures: perceived haptic gap adapted from Citrin, Stem, Spangenberg, and Clark [17] (three items, α = 0.75); haptic craving adapted from Peck, Barger, and Webb [37] (four items, α = 0.85); compensatory behavioral intention adapted from Citrin, Stem, Spangenberg, and Clark [17] (two items, α = 0.87); and need for touch adapted from Peck and Childers [20] (six items, α = 0.83). Full recruitment screening, manipulation-check rule, complete scale items, and demographic distribution appear in Appendix B.
5.2. Results
Manipulation check: A single manipulation-check item probed whether participants perceived the bear as appearing in the immediate physical environment. Fifty-two participants whose answer was inconsistent with their assigned condition were excluded, yielding a final sample of 228 participants.
Main effect: Consistent with H1, AR participants reported significantly higher compensatory behavioral intention (M = 3.69, SE = 0.09) than 3D participants (M = 3.06, SE = 0.09), with , p < 0.001, , and Cohen’s d = 0.65. The medium-to-large effect size, established against a 3D model rather than a 2D photograph, indicates that spatial co-location with the physical environment, not visual rotation or interactive inspection per se, drives compensatory behaviors.
Chain mediation effect: We tested the sequential mechanism using PROCESS Model 6 (PROCESS macro version 4.1 for SPSS; Hayes, Columbus, OH, USA) with 5000 bootstrap samples [63], modeling the path from AR exposure through perceived haptic gap and haptic craving to compensatory behavioral intention. As shown in Table 7, all path coefficients were significant. AR exposure creates perceived haptic gap (B = 0.57, SE = 0.08, t = 7.53, p < 0.001, 95% CI ), and perceived haptic gap in turn positively affects haptic craving (B = 0.36, SE = 0.09, t = 3.92, p < 0.001, ). Finally, haptic craving positively influences compensatory behavioral intention (B = 0.78, SE = 0.06, t = 13.17, p < 0.001, ). The chain indirect effect was also significant (B = 0.16, BootSE = 0.05, 95% Boot CI ), confirming H2. The direct effect of AR on compensatory behavioral intention remained significant (B = 0.30, SE = 0.107, t = 2.79, p = 0.006), indicating partial rather than full mediation.
Table 7.
Chain mediation path coefficients: Study 2.
Moderated chain mediation by NFT: We tested whether need for touch moderates the first stage of the chain using PROCESS Model 83. As shown in Table 8, the interaction of AR and NFT on perceived haptic gap was significant (B = −0.47, SE = 0.15, t = −3.16, p = 0.002, ). The conditional effect of AR on perceived haptic gap was substantially larger for participants with high NFT (B = 0.81) than for those with low NFT (B = 0.34). The chain-specific indirect effects on compensatory behavioral intention were 0.23 (BootSE = 0.07, 95% Boot CI ) for high-NFT participants and 0.10 (BootSE = 0.04, ) for low-NFT participants. The index of moderated mediation was significant (Index = −0.13, BootSE = 0.06, ), confirming H3.
Table 8.
Moderated chain mediation in Study 2.
A complementary analysis of variance (ANOVA) revealed that the interaction between interface (AR vs. 3D) and NFT (high vs. low) was significant: , , and . Compared with the 3D model, AR influences compensatory behavioral intention to a greater degree for participants with high NFT (3D vs. AR ; , , ), whereas the AR vs. 3D difference was non-significant for participants with low NFT (3D vs. AR ; , , ). The interaction effects are presented in Figure 2.
Figure 2.
Interaction of interface and need for touch on compensatory behavioral intention (Study 2).
5.3. Discussion
The results in Study 2 provide support for the first three hypotheses. AR’s influence on compensatory behavioral intention was significant against an interactive 3D model. The proposed chain mediation effect (H2) and the moderated chain mediation by NFT (H3) were both confirmed. Need for touch moderates the chain at its first stage, with high-NFT consumers showing an indirect effect roughly 2.4 times higher than low-NFT consumers. These results suggest that consumers with a high need for touch respond best to AR with haptic cues (such as texture descriptions and close-up images of surfaces), especially when they are later guided to inspect the product in person.
6. Study 3: AR Versus VR
Contrasting AR with fully immersive VR, Study 3 tests the hypotheses in a 2 × 2 design and extends the compensatory behaviors to a different context. A fully immersive VR interface was adopted to investigate whether the AR interface’s effect can be attributed to immersion.
6.1. Method
We recruited 160 college students on a university campus, who were invited to the behavioral laboratory individually and were randomly assigned in a 2 (presentation method: AR vs. VR) × 2 (haptic accessibility: low vs. high) between-subjects design. The experimental design was carried out with 40 participants in each cell. The same teddy-bear stimulus was presented through a Meta Quest 3 headset operating in passthrough AR mode for the AR condition and in immersive VR mode within a neutral virtual room for the VR condition. Haptic accessibility was manipulated by standardized verbal instructions. Under low haptic accessibility, participants were instructed to keep their hands in their pockets throughout the viewing task. Under high haptic accessibility, participants were encouraged to perform air-touch and stroking gestures toward the rendered object without expecting tactile feedback. After viewing, participants completed the measures of perceived haptic gap (α = 0.76) and haptic craving (α = 0.82) used in Study 2, along with measures of the perceived helpfulness of a haptic-cue review for the teddy bear (two items, α = 0.81) [49]. Participants also answered manipulation-check questions on subjective haptic accessibility (three items, α = 0.92) [20]. Participants then evaluated an office chair with highlighted tactile softness and reported their purchase intention using a two-item scale (α = 0.80) [64]. Full instructions, stimulus photographs, scales, demographic distribution, and supplementary analyses appear in Appendix C.
6.2. Results
Manipulation check: The manipulation of haptic accessibility was successful based on participants’ perceived constraints on touching the product. Participants in the low-accessibility condition reported a substantially higher constraint score (M = 4.40, SD = 0.41) than those in the high-accessibility condition (M = 2.87, SD = 0.93), with , p < 0.001, and . The haptic-accessibility manipulation was also independent of the presentation method (main-effect p = 0.44; interaction p = 0.35).
Main and interaction effects on review helpfulness: As shown in Table 9, a 2 × 2 ANOVA on the perceived helpfulness of haptic-cue reviews yielded significant main effects and a significant interaction. Haptic accessibility produced a significant main effect: the low-accessibility group rated haptic-cue reviews as more helpful than the high-accessibility group, with , p < 0.001, and . Presentation method also produced a significant main effect: AR generated higher review helpfulness than VR, with , p = 0.005, and . The interaction between presentation method and haptic accessibility was significant: , p = 0.046, and . Under low haptic accessibility, AR (M = 4.15, SE = 0.12) elicited higher perceived helpfulness than VR (M = 3.51, SE = 0.13). Under high haptic accessibility, the AR vs. VR difference attenuated to a non-significant level (AR M = 3.14, SE = 0.14; VR M = 3.03, SE = 0.14). The interaction effects are shown in Figure 3.
Table 9.
Analysis-of-variance results: Study 3.
Figure 3.
Interaction of presentation method and haptic accessibility on review helpfulness (Study 3).
Moderated chain mediation by haptic accessibility: To test whether haptic accessibility moderates the first stage of the compensatory chain, we estimated PROCESS Model 86 with 5000 bootstrap samples [63], with review helpfulness as the dependent variable. As shown in Table 10, the interaction of presentation method and haptic accessibility on perceived haptic gap was significantly negative (B = −0.54, SE = 0.16, t = −3.35, p = 0.001), indicating that the AR-induced gap was substantially larger when touch was blocked than when it was encouraged. The chain-specific indirect effects on review helpfulness were 0.24 (BootSE = 0.07, 95% Boot CI ) under low haptic accessibility and 0.08 (BootSE = 0.04, ) under high haptic accessibility. The index of moderated mediation was significant (Index = −0.16, BootSE = 0.07, ), confirming H4.
Table 10.
Moderated chain mediation in Study 3.
Cross-context compensatory behavioral intention: We conducted a 2 × 2 ANOVA on chair purchase intention. The presentation method had a significant main effect (, , ). The haptic-accessibility main effect was non-significant (), but the interaction was significant (, , ). Under low haptic accessibility, AR generated higher purchase intention for the tactile chair (, ) than did VR (, ). Under high haptic accessibility, the AR vs. VR difference narrowed (AR , ; VR , ). The compensatory behavioral intention was extended from the focal task to an unrelated tactile-relevant choice.
6.3. Discussion
Study 3 provides evidence for the situational moderating role of haptic accessibility in explaining AR-induced compensatory behaviors. Although neither has real haptic feedback, AR is a stronger driver of compensatory behaviors than fully immersive VR. The effect is not due to immersion experience but to the combination of an AR-induced haptic tendency and low haptic accessibility. When haptic actions are explicitly allowed, even as motor mimicry without contact, the compensatory intention weakens. Extending the compensatory behaviors to a cross-context choice, our results show that compensatory intention can be carried over to other tactile-relevant intentions, suggesting that presentation methods should be tailored to the consumer’s shopping setting or platform. In haptic-accessible shopping settings such as a showroom floor or an in-home preview, the use of AR can lead to more favorable compensatory behavioral outcomes. In presentation-only settings such as mobile commerce or online browsing, AR urges the desire for rich tactile-cue content and increases the likelihood that consumers will visit brick-and-mortar stores for additional haptic information-seeking.
7. General Discussion
Our experiments produced a consistent pattern demonstrating AR’s haptic-inducing effects across comparison interface types (2D, 3D, VR), experimental settings (laboratory, mobile), product stimuli (plush mouse, teddy bear, office chair), and behavioral outcomes (compensatory choice, intention, review helpfulness, cross-context purchase intention). Importantly, this convergence does not rest on the diversity of the hardware used: in Study 1b, both conditions ran on the same iPad; in Study 2, both ran on the participant’s own iPhone using the same product file; and in Study 3, both ran on the same headset with only its mode changed. Because presentation mode is manipulated within a single device in each of these studies, the convergence reflects the same underlying construct rather than device-specific idiosyncrasies that happen to align. AR exposure elicits compensatory behaviors through a chain mediation mechanism: a perceived haptic gap that intensifies haptic craving. The effects are amplified for consumers with a high need for touch and when situational haptic accessibility is low. All four hypotheses were supported, highlighting new psychological effects of AR exposure for consumers that have not been recognized in the interactive marketing literature.
7.1. Theoretical Implications
Prior research has found that AR offers better immersive shopping experiences, such as heightened vividness and diagnosticity [3,4,9,11], which reduces mental imagery load [7,10]. A reality–virtuality paradox was identified in this study, and the underlying mechanism for AR’s influences was re-examined. The mechanism proposed here incorporates a multisensory paradigm, revealing broader sensory inputs and psychological paths in consumers’ interactive experiences with AR that are not captured by previous research. Our study presents a novel framework and findings that expand the current understanding of mixed reality, offering insight into how consumers interact with innovative shopping technologies such as AR.
Our findings challenge the traditional view in interactive marketing that greater immersion necessarily leads to more favorable consumer responses. Through the reality–virtuality paradox, we show that AR’s technological advantage in spatial realism is inseparable from its psychological trade-off and sensory asymmetry. Our framework highlights that both benefit and cost coexist for AR. High visual fidelity combined with absent haptic feedback produces a previously unseen interactive pattern and behavioral outcomes. The findings extend interactive marketing research by showing that greater realism does not always improve consumer responses and may sometimes create sensory mismatches that influence evaluations and choices. Consumers’ interaction and engagement with multiple sensory modalities in emerging AR technologies will substantially advance current inquiries in interactive marketing [65].
In addition, individual need for touch and situational haptic accessibility act as moderators of chain mediation effects, reshaping the boundaries of cross-modality behaviors in interactive marketing and revitalizing sensory marketing research [18,40]. This study draws construal-level theory, embodied cognition, expectation disconfirmation, and psychological reactance into a unified lens for interactive marketing.
Furthermore, we extended compensatory consumption research from resource scarcity [26,30,51] into sensory scarcity and explored the behavioral consequences during consumers’ interaction with AR interfaces. AR-induced perceptual asymmetry generates motivated compensatory behaviors, including offline-channel intent, reliance on tactile-cue information, and cross-context transfer to a tactile-relevant purchase decision. The findings help explain compensatory consumption [52], suggesting that the sensory gap can be bridged through adaptive information-seeking rather than intra-domain compensation [51]. The findings contribute to interactive marketing by identifying previously overlooked psychological and behavioral outcomes in technology-mediated interactive shopping experiences.
7.2. Managerial Implications
Following Wang [22], we provide practical guidelines for strategic AR marketing. Our recommendations primarily benefit brands in tactile and hedonic categories (e.g., apparel, furniture, cosmetics), where sensory expectations are strongest. For omnichannel brands, AR can be used strategically to drive customer engagement by increasing store visits, review-seeking, and tactile-oriented purchases. AR product experience can lead to enhanced multi-channel interaction, such as store visits or sample requests, turning engagement into a sales pathway. Brands without an omnichannel structure (e.g., direct-to-consumer or app-only brands) must address AR’s impact within the digital channel. This can be done through richer tactile cues (e.g., texture zooms, close-up videos, user photos, and material specs) and AI-generated tactile descriptions tailored to consumer concerns. Together, these strategies turn the compensatory response into a content opportunity rather than a channel limitation.
More specifically, generative AI offers the most immediately deployable solution. Because the reality–virtuality paradox drives consumers from visual realism toward haptic information-seeking, AI systems that generate rich tactile descriptions can intervene precisely where consumers look for sensory substitutes [15]. Examples include image-to-text material descriptions, dynamic product copy that answers questions such as “How does this fabric breathe?” or “How heavy does it feel?”, and real-time virtual try-on descriptions tailored to product materials and textures. The AR interface can also pass the shopper’s viewing context and product information to an AI assistant designed to provide tactile cues, enriching the shopping experience and compensating for the absence of physical touch.
Brands can also reduce the haptic gap by incorporating multisensory AR peripherals. Technologies such as vibrotactile wearables, ultrasonic mid-air haptic devices, and scent-emission systems can be integrated into mainstream AR interfaces as consumer-end applications. Low-cost options also exist: pseudo-haptic techniques that simulate properties such as weight using only standard controllers have been shown to raise purchase intent and perceived value in virtual retail, and require no additional hardware [66]. These technologies provide medium-level solutions to enhance the sensory capabilities of AR and help consumers receive realistic tactile feedback from AR experiences.
Across both omnichannel and digital-only brands, marketers can identify high-NFT consumers using behavioral signals (e.g., browsing record of tactile products, store visits, category history) and prioritize AR in tactile categories where the need for touch is most relevant. Low-NFT consumers tend to focus more on AR’s diagnostic benefits with weaker compensatory effects, so AR content can be simplified to avoid unnecessary sensory emphasis.
These recommendations presuppose conditions that are not universally met, and managers should treat them as prerequisites rather than details. AR requires a maintained pipeline of accurate three-dimensional assets, which is costly for broad or fast-turning catalogues; it requires that enough of a brand’s customers hold devices capable of stable rendering, since inconsistent plane detection degrades the very spatial co-location that drives the effect; and it requires permission to access the camera, which a non-trivial share of shoppers will decline. Realizing the compensatory response commercially further requires an attribution system that can connect an AR session to a later offline visit or sample request. Without that, the response is generated but not captured, and the investment appears to underperform. There are also conditions under which AR should not be the default: in categories where tactile attributes are not diagnostic, the mechanism documented here has little to work with; and for brands with no channel able to absorb an intensified desire for physical inspection, amplifying that desire may simply redirect demand to competitors who have one. Finally, because the effect operates by heightening an expectation the interface cannot satisfy, its use warrants restraint where the resulting discomfort could be exploited rather than resolved.
7.3. Limitations and Future Research
This study has several limitations. Our stimuli included plush toys in Studies 1, 1b, and 2 and an office chair in Study 3, all of which have tactile attributes that serve as central information for purchase decision-making. This is a genuine constraint on generality, and we state the resulting boundary as a testable proposition rather than a caveat: the compensatory effect should be strongest where tactile attributes are diagnostic for the decision, should weaken as search attributes come to dominate, and may reverse where visual information is already sufficient and an intensified desire to touch merely delays choice. Categories spanning that range (consumer electronics, furniture and home services, apparel, cosmetics, and fresh groceries) offer a natural test, and identifying the point at which the effect crosses zero would establish where AR is and is not the appropriate interface.
Sample composition also limits generalization. Studies 1, 1b, and 3 recruited students at a single institution in southwestern China, with participants aged 18–25 forming 60–70% of those samples, and all four studies used Chinese participants. Younger, more technology-familiar consumers may respond to AR differently than the broader shopping population, so the effect sizes reported here should be read as estimates from a relatively AR-receptive group rather than population values. Cultural norms surrounding touch in retail also vary, and cross-cultural replication is needed before the mechanism is assumed to be general. Study 2’s requirement that participants own an iPhone 14 or later warrants a separate comment. This was a design constraint rather than a sampling convenience: AR Quick Look’s rendering fidelity and plane detection vary with device capability, and permitting that variation would have introduced precisely the device-driven confound that Study 1b was built to exclude. Holding device class constant removed that source of noise, at the cost of a sample skewed toward higher-income iOS users. Future work using behavioral data from live retail environments, across a wider age range and in multiple cultural settings, would establish the external validity that controlled experiments of this kind cannot.
We measured participants’ compensatory responses immediately after AR exposure. Whether this response persists over hours or days remains unknown. Previous AR experience or repeated AR use may also reduce the effect. Longitudinal research that tracks consumer behavior over time, particularly in settings where AR becomes a routine part of shopping, could provide important insights into AR’s compensatory effects.
We used mobile AR and head-mounted AR as the AR interface in the experiments. The compensatory effect may be stronger in newer AR formats that provide highly realistic visual experiences, such as smart glasses, spatial computing, or voice-haptic AR. Future research should examine whether the effect generalizes across emerging AR modalities and whether these technologies create new sensory asymmetries beyond the visual–haptic gap tested in this study.
Finally, the reality–virtuality paradox was built primarily on cognitive and motivational mechanisms, focusing on the perceptual information-processing route. However, the absence of touch in AR experiences is also likely to generate affective responses that accompany these processes. For example, consumers may experience frustration when an apparently tangible product cannot be touched. Future research should examine these affective pathways directly and investigate how they interact with the cognitive-motivational process identified in this study. Such emotions may strengthen the compensatory response, redirect it toward alternative information-seeking behaviors, or even serve as substitutes for the motivational mechanisms proposed in this study.
7.4. Conclusions and Real-World Applications
This research began from an observation that cuts against the direction of most work on immersive commerce: the more convincingly an interface places a product in the consumer’s own space, the more sharply it advertises the one thing it cannot provide. Across four experiments, we find that AR does not simply improve product evaluation; it creates a perceived haptic gap, that gap intensifies haptic craving, and craving motivates behavior aimed at obtaining the missing tactile information. The effect holds against 2D photographs, interactive 3D models, and fully immersive VR; it survives holding the device constant; and it transfers to a tactile-relevant choice in an unrelated category.
Three applications follow directly. First, omnichannel retailers should treat AR as a driver of physical traffic rather than only of online conversion and should instrument it accordingly: an AR session that ends without a purchase but produces a store visit or a sample request is a success that conventional attribution records as a failure. Second, brands operating only in digital channels should meet the compensatory response with content rather than concede it, supplying the tactile information consumers begin seeking: material and texture description, close-range video of surfaces, weight and drape specifications, and AI-generated answers to the questions shoppers actually ask about how something feels. Third, interface choice should follow the shopper’s situation: AR is most valuable precisely where touch is unavailable, such as mobile browsing and at-home preview, and least differentiated in settings where the product can already be handled. Deployed with these conditions in mind, the reality–virtuality paradox becomes a lever rather than a liability, as AR’s inability to deliver touch is what makes it effective at sending consumers to look for it.
Author Contributions
Conceptualization, Y.D., T.Z., Y.W. and Z.L.; methodology, Y.D.; formal analysis, Y.D.; data curation, Y.D.; visualization, Y.D.; writing—original draft preparation, Y.D., T.Z., Y.W. and Z.L.; writing—review and editing, Y.D., T.Z., Y.W. and Z.L.; supervision, T.Z.; funding acquisition, T.Z. All authors have read and agreed to the published version of the manuscript.
Funding
This work was supported by the National Natural Science Foundation of China (Grant No. 72362006).
Institutional Review Board Statement
All studies reported in this article were approved by the Ethics Committee of Guian New Area Institute, Guizhou University of Finance and Economics (Approval Code GUFEIRB0107, 13 April 2025).
Informed Consent Statement
Informed consent was obtained from all participants involved in the studies.
Data Availability Statement
The raw data supporting the conclusions of this article will be made available by the authors on request. The reported experiments form part of an ongoing research programme; once the full programme is concluded and this article has been accepted for publication, the authors will share the de-identified analytic dataset with qualified researchers upon reasonable request.
Conflicts of Interest
The authors declare no conflicts of interest.
Abbreviations
The following abbreviations are used in this manuscript:
| ANOVA | Analysis of variance |
| AR | Augmented reality |
| AVE | Average variance extracted |
| CBI | Compensatory behavioral intention |
| CFA | Confirmatory factor analysis |
| CFI | Comparative fit index |
| CI | Confidence interval |
| CPI | Chair purchase intention |
| CR | Composite reliability |
| HA | Haptic accessibility |
| HC | Haptic craving |
| HTMT | Heterotrait–monotrait ratio |
| MR | Mixed reality |
| NFT | Need for touch |
| OR | Odds ratio |
| PHG | Perceived haptic gap |
| RH | Review helpfulness |
| RMSEA | Root mean square error of approximation |
| SD | Standard deviation |
| SE | Standard error |
| SRMR | Standardized root mean square residual |
| TLI | Tucker–Lewis index |
| VR | Virtual reality |
Appendix A. Experimental Materials for Study 1
Sample: Eighty undergraduate and graduate students at a university in southwestern China participated in Study 1 (40 per condition). Recruitment used three parallel channels: course-level group chats, the departmental participant-pool email list, and on-campus poster notices. Eligible participants were at least 18 years old with normal or corrected-to-normal vision. A pre-screening question excluded volunteers with a history of severe motion sickness with head-mounted displays (one volunteer not scheduled). On arrival, each participant signed an informed-consent form and received a cash honorarium of approximately CNY 15 after completing the procedure. The target cell size (40 per condition) was set a priori to detect a medium standardized effect (Cohen’s ) with two-tailed α = 0.05 and power = 0.80 in an independent-samples t-test.
Procedure: The study was conducted in a dedicated cognitive behavior laboratory. Each session comprised seven steps: (1) arrival and consent; (2) random assignment to AR or 2D using a pre-generated random-order list blocked at four; (3) apparatus briefing, including Meta Quest 3 fit, head-strap adjustment, and inter-pupillary-distance calibration (AR) or iPad placement at ≈40 cm with the gallery pre-loaded (2D); (4) a ≈90-s viewing task (AR participants walked around a scale-accurate virtual plush mouse anchored to a physical table; 2D participants swiped through nine photographs at their own pace); (5) a compensatory-reward choice between Envelope A (CNY 15 cash) and Envelope B (a plush panda toy of comparable market value); (6) a post-task paper questionnaire measuring offline visit intention, impulse buying intention, and demographics; and (7) debriefing (3–5 min). Total session duration averaged 22 min.
Stimuli: The target product was a commercially available plush mouse toy approximately 18 cm long, made from light-grey polyester fibre, with black thread eyes and a pink thread nose. In the AR condition, participants wore a Meta Quest 3 headset in see-through (passthrough) mode, with a scale-accurate virtual mouse anchored to a physical table approximately 1.2 m in front of them. The virtual mouse maintained spatial anchoring as participants moved, allowing inspection from any angle; no controller-based rotation, zoom, or manipulation was enabled. In the 2D condition, participants viewed nine high-resolution photographs of the same physical plush-mouse toy on an iPad in landscape orientation. The photograph sequence comprised (1) front, (2) front-left three-quarter, (3) left side, (4) back-left three-quarter, (5) rear, (6) back-right three-quarter, (7) right side, (8) front-right three-quarter, and (9) top-down views. All photographs were shot against a neutral grey background at consistent lighting and scale. Figure A1 exhibits the two conditions side by side.
Figure A1.
Stimulus materials for the 2D and AR conditions (Study 1). (a) 2D condition (nine-angle photograph composite). (b) AR condition (Meta Quest 3 passthrough still).
Measures: All self-report items used a five-point Likert response scale (1 = strongly disagree, 5 = strongly agree) unless otherwise noted. Items were developed in English in the cited sources and adapted into the local language using the translation–back-translation procedure [67].
Compensatory reward choice (single binary behavioral measure; adapted from Mandel, Rucker, Levav, and Galinsky [26]): “As a reward for this portion of the study, please choose one of the following: (A) CNY 15 in cash, or (B) a plush panda toy of equivalent value.” Response: forced binary choice.
Offline visit intention (single item; adapted from Baker, Parasuraman, Grewal, and Voss [60]; Bergkvist and Rossiter [55]): “A mall across from our campus stocks the same plush toy. To what extent would you be willing to visit the store to experience the toy in person?” Response: 1 (not at all willing) to 5 (completely willing).
Impulse buying intention (three items, α = 0.87; adapted from Rook [61]; Beatty and Ferrell [62]): (1) “When I saw this plush mouse toy, I suddenly felt an urge to buy it.” (2) “Even though I had no prior plan to buy it, I wanted to own it when I saw it.” (3) “My urge to buy this plush mouse toy was very strong.” Response: 1 (strongly disagree) to 5 (strongly agree). The item mean served as the composite score.
Demographics: single-choice items measuring sex (male/female/prefer not to say), age band (18–25, 26–34, 35–48, 48 and above), education level, and self-reported monthly disposable income.
Manipulation check: Because the manipulation consisted of an observable difference in viewing device and protocol rather than a perceptual inference requiring self-report, the manipulation check followed a procedural-audit design. For each participant, the experimenter completed a standardized checklist documenting (a) the assigned device (AR headset or iPad), (b) whether the viewing duration fell within 70–110 s, and (c) whether the participant completed the condition-specific interaction profile (free head movement under AR, or full nine-photograph swipe-through under 2D). All 80 audit forms were complete and showed full compliance; no participant was excluded on procedural-audit grounds.
Table A1.
Demographic composition of Study 1 (N = 80).
Table A2.
Cell counts, condition means, and standard deviations for Study 1 outcomes.
Data-analysis methods: The chi-square test on the compensatory reward choice was complemented by an odds-ratio analysis: the odds of a tactile-reward choice were 4.33 times higher under AR than under 2D (, 95% CI ). An independent-samples t-test on offline visit intention yielded , , Cohen’s , and mean difference 0.70 on the five-point scale (95% CI ); Levene’s test was non-significant (, ). On impulse buying intention, AR participants scored directionally higher than 2D participants, with , , Cohen’s , and a mean difference of 0.48 (95% CI ); this pattern is reported as suggestive rather than confirmatory at the present cell size. Auxiliary models that added sex and age band as covariates produced essentially unchanged condition effects on all three outcomes (all covariate ).
Appendix B. Experimental Materials for Study 2
Platform and eligibility: Study 2 was fielded on Credamo, a Chinese online behavioral research platform supporting integrated screening logic (e.g., device-model gating) and randomized condition assignment. To ensure comparable AR rendering quality across conditions, the recruitment pre-screen restricted participation to iPhone 14 or later. This constraint matters because the AR manipulation relies on the iOS AR Quick Look system-level feature, whose rendering performance and environment-anchoring stability differ across older hardware; the A15 Bionic chip and newer models expose a uniform AR feature set sufficient for rendering the teddy-bear 3D model used here. Ineligible-device respondents were exited from the survey before condition assignment and were not counted in the sample. Additional screens required (a) an age of 18 or older, (b) willingness to download a model file to the device, (c) access to adequate indoor space for AR inspection, and (d) agreement to a data-use statement specifying academic and anonymized use. Participants received the standard platform incentive on completion; attention-check failure did not affect compensation. Four complete submissions originating from VPN-redirected IPs and two with anomalous completion times (under 90 s) were flagged and excluded before analysis.
Procedure: Participants completed the study entirely on their own iPhone. After consent and device confirmation, the survey instructed them to download a file named teddybear.usdz (Universal Scene Description, the Apple-native format for AR Quick Look) from a stable cloud URL and save it to the iOS Files application. The survey engine then randomly assigned participants to the AR condition or the 3D-model condition. In the AR condition, participants tapped the saved file in the Files app, which opened iOS AR Quick Look; the system detected a flat surface and anchored the teddy-bear model to that plane at human-visible scale, and participants walked around the object for approximately 60 s, leaning and crouching to inspect at multiple angles (described as “AR mode, where the bear appears in your actual environment”). In the 3D-model condition, participants opened the same file and selected “Preview in Object view,” which opened the iOS non-AR object viewer; the same teddy-bear model appeared within the phone screen against a neutral blank background, with support for two-finger rotation, pinch-to-zoom, and pan, for approximately 60 s (described as “object view mode, where the bear appears on your screen”). The same 3D asset file was used in both conditions; only the opening mode differed. Participants then returned to the survey browser tab and completed, in fixed order, the manipulation check, perceived haptic gap (three items), haptic craving (four items), compensatory behavioral intention (two items), need for touch (six items), and demographics. Median completion time was 11 min 42 s. Figure A2 shows representative screenshots of the two viewing modes.
Figure A2.
Stimulus screenshots for the 3D-model and AR conditions (Study 2). (a) 3D-model condition (iOS Object view; blank-background rendering; the on-screen mode toggle reads “AR” and its Chinese equivalent for “Object”). (b) AR condition (iOS AR Quick Look; teddy bear anchored to a physical surface).
Measures: All self-report items used a five-point Likert response format (1 = strongly disagree, 5 = strongly agree) unless noted. Items were adapted into the local language using translation–back-translation [67].
Perceived haptic gap (three items, α = 0.75; adapted from Citrin, Stem, Spangenberg, and Clark [17]): (1) “Because I cannot touch this product, I feel something is missing.” (2) “There is a clear gap between what I can see and the real tactile experience I could have.” (3) “The absence of touch makes this experience feel incomplete.”
Haptic craving (four items, α = 0.85; adapted from Peck, Barger, and Webb [37]): (1) “Right now I have a strong urge to touch this product.” (2) “I find myself involuntarily imagining what this product would feel like to touch.” (3) “I crave the tactile sensation of holding this product in my own hands.” (4) “If this product were right in front of me, I would find it hard to stop myself from touching it.”
Need for touch (six items, α = 0.83; Peck and Childers [20]): (1) “When browsing in stores, I like to touch products.” (2) “I feel more comfortable purchasing a product after physically examining it.” (3) “Even if I have no intention to purchase, I still like to touch products.” (4) “After touching a product, I have more confidence in my purchase decision.” (5) “When I can touch a product, I am more certain about its quality.” (6) “If I cannot touch a product in the store, I am reluctant to purchase it.”
Compensatory behavioral intention (two items, α = 0.87; adapted from Citrin, Stem, Spangenberg, and Clark [17]): (1) “I strongly want to visit a physical store to see this product in person.” (2) “Knowing about this product only online is not enough. I need to experience it in real life.”
Demographics: sex (male/female/prefer not to say); age band (18–25, 26–33, 34–40, 41–48, 48 and above); monthly disposable income band (under CNY 2000, 2001–4000, 4001–6000, 6001–8000, over 8000); education level.
Manipulation check and exclusion audit: A single binary item asked participants whether “the teddy-bear model I just viewed appeared in my actual physical environment” (Yes/No). Participants were classified as passing the manipulation check if their response matched their assigned condition: AR-assigned participants were expected to respond “yes” and 3D-model-assigned participants to respond “no.” Classification was made programmatically against the condition record maintained by the survey engine. The exclusion rule was pre-specified in the study protocol and applied uniformly across conditions. Of the 280 participants who completed the instrument, 52 failed the manipulation check and were excluded, leaving an analytical sample of N = 228. The AR condition produced a slightly higher exclusion rate than the 3D-model condition, consistent with AR Quick Look’s greater sensitivity to environmental conditions (e.g., low-texture surfaces that impair plane detection). As a robustness check, re-estimating the main effect of condition on compensatory behavioral intention on the full N = 280 preserved the direction (AR M = 3.55 vs. 3D M = 3.12) and decreased the effect size only modestly (Cohen’s d ≈ 0.48 with the full sample vs. d = 0.65 with the manipulation-check-retained sample). The pre-specified exclusion therefore sharpens the signal without creating the pattern.
Table A3.
Demographic composition of Study 2 analytical sample (N = 228).
Table A4.
Cell counts and condition means on core variables in Study 2 (N = 228).
Data-analysis methods: The moderated chain mediation reported in the main text (PROCESS Model 83) was complemented by simple-slopes and conditional-indirect-effect analyses. Conditional effects of AR on perceived haptic gap at low, mean, and high NFT were , , , , 95% CI ; , , , , 95% CI ; and , , , , 95% CI , respectively. The conditional effect roughly doubles from low to high NFT, consistent with H3. The chain-specific indirect effect of AR on compensatory behavioral intention via perceived haptic gap and haptic craving was (BootSE , 95% Boot CI ) at low NFT and (BootSE , 95% Boot CI ) at high NFT; the index of moderated mediation was , BootSE , 95% Boot CI (the sign reflects the 0/1 coding of NFT).
A complementary 2 (interface: AR vs. 3D model) × 2 (NFT: low vs. high via median split) ANOVA on compensatory behavioral intention yielded a significant interface main effect, with , , and ; a significant NFT main effect, with , , and ; and a significant interaction, with , , and . Simple-effect decomposition showed a large AR effect among high-NFT consumers (3D , AR ; , , Cohen’s ) and an essentially null effect among low-NFT consumers (3D , AR ; , , Cohen’s ), converging with the PROCESS analysis.
Additional robustness checks confirmed that (a) an alternative specification with the mediator order reversed (haptic craving as , perceived haptic gap as ) produced a non-significant reversed chain (indirect , BootSE , 95% Boot CI ), supporting the pre-specified theoretical sequence; (b) controlling for sex, age band, and income band left the main effect of condition on compensatory behavioral intention effectively unchanged (, , and ), with all covariate terms non-significant (all ); and (c) excluding the fastest 5% of completers (median time under 7 min) preserved all reported inferences, with , , and .
Appendix C. Experimental Materials for Study 3
Sample: One hundred sixty university students at a Chinese university in the southwest region participated in Study 3. Recruitment used the same three parallel channels as Study 1 (course-level group chats, departmental participant-pool email list, on-campus poster notices). Eligibility required (a) an age of 18 or older; (b) normal or corrected-to-normal vision; (c) no severe history of motion sickness with head-mounted displays; and (d) no prior participation in Studies 1 or 2, which shared the same campus. Each participant received a cash honorarium of CNY 15 after completing the full procedure, not contingent on performance. Participants signed an informed-consent form documenting study purpose, anonymization, withdrawal rights, and acknowledgment of head-mounted display use. Random assignment drew from a pre-generated random-order list stratified by sex to ensure balanced composition across the four cells of the 2 (presentation method: AR vs. VR) × 2 (haptic accessibility: low vs. high) between-subjects design. Target cell size was 40 per cell and was achieved exactly (40 × 4 = 160).
Procedure: After arrival and consent, the experimenter drew the next stratified assignment and revealed the cell (AR or VR crossed with low or high haptic accessibility). The experimenter fitted the Meta Quest 3 headset, adjusted the head strap, calibrated inter-pupillary distance, and verified clarity with the headset’s focus card. The rendering mode was then set: passthrough (see-through) mode for AR, so that the participant saw the actual laboratory room augmented with a virtual teddy bear anchored to a physical table approximately 1.2 m in front of them; or a fully immersive VR scene rendering a plain, emotionally neutral virtual room (light-grey walls, plain virtual table) into which the same teddy-bear model was placed at the same visual scale.
Immediately before the viewing task, the experimenter delivered a standardized verbal instruction corresponding to the participant’s haptic-accessibility cell. Instruction scripts were memorized and checked for fidelity by a supervisor during pilot runs. Low-haptic-accessibility script: “During the viewing task that is about to begin, please keep your hands in your pockets at all times. Do not reach toward, gesture at, or otherwise attempt to interact manually with the object you will see. Just look at it carefully.” High-haptic-accessibility script: “During the viewing task that is about to begin, you are welcome to use your hands in the air to mimic touching or stroking the object you will see. You will not actually feel anything under your fingers, but feel free to make these touching gestures whenever you wish.” Participants then observed the teddy-bear rendering for approximately 90 s while the experimenter silently monitored compliance from outside the participant’s peripheral field.
After the headset was removed, participants completed a paper questionnaire in fixed order: the haptic-accessibility manipulation check (three items), perceived haptic gap (three items), haptic craving (four items), review helpfulness (two items, after display of a user review of the teddy bear), chair purchase intention (two items, after display of the chair scenario), and demographics. The review was fabricated but contained naturalistic language with rich haptic cues (softness, fluffiness, smooth fabric finish); the same review was shown to all participants. The chair scenario read: “Suppose you are shopping for an office chair for your home workspace. The following chair is displayed on an e-commerce page.” A photograph of an office chair with prominently advertised tactile softness was shown; the same chair appeared across conditions. Debriefing and payment followed. Total session duration averaged 28 min. Figure A3 shows the AR-vs.-VR presentation renderings, and Figure A4 shows the review card and chair-advertisement stimuli.
Figure A3.
Stimulus renderings for Study 3. (Left): AR passthrough condition, with the teddy bear anchored on a physical table. (Right): VR immersive condition, with the same teddy bear on a virtual table in a neutral virtual room.
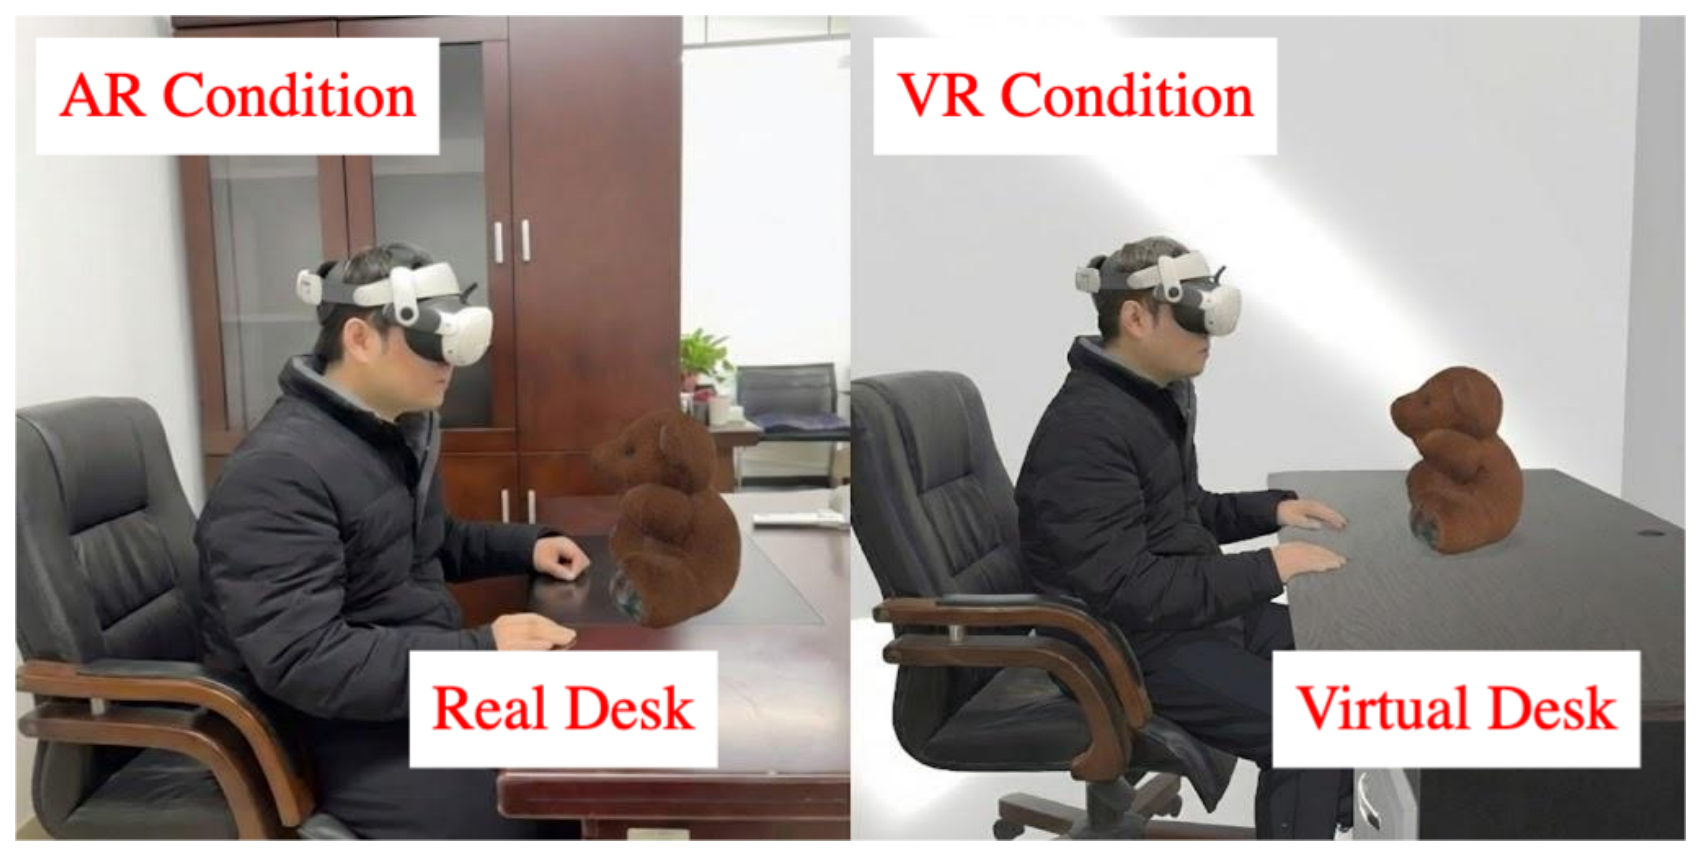
Measures: All self-report items used a five-point Likert response format (1 = strongly disagree, 5 = strongly agree) unless noted; Chinese adaptations used translation–back-translation [67]. Perceived haptic gap (three items, α = 0.76) and haptic craving (four items, α = 0.82) used the identical wording as Study 2 (see Appendix B).
Review helpfulness (two items, α = 0.81; adapted from Filieri, Alguezaui, and McLeay [49]): (1) “This review is helpful.” (2) “This review provides useful information for my decision.”
Figure A4.
Study 3 review-helpfulness and cross-context chair-purchase stimuli. (a) User-review card with naturalistic haptic-cue language. (b) Office-chair advertisement emphasising tactile softness. Both stimuli were presented in Chinese; an English translation of all on-screen text is given immediately below.
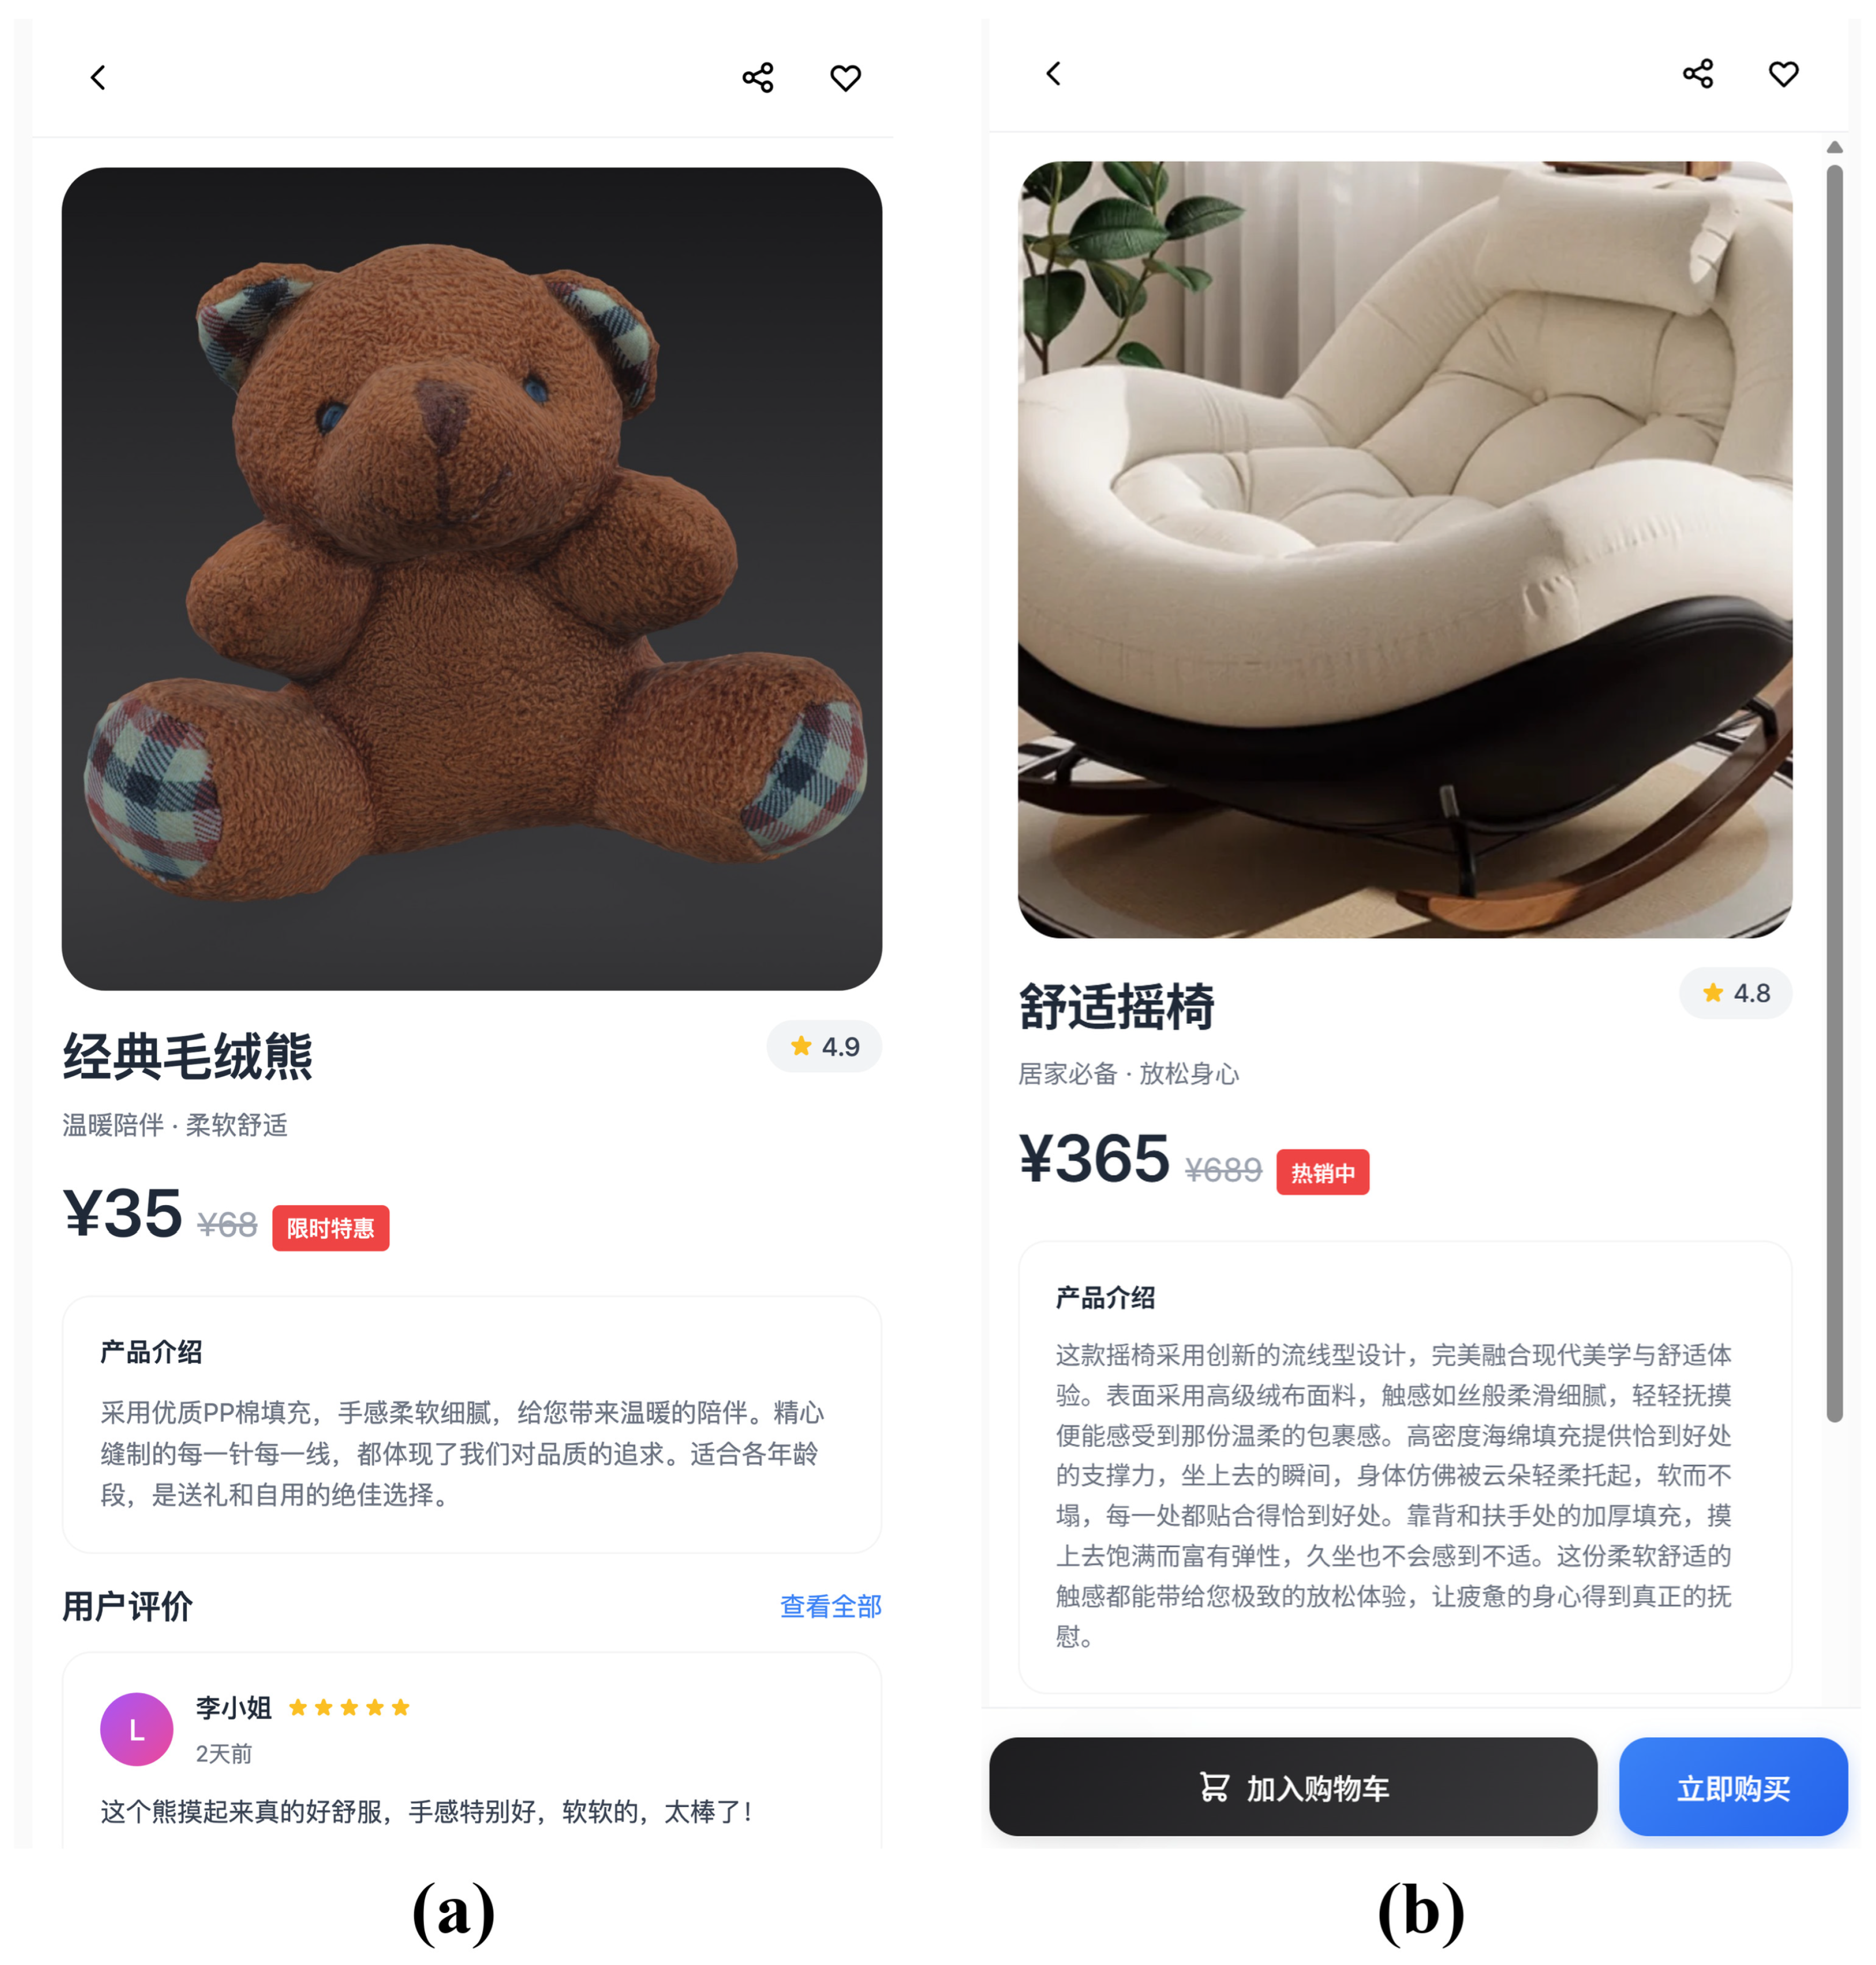
Both stimuli in Figure A4 were presented in Chinese, the participants’ native language, and are reproduced above exactly as they appeared on screen. All substantive on-screen text translates as follows.
Review card (panel a). Product title: “Classic Plush Bear”; strapline: “Warm companionship; soft and comfortable”; rating 4.9; price CNY 35, reduced from CNY 68, flagged “limited-time offer”. Product description: “Filled with high-quality PP cotton, it feels soft and fine to the touch and brings you warm companionship. Every stitch is carefully sewn and reflects our pursuit of quality. Suitable for all ages, it is an excellent choice as a gift or for yourself.” Customer reviews section, one review, posted by “Ms. Li” two days earlier with a five-star rating: “This bear feels really comfortable to touch, the texture is especially good, so soft, wonderful!” Buttons: “Add to cart” and “Buy now”.
Chair advertisement (panel b). Product title: “Comfort Rocking Chair”; strapline: “A home essential; relax body and mind”; rating 4.8; price CNY 365, reduced from CNY 689, flagged “best seller”. Product description: “This rocking chair uses an innovative streamlined design that blends modern aesthetics with a comfortable experience. The surface is finished in a premium velvet fabric whose touch is as smooth and fine as silk; a light stroke is enough to feel its gentle, enveloping softness. High-density foam filling provides exactly the right support: the moment you sit down, your body seems to be lifted gently by a cloud, soft without sagging, fitting closely at every point. The thickened padding at the backrest and armrests feels full and springy to the touch, so that sitting for long periods never becomes uncomfortable. This soft, comfortable feel gives you the ultimate relaxing experience and truly soothes a tired body and mind.” Buttons: “Add to cart” and “Buy now”.
Haptic-accessibility manipulation check (three items, α = 0.92; adapted from Peck and Childers [20]): Higher scores reflect more constraint (i.e., lower subjective haptic accessibility): (1) “During the viewing task, I felt I could not physically interact with (touch) the product.” (2) “While looking at the product, I felt that I lacked the opportunity to touch it.” (3) “During the viewing task, I could not use my hand to touch this plush bear.”
Office-chair purchase intention (two items, α = 0.80; adapted from Dodds, Monroe, and Grewal [64]): (1) “I would be willing to purchase this office chair.” (2) “If I had the opportunity, I would probably purchase this office chair.”
Demographics: sex (male/female/prefer not to say); age band (18–25, 26–33, 34–40, 41 and above); monthly income band (under CNY 1000, 1001–2000, 2001–3000, 3001–4000); education level (undergraduate, master’s, doctoral).
Manipulation checks: The haptic-accessibility manipulation check (composite of three items, α = 0.92) was analyzed by a 2 × 2 ANOVA with presentation method and haptic accessibility as factors. The haptic-accessibility factor produced a very large effect, with , , and ; the main effect of the presentation method was not significant, at , , and ; and the interaction was not significant, at , , and . Cell means on the manipulation-check composite were () under low haptic accessibility (hands in pockets) and () under high haptic accessibility (air-touch). The haptic-accessibility manipulation was therefore successfully isolated from the AR vs. VR contrast. The presentation-method manipulation (AR passthrough vs. VR immersive room) was controlled at the apparatus level (Meta Quest 3 mode selection) and could be directly verified rather than inferred from self-report. All 160 participants completed the viewing task in the correct mode as recorded by the experimenter checklist; no participant exhibited spontaneous mode-switching or apparatus failure during the task, so no self-report check was administered for presentation method.
Table A5.
Demographic composition of Study 3 (N = 160).
Table A6.
Cell means on core dependent variables in Study 3 (four cells, 40 participants each).
Data-analysis methods: A PROCESS Model 6 (Bootstrap = 5000) was estimated with presentation method (AR = 1, VR = 0) as X, perceived haptic gap as , haptic craving as , and review helpfulness as Y.
Table A7.
Path coefficients from the chain mediation model (Study 3).
Table A8.
Direct and indirect effects of presentation method on review helpfulness (Study 3).
The pre-registered chain (AR → perceived haptic gap → haptic craving → review helpfulness) is significant, as is the two-step AR → haptic craving → review helpfulness path. The single-mediator path through perceived haptic gap alone is not significant, consistent with the theoretical prediction that the appraised gap must be translated through craving to reach behaviorally relevant downstream evaluations.
PROCESS Model 86 (Bootstrap = 5000) tested whether haptic accessibility moderates the first stage (presentation method → perceived haptic gap). On perceived haptic gap: presentation method (AR = 1): , , , ; haptic accessibility (high = 1): , , , ; presentation × haptic accessibility: , , , . The conditional effect of AR on perceived haptic gap was , , under low haptic accessibility and , , under high haptic accessibility.
Table A9.
Conditional chain-specific indirect effects of AR on review helpfulness (Study 3).
The index of moderated mediation is significant, confirming that haptic accessibility moderates the compensatory chain at its first stage: AR’s amplification of the perceived haptic gap (and the cascade into haptic craving and review helpfulness) is substantially larger when touch-related action is blocked than when it is encouraged.
To test whether the compensatory chain generalizes to an unrelated tactile-relevant choice, we re-estimated PROCESS Model 86 with chair purchase intention substituted as the dependent variable. A two-way ANOVA on chair purchase intention yielded a non-significant haptic-accessibility main effect, with , , and ; a very large presentation-method main effect, with , , and ; and a significant interaction, with , , and .
Table A10.
Estimated marginal means for chair purchase intention (Study 3).
The interaction pattern parallels the review-helpfulness pattern: the compensatory state, once activated, generalizes from information reliance (review helpfulness) to a downstream tactile-attribute product choice (office-chair softness). The main effect of presentation method on chair purchase intention () is substantially larger than on review helpfulness (), suggesting that AR’s effect on purchase-relevant preference for tactile-attribute products is stronger than its effect on haptic-cue information weighting, at least in this stimulus context.
Robustness checks confirmed that (a) covariate-adjusted 2 × 2 ANOVAs on review helpfulness and chair purchase intention (controlling for sex and age band) preserved all reported main effects and the presentation × haptic accessibility interaction at comparable magnitudes and significance levels, with all covariate terms non-significant (all p > 0.28); (b) an auxiliary PROCESS Model 7 using the manipulation-check composite as a continuous first-stage moderator converged with the categorical-moderator analysis: the presentation × haptic accessibility interaction on perceived haptic gap remained significant, with a stronger conditional AR effect at higher constraint composite values (i.e., lower objective accessibility); and (c) a compliance audit scored each participant as fully or partially compliant with the haptic-accessibility instruction, with 154 of 160 (96.25%) fully compliant; re-estimating the focal analyses on the fully compliant subsample produced results within one decimal place of the full-sample values, confirming that partial compliance did not meaningfully affect inferences.
References
- Fortune Business Insights. Augmented Reality (AR) Market Size, Share and Industry Analysis, 2025–2034; Fortune Business Insights: Pune, India, 2025; Available online: https://www.fortunebusinessinsights.com/augmented-reality-ar-market-102553 (accessed on 22 April 2026).
- Rauschnabel, P.A.; Babin, B.J.; tom Dieck, M.C.; Krey, N.; Jung, T. What is augmented reality marketing? Its definition, complexity, and future. J. Bus. Res. 2022, 142, 1140–1150. [Google Scholar] [CrossRef] [Scilit]
- Rauschnabel, P.A.; Felix, R.; Heller, J.; Hinsch, C. The 4C framework: Towards a holistic understanding of consumer engagement with augmented reality. Comput. Hum. Behav. 2024, 154, 108105. [Google Scholar] [CrossRef] [Scilit]
- Yim, M.Y.-C.; Chu, S.-C.; Sauer, P.L. Is augmented reality technology an effective tool for e-commerce? An interactivity and vividness perspective. J. Interact. Mark. 2017, 39, 89–103. [Google Scholar] [CrossRef] [Scilit]
- Speicher, M.; Hall, B.D.; Nebeling, M. What is mixed reality? In Proceedings of the 2019 CHI Conference on Human Factors in Computing Systems, Glasgow, UK, 4–9 May 2019; ACM: New York, NY, USA, 2019; pp. 1–15. [Google Scholar] [CrossRef] [Scilit]
- Zhu, L.; Du, J.; Zhang, Y. When closer feels cheaper: How AR undermines luxury perceptions compared to 3D visualization. J. Res. Interact. Mark. 2026. ahead-of-print. [Google Scholar] [CrossRef] [Scilit]
- Heller, J.; Chylinski, M.; de Ruyter, K.; Mahr, D.; Keeling, D.I. Touching the untouchable: Exploring multi-sensory augmented reality in the context of online retailing. J. Retail. 2019, 95, 219–234. [Google Scholar] [CrossRef] [Scilit]
- Negm, E. The impact of augmented reality on consumer behavior: A focus on value development, leading to brand engagement and purchase intention. Manag. Sustain. Arab Rev. 2025, 4, 320–341. [Google Scholar] [CrossRef] [Scilit]
- Flavián, C.; Ibáñez-Sánchez, S.; Orús, C. The impact of virtual, augmented and mixed reality technologies on the customer experience. J. Bus. Res. 2019, 100, 547–560. [Google Scholar] [CrossRef] [Scilit]
- Heller, J.; Chylinski, M.; de Ruyter, K.; Keeling, D.I.; Hilken, T.; Mahr, D. Tangible service automation: Decomposing the technology-enabled engagement process (TEEP) for augmented reality. J. Serv. Res. 2021, 24, 84–103. [Google Scholar] [CrossRef] [Scilit]
- Hilken, T.; de Ruyter, K.; Chylinski, M.; Mahr, D.; Keeling, D.I. Augmenting the eye of the beholder: Exploring the strategic potential of augmented reality to enhance online service experiences. J. Acad. Mark. Sci. 2017, 45, 884–905. [Google Scholar] [CrossRef] [Scilit]
- Poushneh, A.; Vasquez-Parraga, A.Z. Discernible impact of augmented reality on retail customer’s experience, satisfaction and willingness to buy. J. Retail. Consum. Serv. 2017, 34, 229–234. [Google Scholar] [CrossRef] [Scilit]
- Zhou, L.; Niu, L.; Wang, C.L.; Wu, B.; Deng, X. Bridging the mental gap: The impact of augmented reality multiproduct presentation and recommendation strategy on consumer satisfaction. Int. J. Consum. Stud. 2025, 49, e70082. [Google Scholar] [CrossRef] [Scilit]
- Maheswari, P.; Balakrishnan, S. Immersive marketing: Exploring the impact of virtual and augmented reality on consumer behavior and brand engagement. Eur. Econ. Lett. 2025, 15, 148–152. [Google Scholar] [CrossRef] [Scilit]
- Wang, C.L. Editorial: The changing landscape of marketing research in the AI era: Prospects and challenges. J. Res. Interact. Mark. 2026, 20, 1–10. [Google Scholar] [CrossRef] [Scilit]
- Zhu, J.; Jiang, L.; Dou, W.; Wang, V.L.; Zhou, L. Beyond the “like” button: Ideal social self-congruity’s role in shaping consumer behaviors on social media. J. Res. Interact. Mark. 2025, 19, 969–983. [Google Scholar] [CrossRef] [Scilit]
- Citrin, A.V.; Stem, D.E.; Spangenberg, E.R.; Clark, M.J. Consumer need for tactile input: An Internet retailing challenge. J. Bus. Res. 2003, 56, 915–922. [Google Scholar] [CrossRef] [Scilit]
- Krishna, A. An integrative review of sensory marketing: Engaging the senses to affect perception, judgment and behavior. J. Consum. Psychol. 2012, 22, 332–351. [Google Scholar] [CrossRef] [Scilit]
- Luangrath, A.W.; Peck, J.; Hedgcock, W.; Xu, Y. Observing product touch: The vicarious haptic effect in digital marketing and virtual reality. J. Mark. Res. 2022, 59, 306–326. [Google Scholar] [CrossRef] [Scilit]
- Peck, J.; Childers, T.L. Individual differences in haptic information processing: The “Need for Touch” scale. J. Consum. Res. 2003, 30, 430–442. [Google Scholar] [CrossRef] [Scilit]
- Peck, J.; Shu, S.B. The effect of mere touch on perceived ownership. J. Consum. Res. 2009, 36, 434–447. [Google Scholar] [CrossRef] [Scilit] [PubMed]
- Wang, C.L. Editorial: What is an interactive marketing perspective and what are emerging research areas? J. Res. Interact. Mark. 2024, 18, 161–165. [Google Scholar] [CrossRef] [Scilit]
- Trope, Y.; Liberman, N. Construal-level theory of psychological distance. Psychol. Rev. 2010, 117, 440–463. [Google Scholar] [CrossRef] [Scilit] [PubMed]
- Gibson, J.J. The Ecological Approach to Visual Perception; Houghton Mifflin: Boston, MA, USA, 1979. [Google Scholar]
- Burgoon, J.K. Interpersonal expectations, expectancy violations, and emotional communication. J. Lang. Soc. Psychol. 1993, 12, 30–48. [Google Scholar] [CrossRef] [Scilit]
- Mandel, N.; Rucker, D.D.; Levav, J.; Galinsky, A.D. The compensatory consumer behavior model: How self-discrepancies drive consumer behavior. J. Consum. Psychol. 2017, 27, 133–146. [Google Scholar] [CrossRef] [Scilit]
- Zhou, L.; Niu, L.; Wang, V.L.; Wu, B. Virtual journeys, shared meaning: Enhancing consumer well-being of mobility-limited older adults through virtual reality tourism. J. Bus. Res. 2026, 206, 115975. [Google Scholar] [CrossRef] [Scilit]
- Barsalou, L.W. Grounded cognition. Annu. Rev. Psychol. 2008, 59, 617–645. [Google Scholar] [CrossRef] [Scilit] [PubMed]
- Zhou, L.; Niu, L.; Zhao, T. The differential effects of augmented reality and product presentation strategies on brand recall: An embodied cognition perspective. J. Theor. Appl. Electron. Commer. Res. 2024, 19, 3035–3050. [Google Scholar] [CrossRef] [Scilit]
- Keinan, A.; Kivetz, R. Productivity orientation and the consumption of collectable experiences. J. Consum. Res. 2011, 37, 935–950. [Google Scholar] [CrossRef] [Scilit]
- Rucker, D.D.; Galinsky, A.D. Desire to acquire: Powerlessness and compensatory consumption. J. Consum. Res. 2008, 35, 257–267. [Google Scholar] [CrossRef] [Scilit]
- Racat, M.; Capelli, S. Haptic Sensation and Consumer Behaviour: The Influence of Tactile Stimulation in Physical and Online Environments; Palgrave Macmillan: Cham, Switzerland, 2020. [Google Scholar] [CrossRef] [Scilit]
- Festinger, L. A Theory of Cognitive Dissonance; Stanford University Press: Stanford, CA, USA, 1957. [Google Scholar]
- Peck, J.; Wiggins, J. It just feels good: Customers’ affective response to touch and its influence on persuasion. J. Mark. 2006, 70, 56–69. [Google Scholar] [CrossRef] [Scilit]
- Zhou, L.; Wang, V.L. “What’s in a name?”: The effect of AI agent naming on psychological ownership and responsible behaviors in the shared economy. J. Appl. Bus. Behav. Sci. 2025, 1, 145–163. [Google Scholar] [CrossRef] [Scilit]
- Kim, S.; Park, H.; Lim, R.E. Unveiling product imagination and decision comfort through personalized virtual try-on: The moderating role of spatial processing perception. J. Res. Interact. Mark. 2025, 19, 387–407. [Google Scholar] [CrossRef] [Scilit]
- Peck, J.; Barger, V.A.; Webb, A. In search of a surrogate for touch: The effect of haptic imagery on perceived ownership. J. Consum. Psychol. 2013, 23, 189–196. [Google Scholar] [CrossRef] [Scilit]
- Bhatt, V.; Fatma, A.; Nand Jha, S.; Sinha, B. Touch influencing purchases: The role of haptic technology in retail. Int. J. Hum.-Comput. Interact. 2026, 42, 9234–9257. [Google Scholar] [CrossRef] [Scilit]
- Pandey, D.; Mukherjee, S. Can multi-sensory affordance mitigate the shortcomings of Metaverse offerings? J. Mark. Theory Pract. 2026, 34, 55–87. [Google Scholar] [CrossRef] [Scilit]
- Petit, O.; Velasco, C.; Spence, C. Digital sensory marketing: Integrating new technologies into multisensory online experience. J. Interact. Mark. 2019, 45, 42–61. [Google Scholar] [CrossRef] [Scilit]
- Peck, J.; Childers, T.L. To have and to hold: The influence of haptic information on product judgments. J. Mark. 2003, 67, 35–48. [Google Scholar] [CrossRef] [Scilit]
- Krishna, A.; Morrin, M. Does touch affect taste? The perceptual transfer of product container haptic cues. J. Consum. Res. 2008, 34, 807–818. [Google Scholar] [CrossRef] [Scilit]
- Joy, A.; Sherry, J.F., Jr. Speaking of art as embodied imagination: A multisensory approach to understanding aesthetic experience. J. Consum. Res. 2003, 30, 259–282. [Google Scholar] [CrossRef] [Scilit] [PubMed]
- Brehm, J.W. A Theory of Psychological Reactance; Academic Press: New York, NY, USA, 1966. [Google Scholar]
- Miron, A.M.; Brehm, J.W. Reactance theory—40 years later. Z. Sozialpsychol. 2006, 37, 9–18. [Google Scholar] [CrossRef] [Scilit]
- Clee, M.A.; Wicklund, R.A. Consumer behavior and psychological reactance. J. Consum. Res. 1980, 6, 389–405. [Google Scholar] [CrossRef] [Scilit] [PubMed]
- Fitzsimons, G.J.; Lehmann, D.R. Reactance to recommendations: When unsolicited advice yields contrary responses. Mark. Sci. 2004, 23, 82–94. [Google Scholar] [CrossRef] [Scilit]
- Alex, L.; Mai, R.; Rauschnabel, P.A. Similar but different: The differential implications of augmented and virtual reality experiences for raising engagement towards climate change actions. Comput. Hum. Behav. 2026, 174, 108798. [Google Scholar] [CrossRef] [Scilit]
- Filieri, R.; Alguezaui, S.; McLeay, F. Why do travelers trust TripAdvisor? Antecedents of trust towards consumer-generated media and its influence on recommendation adoption and word of mouth. Tour. Manag. 2015, 51, 174–185. [Google Scholar] [CrossRef] [Scilit]
- Barari, M.; Ngo, L.V.; Quach, S.; Thaichon, P. Meta-analysis of augmented reality and virtual reality in marketing. Eur. J. Mark. 2026, 60, 932–964. [Google Scholar] [CrossRef] [Scilit]
- Kim, S.; Gal, D. From compensatory consumption to adaptive consumption: The role of self-acceptance in resolving self-deficits. J. Consum. Res. 2014, 41, 526–542. [Google Scholar] [CrossRef] [Scilit]
- Lisjak, M.; Bonezzi, A.; Kim, S.; Rucker, D.D. Perils of compensatory consumption: Within-domain compensation undermines subsequent self-regulation. J. Consum. Res. 2015, 41, 1186–1203. [Google Scholar] [CrossRef] [Scilit]
- Zhou, L.; Xue, F.; Barton, M.H. Visual attention, brand personality and mental imagery: An eye-tracking study of virtual reality (VR) advertising design. J. Res. Interact. Mark. 2026, 20, 182–198. [Google Scholar] [CrossRef] [Scilit]
- Hsieh, J.-K.; Kumar, S. Revisiting the impact of consumers’ need for touch on webrooming intention: The perspective of maximizing mindset theory. J. Res. Interact. Mark. 2024, 18, 688–708. [Google Scholar] [CrossRef] [Scilit]
- Bergkvist, L.; Rossiter, J.R. The predictive validity of multiple-item versus single-item measures of the same constructs. J. Mark. Res. 2007, 44, 175–184. [Google Scholar] [CrossRef] [Scilit]
- Fornell, C.; Larcker, D.F. Evaluating structural equation models with unobservable variables and measurement error. J. Mark. Res. 1981, 18, 39–50. [Google Scholar] [CrossRef] [Scilit]
- Henseler, J.; Ringle, C.M.; Sarstedt, M. A new criterion for assessing discriminant validity in variance-based structural equation modeling. J. Acad. Mark. Sci. 2015, 43, 115–135. [Google Scholar] [CrossRef] [Scilit]
- Anderson, J.C.; Gerbing, D.W. Structural equation modeling in practice: A review and recommended two-step approach. Psychol. Bull. 1988, 103, 411–423. [Google Scholar] [CrossRef]
- Podsakoff, P.M.; MacKenzie, S.B.; Lee, J.-Y.; Podsakoff, N.P. Common method biases in behavioral research: A critical review of the literature and recommended remedies. J. Appl. Psychol. 2003, 88, 879–903. [Google Scholar] [CrossRef] [Scilit] [PubMed]
- Baker, J.; Parasuraman, A.; Grewal, D.; Voss, G.B. The influence of multiple store environment cues on perceived merchandise value and patronage intentions. J. Mark. 2002, 66, 120–141. [Google Scholar] [CrossRef] [Scilit]
- Rook, D.W. The buying impulse. J. Consum. Res. 1987, 14, 189–199. [Google Scholar] [CrossRef] [Scilit] [PubMed]
- Beatty, S.E.; Ferrell, M.E. Impulse buying: Modeling its precursors. J. Retail. 1998, 74, 169–191. [Google Scholar] [CrossRef] [Scilit]
- Hayes, A.F. Introduction to Mediation, Moderation, and Conditional Process Analysis: A Regression-Based Approach, 2nd ed.; The Guilford Press: New York, NY, USA, 2018. [Google Scholar]
- Dodds, W.B.; Monroe, K.B.; Grewal, D. Effects of price, brand, and store information on buyers’ product evaluations. J. Mark. Res. 1991, 28, 307–319. [Google Scholar] [CrossRef] [Scilit]
- Wang, C.L. Editorial: Demonstrating contributions through storytelling. J. Res. Interact. Mark. 2025, 19, 1–4. [Google Scholar] [CrossRef] [Scilit]
- Paraman, P.; Chee Hoo, W.; Spr, C.R.; Dong, Y. The illusion of heft: Using low-cost pseudo-haptics to increase purchase intent and perceived value in virtual retail. Int. J. Hum.-Comput. Interact. 2026, 1–22. [Google Scholar] [CrossRef] [Scilit]
- Brislin, R.W. Back-translation for cross-cultural research. J. Cross-Cult. Psychol. 1970, 1, 185–216. [Google Scholar] [CrossRef] [Scilit]
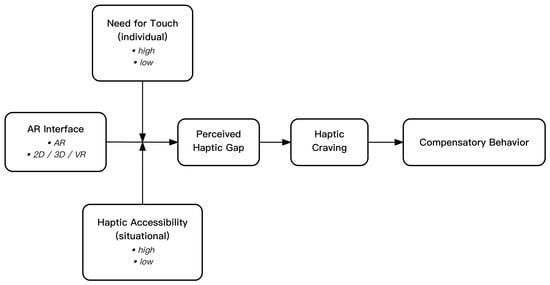
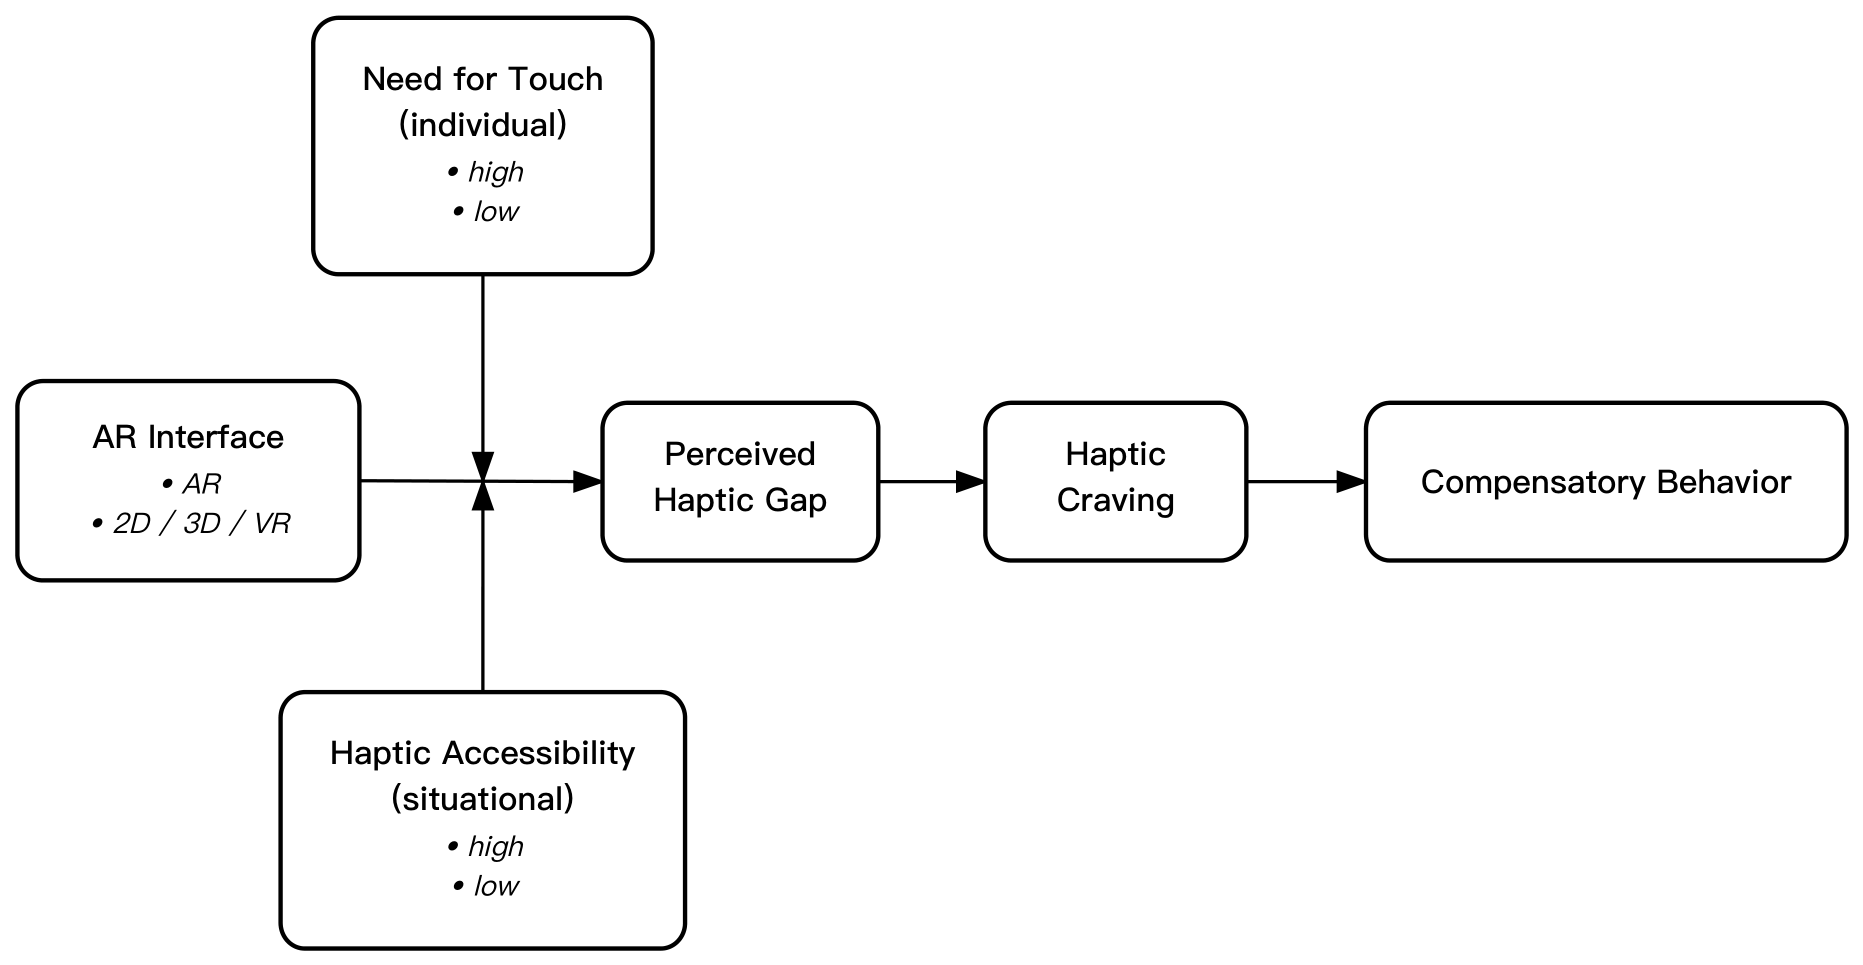
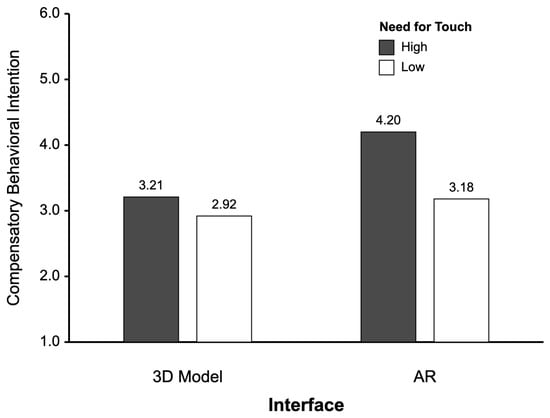
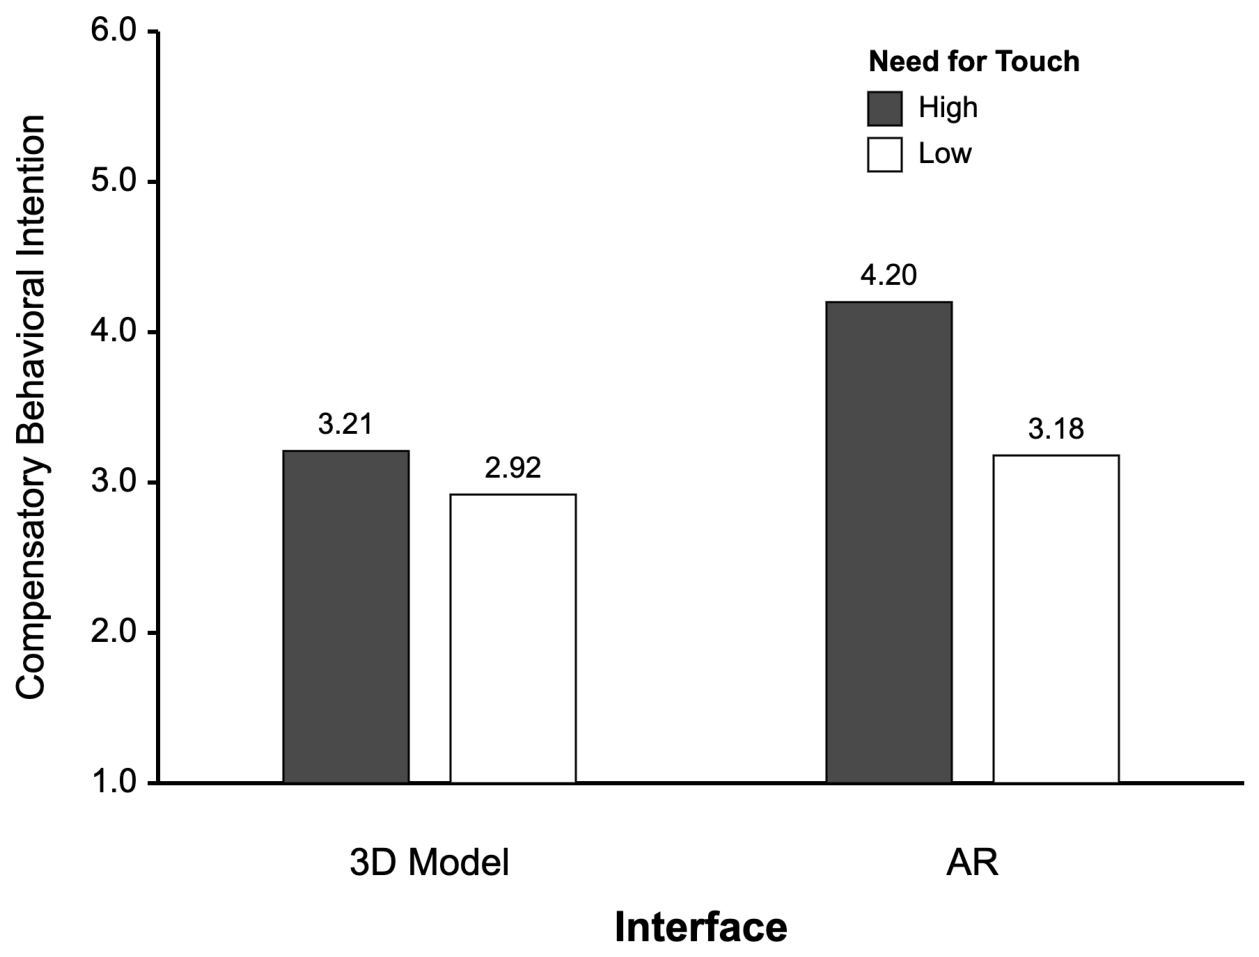
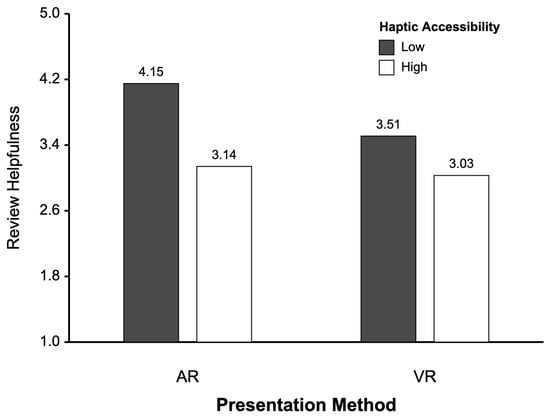

Disclaimer/Publisher’s Note: The statements, opinions and data contained in all publications are solely those of the individual author(s) and contributor(s) and not of MDPI and/or the editor(s). MDPI and/or the editor(s) disclaim responsibility for any injury to people or property resulting from any ideas, methods, instructions or products referred to in the content. |
© 2026 by the authors. Licensee MDPI, Basel, Switzerland. This article is an open access article distributed under the terms and conditions of the Creative Commons Attribution (CC BY) license.