


Abstract
Algorithmic personalization is the flagship mechanism of interactive marketing: platforms learn from user behavior and respond with individually curated value propositions, and industry practice treats the quality of that loop as a lever for customer retention. Whether personalization actually converts into consumer commitment—operationalized here as continuance intention—has been tested almost exclusively in affluent, algorithm-saturated markets. This study tests the conversion where the assumption should be most fragile: subscription video-on-demand in Albania, a price-sensitive transitional European market. Drawing on an extended value-based expectation-confirmation model within a stimulus–organism–response structure, algorithmic personalization, perceived value, and cross-device compatibility are modeled as antecedents of customer satisfaction and continuance intention—the attitudinal antecedent of subscription renewal—among 284 Albanian subscribers, using partial least squares structural equation modeling with 5000 bias-corrected bootstrap resamples. Personalization did not predict continuance intention directly (β = −0.060, ns), and its total effect was effectively zero (−0.004): the significant but weak indirect pathway through satisfaction was offset by the small negative direct path. Perceived value dominated—associated with continuance intention directly (β = 0.337) and through satisfaction (total effect = 0.609)—and emerged in an importance–performance map analysis as the highest-importance, lowest-performing construct. Robustness analyses show the null is not a measurement artifact and sharpens among personal payers; within the sample, it decomposes into a modestly positive personalization effect among lower-income subscribers and a negative effect among higher-income respondents (difference p = 0.003), contradicting a simple income-constraint account and leaving the moderating mechanism open. The findings provide evidence for the market contingency of personalization’s retention promise: in this market, the algorithm does not earn the renewal; the value proposition does.
1. Introduction
Interactive marketing has made digital commerce a two-way, data-rich exchange: platforms observe behavior, infer preferences, and respond with individually curated value propositions. Algorithmic personalization is the flagship of that logic, and nowhere is it more visible than in subscription video-on-demand (VOD), where recommendation engines mediate nearly every content decision and providers treat recommendation quality as a lever against churn [1]. The commercial stakes are considerable: as streaming options multiply and consumers grow reluctant to pay for several services simultaneously [2], the economics of the industry depend less on winning subscribers than on keeping them [3,4,5]. Yet theoretical understanding of whether—and under which market conditions—algorithmic curation converts into consumer commitment has not kept pace with the confidence that practice places in it.
The academic account of subscription renewal rests on post-adoption models. The expectation-confirmation model (ECM) holds that continuance intention follows from satisfaction, which follows from the confirmation of expectations [6,7]. The value-based extensions (V-ECM) position perceived value as the focal cognitive antecedent, reflecting that a recurring-revenue digital service is re-purchased, month after month, on a benefit–cost calculus [8,9]. Within this architecture, algorithmic personalization and seamless multi-device access enter as platform stimuli expected to feed satisfaction and, through it, commitment—with personalization often credited with a direct retention effect of its own [4,10].
The evidence for that credit, however, is drawn from a narrow band of market conditions. The empirical base on VOD continuance and retention is concentrated in affluent or very large digital economies—East, Southeast, and South Asia; North America; and Western Europe (for a review, see [4,5,10,11,12,13])—settings in which willingness to pay is high and content discovery runs substantially through the algorithm. Small, price-sensitive transitional markets are conspicuously underrepresented in this base, and two conditions in such markets plausibly weaken the personalization–retention link: subscriptions compete for constrained discretionary income, making renewal a value judgment rather than a convenience judgment; and content discovery in small, socially dense markets is substantially interpersonal, loosening the algorithm’s grip on the customer journey [14,15]. These are not sampling inconveniences; they are theoretically motivated moderating conditions under which interactive marketing’s flagship mechanism should be weakest—and therefore where testing it is most informative, particularly in a European landscape fragmented along linguistic and regulatory lines [16,17]. Both conjectures are subjected to within-sample probes in Section 4.6.
Two structural features of the European streaming landscape sharpen the case for small-market evidence. First, the European VOD market is not one market: catalogue composition, licensing windows, and price points differ substantially across territories, and regulatory instruments such as European content quotas interact with platform strategy in country-specific ways [16,17]. Second, audiences in small European countries have been shown to engage with global catalogues selectively, navigating a tension between globally promoted titles and locally resonant content [14]. Findings estimated on large, saturated markets therefore cannot simply be assumed to hold in small transitional ones; they must be tested there.
Albania is a useful test case. Digital readiness is high: in 2024, 86.2% of the population aged 16 to 74 used the internet, and 96.4% of users accessed it several times per day [18]. At the same time, the market remains small and price-sensitive, with regulatory data indicating roughly 40,000 streaming subscribers and 14 authorized over-the-top operators as of 2023 [19]. VOD subscriptions in such a setting are scrutinized as discretionary expenses. If personalization-centered retention strategies depend on affluent, saturated markets, Albania is precisely where their limits should become visible.
The objective of the study is therefore to test whether the value–satisfaction architecture of post-adoption theory and the retention promise of algorithmic personalization in particular hold in a small, price-sensitive subscription VOD market. Two research questions guide the analysis. RQ1: To what extent do perceived value, personalized recommendations, and cross-device compatibility shape continuance intention among Albanian VOD subscribers, directly and through customer satisfaction? RQ2: Does perceived recommendation quality convert into continuance intention once perceived value and customer satisfaction are accounted for? This study accordingly tests an extended V-ECM, framed within the stimulus–organism–response (S-O-R) meta-structure, on survey data from 284 Albanian VOD subscribers.
The study makes three contributions. First, it provides evidence for a market contingency—a candidate boundary condition—of algorithmic personalization’s retention promise, in contrast with the positive effects reported in developed and large emerging markets [1,4,10]. Second, it demonstrates value primacy in this setting and argues for retaining a direct value-to-continuance path in value-based extensions of the expectation-confirmation model, translating the structural results into firm-level retention priorities through an importance–performance lens—customer retention being the behavioral basis of customer equity. Third, it supplies, to the authors’ knowledge, the first theory-driven evidence on VOD continuance from the Western Balkans, extending the cross-market base on which interactive marketing theory generalizes.
The remainder of the paper is organized as follows. Section 2 develops the theoretical background and hypotheses. Section 3 describes the design, sample, measures, and analytical strategy. Section 4 reports the measurement and structural results, the mediation analysis, the importance–performance map analysis, and the robustness analyses. Section 5 discusses the findings in the order of the hypotheses and weighs contextual against measurement-based explanations. Section 6 concludes with the study’s contributions, implications, limitations, and directions for future research.
2. Theoretical Background and Hypothesis Development
2.1. Post-Adoption Theory: From ECM to a Value-Based Extension
The expectation-confirmation model adapts consumer satisfaction theory [7] to information systems continuance: users form expectations, experience the service, judge the degree of confirmation, and derive satisfaction, which drives the intention to continue [6]. The ECM has proven to be the workhorse of streaming retention research, but its original cognitive antecedent, perceived usefulness, translates awkwardly to hedonic subscription services. What a VOD subscriber evaluates at renewal is less whether the service is useful than whether it is worth the money. Value-based extensions of the ECM therefore position perceived value—the consumer’s overall assessment of what is received relative to what is given [9]—as the focal cognitive antecedent of satisfaction and continuance [8]. Perceived value in entertainment services is multidimensional, comprising functional, hedonic, social, and economic facets [20,21], which is reflected in the operationalization adopted here.
The V-ECM maps naturally onto the stimulus–organism–response structure: platform attributes act as external stimuli, satisfaction constitutes the internal evaluative state of the organism, and continuance intention is the behavioral response. Uses and gratifications reasoning supplies the motivational logic for which stimuli matter—VOD viewers actively select services that gratify entertainment, social, and convenience needs [22,23]—while technology acceptance reasoning motivates the inclusion of usability-related stimuli such as multi-device access. The present model retains this integrative framing exactly: three sets of stimuli (perceived value, personalized recommendations, and cross-device compatibility), one organismic state (customer satisfaction), and one response (continuance intention).
2.2. The Evidence Base
The evidence base is uneven across the model’s relationships. The value–satisfaction-continuance chain is well documented, including in emerging markets [5,8]. The personalization–satisfaction link has been examined far less, primarily in East and Southeast Asian markets with high technology acceptance [4,10,13], and the full personalization–satisfaction–continuance chain only rarely [4,12,24]. These relationships remain untested in markets of this profile, as noted in the Introduction. The hypotheses concerning value, satisfaction, and continuance therefore replicate established relationships in a new context, while those concerning personalization test a thinner literature at the market conditions under which it should be most fragile.
2.3. Perceived Value
Perceived value reflects the subscriber’s evaluation of the service’s benefits relative to its cost [9,21]. Satisfaction results when the perceived value of a subscription service is high [7]. For streaming services, the content provided is the main component of the value proposition [11]. Furthermore, the concept of value is directly related to the decision to continue subscribing to the service; rational individuals will subscribe to services they perceive as worth the subscription fee [25]. Thus, in a market of individuals who are particularly price-sensitive to cheaper or no-cost alternatives for discretionary funds, both factors are likely to be pronounced in their influence over subscribers’ decisions.
Evidence from the streaming literature supports the idea that both factors influence streaming subscribers’ decisions. Reviews of streaming studies have found that perceived value is the most consistent predictor of subscriber satisfaction and loyalty [5]. Additionally, models that use streaming subscribers to determine the factors influencing their decisions have revealed the importance of the relationship between value and satisfaction [8]. Subscribers typically decide which services to select based on the quality of the content offered [26] and are willing to pay for these services based on the distinctive nature of the available content [11]. Thus, in markets where the cost of the subscription constitutes a significant portion of discretionary income, the economic aspects of streaming services are likely to be important to subscribers when making decisions about both satisfaction and subscription.
H1.
Perceived value positively affects customer satisfaction.
H2.
Perceived value positively affects continuance intention.
2.4. Personalized Recommendations
Recommendation agents match what a platform knows about a customer to the assortment that customer is shown [27,28,29]. For the customer, the benefit is a lower search cost: the products presented are those predicted to fit their preferences [30]. From the perspective of the theory of uses and gratifications, accurate product curation by the online platform gratifies the customer’s need for content (in this case, products) that is both relevant and easily obtained, leading to increased satisfaction [22]. Furthermore, many industry accounts of recommendation agents suggest that satisfaction is also likely to result from the use of such systems as a means of reducing churn in the company’s customer base [1]. In subscription VOD specifically, studies report that recommendation agents are associated with higher satisfaction and continued use of the service [4,10,13]. The generalization of these findings to a small, price-sensitive market in the transitional stage of development is the topic of this research study. In line with the bulk of the existing literature, it is hypothesized that the introduction of recommendation agents will have a positive effect on the satisfaction of customers who utilize those platforms for browsing and purchasing products; this study, then, can be considered an intentional and out-of-context replication of that established finding.
Yet another discussion in the literature on recommendation agents concerns the potential of such agents to reduce the customer’s sense of autonomy. In this view, personalization based on customer data may diminish customers’ desire for autonomy in their online commerce activity [1]. Furthermore, recommendations that are fulfilled according to an individual customer’s preferences may activate in those customers an awareness of the ways in which their activity is monitored and their data collected by the company [31]. This narrowing potential has empirical support: highly accurate recommendations have been shown to reduce users’ perceived diversity of the assortment [32]. Thus, the impact of recommendation agents on customer satisfaction and churn is not an unambiguous topic in the existing literature; rather, it is a question whose answer may vary depending on the specific context in which such agents are deployed on a company’s e-commerce platforms.
Personalization is operationalized in this study as the perceived quality of algorithmic recommendations—their accuracy, discovery value, effort reduction, and preference fit [30]. The construct is deliberately narrower than the full dimensional space of personalization discussed in the recent literature, which additionally encompasses algorithmic transparency, perceived user control, trust in algorithms, and concerns about the use of personal data [32,33,34,35,36,37], and in e-commerce extends beyond product recommendations to interface-level adaptation [38]. The hypotheses below therefore concern subscribers’ evaluative judgment of recommendation quality, and the scope of any conclusion is bounded accordingly (see Section 5 and Section 6).
H3.
Personalized recommendations positively affect customer satisfaction.
H4.
Personalized recommendations positively affect continuance intention.
2.5. Cross-Device Compatibility
VOD consumption occurs on televisions, laptops, tablets, and phones, and the perception of VOD services’ ubiquity across devices is an established factor that influences evaluations of those services [39]. The ability of users to transition seamlessly between devices minimizes the effort and technical friction associated with VOD consumption, factors linked to users’ satisfaction with VOD technology [40]. Furthermore, in markets saturated with VOD providers, technical prowess is often cited as a factor directly affecting the loyalty of VOD subscribers.
An analysis of VOD consumption in Europe, compared with other regions of the world, has found that access to VOD content on various devices is one factor that influences consumers’ willingness to pay for those services [41]. Additionally, studies investigating the quality of the VOD services provided to subscribers have found that factors related to the technical delivery of those services (such as buffering or startup delay) affect consumers’ evaluations of those services [42]. Thus, the items included in the analysis of European consumers include factors related to the technical aspects of the VOD services, such as the consistency of the consumer’s experience with the services, the continuity of the viewing experience across devices, the optimization of the user interface for those services, and the freedom of the service from technical faults when changing devices.
H5.
Cross-device compatibility positively affects customer satisfaction.
H6.
Cross-device compatibility positively affects continuance intention.
2.6. Customer Satisfaction and Its Mediating Role
Satisfaction is the central organismic state in the ECM: a cumulative, affect-laden evaluation of the consumption experience that directly establishes psychological commitment to continue [6,7,43]. Its positive effect on continuance intention is the most consistently replicated relationship in the streaming literature (e.g., [12,24]). Within the S-O-R structure, platform stimuli should not alter behavior in a vacuum; their impact on retention is filtered through the user’s internal evaluative state. Satisfaction is therefore hypothesized both as a direct predictor and as the mediator through which the three stimuli influence continuance intention.
Streaming-specific evidence reinforces the centrality of the satisfaction mechanism. Among Netflix subscribers, satisfaction has been shown to transmit the effects of expectation confirmation and enjoyment to continued subscription intentions [12]; in subscription VOD settings, satisfaction mediates the influence of perceived usefulness and personalization on continuance [4]; and moderation studies confirm the satisfaction–continuance link as a stable backbone across user segments [24]. What varies across studies is not whether satisfaction matters but which stimuli feed it and whether any stimulus retains an unmediated path to retention—the two questions this model is built to answer.
H7.
Customer satisfaction positively affects continuance intention.
H8a.
Customer satisfaction mediates the effects of perceived value on continuance intention.
H8b.
Customer satisfaction mediates the effects of personalized recommendations on continuance intention.
H8c.
Customer satisfaction mediates the effects of cross-device compatibility on continuance intention.
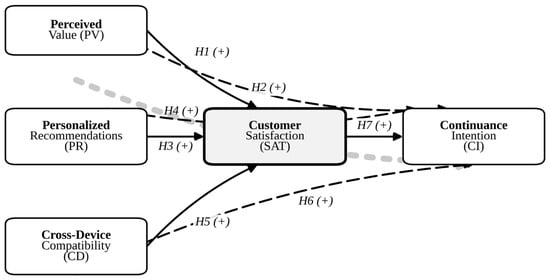
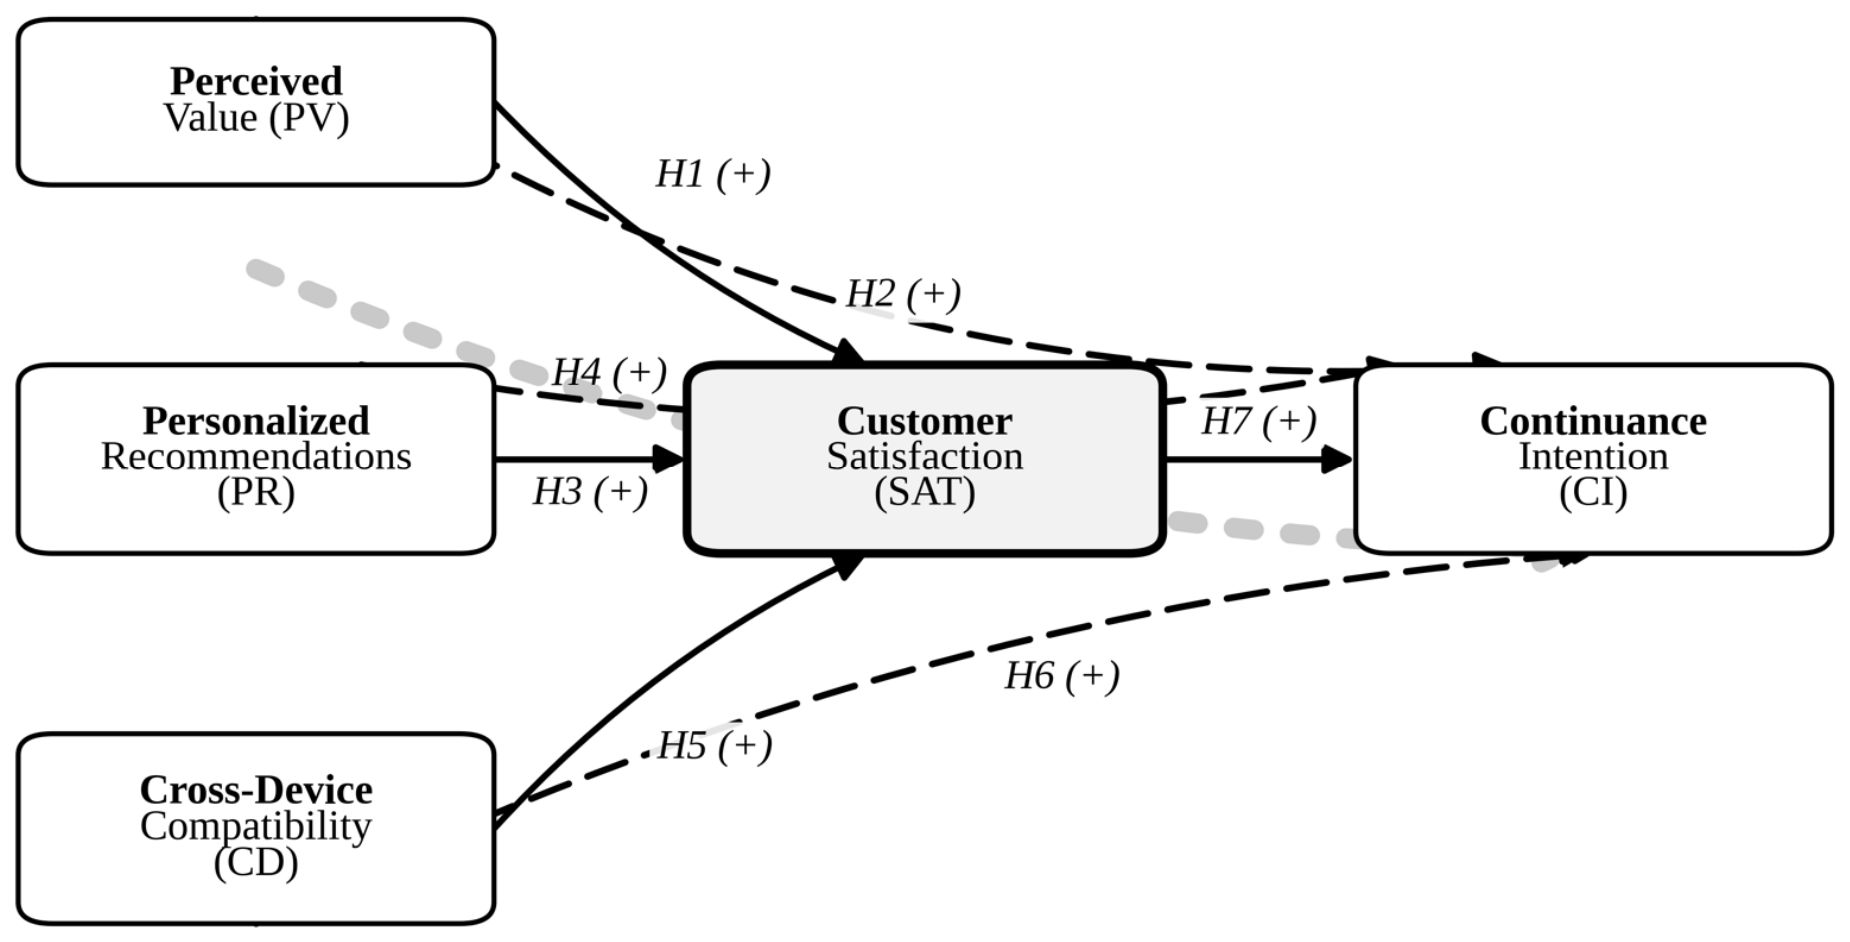
Figure 1 summarizes the conceptual model.
Figure 1.
Conceptual model and hypotheses. Theoretical framework: extended expectation-confirmation model [6] and perceived value theory [8,9]. Solid arrows represent the hypothesized paths to the mediator (H1, H3, H5) and from the mediator to the outcome (H7); dashed arrows represent the hypothesized direct effects on continuance intention (H2, H4, H6). The dotted band traces the hypothesized indirect effects of the three stimuli on continuance intention via customer satisfaction (H8a–H8c). The shaded construct is the mediator. All arrows indicate positive hypothesized effects.
3. Method
3.1. Design, Sampling, and Procedure
The study used a cross-sectional online survey of VOD users in Albania to test relationships identified as underexamined in the global literature. Because no sampling frame of Albanian VOD subscribers was available—a request to the Audiovisual Media Authority for subscriber data to enable probability sampling was unsuccessful—a nonprobability convenience sample was recruited. The self-administered questionnaire was built in Google Forms (Google LLC, Mountain View, CA, USA) and distributed via social media platforms and direct e-mail campaigns. The instrument was originally developed in English, translated into Albanian, and administered to approximately 20 respondents to assess the need for any alterations; all responses were coded according to the original English version of the questionnaire. Individuals without access to a VOD subscription for personal or shared use within the past six months were excluded from the survey. Data were collected between November 2025 and March 2026.
Data collection yielded 302 responses. The target sample size was set a priori using the inverse square root method [44], which requires at least 155 cases to detect path coefficients of 0.20 at α = 0.05 and a power of 0.80; a G*Power (version 3.1.9.7; Heinrich Heine University Düsseldorf, Düsseldorf, Germany) calculation at f2 = 0.15 indicated approximately 92 cases. The final analytic sample of 284 exceeded both thresholds and the deprecated ten-times rule [45], which recent methodological guidance discourages as a stand-alone criterion [46,47].
3.2. Measures
All constructs were measured reflectively using multi-item scales with five-point Likert response formats (1 = strongly disagree, 5 = strongly agree), adapted from established sources for the VOD context; the full instrument is reproduced in Appendix B (Table A8). Perceived value was operationalized with ten items covering functional, hedonic, social, and economic value facets [9,20,21]. Personalized recommendations were measured with five items grounded in the recommendation-agent literature [30]. This operationalization treats algorithmic personalization as the perceived quality of recommendations. Cross-device compatibility was measured with four author-developed items informed by research on perceived ubiquity and smart-TV recommender environments [39,40]. Customer satisfaction was measured with four items based on the satisfaction and ACSI traditions [7,43], and continuance intention was measured with three items following Bhattacherjee [6] and the behavioral-intentions battery of Zeithaml et al. [48]. Following measurement-model refinement (Section 4.2), the retained perceived-value composite is interpreted as a predominantly economic–functional value evaluation. Satisfaction and continuance intention are delineated at the point of measurement: satisfaction items ask for a cumulative evaluative judgment of the experienced service, whereas continuance-intention items ask for a forward-looking behavioral intention toward renewal [6,7].
3.3. Analytical Strategy
Data were screened in IBM SPSS Statistics 29 and modeled in SmartPLS 4 (v4.1.0) using variance-based PLS-SEM with the path-weighting scheme, a maximum of 300 iterations, and bias-corrected and accelerated (BCa) bootstrapping with 5000 resamples for all significance tests. PLS-SEM was chosen because the model is prediction-oriented, encompasses a composite of value facets, and makes no assumptions about multivariate normality [46,49]. Evaluation followed the standard two-stage approach: a measurement model (indicator loadings, internal consistency, and convergent and discriminant validity) followed by a structural model (collinearity, path coefficients, R2, f2 effect sizes, and predictive relevance), with mediation assessed through bootstrapped indirect effects interpreted according to the typology of Zhao et al. [50] and out-of-sample predictive power assessed with the PLSpredict procedure (10-fold cross-validation and 10 repetitions [51]). The analysis concluded with an importance–performance map analysis [52] targeting continuance intention.
3.4. Demographic Profile of the Respondents
The final sample comprised 284 respondents. Table 1 reports the full demographic and usage profile. Women accounted for 73.2% of participants (n = 208), men for 25.4% (n = 72), and 1.4% (n = 4) preferred not to disclose their gender. The age distribution was skewed toward the young: 46.8% of respondents were aged 18–24, and a further 25.7% were aged 25–34, so that participants under 35 constituted 72.5% of the sample, while only 8.1% were aged 45 or older. Educational attainment was high, with 44.0% holding a master’s degree and 8.5% a doctorate; a further 30.6% held a bachelor’s degree, leaving 16.9% with a high school education or less. Half of the respondents (50.0%) reported a monthly household income of 50,000–200,000 ALL, 26.4% reported 200,001–400,000 ALL, and 20.8% reported more than 400,000 ALL. The overwhelming majority resided in Albania (96.5%), and 70.8% paid for their subscription personally, with the remaining 29.2% using a shared subscription. Usage was habitual: 93.3% of respondents used their primary service at least once a week, including 28.9% who used it daily or several times a day, and 71.1% reported watching between one and six hours per week.
Table 1.
Demographic and usage profile of the analytic sample.
4. Results
4.1. Data Screening and Common Method Bias
The 302 collected responses underwent a sequential screening protocol [49,53]. Two respondents completed only the demographic section and were removed. Among the remaining 300 cases, missing values were limited to a single item (PV1, six cells, 0.08% of the data matrix) and were replaced with the item mean, well below the 5% concern threshold. Straight-lining was assessed using the within-case standard deviation across the 26 Likert items: 16 respondents answered every item identically and were removed, yielding the final sample of 284. A further 30 cases with within-case standard deviations between 0 and 0.50 were inspected individually and retained. Multivariate outlier screening using the Mahalanobis distance (p < 0.001, 26 degrees of freedom) flagged 12 cases; a thirteenth fell marginally at the criterion (D2 = 54.09 against 54.05) and was treated identically. A sensitivity analysis estimating the model with and without them produced no material change in the estimates, so they were retained. Item distributions were within conventional bounds (skewness within ±1) for 25 out of 26 items; the exception (PV6, skewness = −2.32, kurtosis = 5.79) reflected a ceiling effect on interface ease of use. PLS-SEM makes no distributional assumptions, and BCa bootstrap intervals are robust to non-normality [49]; PV6 was subsequently dropped from the measurement model on psychometric grounds (Section 4.2).
Because all data were self-reported via a single instrument at one point in time, common method bias was addressed both procedurally (anonymity, separation, and distinct labeling of construct blocks [54]) and statistically. Harman’s single-factor test extracted a first factor accounting for 42.36% of the variance, below the 50% benchmark [55], though this test is acknowledged to be weak. Kock’s [56] full-collinearity assessment produced variance inflation factors of 2.816 (PV), 1.904 (PR), 1.670 (CD), 2.436 (CI), and 3.611 (SAT). All values fall below the 5.0 criterion for critical collinearity [46,49], indicating that common method variance does not reach levels that would compromise the structural estimates, although the satisfaction value exceeds the more conservative 3.3 benchmark proposed by Kock [56]. That the highest full-collinearity VIF attaches to satisfaction is expected on substantive grounds, given its position as the model’s central mediator—it is structurally regressed on and predictive of every other construct—and the Harman result is consistent with this interpretation. Nevertheless, because no a priori marker variable was included, method variance cannot be conclusively ruled out; this is registered as a limitation in Section 6.4.
4.2. Measurement Model
Three perceived-value items with loadings below the 0.708 guideline (PV5 = 0.572, PV6 = 0.392, and PV9 = 0.538) were removed, raising the construct’s average variance extracted from 0.505 to 0.625; the refined model retains 23 indicators, all with loadings above 0.708 and significant at p < 0.001 (range: 0.739–0.932). Table 2 shows that internal consistency and convergent validity are satisfactory for all constructs: Cronbach’s α ranges from 0.829 to 0.904, composite reliability from 0.888 to 0.928, and AVE from 0.625 to 0.748, all exceeding conventional thresholds [49,57]. An exploratory check of the full ten-item pool supports this treatment: sampling adequacy is high (KMO = 0.906), Horn’s parallel analysis retains a single factor, and the one-factor principal-axis loadings separate the retained items (0.689–0.812) from PV5 (0.526), PV6 (0.328), and PV9 (0.492), indicating that the removed items are weak indicators of a single underlying evaluation rather than markers of a distinct dimension (Appendix A, Table A5).
Table 2.
Construct reliability and convergent validity.
The removal of these items is conceptually informative rather than merely psychometric. PV5 (social connection) belongs to the social facet of value, which in a service consumed largely in private covaries only weakly with the economic–functional evaluation the remaining items express; PV6 (interface ease of use) is a system-quality attribute rather than a value facet, and its ceiling effect indicates that it does not discriminate among subscribers’ evaluations; PV9 duplicates the benefit–cost content of PV1, PV7, and PV8 in a globally worded form. The retained composite should accordingly be read as a predominantly economic–functional value evaluation, and a higher-order specification separating value facets is identified in Section 6 as the appropriate design for future work.
Discriminant validity was assessed using the Fornell–Larcker criterion (Table 3) and the heterotrait–monotrait ratio (Table 4). For each construct, √AVE exceeds its correlations with other constructs. All HTMT values fall below the conservative 0.85 threshold, except for satisfaction–continuance intention (0.873; 5000-resample BCa 90% confidence interval: [0.802, 0.926]), which remains below the 0.90 criterion for conceptually related constructs [58] and whose interval excludes unity. The elevation is traceable to item content: CI3 is price-worded and shares content with the economic value items, and the re-estimation excluding it (Section 4.6; Appendix A) reduces the ratio to 0.840, below the conservative threshold, without altering any structural conclusion; SAT3 shares content territory with the content-quality value items. The full cross-loadings matrix (Table A4) shows each indicator loading highest on its own construct. A complementary covariance-based check reinforces the distinction: a five-factor confirmatory factor analysis fits the data significantly better than a model merging satisfaction and continuance intention (Δχ2(4) = 90.15, p < 0.001; ΔCFI = −0.020), with a factor correlation, corrected for measurement error, of 0.829 (Appendix A, Table A6). Discriminant validity is therefore supported, with the SAT-CI proximity—inherent to post-adoption models—acknowledged in Section 6.
Table 3.
Fornell–Larcker criterion.
Table 4.
Heterotrait–monotrait ratio (HTMT) matrix.
4.3. Structural Model
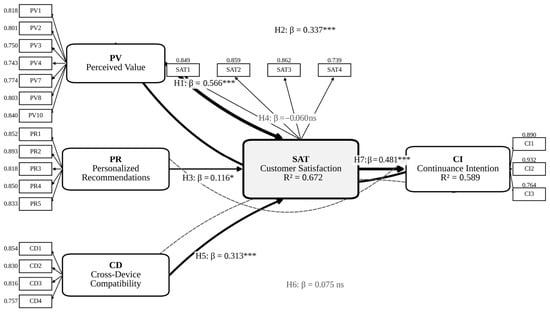
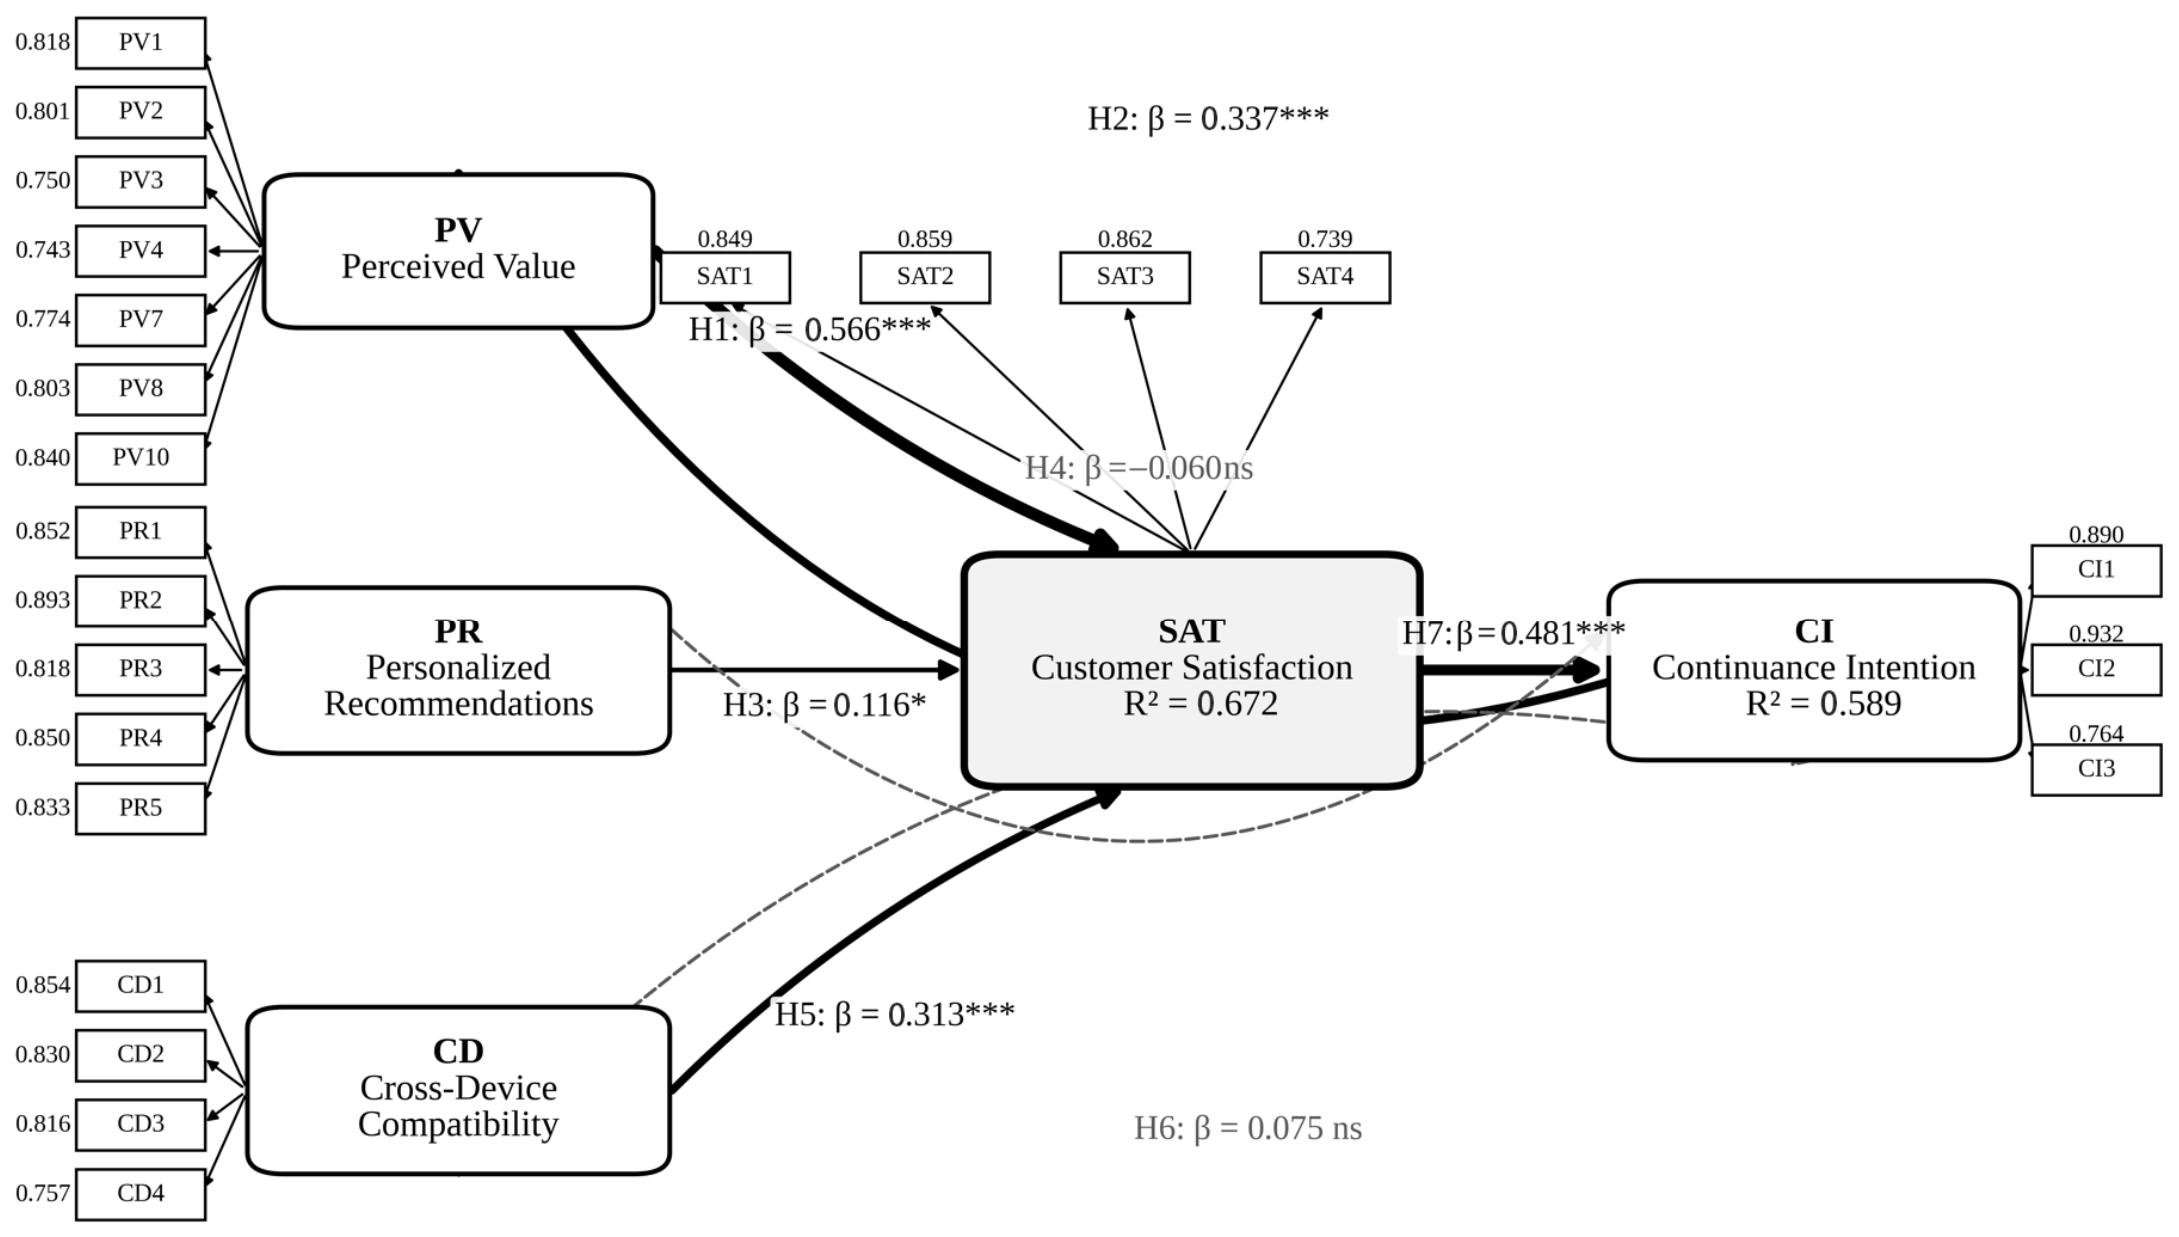
Collinearity was not a concern: predictor VIFs ranged from 1.358 to 1.854 in the satisfaction equation and from 1.657 to 3.048 in the continuance-intention equation, all below 5 [46]. Table 5 reports the structural estimates, and Figure 2 displays the full estimated model, including indicator loadings, path coefficients, and explained variance. Perceived value is the strongest predictor of satisfaction (β = 0.566, p < 0.001), followed by cross-device compatibility (β = 0.313, p < 0.001), while personalized recommendations show only a weak positive association (β = 0.116, p = 0.012). Satisfaction strongly predicts continuance intention (β = 0.481, p < 0.001), and perceived value retains a substantial direct path to it (β = 0.337, p < 0.001). The direct paths from personalized recommendations (β = −0.060, p = 0.311) and cross-device compatibility (β = 0.075, p = 0.147) to continuance intention are not significant, so H4 and H6 are not supported, whereas H1–H3, H5, and H7 are.
Table 5.
Structural path coefficients and hypothesis tests (n = 284, 5000 bootstrap resamples).
Figure 2.
PLS-SEM estimation results. Standardized estimates for the full reported model (Section 3.3): path coefficients with significance and hypothesis labels on the inner model, outer loadings on the measurement model, and R2 inside the endogenous constructs; the shaded construct is the mediator; line width is proportional to |β|, and dashed grey paths are non-significant. Items PV5, PV6, and PV9 were dropped during measurement-model refinement. *** p < 0.001; * p < 0.05; ns = not significant.
The model explains 67.2% of the variance in satisfaction (R2 = 0.672, adjusted R2 = 0.668) and 58.9% of the variance in continuance intention (R2 = 0.589, adjusted R2 = 0.584), which falls between moderate and substantial according to the benchmarks of Hair et al. [49]. Effect sizes (Table 6) mirror the asymmetry in the path coefficients: perceived value has a large effect on satisfaction (f2 = 0.626) and a small effect on continuance intention (f2 = 0.109); cross-device compatibility has a medium effect on satisfaction (f2 = 0.220); and satisfaction has a medium effect on continuance intention (f2 = 0.185). By contrast, the contributions of personalized recommendations are small at best (f2 = 0.022 on satisfaction) and negligible on continuance intention (f2 = 0.005). Out-of-sample predictive power was assessed with PLSpredict [51]. All seven endogenous indicators achieved Q2predict values above zero (Table 7), so the model outperforms the naive mean benchmark throughout. Against the more demanding linear-model benchmark, the PLS model produced lower prediction error for all three continuance-intention indicators, indicating high predictive power for the focal outcome of the model. For the satisfaction indicators, the linear benchmark was not consistently outperformed, which is unsurprising for a mediating construct and is reported for completeness.
Table 6.
f2 effect sizes.
Table 7.
Out-of-sample predictive assessment (PLSpredict).
4.4. Mediation Analysis
Indirect effects were tested with bootstrapped BCa confidence intervals and interpreted according to the typology of Zhao et al. [50] (Table 8). Perceived value shows complementary partial mediation: both the direct effect (0.337) and the indirect effect through satisfaction (0.272, p < 0.001) are significant and have the same sign, with the indirect route accounting for 44.7% of the total effect of 0.609. Personalized recommendations show indirect-only mediation: the direct path is non-significant, and the modest indirect effect through satisfaction (0.056, p < 0.05) is the only operative pathway—with the notable consequence that the standardized total effect is −0.004, effectively zero, because the small positive indirect effect is offset by the small negative (non-significant) direct path. Cross-device compatibility likewise shows indirect-only mediation (indirect = 0.150, p < 0.001; total = 0.225). H8a, H8b, and H8c are therefore all supported, but the mediation pattern carries very different substantive weight across the three stimuli.
Table 8.
Mediation analysis: direct, indirect, and total effects on continuance intention.
4.5. Importance–Performance Map Analysis
The IPMA extends the structural results by contrasting each predecessor construct’s importance for continuance intention (its unstandardized total effect) with its current performance (the construct score rescaled to 0–100), following Ringle and Sarstedt [52] and Hair et al. [49]. Table 9 reports the construct-level results; quadrant boundaries are set at the means of importance (0.393) and performance (73.4).
Table 9.
Construct-level IPMA results (target: continuance intention).
Two constructs occupy the concentrate-here quadrant. Perceived value ranks highest in importance (0.735) but ranks lowest in performance among the significant drivers (69.5): a one-unit improvement in perceived value on the underlying scale is associated with a 0.735-unit gain in continuance intention, yet the construct performs more than 12 points below cross-device compatibility. Customer satisfaction is the second priority (importance: 0.572, performance: 72.2). Cross-device compatibility falls in the possible-overkill quadrant—the highest performance in the model (81.9) paired with below-average importance (0.270), all of it channeled through satisfaction—implying diminishing returns to further investment. Personalized recommendations sit in the low-priority quadrant: performance is unremarkable (70.1) and importance is effectively zero (−0.004), so even substantial gains in recommendation accuracy are associated with essentially no change in continuance intention in this sample.
The indicator-level decomposition (Table 10), computed as the product of each indicator’s loading and its construct’s total effect on continuance intention, translates these priorities into service attributes. The seven perceived-value indicators occupy the top seven positions, led by satisfaction with content and programming (PV10) and value for price (PV1). The single most actionable diagnostic is PV8—the judgment that the subscription is a good investment of one’s money—which combines high importance (0.487) with by far the weakest performance in the model (57.0). Among satisfaction indicators, met expectations (SAT2) performs worst (64.6), pointing to a systematic expectations gap: within the ECM, disconfirmed expectations feed directly into dissatisfaction and, through satisfaction’s strong path, into retention risk. All cross-device indicators rank behind every value and satisfaction indicator, and all personalization indicators carry near-zero importance.
Table 10.
Indicator-level IPMA results (top 11 indicators by importance).
Read jointly with the mediation results, the IPMA resolves an apparent paradox: the two constructs whose effects are fully mediated by satisfaction (personalization and cross-device compatibility) are exactly those with the least leverage—one because its total effect is null, the other because its performance is already near the ceiling—whereas the only partially mediated construct, perceived value, is both the most important and the most in need of improvement. The 41.1% of variance in continuance intention left unexplained plausibly reflects factors outside the model, such as household budget constraints, the availability of pirated or free social media content as substitutes, and cultural attitudes toward paying for entertainment; these are noted as directions for future research.
4.6. Robustness Analyses
The estimates reported above rest on a particular set of specification decisions. Whether the substantive conclusions—the primacy of perceived value and the null effect of personalization—are artifacts of those decisions is an empirical question, addressed here through three sets of robustness analyses reported in full in Appendix A. First, because PV10 is satisfaction-adjacent in wording and CI3 embeds price resistance while perceived value contains price items, the model was re-estimated, excluding PV10, CI3, and both: perceived value’s direct path to continuance intention remained significant in every specification (β = 0.300–0.337, p < 0.001) and personalization’s total effect remained indistinguishable from zero (−0.014 to +0.024, all p > 0.68); excluding CI3 also reduced the satisfaction–continuance HTMT ratio to 0.840. Second, adding payer status (personal vs. shared subscription) as a control left all estimates unchanged (control β = 0.041), and among personal payers only (n = 201) the value paths strengthened (PV → CI = 0.391), while personalization’s direct path turned significantly negative (β = −0.135, p = 0.029) with a total effect still indistinguishable from zero. Third, permutation-based multi-group analysis across household-income groups (measurement invariance assessed with the full MICOM procedure [60]; see Appendix A, Table A7) revealed significant heterogeneity: personalization’s total effect was modestly positive among lower-income respondents (+0.172) and negative among higher-income respondents (−0.171; difference p = 0.003, robust to Bonferroni correction across the nine differences tested), and perceived value’s effects were stronger, not weaker, in the higher-income group; a two-stage interaction model corroborated the personalization-by-income interaction (b = −0.131, p = 0.017). Multi-homing, though more prevalent among higher-income respondents (ρ = 0.19, p = 0.001), did not account for the moderation (interaction non-significant and positively signed), and a discovery-mode test was directionally negative but underpowered (p = 0.109). The interpretive consequences are taken up in Section 5.2.
5. Discussion
5.1. Findings in Hypothesis Order
Table 11 summarizes the hypothesis tests, and the findings are discussed in order below, before the thematic interpretation in Section 5.2 and Section 5.3.
Table 11.
Summary of hypothesis tests.
H1 and H2 concern perceived value, and both are supported: value is the strongest predictor of satisfaction (β = 0.566) and retains a substantial direct path to continuance intention (β = 0.337), so nearly half of its total effect (0.609) bypasses the satisfaction filter. H3 and H4 concern personalized recommendations: the association with satisfaction is positive but weak (β = 0.116, H3 supported), while the direct path to continuance intention is null (β = −0.060, H4 not supported)—the finding at the center of this study. H5 and H6 concern cross-device compatibility: it is the second-strongest predictor of satisfaction (β = 0.313, H5 supported), yet shows no direct association with continuance intention (H6 not supported).
H7 is supported: satisfaction strongly predicts continuance intention (β = 0.481) and functions as the model’s central conduit. The mediation hypotheses H8a–H8c are all supported but with sharply different substantive weights: perceived value shows complementary partial mediation, whereas personalization and cross-device compatibility are indirect-only—and for personalization the small positive indirect effect (0.056) is offset by the small negative direct path, leaving a total effect of −0.004, effectively zero. Section 5.2 and Section 5.3 interpret this pattern.
5.2. Algorithmic Personalization Without Commitment: A Market Contingency
The most consequential finding of this study is what did not happen. Algorithmic personalization—the retention lever most celebrated in industry practice and repeatedly supported in developed-market studies [1,4,13]—failed to predict continuance intention directly, and its total effect was indistinguishable from zero. The null is informative rather than inconclusive, on four grounds stated together. The study was powered a priori to detect path coefficients of 0.20 (required minimum n = 155; achieved n = 284). The personalization construct was well measured (α = 0.904, CR = 0.928, AVE = 0.722). The construct behaved lawfully elsewhere in the model, showing the expected significant association with satisfaction (β = 0.116, p = 0.012)—the instrument detects a signal where a signal exists. And the estimate itself is a precise near-zero rather than noisy non-significance: the direct effect’s bootstrap interval [−0.175, 0.058] brackets zero tightly, and the total effect is −0.004. Albanian subscribers recognize and mildly appreciate algorithmic curation; that appreciation does not travel to the renewal decision.
Two market-level mechanisms were proposed ex ante for this boundary condition: an economic one, in which constrained discretionary income makes renewal a value judgment that crowds out convenience features, and a social one, in which interpersonal content discovery loosens the algorithm’s grip on the customer journey. The within-sample evidence complicates both. The multi-group analysis (Section 4.6) shows that the pooled null decomposes into a modestly positive personalization total effect among lower-income respondents (+0.172) and a negative one among higher-income respondents (−0.171; difference p = 0.003)—and that perceived value’s effects are stronger, not weaker, in the higher-income group. A simple income-constraint account predicts the opposite sign on both counts and is therefore contradicted by the data. Two candidate explanations for the segment pattern were tested and found wanting: multi-homing is more prevalent among higher-income users but does not carry the moderation, and the discovery-mode account was directionally negative but underpowered. What the data support is accordingly narrower and more pointed than the ex ante story: in this market, personalization does not retain on net; such retention value as it has concentrates among lower-income users—plausibly those extracting maximum value from a single subscription—while among more affluent users it is negatively associated with commitment. The mechanism behind this reversal is an open question that this study poses rather than answers. What both patterns imply is that the personalization–retention link documented in saturated, affluent markets presupposes conditions that do not hold uniformly—across markets or within them.
A second, methodological reading must be weighed alongside the contextual one. Personalization is operationalized here as perceived recommendation quality, whereas much of the recent literature operationalizes it more broadly—encompassing perceived relevance, transparency, user control, trust in the algorithm, and concerns about the use of personal data [32,33,34,35,36,37]. Studies reporting positive personalization–continuance effects frequently embed one or more of these dimensions in the focal construct. Part of the divergence from prior findings may therefore reflect differences in measurement design rather than market context alone. Two considerations keep the contextual reading in play: the same narrow instrument detects the expected association with satisfaction, and the income-segment reversal within this sample is not readily attributable to construct scope. The two explanations are complementary, and only designs that measure the full dimensional space of personalization across market types can separate them.
The contrast with prior findings is direct. In Indonesian subscription VOD samples, personalization significantly increased both satisfaction and continuance intentions [4], and gratification-based studies in the same region link recommendation-driven content discovery to sustained subscription [13]; in Chinese e-commerce, AI-personalized recommendation experiences raise behavioral intentions [10]. Against this backdrop, a total effect of −0.004 in the Albanian sample is not a noisier estimate of the same parameter; it is a different answer, obtained with adequate power (n = 284 against a required minimum of 155) and a well-measured construct. The parsimonious reading is that market context moderates the relationship, with measurement scope as a complementary partial explanation, rather than sampling error.
5.3. Value Primacy and the Satisfaction Filter
The remainder of the model behaved as the V-ECM predicts. Perceived value dominated both equations, with a large effect on satisfaction (f2 = 0.626) and the largest total effect on continuance intention (0.609); satisfaction in turn carried a strong path to continuance (β = 0.481) and transmitted the effects of every stimulus, fully in the case of personalization and cross-device compatibility and partially in the case of value. This pattern replicates the core ECM mechanics [6,7] and the value-based extension [8] in a previously untested context, indicating that the model’s fundamental architecture travels well even where one of its fashionable peripheral predictors does not. The S-O-R framing is likewise supported with a refinement: external stimuli are associated with retention through the internal evaluative state, but stimuli differ sharply in whether they retain any unmediated effect—only the benefit–cost judgment does.
Cross-device compatibility deserves its own note. It was the second-strongest predictor of satisfaction (β = 0.313, f2 = 0.220) yet showed no direct association with continuance intention, and its IPMA position—highest performance, below-average importance—suggests that seamless multi-device access has become a hygiene factor in this market: expected, satisfying when present, but not a differentiator that earns renewal on its own. This is consistent with perceived-ubiquity reasoning, in which consistency across contexts shapes evaluations rather than direct commitment [39].
6. Conclusions, Implications, Limitations, and Future Research
6.1. Conclusions
This study tested whether the flagship feature of interactive marketing—algorithmic personalization—has any impact upon consumer commitment to a subscription video-on-demand service in Albania. Using a sample of 284 subscribers, the study finds that intention to continue using the service is driven by perceived value and satisfaction with the service; the impact of personalization is essentially zero (−0.004), with separate personalization effects within income groups yet to be fully explored; and the impact of the ability of users to access the service on different devices without issue is a positive one. The architecture of post-adoption theory holds well in this market. Still, the element that marketers trust most—algorithmic personalization—is the one that earns the least consumer commitment. The test was limited to aspects of personalization related to recommendation algorithms within the service, however, so any conclusions related to other aspects of personalization are premature. For researchers, this provides a new contingency to test in the context of digital commerce. For practitioners, the result suggests that in markets as price-sensitive and transitional as this Albanian market, the link between personalization and consumer commitment passes through the catalogue and the price tag—not the algorithm.
6.2. Theoretical Implications
The first implication is about scope. The studies that link recommendation quality to continuance (e.g., [4,10]) were conducted in markets where discretionary income is high and viewers lean on the algorithm to decide what to watch. Those conditions are part of the finding, not its background: where they are absent, as here, the association disappears. Establishing when personalization converts into commitment therefore requires testing the moderation directly, across markets that differ in income and in how viewers discover content. The results also argue for keeping a direct value-to-continuance path in V-ECM specifications rather than forcing all effects through satisfaction: nearly half of value’s influence bypassed the satisfaction filter (VAF = 44.7%), which a fully mediated specification would misattribute. A more methodological lesson emerges from the joint use of mediation typology and IPMA, which proved diagnostically productive: full mediation coincided with low managerial leverage, partial mediation with high leverage. Treating mediation type and importance–performance position as complementary lenses, rather than reporting them in isolation, may sharpen inference in other post-adoption applications.
6.3. Managerial Implications
For platforms operating in Albania and comparable transitional markets—to the extent that stated intention translates into renewal behavior—the priority ordering is unambiguous. The binding constraint on retention is the value proposition, and within it, the investment judgment: the belief that the subscription is a good investment of one’s money was the worst-performing high-importance indicator in the model (57.0 on a 0–100 scale). The direct levers here are regionally calibrated pricing, tier differentiation that includes an advertising-supported entry point, and clear communication of what the subscription fee buys. And because content and programming satisfaction carried the single highest indicator importance, the strongest investment case is catalogue relevance for the local audience, including localized and regional content. Second, the expectations gap (met expectations performing at 64.6) is a direct retention risk under the ECM: marketing that overpromises breadth or novelty erodes the very confirmation on which renewal rests, so acquisition messaging should be calibrated to what the catalogue delivers. Third, cross-device engineering has reached the point of diminishing returns and requires maintenance, not expansion. Fourth, personalization budgets in this market are better justified as satisfaction and engagement infrastructure than as churn reduction and should be sized accordingly; reallocating marginal personalization spend toward content and pricing is likely to yield more retention per Lek. In customer-equity terms, the IPMA ordering shows where marginal investment converts into retained lifetime value: the catalogue and the price, not the algorithm.
6.4. Limitations and Future Research
The findings must be read against several limitations. The sample is a nonprobability convenience sample recruited online, skewed toward young, educated, urban, female respondents; estimates should not be generalized to the Albanian VOD population, and probability or quota-based replication is needed. More broadly, the findings should be interpreted within the specific cultural and economic context of the Albanian subscription VOD market. The design is cross-sectional and correlational, so the structural paths represent theoretically motivated associations rather than demonstrated causal effects; longitudinal or experimental designs linking measured intentions to actual renewal behavior would materially strengthen inference. Relatedly, the personalization construct captures perceived recommendation quality; it does not measure behavioral reliance on, exposure to, or delegation of content discovery to the algorithm, so the null concerns subscribers’ evaluative judgment of curation rather than algorithmic mediation per se. All constructs were self-reported through one instrument at one time; although procedural remedies were applied, Harman’s test was passed, and all full-collinearity VIFs fell below the 5.0 criterion for critical collinearity [46,49], the highest value—satisfaction, at 3.611, above the more conservative 3.3 benchmark [56]—and the absence of an a priori marker variable mean common method variance cannot be conclusively excluded; relatedly, the satisfaction–continuance HTMT ratio (0.873, 90% CI: [0.802, 0.926]) exceeds the conservative discriminant-validity threshold, so the two constructs, while conceptually and statistically distinguishable, overlap substantially in this sample—an overlap the CI3-excluded re-estimation attributes in part to the price content of that item (Appendix A). Continuance intention, satisfaction, and their measurement drew on a single primary platform per respondent, dominated by Netflix, so platform-specific effects cannot be separated from category effects. Finally, the model leaves 41.1% of the variance in continuance intention unexplained; income constraints, piracy and free-content substitution, habit, and social viewing norms are prime candidates for extension, as are cross-country comparative designs testing the market-contingency moderation implied by the personalization null result. Relatedly, the retained perceived-value composite is predominantly economic–functional; higher-order specifications modeling social, hedonic, and usability-adjacent facets as separate first-order dimensions would test whether value primacy holds across facets. The income-group analyses in Appendix A are exploratory: only the personalization total-effect difference survives multiplicity correction, and the segment pattern should be read as hypothesis-generating rather than confirmatory. The causal version of this study is a field experiment manipulating recommendation quality or visibility on-platform and observing subsequent renewal behavior; platform-side collaborations of that kind would complete the inferential chain that a cross-sectional survey cannot.
Author Contributions
Conceptualization, E.B. and I.K.; methodology, I.K.; formal analysis, E.B. and I.K.; investigation, E.B.; data curation, E.B. and I.K.; validation, I.K.; supervision, I.K.; project administration, I.K.; writing—original draft preparation, E.B.; writing—review and editing, I.K. and E.S.; resources, E.S. All authors have read and agreed to the published version of the manuscript.
Funding
This research received no external funding.
Institutional Review Board Statement
The study was conducted in accordance with the Declaration of Helsinki and approved by the Institutional Ethics Committee of the University of New York Tirana (decision of 17 October 2025). Participation was voluntary and anonymous; respondents were informed of the survey’s academic purpose; no compensation was offered; data were handled in accordance with GDPR-aligned data protection requirements; and no personally identifying information was collected or stored.
Informed Consent Statement
Informed consent was obtained from all subjects involved in the study.
Data Availability Statement
The anonymized dataset supporting the findings of this study is available from the corresponding author upon reasonable request.
Conflicts of Interest
The authors declare no conflicts of interest.
Appendix A. Robustness Analyses
All analyses re-estimate the full structural model of Section 4.3 under the stated modification (Table A1, Table A2 and Table A3); inference rests on 5000-resample BCa bootstrapping within each estimation, permutation-based multi-group comparison (1000 permutations) for group differences, and two-stage latent-variable interaction models with HC3 standard errors for corroboration. Compositional invariance for the income groups was verified (correlation of group-weight and pooled-weight scores ≥ 0.999 for every construct). The income grouping (≤200,000 vs. >200,000 ALL) is the near-median split of the four-band income measure (n = 150 vs. 134). Nine group differences were tested; Bonferroni-adjusted significance is noted where applicable.
Table A1.
Measurement-contamination robustness: model re-estimated without PV10 and CI3.
Table A2.
Payer-status analyses.
Table A3.
Income-group multi-group analysis (permutation test) and mechanism probes.
Table A4.
Indicator cross-loadings.
Additional Psychometric Analyses
Two additional analyses address the operationalization questions raised in the review. First, the dimensionality of the full ten-item perceived-value pool was examined with exploratory factor analysis in IBM SPSS Statistics 29 on the analytic sample (n = 284). Sampling adequacy is high (KMO = 0.906), and Horn’s parallel analysis [61] retains a single factor (second observed eigenvalue = 1.00 against a 95th-percentile simulated threshold of 1.27). Table A5 reports the one-factor principal-axis loadings: the seven retained items load between 0.689 and 0.812, whereas PV5 (0.526), PV6 (0.328), and PV9 (0.492) fall clearly below. The pool is therefore unidimensional, supporting the reflective specification, and the removed items are weak indicators of the single underlying evaluation rather than markers of a distinct dimension—the structural counterpart of the content-based account in Section 4.2.
Table A5.
One-factor principal-axis loadings of the ten perceived-value items (n = 284).
Second, the distinctness of satisfaction and continuance intention was tested with a covariance-based nested-model comparison [62]. A five-factor maximum-likelihood confirmatory factor analysis of the 23 retained indicators, estimated in IBM SPSS Amos 29, was compared with a four-factor model merging the satisfaction and continuance-intention indicators into a single factor (Table A6). The merged model fits significantly worse (Δχ2(4) = 90.15, p < 0.001), and the decrement in CFI (−0.020) exceeds the 0.01 criterion [63]; the factor correlation between the two constructs in the five-factor model, corrected for measurement error, is 0.829. The five-factor model’s global fit is modest, as is common when composite-designed instruments are estimated under a common-factor model, and is reported for transparency; the inferential point is the comparison, which favors treating satisfaction and continuance intention as distinct constructs.
Table A6.
Nested confirmatory factor analysis comparison of the satisfaction–continuance intention distinction.
Third, because the income-group comparison in Table A3 presupposes measurement invariance, the full MICOM procedure [60], implemented in SmartPLS 4 (v4.1.0), was applied to the two income groups (n = 150/134; 1000 label permutations, extended to 5000 for the borderline case). Configural invariance holds by design: identical indicators, data treatment, and estimation across groups. Compositional invariance holds for perceived value, personalized recommendations, cross-device compatibility, and satisfaction (all c ≥ 0.9987, above their 5% permutation quantiles), and the composites’ means and variances are equal across groups for all five constructs (Table A7). For continuance intention, c = 0.9971 falls marginally below its permutation bound (0.9980; permutation p = 0.019). The deviation is traceable to CI3, the price-worded indicator, whose outer weight is larger among higher-income respondents (0.54 vs. 0.42)—a substantively interpretable income sensitivity of the price-referenced item rather than a generalized measurement difference. Under the CI3-excluded specification reported above, compositional invariance holds for all constructs (c = 0.9998) and the income moderation replicates in sign and magnitude (personalization total effect of +0.131 among lower-income and −0.142 among higher-income respondents). The moderation reported in Table A3 is therefore not an artifact of measurement non-invariance.
Table A7.
MICOM results for the household-income groups (≤200,000 ALL, n = 150, vs. >200,000 ALL, n = 134).
Appendix B. Measurement Instrument
The complete measurement instrument is reproduced below, including the three items dropped during measurement-model refinement (Section 4.2), whose outer loadings are annotated in the item wording.
Table A8.
Operationalization of constructs and measurement items.
References
- Gonçalves, A.R.; Pinto, D.C.; Shuqair, S.; Dalmoro, M.; Mattila, A.S. Artificial intelligence vs. autonomous decision-making in streaming platforms: A mixed-method approach. Int. J. Inf. Manag. 2024, 76, 102748. [Google Scholar] [CrossRef] [Scilit]
- Deloitte Insights. 2025 Digital Media Trends: Social Platforms Are Becoming a Dominant Force in Media and Entertainment; Deloitte: New York, NY, USA, 2025; Available online: https://www2.deloitte.com/us/en/insights/industry/technology/digital-media-trends-consumption-habits-survey.html (accessed on 10 November 2025).
- Baek, H.; Jang, M.; Kim, S. Strategies to mitigate the cannibalization effect between subscription video-on-demand and transactional video-on-demand. Digit. Bus. 2024, 4, 100073. [Google Scholar] [CrossRef] [Scilit]
- Carissa, N.E.; Erlangga, M.; Evik, C.S.; Handayani, P.W. The influence of perceived usefulness, satisfaction, and personalization on subscription video on demand continuance intentions. CommIT (Commun. Inf. Technol.) J. 2023, 17, 169–184. [Google Scholar] [CrossRef] [Scilit]
- Datta, S.; Ghosh, T. Linking service quality, value, and loyalty in the V-o-D service context through a review of literature. Cogent Bus. Manag. 2022, 9, 2143311. [Google Scholar] [CrossRef] [Scilit]
- Bhattacherjee, A. Understanding information systems continuance: An expectation-confirmation model. MIS Q. 2001, 25, 351–370. [Google Scholar] [CrossRef] [Scilit]
- Oliver, R.L. A cognitive model of the antecedents and consequences of satisfaction decisions. J. Mark. Res. 1980, 17, 460–469. [Google Scholar] [CrossRef] [Scilit]
- Jia, X.; Pang, Y.; Huang, B.; Hou, F. Understanding consumers’ continuance intention to watch streams: A value-based continuance intention model. Front. Psychol. 2023, 14, 1073301. [Google Scholar] [CrossRef] [Scilit] [PubMed]
- Zeithaml, V.A. Consumer perceptions of price, quality, and value: A means-end model and synthesis of evidence. J. Mark. 1988, 52, 2–22. [Google Scholar] [CrossRef] [Scilit] [PubMed]
- Yin, J.; Qiu, X.; Wang, Y. The impact of AI-personalized recommendations on clicking intentions: Evidence from Chinese e-commerce. J. Theor. Appl. Electron. Commer. Res. 2025, 20, 21. [Google Scholar] [CrossRef] [Scilit]
- Kim, J.; Lee, C. The return of the king: The importance of killer content in a competitive OTT market. J. Theor. Appl. Electron. Commer. Res. 2023, 18, 976–994. [Google Scholar] [CrossRef] [Scilit]
- Masao, M.; Salehudin, I. Unveiling the dynamics of expectation, flow, enjoyment, and satisfaction: Drivers of continued subscription intentions among Netflix users. South East Asian J. Manag. 2023, 17, 96–121. [Google Scholar] [CrossRef] [Scilit]
- Syafira, S.; Dharmmesta, B.S. Video-on-demand streaming services subscription antecedents and consequences: The uses and gratifications theory approach. J. Indones. Econ. Bus. 2024, 39, 256–281. [Google Scholar] [CrossRef] [Scilit]
- Damásio, M.J.; Bengesser, C.H.; Graça, A.R.; Primorac, J.; Grácio, R.; Kauber, S.; Pernin, J.; Hammoud, P.; Materska-Samek, M.; Kotlinska, M. Audiences, content diversity and streaming platforms in small European countries: Engagement, interaction with catalogues, and choice. Convergence 2025, 31, 1573–1590. [Google Scholar] [CrossRef] [Scilit]
- Papathanasopoulos, A.; Varoutas, D. On the competition between video OTT platforms vs traditional TV: A niche case study in Greece. Telemat. Inform. Rep. 2024, 16, 100166. [Google Scholar] [CrossRef] [Scilit]
- Grece, C. Trends in the VOD Market in EU28; European Audiovisual Observatory: Strasbourg, France, 2021; Available online: https://rm.coe.int/trends-in-the-vod-market-in-eu28-final-version/1680a1511a (accessed on 10 November 2025).
- Tambini, D. The “Netflix effect” revisited: OTT video, media globalization and digital sovereignty in 4 countries. Telecommun. Policy 2025, 49, 102935. [Google Scholar] [CrossRef] [Scilit]
- Institute of Statistics. Përdorimi i Teknologjisë së Informacionit dhe Komunikimit në Familje Dhe Nga Individët, 2024 [ICT Usage in Households and by Individuals, 2024]; INSTAT: Tirana, Albania, 2024. Available online: http://www.instat.gov.al/ (accessed on 10 November 2025).
- Media Ownership Monitor. Albania: Technology and Infrastructure; Reporters Without Borders: Paris, France, 2023. [Google Scholar]
- Petrick, J.F. Development of a multi-dimensional scale for measuring the perceived value of a service. J. Leis. Res. 2002, 34, 119–134. [Google Scholar] [CrossRef] [Scilit]
- Sweeney, J.C.; Soutar, G.N. Consumer perceived value: The development of a multiple item scale. J. Retail. 2001, 77, 203–220. [Google Scholar] [CrossRef] [Scilit]
- Menon, D. Purchase and continuation intentions of over-the-top (OTT) video streaming platform subscriptions: A uses and gratification theory perspective. Telemat. Inform. Rep. 2022, 5, 100006. [Google Scholar] [CrossRef] [Scilit]
- Pittman, M.; Sheehan, K. Sprinting a media marathon: Uses and gratifications of binge-watching television through Netflix. First Monday 2015, 20. [Google Scholar] [CrossRef] [Scilit]
- Kareem, S.A.; Venugopal, P.; Yuvaraj, D.; Priya, S.A.; Devi, S.A. Understanding continuance intention of subscription video-on-demand based over-the-top (OTT) platforms: A multiple moderation approach. Interdiscip. J. Manag. Stud. 2024, 17, 953–966. [Google Scholar] [CrossRef]
- Leinsle, P.; Totzek, D.; Schumann, J.H. How price fairness and fit affect customer tariff evaluations. J. Serv. Manag. 2018, 29, 735–758. [Google Scholar] [CrossRef] [Scilit]
- Gutzeit, J.; Dorsch, I.; Stock, W.G. Information behavior on video on demand services: User motives and their selection criteria for content. Information 2021, 12, 173. [Google Scholar] [CrossRef] [Scilit]
- Deighton, J. The future of interactive marketing. Harv. Bus. Rev. 1996, 74, 151–160. [Google Scholar]
- Prahalad, C.K.; Ramaswamy, V. Co-creation experiences: The next practice in value creation. J. Interact. Mark. 2004, 18, 5–14. [Google Scholar] [CrossRef] [Scilit]
- Wang, C.L. New frontiers and future directions in interactive marketing: Inaugural editorial. J. Res. Interact. Mark. 2021, 15, 1–9. [Google Scholar] [CrossRef] [Scilit]
- Xiao, B.; Benbasat, I. E-commerce product recommendation agents: Use, characteristics, and impact. MIS Q. 2007, 31, 137–209. [Google Scholar] [CrossRef] [Scilit]
- Paliński, M.; Jusypenko, B.; Hardy, W. Behind the screens: Privacy and advertising preferences in VoD—The role of privacy concerns, persuasion knowledge, and experience. J. Retail. Consum. Serv. 2025, 84, 104233. [Google Scholar] [CrossRef] [Scilit]
- Zhang, Y.; Di, Y.; Liu, L. Beyond accuracy: How algorithm characteristics and digital generational differences affect user interaction and acceptance in fashion recommendation systems. Int. J. Hum.-Comput. Interact. 2026. Epub ahead of printing. [Google Scholar] [CrossRef] [Scilit]
- Knijnenburg, B.P.; Willemsen, M.C.; Gantner, Z.; Soncu, H.; Newell, C. Explaining the user experience of recommender systems. User Model. User-Adapt. Interact. 2012, 22, 441–504. [Google Scholar] [CrossRef] [Scilit]
- Sutanto, J.; Palme, E.; Tan, C.-H.; Phang, C.W. Addressing the personalization–privacy paradox: An empirical assessment from a field experiment on smartphone users. MIS Q. 2013, 37, 1141–1164. [Google Scholar] [CrossRef] [Scilit]
- Aguirre, E.; Mahr, D.; Grewal, D.; de Ruyter, K.; Wetzels, M. Unraveling the personalization paradox: The effect of information collection and trust-building strategies on online advertisement effectiveness. J. Retail. 2015, 91, 34–49. [Google Scholar] [CrossRef] [Scilit]
- Shin, D.; Park, Y.J. Role of fairness, accountability, and transparency in algorithmic affordance. Comput. Hum. Behav. 2019, 98, 277–284. [Google Scholar] [CrossRef] [Scilit]
- Shin, D. User perceptions of algorithmic decisions in the personalized AI system: Perceptual evaluation of fairness, accountability, transparency, and explainability. J. Broadcast. Electron. Media 2020, 64, 541–565. [Google Scholar] [CrossRef] [Scilit]
- Wasilewski, A.; Wasilewska, B. Data-driven e-commerce UI personalization: Going beyond product recommendations. Int. J. Hum.-Comput. Interact. 2026, 42, 7185–7208. [Google Scholar] [CrossRef] [Scilit]
- Okazaki, S.; Mendez, F. Perceived ubiquity in mobile services. J. Interact. Mark. 2013, 27, 98–111. [Google Scholar] [CrossRef] [Scilit]
- Alam, I.; Khusro, S.; Khan, M. Factors affecting the performance of recommender systems in a smart TV environment. Technologies 2019, 7, 41. [Google Scholar] [CrossRef] [Scilit]
- Dufft, N.; Bohn, P.; Stiehler, A.; Wichmann, T. Digital Video Usage and DRM: Results from a European Consumer Survey; Berlecon Research: Berlin, Germany, 2006. [Google Scholar]
- Juluri, P.; Tamarapalli, V.; Medhi, D. Measurement of quality of experience of video-on-demand services: A survey. IEEE Commun. Surv. Tutor. 2016, 18, 401–418. [Google Scholar] [CrossRef] [Scilit]
- Fornell, C.; Johnson, M.D.; Anderson, E.W.; Cha, J.; Bryant, B.E. The American Customer Satisfaction Index: Nature, purpose, and findings. J. Mark. 1996, 60, 7–18. [Google Scholar] [CrossRef] [Scilit]
- Kock, N.; Hadaya, P. Minimum sample size estimation in PLS-SEM: The inverse square root and gamma-exponential methods. Inf. Syst. J. 2018, 28, 227–261. [Google Scholar] [CrossRef] [Scilit]
- Barclay, D.W.; Higgins, C.; Thompson, R. The partial least squares approach to causal modeling: Personal computer adoption and use as illustration. Technol. Stud. 1995, 2, 285–309. [Google Scholar]
- Hair, J.F.; Risher, J.J.; Sarstedt, M.; Ringle, C.M. When to use and how to report the results of PLS-SEM. Eur. Bus. Rev. 2019, 31, 2–24. [Google Scholar] [CrossRef] [Scilit]
- Memon, M.A.; Ting, H.; Cheah, J.-H.; Thurasamy, R.; Chuah, F.; Cham, T.H. Sample size for survey research: Review and recommendations. J. Appl. Struct. Equ. Model. 2020, 4, i–xx. [Google Scholar] [CrossRef] [Scilit] [PubMed]
- Zeithaml, V.A.; Berry, L.L.; Parasuraman, A. The behavioral consequences of service quality. J. Mark. 1996, 60, 31–46. [Google Scholar] [CrossRef] [Scilit]
- Hair, J.F.; Hult, G.T.M.; Ringle, C.M.; Sarstedt, M. A Primer on Partial Least Squares Structural Equation Modeling (PLS-SEM), 3rd ed.; Sage: Thousand Oaks, CA, USA, 2022. [Google Scholar]
- Zhao, X.; Lynch, J.G., Jr.; Chen, Q. Reconsidering Baron and Kenny: Myths and truths about mediation analysis. J. Consum. Res. 2010, 37, 197–206. [Google Scholar] [CrossRef] [Scilit]
- Shmueli, G.; Sarstedt, M.; Hair, J.F.; Cheah, J.-H.; Ting, H.; Vaithilingam, S.; Ringle, C.M. Predictive model assessment in PLS-SEM: Guidelines for using PLSpredict. Eur. J. Mark. 2019, 53, 2322–2347. [Google Scholar] [CrossRef] [Scilit]
- Ringle, C.M.; Sarstedt, M. Gain more insight from your PLS-SEM results: The importance-performance map analysis. Ind. Manag. Data Syst. 2016, 116, 1865–1886. [Google Scholar] [CrossRef] [Scilit]
- Sarstedt, M.; Hair, J.F.; Pick, M.; Liengaard, B.D.; Radomir, L.; Ringle, C.M. Progress in partial least squares structural equation modeling use in marketing research in the last decade. Psychol. Mark. 2022, 39, 1035–1064. [Google Scholar] [CrossRef] [Scilit]
- MacKenzie, S.B.; Podsakoff, P.M. Common method bias in marketing: Causes, mechanisms, and procedural remedies. J. Retail. 2012, 88, 542–555. [Google Scholar] [CrossRef] [Scilit]
- Podsakoff, P.M.; MacKenzie, S.B.; Lee, J.-Y.; Podsakoff, N.P. Common method biases in behavioral research: A critical review of the literature and recommended remedies. J. Appl. Psychol. 2003, 88, 879–903. [Google Scholar] [CrossRef] [Scilit] [PubMed]
- Kock, N. Common method bias in PLS-SEM: A full collinearity assessment approach. Int. J. E-Collab. 2015, 11, 1–10. [Google Scholar] [CrossRef] [Scilit]
- Fornell, C.; Larcker, D.F. Evaluating structural equation models with unobservable variables and measurement error. J. Mark. Res. 1981, 18, 39–50. [Google Scholar] [CrossRef] [Scilit]
- Henseler, J.; Ringle, C.M.; Sarstedt, M. A new criterion for assessing discriminant validity in variance-based structural equation modeling. J. Acad. Mark. Sci. 2015, 43, 115–135. [Google Scholar] [CrossRef] [Scilit]
- Cohen, J. Statistical Power Analysis for the Behavioral Sciences, 2nd ed.; Lawrence Erlbaum Associates: Hillsdale, NJ, USA, 1988. [Google Scholar] [CrossRef] [Scilit]
- Henseler, J.; Ringle, C.M.; Sarstedt, M. Testing measurement invariance of composites using partial least squares. Int. Mark. Rev. 2016, 33, 405–431. [Google Scholar] [CrossRef] [Scilit]
- Horn, J.L. A rationale and test for the number of factors in factor analysis. Psychometrika 1965, 30, 179–185. [Google Scholar] [CrossRef] [Scilit] [PubMed]
- Anderson, J.C.; Gerbing, D.W. Structural equation modeling in practice: A review and recommended two-step approach. Psychol. Bull. 1988, 103, 411–423. [Google Scholar] [CrossRef]
- Cheung, G.W.; Rensvold, R.B. Evaluating goodness-of-fit indexes for testing measurement invariance. Struct. Equ. Model. 2002, 9, 233–255. [Google Scholar] [CrossRef] [Scilit] [PubMed]

Disclaimer/Publisher’s Note: The statements, opinions and data contained in all publications are solely those of the individual author(s) and contributor(s) and not of MDPI and/or the editor(s). MDPI and/or the editor(s) disclaim responsibility for any injury to people or property resulting from any ideas, methods, instructions or products referred to in the content. |
© 2026 by the authors. Licensee MDPI, Basel, Switzerland. This article is an open access article distributed under the terms and conditions of the Creative Commons Attribution (CC BY) license.