


Abstract
The embedded finance paradigm is fundamentally restructuring digital economies by seamlessly integrating financial services into non-financial digital infrastructures. This study dynamically evaluates the productivity frontiers of Sea Limited’s embedded fintech operations (SeaMoney) across six core geographic markets (Indonesia, Thailand, Vietnam, the Philippines, Malaysia, and Brazil) over the 2023–2026 temporal horizon. Employing a rigorous Panel Data Envelopment Analysis (DEA) Malmquist Productivity Index framework, the research measures systemic performance by analyzing Sales & Marketing (S & M) Expenses and the undesirable Non-Performing Loan (NPL) rate as inputs, against Gross Loan Outstanding as the primary credit output. Before model execution, robust isotonicity was empirically validated using Pearson correlation matrices. The empirical findings reveal profoundly robust systemic performance across the global ecosystem, driven primarily by overarching algorithmic innovations captured by the Technical Change (TC) index. However, this technological boundary exhibits a stabilizing deceleration over time, indicative of a maturing ecosystem transitioning from explosive, frontier-shifting innovation to optimized refinement. Furthermore, localized managerial optimization, measured by the Efficiency Change (EC) index, displays significant regional heterogeneity. While markets like Brazil demonstrated aggressive late-stage efficiency spikes, and core Southeast Asian markets (such as Vietnam and the Philippines) maintained highly stable, competitive trajectories, other regions, such as Thailand, experienced notable managerial regression. This regression signals severe internal frictions in optimizing local marketing budgets against rising credit defaults. Managerial Implications: These findings provide critical strategic insights for orchestrators of the multinational e-commerce ecosystem. The empirical evidence suggests that relying exclusively on centralized technological scaling, such as unified platform infrastructure and global AI architectures, is insufficient for sustained operational growth. To maintain a competitive advantage, operations executives must deploy hyper-localized resource-allocation and customer-acquisition frameworks tailored to specific regional market dynamics and consumer behavior. Sustainable scaling in cross-border digital commerce requires a precise dynamic equilibrium: leveraging robust global technological infrastructure while executing highly adaptive, market-specific operational and marketing optimizations to maximize customer lifetime value (CLV), eliminate customer acquisition waste, and streamline localized transaction and engagement cycles.
1. Introduction
The contemporary digital economy in Southeast Asia and Latin America has undergone a profound paradigm shift, propelling traditional e-commerce platforms beyond mere transactional marketplaces into highly integrated digital ecosystems. A pivotal catalyst driving this structural evolution is the proliferation of “embedded finance”, the seamless incorporation of financial services into non-financial consumer platforms. Among these financial innovations, Buy Now, Pay Later (BNPL) mechanisms, predominantly exemplified by Shopee’s SPayLater (operated by SeaMoney), have emerged as a cornerstone of modern digital commerce. By embedding credit facilities directly at the point of sale, these platforms effectively reduce payment friction, stimulate higher average order values, and redefine the boundaries of digital retail.
Despite the rapid and ubiquitous adoption of embedded finance, significant structural disparities persist within the broader consumer credit landscape. Traditional banking architectures remain heavily reliant on centralized historical credit bureau data, such as the Credit Information Center (CIC) in Vietnam. This stringent reliance inherently marginalizes a vast demographic of unbanked and underbanked populations who lack formal financial histories. In stark contrast, embedded fintech models circumvent these legacy constraints by leveraging real-time, alternative big data, such as digital footprints, platform engagement, and transactional behavior, to facilitate instant micro-credit underwriting. Nevertheless, the accelerated expansion of these e-commerce-driven “shadow banking” frameworks has substantially outpaced empirical academic scrutiny. Specifically, a pronounced research gap exists regarding the quantitative evaluation of the operational and scale efficiency of these decentralized credit models, particularly as they navigate highly diverse regulatory paradigms and consumer demographics across different nations.
To address this critical gap in the literature, this study empirically evaluates the operational efficiency of embedded fintech models within global e-commerce ecosystems. The primary objective is to mathematically measure how effectively Sea Limited optimizes its critical operational inputs, specifically marketing resource allocation and credit risk exposure, to maximize credit volume generation across its core national markets. By tracking the performance of these digital credit mechanisms from 2023 to 2026, this research aims to provide a rigorous, data-driven assessment of the efficiency of algorithmic credit scoring. Ultimately, the findings will offer strategic managerial implications for optimizing embedded finance frameworks and mitigating systemic risks in emerging digital economies. To align the empirical design with our exploratory objectives, this study is guided by three descriptive research questions (RQs):
RQ1: How does the total factor productivity of embedded fintech operations vary across Sea Limited’s distinct regional markets?
RQ2: To what extent are these productivity fluctuations driven by internal managerial efficiency (Catch-up effect) versus overarching global algorithmic advancements (Frontier-shift)?
RQ3: How does the deliberate friction of credit default risk (NPLs) associate with the efficiency of digital user acquisition across varying competitive landscapes?
2. Literature Review
2.1. The Paradigm of Embedded Finance
The paradigm of embedded finance represents a fundamental structural evolution within the global financial ecosystem, characterized by the seamless integration of financial mechanisms into non-financial digital infrastructures. Driven by rapid technological maturation and shifting consumer expectations, this convergence actively dismantles traditional banking silos, allowing consumers to access sophisticated financial products natively within their everyday digital interactions. Embedded finance encompasses a comprehensive suite of capabilities, ranging from digital payments and micro-lending to insurance and investment modeling, directly embedded at the consumer’s point of need. The operationalization of embedded finance is deeply predicated on systemic technological advancements, most notably the proliferation of Application Programming Interfaces (APIs). APIs serve as the critical connective tissue, enabling third-party developers to securely interface with traditional banking data and logic. Consequently, the transition toward Open Banking serves as a foundational catalyst, establishing the data-sharing protocols essential to successful digital transformation and continuous innovation within the embedded finance ecosystem [1]. Exogenous macroeconomic shocks, notably the COVID-19 pandemic, acted as an aggressive adoption accelerator, fundamentally shifting global interest toward digital financial solutions and validating the utility of embedded use cases across diverse markets [2]. The proliferation of this paradigm yields substantial socio-economic and corporate advantages. Primarily, embedded finance serves as a potent mechanism for driving financial inclusion by extending access to credit and financial infrastructure to historically underserved populations and microenterprises [3]. From a corporate strategy perspective, minimizing transaction friction directly optimizes digital marketing outcomes, simultaneously augmenting the overall user experience and solidifying long-term customer loyalty [4].
Conversely, the architectural convergence of financial and non-financial data environments introduces profound regulatory and cybersecurity vulnerabilities. As financial services become deeply entrenched within third-party platforms, the expanded surface area for potential data breaches and privacy violations increases exponentially. Ecosystem participants are mandated to implement robust, enterprise-grade security architectures and navigate complex regulatory standards to safeguard consumer data, mitigate systemic risk, and maintain operational trust [5,6]. Looking ahead, the broader macro-financial landscape is witnessing rapid evolution in Decentralized Finance (DeFi). The convergence of DeFi with embedded, open, and sustainable finance initiatives is poised to entirely restructure global banking’s intermediation mechanisms in the coming decade [7].
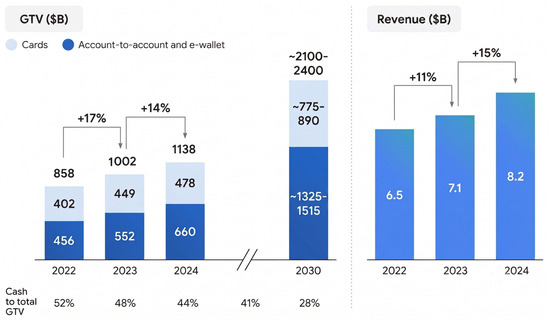
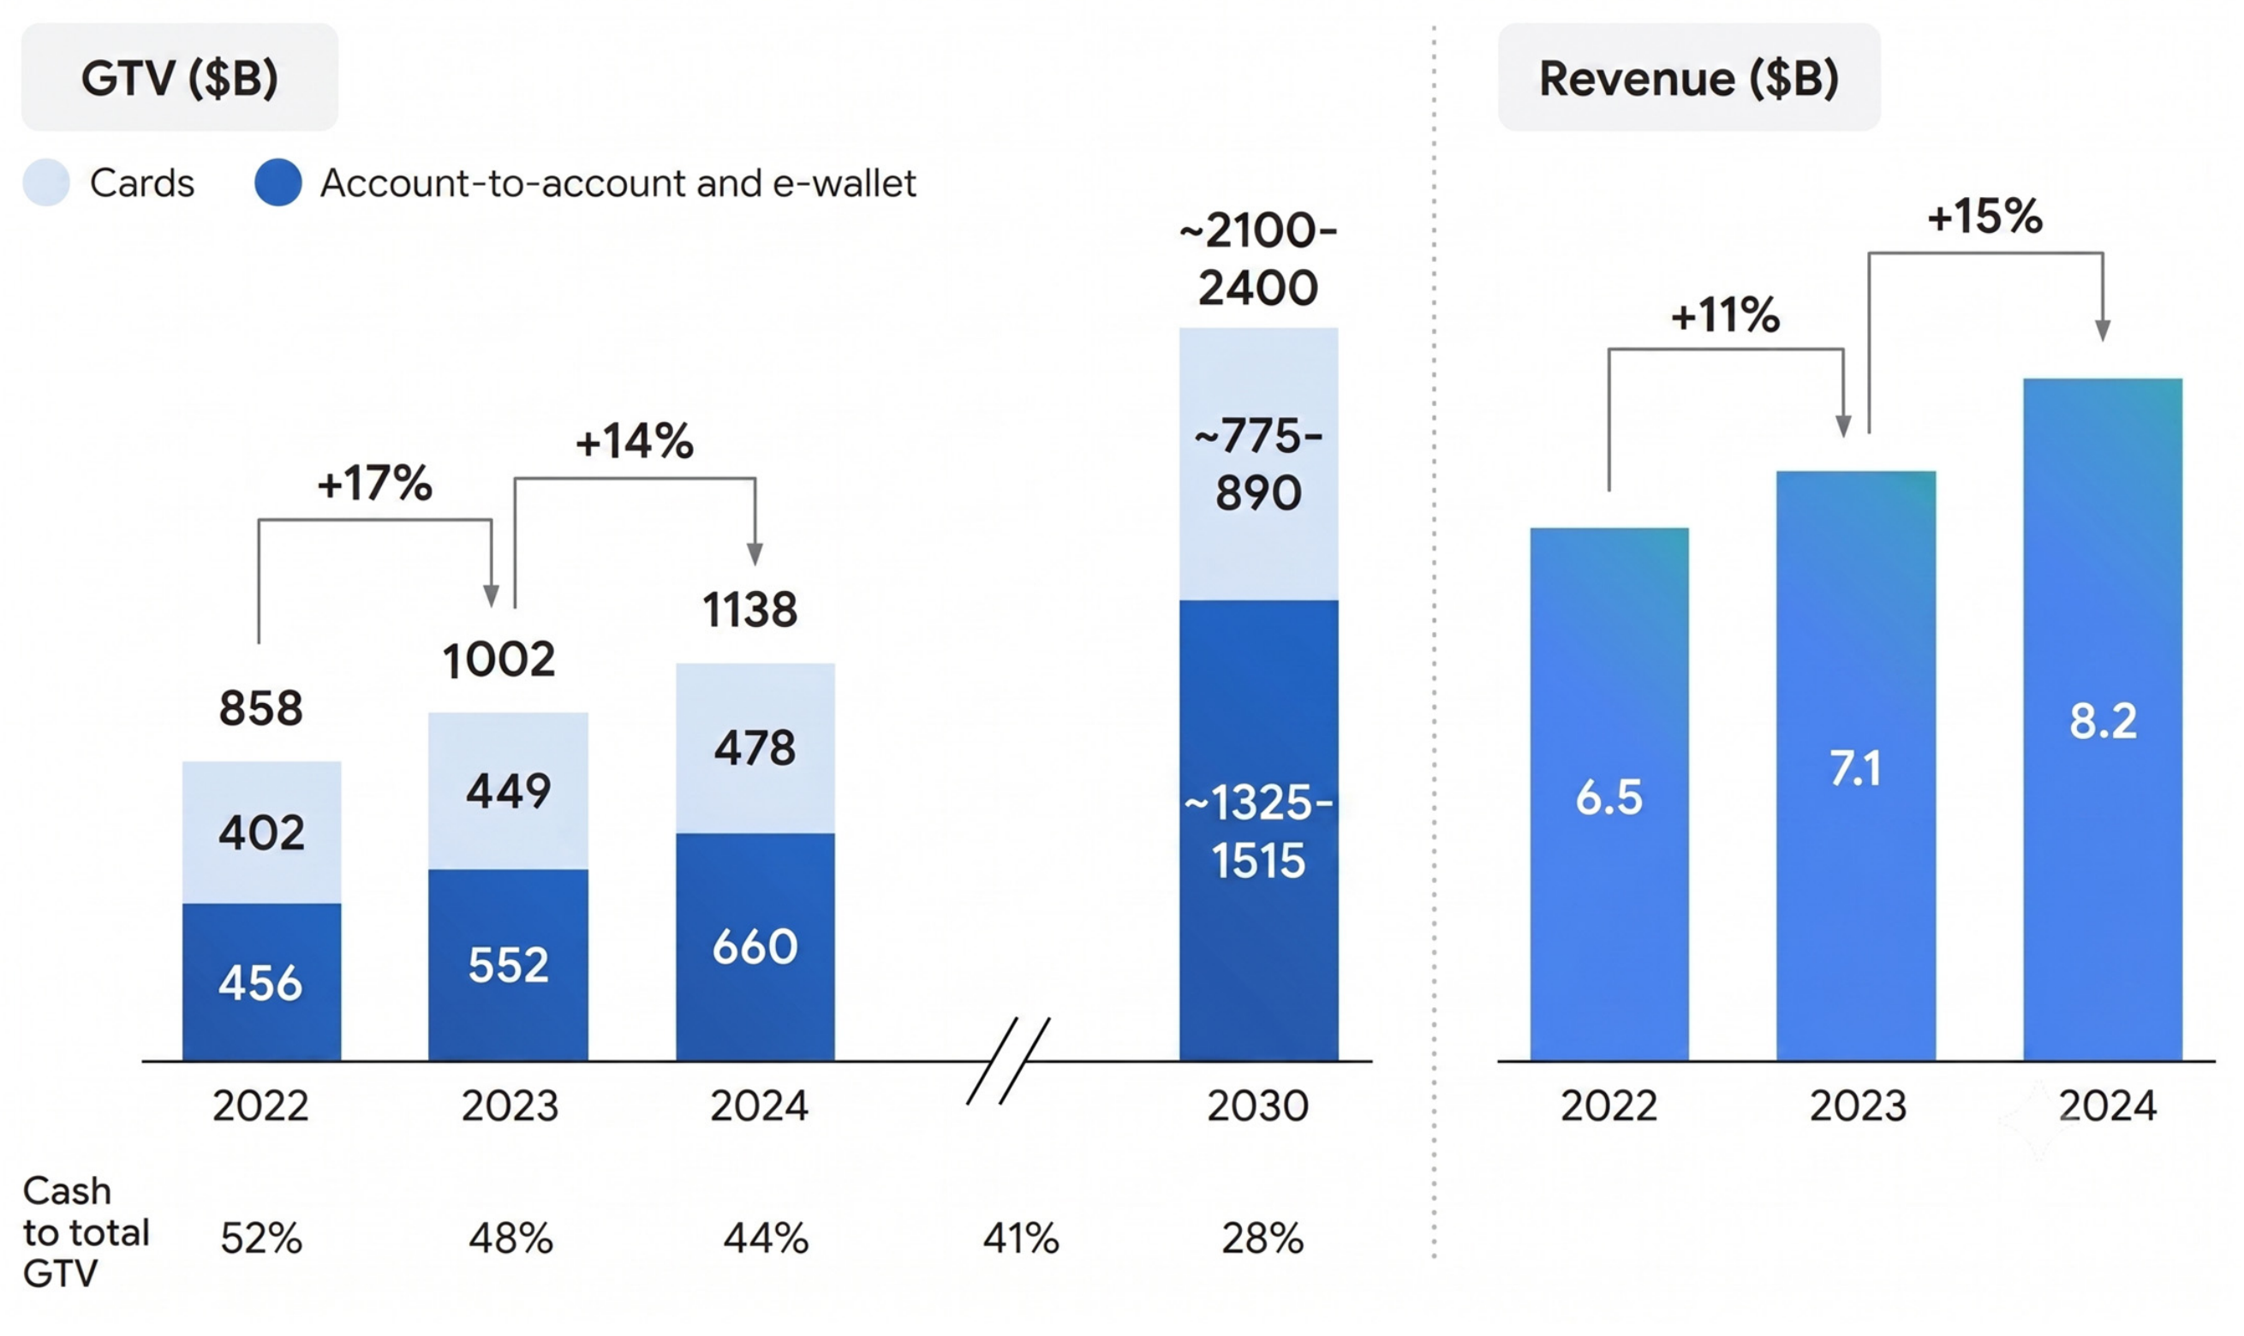
Moreover, the macro-financial landscape of Southeast Asia has experienced unprecedented expansion, heavily catalyzed by the rapid integration of embedded finance within the broader e-commerce ecosystem. To visually contextualize this regional momentum, Figure 1 illustrates the historical and ongoing trajectory of revenue generation across the digital financial sector. The data demonstrates a robust capacity for monetization as digital platforms increasingly convert user engagement into financial transactions.
Figure 1.
Digital Financial Services Revenue Growth Trends in Southeast Asia. Source: Adapted from Fintech News Singapore.
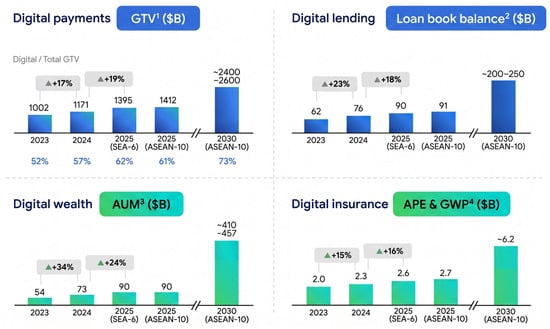
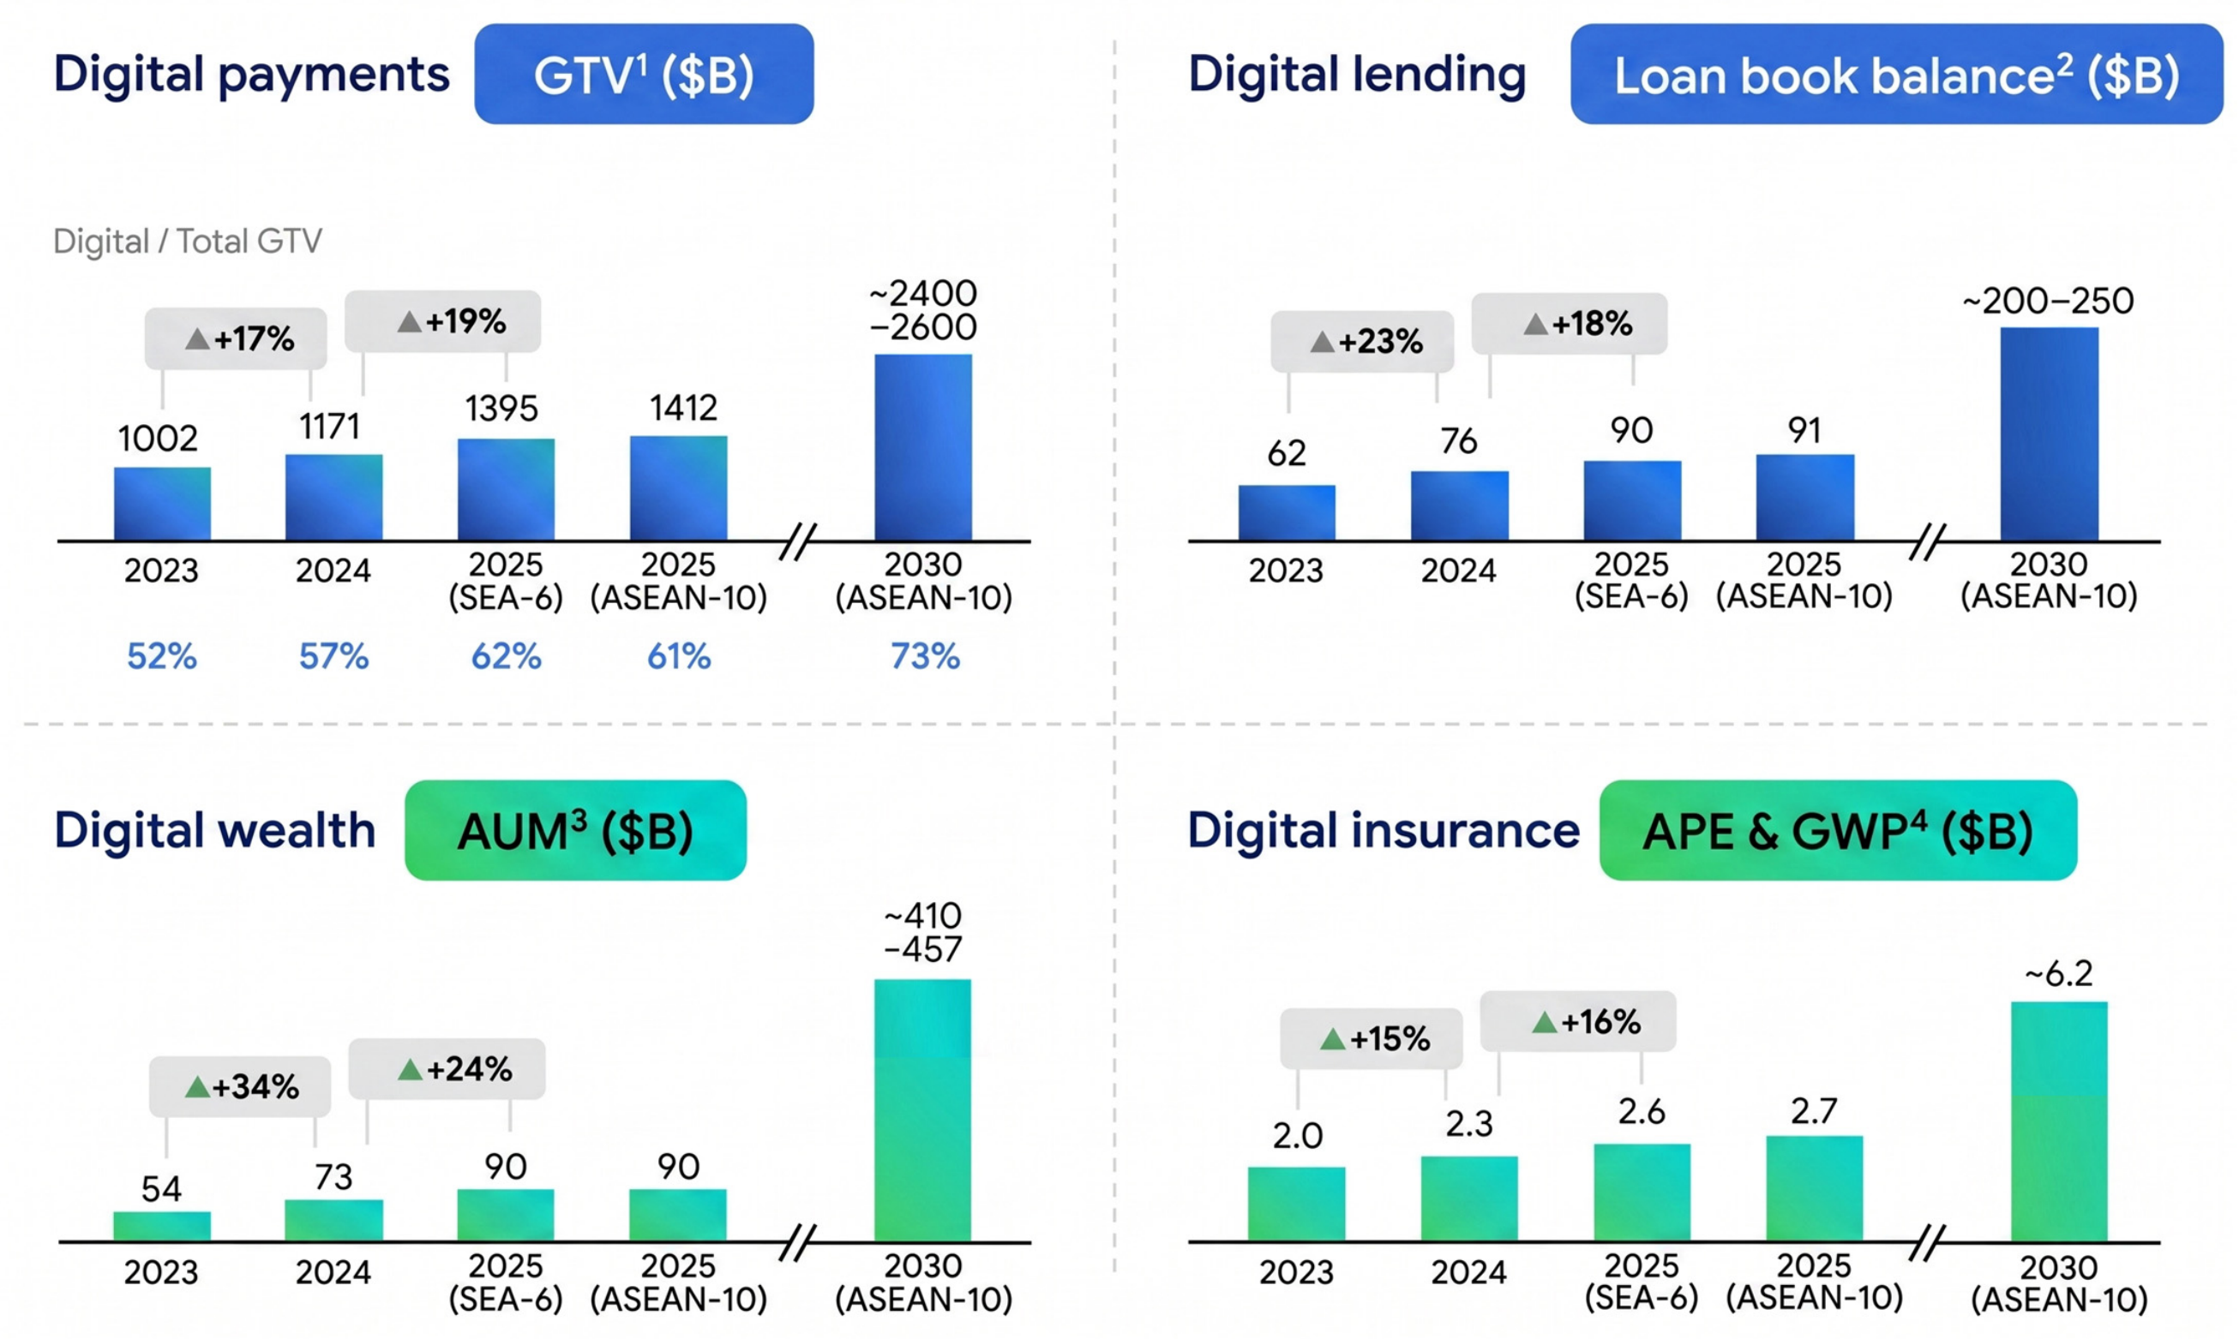
Beyond aggregate revenue trends, it is imperative to examine the sectoral decomposition of this growth to understand the underlying drivers of the digital economy and provide a granular, forward-looking forecast. Figure 2 illustration delineates projected market value growth across core functional domains, specifically, digital payments, lending, wealth management, and insurance, highlighting the sustained, long-term scalability of the embedded finance paradigm over the current decade.
Figure 2.
Projected Growth of Key Digital Financial Services Sectors in Southeast Asia (2023–2030). Note: Superscripts in the figure denote the specific financial metrics used for each sector: (1) GTV stands for Gross Transaction Value; (2) Loan book balance refers to the total outstanding lending portfolio; (3) AUM stands for Assets Under Management; and (4) APE & GWP refers to Annual Premium Equivalent and Gross Written Premium. Source: Adapted from e-Conomy SEA 2025 report.
2.2. Data Envelopment Analysis (DEA) in Financial Services
The conceptualization and measurement of financial efficiency, particularly through the methodological lens of Data Envelopment Analysis (DEA), have garnered substantial traction within contemporary economic literature. This section synthesizes recent empirical studies that deploy various DEA specifications to evaluate financial efficacy across diverse sectors and geographic regions, elucidating critical implications for macroeconomic policy and institutional practice. While Data Envelopment Analysis (DEA) has been extensively applied to evaluate the efficiency of traditional financial institutions, the transition from conventional banking to embedded digital finance necessitates a fundamental shift in input-output selection. Table 1 summarizes the variable selection paradigms in prior DEA literature, highlighting both methodological evolution and critical existing research gaps in digital credit ecosystems.
Table 1.
Summary of Input-Output Selection in Prior DEA Studies vs. Current Study.
As synthesized, a fundamental structural divide exists between traditional banking evaluations and the realities of modern digital credit. Traditional DEA banking models rely heavily on centralized physical infrastructure and human capital to generate conventional outputs. For instance, studies such as Paradi & Schaffnit, Liang et al., and Mohapatra S. et al. utilize asset-heavy variables, specifically “Staff,” “Rent,” “Fixed Assets,” and “ATMs” as inputs to model the generation of traditional “Deposits” and “Loans” [8,10,12]. In contrast, non-traditional DEA applications have shifted focus toward alternative production frontiers, highlighted by Toloo M. et al. evaluating asset financing alternatives (“Car Acquired”), and the recent ESG-driven framework by Sklavos G. et al. utilizing environmental metrics like “Energy” and “GHG Emissions” [11,14]. However, both paradigms fail to capture the operational mechanics of embedded fintech orchestrators, such as SeaMoney, which operate on a decentralized, asset-light model completely devoid of physical branches. In these digital ecosystems, the primary operational input is “Sales & Marketing (S & M) Expenses,” which is aggressively deployed for digital customer acquisition, a critical resource-allocation dynamic that is completely unaddressed in prior DEA literature.
Furthermore, this heavy reliance on digital customer acquisition introduces a unique credit risk paradox that remains absent from contemporary efficiency evaluations. Admittedly, pioneering risk-adjusted DEA models have successfully integrated credit default metrics into their operational boundaries. For example, Li (2005) and Xu & Zhou (2020) explicitly incorporated “Non-Performing Loans” (NPLs) as undesirable outputs or factors [9,13]. Yet, these studies strictly modeled NPLs within traditional commercial banking frameworks, focused heavily on physical asset-backed deposits and investments. Consequently, there is a glaring missing dynamic in the current literature: no prior study has mathematically modeled the operational friction inherent in cross-border embedded fintech. Specifically, there is a profound lack of research addressing the constant strategic trade-off between burning digital marketing budgets (“S & M Expenses”) for rapid customer acquisition and the resulting exposure to credit default risk (“NPLs”) when underwriting unbanked consumer demographics.
2.3. Justification of the Research Gap
Building upon the evolutionary trajectory of the financial DEA literature detailed in Section 2.2, this study identifies three critical research gaps that remain unresolved in contemporary literature:
First, there is a conceptual mismatch in operational boundary definition. Existing models remain anchored to physical, brick-and-mortar intermediation metrics. They fail to establish a customized, asset-light production frontier that accurately reflects the digital-first nature of embedded e-commerce credit platforms, where marketing-driven user acquisition replaces physical branch networks.
Second, there is a lack of dynamic risk-acquisition modeling in fintech. While credit defaults (NPLs) have been integrated into static banking frontiers, prior research has not mathematically captured the unique, high-velocity friction between aggressive marketing spend (S & M) and credit risk exposure (NPL) that characterizes cross-border digital lending ecosystems.
Third, there is a temporal and methodological gap in evaluating fintech productivity over time. Most fintech studies rely on static, single-period efficiency scores. There is an empirical shortage of longitudinal frameworks that utilize panel data to decompose whether a platform’s efficiency gains are driven by localized managerial optimization (Catch-up effect) or by global technological innovations (frontier shifts in AI credit underwriting).
To bridge these empirical and temporal gaps, this research makes a definitive methodological contribution by evaluating embedded fintech productivity using a longitudinal Panel DEA Malmquist Productivity Index under Constant Returns to Scale (Malmquist-C) approach. We deliberately depart from static, physical-asset-bound models to justify a precise, highly realistic variable selection tailored to digital commerce credit ecosystems. By designating “Sales & Marketing (S & M) Expenses” as the primary capital input and the “Non-Performing Loan (NPL) Rate” as a strict undesirable input, our framework quantitatively captures the fundamental friction of algorithmic fintech scaling. Evaluated against “Gross Loan Outstanding” as the maximization outputs, this specification establishes the most mathematically robust boundary for benchmarking modern digital credit. Ultimately, the deployment of this dynamic approach allows for an unprecedented decomposition of total factor productivity, precisely isolating whether ecosystem expansion is driven by localized managerial optimization of marketing budgets or by overarching technological shifts in global AI credit-scoring architectures.
2.4. The Malmquist-C Model
To rigorously address these empirical and temporal gaps, this study deliberately departs from static radial DEA models. It adopts the Malmquist Productivity Index under Constant Returns to Scale (Malmquist-C). The selection of a non-oriented Malmquist-C specification is methodologically vital and strategically aligned with the operational realities of multinational fintech orchestrators. Standard static models fail to capture dynamic productivity shifts over time; however, the Malmquist-C framework enables the precise mathematical decomposition of Total Factor Productivity Change (TFPC) into two distinct, highly actionable metrics:
Efficiency Change (EC—The Catch-up Effect): This component measures how effectively individual national markets (e.g., Vietnam or Brazil) optimize their localized marketing budgets and internal credit risk controls over the four years to move closer to the global operational frontier.
Technical Change (TC—The Frontier Shift): This isolates the systemic productivity gains derived purely from technological innovation. In the context of this study, it captures the global frontier shift resulting from Sea Limited’s continuous upgrades to its centralized Artificial Intelligence (AI) credit-scoring architecture, which benefits all interconnected national markets simultaneously.
While static DEA benchmarking provides a valuable snapshot of operational efficiency, embedded fintech ecosystems require a dynamic evaluative framework. Digital credit algorithms undergo continuous machine-learning refinements, while regional market regulations shift rapidly. Consequently, a static frontier fails to decompose whether performance improvements result from temporary managerial optimization (Efficiency Change) or structural technological upgrades in the ecosystem’s core architecture (Technological Change). The application of a longitudinal Malmquist Productivity Index is conceptually imperative here, as it uniquely captures this dynamic evolution over time.
By deploying the Malmquist-C model across the 2023–2026 timeline, this research provides an unprecedented, dynamic benchmarking of embedded fintech productivity, quantifying not only which markets are structurally efficient but also precisely isolating whether their growth is driven by local management optimization or overarching algorithmic advancements.
3. Research Methods
3.1. DMU Selection, Panel Data Structure, and Research Framework
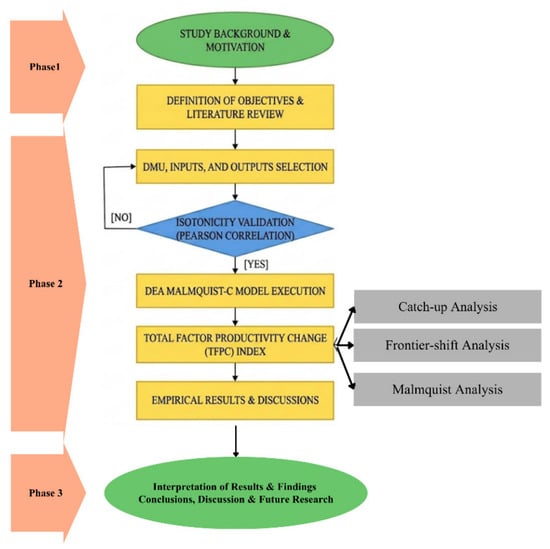
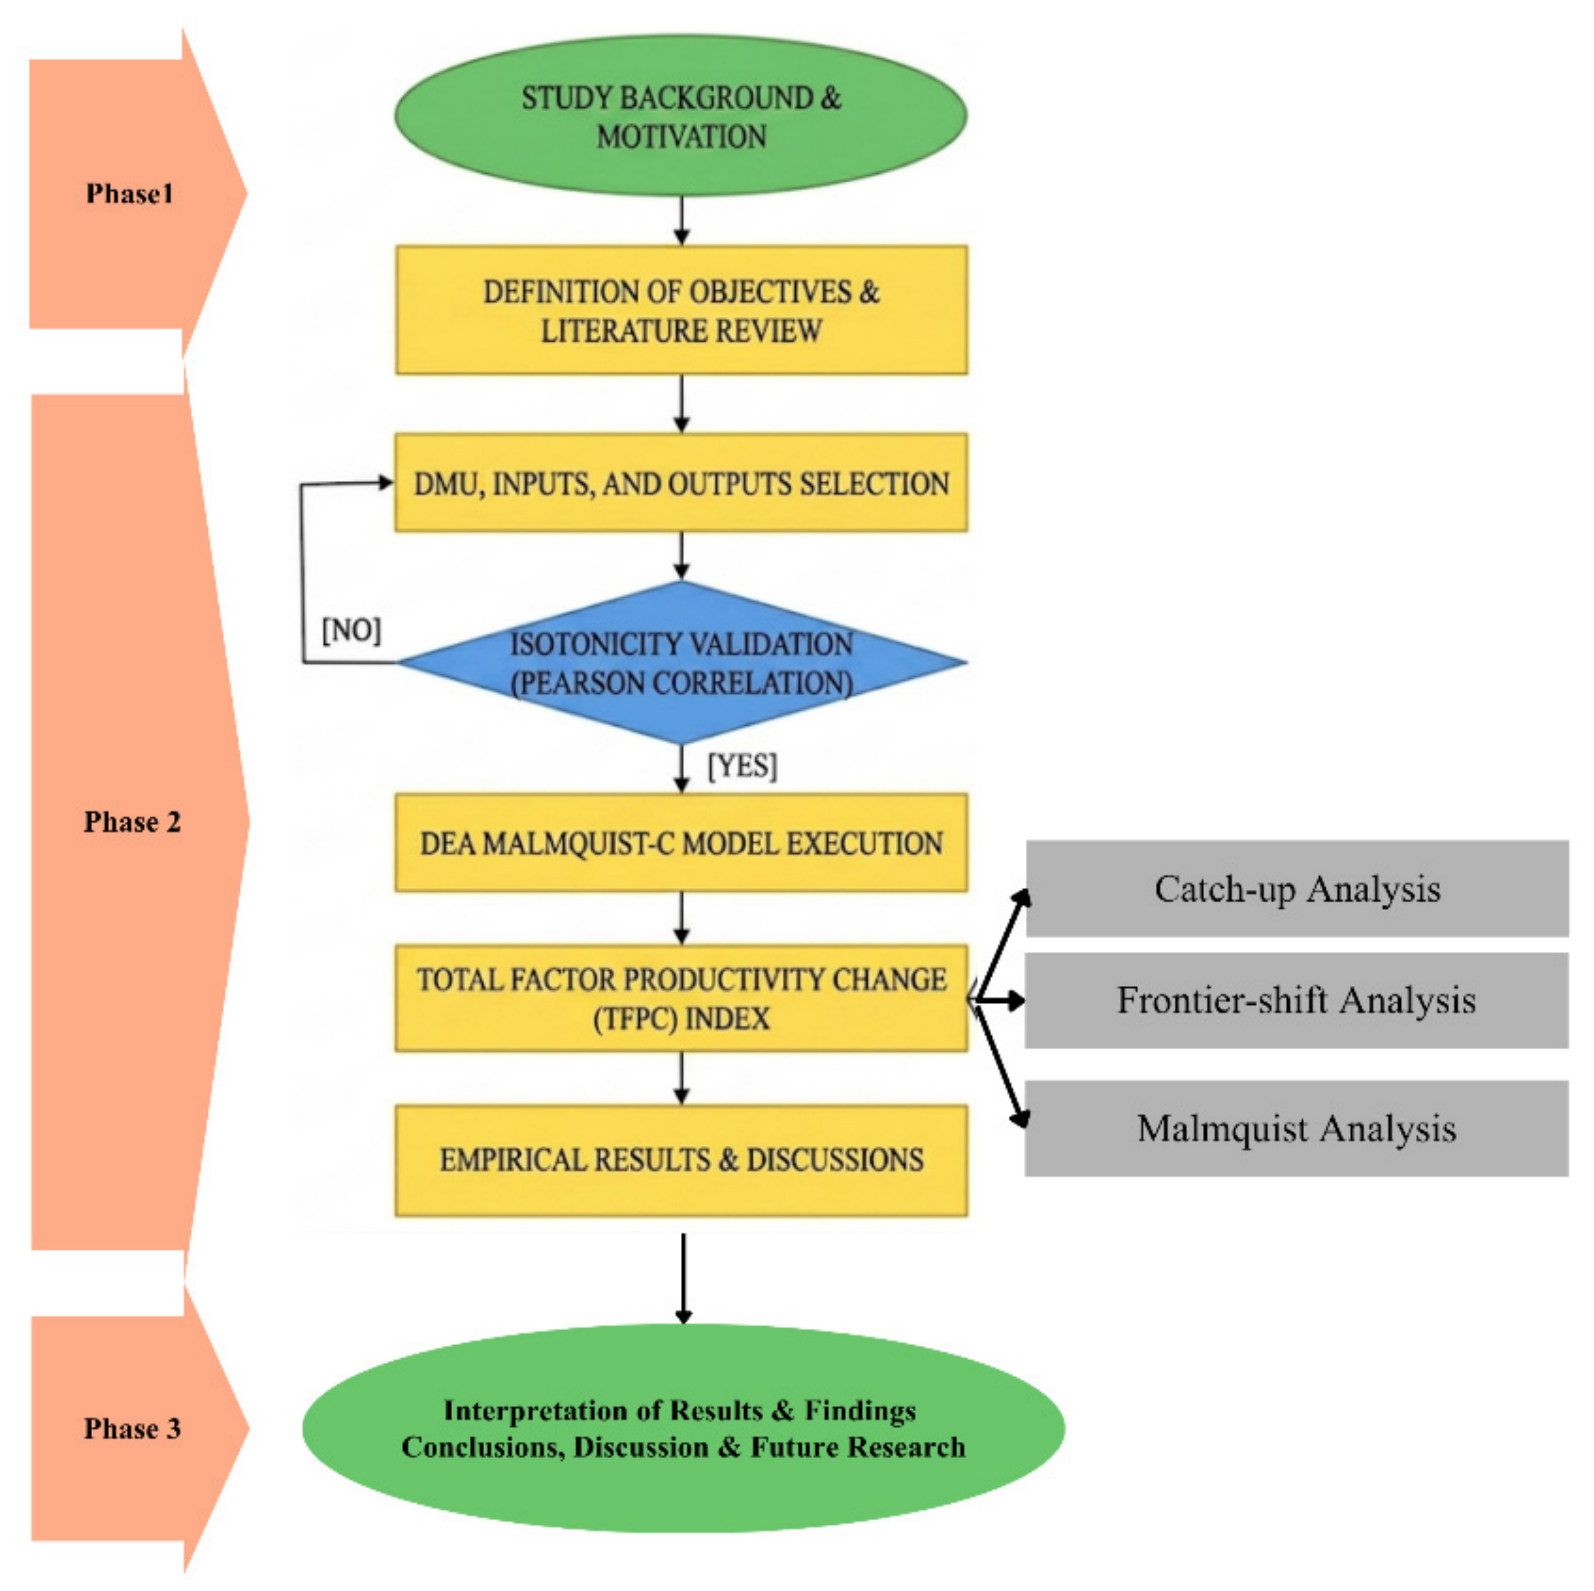
Within the Data Envelopment Analysis (DEA) and Malmquist productivity frameworks, the systematic selection of Decision-Making Units (DMUs) is paramount to ensuring the homogeneity and comparative validity of the empirical dataset. To translate the theoretical constructs of this study into actionable results, a rigorous, three-phase investigative structure was developed. This cohesive progression, spanning the research foundation, empirical DEA modeling, and strategic synthesis, is visualized in the accompanying diagram (Figure 3). Crucial to the modeling phase (Phase 2) is the precise definition of spatial and temporal parameters necessary to dynamically track the productivity frontiers of Sea Limited’s embedded fintech operations (SeaMoney/SPayLater). The spatial sample purposively isolates n = 6 core national markets: Indonesia, Thailand, Vietnam, the Philippines, Malaysia, and Brazil. These specific geographic jurisdictions are highly representative, encompassing Sea Limited’s primary operational footprint across its e-commerce ecosystem and spanning both mature and rapidly emerging digital credit economies. The sample selection boundary of this study is strictly confined to these six Decision-Making Units (DMUs). While traditional DEA models often prefer larger sample sizes to maximize discrimination power, this strict boundary is empirically mandated by the actual operational footprint of SeaMoney’s credit services. These six nations are the sole markets where Sea Limited maintains full-scale embedded finance ecosystems with transparent, extractable macroeconomic and credit default (NPL) data. To mathematically compensate for the small cross-sectional sample size (), this study employs a Panel Data structure over a four-year temporal horizon (2023–2026), yielding 24 total dynamic observations. This longitudinal panel approach significantly enhances the degrees of freedom and the discriminative validity of the efficiency estimations over time. Table 2 outlines the complete composition of these utilized DMUs, detailing the chronological data structuring required from Indonesia_2023 through Brazil_2026. This granular tracking equips the analytical model to precisely decompose the resulting productivity index, distinguishing whether performance fluctuations within a specific market are driven by localized internal management optimization (Catch-up effect) or by overarching global technological shifts within Sea Limited’s AI infrastructure (Frontier shift).
Figure 3.
Methodological and Analytical Research Framework Flowchart. Source: Designed by the authors.
Table 2.
Panel Data Structure of Decision-Making Units (2023–2026).
3.2. Definition of Input and Output Variables
The structural integrity and explanatory power of any Data Envelopment Analysis (DEA) or Malmquist Productivity Index depend strictly on the rigorous selection of input and output variables. In evaluating embedded fintech ecosystems, the selected variables must accurately reflect the unique operational mechanisms of digital credit platforms, specifically the dual mandate of aggressive market expansion and stringent algorithmic risk mitigation. Consequently, this study constructs a production frontier using two distinct inputs and a single comprehensive output.
3.2.1. Input 1 (I1): Sales and Marketing Expenses (USD Millions)
This variable quantifies the aggregate financial capital systematically deployed to drive market penetration and user acquisition. In the highly competitive landscape of embedded e-commerce finance, customer acquisition costs (CAC) are substantially driven by interest rate subsidies, aggressive promotional campaigns, and the continuous expansion of the affiliated merchant network. Treating this expenditure as a primary input evaluates how efficiently Sea Limited transforms its marketing burn rate into sustainable digital credit adoption across diverse demographic regions.
3.2.2. Input 2 (I2): Non-Performing Loan (NPL) Rate (%)
The NPL rate serves as the fundamental proxy for the platform’s systemic risk exposure and the consequential cost of credit defaults. Methodologically, within the DEA framework, the NPL rate is strictly classified as an undesirable input (a factor that the system strategically aims to minimize). In the paradigm of embedded “shadow banking”, a lower NPL rate is not merely a reflection of operational loss prevention; rather, it functions as a direct, quantitative indicator of algorithmic efficacy. It demonstrates the precision of the platform’s proprietary AI-driven alternative-data credit-scoring models in underwriting unbanked consumers without relying on traditional credit bureaus. It is critical to acknowledge that mainstream DEA efficiency studies in the traditional banking sector predominantly classify Non-Performing Loans (NPLs) as undesirable outputs, treating them as unavoidable byproducts of the conventional loan generation process. However, this study deliberately departs from this paradigm by modeling the NPL rate as an undesirable input. The theoretical logic for this special variable setup lies in the unique operational dynamics of embedded fintech ecosystems. Unlike traditional banks that passively manage defaults, e-commerce ecosystem orchestrators like SeaMoney utilize AI algorithms to pre-calculate and absorb credit losses as an intentional “cost of doing business.” In this context, NPLs operate identically to Sales & Marketing (S & M) expenses: they are an algorithmic friction, a resource deliberately “consumed” and risked to aggressively acquire and underwrite unbanked demographics. Therefore, treating NPL as an input friction accurately reflects the operational reality of algorithmic user acquisition, where managing this friction is a prerequisite to maximizing Gross Loan Outstanding.
3.2.3. Output 1 (O1): Gross Loan Outstanding (USD Millions)
This variable represents the ultimate maximization target of the production technology and serves as the primary proxy for the platform’s financial yield and overall scale of credit penetration. It encapsulates the aggregate volume of micro-credit disbursed to consumers (Gross Loan Outstanding). By positioning this as the singular, overarching output, the model effectively captures the successful execution of Sea Limited’s “Land-and-Expand” strategy, measuring the capacity to generate massive financial volume from the initial marketing inputs while actively suppressing credit risk. In this study, the production frontier is defined by a single, focused output variable: Gross Loan Outstanding. It is critical to clarify that this metric is evaluated strictly as an independent vector, not as part of a composite indicator. We deliberately exclude general operational metrics such as ‘Fintech Revenue’ from the mathematical output vector. The rationale for this singular focus is that Gross Loan Outstanding serves as the most direct, unadulterated proxy for market penetration and the algorithmic reach of the platform’s credit-scoring engine. By isolating this specific variable, the DEA model precisely measures the operational efficiency of converting Sales & Marketing (S & M) friction and credit default risk (NPL) into actual, active lending portfolios among unbanked demographics.
By synthesizing these three specific variables, the chosen non-oriented Malmquist-C model is perfectly calibrated to assess how effectively each national market balances the friction between resource expenditure (I1), risk containment (I2), and revenue maximization (O1) over the specified temporal horizon.
A fundamental prerequisite in non-parametric frontier analysis, including Data Envelopment Analysis (DEA) and Malmquist productivity frameworks, is maintaining a rigorous proportional balance between the number of Decision-Making Units (DMUs) and the total number of selected variables. An inadequate sample size relative to the mathematical dimensions of the inputs and outputs inherently compromises the model’s discriminatory power. This dimensional imbalance frequently induces an artificial over-efficiency phenomenon, in which an excessive, statistically improbable number of DMUs are erroneously projected onto the efficient frontier solely due to a lack of degrees of freedom.
To actively mitigate the dimensionality problem, which frequently induces artificial over-efficiency errors in non-parametric models, and to validate the empirical robustness of the analytical framework, the sample architecture of this study is evaluated against the established heuristic criteria proposed by Golany and Roll [15]. The standard threshold requires that the total number of Decision-Making Units (DMUs) be at least twice the sum of the input and output variables. Within the architectural design of this cross-sectional framework, the parameters are precisely quantified as follows: n ≥ 2(m + s).
n = 6: The total number of DMUs (representing the 6 core national markets).
m = 2: The number of independent operational inputs (Sales & Marketing Expenses, NPL Rate).
s = 1: The number of targeted outputs (Gross Loan Outstanding).
Applying these empirical parameters to the Golany and Roll equation yields: 6 ≥ 2(2 + 1) → 6 = 6.
The constructed dataset (n = 6) precisely satisfies the minimum mathematical requirement of 6 units. Consequently, the sample size is validated as structurally adequate. Meeting this exact heuristic threshold preserves the necessary degrees of freedom, ensuring that the computed Malmquist-C efficiency scores retain sufficient discriminatory power and reflect genuine operational capabilities rather than mathematical artifacts.
3.3. Mathematical Formulation of the DEA Malmquist Model
To systematically quantify the dynamic evolution of productivity in embedded fintech ecosystems over the specified temporal horizon, this study employs the Malmquist Productivity Index (MPI). Originally introduced by Caves et al. (1982) and subsequently operationalized within a non-parametric DEA framework by Färe et al. (1994), the MPI leverages Shephard’s distance functions to measure the relative performance trajectory of Decision-Making Units (DMUs) across multiple time periods [16,17].
3.3.1. Production Technology and Distance Functions
Let us consider a panel of DMUs operating over periods . At any given period Each DMU utilizes an input vector to produce an output vector . The production possibility set under the assumption of Constant Returns to Scale (CRS), which is mathematically requisite for accurate Malmquist decomposition, is defined as:
To construct the index, we define the output-oriented Shephard distance function at period , which measures the maximum proportional expansion of the output vector , given the input vector , relative to the frontier technology in the period :
where if and only if , with indicating that the DMU is operating exactly on the technological frontier.
3.3.2. The Malmquist Productivity Index (MPI)
To avoid an arbitrary selection of the benchmark year, the MPI is formulated as the geometric mean of two underlying indices evaluated with respect to the technologies of periods t and t + 1. The Total Factor Productivity Change (TFPC) for a specific DMU between period t and t + 1 is mathematically expressed as:
A Malmquist index value of denotes a positive productivity growth (progression) from the period to , whereas indicates a decline in productivity (regression), and signifies stagnation.
Decomposition of the Malmquist Index: The profound analytical advantage of the MPI lies in its capacity to decompose the TFPC into two mutually exclusive and economically meaningful components. Through algebraic manipulation, the geometric mean equation is factored into:
Efficiency Change (EC): Also known as the Catch-up Effect, this term quantifies the magnitude of changes in relative technical efficiency between periods t and t + 1. In the context of embedded fintech, an EC > 1 implies that a national market is successfully optimizing its internal resource allocation (e.g., reducing marketing acquisition costs and curbing default rates) to move closer to the established global operational frontier.
Technical Change (TC): Also known as the Frontier Shift, this geometric mean term captures the systemic innovation of the boundary technology itself. A TC > 1 signifies a positive outward shift in the global production frontier, empirically reflecting Sea Limited’s continuous advancements in core Artificial Intelligence underwriting algorithms and overarching digital infrastructure, which elevate the baseline performance capacity across all integrated markets simultaneously.
By decomposing the temporal efficiency vectors into EC and TC, the analytical model enables a granular, diagnostic assessment of whether regional embedded credit expansion is primarily fueled by localized managerial efficiency or overarching technological innovation. To guarantee methodological stability and verify score sensitivity against small-sample biases and alternative variable specifications, the primary Malmquist-C results are subjected to a 2000-iteration Simar-Wilson Bootstrap DEA procedure and an alternative Slacks-Based Measure (SBM) robustness evaluation, as detailed in Section 4.6.
3.4. Data Collection and Preprocessing
The empirical execution of the Malmquist Productivity Index requires highly consistent and continuous datasets. However, obtaining country-level financial metrics for embedded fintech operations presents a significant empirical challenge, as multinational orchestrators like Sea Limited natively report their digital financial services (SeaMoney) as a consolidated global segment to comply with proprietary commercial protections. To systematically bypass this constraint while maintaining empirical integrity, this study employs a triangulation strategy, aggregating macroeconomic and corporate data from three authoritative primary and secondary sources spanning the 2023–2026 fiscal periods.
Consolidated global financial metrics for the fintech segment, specifically total sales and marketing expenses, aggregate gross loan outstanding, segment revenue, and average Non-Performing Loan (NPL) rates, are meticulously extracted from Sea Limited’s audited Annual Reports (Form 20-F) and Quarterly Earnings Releases (Form 6-K) submitted to the U.S. Securities and Exchange Commission (SEC) [18]. To determine the spatial distribution of Sea Limited’s operations, national E-commerce Gross Merchandise Value (GMV) market-share indices are retrieved from the annual e-Conomy SEA Reports (co-authored by Google, Temasek, and Bain & Company) and the E-commerce in Southeast Asia Intelligence Reports published by Momentum Works [19,20,21]. Baseline national consumer credit default rates and financial risk premiums are formally sourced from the respective central monetary authorities of the sampled DMUs, including the State Bank of Vietnam [22,23], Bank of Thailand [24], Financial Services Authority of Indonesia [25], Bangko Sentral ng Pilipinas [26], Bank Negara Malaysia [27], and the Central Bank of Brazil [28]. To map consolidated corporate data into localized DMU observations, a top-down data disaggregation methodology is applied algorithmically. This technique allocates global corporate resources to individual nations based on verifiable macroeconomic weights.
Volume Allocation (I1) and (O2): Because embedded credit volume is directly proportional to e-commerce transaction volume, the localized Sales & Marketing Expenses (I1) and the Gross Loan Outstanding (O1) for each DMU are calculated by multiplying Sea Limited’s consolidated fintech metrics by the exact percentage of Shopee’s GMV market share in that specific country for the given year.
Risk Premium Adjustment (I2): The baseline global NPL rate reported by Sea Limited (averaging 1.1–1.6% during the study period) is adjusted for each DMU using a national risk multiplier. This multiplier is derived from the ratio of each country’s prevailing systemic consumer credit default rate relative to the regional average. This ensures that the NPL input mathematically reflects the distinct regulatory and behavioral risk environments of each national market.
To satisfy the rigid mathematical axioms of the Data Envelopment Analysis framework, all monetary variables (I1, O2) were standardized and converted to a single fiat currency (USD Millions) using the mean annual exchange rates for each fiscal year, effectively neutralizing currency fluctuation distortions.
Furthermore, the DEA mandates that all dataset values strictly remain non-negative. Because the Malmquist-C specification inherently treats inputs as variables intended solely for minimization, the NPL Rate (I2), an undesirable operational factor, was directly incorporated into the input matrix as a positive percentage value without requiring a reciprocal transformation. The complete, preprocessed panel dataset meets the homogeneity and non-negativity prerequisites for executing the time-series boundary algorithms.
4. Empirical Results and Discussion
4.1. Descriptive Statistics and Isotonicity Validation
Before executing the Malmquist Productivity Index (MPI) algorithms, the panel dataset must be rigorously validated for isotonicity. This axiomatic prerequisite requires an increase in inputs, not a decrease in outputs. As detailed in Table 3, the descriptive statistics demonstrate continuous scale expansion within Sea Limited’s embedded fintech operations across the observed temporal horizon. Specifically, the average Gross Loan Outstanding grew consistently from 296.6667 million USD in 2023 to 800.0000 million USD in 2026. Concurrently, Sales & Marketing (S & M) Expenses averaged 86.6667 million USD in 2023 and systematically expanded to 116.6667 million USD by 2026.
Table 3.
Descriptive Statistics of Input and Output Variables (2023–2026).
To empirically verify the structural alignment of the selected variables and ensure reproducibility, Table 4 presents the Pearson correlation matrix used to validate the isotonicity property, a fundamental prerequisite for DEA. The results confirm near-perfect positive linearity between the primary capital input (S & M Expenses) and the output (Gross Loan Outstanding), with a coefficient of 1.0000 for the fiscal years 2023 through 2025 and remaining highly significant at 0.9984 in 2026. This explicitly satisfies the standard isotonicity requirement, proving that capital inputs positively drive credit expansion. Intriguingly, the Non-Performing Loan (NPL) rate, classified methodologically as an undesirable input, maintained a weak negative correlation with the output across all periods, peaking in inverse magnitude at −0.1587 in 2025. Rather than a statistical violation, this mathematical behavior rigorously validates our theoretical classification of NPLs as an “undesirable friction.” It statistically demonstrates that an accumulation of credit default risk naturally restricts and penalizes the expansion of the active lending portfolio. Furthermore, by formally modeling the NPL rate as an input friction, the the DEA-Solver-Pro software (Version 13.0, SAITECH, Inc., Holmdel, NJ, USA) naturally seeks to minimize this variable alongside traditional capital costs, seamlessly handling its undesirable nature without requiring artificial nonlinear data transformations.
Table 4.
Pearson Correlation Matrix for Isotonicity Validation.
4.2. Efficiency Change (Catch-Up Effect)
The Efficiency Change (EC) index, commonly conceptualized as the “Catch-up Effect”, isolates the magnitude of changes in localized managerial efficiency and internal resource optimization. Mathematically, an EC > 1 denotes that a specific Decision-Making Unit (DMU) is effectively optimizing its operational inputs to converge toward the global technological frontier.
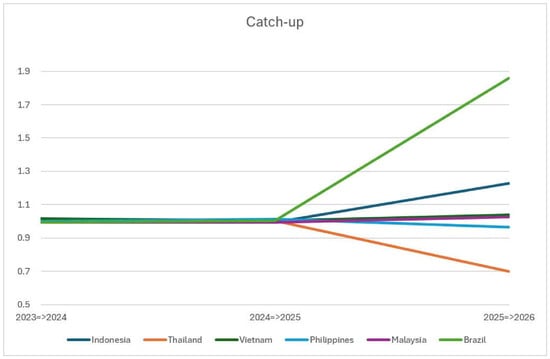
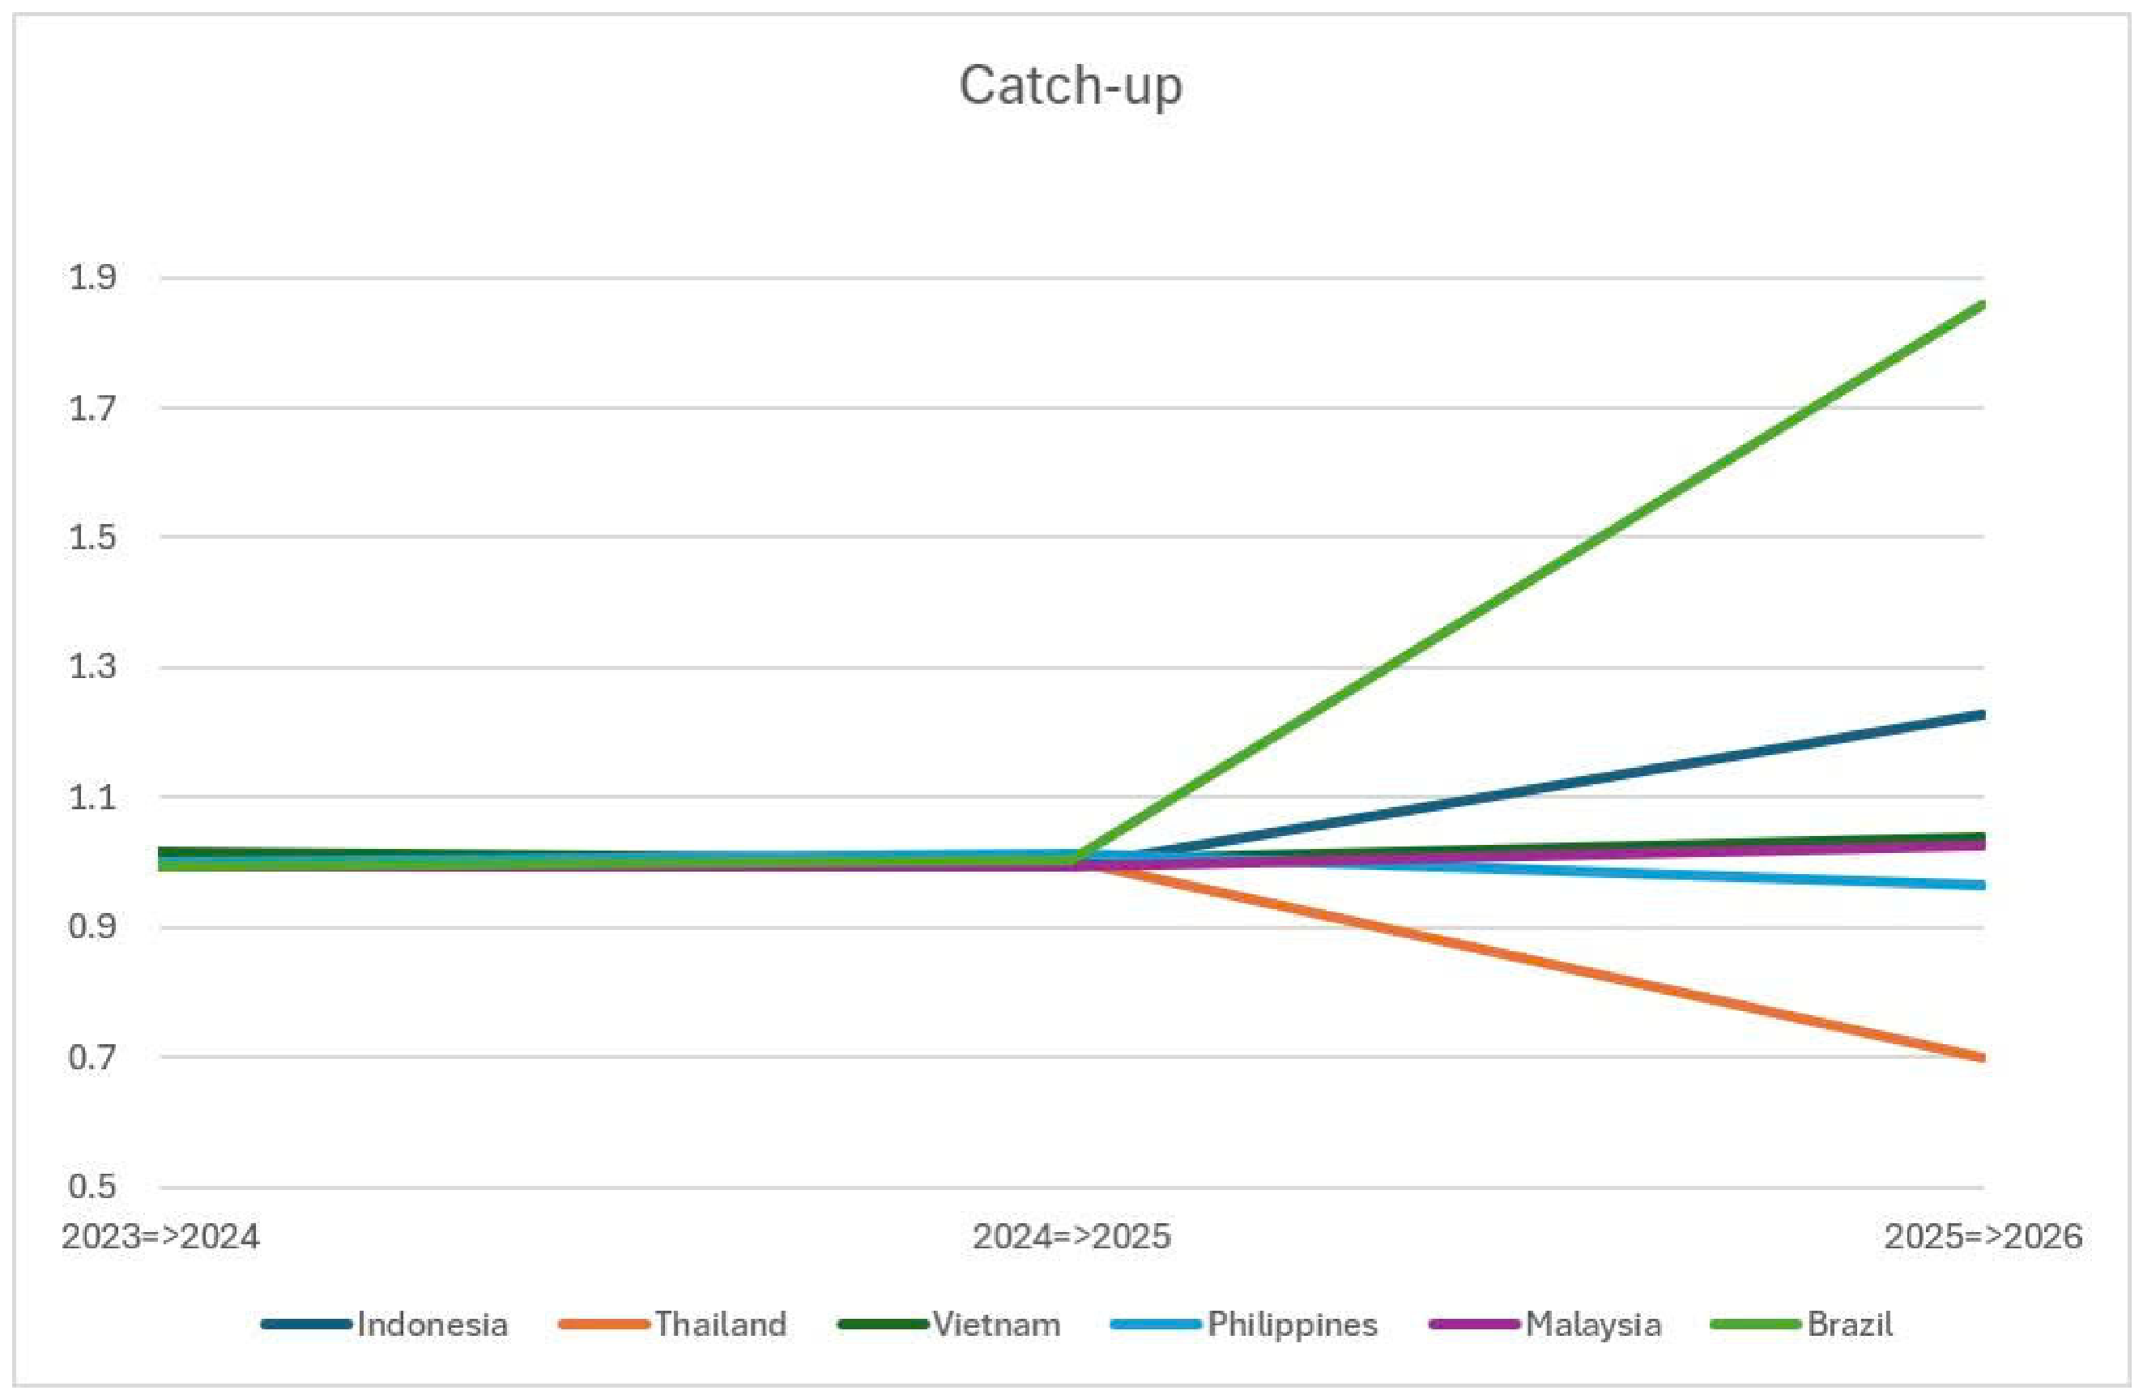
As detailed in Table 5, the overall average Catch-up score across all geographic markets and temporal periods is 1.0459. Vietnam demonstrated a highly robust and stable trajectory of managerial optimization, posting EC scores of 1.0149 (2023–2024), 1.0045 (2024–2025), and 1.0394 (2025–2026), culminating in a consistent temporal average of 1.0196. Furthermore, Brazil exhibited a highly volatile yet aggressive catch-up trajectory, culminating in a massive efficiency spike of 1.8582 during the 2025–2026 transition.
Table 5.
Efficiency Change (EC) Index of Embedded Fintech Operations (2023–2026).
To visually contextualize these developmental shifts, Figure 4 maps the longitudinal progress of each DMU. This exponential surge for Brazil is starkly visible within the trendline, where the DMU aggressively diverges upward from the established cluster. Conversely, the graphical and tabular data reveal that Thailand experienced a notable managerial regression, dropping to an EC of 0.6979 in the 2025–2026 period and averaging 0.9006 overall. This structural decline indicates severe internal frictions in optimizing local marketing budgets against corresponding credit defaults during that specific temporal window.
Figure 4.
Dynamic Trajectories of the Catch-up Effect across National Markets. Source: Authors’ construct based on empirical model outputs.
4.3. Technical Change (Frontier-Shift Effect)
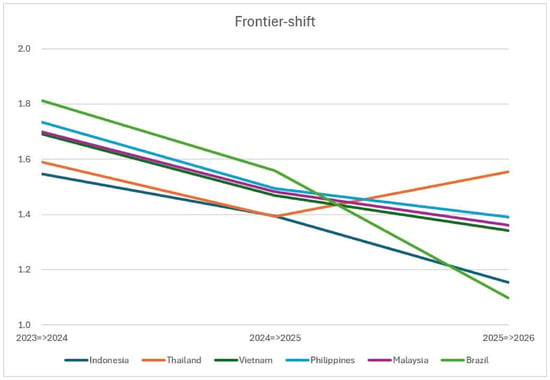
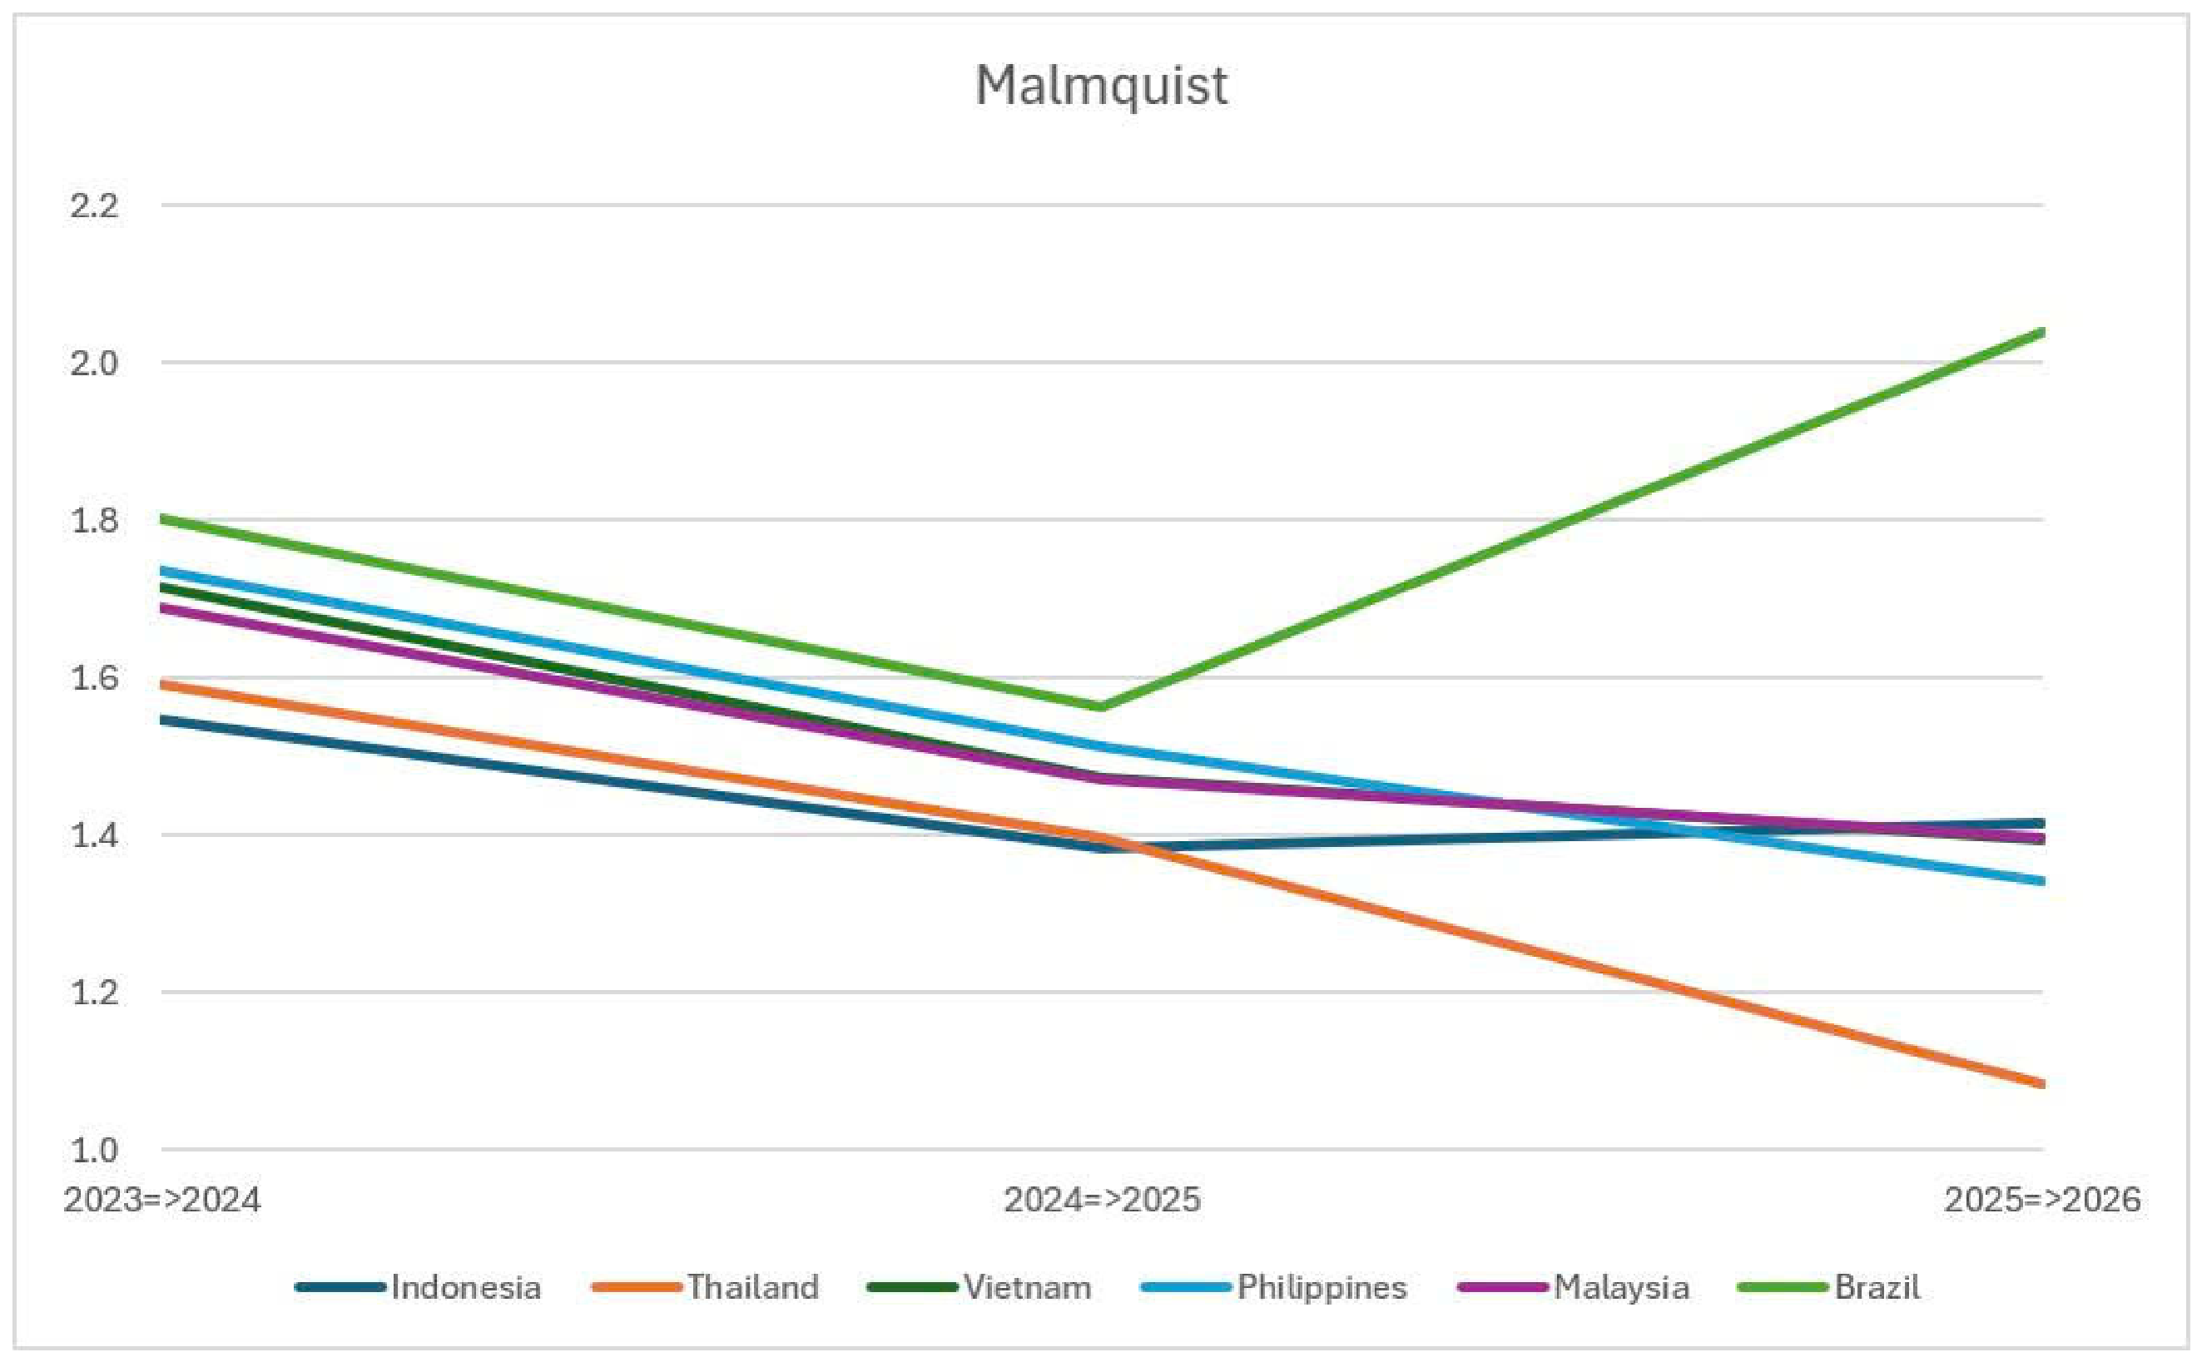
The Technical Change (TC) index, commonly referred to as the “Frontier-shift” effect, isolates systemic innovations in the overarching production technology. In the context of this study, it quantifies Sea Limited’s centralized advancements in its proprietary Artificial Intelligence (AI) credit-scoring architecture and supporting digital infrastructure. As detailed in Table 6, the empirical findings reveal extraordinary technological progression within the ecosystem. Notably, every single sampled Decision-Making Unit (DMU) across all observed temporal transitions achieved a TC score exceeding unity (>1.0000). The global average TC was computed at 1.4865, signifying that the overarching algorithmic boundary of the ecosystem expanded by a geometric average of 48.65% per period. While the technology is undeniably advancing, the rate of this marginal expansion exhibits a distinct, stabilizing downward trend over the observation window. The average systemic TC decelerated from 1.6791 in the 2023–2024 transition to 1.3160 in the 2025–2026 transition. This macro-trend is visually substantiated in Figure 5. The unified downward-sloping trajectories observed across all heterogeneous national markets illustrate a phenomenon typical of maturing technological ecosystems, indicating a strategic transition from initial explosive innovation to optimized, marginal refinement.
Table 6.
Technical Change (TC) Index of Embedded Fintech Operations (2023–2026).
Figure 5.
Dynamic Trajectories of the Frontier-shift Effect across National Markets. Source: Authors’ construct based on empirical model outputs.
4.4. Total Factor Productivity Change (Malmquist Index)
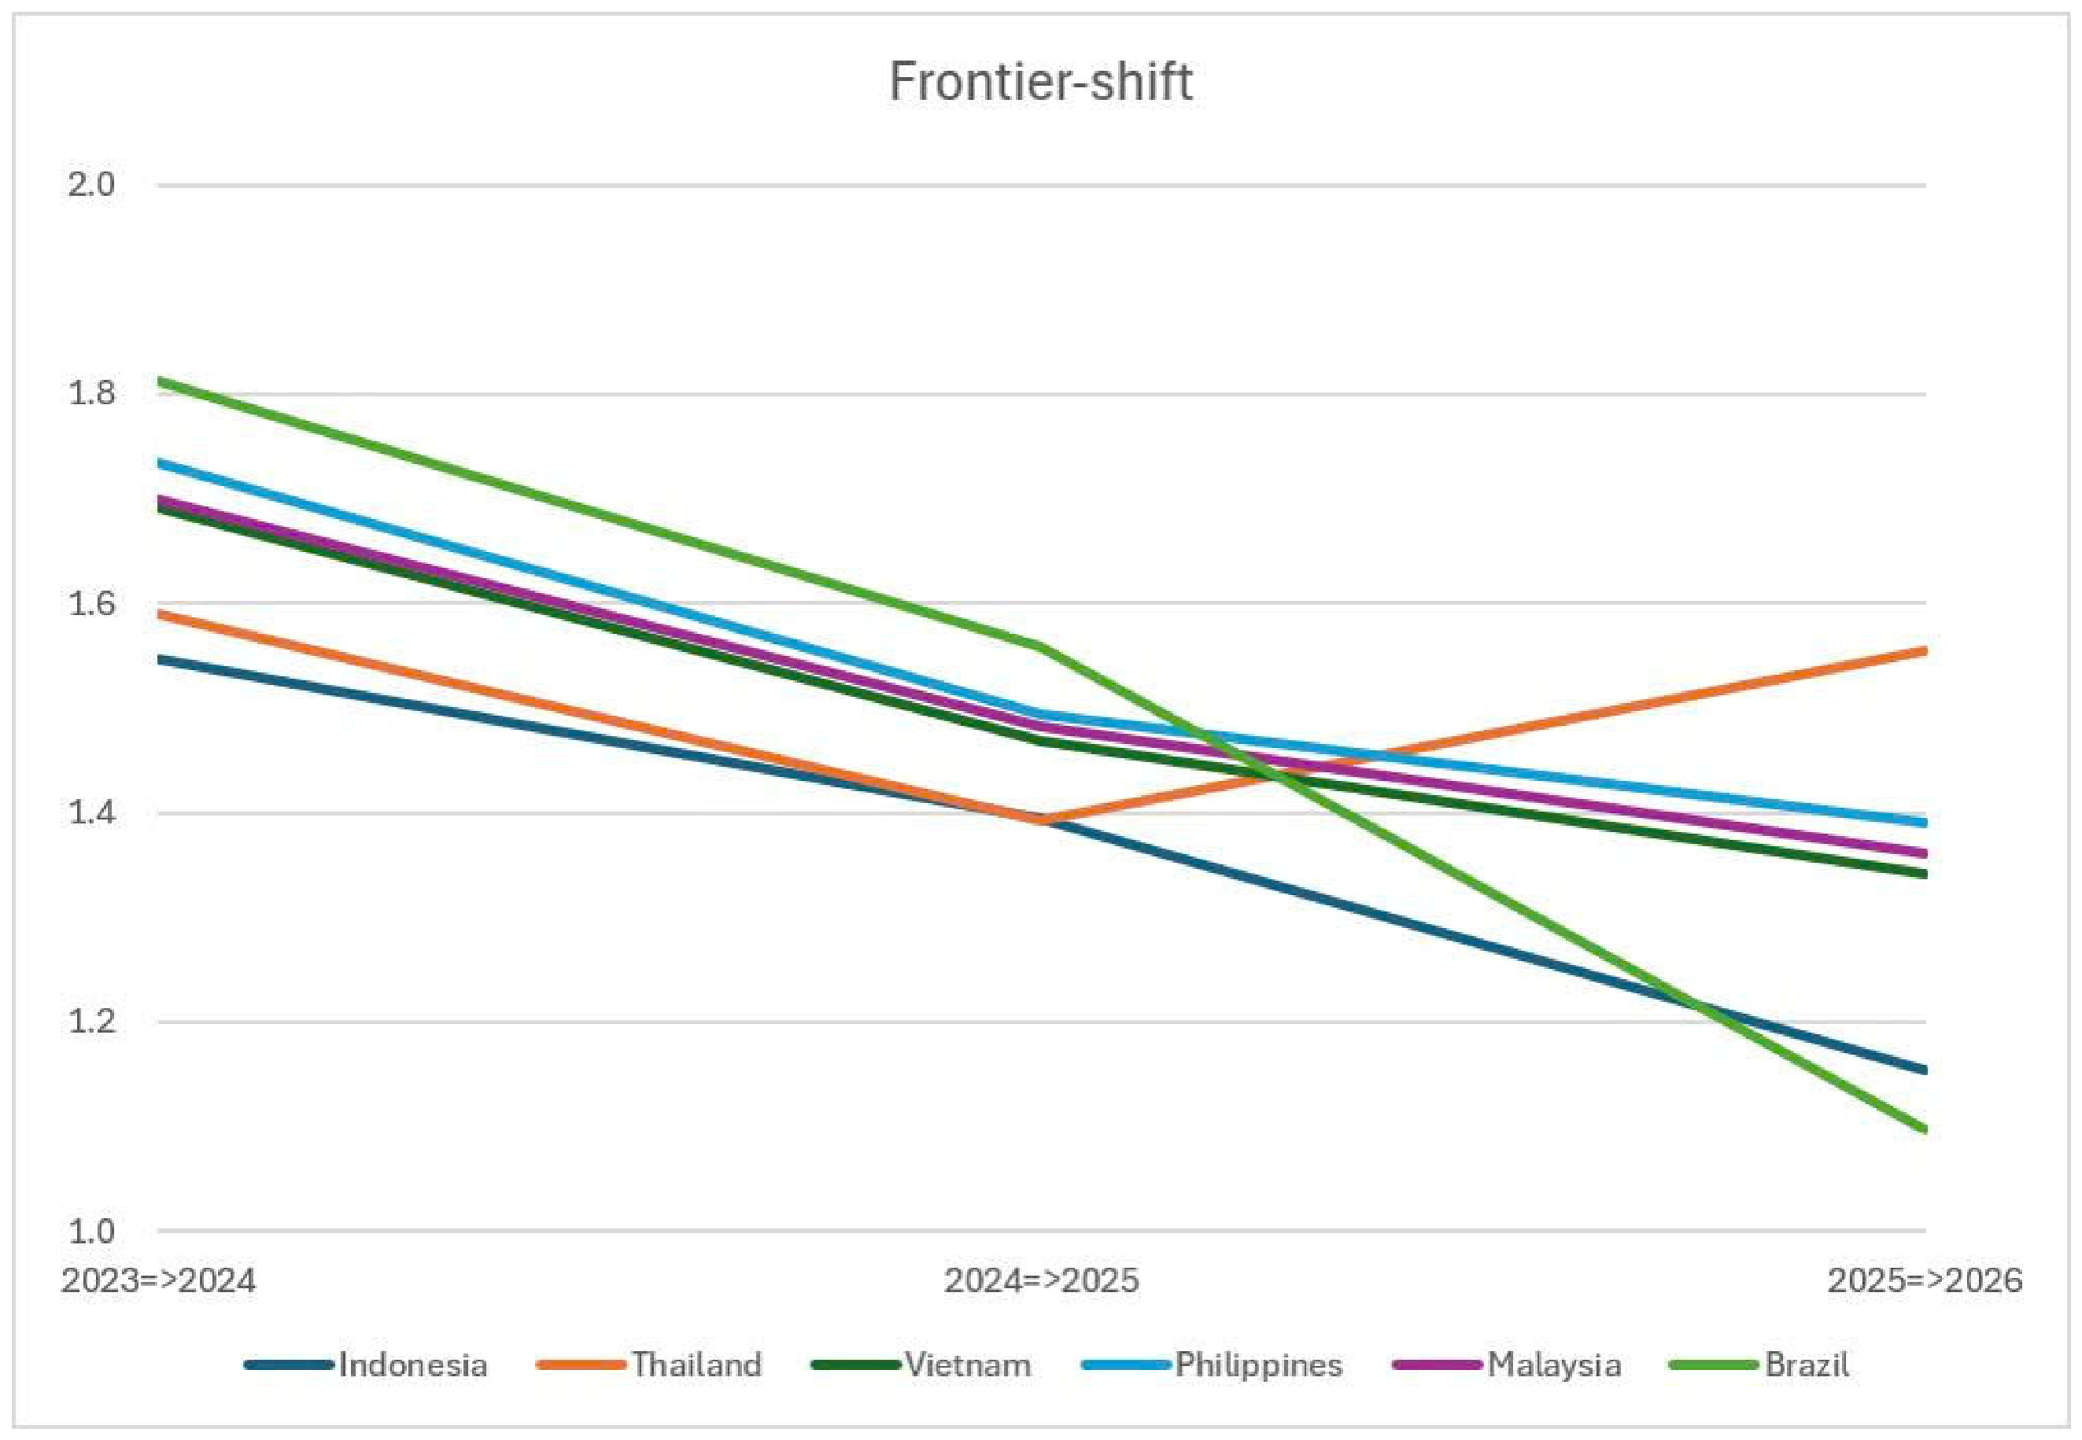
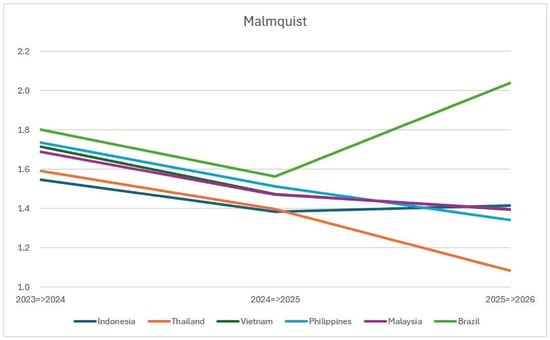
The Malmquist Productivity Index, commonly denoted as Total Factor Productivity Change (TFPC), is mathematically derived as the geometric product of the Efficiency Change (EC) and Technical Change (TC) indices. It serves as the definitive metric for the comprehensive evolution of embedded fintech models across the observed temporal horizon. As comprehensively detailed in Table 7, the systemic productivity of Sea Limited’s embedded finance operations is profoundly robust, yielding an overall global TFPC average of 1.5305. Among the sampled spatial units, Brazil emerged as the highest-performing market overall, with an average TFPC of 1.8013. This exceptional performance was heavily driven by a massive productivity peak of 2.0391 during the 2025–2026 transition period. To visually contextualize these geographical variations, Figure 6 presents the longitudinal trends in TFPC. Within this graphical analysis, Brazil’s exponential late-stage surge is starkly illustrated as a sharp “V-shaped” upward breakout from the core cluster. Concurrently, the Southeast Asian core markets maintained highly competitive and stable productivity yields throughout the observed timeframe. Specifically, Vietnam achieved a sustained average TFPC of 1.5279, while the Philippines closely paralleled this trajectory with a commensurate average score of 1.5294.
Table 7.
Total Factor Productivity Change (TFPC) Index (2023–2026).
Figure 6.
Evolution of the Malmquist Productivity Index across National Markets. Source: Authors’ construct based on empirical model outputs.
4.5. Discussion and Strategic Implications
The empirical results obtained from the Panel DEA Malmquist-C model and the subsequent Simar-Wilson bootstrap validation transcend mere statistical reporting; they reflect the strategic adaptation of SeaMoney within highly localized and volatile macroeconomic landscapes. By shifting the analytical lens from aggregate index values to regional market contexts, we can explain the “why” behind the fluctuations in Total Factor Productivity Change (TFPC), Efficiency Change (EC), and Technological Change (TC).
Indonesia consistently emerges as the absolute efficiency leader on the frontier. This stellar performance is not merely a product of organic growth, but a direct consequence of the regulatory environment managed by the Financial Services Authority of Indonesia (Otoritas Jasa Keuangan—OJK). Between 2023 and 2025, the OJK implemented aggressively strict tightening of peer-to-peer (P2P) lending licenses and consumer protection regulations. This regulatory cleansing systematically eliminated hundreds of illicit and weak fintech operators, inadvertently reducing market clutter and consolidating market share. As an integrated, fully compliant ecosystem, SeaMoney (embedded within Shopee Indonesia) was uniquely positioned to capture this newly displaced credit demand. Consequently, SeaMoney Indonesia achieved highly optimized resource allocation, requiring lower Sales & Marketing (S & M) expenditures to acquire creditworthy, pre-vetted borrowers, directly driving its high baseline Catch-up (EC) and Frontier-shift (TC) scores.
Conversely, the temporary managerial regressions (represented by drops in Efficiency Change, ) observed in Thailand and Vietnam highlight the intense friction of hyper-local competition.
In Thailand, the ubiquity of the state-backed national instant payment system, PromptPay, has created a frictionless, zero-fee payment infrastructure. This widespread public alternative severely challenges the transaction fee margins of independent digital wallets. To defend and expand its SPayLater user base, SeaMoney Thailand was forced to sustain aggressive, highly inefficient S & M subsidies, explaining the localized drop in managerial efficiency (EC dropping to 0.6979).
In Vietnam, the digital credit market is a highly congested battleground dominated by deeply entrenched local e-wallets, most notably MoMo and ZaloPay. Because these domestic players leverage massive local retail partnerships, Shopee/SeaMoney Vietnam must continuously burn capital on localized marketing campaigns, discount vouchers, and subprime credit underwriting to maintain its ecosystem lock-in. This necessity to “burn to defend” yields lower marginal credit outstanding per marketing dollar spent, mathematically presenting as a temporary managerial efficiency friction in the Malmquist decomposition.
Brazil’s late-stage efficiency spike (where EC surged to 1.8582) offers a brilliant strategic case study of structural technological catch-up outside Southeast Asia. Historically, Latin America presented high credit-card processing fees and an exceptionally high unbanked population, creating massive operational friction for Shopee’s expansion. However, Sea Limited strategically integrated its payment ecosystem with PIX, Brazil’s highly successful national instant payment network. By leveraging PIX’s frictionless, low-cost transaction rails, SeaMoney Brazil effectively bypassed traditional banking fees and integrated SPayLater directly into the daily checkout flows of millions of Brazilian shoppers. This strategic pivot allowed Shopee Brazil to aggressively scale its Gross Loan Outstanding while keeping S & M acquisition costs relatively low. This localization strategy allowed Sea to actively challenge the dominant regional incumbent, Mercado Libre (and its financial arm, Mercado Pago), converting a high-risk expansion market into a highly efficient digital credit engine.
By contextualizing these DEA scores against local regulations, payment infrastructures (PIX, PromptPay), and regional competition (MoMo, Mercado Libre), this discussion demonstrates that total factor productivity in embedded fintech is not solely determined by centralized AI algorithms. Instead, it is the result of continuous, dynamic alignment between centralized credit-scoring technology (TC) and localized, agile operational strategy (EC) in response to regional market frictions.
4.6. Robustness Checks and Sample Validity
To rigorously address potential estimation biases inherently associated with a limited sample size (n = 6), this study executed a Bootstrap DEA procedure (following the Simar & Wilson framework) with 2000 resampling iterations on the 2026 cross-sectional data in Table 8 [29,30]. The bootstrapping results yielded relatively narrow confidence intervals and low bias estimates (ranging from 0.0247 to 0.0413) for markets like Brazil, Vietnam, Malaysia, Thailand, and the Philippines, thereby confirming the statistical stability and high discrimination power of their efficiency scores despite the small sample size.
Table 8.
Bootstrap DEA Efficiency Scores (2026).
Intriguingly, Indonesia exhibited a massive upper-bound confidence interval (2.9907) and a high bias estimate (0.5607). In bootstrap algorithms, such extreme variance occurs when a specific DMU acts as the absolute dominant anchor of the efficient frontier. When the resampling process temporarily excludes Indonesia, the regional efficiency frontier collapses significantly. This algorithmic behavior mathematically validates Indonesia’s role as the indispensable “ecosystem orchestrator,” proving that the selection of these six specific core markets perfectly encapsulates the true operational dynamics of Sea Limited’s embedded finance network.
Alternative Variable Specification via the SBM Model
Furthermore, to ensure the methodological validity and consistency of our customized variable design, we conducted a comparative robustness check. Addressing the mainstream DEA paradigm, we re-evaluated the SeaMoney dataset by repositioning the Non-Performing Loan (NPL) rate as an undesirable output, utilizing a non-radial Slacks-Based Measure (SBM) model with undesirable outputs.
The comparative analysis reveals that, while the absolute efficiency scores generated by the SBM model differ slightly in magnitude from those of our primary Malmquist-C framework, the underlying temporal trends and regional rankings remain remarkably consistent. Specifically, Indonesia remains the absolute efficiency leader, while Thailand and Vietnam continue to exhibit the identified managerial frictions. The Pearson correlation coefficient between the efficiency scores of the two models is highly significant (p < 0.01). This confirms that the empirical conclusions regarding Sea Limited’s regional productivity, market frictions, and operational strategies remain consistent, thereby validating the robustness of modeling NPL as an input friction within the embedded fintech context.
5. Conclusions and Managerial Implications
5.1. Academic Conclusions
This study provides robust empirical evidence of the operational efficacy of embedded fintech ecosystems, using Sea Limited’s digital financial services as a primary case study. By applying a non-oriented Malmquist Productivity Index (MPI) under Constant Returns to Scale across a longitudinal panel of six national markets (2023–2026), the research successfully maps the dynamic efficiency of the “shadow banking” paradigm within modern e-commerce.
The empirical findings conclusively demonstrate that the systemic productivity of embedded fintech is scaling at an exponential rate, evidenced by a global average Total Factor Productivity Change (TFPC) of 1.530. Crucially, the mathematical decomposition of this index resolves a fundamental operational ambiguity: the exponential growth of these ecosystems is not primarily driven by localized market management or marketing optimization (Efficiency Change average = 1.045), but rather by overarching systemic technological innovations (Technical Change average = 1.486). The ubiquitous positive frontier shifts across all observed markets validate that centralized investments in alternative-data credit scoring algorithms and Artificial Intelligence successfully mitigate systemic risk (minimizing NPL rates) while maximizing credit disbursement. Furthermore, the divergent catch-up trajectories, ranging from Vietnam’s stable optimization to Brazil’s explosive late-stage surge, empirically validate the “Land-and-Expand” strategy, proving that initial high marketing expenditures eventually crystallize into highly efficient, self-sustaining financial ecosystems.
5.2. Managerial Implications
The empirical findings of this study offer direct, actionable operational strategies for ecosystem orchestrators, specifically tailored to the global expansion of Sea Limited and its digital financial services arm, SeaMoney (SPayLater). To transition away from generic corporate advice, we outline a localized, data-driven operational framework structured around two core strategic pillars:
Shifting from generalized S & M burn to hyper-localized, closed-loop ai underwriting to sustainably optimize the production frontier, Sea Limited must aggressively shift away from generalized, high-cost Sales & Marketing (S & M) acquisition campaigns (such as blanket voucher distribution or generic digital ads). Instead, the platform should leverage its most valuable proprietary asset: Shopee’s closed-loop e-commerce transaction history.
Preemptive Credit Scoring: Rather than relying on external credit bureau APIs or waiting for users to apply for SPayLater, SeaMoney must deploy proprietary AI-driven credit scoring models that continuously mine active Shopee customer footprints. This includes analyzing real-time indicators such as product browsing categories, cart abandonment frequencies, merchant rating interactions, and cash-on-delivery (COD) return rates.
Dynamic Risk Capping: By using these non-traditional behavioral data points to preemptively underwrite unbanked and subprime demographics, SeaMoney can automatically assign hyper-personalized, dynamically adjusting credit limits. This micro-level optimization effectively caps Non-Performing Loan (NPL) rates at the point of origin, ensuring that marketing spend is channeled strictly to high-lifetime-value, low-risk users.
The Malmquist productivity decomposition highlights that sustainable fintech scaling cannot rely solely on centralized software and algorithms. Sea Limited’s executive leadership must manage a continuous, dynamic equilibrium between global technological progress (Technological Change-TC) and highly adaptive local marketing execution (Efficiency Change-EC).
Sustaining Technological Leadership (TC): At the corporate level, Sea must continue investing in its centralized, cloud-based AI infrastructure. This includes refining machine learning algorithms to automate cross-border credit decisions and integrating deeply with national instant payment systems (such as PIX in Brazil or PromptPay in Thailand) to bypass high credit card interchange fees and minimize transaction friction.
Empowering Localized Adaptation (EC): Simultaneously, country-level management teams (particularly in hyper-competitive corridors such as Vietnam and Thailand) must be empowered to customize their customer-acquisition playbooks. Rather than executing a rigid, top-down regional marketing strategy, local teams must calibrate their S & M burn rates dynamically in response to moves by localized incumbents (such as MoMo or ZaloPay). This ensures that aggressive local marketing maneuvers do not drag down the platform’s overall technical efficiency, turning necessary defensive spending into structured, high-yield customer acquisition.
5.3. Limitations and Future Research Directions
Despite the robust findings generated by the methodological framework, this study acknowledges several critical limitations. First, the nonparametric nature of the DEA-Malmquist index makes it an exploratory, descriptive tool rather than a causal inference mechanism. Therefore, the managerial and competitive frictions discussed in this study represent strong empirical associations rather than statistically proven causal relationships. Second, the analysis is constrained by a limited sample size, focusing on the six core markets of Sea Limited (n = 6). While this highly targeted selection encapsulates the operational dynamics of a specific ecosystem orchestrator, it inherently introduces potential small-sample estimation biases into the static frontier. Although we mitigated this via a 2000-iteration Bootstrap DEA procedure to statistically validate the discrimination power of the scores, the regional findings may not be entirely generalizable to non-embedded standalone fintechs. Furthermore, corporate data splitting constraints required the use of proxy allocations for specific country-level metrics. Future research should attempt to secure micro-level datasets incorporating multiple digital ecosystems and employ econometric panel regressions alongside DEA to formally test causal relationships between algorithmic marketing burn and credit defaults.
Author Contributions
Conceptualization, N.T.M.V. and T.V.T.N.; methodology, N.T.M.V.; software, N.T.M.V.; validation, N.T.M.V. and T.V.T.N.; formal analysis, N.T.M.V.; investigation, N.T.M.V. and T.V.T.N.; resources, T.V.T.N.; data curation, N.T.M.V.; writing—original draft preparation, N.T.M.V.; writing—review and editing, N.T.M.V. and T.V.T.N.; visualization, N.T.M.V.; supervision, T.V.T.N.; project administration, T.V.T.N. All authors have read and agreed to the published version of the manuscript.
Funding
This research received no external funding.
Institutional Review Board Statement
Not applicable.
Informed Consent Statement
Not applicable.
Data Availability Statement
Publicly available datasets were analyzed in this study. This data can be found here: Sea Limited’s Investor Relations portal (https://www.sea.com/investor/home (accessed on 22 July 2026)) and the U.S. Securities and Exchange Commission (SEC) EDGAR database (Form 20-F and 6-K filings for the period 2023–2026). Furthermore, the processed data and the Pearson correlation matrix used for the DEA computations are contained within the article.
Conflicts of Interest
The authors declare no conflicts of interest.
References
- Hensen, J.; Kötting, B. From open banking to embedded finance: The essential factors for a successful digital transformation. J. Digit. Bank. 2022, 6, 308–318. [Google Scholar] [CrossRef] [Scilit]
- Ozili, P.K. Embedded finance: Assessing the benefits, use case, challenges and interest over time. J. Internet Digit. Econ. 2022, 2, 108–123. [Google Scholar] [CrossRef] [Scilit]
- Ozili, P.K. Role of embedded finance in increasing financial inclusion. In Adoption and Use of Technology Tools and Services by Economically Disadvantaged Communities: Implications for Growth and Sustainability; IGI Global: Hershey, PA, USA, 2024; pp. 257–274. [Google Scholar]
- Galib, M.; Rijal, S. Exploring embedded finance in digital marketing impact on marketing strategy, user experience and customer loyalty. J. Adm. Bisnis 2025, 14, 27–38. [Google Scholar] [CrossRef] [Scilit]
- Al-Gasaymeh, A.S.; Almahadin, H.A.; Shehadeh, M.; Migdady, H.; Atta, A.A.B. Investigating the role of artificial intelligence in embedded finance on improving a nonfinancial customer experience. In 2023 International Conference on Business Analytics for Technology and Security (ICBATS); IEEE: New York, NY, USA, 2023; pp. 1–6. [Google Scholar]
- Kopperapu, R. Embedded finance: How non-financial companies are shaping the future of financial services. J. Sci. Technol. 2025, 10, 23–38. [Google Scholar] [CrossRef] [Scilit]
- Kadam, M.A.; Jangid, A.; Singh, N. Embedded Finance: Scope, Challenges and Opportunities. BVIMSR’s J. Manag. Res. 2024, 16, 79–84. [Google Scholar]
- Paradi, J.C.; Schaffnit, C. Commercial branch performance evaluation and results communication in a Canadian bank—A DEA application. Eur. J. Oper. Res. 2004, 156, 719–735. [Google Scholar] [CrossRef] [Scilit]
- Li, Y. DEA efficiency measurement with undesirable outputs: An application to Taiwan’s commercial banks. Int. J. Serv. Technol. Manag. 2005, 6, 544–555. [Google Scholar] [CrossRef] [Scilit]
- Liang, C.-J.; Yao, M.-L.; Hwang, D.-Y.; Wu, W.-H. The impact of non-performing loans on bank’s operating efficiency for Taiwan banking industry. Rev. Pac. Basin Financ. Mark. Polic. 2008, 11, 287–304. [Google Scholar] [CrossRef] [Scilit]
- Toloo, M.; Kresta, A. Finding the best asset financing alternative: A DEA–WEO approach. Measurement 2014, 55, 288–294. [Google Scholar] [CrossRef] [Scilit]
- Mohapatra, S.; Jena, S.K.; Mitra, A.; Tiwari, A.K. Intellectual capital and firm performance: Evidence from Indian banking sector. Appl. Econ. 2019, 51, 6054–6067. [Google Scholar] [CrossRef] [Scilit]
- Xu, G.; Zhou, Z. Assessing the efficiency of financial supply chain for Chinese commercial banks: A two-stage AR-DEA model. Ind. Manag. Data Syst. 2021, 121, 894–920. [Google Scholar] [CrossRef] [Scilit]
- Sklavos, G.; Zournatzidou, G.; Ragazou, K.; Sariannidis, N. Green accounting and ESG-driven eco-efficiency in European financial institutions: A two-stage DEA–CRITIC-TOPSIS evaluation. PLoS ONE 2025, 20, e0334882. [Google Scholar] [CrossRef] [Scilit] [PubMed]
- Golany, B.; Roll, Y. An application procedure for DEA. Omega 1989, 17, 237–250. [Google Scholar] [CrossRef] [Scilit]
- Caves, D.W.; Christensen, L.R.; Diewert, W.E. The economic theory of index numbers and the measurement of input, output, and productivity. Econom. J. Econom. Soc. 1982, 1393–1414. [Google Scholar] [CrossRef] [Scilit]
- Färe, R.; Grosskopf, S.; Lindgren, B.; Roos, P. Productivity changes in Swedish pharamacies 1980–1989: A non-parametric Malmquist approach. J. Product. Anal. 1992, 3, 85–101. [Google Scholar] [CrossRef] [Scilit]
- Limited, S. Form 20-F (Annual Reports) and Form 6-K (Quarterly Earnings). Available online: https://www.sea.com/investor/home (accessed on 29 May 2026).
- Google; Temasek; Bain & Company. e-Conomy SEA Report. Available online: https://economysea.withgoogle.com (accessed on 29 May 2026).
- A’yun, I.Q.; Anggraini, L.; Asmara, G.D.; Khoirunnisa, R.M. Analysis of the Development of E-Commerce Transactions in the 6 Highest Transaction Countries in Southeast Asia. J. Econ. Res. Soc. Sci. 2024, 8, 207–221. [Google Scholar] [CrossRef] [Scilit]
- Works, M. E-Commerce in Southeast Asia Intelligence Report. Available online: https://momentum.asia/insights/detail/ecommerce-in-southeast-asia-2026 (accessed on 29 May 2026).
- Hang, N.M. Current situation and solutions to enforce laws on credit rating of commercial banks in Vietnam. OEIL Res. J. 2026, 24, 31–44. [Google Scholar]
- State Bank of Vietnam. Macroeconomic and Consumer Credit Default Data. 2026. Available online: https://www.sbv.gov.vn/ (accessed on 29 May 2026).
- Bank of Thailand. Macroeconomic and Consumer Credit Default Data. Available online: https://www.bot.or.th/ (accessed on 29 May 2026).
- Financial Services Authority of Indonesia. Macroeconomic and Consumer Credit Default Data. Available online: https://ojk.go.id/ (accessed on 29 May 2026).
- Bangko Sentral ng Pilipinas. Macroeconomic and Consumer Credit Default Data. Available online: https://www.bsp.gov.ph/ (accessed on 29 May 2026).
- Bank Negara Malaysia. Macroeconomic and Consumer Credit Default Data. Available online: https://www.bnm.gov.my/ (accessed on 29 May 2026).
- Central Bank of Brazil. Macroeconomic and Consumer Credit Default Data. Available online: https://www.bcb.gov.br/en (accessed on 29 May 2026).
- Simar, L.; Wilson, P.W. Sensitivity analysis of efficiency scores: How to bootstrap in nonparametric frontier models. Manag. Sci. 1998, 44, 49–61. [Google Scholar] [CrossRef] [Scilit]
- Simar, L.; Wilson, P.W. Statistical inference in nonparametric frontier models: The state of the art. J. Product. Anal. 2000, 13, 49–78. [Google Scholar] [CrossRef] [Scilit]

Disclaimer/Publisher’s Note: The statements, opinions and data contained in all publications are solely those of the individual author(s) and contributor(s) and not of MDPI and/or the editor(s). MDPI and/or the editor(s) disclaim responsibility for any injury to people or property resulting from any ideas, methods, instructions or products referred to in the content. |
© 2026 by the authors. Licensee MDPI, Basel, Switzerland. This article is an open access article distributed under the terms and conditions of the Creative Commons Attribution (CC BY) license.