


Abstract
To address the challenge of complex quality control in shared manufacturing arising from loose “partner” relationships, a quality disclosure mechanism is incorporated into a shared manufacturing supply chain. By developing a platform-led game-theoretic model, it compares four quality disclosure strategies under third-party and self-built shared manufacturing platforms, filling a theoretical gap on how quality disclosure aligns with different platform models. The findings indicate that: (1) Quality disclosure always increases platform profit, providing theoretical support for the economic incentives for platforms to promote quality transparency. (2) Under third-party shared manufacturing platforms, all manufacturers prefer unilateral disclosure by the high-quality manufacturer, indicating that this platform model naturally generates a high-quality-led signaling mechanism and reduces coordination costs. (3) Under self-built shared manufacturing platforms, strategy choice is conditional: when the disclosure level is very high, the high-quality manufacturer counter-intuitively induces the low-quality manufacturer to disclose in order to avoid excessive guarantee risk; when the market quality gap is large, bilateral disclosure is the equilibrium, jointly building market trust; when the quality gap narrows, the equilibrium returns to unilateral disclosure by the high-quality manufacturer to strengthen the quality signal.This study provides a new theoretical framework for understanding quality signaling in multi-actor collaborative settings and offers managerial insights for shared manufacturing platforms to design disclosure mechanisms and for manufacturers to choose cooperation modes.
1. Introduction
Shared manufacturing enables flexible capacity allocation through a distinctive “partnership” structure, but this loosely coupled collaboration makes quality control more complex than in traditional manufacturing. In traditional production, processes are typically managed centrally within a single firm, so the quality management system is relatively clear and stable, and quality standards and accountability across production stages are comparatively well defined. By contrast, the difficulty of quality control in shared manufacturing is directly related to its dominant platform-based organizational form, and the most representative models in practice can be classified into third-party shared manufacturing platforms (TPSMPs) and self-built shared manufacturing platforms (SBSMPs). Specifically, the TPSMP model is typically operated by a third-party platform that uses internet technologies to match supply and demand for manufacturing resources, thereby activating idle resources and enhancing their utilization [1,2]. For example, Taogongchang and MFG.com are typical examples of this model. In contrast, SBSMPs are usually established by leading firms in an industry; leveraging advanced production equipment and strong process capabilities, these firms demonstrate substantial capacity for resource integration and platform operations [3,4]. For example, Haichuanghui, the Jiejiang Sheet Metal shared manufacturing platform, and the Tangshan Baichuan Robot shared manufacturing factory are typical cases of SBSMPs. Across both platform types, distributed collaboration among partners involves multiple relatively independent stakeholders. Although these stakeholders collaborate to share resources and coordinate capacity, incomplete alignment of objectives and differences in quality control standards increase the likelihood of quality gaps during production. For example, partners may differ in how they trade off cost and quality; some may neglect quality requirements in pursuit of short-term cost reductions, thereby adversely affecting overall product quality. Therefore, how effectively to improve product quality remains an urgent unresolved issue and is critical to the sustainable development of shared manufacturing.
As a composite mechanism of signaling and institutional governance, quality disclosure, on the one hand, increases information transparency, strengthens external oversight, and facilitates supply chain coordination, thereby directly addressing the “lemons market” problem in shared settings [5]; on the other hand, to earn the trust of consumers, manufacturers present multidimensional quality information—such as patent certificates, CAMT/CE certifications, factory inspection reports, and ISO system qualifications—thereby enhancing consumers’ confidence in product quality and ultimately translating it into order growth and relationship lock-in. However, the intensity of quality disclosure depends on the magnitude of costs borne by manufacturers, such as patent application fees, third-party testing fees, and certification maintenance fees; therefore, manufacturers must weigh benefits against costs. Prior studies show that higher levels of quality disclosure not only affect firms’ market competition and strategic decisions but also motivate firms continuously to improve product quality. Improving the level of quality disclosure helps achieve channel fairness between manufacturers and retailers, thereby attaining Pareto optimality, increasing profits, and improving overall market efficiency [6,7,8].
Quality disclosure plays a critical role in improving product quality within shared manufacturing. Nonetheless, there is ongoing academic debate regarding the necessity of quality information disclosure and the identification of the appropriate disclosing entity. Regarding the decision to disclose, some studies suggest that entities within the supply chain may engage in selective quality disclosure. Grossman et al. [9] demonstrated that in the absence of disclosure costs, entities are likely to voluntarily disclose all private information. Conversely, when disclosure incurs costs, the scenario becomes more nuanced. Research indicates that firms are less inclined to disclose quality information when product quality is low [10]. Additionally, manufacturers may choose to conceal both low and high-quality information, opting instead to disclose mid-range quality data to maximize profits [11]. Furthermore, if firms can observe their competitors’ quality information, they are less likely to disclose their own quality metrics [12]. There is also debate regarding the appropriate subject of quality disclosure. Studies have identified that the responsibility for quality disclosure can lie with either the manufacturing enterprise (supplier) or the retailer [13,14]. In dual-channel supply chains, the decision of which entity—manufacturer or platform—should disclose quality information is influenced by a multitude of factors [15]. However, existing research predominantly focuses on quality disclosure at the consumer end, overlooking the unique challenges arising from decentralized capacity and multi-stakeholder dynamics in shared manufacturing environments. Particularly absent is systematic analysis of cost-sharing mechanisms among different stakeholders. Additionally, no studies have explicitly addressed who should bear quality disclosure costs to achieve profit maximization in shared manufacturing supply chains. Accordingly, this paper addresses the following questions:
- (1)
- Under what conditions are members of a shared-manufacturing supply chain willing to disclose quality?
- (2)
- Under different shared-manufacturing modes, who is the disclosing party?
- (3)
- Under a given quality disclosure strategy, how do manufacturers choose a shared-manufacturing mode?
To address these issues, we develop a platform-led game-theoretic model that incorporates quality disclosure in competitive shared manufacturing. Our analysis focuses on quality control challenges posed by loose supply chain relationships. We consider a shared manufacturing supply chain consisting of two manufacturers: one producing high-quality products (hereafter referred to as the high-quality manufacturer) and the other producing low-quality products (hereafter referred to as the low-quality manufacturer). Following Zhao et al. [14] and Zhao et al. [16], we define “quality” as consumers’ perceived value of the product. When purchasing products, consumers’ willingness to pay varies with product quality. We investigate four quality disclosure scenarios: (1) no quality disclosure; (2) the platform discloses both manufacturers’ product quality; (3) unilateral disclosure by the high-quality manufacturer; and (4) unilateral disclosure by the low-quality manufacturer. The contributions of this study are mainly reflected in the following aspects: First, we focus on supply chain members’ preferences for quality disclosure strategies in shared manufacturing. Although some studies have examined quality disclosure under third-party shared manufacturing, they mainly establish the necessity of quality disclosure and do not investigate the choice of specific disclosure strategies. As a result, they cannot effectively address the “lemons market” effect caused by inappropriate disclosure strategies, which is a key barrier to the development of shared manufacturing. Second, we move beyond the traditional assumption that treats consumer cognitive limitations as an exogenous inhibiting factor [14,17] by endogenizing quality disclosure as an incremental signal within the consumer utility function. Consumers not only evaluate quality based on the disclosed content but also perceive the firm’s willingness to disclose information as a credible commitment to reducing opportunistic risks. Furthermore, departing from the simplified treatment of disclosure costs in existing literature [14,18], we construct a certification cost function that strictly corresponds to the level of disclosure. Additionally, from a multi-agent perspective, we reveal how the gap between the level of quality disclosure and the actual product quality in the market influences supply chain members’ preferences regarding disclosure strategies, offering a novel perspective for understanding how these members weigh their disclosure options. Finally, by incorporating third-party shared manufacturing and self-built shared manufacturing into a unified analytical framework, this study reveals the fundamental differences in their incentive mechanisms. Under the third-party platform model, the platform functions as an independent intermediary, deriving its profit from manufacturer commissions. This profit structure motivates it to expand total market demand; however, its choice of disclosure strategy is contingent upon the disclosure level. In contrast, manufacturers exhibit a highly consistent preference for unilateral disclosure by the high-quality manufacturer. This is because such disclosure enables the high-quality manufacturer to enhance its pricing power and sales volume, while the low-quality manufacturer avoids disclosure costs and benefits from demand spillovers. Under the self-built platform model, the platform operator simultaneously assumes the role of a manufacturer, with its profit comprising both its own product sales revenue and the commissions charged to its competitor. This dual role forces the manufacturer operating the self-built platform to dynamically balance strengthening its own competitive advantage against promoting its competitor’s sales. Consequently, its optimal strategy shifts among bilateral disclosure, unilateral disclosure, and the transfer of disclosure responsibility, depending on the quality gap and the disclosure level, thereby exhibiting pronounced context dependence. By elucidating these incentive differentials, this study provides a theoretical basis for manufacturers to select appropriate shared manufacturing models based on their quality levels and market conditions, and also offers decision-making references for platforms to design differentiated disclosure mechanisms.
We organize the remainder of the paper as follows. In Section 2, we provide a comprehensive literature review. In Section 3, we present a detailed problem description. Section 4 and Section 5 respectively examine the quality disclosure strategies under third-party shared manufacturing platforms and self-built shared manufacturing platforms. In Section 6, we propose the optimal choice of manufacturers’ sharing models. Finally, in Section 7, we summarize the conclusions, discuss the limitations of our study, and outline directions for future research.
2. Literature Review
This section reviews the relevant literature related to this study, including the shared manufacturing, quality disclosure of traditional supply chain and the quality disclosure of sharing economy.
2.1. Shared Manufacturing
The field of shared manufacturing has attracted significant attention from the academic community. Early research primarily focused on foundational aspects such as conceptual frameworks [19], key enabling technologies [20], and operational modes [21]. These initial studies laid a robust foundation for subsequent investigations, establishing the essential building blocks for understanding shared manufacturing systems. With the continuous development of the shared manufacturing field, research perspectives have broadened, with a growing emphasis on the operational dynamics of shared manufacturing platforms. Contemporary studies increasingly focus on critical issues such as pricing strategies, resource matching mechanisms, coordination management, and supervisory systems. In the realm of cloud manufacturing, numerous scholars have explored the optimization of resource allocation and pricing strategies to bolster manufacturing efficiency [22,23]. Notably, Pan et al. [24] addressed pricing challenges within emerging market structures, providing theoretical insights that inform the economic operations of cloud manufacturing platforms. In the specific context of capacity sharing platforms, Zhao et al. [25] employed game theory models to conduct an in-depth analysis of pivotal decision-making factors, including quality commitment, order quantity, security deposits, unit penalties, and transaction rates. Their work offers a scientific basis for strategic decisions within capacity sharing frameworks. Further advancing the field, Zhang et al. [26] integrated prospect theory and mental accounting into a multi-agent evolutionary game framework. This approach enabled the construction of a co-evolutionary game model that examines the impact of reward and punishment strategies on quality decision-making. Their analysis elucidates the collaborative enhancement of manufacturing quality and the dynamic evolution of participants under a dynamic reward and punishment mechanism. Li et al. [27] examine a multi–value-chain system comprising manufacturers, suppliers, and a third-party manufacturing e-commerce platform. Using a system dynamics model, they investigate the dynamic effects of the platform’s value-added service level, pricing strategy, and cross-network effects on platform profitability and user participation, thereby providing support for platform operating strategies in shared manufacturing settings.
While existing research on shared manufacturing has extensively explored pricing strategies, resource matching mechanisms, coordination management, and regulatory systems, these studies primarily focus on single-platform configurations and fail to integrate common third-party and self-established shared manufacturing modes into a unified analytical framework. To address this limitation, this study constructs a comprehensive analytical framework encompassing diverse shared manufacturing models, systematically examining the heterogeneous characteristics of supply chain members’ payoff structures across modes and their influence mechanisms on decision-making behaviors. This approach provides novel theoretical insights into the inherent operational logic of shared manufacturing paradigms.
2.2. Quality Disclosure of Traditional Supply Chain
Quality disclosure has been extensively examined in the academic literature, with primary attention devoted to consumer behavior, brand strategies, and practical implications observed in specific industries and firms. Grossman [28] and Milgrom [29] first addressed the quality information disclosure problem and put forward the full-disclosure proposition that a supplier chooses to reveal all quality information so long as the disclosure is costless. Establishing a foundation for subsequent research. As the field has evolved, the focus of research on corporate quality information disclosure strategies has diversified. Research on influencing factors has concentrated on market competition structures [6,30], consumer behavior and psychology [18,31]. Guan et al. [32] have explored the mechanisms through which consumer behavior patterns and psychological cognition impact corporate quality information disclosure strategies.Hong et al. [33] investigated how technological capabilities influence firms’ decisions to disclose quality information.
In terms of research methodologies and situational analyses, Zhao et al. [14] utilized game theory to explore collaborative strategies for quality disclosure and pricing among small and micro enterprises operating in highly competitive markets. Tan et al. [34] expanded the research boundaries by analyzing optimal quality information disclosure strategies for sellers under monopoly and duopoly market structures, considering both homogeneous and heterogeneous consumer preferences. Additionally, Dou et al. [35] and Yu et al. [36] examined quality disclosure strategies within supply chains selling second-hand products and food supply chains, respectively. Their studies revealed that factors such as supply chain structure, product quality, demand information asymmetry, and consumer channel acceptance significantly influence quality disclosure and channel strategy selection among supply chain members. Furthermore, research on supply chain relationships emphasizes the necessity for manufacturers to integrate information acquisition and quality disclosure into their overall decision-making frameworks. This integration necessitates attention to the effects of interaction and information sharing among supply chain members on strategic formulation, thereby enhancing retailers’ quality inference capabilities and overall profitability. The costs associated with information disclosure and channel intrusion must be thoroughly considered, as highlighted by Guan et al. [37] and Huang et al. [17,38]. Zhang et al. [39] study competing suppliers on a third-party e-commerce platform and examine how blockchain cost and information reliability affect the interaction between suppliers’ quality information disclosure and blockchain adoption. Tong et al. [40] focus on platform private brands and analyze the nonlinear effects of brand spillover, disclosure cost, and procurement strategy on the disclosure-threshold decision for private-brand quality.
Despite the extensive and multifaceted research on quality disclosure—from optimal disclosure strategies and consumer behavior factors to industry-specific practices—the majority of existing studies concentrate on traditional supply chains. There remains a paucity of in-depth and systematic analyses addressing quality information disclosure within competitive market environments specific to shared manufacturing platforms.
2.3. The Quality Disclosure of Sharing Economy
With the vigorous development of the sharing economy, quality disclosure within sharing supply chains has garnered substantial attention from the academic community. Scholars have conducted in-depth analyses of quality disclosure in shared supply chains from various perspectives. Wu et al. [41] examined the influence mechanism of online platforms’ involvement in traditional retail markets on supply chain quality information disclosure strategies. Their study found that, to leverage competitive advantages, manufacturers are more inclined to disclose quality information, thereby enhancing their market competitiveness and generating positive spillover effects that increase the transparency of the entire supply chain. Xu et al. [42] developed an analytical model to investigate the impact of retail platforms’ voluntary disclosure of product quality information on pricing strategies and consumer deliberation behavior in the context of blockchain-enabled product sales. Their model elucidates the internal relationships between quality disclosure strategies, market pricing, and consumer behavior, providing valuable insights into the decision-making processes of firms utilizing blockchain technology for product distribution. Using game theory, Liu et al. [43] constructed a duopoly model to analyze how manufacturers make quality disclosure decisions across different sales channels, such as online retailers or direct blockchain-based sales, within a highly competitive market environment. This study offers a crucial theoretical foundation for understanding manufacturers’ quality disclosure decisions in complex competitive settings. Huang et al. [15] examine quality disclosure strategies of an online multifunction platform and a manufacturer in a dual-channel supply chain (in the M-C/P-C setting), analyzing how multiple factors affect disclosure incentives and the robustness of the results, and offering supply-chain-based theoretical and variable-analysis references for research on “quality disclosure on sharing platforms.
However, previous studies have predominantly focused on quality disclosure within the sales domain. This paper shifts the focus to the manufacturing sector, positioning quality disclosure as the core of shared manufacturing research. By comparing and analyzing quality disclosure strategies under two typical shared manufacturing modes, this study provides decision support for participants in shared manufacturing supply chains, facilitating the optimization of mode selection and quality disclosure strategies, and ultimately enhancing the overall operational efficiency and profitability of the supply chain.
3. Symbols and Problem Description
3.1. Symbols
The symbols and their meanings involved in this article are shown in Table 1.
Table 1.
Symbols and Their Explanations.
3.2. Problem Description
To make investigation on the issue of quality disclosure under different shared manufacturing models, we will make the assumption of existence of two manufacturers that will produce similar products under different brands, with the two products serving as substitutes for one another, possessing a substitution coefficient of 1. Manufacturer 1 produces a high-quality product (Product 1), with consumers perceiving the quality of this product as , where . Manufacturer 2 produces a product of lower quality than Manufacturer 1 (Product 2), characterized by a quality level of , satisfying . Moreover, the magnitude of v reflects not only the quality level of Manufacturer 2’s product but also the dispersion in product quality across the market. A smaller v indicates a larger quality gap in the market, whereas a larger v indicates a smaller quality gap.For example, in the food industry, consumers perceive organic milk as delivering higher value than conventional milk. s is defined as quality disclosure.Furthermore, firms demonstrating proactive quality transparency signal uncompromising product safety to consumers, as evidenced by behavioral research in food industries where purchase intentions for uncertified (“three-no”) products remain significantly lower compared to information-comprehensive alternatives [44,45]. This transparency mechanism increases consumer utility gains by reducing perceived transaction risks. In the practice of shared manufacturing platforms, disclosed information typically requires platform review or third-party certification. In the manufacturing industry, in addition to costs incurred for applying for patent certificates and third-party institutional certifications, firms also provide samples or free trials to consumers or capacity-demanding partners [45,46], thereby ensuring the credibility of the information. Therefore, the cost of quality disclosure is denoted as . This paper describes the demand function based on willingness to pay, and with reference to the utility functions proposed by Zhao et al. [16] and Feng et al. [47], we construct the consumer utility function as follows:
Consumers purchase products based on utility maximization, and do not make purchases when . The utility derived from purchasing a product from Manufacturer 1 is denoted as , while the utility from purchasing a product from Manufacturer 2 is denoted as .
Following the methodologies of Board [6] and Feng et al. [47], we calculate the demand functions for the two manufacturers. Taking the (Y, Y) strategy as an example, we describe the demand function based on willingness to pay, with the condition .
When , consumers are indifferent in purchasing products from Manufacturer 1 or Manufacturer 2, represented as:
When , consumers are indifferent between purchasing a product from Manufacturer 2 or choosing not to purchase at all, represented as:
The demand functions for the two manufacturers are given by . The derivation of the demand functions under the other three strategies follows a similar approach.
To better describe and establish the model, this paper makes the following assumptions:
Assumption 1.
In shared manufacturing platforms, quality information access incurs no acquisition costs for consumers or capacity demanders [45,46].
Assumption 2.
Without loss of generality, we assume that the unit production costs of both Manufacturers are normalized to zero [14].
Assumption 3.
The mass of consumers in each market is normalized to one [48].
Assumption 4.
In the third-party shared manufacturing platform model, the platform determines the commission λ [49] in the first stage; in the second stage of the game, Manufacturers set the product prices ;
Assumption 5.
In the self-built shared manufacturing platform model, the first stage of the game is where the Manufacturer owning the platform decides on the commission fee λ and the product price ; in the second stage, competing Manufacturers set the product price ;
Assumption 6.
The willingness to pay of consumers under different strategies is as follows: for the (N, N) strategy, it is ; for the (Y, Y) strategy, it is ; for the (Y, N) strategy, it is ; and for the (N, Y) strategy, it is (this assumption is confirmed by the equilibrium results presented below).
Assumption 7.
Quality disclosure costs increase with marginal increasing costs in relation to disclosure levels. Consequently, quality disclosure costs are modeled as [50,51].
4. Quality Disclosure in the TPSMPs Model
In the third-party shared manufacturing platform model, consider a two-level supply chain system composed of two manufacturers and the third-party shared manufacturing platform. In this model, the third-party shared manufacturing platform plays the role of an intermediary, integrating and matching scattered supply and demand resources, and maintaining its normal operation and development by charging a certain commission to the manufacturer. The manufacturer produces the product and flows the product into the market through the third-party shared manufacturing platform. Figure 1 shows the relationship diagram in the third-party shared manufacturing platform mode.
Figure 1.
The relationship diagram under the TPSMPs model.
In order to explore the conditions under which members of the shared manufacturing supply chain are willing to disclose product quality information and determine the responsible subject of quality disclosure, this section makes comparison and analysis on the utility function and demand function under the four strategies under the framework of the third-party shared manufacturing platform model (i.e., No quality disclosure (N, N), the third-party shared-manufacturing platform implements bilateral quality disclosure (Y, Y) Manufacturer 1 unilateral quality disclosure (Y, N), Manufacturer 2 unilateral quality disclosure (N, Y)). See Table 2.
Table 2.
Function under four strategies.
4.1. No Quality Disclosure (N, N) Strategy in TPSMPs Mode
Under strategy (N, N), neither the third-party shared manufacturing platform nor the two manufacturers disclose quality information. The profit functions of the third-party shared manufacturing platform and the manufacturers are given as follows:
The profit functions of the third-party manufacturing platform:
The profit functions of Manufacturer 1:
The profit functions of Manufacturer 2:
The decision sequence is as follows: First, the third-party shared manufacturing platform determines the commission fee. Second, Manufacturers 1 and Manufacturers 2 simultaneously choose their prices. Based on Table 2, we use backward induction to derive the equilibrium outcomes. The optimal equilibrium solution includes the commission fee, the selling prices of Manufacturers 1 and Manufacturers 2, and the profits of the third-party platform, Manufacturer 1, and Manufacturer 2. For clarity, the equilibrium outcomes associated with strategy (N, N) are reported in Table 3.
Table 3.
Equilibrium Solution under the (N, N) Strategy in TPSMPs Mode.
Proof. See Appendix A.1.
4.2. Bilateral Quality Disclosure (Y, Y) Strategy in TPSMPs Mode
When a third-party shared manufacturing platform makes quality disclosure, the third-party shared manufacturing platform will publish the quality of the products of both manufacturers and bear the corresponding cost. The profit functions of the third-party shared manufacturing platform and the manufacturers are given as follows:
The profit functions of the third-party manufacturing platform:
The profit functions of Manufacturer 1:
The profit functions of Manufacturer 2:
The decision sequence is as follows: First, the third-party shared manufacturing platform determines the commission fee. Second, Manufacturers 1 and Manufacturers 2 simultaneously choose their prices. Based on Table 2, we use backward induction to derive the equilibrium outcomes. The optimal equilibrium solution includes the commission fee, the selling prices of Manufacturers 1 and Manufacturers 2, and the profits of the third-party platform, Manufacturer 1, and Manufacturer 2. For clarity, the equilibrium outcomes associated with strategy (Y, Y) are reported in Table 4.
Table 4.
Equilibrium Solution under the (Y, Y) Strategy in TPSMPs Mode.
Proposition 1.
Compared with the (N, N) strategy, the (Y, Y) strategy has the following conditions:
- 1.
- Under the (Y, Y) strategy, both the third-party shared manufacturing platform and Manufacturer 1 achieve higher profits compared to the (N, N) strategy (i.e., ).
- 2.
- Under the (Y, Y) strategy, Manufacturer 2’s profit exceeds that under the (N, N) strategy when (i.e., ). In all other instances, Manufacturer 2’s profit under the (Y, Y) strategy surpasses that under the (N, N) strategy (i.e., ).
Proof. See Appendix A.2.
Notably, quality disclosure increases market demand by reducing information asymmetry about quality, which in turn stimulates consumers’ willingness to purchase. Compared with the (N, N) strategy, under the (Y, Y) strategy, Manufacturer 1 and the third-party shared manufacturing platform earn higher profits due to demand expansion. As the level of quality disclosure increases, consumers perceive product advantages more clearly and are willing to pay higher prices, which further increases the profits of manufacturers and the third-party shared manufacturing platform.
For Manufacturer 2, when the third-party shared manufacturing platform’s quality disclosure level is extremely low (i.e., ), the (N, N) strategy generates higher profitability than the (Y, Y) strategy, as illustrated by the white region in Figure 2. At such low disclosure levels, price reductions and demand declines lead to significantly lower profits under the (Y, Y) strategy compared to the (N, N) strategy. Conversely, in all other cases, the (Y, Y) strategy yields superior profitability, represented by the gray region in Figure 2. Effective quality disclosure under the (Y, Y) strategy enhances Manufacturer 2’s product pricing and market demand, thereby improving profits relative to non-disclosure scenarios.
Figure 2.
Manufacturer 2 (Y, Y) strategy vs. (N, N) strategy.
4.3. Quality Disclosure by High-Quality Manufacturers (Y, N) Strategy in TPSMPs Mode
In the (Y, N) strategy, Manufacturer 1 adopts a quality disclosure approach by exclusively revealing the quality information of its own product and bearing the associated disclosure costs. The profit functions of the third-party shared manufacturing platform and the manufacturers are given as follows:
The profit functions of the third-party manufacturing platform:
The profit functions of Manufacturer 1:
The profit functions of Manufacturer 2:
The decision sequence is as follows: First, the third-party shared manufacturing platform determines the commission fee. Second, Manufacturers 1 and Manufacturers 2 simultaneously choose their prices. Based on Table 2, we use backward induction to derive the equilibrium outcomes. The optimal equilibrium solution includes the commission fee, the selling prices of Manufacturers 1 and Manufacturers 2, and the profits of the third-party platform, Manufacturer 1, and Manufacturer 2. For clarity, the equilibrium outcomes associated with strategy (Y, N) are reported in Table 5.
Table 5.
Equilibrium Solution under the (Y, N) Strategy in TPSMPs Mode.
Proposition 2.
Compared with the (N, N) strategy, the (Y, N) strategy has the following conditions:
The profit of the third-party shared manufacturing platform under the (Y, N) strategy and the profit of the two manufacturers are higher than the profit under the (N, N) strategy (i.e., ).
Proof. See Appendix A.3.
Under the (Y, N) strategy, the third-party shared-manufacturing platform and both manufacturers earn higher profits than under (N, N). The key mechanism is that quality disclosure in (Y, N) creates a competitive advantage for the high-quality manufacturer. Compared with the (N, N) strategy, the (Y, N) strategy leads to higher prices and quantities, thereby improving the profits of all supply chain members.
4.4. Quality Disclosure by Low-Quality Manufacturers (N, Y)Strategy in TPSMPs Mode
In the (N, Y) strategy, Manufacturer 2 adopts a quality disclosure approach, exclusively revealing the quality information of its own product and bearing the associated disclosure costs. The profit functions of the third-party shared manufacturing platform and the manufacturers are given as follows:
The profit functions of the third-party manufacturing platform:
The profit functions of Manufacturer 1:
The profit functions of Manufacturer 2:
The decision sequence is as follows: First, the third-party shared manufacturing platform determines the commission fee. Second, Manufacturers 1 and Manufacturers 2 simultaneously choose their prices. Based on Table 2, we use backward induction to derive the equilibrium outcomes. The optimal equilibrium solution includes the commission fee, the selling prices of Manufacturers 1 and Manufacturers 2, and the profits of the third-party platform, Manufacturer 1, and Manufacturer 2. For clarity, the equilibrium outcomes associated with strategy (N, Y) are reported in Table 6.
Table 6.
Equilibrium Solution under the (N, Y) Strategy in TPSMPs Mode.
Proposition 3.
Compared with the (N, N) strategy, the (N, Y) strategy has the following conditions:
- (1)
- The profit of the third-party shared manufacturing platform under the (N, Y) strategy is higher than that under the (N, N) strategy (i.e., ).
- (2)
- Manufacturer 1’s profit under the (N, Y) strategy exceeds that under the (N, N) strategy only when Manufacturer 2’s product quality satisfies and the quality disclosure level satisfies (i.e., ). In all other cases, the (N, N) strategy yields better results (i.e., ).
- (3)
- Manufacturer 2’s profit under the (N, Y) strategy surpasses that of the (N, N) strategy exclusively when the quality disclosure level falls within the interval (i.e.,). In all other cases, the (N, N) strategy is more advantageous (i.e., ).
Proof. See Appendix A.4.
Under the (N, Y) strategy, the profit of the third-party shared manufacturing platform is higher than that under the (N, N) strategy. This can be attributed to the increase in commission prices driven by the improvement in quality disclosure levels, which leads to higher the third-party shared manufacturing platform profits under the (N, Y) strategy compared to the (N, N) strategy.
Manufacturer 1, considering market competition and its own interests, supports Manufacturer 2’s quality disclosure only when Manufacturer 2’s product quality satisfies and the quality disclosure level satisfies (i.e., ), as illustrated by the white area in Figure 3a where . The rationale lies in that, under the (N, Y) strategy where Manufacturer 1 does not disclose but Manufacturer 2 does, only high Manufacturer 2 quality combined with high disclosure levels leads to simultaneous increases in Manufacturer 1’s production quantity and sales volume. Conversely, when Manufacturer 2’s product quality is low, its quality disclosure undermines consumer willingness to pay, resulting in higher sales volumes and subsequent profit growth. Thereby harming Manufacturer 1’s interests. This phenomenon is more intuitively explained by the gray area in Figure 3a .
Figure 3.
Comparison chart of (N, Y) strategy and (N, N) strategy.
Manufacturer 2’s profit is higher under the (N, Y) strategy than under the (N, N) strategy only when the quality disclosure level s lies within the interval: as shown in the white region in Figure 3b, where . In this scenario, Manufacturer 2 is incentivized to disclose quality information. This is because quality disclosure allows Manufacturer 2 to establish a differentiated competitive advantage in the market, enabling it to attract price—sensitive consumers through a distinct market positioning. Consequently, Manufacturer 2 captures a larger market share and profit margin in the low—end market. In contrast, under other conditions, Manufacturer 2’s profit is lower under the (N, Y) strategy compared to the (N, N) strategy, as shown in the gray region in Figure 3b, where . In such cases, Manufacturer 2 is unwilling to disclose quality information. This reluctance arises because quality disclosure incurs costs, and the benefits gained from disclosure are insufficient to offset these costs. As a result, Manufacturer 2 struggles to achieve a competitive edge in the highly competitive market.
4.5. Comparative Analysis of Three Quality Disclosure Strategies Under the TPSMPs Model
We systematically examine and compare the profitability of the platform and two manufacturers across three strategic scenarios: (Y, Y), (Y, N), and (N, Y) within the TPSMPs framework. This comparative analysis elucidates the distinct interest structures of each stakeholder under varying strategic scenarios, thereby establishing a robust theoretical foundation for the selection of quality disclosure strategies. Our findings provide significant theoretical insights and practical guidance for supply chain management, enhancing strategic decision-making processes related to quality disclosure.
Proposition 4.
Under the third-party shared manufacturing platform model, comparing the three quality disclosure strategies (Y, Y), (Y, N), and (N, Y), the platform and manufacturers exhibit the following strategic preferences:
- (1)
- For the platform, implementing quality disclosure is always superior to non-disclosure. Its specific preference depends on the quality disclosure level. When the disclosure level reaches the threshold , the platform prefers that only Manufacturer 2 conducts disclosure, i.e., the (N, Y) strategy. In other cases, the platform prefers to implement disclosure itself, i.e., the (Y, Y) strategy.
- (2)
- For Manufacturer 1, it always prefers its own product quality to be disclosed and therefore strictly prefers unilateral self-disclosure, i.e., the (Y, N) strategy.
- (3)
- For Manufacturer 2, it is always preferable that only Manufacturer 1’s product quality is disclosed; thus, it likewise prefers the (Y, N) strategy.
Proof. See Appendix A.5.
In a competitive market environment, product quality information is a key factor affecting consumers’ purchase decisions. As shown by the gray region in Figure 4, when the quality disclosure level is , the third-party shared manufacturing platform chooses strategy (N, Y), assigning Manufacturer 2 the responsibility for quality disclosure to reduce the platform’s risk and cost. In contrast, as shown by the white region in Figure 4, when the quality disclosure level is , the third-party shared manufacturing platform chooses strategy (Y, Y), with the platform taking responsibility for quality disclosure; this strategy provides consumers with quality information for all products, strengthens consumer trust, increases purchase intention, and thereby raises market demand.
Figure 4.
Comparison of Three Strategies.
Manufacturer 1’s choice of strategy (Y, Y) to undertake full quality disclosure reflects a set of considerations. As the quality disclosure level increases, purchase intention is stimulated and demand for high-quality products rises, allowing Manufacturer 1 to raise its product price. Meanwhile, a higher quality disclosure level increases consumer utility. Manufacturer 2 chooses strategy (Y, N) because it avoids the risk of directly exposing low quality; by not disclosing quality information, it can flexibly adopt a low-price strategy to target price-sensitive consumers, thereby maintaining stable demand and positive profits.
5. Quality Disclosure in the SBSMPs Model
In the manufacturing paradigm of a self-built shared manufacturing platform, we examine a two-level supply chain composed of two manufacturers. Manufacturer 1 assumes dual responsibilities: not only does it produce its own products, but it also leverages its high-quality resources to actively promote and manage the shared manufacturing platform. Meanwhile, Manufacturer 2 dedicates its efforts to the production of Product 2, aiming to enhance its capabilities and achieve superior growth by utilizing the services offered by the shared platform. Figure 5 illustrates the relational dynamics within the self-built shared manufacturing platform model.
Figure 5.
The relationship diagram under the SBSMPs model.
In shared manufacturing supply chains, the strategic disclosure of product quality information plays a critical role in shaping the dynamics between participants. This study delves into the intricacies of these interactions by exploring the conditions under which supply chain members opt to disclose product quality information and identifying the appropriate distribution of the associated costs. In this context, we conduct a comparative analysis of the utility functions and demand functions. The analysis evaluates four distinctive strategies: No quality disclosure (N, N), SBSMPs bilateral quality disclosure (Y, Y), Manufacturer 1 quality disclosure (Y, N), Manufacturer 2 quality disclosure (N, Y). The details are provided in Table 7.
Table 7.
Function under four strategies.
5.1. No Quality Disclosure (N, N) Strategy in SBSMPs Mode
In the (N, N) strategy, neither manufacturer discloses quality information. The manufacturers’ profit functions are given as follows:
The Profit Functions of Manufacturer 1:
The Profit Functions of Manufacturer 2:
The decision sequence is as follows. First, Manufacturer 1 determines the commission and the selling price. Based on Table 7, we use backward induction to derive the equilibrium outcome. Second, Manufacturer 2 determines its selling price. The optimal equilibrium includes the commission fee, retail prices for both manufacturers, and the profits of Manufacturers 1 and Manufacturers 2. For clarity, the simplified equilibrium results for the (N, N) strategy are reported in Table 8.
Table 8.
Equilibrium Solutions under the (N, N) Strategy in SBSMPs Mode.
Proof. See Appendix B.1.
5.2. Bilateral Quality Disclosure (Y, Y) Strategy in SBSMPs Mode
In the (Y, Y) strategy, Manufacturer 1 owns a self-built shared manufacturing platform (SBSMPs), simultaneously revealing the product quality of both manufacturers and bearing the associated costs. The manufacturers’ profit functions are given as follows:
The Profit Functions of Manufacturer 1:
The Profit Functions of Manufacturer 2:
The decision sequence is as follows. First, Manufacturer 1 determines the commission and the selling price. Based on Table 7, we use backward induction to derive the equilibrium outcome. Second, Manufacturer 2 determines its selling price. The optimal equilibrium includes the commission fee, retail prices for both manufacturers, and the profits of Manufacturers 1 and Manufacturers 2. For clarity, the simplified equilibrium results for the (Y, Y) strategy are reported in Table 9.
Table 9.
Equilibrium Solutions under the (Y, Y) Strategy in SBSMPs Mode.
Proposition 5.
Compared with the (N, N) strategy, the (Y, Y) strategy has the following conditions:
The profit of the members of the shared manufacturing supply chain under the (Y, Y) strategy is higher than that under the (N, N) strategy (i.e., ).
Proof. See Appendix B.2.
Compared with the (N, N) strategy, Manufacturer 1 with a self-built shared manufacturing platform prefers the (Y, Y) strategy. This is because increasing quality disclosure levels stimulate growth in both prices and demand, thereby raising profits for all supply chain members. Meanwhile, disclosure by the self-built platform enhances consumers’ willingness to purchase its products. Therefore, the (Y, Y) strategy strengthens both market competitiveness and profits for Manufacturer 1 relative to the (N, N) strategy. Although Manufacturer 2’s product quality is lower than Manufacturer 1’s, it can demonstrate its product’s cost-effectiveness through quality disclosure without bearing the associated costs. While Manufacturer 2’s price increases with higher quality disclosure levels, this also expands market demand. Consequently, the (Y, Y) strategy generates higher profits for Manufacturer 2 than the (N, N) strategy.
5.3. Unilateral Quality Disclosure by High-Quality Manufacturers (Y, N) Strategy in SBSMPs Mode
In the (Y, N) strategy, Manufacturer 1 utilizes its self-built shared manufacturing platform to implement a unilateral quality disclosure strategy, revealing solely its own product quality while bearing the associated costs. The manufacturers’ profit functions are given as follows:
The Profit Functions of Manufacturer 1:
The Profit Functions of Manufacturer 2:
The decision sequence is as follows. First, Manufacturer 1 determines the commission and the selling price. Based on Table 7, we use backward induction to derive the equilibrium outcome. Second, Manufacturer 2 determines its selling price. The optimal equilibrium includes the commission fee, retail prices for both manufacturers, and the profits of Manufacturers 1 and Manufacturers 2. For clarity, the simplified equilibrium results for the (Y, N) strategy are reported in Table 10.
Table 10.
Equilibrium Solutions under the (Y, N) Strategy in SBSMPs Mode.
Proposition 6.
Compared with the (N, N) strategy, the (Y, N) strategy has the following conditions:
Compared to the (N, N) strategy, both manufacturers experience an increase in profits under the (Y, N) strategy (i.e., ).
Proof. See Appendix B.3.
Manufacturer 1’s profit under strategy (Y, N) is higher than that under strategy (N, N). The reason is that as the level of quality disclosure increases, consumers’ willingness to pay for high-quality products also rises, leading to higher prices and increased sales. Compared with the (N, N) strategy, the (Y, N) strategy further enhances profit growth. Under strategy (Y, N), quality information for Manufacturer 2’s product is not disclosed, leading to lower market demand. To maintain market share, Manufacturer 2 typically cuts its price to avoid intense price competition. Nevertheless, Manufacturer 1’s quality disclosure indirectly benefits Manufacturer 2, allowing it to earn a higher profit under strategy (Y, N) than under strategy (N, N).
5.4. Unilateral Quality Disclosure by Low-Quality Manufacturers (N, Y) Strategy in SBSMPs Mode
Manufacturer 2 adopts a unilateral quality disclosure strategy, disclosing only the quality information of its own product and bearing the associated cost. The manufacturers’ profit functions are given as follows:
The Profit Functions of Manufacturer 1:
The Profit Functions of Manufacturer 2:
The decision sequence is as follows. First, Manufacturer 1 determines the commission and the selling price. Based on Table 7, we use backward induction to derive the equilibrium outcome. Second, Manufacturer 2 determines its selling price. The optimal equilibrium includes the commission fee, retail prices for both manufacturers, and the profits of Manufacturers 1 and Manufacturers 2. For clarity, the simplified equilibrium results for the (N, Y) strategy are reported in Table 11.
Table 11.
Equilibrium Solutions under the (N, Y) Strategy in SBSMPs Mode.
Proposition 7.
Compared with the (N, N) strategy, the (N, Y) strategy has the following conditions:
- (1)
- The profit of Manufacturer 1 under the (N, Y) strategy is higher than that under the (N, N) strategy (i.e., ).
- (2)
- For Manufacturer 2, when its product quality satisfies , its profit under the (N, Y) strategy is lower than that under the (N, N) strategy (i.e., ). Otherwise, its profit under the (N, Y) strategy is higher than that under the (N, N) strategy (i.e., ).
Proof. See Appendix B.4.
Under the (N, Y) strategy, only the product quality of Manufacturer 2 is disclosed, while the quality of Manufacturer 1’s product remains undisclosed, inevitably affecting Manufacturer 1’s quality standing. As a result, Manufacturer 1’s demand decreases. To maintain the smooth operation of the self - built shared manufacturing platform, the commission price must inevitably rise. Under the strategy in which Manufacturer 2 discloses only its own product quality and bears the disclosure cost, Manufacturer 2 is unwilling to disclose when its product quality satisfies . While the improvement in quality disclosure enhances Manufacturer 2’s product price and demand, the increase is insufficient to offset the combined costs of commission and quality disclosure when compared to the (N, N) strategy.
5.5. Comparative Analysis of Three Quality Disclosure Strategies Under the SBSMPs Model
In order to study the attribution of responsibility for quality disclosure under SBSMPs mode, the profit of two manufacturers under three strategies (Y, Y), (Y, N) and (N, Y) under SBSMPs mode is compared and analyzed. Through this comparison, the aim is to identify the most effective quality disclosure strategy in the SBSMPs model. The research results will provide theoretical guidance and practical reference for supply chain management.
Proposition 8.
Comparative analysis of the profits of the self-built shared manufacturing platform and the two manufacturers under the (Y, Y), (Y, N), and (N, Y) strategies:
- (1)
- For Manufacturer 1, which operates a self-built shared manufacturing platform, adopting quality disclosure is better than not disclosing quality, and the specific strategy choice depends on Manufacturer 2’s product quality and its quality disclosure level: When Manufacturer 2’s product quality is low (i.e., ) and its disclosure level is below the threshold, the (Y, Y) strategy yields a higher profit; When Manufacturer 2’s product quality is high (i.e., ) and its disclosure level is below the threshold, the (Y, N) strategy is more advantageous; However, when the quality disclosure level is high , the (N, Y) strategy becomes the optimal choice.
- (2)
- For Manufacturer 2, it is unwilling to disclose only its own product quality. When Manufacturer 2’s product quality is low (i.e., ), the (Y, Y) strategy is more favorable than other strategies. Conversely, when Manufacturer 2’s product quality is high (i.e., ), the (Y, N) strategy becomes the better option.
Proof. See Appendix B.5.
When the rival’s quality is low, the gap in product quality in the market is large, and Manufacturer 1 chooses strategy (Y, Y), as shown in the light-gray area in Figure 6; the high-quality manufacturer bears the disclosure cost and discloses both parties’ quality information to highlight its advantage. When the rival’s quality is high, the market quality gap is small, and Manufacturer 1 chooses strategy (Y, N), as shown in the dark-gray area in Figure 6, to avoid intensified competition. When the cost of quality disclosure is extremely high, it strategically shifts the disclosure responsibility to the rival to avoid the cost, as shown in the white area in Figure 6.
Figure 6.
Strategy selection of Manufacturer 1.
Manufacturer 2 always avoids disclosing quality information alone when Manufacturer 1 remains silent, and it chooses to support bilateral disclosure or platform-only disclosure depending on its own quality level. Because under strategy (N, Y), consumers may question Manufacturer 1’s non-disclosure as the platform operator and may infer that its quality is higher or that Manufacturer 2’s disclosure is questionable, which suppresses demand for Manufacturer 2’s product and thereby harms its profit.
7. Conclusions
7.1. Main Findings
Shared manufacturing features a “partner” structure; this loose collaboration, during resource sharing and capacity coordination, combined with misaligned objectives and differences in quality control standards, makes quality information more opaque in production and can lead to a sharp decline in product quality. In the absence of a effective quality information transmission mechanism, the market faces an adverse selection dilemma: high-quality manufacturers fail to capture fair returns, while low-quality manufacturers may trigger a vicious cycle wherein “bad money drives out good.” Against this backdrop, quality disclosure serves as a critical breakthrough to mitigate the “lemon market” effect in shared manufacturing. However, due to the platform-led and multi-agent collaborative structure, the choice of quality disclosure strategies and their alignment with different platform models have yet to be systematically revealed. This paper addresses this gap by constructing a platform-led game model to compare two typical shared manufacturing models: third-party platforms and self-built platforms. In the third-party model, an independent platform intermediates transactions and derives revenue from commissions charged to manufacturers. In the self-built model, the manufacturer operating the platform both produces its own products and subcontracts orders to other manufacturers, while charging commissions. This study examines supply chain members’ strategic choices under four quality disclosure scenarios—no disclosure, bilateral disclosure, unilateral disclosure by the high-quality manufacturer, and unilateral disclosure by the low-quality manufacturer—as well as manufacturers’ preferences for the two shared manufacturing models. The analysis reveals that the platform’s identity determines its profit structure, which in turn shapes the decision-making logic of each member. The key findings are summarized as follows:
- (1)
- Commonalities across the two modes.
Under both third-party (TPSMPs) and self-built (SBSMPs) shared manufacturing modes, implementing quality disclosure increases the platform’s profit. This commonality indicates that quality disclosure is a fundamental governance tool for platforms to improve the trading environment, providing economic incentives and a theoretical basis for platform managers to implement information disclosure mechanisms.
- (2)
- Under the third-party platform mode, the platform’s strategy choice reflects a careful trade-off between information disclosure costs and market demand.
The high-quality manufacturer always has a strong incentive to disclose the quality of its own product unilaterally and strictly prefers the scenario in which only it discloses while the rival does not. High-quality manufacturers maintain strong incentives for unilateral quality disclosure and strictly prefer strategic contexts where they disclose while competitors remain silent. Low-quality manufacturers similarly favor scenarios where only high-quality firms disclose unilaterally and exhibit no incentive to reveal their own quality information.
- (3)
- Self-built platform mode: Quality disclosure strategies based on competitive positioning.
In platform models self-established and operated by leading manufacturers, these firms hold dual roles as both platform operators and competing manufacturers, with their disclosure strategies forming a strategic extension of competitive positioning. When competitor quality is low and market quality gaps are substantial, leaders strategically assume disclosure costs to simultaneously reveal both parties’ quality information, emphasizing their competitive advantage. Whereas when competitor quality is high and quality differentiation narrows, leaders shift to disclosing only their own quality to mitigate intensified competition. However, when disclosure costs are prohibitively high, leaders strategically transfer disclosure obligations to competitors to avoid cost escalation.
Subordinate manufacturers consistently refrain from unilateral disclosure when the leader remains silent, instead conditionally supporting either bilateral disclosure or leader-only disclosure based on their quality positioning. Specifically, when their quality is high, they favor bilateral disclosure to validate their value proposition; conversely, when their quality is low, they prefer leader-only disclosure to avoid unfavorable direct comparisons.
- (4)
- In shared manufacturing, manufacturers’ choice of platform type is not arbitrary; it is a strategic decision shaped jointly by their quality level and the information disclosure environment.
High-quality manufacturers generally prefer the self-built shared manufacturing platform mode to take control of quality disclosure, thereby turning information control into a strategic tool to reinforce their market leadership. In contrast, low-quality manufacturers’ mode choice is strategy-dependent, and their decision is closely tied to the quality disclosure strategy. When neither party discloses, they typically choose a third-party platform to avoid quality comparisons. Under the strategy in which all products in the market disclose quality, whether a low-quality manufacturer joins the self-built platform is subject to a clear threshold condition. Only when both its product quality and the quality disclosure level fall within a certain range does it tend to choose the self-built platform mode; otherwise, it switches to the third-party platform mode. When only the high-quality party discloses, it chooses the self-built platform to make the most of the market demand created by the high-quality platform owner’s disclosure. When only the low-quality manufacturer discloses, it chooses the self-built shared manufacturing platform as a quality “endorsement” when the disclosure level is low. However, at other disclosure levels, it typically chooses the third-party shared manufacturing mode to avoid commission pressure.
7.2. Potential Application
With the rapid growth of the sharing economy, supply chain members’ strategic choices in shared manufacturing have profound effects on the operational efficiency and economic performance of the entire supply chain. Our findings suggest substantial potential applications in shared manufacturing.
- (1)
- For third-party shared manufacturing platforms, recognizing quality disclosure as an effective means to boost transaction volume and profitability is essential. Platforms must strike a precise balance between disclosure costs and market demand. Specifically, they should offer tailored support to high-quality service providers who favor unilateral disclosure, while avoiding mandatory disclosure for low-quality providers but strictly enforcing compliance baselines.
- (2)
- For leading firms that operate self-built shared-manufacturing platforms, quality disclosure should be incorporated as a tool for dynamic competitive strategy. Their strategic choices should depend on the quality comparison between themselves and rivals and on the disclosure level, adopting bilateral disclosure to develop the market and using unilateral disclosure to avoid intensified competition.
- (3)
- For ordinary manufacturers participating in shared manufacturing, the platform’s quality disclosure policy should be a critical factor when selecting an entry point. Regardless of the platform type, high-quality manufacturers should consistently proactively disclose core quality information (e.g., inspection data, certification qualifications). They should prioritize scenarios where they disclose while competitors do not, leveraging unilateral disclosure to establish a moat of quality trust. Within proprietary platforms, they should flexibly adjust the disclosure scope based on quality gaps to maximize competitive advantage.
High-quality manufacturers should prioritize modes that ensure the effective transmission of their quality signals. Conversely, subordinate manufacturers with relatively lower quality should adopt a contingent strategy: when their quality is relatively high and the market gap is small, they should support bilateral disclosure to validate their value; when their quality is lower and the market gap is large, they should free-ride on the disclosure efforts of leading or high-quality manufacturers.
7.3. Limitations and Future Research
Although this study has achieved certain results in the sharing of manufacturing models and quality disclosure strategies, has obtained quality information disclosure strategies for manufacturers and platforms, there are still limitations that cannot be ignored.
In terms of the scope of shared manufacturing models, the role of the platform in capacity sharing can be further subdivided into categories such as intermediary, maker, service, and collaborative types. However, this study is confined to comparing only two models: third-party shared manufacturing platforms (TPSMPs) and self-built shared manufacturing platforms (SBSMPs). This narrow scope limits the comprehensiveness of the study’s understanding of shared manufacturing and prevents the findings from being generalized across all shared manufacturing scenarios, thus restricting the broader applicability and dissemination of the research results. Regarding the dominance structure within the research, this study primarily focuses on the platform’s perspective in exploring quality disclosure strategies. In reality, however, large manufacturers or retailers often hold dominant positions within the supply chain due to their significant market share, brand influence, and resource advantages. This study does not sufficiently consider the complex hierarchical structures and power dynamics within the supply chain, which may lead to an inaccurate analysis of the quality disclosure decision-making process. Consequently, the proposed strategies may not be directly applicable to real-world supply chain scenarios.
In addition to addressing the aforementioned limitations, future research could be expanded in several directions. Research on subsidy strategies employed by shared manufacturing platforms for manufacturers could focus on developing a scientific subsidy model and exploring optimal subsidy strategies. This model could examine how platforms can encourage manufacturers’ participation in quality disclosure. Although this study suggests that shared manufacturing platforms are inclined to promote quality disclosure within the supply chain, the extent of manufacturers’ willingness to participate remains uncertain. By investigating the relationship between the intensity and form of subsidies and manufacturers’ enthusiasm for quality disclosure, future studies could help platforms refine their quality disclosure promotion strategies, enhance disclosure effectiveness, and contribute to the healthy development of the shared manufacturing ecosystem.
Author Contributions
Writing—original draft, conceptualization, formal analysis, methodology, software, S.S.; supervision, Y.Y.; conceptualization, formal analysis, X.M.; writing—review and editing, funding acquisition, supervision, T.L. All authors have read and agreed to the published version of the manuscript.
Funding
This research was funded by the National Social Science Foundation of China (No. 20BGL110), Natural Science Foundation of Shandong Province (No. ZR2021MG022), Humanities and Social Sciences Fund of Shandong Federation of Social Sciences (No. 2023-zkzd-022).
Institutional Review Board Statement
Not applicable.
Informed Consent Statement
Not applicable.
Data Availability Statement
The original contributions presented in this study are included in the article. Further inquiries can be directed to the corresponding author.
Acknowledgments
The authors wish to express their gratitude to the anonymous reviewers for their valuable suggestions and comments for improving this manuscript.
Conflicts of Interest
The authors declare no conflicts of interest regarding the publication of this paper.
Abbreviations
The following abbreviations are used in this manuscript:
| TPSMPs | Third-Party Shared Manufacturing Platforms |
| SBSMPs | Self-Built Shared Manufacturing Platforms |
Appendix A
Appendix A.1. Proofs of the Equilibrium Solutions in the TPSMP Model
Proof (N, N).
Considering the Manufacturers’ action first, we can find that is a concave function in and is a concave function in by the backward induction method. Letting the first partial derivatives of with respect to be zero, and the first partial derivatives of with respect to be zero, we gain: and
Solving the above system of linear equations, we obtain the reaction functions of and with respect to and v as follows:
Next, considering the third-party platform’s action: substituting Equations (A1) and (A2) into the platform’s profit function (Equation (2) in the main text), we can observe that is a concave function in (the joint concavity in is guaranteed by the parameter range ). Letting the first partial derivative of with respect to be zero, we gain:
The optimal commission fee of is obtained. Substituting the optimal back into (A1) and (A2), we obtain the following:
Finally, substituting all optimal results () into the profit functions (Equations (1)–(3) in the main text), we obtain the following:
The equilibrium solutions of the (Y, Y), (Y, N), and (N, Y) strategies follow the same backward induction logic and thus will not be elaborated on further. □
Appendix A.2. Proof of Proposition 1
,
Let , then the level of quality disclosure can be obtained as:
Appendix A.3. Proof of Proposition 2
Appendix A.4. Proof of Proposition 3
Let , then the level of quality disclosure can be obtained as:
Let , then the level of quality disclosure can be obtained as:
Appendix A.5. Proof of Proposition 4
Let , then the level of quality disclosure can be obtained as:
Appendix B
Appendix B.1. Proofs for the Equilibrium Solutions in the SBSMPs Model
Proof (N, N).
Considering the Manufacturer 2 action first, we can find that is a joint concave function in by the backward induction method. Letting the first partial derivatives for of be zero. We gain And we can obtain the reaction functions for of as follows,
Next, considering the Manufacturer 1 action and substituting Equations (A8) into Equation (14), we can observe that is a joint concave function in . Letting the first partial derivatives for of be zero, we gain . Letting the first partial derivatives for of be zero, we gain . Solving the above equation for and , we obtain the following:
Thus, the optimal commission fee and sale price of are obtained. Substituting , into (A8), the optimal sale price can be gained. Substituting all results into (A9) and (A10), we get the optimal profits as follows:
The equilibrium solutions of the (Y, Y), (Y, N), and (N, Y) strategies are similar to those of the (N, N) strategy and thus will not be elaborated on further. □
Appendix B.2. Proof of Proposition 5
Appendix B.3. Proof of Proposition 6
Appendix B.4. Proof of Proposition 7
Let , then the quality level of Manufacturer 2 can be obtained as: or (i.e., or ).
Appendix B.5. Proof of Proposition 8
Let , then the quality level of Manufacturer 2 can be obtained as:
Let , then the level of quality disclosure can be obtained as:
Let , then the level of quality disclosure can be obtained as:
Let , then the quality level of Manufacturer 2 can be obtained as:
Let , then the quality level of Manufacturer 2 can be obtained as:
Let , then the quality level of Manufacturer 2 can be obtained as:
Appendix C
Appendix C.1. Proof of Proposition 9
Under the strategy, a comparison of Manufacturer 1’s profits between third-party shared manufacturing and self-built shared manufacturing.
Under the strategy, a comparison of Manufacturer 1’s profits between third-party shared manufacturing and self-built shared manufacturing.
Under the strategy, a comparison of Manufacturer 1’s profits between third-party shared manufacturing and self-built shared manufacturing.
Under the strategy, a comparison of Manufacturer 1’s profits between third-party shared manufacturing and self-built shared manufacturing.
Under the strategy, a comparison of Manufacturer 2’s profits between third-party shared manufacturing and self-built shared manufacturing.
Under the strategy, a comparison of Manufacturer 2’s profits between third-party shared manufacturing and self-built shared manufacturing.
Let , then the quality level of Manufacturer 2 can be obtained as:
Under the strategy, a comparison of Manufacturer 2’s profits between third-party shared manufacturing and self-built shared manufacturing.
Under the strategy, a comparison of Manufacturer 2’s profits between third-party shared manufacturing and self-built shared manufacturing.
Let , then the quality level of Manufacturer 2 can be obtained as:
References
- Xie, L.; Zhang, J.; Meng, Q.; Jin, Y.; Liu, W. An intelligent matching recommendation algorithm for a manufacturing capacity sharing platform with fairness concerns. Int. J. Prod. Res. 2024, 62, 7447–7465. [Google Scholar] [CrossRef] [Scilit]
- Li, W.; Dan, B.; Zhang, X.; Lei, T.; Zhang, S. The quality admission and price decisions of production capacity on the third-party platform for shared manufacturing. Int. Trans. Oper. Res. 2026, 33, 529–566. [Google Scholar] [CrossRef] [Scilit]
- Zhang, Y.; Huang, M.; Tian, L.; Jin, D.; Cai, G.G. Build or join a sharing platform? The choice of manufacturer’s sharing mode. Int. J. Prod. Econ. 2021, 231, 107811. [Google Scholar] [CrossRef] [Scilit]
- Xiao, W.; Cao, Y. The manufacturer’s strategic involvement in product sharing. Comput. Ind. Eng. 2023, 180, 109253. [Google Scholar] [CrossRef] [Scilit]
- Akerlof, G.A. The market for “lemons”: Quality uncertainty and the market mechanism. In Uncertainty in Economics; Academic Press: Cambridge, MA, USA, 1978; pp. 235–251. [Google Scholar]
- Board, O. Competition and disclosure. J. Ind. Econ. 2009, 57, 197–213. [Google Scholar] [CrossRef] [Scilit]
- Deore, A.; Holzhacker, M.; Krishnan, R. Direct and spillover effects of quality disclosure regulation: Evidence from California hospitals. Manag. Sci. 2024, 70, 2477–2496. [Google Scholar] [CrossRef] [Scilit]
- Ding, L.; Huang, H.; Yuan, H. Impacts of distributional fairness concerns on quality disclosure in a dyadic supply chain. Comput. Ind. Eng. 2023, 182, 109416. [Google Scholar] [CrossRef] [Scilit]
- Grossman, S.J.; Hart, O.D. Disclosure laws and takeover bids. J. Financ. 1980, 35, 323–334. [Google Scholar] [CrossRef]
- Zhu, H.; Yu, Y.; Ray, S. Quality disclosure strategy under customer learning opportunities. Prod. Oper. Manag. 2021, 30, 1136–1153. [Google Scholar] [CrossRef] [Scilit]
- Guo, L. Upstream exploitation and strategic disclosure. Mark. Sci. 2020, 39, 923–938. [Google Scholar] [CrossRef] [Scilit]
- Hotz, V.J.; Xiao, M. Strategic information disclosure: The case of multiattribute products with heterogeneous consumers. Econ. Inq. 2013, 51, 865–881. [Google Scholar] [CrossRef] [Scilit]
- Jiang, Y.; Guan, X.; Bian, Y.; Huang, S. Information disclosure with endogenous channel structure. Nav. Res. Logist. (NRL) 2023, 70, 105–120. [Google Scholar] [CrossRef] [Scilit]
- Zhao, M.; Dong, C.; Cheng, T.C.E. Quality disclosure strategies for small business enterprises in a competitive marketplace. Eur. J. Oper. Res. 2018, 270, 218–229. [Google Scholar] [CrossRef] [Scilit]
- Huang, S.; Xu, J.; Wang, Y. Quality disclosure in a dual-channel supply chain with an online dual-purpose platform. Transp. Res. Part E Logist. Transp. Rev. 2025, 193, 103834. [Google Scholar] [CrossRef] [Scilit]
- Zhao, J.; Qiu, J.; Zhou, Y.-W.; Hu, X.-J.; Yang, A.-F. Quality disclosure in the presence of strategic consumers. J. Retail. Consum. Serv. 2020, 55, 102084. [Google Scholar] [CrossRef] [Scilit]
- Huang, S.; Chen, S.; Xiao, L. Manufacturer product quality information disclosure with channel encroachment in the E-commerce age. Manag. Decis. Econ. 2020, 41, 744–761. [Google Scholar] [CrossRef] [Scilit]
- Zhang, J.; Li, K.J. Quality disclosure under consumer loss aversion. Manag. Sci. 2021, 67, 5052–5069. [Google Scholar] [CrossRef] [Scilit]
- Xu, X. From cloud computing to cloud manufacturing. Robot.-Comput.-Integr. Manuf. 2012, 28, 75–86. [Google Scholar] [CrossRef] [Scilit]
- Yu, C.; Zhang, L.; Zhao, W.; Zhang, S. A blockchain-based service composition architecture in cloud manufacturing. Int. J. Comput. Integr. Manuf. 2020, 33, 701–715. [Google Scholar] [CrossRef] [Scilit]
- Liu, C.; Su, Z.; Xu, X.; Lu, Y. Service-oriented industrial internet of things gateway for cloud manufacturing. Robot.-Comput.-Integr. Manuf. 2022, 73, 102217. [Google Scholar] [CrossRef] [Scilit]
- Chen, J.; Huang, G.Q.; Wang, J.-Q.; Yang, C. A cooperative approach to service booking and scheduling in cloud manufacturing. Eur. J. Oper. Res. 2019, 273, 861–873. [Google Scholar] [CrossRef] [Scilit]
- Chen, Q.; Xu, Q.; Wu, C. Dynamic matching in cloud manufacturing considering matching costs. Complexity 2019, 2019, 8398356. [Google Scholar] [CrossRef] [Scilit]
- Pan, X.-y.; Ma, J.-z.; Zhao, D.-z. Study on pricing behaviour and capacity allocation of cloud manufacturing service platform. Clust. Comput. 2019, 22, 14701–14707. [Google Scholar] [CrossRef] [Scilit]
- Zhao, D.; Han, H.; Shang, J.; Hao, J. Decisions and coordination in a capacity sharing supply chain under fixed and quality-based transaction fee strategies. Comput. Ind. Eng. 2020, 150, 106841. [Google Scholar] [CrossRef] [Scilit]
- Zhang, Z.; Wang, X.; Su, C.; Sun, L. Evolutionary game analysis of shared manufacturing quality synergy under dynamic reward and punishment mechanism. Appl. Sci. 2022, 12, 6792. [Google Scholar] [CrossRef] [Scilit]
- Li, W.; Zhang, Y.; Dan, B.; Zhang, X.; Sui, R. Simulation Modeling and Analysis on the Value-Added Service of the Third-Party E-Commerce Platform Supporting Multi-Value Chain Collaboration. J. Theor. Appl. Electron. Commer. Res. 2024, 19, 846–862. [Google Scholar] [CrossRef] [Scilit]
- Grossman, S.J. The informational role of warranties and private disclosure about product quality. J. Law Econ. 1981, 24, 461–483. [Google Scholar] [CrossRef] [Scilit]
- Milgrom, P.R. Good news and bad news: Representation theorems and applications. Bell J. Econ. 1981, 12, 380–391. [Google Scholar] [CrossRef] [Scilit]
- Guo, L. Quality disclosure formats in a distribution channel. Manag. Sci. 2009, 55, 1513–1526. [Google Scholar] [CrossRef] [Scilit]
- Ghosh, B.; Galbreth, M.R. The impact of consumer attentiveness and search costs on firm quality disclosure: A competitive analysis. Manag. Sci. 2013, 59, 2604–2621. [Google Scholar] [CrossRef] [Scilit]
- Guan, X.; Wang, Y. Quality disclosure in a competitive environment with consumer’s elation and disappointment. Omega 2022, 108, 102586. [Google Scholar] [CrossRef] [Scilit]
- Hong, X.; Zhou, M.; Gong, Y. Dilemma of quality information disclosure in technology licensing. Eur. J. Oper. Res. 2021, 294, 543–557. [Google Scholar] [CrossRef] [Scilit]
- Tan, Y.; Wang, C.; Zhou, Z.; Dong, R.; Guan, X. Quality disclosure strategy in a competitive environment with consumers’ homogeneity and heterogeneity. Manag. Decis. Econ. 2024, 45, 2144–2156. [Google Scholar] [CrossRef] [Scilit]
- Dou, X.; Li, Z.; Liu, C. Secondhand product quality disclosure strategy of the retailer under different supply chain structures. Manag. Decis. Econ. 2022, 43, 2982–2999. [Google Scholar] [CrossRef] [Scilit]
- Yu, Y.; He, Y.; Guo, X.; Li, D.; Huang, H. Quality disclosure strategy with asymmetric demand information in food supply chains. Transp. Res. Part E Logist. Transp. Rev. 2024, 183, 103427. [Google Scholar] [CrossRef] [Scilit]
- Guan, X.; Chen, Y.-J. The interplay between information acquisition and quality disclosure. Prod. Oper. Manag. 2017, 26, 389–408. [Google Scholar] [CrossRef] [Scilit]
- Huang, S.; Zhang, X.; Guan, X.; Yi, Z. Quality information disclosure with retailer store brand introduction in a supply chain. Comput. Ind. Eng. 2022, 171, 108475. [Google Scholar] [CrossRef] [Scilit]
- Zhang, S.; Zhang, X.; Wang, B.; Dan, B. Quality Information Disclosure and Blockchain Technology Adoption of Competitive Suppliers on the Third-Party E-Commerce Platform. J. Theor. Appl. Electron. Commer. Res. 2025, 20, 127. [Google Scholar] [CrossRef] [Scilit]
- Tong, Y.; Shi, Z.; Li, J. Impacts of Brand Spillover Effect on Sourcing and Quality Disclosure of the Platform’s Store Brand Under Asymmetric Information. J. Theor. Appl. Electron. Commer. Res. 2025, 20, 291. [Google Scholar] [CrossRef] [Scilit]
- Wu, J.; Lu, W.; Ji, X. The interactions between upstream quality disclosure and downstream entry. Eur. J. Oper. Res. 2023, 309, 545–559. [Google Scholar] [CrossRef] [Scilit]
- Xu, Q.; He, Y. Optimal information disclosure strategies for a retail platform in the blockchain technology era. Int. J. Prod. Res. 2023, 61, 3781–3792. [Google Scholar] [CrossRef] [Scilit]
- Liu, W.; Li, B.; Zhang, G.; Wang, Z.; Cheng, Y. Quality disclosure pattern options for competing refurbishers: Blockchain vs online platform. Ann. Oper. Res. 2023, 344, 1027–1056. [Google Scholar] [CrossRef] [Scilit]
- Lan, Y.; Peng, J.; Wang, F.; Gao, C. Quality Disclosure with Information Value Under Competition. Int. J. Mach. Learn. Cybern. 2018, 9, 1489–1503. [Google Scholar] [CrossRef] [Scilit]
- Guan, X.; Wang, Y.; Yi, Z.; Chen, Y.-J. Inducing consumer online reviews via disclosure. Prod. Oper. Manag. 2020, 29, 1956–1971. [Google Scholar] [CrossRef] [Scilit]
- Huang, H.; Yang, Y.; Xu, H. Larger Number of Reviews or Higher Rating? The Firm’s Pricing and Quality Disclosure Strategies on the Online Platform. Inf. Technol. Manag. 2025, 26, 39–56. [Google Scholar] [CrossRef] [Scilit]
- Feng, J.; Wang, Y.; Liu, Z. Joint impact of service efficiency and salvage value on the manufacturer’s shared vehicle-type strategies. Rairo-Oper. Res. 2024, 58, 2261–2287. [Google Scholar] [CrossRef] [Scilit]
- Yu, X.; Xiao, T. Quality disclosure and unauthorized channel choice. Int. Trans. Oper. Res. 2025, 32, 1184–1213. [Google Scholar] [CrossRef]
- Cao, X.; Bo, H.; Liu, Y.; Liu, X. Effects of different resource-sharing strategies in cloud manufacturing: A Stackelberg game-based approach. Int. J. Prod. Res. 2023, 61, 520–540. [Google Scholar] [CrossRef] [Scilit]
- Karmarkar, U.S.; Pitbladdo, R.C. Quality, Class, and Competition. Manag. Sci. 1997, 43, 27–39. [Google Scholar] [CrossRef] [Scilit]
- Banker, R.D.; Khosla, I.; Sinha, K.K. Quality and Competition. Manag. Sci. 1998, 44, 1179–1192. [Google Scholar] [CrossRef] [Scilit]
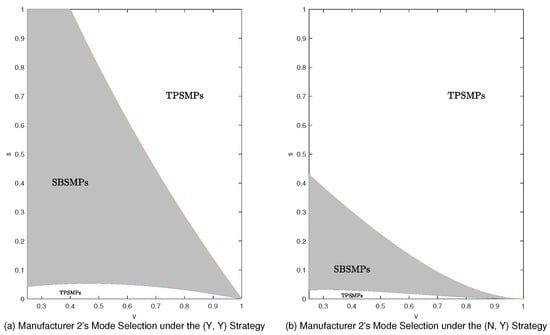
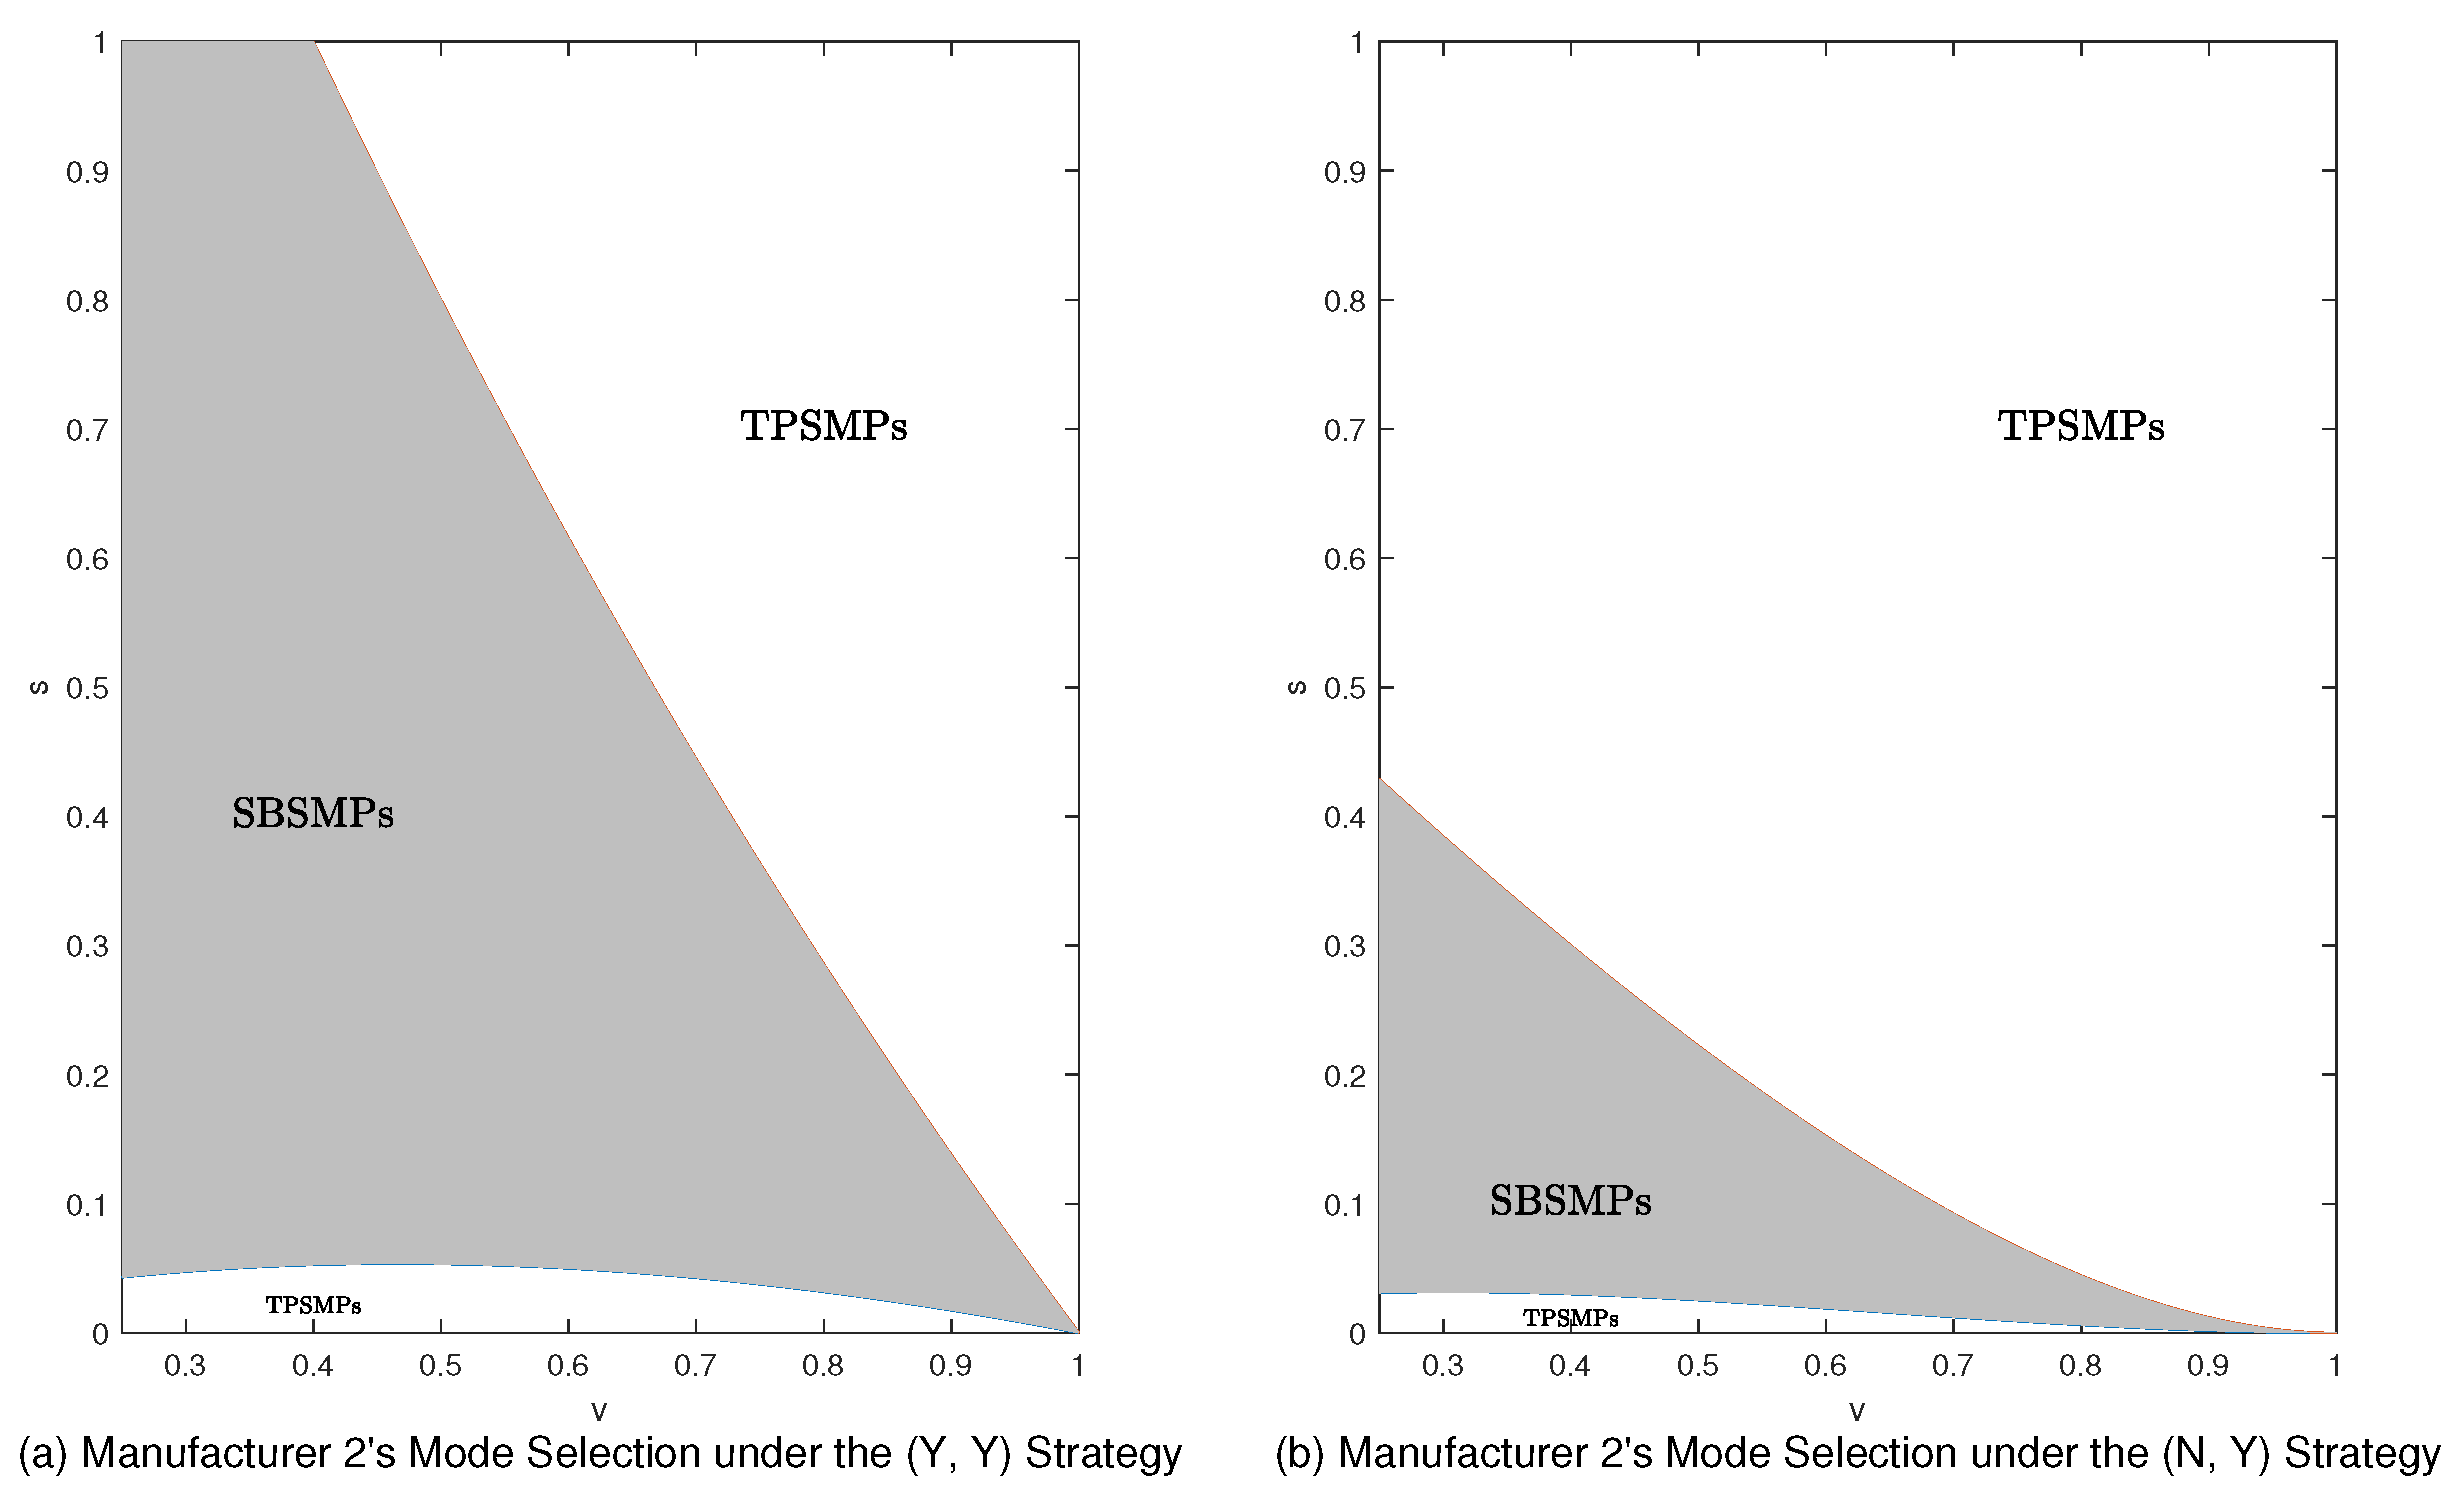
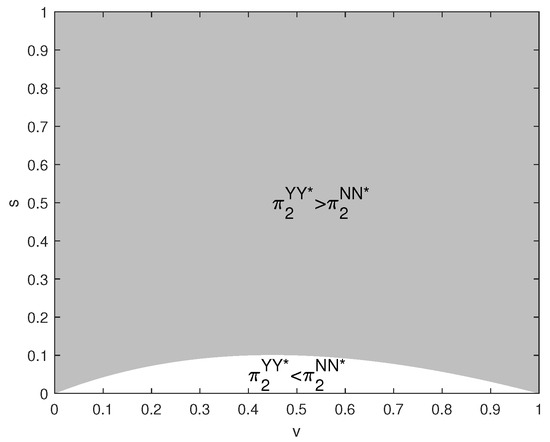
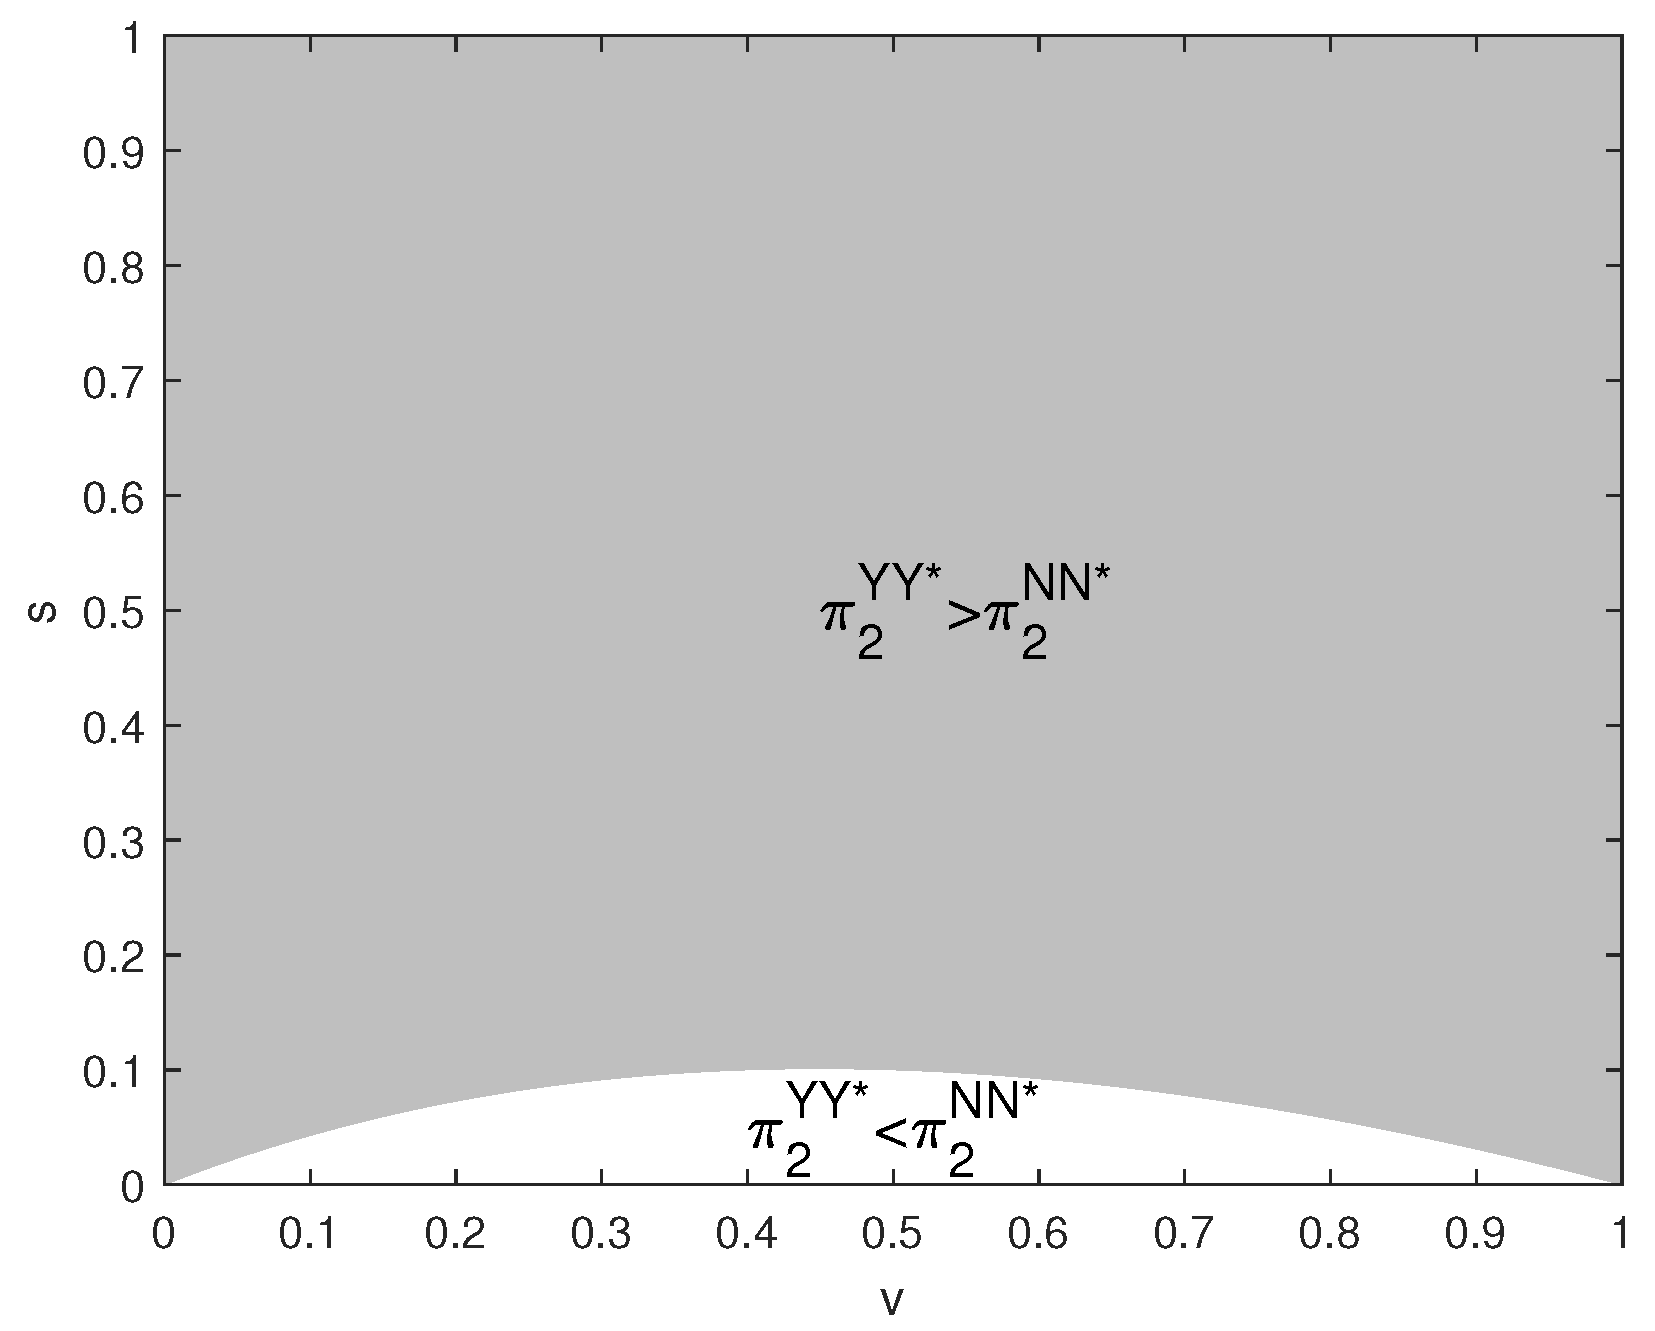
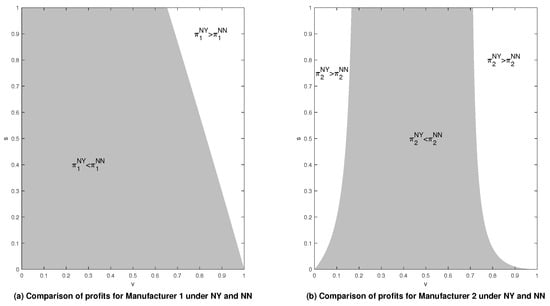
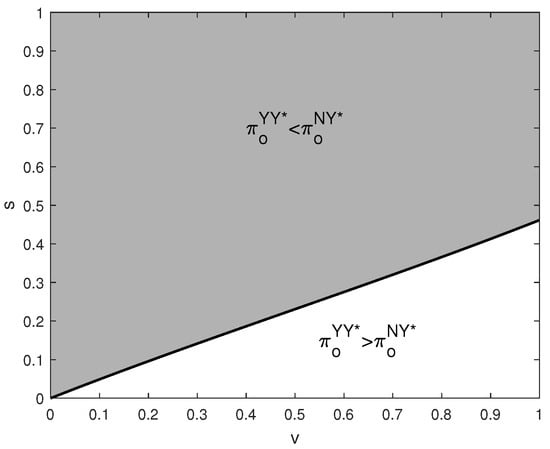
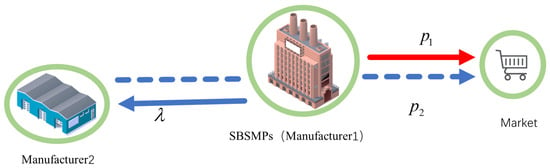
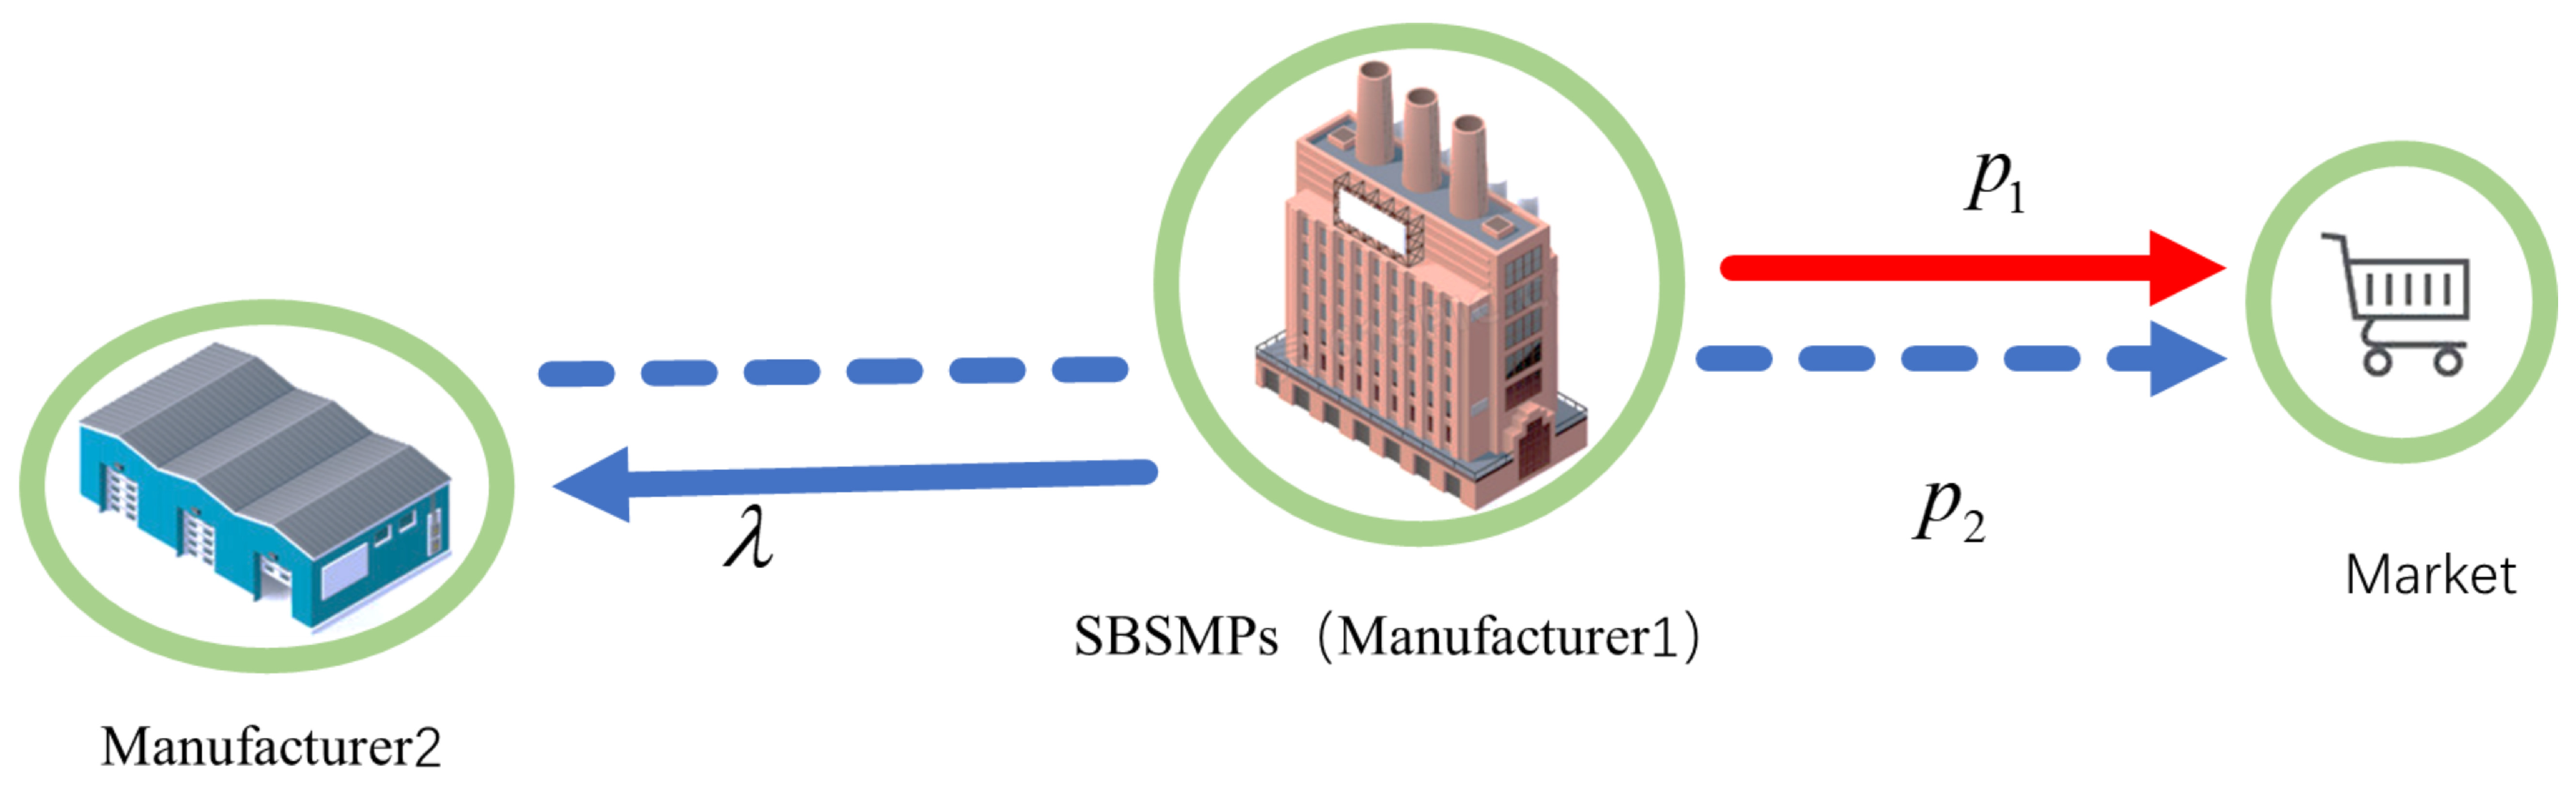
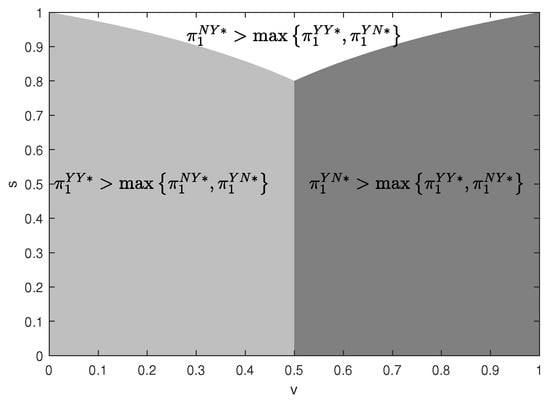
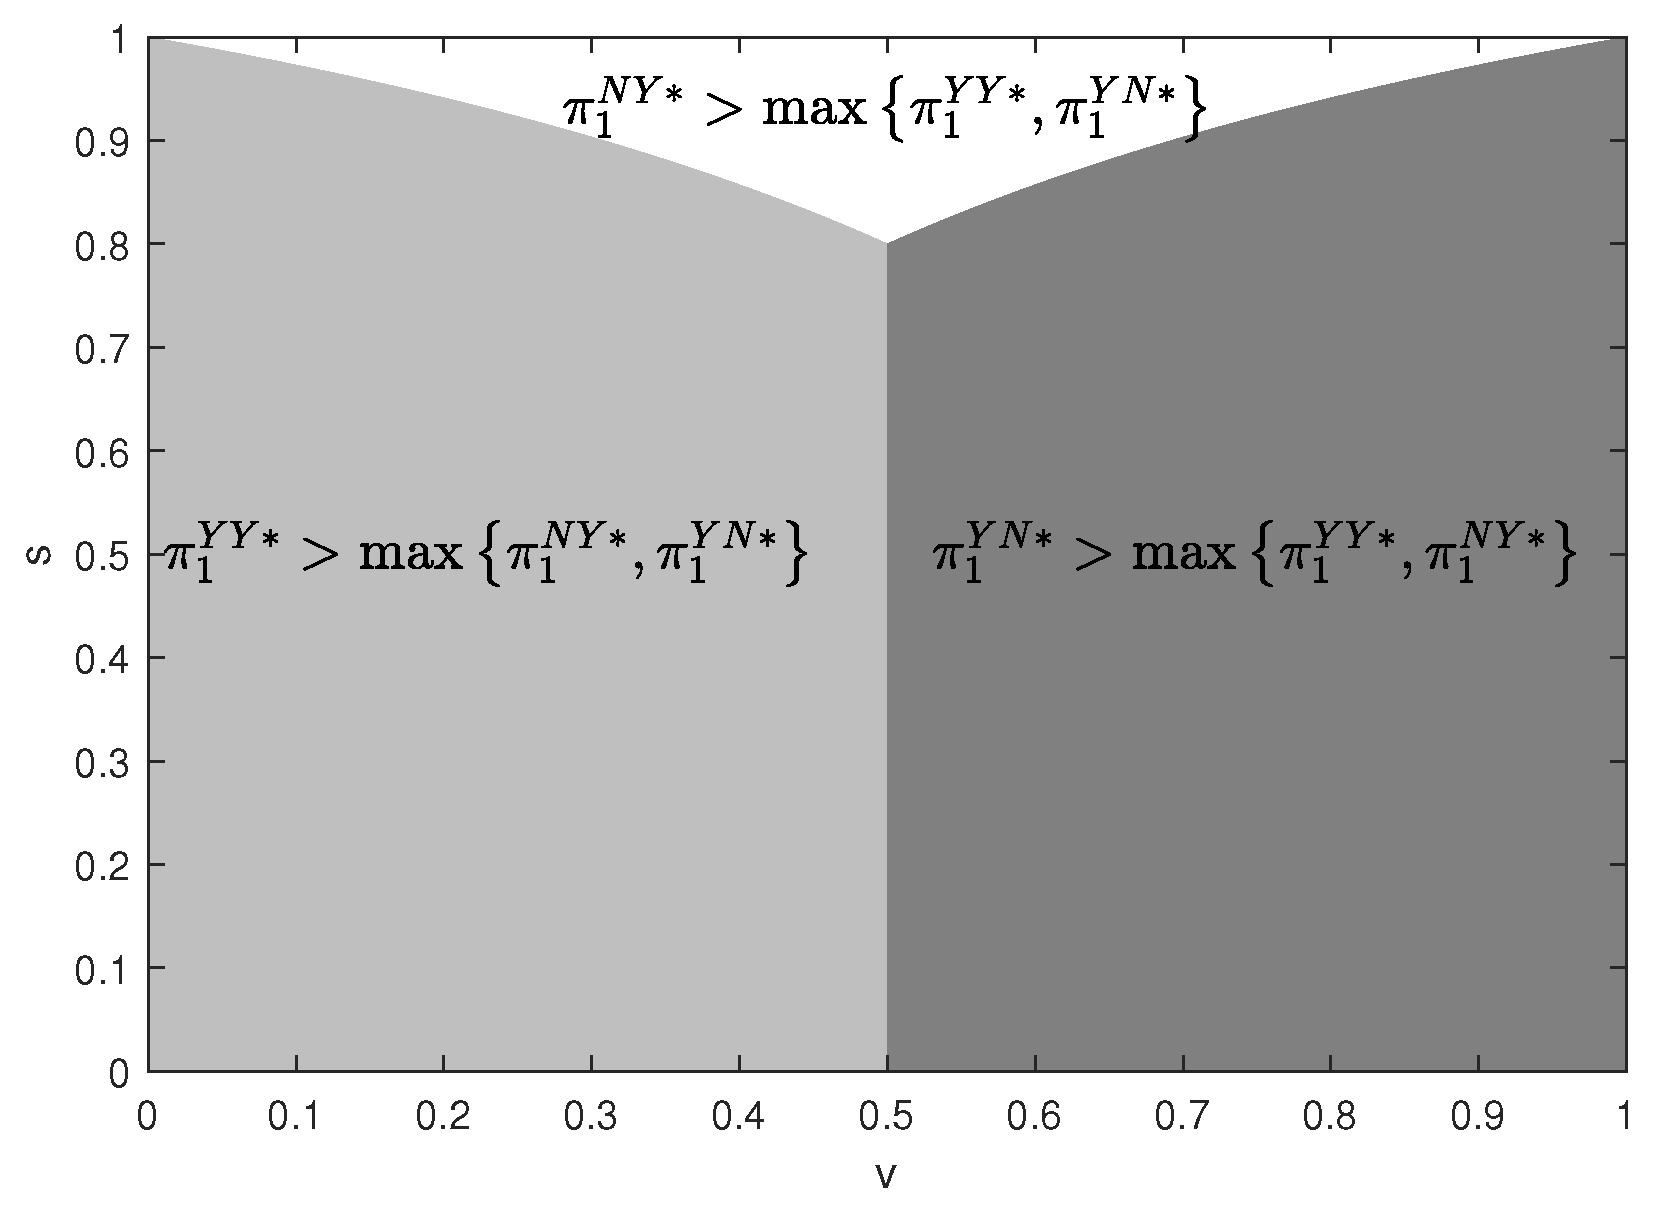
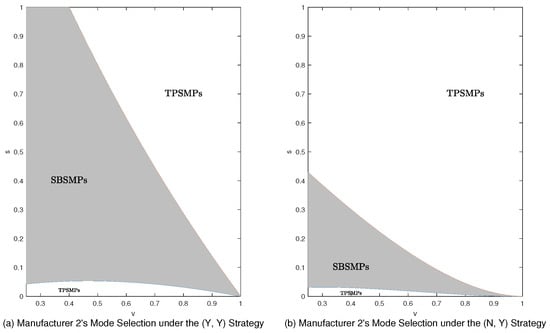
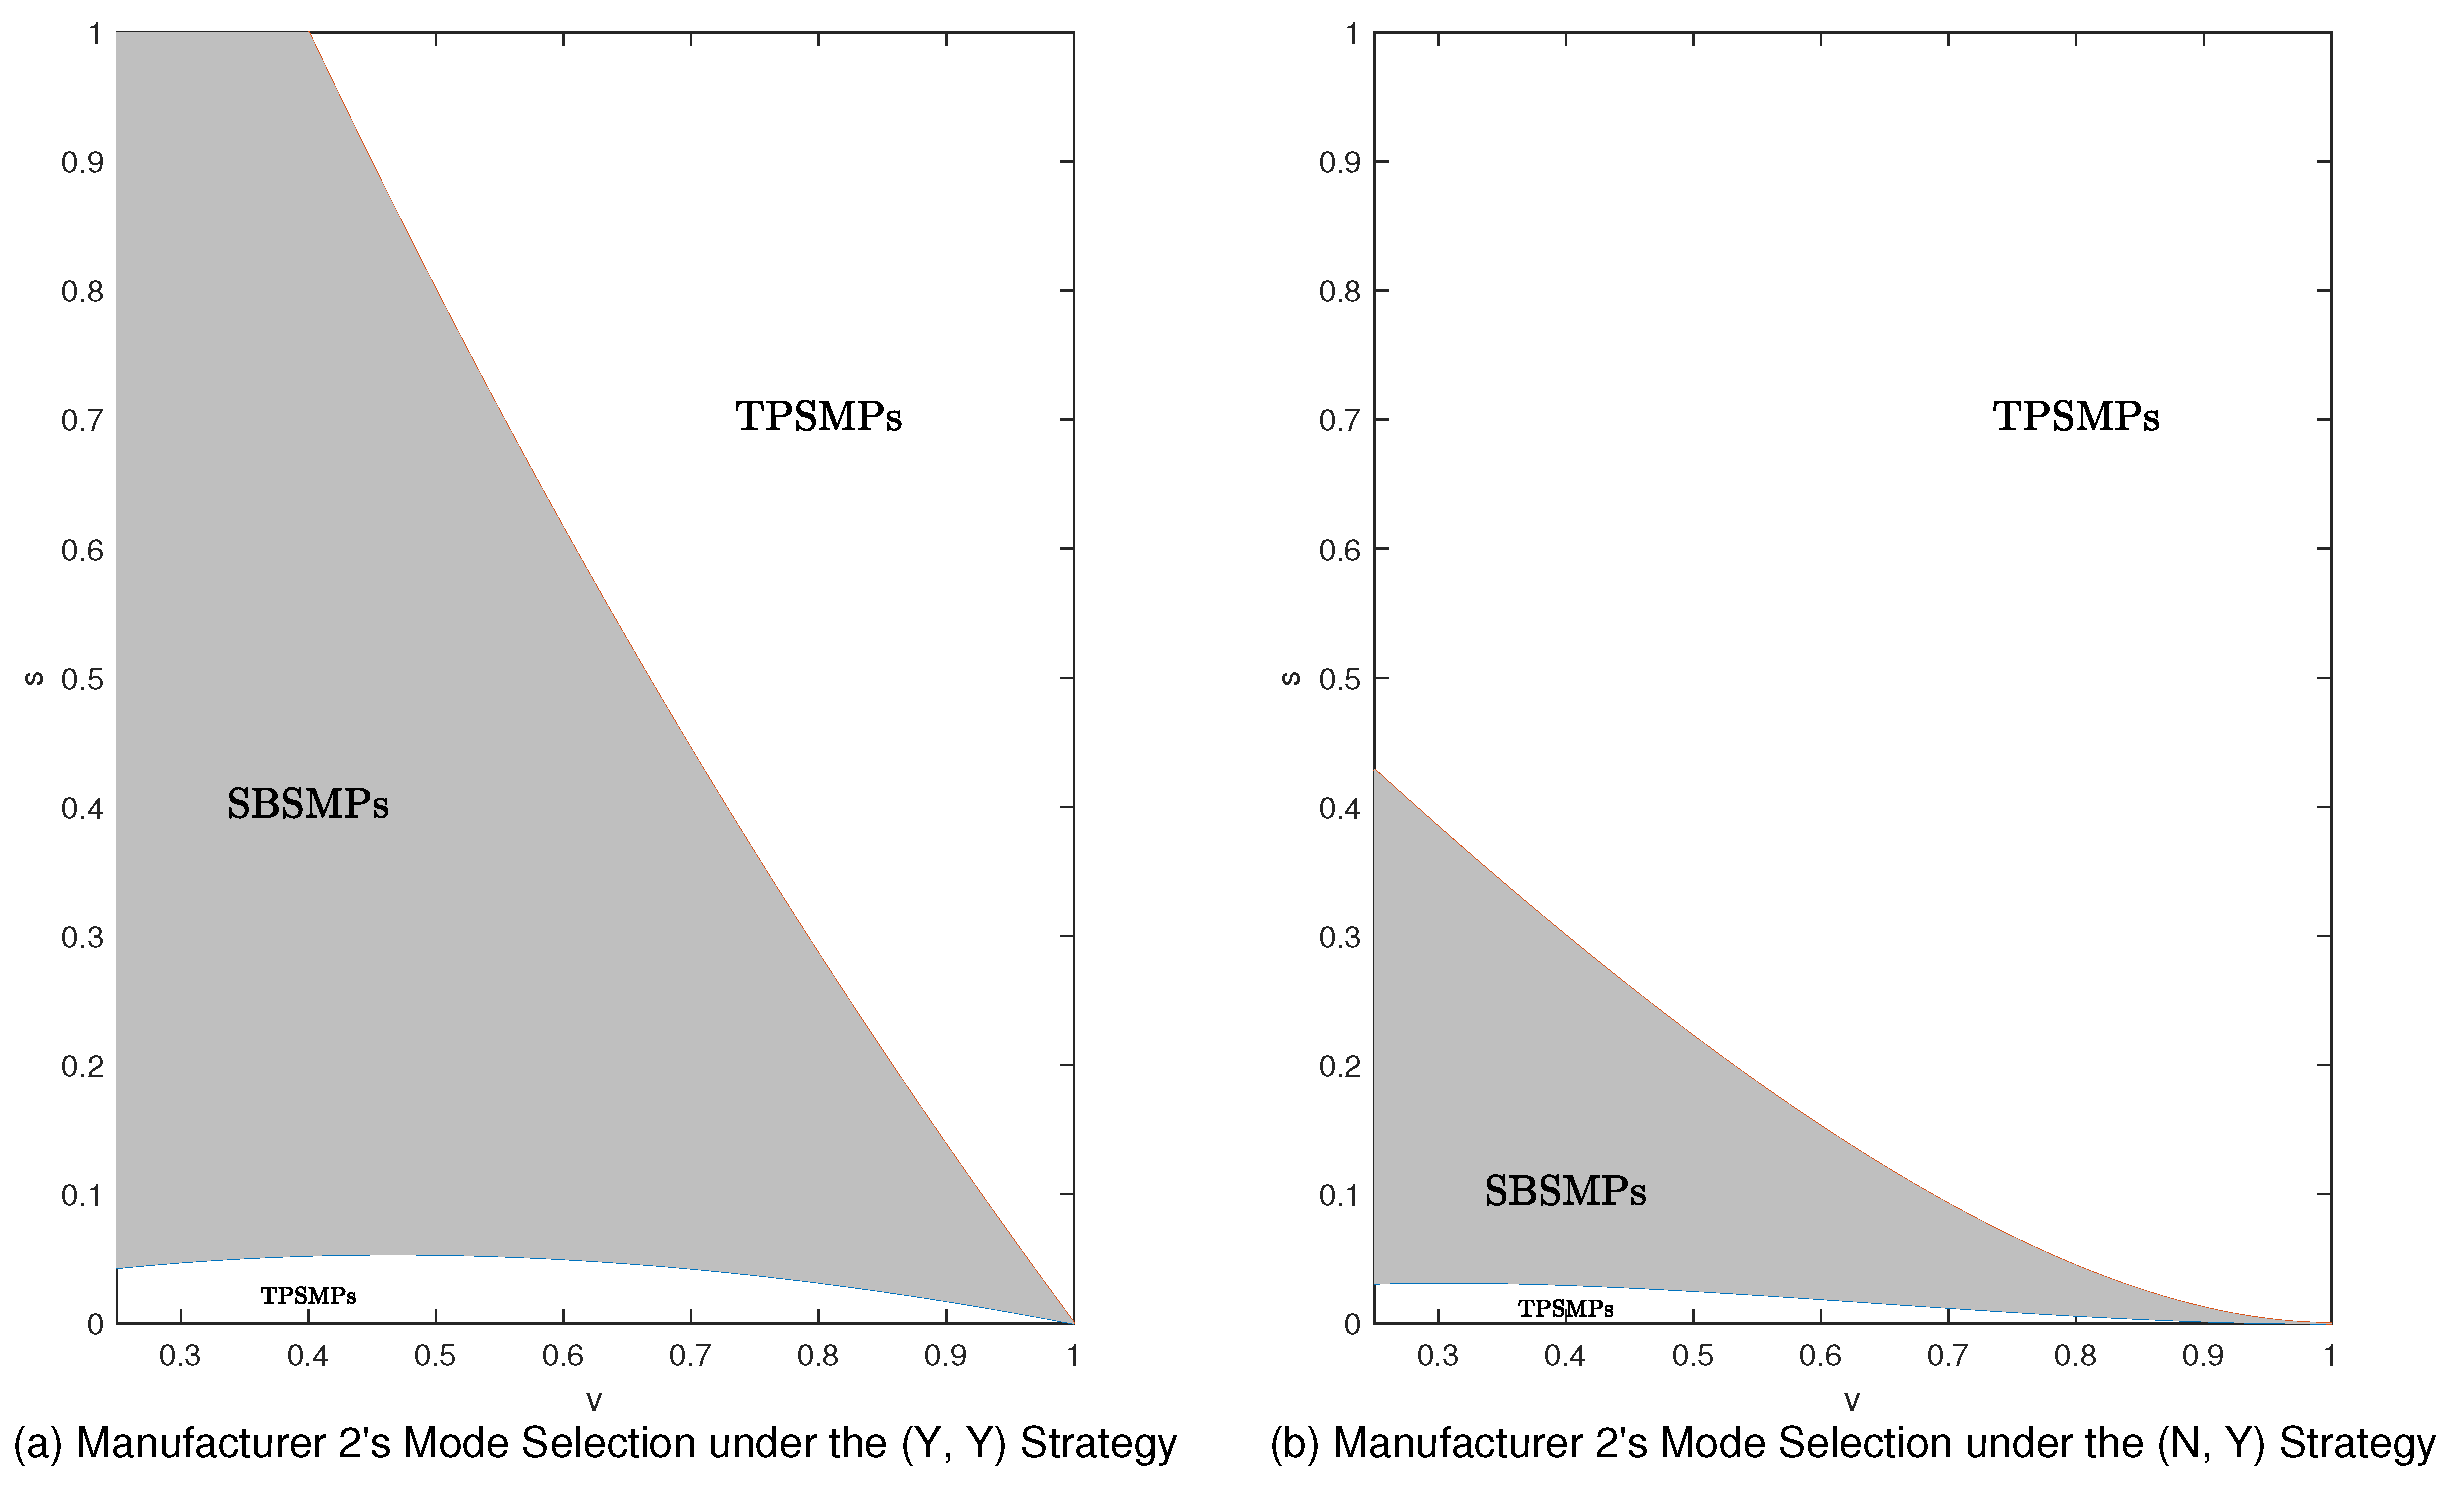

Disclaimer/Publisher’s Note: The statements, opinions and data contained in all publications are solely those of the individual author(s) and contributor(s) and not of MDPI and/or the editor(s). MDPI and/or the editor(s) disclaim responsibility for any injury to people or property resulting from any ideas, methods, instructions or products referred to in the content. |
© 2026 by the authors. Licensee MDPI, Basel, Switzerland. This article is an open access article distributed under the terms and conditions of the Creative Commons Attribution (CC BY) license.