


Abstract
Digital marketing is spreading fast across emerging economies, but adoption among MSMEs in rural regions is limited and concentrated in free, low-commitment channels. Most firm-level adoption studies are based on symmetric methods that assume additive effects, a single adoption pathway, and causal symmetry. The present study integrates partial least squares structural equation modelling (PLS-SEM) and fuzzy-set qualitative comparative analysis (fsQCA) using survey data from 538 MSMEs in Idukki, a mainly rural district in Kerala, India. Digital marketing orientation was the strongest predictor of adoption intention, while digital marketing capability was the strongest predictor of actual adoption. Adoption intention mediated the effects of eight of the ten Technology-Organization-Environment (TOE) antecedents. Customer power and perceived financial cost did not affect adoption intention but showed negative direct associations with actual adoption. Two configurations were sufficient for high adoption, both combining organizational knowledge readiness, digital marketing orientation, and low perceived financial cost. Four configurations were sufficient for non-adoption, with the dominant configurations characterised by the joint absence of organizational knowledge readiness and digital marketing orientation, suggesting that non-adoption was not simply the logical opposite of adoption. High adoption intention was neither a necessary nor a sufficient condition for actual adoption. Findings suggest that MSME support programmes should prioritise organizational capability building and should combine it with financial cost relief.
1. Introduction
Digital marketing is reshaping business competition by changing how companies reach customers, build brands, and compete for demand. Lower data costs, wider smartphone adoption, and platform-based intermediation have lowered barriers to digital participation [1]. MSMEs are expected to benefit substantially from adopting digital technologies [2,3], but these benefits are not realised equally across all enterprises. As access becomes widespread, the digital divide shifts from whether firms are online to how they use digital technologies, a phenomenon known as the “second level” digital divide [4,5]. In rural and geographically dispersed areas, MSME digital marketing often remains limited in scope and intensity, with adoption largely concentrated in free, low-commitment channels such as messaging applications and social media pages, which are used infrequently and require little or no financial investment. MSMEs rarely extend their digital marketing activities to owned channels such as websites, or to paid advertising and online marketplaces [2,6]. Digital marketing activities are also often informal, relying on personal accounts and ad hoc practices rather than structured, planned marketing routines. Understanding why some resource-constrained companies convert digital access to meaningful use while others do not, even though they have access to similar infrastructure, is an important research question, central to both technology adoption theory in emerging markets and the design of digital inclusion policy.
Research on SME digital and social media marketing adoption has identified several technological, organizational, and environmental antecedents using the TOE framework, often combined with perception-based theories [3,7,8,9,10]. Most existing studies estimate the average net effect of individual antecedents using regression analysis or structural equation modelling, including the authors’ earlier CB-SEM study of registered MSMEs in a resource-constrained setting [6].
The symmetric methods in traditional research assume additivity (factors contribute independently and can compensate for one another), a single pathway (firms are assumed to follow a broadly similar route toward adoption), and causal symmetry (factors driving adoption are assumed to be the opposite of those driving non-adoption) [11,12]. Configurational methods relax the assumptions of net-effect approaches. Studies combining PLS-SEM and fsQCA show that conditions without significant individual net effects may still matter when combined [13,14]. Chen et al. [15] found that cloud computing adoption and non-adoption among SMEs follow different configurations. Three research gaps remain for digital marketing adoption among rural MSMEs: whether similar complexity exists for low-cost, platform-mediated technologies, where the key divide concerns depth of use rather than access; whether non-adoption is simply the opposite of adoption; and it remains to be seen whether these patterns hold among samples that are not restricted to registered MSMEs.
The study uses survey data from 538 MSMEs in Idukki, from a sample that was not restricted to registered firms, and asks the following three research questions. RQ1: How widely and deeply do MSMEs in a predominantly rural district use digital marketing channels? RQ2: What are the net effects of TOE antecedents on adoption intention and adoption, and does intention mediate these effects? RQ3: Which combinations of conditions are sufficient for high adoption intention, high adoption, and non-adoption? Are non-adoption configurations the negation of adoption configurations?
The study makes three contributions. First, it combines PLS-SEM and fsQCA using the same data to show where net effect and configurational evidence converge—around organizational readiness and digital marketing orientation—and where configurational patterns reveal what net effect analysis alone cannot capture. Second, it analyses non-adoption separately instead of treating it as the opposite of adoption, and shows that adoption requires four or five conditions to operate together, whereas the joint absence of two organizational conditions is sufficient for non-adoption. This suggests that organizational context acts as a gateway within the TOE framework, which favorable technological perceptions or market pressure cannot compensate for. Third, the study extends evidence on digital marketing adoption beyond registry-based samples in a rural emerging economy.
2. Literature Review and Hypotheses
2.1. Digital Marketing Adoption by MSMEs and the Depth of Adoption
Digital marketing adoption among small firms is explained mainly by perceived benefits, costs, capabilities, and external pressures [2,3,9,10]. For micro enterprises, low perceived cost, ease of use, and perceived value are important adoption drivers [2], while internal capabilities and strategic orientation towards digital channels determine whether adoption is sustained and produces results [16,17,18]. The digital divide literature suggests that once access becomes widespread, inequality shifts towards the range and depth of technology use [4,5]. For MSMEs, digital marketing adoption can be viewed as a channel ladder that runs from free messaging applications and social media presence to owned websites and online marketplaces and paid digital advertising. In this study, shallow adoption refers to using only the lower levels of this ladder, with low frequency and little or no spending. Informal adoption refers to using personal accounts and ad hoc activities rather than following planned routines. Few MSME studies explicitly examine adoption depth, and those that do rarely include unregistered enterprises, despite their wide presence among rural Indian micro-businesses, as these are often excluded from registry-based sampling frames [6,19].
2.2. Theoretical Foundation
The study used Technology–Organization–Environment (TOE) along with the Technology Acceptance Model (TAM) and Diffusion of Innovations (DOI) theory. The TOE framework proposes that technological, organizational, and environmental contexts together shape the firm’s adoption of an innovation [7]. The TOE framework’s broad scope makes it suitable for identifying and organizing antecedents of adoption. However, the TOE framework is agnostic about the perceptual mechanisms that translate contextual factors into adoption behavior. Perceived ease of use is incorporated from the Technology Acceptance Model, and it captures the effort barrier associated with adopting a technology [20]. Relative advantage, capturing the perceived superiority over current practice, and compatibility, capturing perceived fit with current practice, were incorporated from Diffusion of Innovations theory [21]. As reliability concerns are associated with platform-mediated marketing, trust is added as a technological perception condition [22,23]. Perceived financial cost is a major resource barrier for micro enterprises and is classified as a technological context factor because it reflects the perceived cost of the technology itself [2,24]. On the organizational side, the study includes knowledge, digital marketing capability, and strategic digital marketing orientation, representing the resources that convert perception into routine [16,25,26]. Competition represents rivalry side pressure [27], and customer power represents the demand-side pressure within the environmental context [28].
2.3. Net Effects and Configurations
In line with the intention behavior models of technology use, the antecedents are treated as independent predictors of intention and adoption, while intention is treated as a mediator for the variable-centred analysis. This helps to examine the individual net effects of the antecedents and the mediating role of intention. Hence, PLS-SEM is used to understand how each factor contributes to adoption while considering the effects of other factors in the model.
In contrast, the case-centred analysis considers that digital marketing adoption is not the result of the independent effect of individual factors alone, but happens from the combinations of technological, organizational, and environmental conditions. Hence, the same antecedents are treated as causal ingredients that can combine in different ways to produce the adoption. This is theoretically grounded in complexity theory, which views outcomes in social systems as the result of multiple interacting conditions rather than a single factor. This suggests that the adoption of digital marketing mainly arises from conjunctural causation (conditions matter in combination), equifinality (several different combinations can produce the same outcome), and causal asymmetry (the recipe for the presence of an outcome is not always the negation of the recipe of its absence) [11,12,29].
Combining the two approaches is recommended as they answer different questions. PLS-SEM estimates the average contribution of individual antecedents, while fsQCA identifies the combinations of conditions sufficient to produce an outcome [13,14]. Chen et al. [15] examined cloud computing adoption among 203 Chinese SMEs and identified seven adoption configurations and eight non-adoption configurations; some antecedents with no significant net effect were relevant within configurations. The present study extends the previous research in four ways: to digital marketing, a platform-mediated technology where the key divide concerns depth of use; uses a sample of MSMEs in a predominantly rural district that was not restricted to registered firms; examines adoption intention as both a separate outcome and a mediator; and tests whether non-adoption is the logical negation of adoption. Compared to the earlier study of registered MSMEs [6], which estimated the net effects with CB-SEM, it adds direct effects and mediation analysis, applies configurational analysis to three outcomes, and examines the depth of digital marketing usage.
2.4. Research Model and Hypotheses
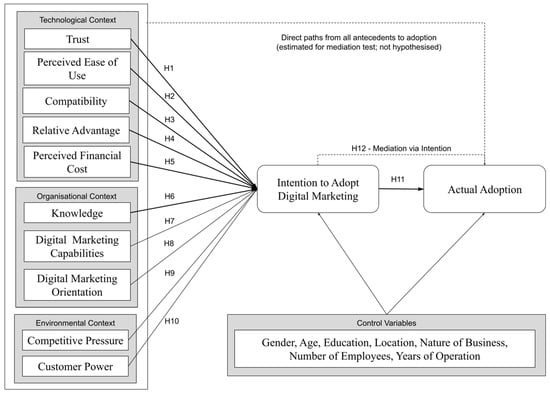
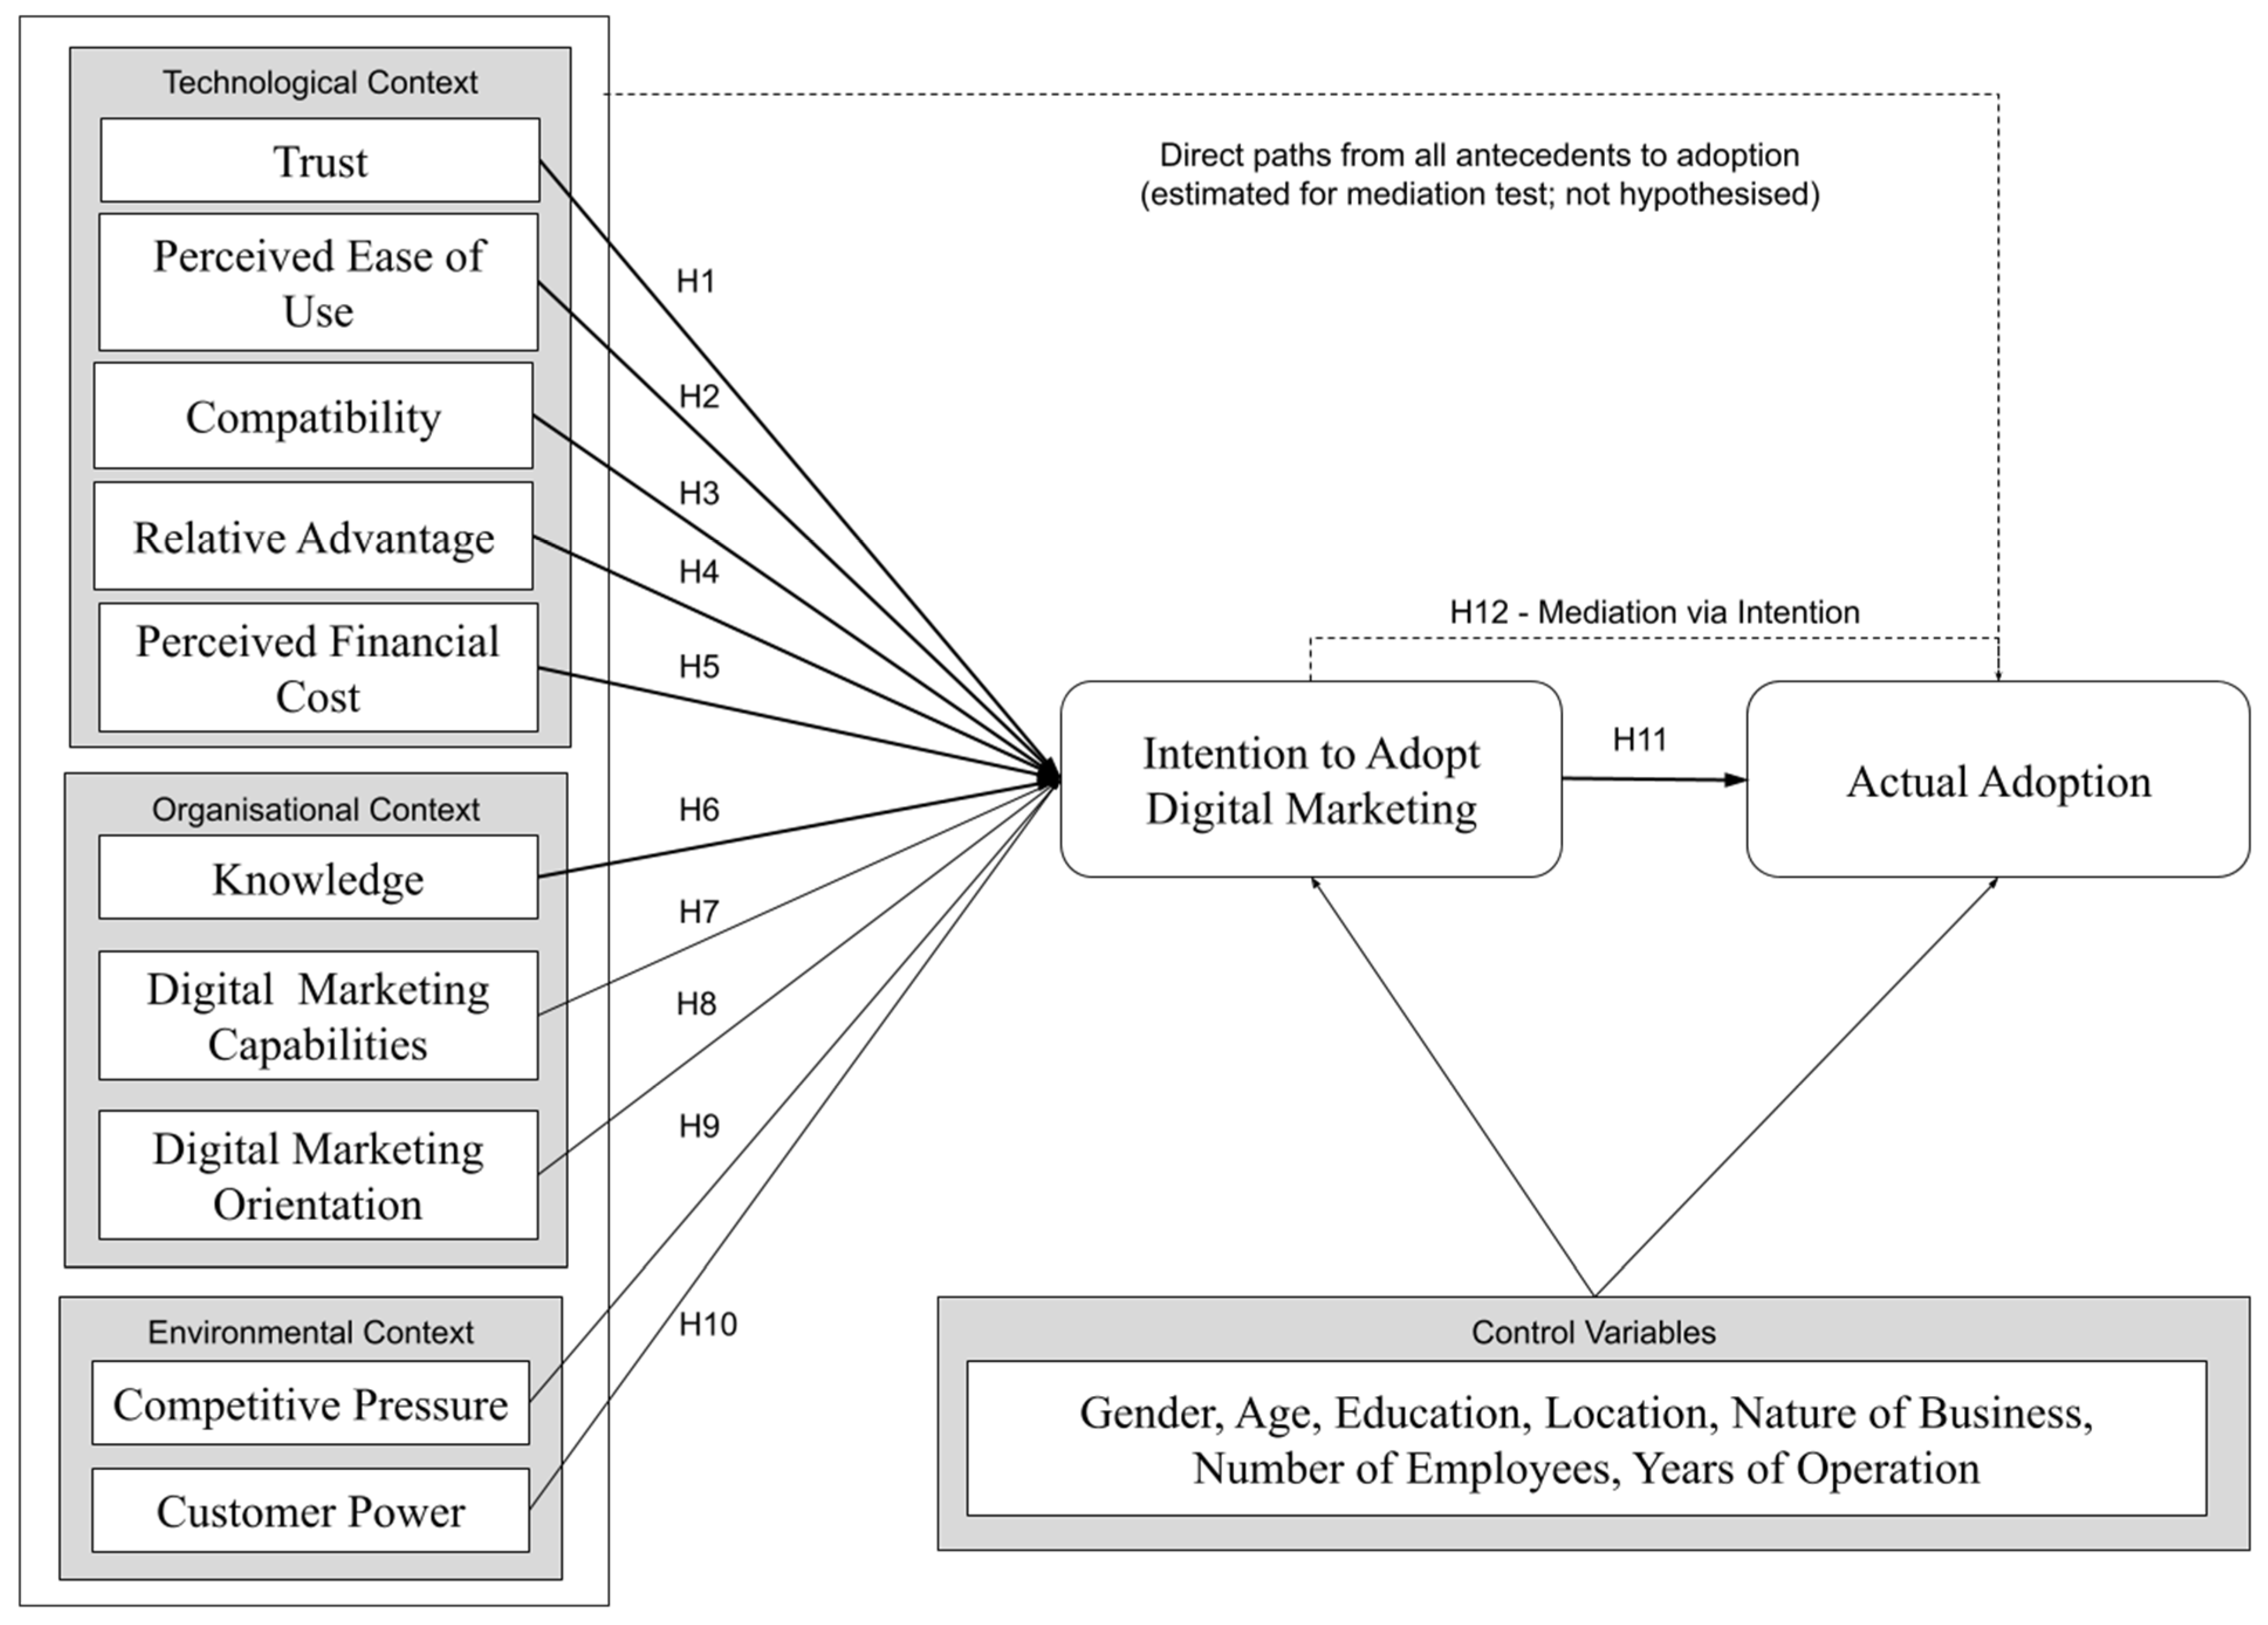
The model uses ten antecedents that influence digital marketing adoption intention—trust, perceived ease of use, compatibility, relative advantage, and perceived financial cost (technological); knowledge, digital marketing capability, and digital marketing orientation (organizational); competition and customer power (environmental)—predicting adoption intention, which predicts digital marketing adoption, with intention mediating the relationships between antecedents and digital marketing adoption (Figure 1).
Figure 1.
Conceptual model. Notes: Solid arrows are hypothesised paths; dashed arrows show the mediation hypothesis and direct paths estimated for the mediation test.
Mediation testing required estimating both the direct effect of each antecedent on adoption and its indirect effect through adoption intention [30], and these direct paths are shown as dashed lines in Figure 1 and are not individually hypothesised; seven control variables are included in the model. The same constructs are later consolidated to six conditions for configurational analysis (Section 3.3).
Technological antecedents. Perceived ease of use reduces the effort needed to use digital marketing technologies and can hence encourage MSMEs to develop adoption intentions [3]. Also, compatibility increases adoption intention when digital marketing fits existing business practices and processes [8]. Relative advantage shows the perceived benefits of digital marketing compared with existing marketing approaches and has been identified as an important determinant of MSME digital marketing adoption [9,19]. Trust can reduce uncertainty and perceived risk associated with digital platforms and hence motivate firms to consider digital marketing; in online exchanges, trust in the platform and its institutional safeguards reduces perceived risk and increases the intention to transact through the platform [22,23]. Perceived financial cost represents a potential barrier, especially for resource-constrained MSMEs, which can influence adoption decisions [2,10]. Hence, we hypothesise that,
H1.
Trust is positively associated with intention to adopt digital marketing.
H2.
Perceived ease of use is positively associated with intention.
H3.
Compatibility is positively associated with intention.
H4.
Relative advantage is positively associated with intention.
H5.
Perceived financial cost is negatively associated with intention.
Organisational antecedents. Digital knowledge and skills are the foundation for firms to understand and effectively use digital marketing. Knowledge barriers are a major obstacle to new technology adoption among small organizations, and the knowledge of owners and employees strongly predicts technology adoption [25,31]. Digital marketing capability represents the firm’s ability to implement and manage digital marketing activities effectively [8,16]. Digital marketing orientation shows the strategic inclination of the firm towards using digital channels in its marketing activities [18,26]. Hence, we hypothesise that,
H6.
Knowledge is positively associated with intention.
H7.
Digital marketing capability is positively associated with intention.
H8.
Digital marketing orientation is positively associated with intention.
Environmental antecedents. Competition can motivate MSMEs to adopt digital marketing in response to competitors using digital channels to maintain market visibility and competitive position. Customer power represents the demand-side pressure from customers’ expectations for digital communication and interaction. Both competitive pressure and customer pressure have important environmental influences on adoption [9,19,27,28].
H9.
Competition is positively associated with intention.
H10.
Customer power is positively associated with intention.
Intention and mediation. Adoption intention represents the firm’s willingness to implement digital marketing and provides a link between antecedent conditions and actual adoption. Intention is expected to translate into adoption and to mediate the antecedent–adoption relationships [6,32]. As intention and adoption were measured at the same time, H11 and H12 are tested as associations rather than temporal sequence.
H11.
Adoption intention is positively associated with digital marketing adoption.
H12.
Adoption intention mediates the relationships between the antecedents and adoption.
Configurational expectations. Because fsQCA focuses on combinations of conditions, the case-centered analysis is guided by three propositions rather than variable-level hypotheses; P1: digital marketing adoption is produced by more than one sufficient configuration, showing the principle of equifinality, which means different combinations of conditions can lead to the same outcome. P2: Digital marketing adoption happens when factors work together in combinations, showing conjunctural causation. Here, the factors, instead of operating in isolation, can act in combination to produce the outcome. P3: The configurations sufficient for non-adoption are not the logical negation of those associated with adoption, showing causal asymmetry where the conditions that are leading to an outcome are not necessarily the opposite of the conditions that are leading to its absence.
3. Materials and Methods
3.1. Measurement of Variables
Constructs were measured with established multi-item, five-point Likert scales (1 = strongly disagree to 5 = strongly agree). Digital marketing capability was measured using Wang [16]; digital marketing orientation followed Mahmutović [26]; relative advantage and compatibility were measured using Moore and Benbasat [33]; perceived ease of use followed Davis [20]; trust followed Pavlou and Gefen [22]; knowledge followed Thong [25]; competition was measured using Premkumar and Ramamurthy [27]; customer power followed Wu et al. [28]; perceived financial cost was measured with items adapted from [34]; and intention and adoption were measured using Jelinek et al. [35]. The adoption items measured the extent to which firms used digital marketing in their marketing activities and were answered by all respondents, including non-users. The questionnaire was administered in English. The researchers conducted a pilot study with 67 firm owners to assess item clarity and completion time.
3.2. Sample and Data Collection
The study was conducted in Idukki, Kerala, India, which is characterised by a hilly geographical setting, a mainly rural economy, dominated by micro enterprises, and provides an informative case of the emerging economy rural conditions. Idukki is one of Kerala’s least urbanised districts, with 95.3% rural and 4.7% urban [36]. The study belongs to the same research programme as the earlier study [6] and uses the same core instrument, but the present study targets a different population and has separate data collection. The earlier study included only UDYAM-registered MSMEs, with a sampling frame of 20,284 firms. The present study was not restricted to registered firms: it included firms meeting the Government of India’s MSME size criteria based on investment and turnover, and registration on the UDYAM portal is not required for inclusion. Registration status was not recorded in the survey, so the numbers of registered and unregistered firms in the sample cannot be reported. The study used non-probability referral (snowball) sampling because no sampling frame covers unregistered firms. As the responses were anonymous, we cannot rule out that some registered firms took part in both surveys.
Eligible respondents were owners of firms, managers of firms, and key decision makers. The firms had to meet the MSME size criteria, be based in Idukki, and have been operational for at least one year. Respondents needed basic knowledge of digital marketing to answer perception items meaningfully, but actual use of digital marketing was not required. Data were collected from March 2025 to October 2025 using online forms. Of the final 538 valid cases, 313 were digital marketing users and 225 non-users. An a priori power analysis using G*Power version 3.1.9.7. [37] (multiple regression, f2 = 0.15, α = 0.05, power = 0.95, 18 predictors for adoption: ten antecedents, intention and seven controls) indicated a minimum sample of 213. As the sample was non-probabilistic, the findings describe relations within the sample and should not be interpreted as estimates of district-level prevalence [38]. Table 1 shows the profile of the firms. Location in Table 1 was self-reported for the firm’s business premises (rural, semi-urban or urban) and is not the census classification; hence, the larger share of semi-urban and urban firms (73.8%) shows the concentration of businesses in the towns and market centers of the district instead of the distribution of its population.
Table 1.
Profile of respondents and firms (n = 538).
3.3. Research Methods
A mixed PLS-SEM–fsQCA design was adopted. PLS-SEM using SmartPLS 4 was chosen for the variance-based analysis as it is prediction-based, accommodates complex models, and does not require distributional assumptions. The measurement model and structural model were evaluated using established guidelines [38]. The structural model estimated paths from ten antecedents to adoption intention, adoption intention, and from each antecedent to actual adoption. Seven control variables such as respondent age, gender and education, location, nature of business, number of employees and years of operation were linked to both intention and adoption. Digital marketing orientation was modelled as a single construct measured by 11 items, as its strategic and practice dimensions were not empirically distinct (HTMT = 0.991; Section 4.3), which also rules out a higher-order specification with two separate dimensions [39]. Out-of-sample prediction was done using PLSpredict, and statistical significance was assessed using bootstrapping with 5000 subsamples. Mediation was classified using the typology of Zhao et al. [30].
fsQCA [40] was applied as it represents conjunctural causation directly, represents equifinality directly, permits non-adoption to be analysed separately, and allows causal asymmetry to be tested rather than assumed. As using all ten antecedents would result in 210 = 1024 possible configurations and very limited diversity, the ten antecedents were consolidated into six theoretically coherent conditions (26 = 64 configurations; Table 2). Constructs were grouped when they belonged to the same TOE context and represented the facets of the same underlying condition. As the grouping is conceptual and some constituent constructs have modest correlations (e.g., 0.22–0.30 within technology–use fit), alternative groupings are tested as robustness checks. Technology use fit combines perceived ease of use, compatibility, and trust; these constructs reflect how well the technology fits the user and context of use, including the required effort, compatibility with already existing practices, and platform reliability. Relative advantage remains separate because it concerns expected benefits rather than fit. Organizational knowledge readiness combines knowledge and digital marketing capability, as both represent the firm’s internal resource base. Market pressure combines competition and customer power. Each grouped condition was estimated in SmartPLS as a composite using all items from its constituent constructs, and unstandardised latent variable scores on the 1–5 scale were used as raw measures for all conditions and outcomes. Alternative construct groupings are examined in Section 4.5.4.
Table 2.
Composition of the fsQCA causal conditions.
All scores were calibrated into fuzzy-set membership using Ragin’s direct method, with the 95th percentile: full membership, 50th percentile: crossover point, and 5th percentile: full non-membership [14]. Membership scores of exactly 0.5 were adjusted to 0.501. Non-adoption was defined as the negation of the calibrated adoption set, using the formula: non-adoption membership = 1 − high-adoption membership. A separate truth-table analysis was conducted for non-adoption. Truth tables were formed with a frequency cut-off of 3 cases, raw consistency cut-off of 0.80, and PRI cut-off of 0.70 [41]. The study reported both parsimonious and intermediate solutions, distinguishing core conditions (present in both) from peripheral conditions (present only in the intermediate solution) [29]. Technology use fit, organizational knowledge readiness, digital marketing orientation, market pressure, and relative advantage were expected to contribute to high adoption and high intention when present. Perceived financial cost was expected to contribute when absent, and expectations were reversed for non-adoption. Separate configurational analyses were conducted for high adoption, high adoption intention, and non-adoption.
4. Results
4.1. Digital Marketing Usage Profile (RQ1)
Digital participation is wide but shallow (Table 3). 58.2% of firms use some form of digital marketing, but the usage concentrates in low-cost, easy channels like WhatsApp Business (43.3%) and Instagram/Facebook (33.5%)—and drops sharply for owned and paid channels like own website (20.1%), online marketplaces (13.2%), YouTube/e-mail (13.2%) and Google Ads (9.5%). Among the 313 users, intensity is modest: 12.8% use digital marketing daily, 44.1% spend less than ₹5000 per month and 55.6% target only local customers (Table 3). The divide is therefore less about whether firms are online and more about how far up the channel ladder they climb.
Table 3.
Digital marketing usage and channel penetration.
4.2. Measurement Model
4.2.1. Common Method Bias
Because the data are self-reported, common method bias is a concern in two ways. For Harman’s single-factor test [42], all 58 measurement indicators were entered into an unrotated exploratory factor analysis in JASP, with extraction constrained to one factor. The single factor explained 24.85% of the total variance, below the 50% threshold, and 28 of 58 indicators had factor loadings below 0.40. Higher loadings were concentrated among adoption, orientation, capability, and intention items, which are substantively correlated, and no single method factor dominated the variance. In the full collinearity assessment [43], all construct-level VIFs were below 3.3 (range 1.053–2.315). Hence, common method bias is unlikely to threaten the study’s findings [44].
4.2.2. Reliability and Validity
Reliability and convergent validity were satisfactory (Table 4). Cronbach’s α values ranged from 0.722 (intention) to 0.951 (adoption), composite reliability ranged from 0.844 to 0.962, and all values were above 0.70; average variance extracted (AVE) values ranged from 0.585 (relative advantage) to 0.836 (adoption), all above 0.50. All indicators had loadings above 0.70, except the owner-knowledge item CEO_KNOW (0.597; 95% CI 0.524–0.663), which was retained because its loading was statistically significant; the knowledge construct met reliability and validity thresholds with the item included (CR = 0.861; AVE = 0.611), and owner knowledge is central to the construct in micro-enterprises [38]. Discriminant validity was established using both the Fornell–Larcker criterion [45] and the HTMT ratio [46], with all HTMT values below the 0.85 threshold (maximum 0.772, intention–adoption; Appendix B).
Table 4.
Construct descriptive statistics, reliability, and convergent validity (n = 538).
The composite reliability of adoption (0.962) marginally exceeded the 0.95 guideline [38]. The five adoption items correlated between 0.72 and 0.86 in full sample correlations, but the within-group correlations were only 0.18–0.40 among users and 0.11–0.34 among non-users. The high reliability in the full sample appears to reflect the separation between users, who scored high across items, and non-users, who scored low, rather than semantically redundant wording. Similarly, the indicator VIFs of ADOPTION1 and ADOPTION4 were 5.32 and 5.47, respectively. As removing the most highly correlated item would reduce the composite reliability only to 0.952, all items were retained to preserve content validity.
Table 4 also reports construct means. Relative advantage (M = 3.82), competition (M = 3.98), customer power (M = 3.86), and perceived financial cost (M = 3.84) had means above the scale midpoint, while knowledge (M = 2.53) and digital marketing capability (M = 2.64) are below it. The non-users perceive a clear relative advantage (M = 3.66) but low knowledge (M = 2.06) and capability (M = 2.05) (Appendix B, Table A4). Because referral sampling was used, these levels describe the study sample and should not be generalised to the district.
4.3. Structural Model and Hypothesis Testing
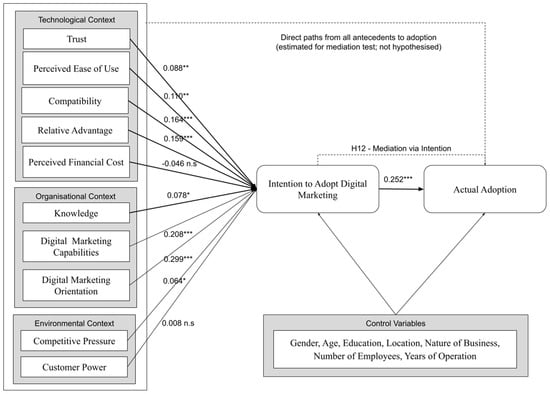
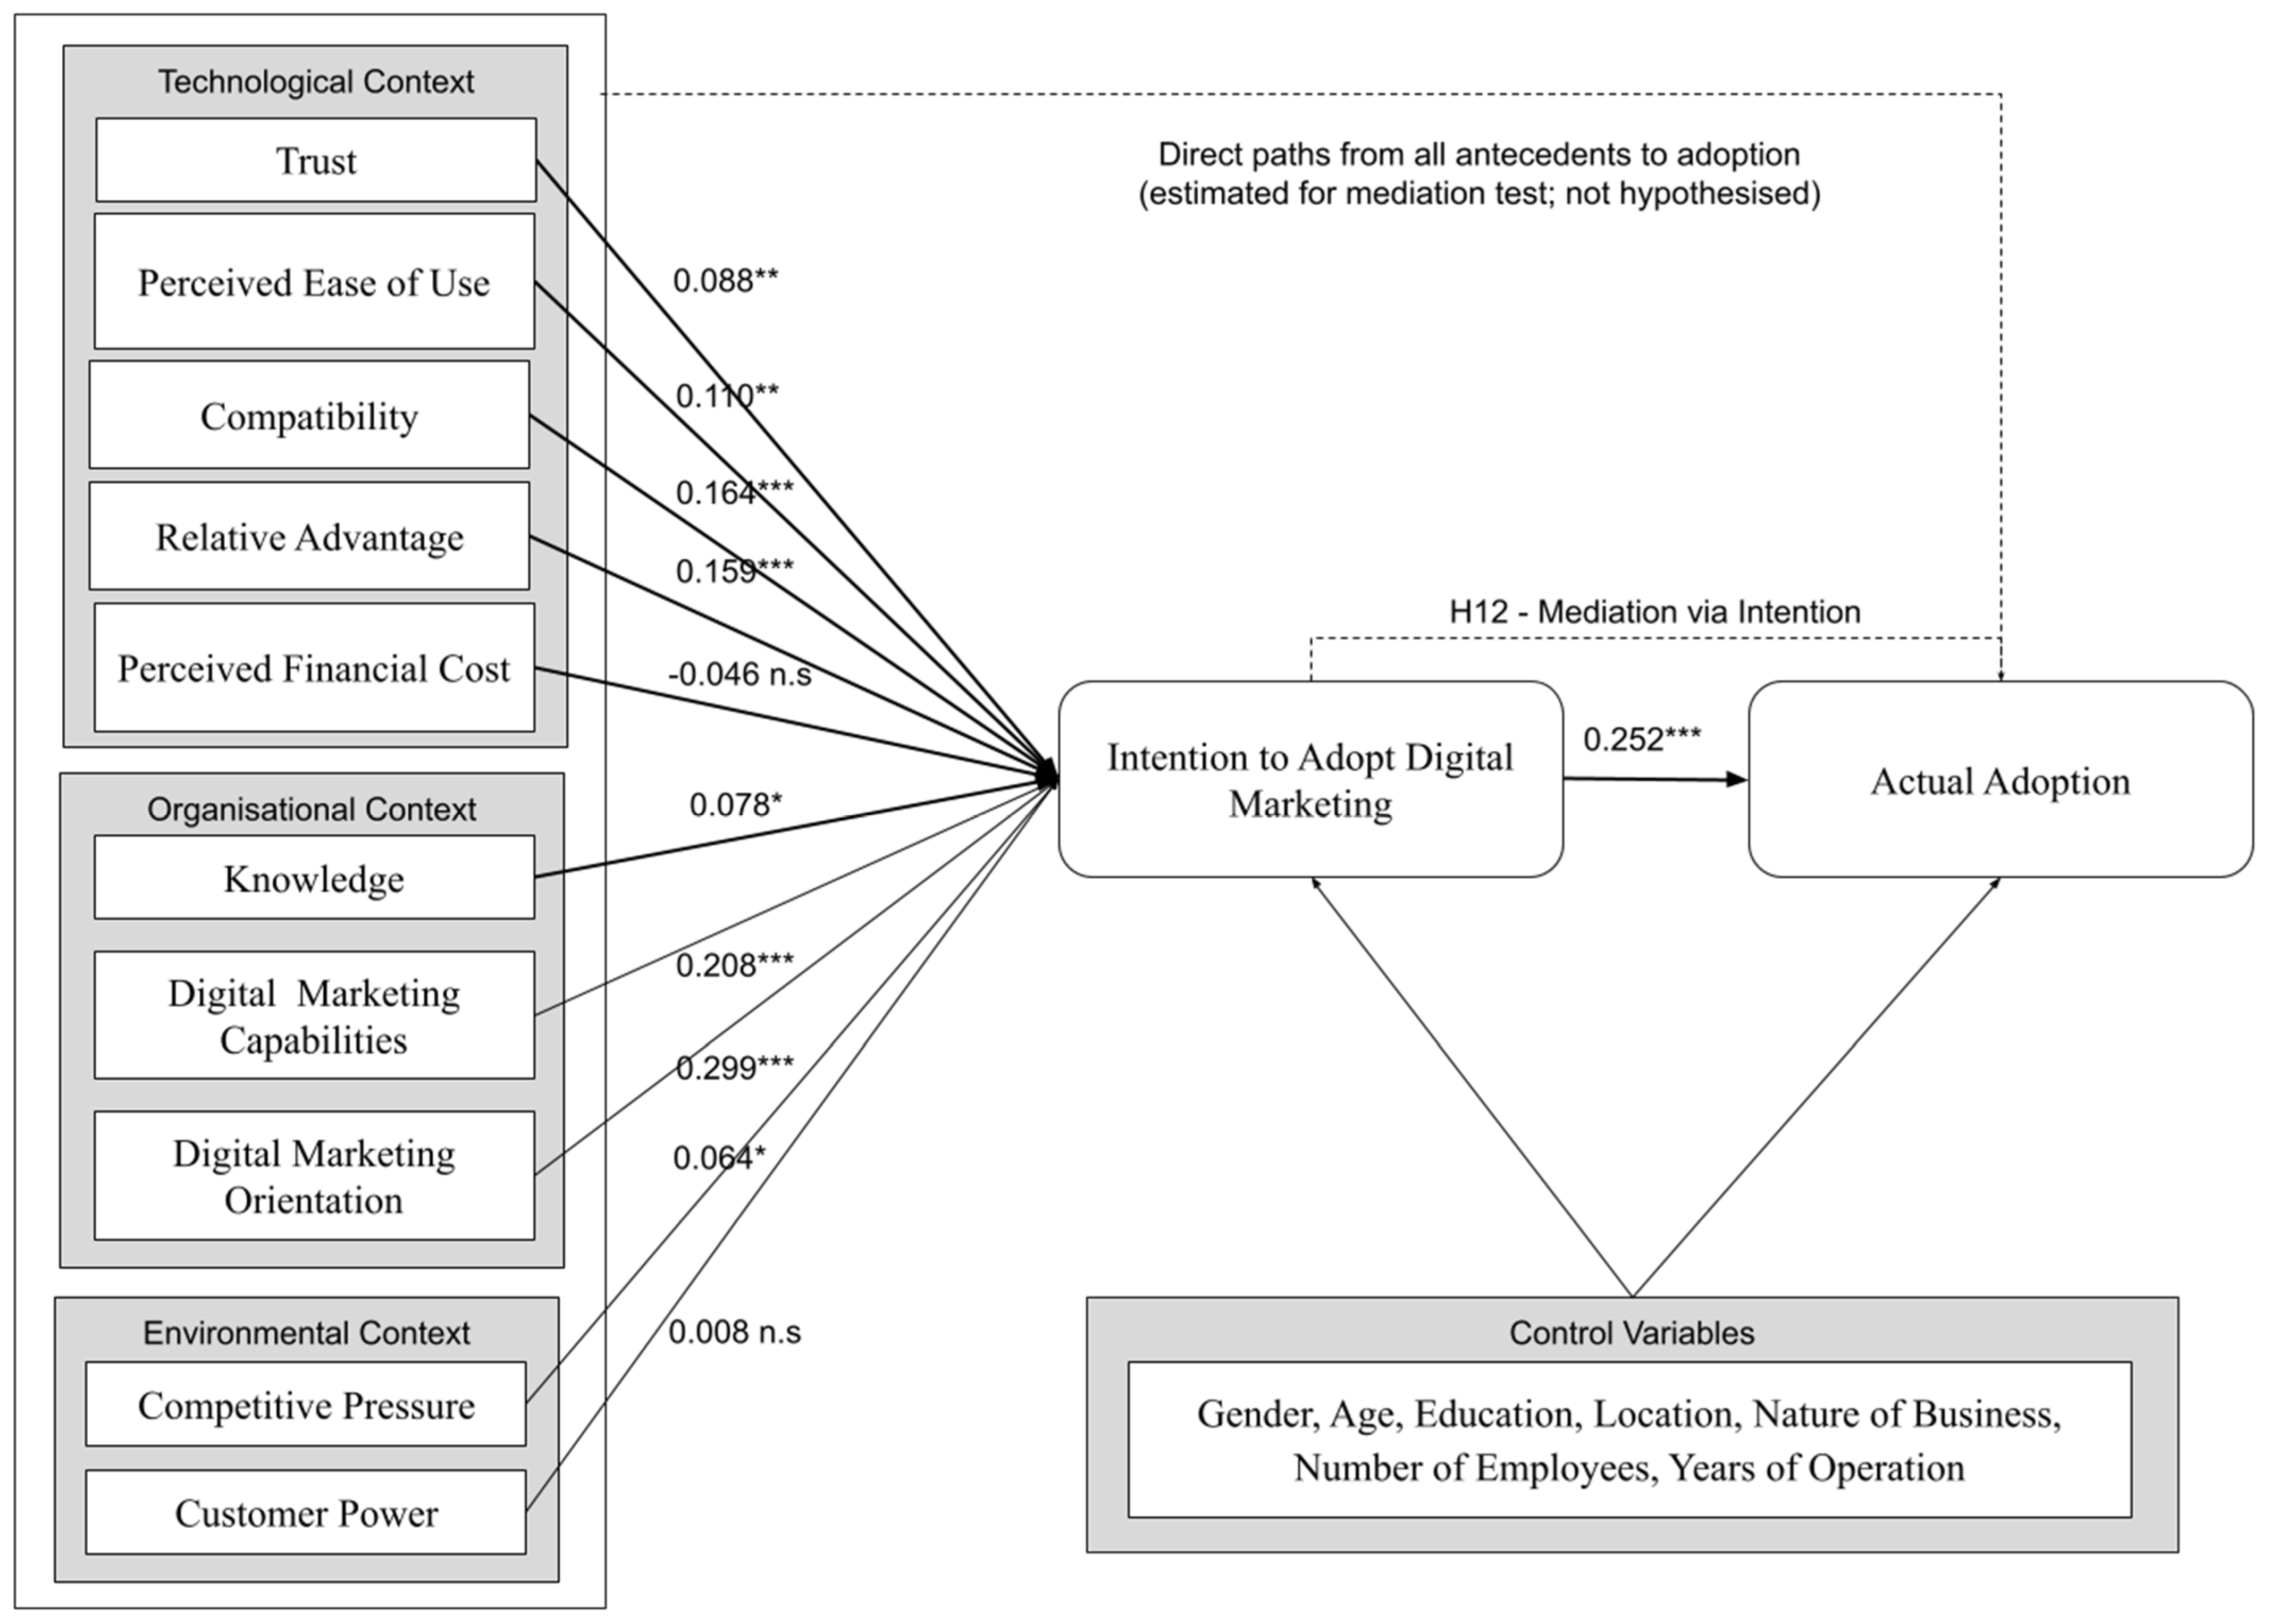
The structural model (Figure 2) showed satisfactory explanatory and predictive power, explaining 55.8% of the variance in adoption intention (R2 = 0.558) and 63.5% in digital marketing adoption (R2 = 0.635); PLSpredict results showed Q2predict of 0.525 (intention) and 0.577 (adoption), both above zero, indicating predictive relevance, and the model SRMR was 0.036. All inner-model VIFs were below 2.3. Path results (5000 bootstrap subsamples) are reported in Table 5. Digital marketing orientation was the strongest antecedent of intention (β = 0.299, p < 0.001), followed by digital marketing capability (β = 0.208), compatibility (β = 0.164), relative advantage (β = 0.159), perceived ease of use (β = 0.110), trust (β = 0.088), knowledge (β = 0.078) and competition (β = 0.064); customer power (β = 0.008, p = 0.805) and perceived financial cost (β = −0.046, p = 0.181) were not significant for digital marketing adoption intention. Intention significantly predicted adoption (β = 0.252, p < 0.001). Beyond their effect through intention, digital marketing capability (β = 0.321), digital marketing orientation (β = 0.225), and knowledge (β = 0.182) had significant positive direct effects on adoption, while customer power (β = −0.078, p = 0.015) and perceived financial cost (β = −0.101, p < 0.001) had significant negative direct effects. The largest effect sizes were digital marketing capability on adoption (f2 = 0.162) and digital marketing orientation on intention (f2 = 0.142). Hence, H1–H4, H6–H9 and H11 were supported, and H5 and H10 were not supported. None of the seven control variables had a statistically significant effect on the outcomes (Appendix C). A robustness check using regression re-estimation with latent variable scores showed that coding the nature of business and location as dummy variables, rather than single numerical codes, changed no structural coefficient by more than 0.007.
Figure 2.
Results of the structural model (standardized path coefficients). Notes: *, **, and *** indicate statistical significance at the 10% (p < 0.10), 5% (p < 0.05), and 1% (p < 0.01) levels, respectively, n.s. = not statistically significant (p ≥ 0.05).
Table 5.
Path coefficients and hypothesis testing (5000 bootstrap subsamples).
The figure shows the paths from the antecedents to adoption intention and from intention to actual adoption. The direct paths from the antecedents to actual adoption (dashed line) are reported in Table 5. The R2 and Q2predict values are reported in Section 4.3.
Robustness: dimensions of digital marketing orientation. The strategic orientation (DMO_S) and practical orientation (DMO_P) were entered as separate constructs, DMO_P was significant (β = 0.231 on intention, p < 0.001; β = 0.182 on adoption, p = 0.001) and DMO_S was not significant (β = 0.075, p = 0.248; β = 0.049, p = 0.368), while all other paths and the R2 values were unchanged (0.559 for adoption intention and 0.636 adoption). However, the two dimensions are not empirically distinct: their HTMT is 0.991 (95% CI 0.974–1.008), and their inner VIFs are approximately 4.8. The separate coefficients mainly reflect the division of shared variance between the two highly similar predictors, and we interpret digital marketing orientation as a single construct (Appendix D).
4.4. Mediation Analysis
Mediation was classified using the Zhao et al. [30] typology (Table 6). Adoption intention fully (indirect-only) mediated the effects of trust, perceived ease of use, compatibility, relative advantage, and competition—their direct effects on adoption were non-significant, and hence, they operate on adoption by shaping adoption intention. Intention complemented and partially mediated the effects of knowledge, digital marketing capability, and digital marketing orientation—as these organizational resources raise intention and, in addition to that, are directly associated with adoption. For customer power and perceived financial cost, the indirect effects were non-significant, while the direct effects were significantly negative (direct-only, non-mediation); hence, their influence bypasses the adoption intention. Mediation was hence established for eight of ten antecedents, and H12 was partially supported. The pattern suggests that perceptual and environmental-pressure factors operate through intention, while cost and customer power are directly associated with adoption.
Table 6.
Direct, indirect, and total effects on adoption and mediation type.
4.5. Fuzzy-Set Qualitative Comparative Analysis (RQ3)
4.5.1. Data Calibration
The six conditions and three outcomes were calibrated into fuzzy membership scores using the direct method with 95th, 50th, and 5th percentiles as anchors for full membership, the crossover, and full non-membership [14]. Calibrated values of exactly 0.5 were adjusted to 0.501. The adoption crossover anchor (3.175) exceeds the highest score among non-users (2.408), so all 225 non-users fall outside the high adoption set, along with 43 users with low use; the full non-membership anchor (1.000) coincides with the scale minimum, shared by 42 non-users. Alternative calibration anchors are examined in Section 4.5.4.
4.5.2. Necessity Analysis
No condition, present or absent, reached the 0.90 consistency benchmark for any outcome (Table 7), and therefore, none of the conditions was individually necessary for the outcomes of digital marketing adoption intention, digital marketing adoption, and non-adoption. Organizational knowledge readiness (0.844) and digital marketing orientation (0.798) were the conditions with the highest consistency scores for high adoption. For non-adoption, absence of organizational knowledge readiness (0.786) and absence of digital marketing orientation (0.751) were the conditions with the highest consistency scores. Organizational knowledge readiness (0.773) and digital marketing orientation (0.760) were the conditions with the highest consistency scores for adoption intention. Neither condition was indispensable for any outcome, providing initial evidence of configurational causation.
Table 7.
Necessity analysis: consistency and coverage of each condition (and its absence) across outcomes.
4.5.3. Configurational Analysis
Out of the 64 configurations, 58 contained at least three cases, leaving only six logical remainders. No easy counterfactuals were available; therefore, the parsimonious and intermediate solutions coincide. All conditions in Table 8, Table 9 and Table 10 are classified as core conditions. For adoption, two equivalent parsimonious models were identified, and the one consistent with the directional expectations is reported.
Table 8.
Configurations sufficient for high digital marketing adoption.
Table 9.
Configurations sufficient for high adoption intention.
Table 10.
Configurations sufficient for non-adoption.
Two configurations were sufficient for high adoption, with solution consistency of 0.905 and solution coverage of 0.530 (Table 8). Both configurations share a core combination of organizational knowledge readiness, digital marketing orientation, and the absence of perceived financial cost. A1 adds technology-use fit, while A2 adds market pressure and relative advantage. A2 contributes little unique coverage (0.031), showing substantial overlap with A1. The configurations are best interpreted as a shared organizational and cost foundation with two possible complementary pathways, rather than two distinct firm types. The findings support P1 (equifinality) and P2 (conjunctural causation).
Five configurations were identified as sufficient for high adoption intention with solution consistency of 0.905 and solution coverage of 0.677 (Table 9). The absence of perceived financial cost appears in two intention configurations (I3 and I5), suggesting it can matter in specific combinations, even though it has no significant net effect on intention. Configuration I5 is sensitive to the truth-table thresholds: with a frequency cut-off of four, a borderline row (three cases; PRI = 0.709) is excluded, and I5 also includes market pressure (Section 4.5.4)
Four configurations were identified as sufficient for non-adoption with a solution consistency of 0.888 and solution coverage of 0.740 (Table 10). The joint absence of organizational knowledge readiness and digital marketing orientation is sufficient for non-adoption and has the highest coverage (raw 0.645; unique 0.184). Perceived financial cost contributes to non-adoption only in combination with other absent conditions (N2 and N4). The absence of market pressure contributes to non-adoption alongside three other absent conditions (N3).
Comparing Table 8 and Table 10 confirms causal asymmetry (P3), but the difference lies in how conditions combine, rather than which conditions appear. By De Morgan’s law, the negation of the adoption solution would suggest that the absence of organizational knowledge readiness, the absence of digital marketing orientation, or the presence of perceived financial cost is sufficient for non-adoption. The truth table does not support these individual conditions as sufficient, as 42 firms with low knowledge readiness but higher digital marketing orientation are not consistently linked with non-adoption, and perceived financial cost contributes to non-adoption only along with other deficits. Adoption requires four or five conditions to combine, while non-adoption can result from the joint absence of just two organizational conditions.
4.5.4. Robustness Tests
Results were re-estimated under seven alternative specifications (Table 11), covering stricter thresholds, alternative condition groupings and aggregation methods, and alternative calibration anchors. Organizational knowledge readiness appeared in every adoption configuration across all specifications. Both organizational knowledge readiness and digital marketing orientation appeared together in all but one specification. Under minimum aggregation, one of three adoption paths combined knowledge readiness with technology-use fit, market pressure, relative advantage, and low cost, but not orientation. The joint absence of organizational knowledge readiness and digital marketing orientation featured in non-adoption across all specifications and was independently sufficient in six. When market pressure was split into competition and customer power, A2 required both pressures to be present. Therefore, a high market pressure represents high levels of both. The seven-condition model was not selected as the main analysis because 49 of 128 truth table rows were logical remainders, and the parsimonious solution for intention produced twelve equivalent models.
Table 11.
Robustness of the configurational results.
4.5.5. Intention as a Condition for Adoption
To examine the relationship between intention and adoption configurationally, intention was included as a condition (Table 12). High intention was not a necessary condition for high adoption (consistency = 0.840 < 0.90) and also not a sufficient condition (consistency = 0.730; PRI = 0.599) for high adoption: Of the 289 firms with high intention, 82 were not members of the high adoption set. Contrastingly, low intention was highly consistent with non-adoption (consistency = 0.845; PRI = 0.774). As the intention and adoption were measured simultaneously, these findings describe the associations within the sample instead of a temporal sequence.
Table 12.
Adoption intention as a condition for adoption.
5. Discussion
Integrating the variance-based analysis and configurational analysis using the same 538 firms provided a layered understanding of digital marketing adoption in a predominantly rural emerging economy district. The two analytical lenses converge on the importance of the organizational factors, as digital marketing orientation is the strongest net driver of adoption intention, while digital marketing capability is the strongest net driver of adoption. Also, organizational knowledge readiness and digital marketing orientation recur as the core conditions across every adoption configuration and are jointly absent in the dominant non-adoption configuration. The configurational analysis adds structural insights that cannot be identified through net effects alone.
The usage profile places the digital divide along the channel ladder instead of simply at the point of access [4,5]. Most users are online mainly through free channels, and penetration declines substantially beyond them; among users, digital marketing spending and usage frequency are low. Hence, inclusion metrics based only on any digital marketing use may overstate genuine participation. A key practical question is what enables firms to progress from basic digital presence to owned and paid digital marketing channels. Since adoption was measured as the extent of use instead of separate shallow and deep-adoption outcomes, this question remains for future research.
The mediation results showed that perceptual and pressure-related factors such as trust, perceived ease of use, compatibility, relative advantage, and competition are associated with adoption only through adoption intention, whereas organizational resources such as knowledge, digital marketing capability, and digital marketing orientation are associated with both intention and adoption directly. Awareness-based exposure to digital marketing benefits may have limited impact when the organizational foundation is lacking, and this proposition aligns with resource and capability perspectives on small firm digital transformation [16,17,26]. However, this proposition was not directly tested in this study.
Customer power was positively correlated with adoption (r = 0.17, p < 0.001) but, after controlling for intention and other antecedents, customer power showed a small negative association with adoption (β = −0.078). This sign reversal suggests that firms facing powerful customers also tend to have stronger digital marketing capability, orientation, and intention, explaining the positive bivariate association. Holding these factors constant, greater customer power is associated with slightly lower adoption, which can be explained by the relationship-based local markets, where powerful customers may prefer face-to-face or telephone interactions and expect price concessions, reducing the anticipated benefits of shifting these relationships to digital channels [28]. 55.6% of digital marketing users serve only local customers. As the effect is small and depends on the set of control variables, this explanation is presented as a future research proposition instead of an established finding.
The configurational findings extend the variance-based results in three ways. First, two configurations lead to high adoption; both share an organizational and cost foundation but differ in their complementary conditions: technology use fit, or market pressure combined with relative advantage. Second, intention is neither necessary nor sufficient for adoption, while low intention is highly consistent with non-adoption. Even though most high adopters report high intention, intention alone does not guarantee actual use, which is in line with the intention-behaviour gap [32]. Third, non-adoption is not simply the negation of adoption. The joint absence of organisational knowledge readiness and digital marketing orientation is sufficient for non-adoption, regardless of technological perceptions or market pressure, while the absence of either condition alone is not. Symmetric estimators that infer the causes of non-adoption by negating the causes of adoption cannot capture this configurational pattern.
Perceived financial cost shows why the two analytical methods are complementary. For adoption, both PLS-SEM and fsQCA show that perceived financial cost acts as a barrier. It has a negative direct effect on adoption, and its absence features in both high-adoption configurations. When it comes to adoption intention, the methods differ in their findings. Perceived financial cost has no significant net effect on intention, but its absence appears in two of the five intention configurations. For non-adoption, perceived financial cost contributes to non-adoption only when combined with other organizational or contextual deficits. Hence, perceived financial cost can be understood as an INUS-type condition [47], which is causally active within combinations, and is not decisive on its own. A possible implication is that cost-only interventions may be insufficient to promote digital marketing adoption, but they can be effective when combined with strengthening the organizational core, especially organizational knowledge readiness and digital marketing orientation.
Theoretically, the study contributes a dual symmetric–asymmetric perspective on MSME digital marketing adoption in emerging markets. For the TOE framework, the results suggest that the technological, organizational, and environmental contexts do not operate as additive or compensatory factors. Organizational factors act as a gateway since the joint absence of organizational knowledge readiness and digital marketing orientation is sufficient for non-adoption. Technological perceptions, market pressure, and cost become relevant only in combination with it. The study positions complexity theory as a productive complement to the TOE framework and shows how PLS-SEM and fsQCA can be applied to the same dataset and interpreted together [13,15]. The two analysis approaches converge on the importance of the organizational factors while diverging in showing the combinatorial role of perceived financial cost and the structural nature of non-adoption.
6. Conclusions
6.1. Findings
The study used a combined PLS-SEM and fsQCA design based on data from 538 MSMEs in a predominantly rural district, showing that digital marketing adoption is wide but shallow. Digital marketing orientation is the dominant net driver of adoption intention, while digital marketing capability is the dominant driver of digital marketing adoption. Adoption intention mediates the effects of eight out of ten antecedents. Also, digital marketing adoption is configurational and causally asymmetric. Two equifinal pathways based on organisational knowledge readiness, digital marketing orientation and low perceived financial cost lead to digital marketing adoption; five pathways lead to adoption intention, and four pathways lead to non-adoption, the dominant one being the joint absence of the two organisational conditions. High intention is neither necessary nor sufficient for adoption. Perceived financial cost matters for intention only in combination with other conditions. Hence, the findings provide evidence of equifinality, conjunctural causation and causal asymmetry.
6.2. Implications
Findings suggest possible priorities for support agencies and policymakers, instead of proven interventions. Organizational knowledge readiness and digital marketing orientation appear in every adoption configuration, while their joint absence is the dominant pathway to non-adoption. Non-users already perceive the relative advantages of digital marketing but report low knowledge and capability. Practical training in content creation, digital advertising, and lead handling may therefore be more effective than awareness campaigns alone. Capability-building initiatives should be combined with support for developing a strategic digital marketing orientation. Since perceived financial cost matters only in combination with other conditions, measures such as onboarding support or advertising credits may be more useful when bundled with capability development. As high intention does not reliably translate into adoption, programmes should be evaluated based on realised and sustained use instead of expressed intention alone. These implications are propositions that need evaluation using intervention-based or longitudinal data. The study also provides a replicable template for combining symmetric and asymmetric analysis, which can be applied in emerging market e-commerce research.
6.3. Limitations and Future Directions
The study has four main limitations. First, the data are cross-sectional and self-reported. Intention and adoption were measured simultaneously, when most firms already used digital marketing. The estimated paths, including adoption intention, should be interpreted as associations instead of causal or temporal effects. Future research can focus on longitudinal designs and behaviorally measured adoption. Second, because the sample was not restricted to registered MSMEs and no sampling frame covers unregistered firms, referral sampling was used with basic digital marketing knowledge as an eligibility criterion. Relationships and configurations may differ in populations containing more firms unaware of digital marketing. As the study was done in a predominantly rural, hilly district of Kerala, a state with high literacy and mobile connectivity, the findings may not generalise to other rural districts, urban MSMEs, or India as a whole, and replication with probability samples across regions is needed.
Third, the consolidation of ten antecedents into six conditions made the truth table more manageable but may have concealed important distinctions. The robustness checks indicated that the core findings hold under alternative groupings, but using large or sector-specific samples to examine more finely differentiated conditions is needed.
Fourth, adoption was measured as the extent of digital marketing use; shallow and deep adoption were not modelled as separate outcomes. The adoption scale mainly separates users from non-users. Future research can focus on modelling adoption depth, including the use of owned and paid channels, as a separate outcome and examine whether non-adoption follows simpler configurations than adoption in other contexts within emerging markets.
Author Contributions
Conceptualization, methodology, data curation, investigation, formal analysis, and writing—original draft, B.X.; writing—review and editing, all authors; supervision, A.V. and N.K. All authors have read and agreed to the published version of the manuscript.
Funding
This research received no external funding.
Institutional Review Board Statement
The Institutional Ethics Committee of Marian College Kuttikkanam Autonomous reviewed the study and exempted it from full ethical review because it used fully anonymous questionnaires and collected no personally identifiable or sensitive data.
Informed Consent Statement
All respondents provided informed consent; questionnaire submission indicated voluntary agreement to participate.
Data Availability Statement
The data supporting the findings of this study are available from the corresponding author on reasonable request.
Conflicts of Interest
The authors declare no conflicts of interest.
Abbreviations
The following abbreviations are used in this manuscript:
| MSME | Micro, Small and Medium Enterprise |
| TOE | Technology–Organization–Environment |
| TAM | Technology Acceptance Model |
| DOI | Diffusion of Innovations |
| PLS-SEM | Partial Least Squares Structural Equation Modeling |
| fsQCA | Fuzzy-Set Qualitative Comparative Analysis |
| DMO | Digital Marketing Orientation |
| DMC | Digital Marketing Capability |
| PEOU | Perceived Ease of Use |
| PFC | Perceived Financial Cost |
| RA | Relative Advantage |
| AVE | Average Variance Extracted |
| PRI | Proportional Reduction in Inconsistency |
| HTMT | Heterotrait–Monotrait Ratio |
| TUF | Technology–Use Fit |
| OKR | Organisational Knowledge Readiness |
| MP | Market Pressure |
Appendix A
Table A1 lists all measurement items with their wording, sources, outer loadings, bootstrap confidence intervals, and indicator VIFs. All items were rated on five-point scales from 1 = strongly disagree to 5 = strongly agree, except CEO_KNOW (1 = very poor to 5 = very good) and DMC1–DMC5, which asked how well the enterprise performs relative to its major competitors (1 = very poor to 5 = excellent). DMO_S1–DMO_S5 are the strategic-orientation items, and DMO_P1–DMO_P6 are the planning-and-analytics items of digital marketing orientation.
Table A1.
Measurement items and their wording, outer loadings (95% bootstrap CI), and indicator VIFs.
Appendix B
Table A2 and Table A3 report the discriminant validity assessment. Table A4 compares the construct means of users and non-users.
Table A2.
Fornell–Larcker criterion.
Table A3.
Heterotrait–monotrait ratio (HTMT).
Table A4.
Construct means of users and non-users.
Appendix C
Table A5.
Effects of the control variables.
Appendix D
Table A6.
Robustness check with the two dimensions of digital marketing orientation entered separately.
References
- Dwivedi, Y.K.; Ismagilova, E.; Hughes, D.L.; Carlson, J.; Filieri, R.; Jacobson, J.; Jain, V.; Karjaluoto, H.; Kefi, H.; Krishen, A.S.; et al. Setting the Future of Digital and Social Media Marketing Research: Perspectives and Research Propositions. Int. J. Inf. Manag. 2021, 59, 102168. [Google Scholar] [CrossRef] [Scilit]
- Eze, S.C.; Chinedu-Eze, V.C.; Awa, H.O.; Alharthi, R.H.E. Factors Stimulating Value Micro-Businesses Attribute to Digital Marketing Technology (DMT) Adoption. PLoS ONE 2021, 16, e0260145. [Google Scholar] [CrossRef] [Scilit]
- Chatterjee, S.; Chaudhuri, R.; Sakka, G.; Grandhi, B.; Galati, A.; Siachou, E.; Vrontis, D. Adoption of Social Media Marketing for Sustainable Business Growth of SMEs in Emerging Economies: The Moderating Role of Leadership Support. Sustainability 2021, 13, 12134. [Google Scholar] [CrossRef] [Scilit]
- Kilinc-Ata, N.; Al-Fori, A.M. FinTech investment, geopolitical-economic uncertainty, and CO2 emissions in low-and middle-income countries: Evidence from dynamic panel models. J. Risk Financ. Manag. 2026, 19, 362. [Google Scholar] [CrossRef] [Scilit]
- van Deursen, A.J.A.M.; van Dijk, J.A.G.M. The Digital Divide Shifts to Differences in Usage. New Media Soc. 2014, 16, 507–526. [Google Scholar] [CrossRef] [Scilit]
- Xavier, B.; Vanitha, A. What Drives Digital Marketing Adoption in Resource-Constrained MSMEs? Evidence Using a TOE-Led Integrative Framework. Int. Rev. Manag. Mark. 2025, 16, 187–198. [Google Scholar] [CrossRef] [Scilit]
- Tornatzky, L.G.; Fleischer, M. The Processes of Technological Innovation; Lexington Books: Lexington, MA, USA, 1990. [Google Scholar]
- Ta, V.A.; Lin, C.-Y. Exploring the Determinants of Digital Transformation Adoption for SMEs in an Emerging Economy. Sustainability 2023, 15, 7093. [Google Scholar] [CrossRef] [Scilit]
- Ali Abbasi, G.; Abdul Rahim, N.F.; Wu, H.; Iranmanesh, M.; Keong, B.N.C. Determinants of SME’s Social Media Marketing Adoption: Competitive Industry as a Moderator. Sage Open 2022, 12, 21582440211067220. [Google Scholar] [CrossRef] [Scilit]
- Maduku, D.K.; Mpinganjira, M.; Duh, H. Understanding Mobile Marketing Adoption Intention by South African SMEs: A Multi-Perspective Framework. Int. J. Inf. Manag. 2016, 36, 711–723. [Google Scholar] [CrossRef] [Scilit]
- Woodside, A.G. Moving beyond Multiple Regression Analysis to Algorithms: Calling for Adoption of a Paradigm Shift from Symmetric to Asymmetric Thinking in Data Analysis and Crafting Theory. J. Bus. Res. 2013, 66, 463–472. [Google Scholar] [CrossRef] [Scilit]
- Misangyi, V.F.; Greckhamer, T.; Furnari, S.; Fiss, P.C.; Crilly, D.; Aguilera, R. Embracing Causal Complexity: The Emergence of a Neo-Configurational Perspective. J. Manag. 2017, 43, 255–282. [Google Scholar] [CrossRef] [Scilit]
- Rasoolimanesh, S.M.; Ringle, C.M.; Sarstedt, M.; Olya, H. The Combined Use of Symmetric and Asymmetric Approaches: Partial Least Squares-Structural Equation Modeling and Fuzzy-Set Qualitative Comparative Analysis. Int. J. Contemp. Hosp. Manag. 2021, 33, 1571–1592. [Google Scholar] [CrossRef] [Scilit]
- Pappas, I.O.; Woodside, A.G. Fuzzy-Set Qualitative Comparative Analysis (FsQCA): Guidelines for Research Practice in Information Systems and Marketing. Int. J. Inf. Manag. 2021, 58, 102310. [Google Scholar] [CrossRef] [Scilit]
- Chen, M.; Wang, H.; Liang, Y.; Zhang, G. Net and Configurational Effects of Determinants on Cloud Computing Adoption by SMEs under Cloud Promotion Policy Using PLS-SEM and FsQCA. J. Innov. Knowl. 2023, 8, 100388. [Google Scholar] [CrossRef] [Scilit]
- Wang, F. Digital Marketing Capabilities in International Firms: A Relational Perspective. Int. Mark. Rev. 2020, 37, 559–577. [Google Scholar] [CrossRef] [Scilit]
- Rupeika-Apoga, R.; Petrovska, K.; Bule, L. The Effect of Digital Orientation and Digital Capability on Digital Transformation of SMEs during the COVID-19 Pandemic. J. Theor. Appl. Electron. Commer. Res. 2022, 17, 669–685. [Google Scholar] [CrossRef] [Scilit]
- Hokmabadi, H.; Rezvani, S.M.H.S.; de Matos, C.A. Business Resilience for Small and Medium Enterprises and Startups by Digital Transformation and the Role of Marketing Capabilities—A Systematic Review. Systems 2024, 12, 220. [Google Scholar] [CrossRef] [Scilit]
- Xavier, B.; Vanitha, A.; George, A. A Conceptual Model for the Adoption of Digital Marketing by Micro, Small, and Medium Enterprises. IFIP Adv. Inf. Commun. Technol. 2024, 697, 410–420. [Google Scholar] [CrossRef] [Scilit]
- Davis, F.D. Perceived Usefulness, Perceived Ease of Use, and User Acceptance of Information Technology. MIS Q. 1989, 13, 319–340. [Google Scholar] [CrossRef] [Scilit]
- Rogers, E.M. Diffusion of Innovations, 5th ed.; Free Press: New York, NY, USA, 2003. [Google Scholar]
- Pavlou, P.A.; Gefen, D. Building Effective Online Marketplaces with Institution-Based Trust. Inf. Syst. Res. 2004, 15, 37–59. [Google Scholar] [CrossRef] [Scilit]
- Gefen, D.; Karahanna, E.; Straub, D.W. Trust and TAM in Online Shopping: An Integrated Model. MIS Q. 2003, 27, 51–90. [Google Scholar] [CrossRef] [Scilit]
- Kilinc, N.; Proskuryakova, L.N. Assessing the influence of innovation and digitalization on carbon footprint across the Middle East, North Africa, and South Caucasus regions. Nat. Resour. Forum 2026. [Google Scholar] [CrossRef] [Scilit]
- Kilinc, N.; Rahman, M.P. Digitalization and financial development contribution to the green energy transition in Malaysia: Findings from the BARDL approach. Nat. Resour. Forum 2025, 49, 2775–2793. [Google Scholar] [CrossRef] [Scilit]
- Mahmutović, K. Development and Validation of the Scale for Measuring Digital Marketing Orientation in the Hotel Industry. Ekon. Vjesn. 2021, 34, 115–129. [Google Scholar] [CrossRef] [Scilit]
- Premkumar, G.; Ramamurthy, K. The Role of Interorganizational and Organizational Factors on the Decision Mode for Adoption of Interorganizational Systems. Decis. Sci. 1995, 26, 303–336. [Google Scholar] [CrossRef] [Scilit]
- Wu, F.; Mahajan, V.; Balasubramanian, S. An Analysis of E-Business Adoption and Its Impact on Business Performance. J. Acad. Mark. Sci. 2003, 31, 425–447. [Google Scholar] [CrossRef] [Scilit]
- Fiss, P.C. Building Better Causal Theories: A Fuzzy Set Approach to Typologies in Organization Research. Acad. Manag. J. 2011, 54, 393–420. [Google Scholar] [CrossRef] [Scilit]
- Zhao, X.; Lynch, J.G.; Chen, Q. Reconsidering Baron and Kenny: Myths and Truths about Mediation Analysis. J. Consum. Res. 2010, 37, 197–206. [Google Scholar] [CrossRef] [Scilit]
- Attewell, P. Technology Diffusion and Organizational Learning: The Case of Business Computing. Organ. Sci. 1992, 3, 1–19. [Google Scholar] [CrossRef] [Scilit]
- Sheeran, P.; Webb, T.L. The Intention–Behavior Gap. Soc. Personal. Psychol. Compass 2016, 10, 503–518. [Google Scholar] [CrossRef] [Scilit]
- Kilinc, N.; Ata, R. The place and role of digital twin applications: Directions for energy and education sector. In Transforming Industry Using Digital Twin Technology; Springer: Cham, Switzerland, 2024; pp. 45–57. [Google Scholar] [CrossRef] [Scilit]
- Tiwari, P.; Tiwari, S. Integration of Technology Acceptance Model with Perceived Risk, Perceived Trust and Perceived Cost: Customer’s Adoption of M-Banking. Int. J. Emerg. Technol. 2020, 11, 447–452. [Google Scholar]
- Jelinek, R.; Ahearne, M.; Mathieu, J.; Schillewaert, N. A Longitudinal Examination of Individual, Organizational, and Contextual Factors on Sales Technology Adoption and Job Performance. J. Mark. Theory Pract. 2006, 14, 7–23. [Google Scholar] [CrossRef] [Scilit]
- Department of Economics and Statistics, Government of Kerala. Panchayat Level Statistics 2011: Idukki District. Available online: https://ecostat.kerala.gov.in/publication-detail/panchayat-level-statistics-2011-idukki-district (accessed on 20 October 2026).
- Faul, F.; Erdfelder, E.; Buchner, A.; Lang, A.-G. Statistical Power Analyses Using G*Power 3.1: Tests for Correlation and Regression Analyses. Behav. Res. Methods 2009, 41, 1149–1160. [Google Scholar] [CrossRef] [Scilit]
- Hair, J.F.; Risher, J.J.; Sarstedt, M.; Ringle, C.M. When to Use and How to Report the Results of PLS-SEM. Eur. Bus. Rev. 2019, 31, 2–24. [Google Scholar] [CrossRef] [Scilit]
- Sarstedt, M.; Hair, J.F.; Cheah, J.H.; Becker, J.M.; Ringle, C.M. How to Specify, Estimate, and Validate Higher-Order Constructs in PLS-SEM. Australas. Mark. J. 2019, 27, 197–211. [Google Scholar] [CrossRef] [Scilit]
- Ragin, C.C. Redesigning Social Inquiry: Fuzzy Sets and Beyond; University of Chicago Press: Chicago, IL, USA, 2008. [Google Scholar]
- Greckhamer, T.; Furnari, S.; Fiss, P.C.; Aguilera, R.V. Studying Configurations with Qualitative Comparative Analysis: Best Practices in Strategy and Organization Research. Strateg. Organ. 2018, 16, 482–495. [Google Scholar] [CrossRef] [Scilit]
- Podsakoff, P.M.; MacKenzie, S.B.; Lee, J.Y.; Podsakoff, N.P. Common Method Biases in Behavioral Research: A Critical Review of the Literature and Recommended Remedies. J. Appl. Psychol. 2003, 88, 879–903. [Google Scholar] [CrossRef] [Scilit]
- Kock, N. Common Method Bias in PLS-SEM: A Full Collinearity Assessment Approach. Int. J. E-Collab. 2015, 11, 1–10. [Google Scholar] [CrossRef] [Scilit]
- Kock, F.; Berbekova, A.; Assaf, A.G. Understanding and Managing the Threat of Common Method Bias: Detection, Prevention and Control. Tour. Manag. 2021, 86, 104330. [Google Scholar] [CrossRef] [Scilit]
- Fornell, C.; Larcker, D.F. Evaluating Structural Equation Models with Unobservable Variables and Measurement Error. J. Mark. Res. 1981, 18, 39–50. [Google Scholar] [CrossRef] [Scilit]
- Henseler, J.; Ringle, C.M.; Sarstedt, M. A New Criterion for Assessing Discriminant Validity in Variance-Based Structural Equation Modeling. J. Acad. Mark. Sci. 2015, 43, 115–135. [Google Scholar] [CrossRef] [Scilit]
- Mackie, J.L. Causes and Conditions. Am. Philos. Q. 1965, 2, 245–264. [Google Scholar]

Disclaimer/Publisher’s Note: The statements, opinions and data contained in all publications are solely those of the individual author(s) and contributor(s) and not of MDPI and/or the editor(s). MDPI and/or the editor(s) disclaim responsibility for any injury to people or property resulting from any ideas, methods, instructions or products referred to in the content. |
© 2026 by the authors. Licensee MDPI, Basel, Switzerland. This article is an open access article distributed under the terms and conditions of the Creative Commons Attribution (CC BY) license.