


Abstract
Sustainability has become central to digital commerce research, yet that literature is rarely confronted with independent evidence of what the public actually attends to. This study pairs two analyses for the Republic of Korea. Analysis 1 is a PRISMA-guided review that screens 700 records against a three-axis Boolean criterion and retains 303 studies published between 2022 and 2026, which are then examined as a keyword co-occurrence network in UCINET. Analysis 2 maps public attention using anchored search-interest data from Naver DataLab and Google Trends, embedding a common reference term in every request so that interest levels become comparable across keyword groups—a correction the search-trend literature has largely neglected. Green products and purchase behaviour dominate the corpus at 29.0%, while platform governance accounts for only 3.6% of studies meeting an eligibility criterion that itself requires perception or behaviour vocabulary, so this figure bounds rather than estimates the governance share of the wider field; manual validation of a stratified sample (Cohen’s κ = 0.59 between coders, rule accuracy 62%) places the governance theme at 2.2% and the greenwashing theme at 1.7% of the corpus, leaving both credibility-related themes together at about 4% against a quarter for green products. Fourteen subdomain keywords co-occur with one another a mean of 1.40 times but with the four most central keywords a mean of 12.6 times; a randomisation model holding keyword frequencies fixed reproduces most of that gap, but subdomain pairs still co-occur less often than chance (p = 0.003) and 35 of 91 pairs never co-occur against 20 expected (p < 0.001). Sustainability-related search interest reaches only 0.7–4.1% of the secondhand-trading anchor term, and once the anchor removes the common denominator, aspirational expressions contract by 39–63% while greenwashing holds its share unchanged. Greenwashing is the only expression without a significant monotonic trend (Mann–Kendall p = 0.49); the differential holds under an alternative anchor, though the absolute magnitude does not. Scholarly attention expands and reorganises while public search attention contracts.
1. Introduction
Digital commerce has absorbed the sustainability agenda with remarkable speed. Platforms display carbon labels, marketplaces promote resale and refurbishment, and livestream sellers narrate provenance in real time. The commercial footprint of this shift is measurable: across roughly 600,000 product lines in 32 consumer categories, items carrying environmental, social or governance claims grew about 28% cumulatively between 2017 and mid-2022 against about 20% for items without them, and accounted for 56% of all category growth over the period [1]. Within research, a parallel expansion has occurred: research linking electronic commerce to environmental and ethical consumption has grown from a peripheral concern into a substantial literature spanning marketing, information systems, and environmental social science [2,3]. Yet the relationship between this scholarly expansion and the public it purports to describe remains largely unexamined. We know what researchers study; we know far less about whether public attention moves in the same direction, at the same time, and toward the same objects.
This gap matters for three reasons specific to the present moment. First, sustainability claims in digital commerce are increasingly made in transient, weakly documented formats—spoken assertions in livestreams, ephemeral badges on product pages—so the informational environment in which consumers form judgements is deteriorating even as the volume of claims increases. Second, the regulatory apparatus governing such claims is being assembled now, which provides evidence for where public attention concentrates a narrow window of policy relevance. Third, the field’s reviews have proliferated without a corresponding effort to validate scholarly framing against independent behavioural measures, leaving open the possibility that the literature elaborates distinctions the public does not make.
Existing reviews offer limited purchase on these questions. They are typically bound to a single product category, technology, or database, and they synthesise scholarship against scholarship. The pattern is consistent across the available syntheses. Rita and Ramos [2] map consumer behaviour and sustainability in e-commerce from 104 Scopus-indexed articles; Zhang [3] codes 58 articles against a fixed sustainability-transitions frame; and the remaining reviews are bounded by a single logistical function or product category—sustainable e-commerce logistics [4], urban last-mile delivery [5], and e-grocery energy use, which rests on twelve primary studies [6]. Bălan [7] reviews retail engagement with sustainable consumption but draws mostly on brick-and-mortar settings, and Shafi et al. [8] screen 51 Scopus records to 30. Seven of these seven reviews rely on a single database, and none reports a measure of public behaviour. Even the most rigorous cannot say whether the themes they identify correspond to anything in public behaviour, because they contain no behavioural measure. Conversely, the few studies that use search-trend data in commerce research have generally treated search-interest indices as comparable across separately executed queries, which they are not: search platforms normalise each query independently, so a low-volume term and a high-volume term both peak at the index maximum [9]. Comparisons built on such data are, strictly speaking, uninterpretable.
The present study responds to both limitations. It conducts a PRISMA-guided structured review of the 2022–2026 literature—PRISMA, the Preferred Reporting Items for Systematic Reviews and Meta-Analyses, is the reporting standard that requires every record identified, screened, excluded and included to be counted and justified in a published flow diagram [10]—using an explicit three-axis Boolean criterion applied to titles and abstracts rather than relying on database subject tags, and it treats the resulting corpus not only as a set of coded records but as a semantic network whose structure is analysed through centrality measures and k-core decomposition. It then pairs that review with an anchored search-interest landscape in which a common reference term is embedded in every query so that interest levels are genuinely comparable. The two analyses are triangulated: the thematic composition, semantic structure, and temporal dynamics of the literature (the supply side of attention) are read against the magnitude and trajectory of public search interest (the demand side).
Four contributions follow. Methodologically, the study demonstrates anchored normalisation as a correction to a widespread but unremarked flaw in search-trend research and documents it transparently so that it can be replicated. Structurally, it applies semantic network analysis to a PRISMA-screened corpus, producing a map of how the field’s concepts cohere rather than merely how often they appear. Empirically, it quantifies the magnitude gap between sustainability-related and mainstream commerce search interest in a national digital market. Theoretically, it supplies behavioural evidence bearing on the attitude–behaviour gap by showing that the gap is visible at the search stage, the earliest observable point of consumer information seeking.
2. Literature Review
2.1. Sustainability in Digital Commerce Research
Research connecting digital commerce and sustainability has developed along three broad lines. The first examines green products and purchase behaviour, typically modelling intention as a function of environmental concern, perceived consumer effectiveness, and product attributes [11,12,13,14]. The second examines circular practices—secondhand exchange, resale, refurbishment, rental—as commerce modalities with intrinsic environmental value, and asks what motivates participation [15,16]. The third examines the sustainability implications of specific channel forms, most prominently livestream and social commerce, where the immediacy of the format is thought both to stimulate consumption and to improve the transmission of provenance information [17,18,19,20].
These lines share an analytic structure: a consumer-level dependent variable, a set of psychological or channel-feature antecedents, and a survey or experimental design. What they share less often is attention to the informational and institutional conditions under which sustainability claims circulate. Governance, verification, and platform accountability appear infrequently, and when they do, they are usually treated as context rather than as objects of study.
Seven syntheses of this literature are available, and their boundaries are instructive. Rita and Ramos [2] analyse 104 Scopus articles on consumer behaviour and sustainability in e-commerce (2001–2022) and recover a knowledge structure from co-citation; Zhang [3] screens 261 records to 58 and codes them against the nine sustainability-transition themes, acknowledging single-coder subjectivity. The remainder are function-bounded: Cano et al. [4] cover sustainable e-commerce logistics over a thirteen-month publication window, Mucowska [5] covers urban last-mile delivery, and Aziz et al. [6] cover e-grocery energy and environmental impact from twelve primary studies. Bălan [7] addresses retail engagement with sustainable consumption across 45 articles but with only a minority set online, and Shafi et al. [8] screen 51 Scopus records to 30 without formal quality appraisal. Three features recur: single-database sourcing in six of the seven, scope bounded to one function or category in four, and—without exception—validation of scholarly themes against other scholarship rather than against any external measure of what consumers attend to. The present review does not claim better coverage than these syntheses; it claims a different warrant, supplying the external behavioural comparison that none of them contains.
2.2. Greenwashing, Scepticism, and the Credence Problem
Sustainability attributes are credence attributes: consumers cannot verify them through inspection before purchase or through use after it. This creates a structural opening for greenwashing and, correspondingly, for consumer scepticism [21,22]. A growing literature examines how scepticism forms and how certification and labelling mitigate it [21,22], and how source credibility substitutes for verification when verification is unavailable [23,24,25]. In digital commerce, the credence problem is intensified: the physical product is absent, the claim is mediated, and in livestream settings it may leave no durable record at all [26,27,28].
The theoretical importance of this literature is that it identifies the mechanism by which sustainability information either does or does not become actionable. Its empirical limitation is that scepticism is almost always measured through self-report, precisely the instrument most vulnerable to the social-desirability pressures surrounding sustainability. Behavioural traces of scepticism—including search behaviour directed at greenwashing itself—are rarely examined.
2.3. The Attitude–Behaviour Gap
The discrepancy between stated sustainability commitments and observed sustainable behaviour is one of the most robust findings in consumption research. Explanations invoke situational barriers, price sensitivity, habit, and the diffuse and deferred nature of environmental benefit [29,30,31,32]. Most evidence comes from comparing survey-measured attitudes with survey-measured or panel-measured purchases.
Search behaviour occupies an informative position between these measures. It is behavioural rather than attitudinal, unobtrusive and therefore free of social-desirability bias [33], and antecedent to purchase in the decision sequence. If sustainability attitudes are widespread but sustainable purchasing is not, one may ask where in the sequence attenuation occurs. Evidence that attenuation is already visible at the search stage would locate it earlier than existing accounts assume.
2.4. Semantic Network Analysis of Research Corpora
Co-word and semantic network analysis treats a body of literature as a structure of concepts rather than a list of records. Keywords co-occurring within documents form a network whose centrality distribution reveals which concepts organise the field and whose cohesive structure reveals how concepts stratify into core and peripheral positions. The approach has an established record in recovering market structure and research-field organisation from unstructured text [34,35,36], and it complements frequency-based thematic coding by showing not merely what is studied but what is studied together.
Two analytic devices are used here. Centrality measures—degree, closeness, betweenness, and eigenvector—characterise positional prominence, distinguishing concepts that are ubiquitous from those that broker between otherwise separated regions. k-core decomposition partitions the network into nested strata of increasing cohesion, identifying a dense conceptual core and the peripheral positions attached to it, and is well suited to diagnosing whether a field’s subdomains are integrated with one another or merely with a shared abstract vocabulary.
2.5. Search-Trend Data and Its Normalisation Problem
Search-interest indices have been used in commerce research to nowcast demand, track diffusion, and characterise public attention. Choi and Varian [37] established the nowcasting template, and search volumes have since been used to measure attention to conservation topics [38] and to environmental awareness as a construct in its own right [39]. In the Korean market specifically, Song et al. [9] use Naver DataLab shopping-category volumes to track pandemic shifts in online purchasing across some 1800 product categories, establishing the platform as a usable instrument for consumer attention in this setting. Their appeal is scale and unobtrusiveness. Their principal hazard is less widely appreciated: platforms normalise interest within a query, rescaling each series so that its own maximum equals the index ceiling. Two terms queried separately therefore both attain the ceiling regardless of their true relative magnitude, and any comparison of their levels—including aggregation into category shares—is invalid. Springer et al. [40] state the property directly, noting that the platform “provides only relative data and not absolute search volumes” and that series retrieved at different times may differ; Rovetta [41] documents day-to-day sampling variability in repeated identical queries, and Cebrián and Domenech [42] model the sampling process and recommend averaging repeated extractions. A systematic review of 360 social-science applications finds that most report no test of internal validity or reliability across samples [43].
The correction is to embed a common anchor term in every query so that all series are normalised jointly against a shared reference, then rescale between queries using the anchor. This procedure is standard in some applied settings but is seldom reported in commerce research, with the consequence that published category-share comparisons based on separately executed queries may not support the interpretations placed on them. Two qualifications bound the contribution claimed here. The anchoring logic is not novel in itself—benchmark terms are discussed in the infodemiology literature [40]—and what is offered is its systematic application, empirical verification, and transparent reporting in a commerce setting, together with the observation that the resulting magnitudes are themselves conditional on which term serves as the anchor. The present study applies and documents the correction.
3. Research Questions
Six questions organise the study, three for each analysis, culminating in a triangulation question.
RQ1. What is the thematic composition of the 2022–2026 literature on sustainable digital commerce, and which themes are underrepresented?
RQ2. How has thematic composition changed across the observation window?
RQ3. What is the semantic structure of the corpus—which concepts are central, and how do concepts stratify into core and peripheral positions?
RQ4. Once search-interest indices are anchored to a common reference, what is the magnitude of sustainability-related public attention relative to mainstream commerce attention?
RQ5. How has that attention evolved between 2022 and 2025, and do sustainability subdomains differ in their trajectories?
RQ6. Where do the supply side (scholarly attention) and the demand side (public search attention) converge and diverge?
4. Methodology
4.1. Design, Data, and Transparency Statement
The study employs a sequential two-analysis design. Analysis 1 characterises the supply side of attention through a PRISMA-guided structured review supplemented by semantic network analysis. Analysis 2 characterises the demand side through anchored search-interest data. The two are then triangulated. All searches were executed on 23 July 2026; because search-interest indices are renormalised at query time and bibliographic databases are continuously updated, the collection date is reported throughout and is material to replication.
Bibliographic records were retrieved through the Publish or Perish 8 utility [44]. Search-interest data were obtained from the Naver DataLab open application programming interface and from Google Trends restricted to the Korean geography. Keyword lists, query strings, screening criteria, network construction parameters, and the anchoring procedure are reported below and in the Appendix A, Appendix B, Appendix C and Appendix D. The screened corpus, the co-occurrence matrix in UCINET DL format, and the NetDraw input files are available from the corresponding author.
4.2. Analysis 1: PRISMA-Guided Structured Review
The review follows PRISMA 2020 reporting conventions [10] adapted for a scoping synthesis [45]: the objective is to map themes, structure, and dynamics rather than to pool effect sizes, so no risk-of-bias assessment or meta-analytic aggregation was performed. Identification and eligibility were separate operations. Records were first identified through a relevance-ranked query in Publish or Perish rather than through a field-delimited Boolean expression, because the source platform does not support conjunction across fields; the executed query string is reported in Appendix A. The three-axis criterion was then applied post hoc to the title and abstract of every retrieved record. Recall is therefore governed by the platform’s relevance ranking and cannot be quantified, a limitation returned to in Section 8.3.
Eligibility was determined by a three-axis Boolean criterion requiring the simultaneous presence, in the title or abstract, of a commerce term (axis A), a sustainability term (axis B), and a perception or behaviour term (axis C); the complete term lists appear in Appendix A. Requiring conjunction across all three axes, rather than relying on database subject tags, was necessary because preliminary screening of a keyword-only collection had returned approximately half its records from chemistry, materials, and construction, fields in which eco-friendly appears as a process descriptor unrelated to commerce.
The conjunction requirement has a consequence for scope that must be stated before any theme share is interpreted. Axis C requires perception or behaviour vocabulary, so a study of certification regimes, platform liability, environmental regulation or infrastructure that reports no consumer-side construct is excluded by design. Re-applying the three axes to the 700 retrieved records isolates the effect: of the records carrying both a commerce and a sustainability term, 119 fail axis C, and governance vocabulary (governance, regulation, certification, accountability, compliance, policy, enforcement, disclosure, liability) appears in 12 of them, or 10.1%, against 6.2% of the records that satisfy all three axes. Governance research is therefore over-represented among the exclusions by a factor of about 1.6. Every theme share reported below is accordingly a share of consumer-facing sustainable digital commerce research, not of the field at large, and the governance figure in particular is a lower bound.
Figure 1 reports the resulting flow. Of 700 records identified, 10 were excluded as citation-only entries, 4 fell outside the 2022–2026 observation window, and 2 were duplicates, leaving 684 records for screening. Of these, 381 failed the eligibility criterion (6 lacking a commerce term, 258 lacking a sustainability term, and 117 lacking a perception term), yielding 303 included studies.
Figure 1.
PRISMA 2020 flow diagram for the structured review. Note. Records identified on 23 July 2026 through a relevance-ranked query in Publish or Perish against Google Scholar; the executed query string is reported in Appendix A. Eligibility was then assessed post hoc and required the conjunction of a commerce term (A), a sustainability term (B), and a perception or behaviour term (C) in the title or abstract.
A separate venue census was assembled to position the study within the target journal’s own research landscape. Because a single retrieval pass approached the platform’s return ceiling, three passes were executed—one covering 2006–2026 and two covering 2006–2022 and 2023–2026 separately—and merged. Of 1859 retrieved records, 728 were duplicates and one was published outside the journal, yielding 1130 unique articles. Sustainability content within the census was identified by keyword match on titles and abstracts.
Thematic coding was performed by keyword rule applied to titles and abstracts. Each record was assigned to the first matching theme under a priority order running from the most lexically specific category to the most general: platform and governance; greenwashing and trust; circular economy and secondhand exchange; livestream and social commerce; logistics and packaging; technology and artificial intelligence; green products and purchase behaviour; and an unclassified residual. This direction was chosen deliberately. Under the reverse order, broad environmental vocabulary absorbs the narrower institutional and technological categories: of the eighteen records carrying governance vocabulary only five, and of the eighteen carrying artificial-intelligence vocabulary only seven, would be assigned to those themes. Two further rules follow from the eligibility criterion. First, the bare tokens green and sustainab* are excluded from the green-products rule, because the criterion requires an axis-B term in every record and these tokens therefore carry no discriminating power; including them assigns 91.1% of the corpus to that single theme. Second, records carrying only axis-B vocabulary without any theme-specific expression are assigned to the residual rather than to green products. The complete pattern set, the coding script, and a multi-label version of the same rules are provided in Appendix D and in the supplementary repository. Because rule-based assignment is reproducible but not thereby valid, the coding was validated against independent manual coding. A stratified random sample of 100 records was drawn, comprising every record assigned to the four smallest substantive themes—where boundary error is most consequential—and a random draw from the remainder. Two authors coded each record independently from its title and abstract, blind to the rule assignment, using the theme definitions in Appendix D. Inter-coder agreement is reported as Cohen’s κ and Krippendorff’s α, and rule accuracy as agreement with the coders’ consensus, computed on the records where the two coders agreed without adjudication. Because the sample deliberately over-samples the smallest themes, the manual codes were also used to re-estimate the thematic distribution of the full corpus by weighting each stratum back to its population size, with 95% intervals from 10,000 stratified bootstrap replications. Results appear in Section 5.2 and Appendix D, and the coding sheets, the scoring script and the resulting confusion matrix are supplied in the Supplementary Materials.
4.3. Semantic Network Construction and Analysis
Titles and abstracts were tokenised after removal of function words and generic academic vocabulary, with multi-word concepts consolidated into single tokens and morphological variants merged. The thirty-three most frequent substantive keywords were retained as nodes, and ties were defined by document-level co-occurrence across the 303 included studies. Sixteen of the thirty-three retained keywords are themselves axis terms from the eligibility criterion; their joint prominence is therefore induced by the selection design and is not an empirical property of the field. Section 5.4 accordingly reports a robustness analysis in which the axis terms are removed and the network is re-thresholded on the remaining distribution, and confines the substantive interpretation to structural features that survive that removal. Because the unthresholded network was highly saturated—a density of 0.888, with almost every keyword pair co-occurring at least once—a threshold was applied at the seventieth percentile of the co-occurrence distribution (nine co-occurrences), reducing density to 0.303 while retaining all thirty-three nodes. Because the reported structure is sensitive to this choice, the network was recomputed across the fortieth to ninetieth percentiles; the full sensitivity grid appears in Appendix C. Core membership is stable between the sixtieth and eightieth percentiles, whereas the concentration of brokerage rises monotonically with the threshold, from 19.8% at the fortieth percentile to 90.6% at the ninetieth. The brokerage figures reported below should therefore be read as properties of the network at a co-occurrence strength of nine or above, not as threshold-free quantities.
The thresholded matrix was analysed in UCINET 6.780 [46] with ties treated as valued, so that centrality reflects co-occurrence strength rather than mere presence. Degree, closeness, betweenness, and eigenvector centrality were computed to characterise positional prominence, and k-coreness was computed to identify the network’s core–periphery structure. Layout coordinates were computed by spring embedding in NetDraw and the figure was rendered for publication with node shape and fill encoding k-core stratum, node size proportional to valued degree, and edge width and darkness proportional to co-occurrence strength.
Raw co-occurrence counts confound association with term frequency: two frequent keywords co-occur often whether or not they are related. Three frequency-normalised measures were therefore computed alongside the raw counts for every keyword pair—the Jaccard index, the cosine (Salton) coefficient, and association strength, the probabilistic measure cij·N/(ni·nj) recommended by van Eck and Waltman [47] for co-occurrence data, which equals one under statistical independence. Pointwise mutual information was also computed but is undefined for the 35 pairs that never co-occur and is reported only for non-zero cells. Statistical significance was assessed against a randomisation model that holds each keyword’s document frequency fixed at its observed value and assigns it to documents at random, so that any residual structure cannot be attributed to keyword frequency. Ten thousand draws were generated; reported p-values are the proportion of draws at least as extreme as the observed statistic. Expected counts under independence were also computed analytically as ni·nj/N with hypergeometric tail probabilities for the zero and threshold-clearing cells.
4.4. Analysis 2: Anchored Search-Interest Landscape
Public attention was measured from Naver DataLab, the dominant search infrastructure in the Korean digital environment, and from Google Trends restricted to Korea. Because neither platform supports Boolean conjunction or wildcards, the three-axis criterion used in Analysis 1 could not be applied directly. Instead the conceptual intersections were operationalised as compound consumer search expressions in which two axes are lexically fused—for example, an expression combining eco-friendliness and shopping realises the intersection of axes A and B within a single term. Nine keyword groups were constructed across five categories; the complete list appears in Appendix B.
Keywords were validated before collection by querying each individually and computing the proportion of months returning non-zero interest. Three initially specified expressions returned non-zero values in fewer than 12% of months and were replaced with broader consumer-facing equivalents: a compound of sustainable consumption and ESG consumption (2.5% of months) was replaced by the general term ESG; vegan cosmetics (11.3%) was replaced by the superordinate vegan; and a compound of eco-friendly packaging and eco-friendly delivery (11.3%) was replaced by a compound of refill station and eco-friendly packaging. The validation output for every candidate keyword, and the configuration file recording each substitution, are provided in the Supplementary Materials. One expression retained through validation was subsequently excluded on construct-validity grounds. The group labelled ESG (search terms: ESG, ESG management, and sustainable consumption) proved to capture corporate environmental, social and governance discourse rather than consumer sustainable shopping. Three observations support the exclusion: its anchored magnitude differed between platforms by a factor of twenty-four (13.1% of the anchor on Naver against 318% on Google); its temporal profile tracked the debate over mandatory disclosure rather than any consumption cycle; and within Naver alone it stood at 13.1% of the anchor, more than three times the next largest sustainability expression and eighteen times the smallest, placing it in a different order of magnitude from every consumer-facing term in the set.
Anchored collection proceeded as follows. Because each platform normalises interest within a query, the anchor term was included in every Naver request, each comprising the anchor, a fixed probe group, and up to three further groups. Series were then rescaled between requests by the ratio of the anchor’s reference mean to its mean within the request. What the verification establishes requires precise statement. The probe group, collected in all three requests, was reproduced identically after rescaling across all fifty-five months, with a maximum relative deviation of 0.000% (Appendix B, Table A2); the rescaling factor was exactly 1.000 in every request. Taken alone this would be close to circular, since it tests the arithmetic under the authors’ own collection configuration. The substantive result is a different one. The three requests differed in composition—two carried five groups and one carried three—and the anchor and probe series returned by the platform were numerically identical across all three to the full precision of the response, as were their ratios. The platform’s normalisation of these series is therefore invariant to which other terms accompany them, which is the property the bridge requires: a term’s value is the same whether or not it was co-queried with a given other term. This holds because the anchor sets the index ceiling in every request, and it would not be expected to hold for an anchor that did not. What the design cannot establish is agreement with an independently executed joint query containing terms that were never co-queried here; that check requires re-collection and is identified as a priority in Section 8.4. The highest-volume commerce expression served as the anchor, and Naver returned monthly indices for all nine groups across fifty-five months. Because every reported magnitude is a ratio to that anchor, the choice of anchor is itself a parameter: Section 6.1 and Appendix B, Table A4 report all results against an alternative mainstream-commerce denominator, and against the ESG group that was excluded on construct-validity grounds. On the Google side, rate limiting prevented completion of the first batch; the four groups obtained came from a single joint query and are internally comparable without rescaling, but no between-request alignment was performed, and the Google series is therefore used only for the exploratory contrast in Section 6.3.
5. Results of Analysis 1: The Structure of the Literature
5.1. Corpus Composition
The included corpus comprises 303 studies published between 2022 and 2026. Venue names in the retrieval metadata are truncated for 153 of the 303 records (50.5%), so the number of distinct outlets cannot be determined: at least 89 distinct venues are identifiable from complete names, but truncated strings both fragment single journals across variants and collapse different journals into shared stems, the largest such stem accounting for twelve records. Dispersion is therefore reported qualitatively rather than as a count. Annual output rises across the window—38 studies in 2022, 44 in 2023, 81 in 2024, 108 in 2025, and 32 in the partial year 2026—but this series describes the corpus, not the field. Because identification proceeded through a relevance-ranked query whose recall cannot be quantified, and because re-executing the same query returned materially different counts (Section 8.3), the rising counts are consistent with growth in the literature but do not establish it: they are equally consistent with improving index coverage of recent years, which is a known property of the source. The within-corpus comparisons that follow—thematic shares by year—are unaffected, because they are proportions within each annual slice rather than counts across slices, and these are the quantities on which the argument rests. References to expansion elsewhere in this article should be read as describing the corpus. The corpus has accumulated 5017 citations, a mean of 16.6 per study, with a median of five, indicating a citation distribution typical of a young and rapidly growing field.
5.2. Thematic Composition (RQ1)
Table 1 reports the thematic distribution. Green products and purchase behaviour dominate at 29.0%, followed by logistics and packaging at 20.8% and livestream and social commerce at 11.9%. A residual fifth of the corpus (19.5%) carries sustainability vocabulary without any theme-specific expression and is left unclassified rather than forced into a substantive category.
Table 1.
Thematic distribution of the included studies (N = 303).
Two findings in this table are negative and consequential. Platform and governance accounts for eleven studies, or 3.6% of the corpus. Two qualifications bound that number before it is interpreted. It is a share of studies meeting an eligibility criterion that requires perception or behaviour vocabulary, and such vocabulary is precisely what institutional research often lacks; governance vocabulary is over-represented among axis-C exclusions by a factor of about 1.6 (Section 4.2), so 3.6% understates the governance share of the wider field. Against this, manual inspection of all eleven records indicates that the rule also admits studies in which policy or regulation is mentioned in passing rather than studied, so precision is imperfect in the opposite direction (Appendix D). The point estimate should therefore not be read as precise. The validation reported below quantifies both errors and shifts two figures in this table. Re-estimating the thematic distribution from the manual consensus codes, with the sampling design weighted out, puts governance at 2.2% (95% CI 0.6 to 4.4) rather than 3.6%, and greenwashing and trust at 1.7% (95% CI 0.0 to 3.3) rather than 5.3%. The rule overstates both, and the more severely the second; the re-estimate does not separate them, since the probability that greenwashing and trust is the smaller of the two is 0.57 across the bootstrap distribution, so no ordering between the two can be asserted. Both remain small on either coding, and the two are small together: the credibility-related themes account for 3.9% of the corpus (95% CI 1.7 to 6.6) against 23.7% for green products and purchase behaviour, a ratio of 6.1 to one whose confidence interval (2.5 to 17.6) excludes parity. Table 1 is retained as the rule-based coding of the full corpus, which is deterministic and reproducible; the corrected estimates, which rest on 65 manually coded records and are reported as a direction-of-bias diagnostic rather than a corrected distribution, are given in Appendix D, Table A13. That literature preoccupied with the credibility of sustainability claims should devote under a seventh of its output to the credibility of those claims and to the institutional arrangements that determine credibility is a structural imbalance rather than an incidental gap. The field studies whether consumers respond to sustainability attributes far more than it studies whether those attributes can be believed.
Two authors independently coded the stratified sample of 100 records described in Section 4.2, using titles and abstracts and remaining blind to the rule-based thematic assignments. Inter-coder agreement was moderate, with Cohen’s κ = 0.590 and Krippendorff’s α = 0.588 (nominal metric). The two coders assigned identical thematic categories to 65 of the 100 records, yielding an observed agreement rate of 65.0%. Agreement at this level indicates that the eight-category scheme has boundaries which two trained readers do not partition identically from title and abstract alone, so the per-theme figures below are correspondingly imprecise. Disagreements occurred in 35 records and are concentrated on the boundary between the general category and the substantive themes: one coder placed 15 records in the general category and the other 30, which accounts for the larger part of the gap. The 35 were left unadjudicated and excluded from the comparison rather than resolved by the authors, so all figures below rest on the 65 records on which two blind coders agreed independently. Against that consensus, the rule assignment is correct in 40 of 65 cases, an accuracy of 61.5%. Accuracy is not uniform across themes, and the pattern is systematic rather than random. Precision is complete for livestream and social commerce (five of five) and for technology and artificial intelligence (six of six), high for logistics and packaging (86%), and poor for the three categories highest in the priority order: platform and governance 50%, circular economy 45%, and greenwashing and trust 27%. Recall runs in the opposite direction, reaching 100% for greenwashing and circular economy but only 38% for green products, 47% for the general category and 56% for livestream. The diagnosis follows directly from the priority rule set out in Section 4.2. Assignment runs from the most lexically specific category to the most general, on the assumption that specific vocabulary is diagnostic; the validation shows that for the highest-ranked categories it is not. Terms such as trust, certification and resale occur in studies whose object is a channel, a product class or a logistics process, and because those categories sit above livestream, logistics, technology and green products in the order, they capture records that belong elsewhere. Four records assigned to greenwashing and trust were coded by both coders as livestream studies, and four assigned to circular economy as green-product studies. The priority order, in other words, is an active source of error, not the patterns themselves, and the categories it harms are the ones it ranks lowest. Because the consensus base is 65 records and several per-theme cells hold fewer than ten, these rates indicate direction rather than precise magnitude. The full confusion matrix, per-theme precision and recall, and the design-weighted re-estimate of the thematic distribution appear in Appendix D, Table A12 and Table A13. Independently of the manual validation, 29.7% of records matched two or more thematic patterns under multi-label coding, including 12 records matching three patterns. This indicates potential sensitivity of single-label assignments to the priority order, which the validation confirms is realised rather than merely potential.
5.3. Temporal Dynamics (RQ2)
Table 2 and Figure 2 report thematic shares by year. Green products and purchase behaviour, though dominant throughout, declines from 28.9% in 2022 to 15.6% in 2026, indicating diversification rather than displacement. Circular economy rises from 5.3% to 9.4%, and livestream and social commerce, after a trough in 2023, reaches 21.9% in 2026. Platform and governance is absent only in 2022; it appears from 2023 onward but never exceeds 5.6% of annual output in any year.
Table 2.
Thematic shares by publication year (%).
Figure 2.
Thematic shares of annual publication output, 2022–2026.
The dominant movement is a gradual decentring of the green-product paradigm. Early work asked whether consumers would choose sustainable products; later work distributes attention across the transaction as a whole—its fulfilment infrastructure, its circular alternatives, and its channel forms. Governance is thin throughout rather than newly emergent: it is present in every year from 2023 but never rises above a twentieth of annual output, even as regulatory activity in this domain intensified across the same period. The pattern is one of persistent underweighting rather than delayed arrival, which is the more difficult finding for the field to explain.
5.4. Semantic Network Structure (RQ3)
The keyword co-occurrence network comprises thirty-three nodes. Before thresholding its density was 0.888, meaning that almost every keyword pair co-occurred at least once across the corpus. After thresholding at nine co-occurrences, the network retains 160 ties at a density of 0.303. Centrality was computed in UCINET with ties treated as valued, so that scores reflect co-occurrence strength.
Table 3 reports the results for the fifteen most prominent keywords. Two findings stand out. First, the distribution is steeply hierarchical: e-commerce (valued degree 1183) and green (901) are followed at a considerable distance by awareness (625) and sustainable (573), after which values decline rapidly. Eigenvector centrality confirms the ordering, with e-commerce at 0.507 and green at 0.421 against 0.347 for awareness. Second, and more consequentially, betweenness is extraordinarily concentrated. Of thirty-three keywords, twenty-one have betweenness of exactly zero, and e-commerce (130.53) and green (120.53) together account for 68.0% of all brokerage in the network. The next highest value, awareness at 36.20, is less than a third of either.
Table 3.
UCINET centrality scores for the fifteen most prominent keywords.
The k-coreness column reveals the structure underlying this concentration. Table 4 partitions the network into three strata. A dense core of twelve keywords occupies the 11-core, meaning each is connected to at least eleven of the other core keywords. Below it, thirteen keywords occupy intermediate positions in the 4-core to 10-core range, and eight keywords occupy the 1-core to 3-core periphery. The drop from the 11-core to the next stratum is abrupt: no keyword occupies a 9-core position, and only one occupies the 10-core. Figure 3 shows the thresholded network, with the three strata distinguished by node shape and fill.
Table 4.
Core–periphery structure from k-core decomposition.
Figure 3.
Semantic network of the corpus by k-core stratum. Note. Layout coordinates computed by spring embedding in NetDraw from the thresholded matrix. Node shape and fill denote k-core stratum; node size is proportional to valued degree; and edge width and darkness are proportional to co-occurrence strength. Ties below nine co-occurrences are suppressed.
Read together, these results describe a field held together by its most abstract vocabulary. The twelve keywords in the densest stratum combine three vocabularies—the channel, the environmental attribute, and consumer cognition—but eleven of them are axis terms from the eligibility criterion, which required a term from each axis in every record. Their joint prominence is therefore induced by the selection design and is not interpreted here as evidence that the field has fused these vocabularies.
The periphery tells a different story, though it requires a frequency-normalised test before it can be told. Fourteen subdomain keywords—packaging, delivery, logistics, supply chain, trust, green marketing, marketing, brand, social, social commerce, livestreaming, circular economy, green product and platform—form 91 possible pairs among themselves. Across the unthresholded corpus, these pairs co-occur a mean of 1.40 times, reach a maximum of five, and not one attains the threshold of nine; 35 of the 91 pairs never co-occur at all. The same fourteen terms, paired against the four most central keywords, co-occur a mean of 12.6 times, reach a maximum of fifty, and clear the threshold in 37 of 56 pairs. Raw counts of this kind confound association with frequency, and most of the ninefold gap is indeed a frequency effect: a randomisation model that holds every keyword’s document frequency at its observed value and assigns documents at random produces a ratio of 7.48 (95% interval 6.41 to 8.67) against the observed 9.06. Normalised measures tell the same story—association strength, which equals one under independence, is 0.82 for subdomain pairs against 0.96 for subdomain–core pairs, a ratio of 1.17 rather than nine (Appendix C, Table A9). The claim that subdomain terms are specially attracted to the core cannot be sustained: at 12.64 observed against 12.79 expected, they attach to core vocabulary almost exactly as often as their frequencies alone predict (p = 0.32). Two results do survive the correction, and they are the ones the argument now rests on. Subdomain pairs co-occur less often than chance, 1.40 observed against 1.72 expected (p = 0.003), a deficit of 19%. More robustly, 35 of the 91 pairs never co-occur where 19.7 would be expected under the same null, a result no randomisation draw in ten thousand reproduced (p < 0.001). The accurate formulation is therefore not that subdomains are bound to a shared abstract vocabulary—they are bound to it no more than chance requires—but that they avoid one another: the subdomain studies are disconnected from each other to a degree that their individual prominence in the corpus does not explain. Nothing in the eligibility criterion requires this: the criterion demands a term from each of the three axes but places no constraint on whether logistics research and livestream research share language.
Two robustness checks support confining the interpretation in this way. Removing the sixteen axis terms and re-thresholding at the seventieth percentile of the remaining distribution leaves a network of seventeen nodes, 48 ties and a density of 0.353, in which brokerage remains concentrated in two generic terms (77.0%); the concentration of brokerage in general vocabulary therefore survives the removal, whereas the composition of the dense core does not. Varying the threshold across the fortieth to ninetieth percentiles leaves the identity of the two principal brokers unchanged from the sixtieth percentile upward—at the fortieth and fiftieth, the second broker is sustainable rather than green (Appendix C, Table A6)—while moving their combined share from 19.8% to 90.6%. Both grids are reported in Appendix C. Core membership is correspondingly threshold-dependent: the densest stratum contains 16, 12 and 13 keywords at the sixtieth, seventieth and eightieth percentiles, respectively, so statements about which keywords occupy the core hold at the reported cut and not in general. The subdomain result above is not subject to this caveat, being computed on the unthresholded matrix. A caution also applies to reading the network as a map of the field’s concepts. The network is built from literal keyword occurrence in titles and truncated abstracts, whereas the thematic coding operates on concepts, and the two diverge systematically. Circular economy appears as a term in sixteen records but as a theme in twenty-three, because much circular-commerce research uses secondhand, resale or refurbishment instead, none of which ranks among the thirty-three most frequent keywords. Conversely, platform occurs in fifty-six records but anchors only eleven governance-coded studies, and greenwashing itself does not rank among the thirty-three and is therefore absent from the network altogether. The peripheral position of a subdomain in this network indicates that its canonical term is lexically isolated, not that the research area is conceptually isolated.
5.5. Venue Landscape
Because venue names are truncated in half of the retrieval metadata, the corpus cannot be characterised by a venue count. What can be said is that no single outlet accounts for more than a small fraction of output and that the identifiable venues span sustainability-focused outlets, commerce and information-systems journals, and general management titles. Sustainable digital commerce is not consolidated within a disciplinary home.
5.6. The Target Venue’s Research Landscape (N = 1130)
Splitting the retrieval period proved necessary because a single query approached the platform’s return ceiling; the merged census recovered 131 articles that the single pass had missed. Neither retrieval strategy dominated, however. The split passes recovered 88 additional records for 2006–2022 but returned 227 fewer for 2023–2026, reflecting query-dependent relevance ranking in the source platform. The union of all passes was therefore used, and the instability is itself reported as a limitation of retrieval from this source.
The census documents an institutional transition that conditions any interpretation of the journal’s output. The journal was published in Chile until 2021 and by its current publisher thereafter, and the transition is visible in volume: annual output averaged approximately twenty articles from 2006 to 2019, rose to 39 in 2020, and reached 166 in 2021, the transition year in which both publishers appear. Output peaked at 248 articles in 2025. Table 5 reports the distribution.
Table 5.
Target-venue census by era and sustainability content (N = 1130).
Sustainability content within the venue is both recent and thin. No sustainability-related article appears before 2012, the share remains at 2.5% through 2020, and it reaches 6.2% only under the current publisher, peaking at 8.6% in 2024. Across the entire twenty-year history, 55 articles, or 4.9% of output, engage sustainability in any form. Because retrieved abstracts are short, this is a lower bound; nevertheless the order of magnitude is informative.
The thematic profile of these 55 articles differs from that of the international corpus analysed above. Logistics and packaging is the largest identifiable cluster with six articles, followed by circular economy and secondhand exchange with five and green products with four. Platform and governance, absent from the semantic network of the international corpus, appears in three articles here. Livestream sustainability and greenwashing are each represented by a single article. The most cited members of the subset address blockchain adoption, digital financial services, circular business models, and fast-fashion participation, indicating that the venue has engaged sustainability primarily through business-model and technology lenses rather than through consumer perception.
Two observations follow. First, the venue has published sustainability research consistently but sparsely across its history. Second, its existing sustainability work approaches the topic through business models and technologies rather than through public perception and information behaviour.
5.7. Publication Route and Indexing Profile
Because Google Scholar indexes repositories and preprint servers alongside publisher platforms, the corpus includes records whose route to publication varies in ways that bear on their standing. Each record was therefore classified by its host: major academic publishers whose journals are routinely indexed in Scopus and Web of Science; repositories and aggregators such as institutional archives and academic social networks; and other publishers, comprising smaller presses, regional outlets, and conference proceedings. Table 6 reports the distribution.
Table 6.
Publication route of the included studies (N = 303).
Slightly more than half of the corpus (52.1%) was published by major academic publishers whose journals are typically indexed, and these records accumulate substantially more citations than the remainder (mean 23.0 against 9.9 and 8.5; median nine against three and three). The 13.5% hosted by repositories and aggregators is a direct consequence of the retrieval platform: Scopus and Web of Science would not return such records. Their inclusion broadens coverage of recent and regionally published work at the cost of heterogeneity in peer-review status, and readers should weigh the two analytic strata accordingly. Table 7 lists the twelve major publishers represented in the corpus, and two observations follow from it.
Table 7.
Major academic publishers represented in the corpus.
First, the publisher profile is dominated by open-access and hybrid portfolios, with MDPI alone accounting for 12.5% of the corpus and MDPI, Springer, and Frontiers together for 24.4%. Venues with shorter review cycles are heavily represented, so the corpus is heterogeneous in the maturity of the peer review its members have undergone.
Second, the thematic profile of indexed-publisher output differs only modestly from the corpus as a whole. Green products and purchase behaviour is less dominant among major-publisher records (22.8% against 29.0%), while logistics and packaging (23.4% against 20.8%), circular economy (8.9% against 7.6%), technology and artificial intelligence (4.4% against 2.3%), and platform governance (3.8% against 3.6%) are better represented. The direction is consistent: the emerging themes are slightly more visible in indexed venues than in the corpus at large, suggesting that the reorientation documented in Section 5.3 is not an artefact of less-scrutinised outlets. The share of major-publisher output is stable across the window, ranging between 45.5% and 65.8% with no monotonic trend.
6. Results of Analysis 2: The Anchored Search-Interest Landscape
6.1. Magnitude of Sustainability-Related Search Interest (RQ4)
Anchoring makes cross-group magnitude comparison possible. Table 8 and Figure 4 report mean anchored interest for each keyword group, in index units and as a percentage of the anchor. Secondhand trading, the anchor, has a mean anchored index of 68.81. Every sustainability-oriented expression falls between 0.50 and 2.82, that is, between 0.73% and 4.10% of the anchor.
Table 8.
Anchored search interest by keyword group (Naver DataLab, monthly, 2022–2026).
Figure 4.
Mean anchored search interest by keyword group (logarithmic scale).
Aggregated to categories, secondhand and circular exchange accounts for 89.0% of total anchored interest, green shopping for 4.6%, channel and live commerce for 2.8%, eco-packaging for 2.1%, and ethical consumption and greenwashing for 1.5%. Interpretive caution is warranted: secondhand trading is a mass consumer activity conducted through named platforms, whereas the other expressions denote orientations rather than transactions. But the magnitude of the difference—two orders of magnitude between the anchor and the ethical-consumption expression—is not explicable by that distinction alone. Sustainability, as a search-articulated concern, occupies a very small share of the attention consumers direct at commerce.
Both figures are conditional on the anchor, and the condition is not innocuous. Secondhand trading is used here as the benchmark for mainstream commerce because it is the highest-volume consumer transaction expression available on the platform, but it is also coded as a circular-economy activity in Analysis 1, so the denominator is not a sustainability-neutral measure of commerce attention. Repeating the analysis against live commerce, a channel expression with no sustainability content, changes the magnitudes substantially: sustainability expressions range from 23% to 130% of the live-commerce denominator rather than from 0.7% to 4.1% of the secondhand denominator (Appendix B, Table A4). The ordering of the expressions is identical under both, and the differential trajectories reported in Section 6.2 are preserved, but the absolute magnitude claim is not anchor-free and should be read as a comparison against the single largest consumer transaction category in this market rather than against commerce attention in general. A second sensitivity concerns the ESG group, which was collected and then excluded on construct-validity grounds (Section 4.4). Including it would raise the upper end of the range from 4.1% to 13.1% of the anchor, so the exclusion is consequential for the stated magnitude; it does not affect any comparative or temporal result, since ESG declines like the aspirational expressions rather than holding its share (Table A4).
6.2. Temporal Dynamics of Public Attention (RQ5)
Table 9 and Figure 5 report annual means and change from 2022 to 2025. Every group declines, but unevenly. Vegan falls by 74.1%, ethical consumption by 70.9%, and zero waste by 67.3%, whereas secondhand trading falls by 30.0% and greenwashing by 31.1%.
Table 9.
Annual mean anchored search interest and change, 2022–2025.
Figure 5.
Trajectories of anchored search interest, indexed to 2022 = 100.
Because all series, including the anchor, are shares of total search volume, a uniform decline could reflect the dispersion of search traffic across platforms rather than any change specific to sustainability. Expressing each group as a proportion of the anchor removes this common denominator. The ranking of declines is preserved, but one result changes character: greenwashing, which falls 31.1% in absolute index terms, is essentially flat relative to mainstream commerce attention over the same period (0.869% of the anchor in 2022 against 0.860% in 2025, a change of −1.0%), having risen to 1.239% in 2024 before returning. Every other sustainability expression contracts by between 39% and 63% relative to the anchor. The expressions declining most steeply denote normative consumption identities—vegan, ethical consumption, and zero waste—while those declining least denote either a practical transaction or a critical stance. Public engagement with sustainable commerce is therefore not uniformly receding: it is contracting on its aspirational dimension while its critical dimension holds its share of attention.
Four annual observations cannot by themselves support a trend claim, so the monthly series were tested directly. Mann–Kendall tests [48] on the 48 monthly anchor-relative observations from 2022 to 2025 confirm a significant monotonic decline for every expression except greenwashing: vegan (τ = −0.78, p < 0.001), zero waste (τ = −0.65, p < 0.001), resale (τ = −0.53, p < 0.001), live commerce (τ = −0.55, p < 0.001), ethical consumption (τ = −0.26, p = 0.011) and green shopping (τ = −0.20, p = 0.046). Greenwashing shows no monotonic trend (τ = 0.07, p = 0.49). Bootstrap confidence intervals on the 2022–2025 change, resampling months within year over 10,000 replications, exclude zero for every expression except greenwashing, whose interval runs from −28.8% to +34.7%. The differential is thus not an artefact of comparing point estimates: the aspirational expressions decline on both tests, and greenwashing fails to decline on both. Full results appear in Appendix B, Table A5. Two cautions are attached. The confidence intervals describe sampling variation in the monthly series, not uncertainty in the platform’s own index construction, which cannot be quantified from the returned data. And a flat relative share is not evidence of stable underlying interest, only of interest that is contracting no faster than the anchor.
6.3. Platform Register Contrast
Table 10 compares anchored interest across platforms for the four groups collected on both. Relative to the shared anchor, every sustainability-related expression is substantially larger on Google than on Naver: greenwashing by a factor of 10.5, live commerce by 6.0, and ethical consumption by 5.6.
Table 10.
Platform contrast in anchored interest (% of shared anchor).
This contrast must be read with two qualifications. First, the keyword sets were not symmetric across platforms: each Naver group aggregated two or three expressions by disjunction whereas the corresponding Google query used a single expression, and the anchor in particular was broader on Naver. Because the anchor forms the denominator of every reported percentage, this asymmetry depresses the Naver figures relative to the Google ones and accounts for an unknown but potentially substantial share of the observed gap. Second, the two platforms differ in the demographic composition of their user bases in this market, which is not controlled here. The contrast is accordingly reported as an exploratory observation rather than as an estimate of a register effect, and is not carried into the theoretical claims of Section 7.
7. Discussion and Implications
7.1. Triangulating the Two Analyses (RQ6)
Reading the analyses against one another yields three findings that neither produces alone.
The first is a supply–demand asymmetry in direction. Scholarly output rises across the observation window—from 38 studies in 2022 to 108 in 2025—whereas public search attention to every measured sustainability expression declines, in several cases by more than two-thirds. The field is expanding its account of a phenomenon whose salience in public information seeking is contracting. This is not necessarily a defect, since research need not track attention, but it does mean that claims about growing consumer sustainability consciousness cannot be supported by behavioural evidence from this market and period.
The second is an asymmetry in composition. The literature’s dominant theme, green products and purchase behaviour, corresponds to search expressions that decline most steeply (green shopping −49.9% and vegan −63.0% relative to the anchor). Its thinnest substantive themes, greenwashing and governance, correspond to the one expression whose public attention holds its share: relative to mainstream commerce attention, greenwashing is unchanged across the window (−1.0%) while every other sustainability expression contracts by 39% to 63%. Scholarship is concentrated where public attention is receding fastest and thin where it persists. The semantic network corroborates this. Greenwashing does not rank among the thirty-three most frequent substantive keywords and is therefore absent from the network altogether; the nearest adjacent term, trust, occupies the peripheral stratum with zero betweenness and shares no threshold-clearing tie with any other subdomain term.
The third concerns the attitude–behaviour gap. Survey research consistently reports high and often rising sustainability orientation among consumers. The anchored search data show that the behavioural expression of that orientation, at the earliest observable stage of information seeking, is between 0.7% and 4.1% of attention directed at a mainstream commerce activity, and falling. Locating the gap at the search stage matters theoretically: attenuation occurs before the situational barriers—price, availability, inconvenience—that dominate existing explanations become operative. The inference should be stated with care. Search interest records information seeking, not attitudes and not purchases, and this design observes no individual moving through the sequence; what it establishes is that the aggregate search signal is small and contracting while surveyed attitudes are not, which is a discrepancy in need of explanation rather than a demonstration that attenuation occurs at a particular stage. The observation is consistent with a common factor acting early enough to depress search as well as purchase, but it does not identify one, and the alternative that consumers who intend to buy sustainably simply do not express that intention as a sustainability query cannot be excluded from these data.
7.2. Theoretical Implications
Three contributions follow. First, the study introduces search behaviour as a middle-stage measure in the attitude–behaviour sequence. Because it is behavioural, unobtrusive, and antecedent to purchase, it offers a way to partition the gap into pre-search and post-search components. The partition is proposed here as a design, not delivered as an estimate: separating the two components requires search behaviour and purchase behaviour observed in the same population, which aggregate index data cannot supply. What these data show is that the pre-search component is unlikely to be negligible, since sustainability expressions command a very small and shrinking share of commerce-directed search; quantifying it is left to the linked-data design set out in Section 8.4.
Second, the study distinguishes two components of public sustainability attention that survey measures conflate. Once the common denominator is removed by anchoring, aspirational expressions—vegan, ethical consumption, zero waste, green shopping—lose between two-fifths and two-thirds of their share of commerce-directed attention across four years, while the one critical expression, greenwashing, holds its share unchanged (39% to 63%; Table A3, with trend tests in Table A5). Public sustainability attention is therefore not a single quantity in decline but two quantities moving differently: an aspirational component that is contracting and a sceptical component that is not. Theories of sustainable consumption that treat public concern as one latent construct will misread this period, and interventions premised on a receding audience will misidentify the audience that remains.
Third, the semantic network analysis reframes the field’s blind spot. Thematic coding shows that governance and greenwashing are both thin, and validated coding shows greenwashing to be the thinner of the two; the network shows something more specific, namely that governance-specific vocabulary—governance, regulation, certification, accountability—does not rank among the field’s thirty-three most frequent substantive keywords and so does not enter its conceptual structure. The channel term platform is present as a node, and occupies the 10-core, but it indexes the marketplace as a commercial form rather than as an object of institutional analysis: it occurs in fifty-six records while anchoring only eleven governance-coded studies. Literature organised around the credibility of unverifiable claims has not integrated the institutional vocabulary through which credibility could be established. The accompanying structural finding, restated after frequency normalisation, is that the field’s subdomains co-occur with one another less often than their individual frequencies predict, and that a third of all subdomain pairs never co-occur at all where a fifth would be expected, so that the literature can accumulate studies rapidly while its parts remain lexically disconnected.
7.3. Practical Implications
For platform operators, the magnitude findings counsel realism about the current market for sustainability information. Attention directed at sustainability expressions is small and contracting, so features positioned as a distinct sustainability proposition will address a narrow audience. The resilience of secondhand trading suggests the more effective route is to embed sustainability within transactional flows that already command attention rather than to present it as a separate destination.
For sellers of sustainable products, the differential decline is instructive. Communication anchored in normative identity addresses a rapidly contracting attention base, whereas communication anchored in practical benefits and verifiable claims addresses the segment whose attention persists. The persistence of greenwashing interest indicates that the audience remaining for sustainability claims is disproportionately sceptical, so substantiation is likely to outperform assertion.
For regulators, the combination is consequential. Public scrutiny of greenwashing is resilient in relative terms—it is the only sustainability expression to hold its share of commerce-directed attention across the window—but it remains small in absolute terms, under one percent of the attention directed at a mainstream commerce activity. Consumers transacting in mainstream environments are therefore unlikely to encounter the scrutiny that exists. This argues for verification requirements embedded at the point of transaction rather than disclosure regimes presuming an actively searching consumer, and for attention to livestream settings in particular, where claims are transient and the documentary record on which enforcement depends may not exist.
8. Conclusions
8.1. Summary of Findings
This study mapped the 2022–2026 literature on sustainable digital commerce, analysed its semantic structure, and triangulated both against anchored search-interest data for the Korean market. The literature comprises 303 studies dominated by green products and purchase behaviour (29.0%), with logistics and packaging a substantial second cluster (20.8%) and governance thin throughout (3.6%, present from 2023 but never above 5.6% of annual output; a lower bound, given that the eligibility criterion excludes institutional research lacking consumer-side vocabulary). Validation against two blind coders who agreed moderately with one another (κ = 0.59) shows the rule-based coding to be 61.5% accurate and to err systematically with the priority order; re-estimating from the manual codes puts governance at 2.2% and greenwashing at 1.7%, so that the credibility-related themes together account for 3.9% of the corpus against 23.7% for green products. Analysis of the semantic network shows that subdomain keywords co-occur with one another less often than their frequencies predict (1.40 observed against 1.72 expected, p = 0.003), and that 35 of 91 subdomain pairs never co-occur where 19.7 would be expected (p < 0.001); their attachment to the four most central keywords, by contrast, is no greater than chance. Governance-specific vocabulary does not rank among the thirty-three most frequent keywords, although the channel term platform is present as a peripheral node. Public search attention to sustainability expressions is small relative to mainstream commerce attention—between 0.7% and 4.1% of the secondhand-trading anchor—and declined between 30% and 74% over the window. Once the anchor removes the common denominator, aspirational expressions contract by 39–63% while greenwashing holds its share unchanged, and greenwashing is the only expression with no significant monotonic trend. The magnitude figures move with the choice of anchor; the differential between aspirational and critical expressions does not. Scholarly and public attention diverge in direction and, for the green-product and greenwashing themes, in composition.
8.2. Methodological Contribution
Three procedures are offered for reuse. The three-axis conjunctive eligibility criterion applied to titles and abstracts substantially improves precision over keyword-only or subject-tag screening; in preliminary work, keyword-only collection returned approximately half its records from unrelated physical-science fields. Semantic network analysis of a PRISMA-screened corpus adds structural evidence to frequency-based coding, and in this case produced a finding—the complete absence of governance vocabulary from the conceptual structure—that thematic coding could only render as a small percentage. Anchored normalisation of search-interest indices corrects a flaw that invalidates cross-term magnitude comparison and is inexpensive: it requires only that a common reference term be included in every request and that series be rescaled by the anchor. Given how frequently search-trend data are used in commerce research and how rarely the correction is reported, we suggest that anchoring be treated as a reporting requirement rather than a refinement.
8.3. Limitations
Several limitations qualify these conclusions. The review draws on a single bibliographic source, and identification proceeded through a relevance-ranked query rather than a field-delimited Boolean expression, so recall cannot be quantified; a repeat retrieval under the same conditions returned 227 fewer records for 2023–2026 while recovering 88 additional records for 2006–2022, indicating material instability in the platform’s ranking. This was a deliberate choice made after a candidate second source proved to contain templated records unsuitable for analysis, and it was preferable to admitting compromised data; nonetheless, Scopus and Web of Science coverage would strengthen the corpus, and replication with indexed databases is the first priority for extension. Retrieved abstracts average 183 characters and 73.9% of records carry no DOI, which prevented both reliable methodological coding and enrichment from Crossref; the methodological profile of this literature therefore remains uncharacterised. Venue names are truncated for half of the corpus, so venue dispersion cannot be quantified. Thematic coding was rule-based and single-label, so studies spanning themes are assigned to one; the rules are deterministic and fully reported, but their construct validity was not assessed against independent human coding, and no inter-coder reliability statistic is available.
The semantic network was constructed from titles and truncated abstracts rather than full texts, which biases it toward terms appearing early in abstracts, and sixteen of its thirty-three nodes are axis terms from the eligibility criterion, so the composition of its dense core is induced by the selection design. Its high pre-threshold density means that the stratification is sensitive to the threshold chosen; the seventieth percentile was selected for readability and the full sensitivity grid is reported in Appendix C. On the search-interest side, the analysis is confined to one national market; the Google series covers four groups from a single query, and its keyword sets are not symmetric with the Naver sets, so the platform contrast is exploratory only. Search interest indicates information seeking rather than purchasing, and the final month of the observation window is partial.
The thematic coding carries a further limitation that the validation made visible. Two blind coders agreed on only 65 of the 100 validation records (κ = 0.590), and against their consensus the rule is 61.5% accurate. The errors are not random: the priority order transfers records from livestream, logistics, technology and green products into the categories ranked above them, so the published single-label shares in Table 1 and Table 2 overstate circular economy and greenwashing and understate the lower-ranked themes. The re-estimate in Table A13 indicates the direction of that bias but rests on 65 manually coded records with a sampling weight of 7.9 in the larger stratum, so its intervals are too wide to support a corrected distribution, and the moderate agreement between the coders is itself evidence that the eight-category scheme is not cleanly separable from titles and abstracts alone. A coding scheme that resolved the priority problem—by requiring the matched term to occupy a syntactic position indicating the study’s object, or by multi-label assignment with explicit tie-breaking—would be the better instrument, and the corpus and scripts are supplied so that it can be built. Three further limitations follow from the other analyses added in revision. The structural network finding rests on a randomisation model that fixes keyword frequencies and assigns documents independently; this controls the confound the raw counts contain, but it does not reproduce the clustering that topic and venue impose on real corpora, so the expected counts are a benchmark rather than a faithful null. The anchor sensitivity reported in Table A4 tests two denominators, both drawn from the same platform and market, and cannot establish how the magnitudes would behave against a denominator constructed differently or in another market. And the composition-invariance of the anchored series, while it is the property the bridging procedure requires, was verified within a single collection configuration; agreement with an independently executed joint query over terms not co-queried here remains untested.
8.4. Recommendations for Future Research
Five directions follow. First, replication with indexed bibliographic databases would establish whether the thematic and structural findings reported here survive broader coverage. Second, cross-national replication with the anchored procedure would establish whether the magnitude gap is a Korean particularity or a general feature. Third, linking anchored search series to platform transaction records would allow the pre-search and post-search components of the attitude–behaviour gap to be estimated separately. Fourth, the governance blind spot invites direct work on verification mechanisms, certification visibility at the point of transaction, and accountability for claims made in transient formats. Fifth, the corpus and co-occurrence matrix assembled here could be maintained as a living review, with periodic re-screening under the same criterion, so that the divergence between scholarly and public attention can be tracked rather than inferred from a single window.
Supplementary Materials
The following supporting information can be downloaded at https://www.mdpi.com/article/10.3390/jtaer21110393/s1. Supplementary_Materials_Guide.docx: index of all files and the procedure for reproducing each result; Folder 01_corpus: retrieval export, screened corpus (N = 303), thematic codes and PRISMA counts (Figure 1); Folder 02_network: unthresholded and thresholded co-occurrence matrices in UCINET DL format, centrality and import logs, NetDraw input and sensitivity grids (Table 3, Table 4 and Table A6, Table A7 and Table A8); Folder 03_search_trends: keyword configuration, anchored Naver series, platform responses and probe verification (Table 8, Table 9 and Table 10, Table A2 and Table A3); Folder 04_venue_census: target-venue census (N = 1130), three retrieval passes and sustainability subset (Table 5, Table 6 and Table 7); Folder 05_scripts: retrieval, collection, screening and coding scripts; Folder 06_derived_tables: Table 1, Table 2, Table A10 and Table A11. Folder 07_coding_validation: completed coder workbooks, master key, confusion matrix, corrected thematic estimates and scoring scripts (Table A12 and Table A13).
Author Contributions
Conceptualization, C.-H.J.; methodology, C.-H.J. and C.B.; software, C.B.; validation, C.B. and C.Y.; formal analysis, C.B.; investigation, C.B. and C.Y.; resources, C.Y.; data curation, C.B.; writing—original draft preparation, C.-H.J.; writing—review and editing, C.-H.J., C.B. and C.Y.; visualization, C.B.; supervision, C.-H.J.; project administration, C.-H.J. All authors have read and agreed to the published version of the manuscript.
Funding
This research received no external funding.
Institutional Review Board Statement
Not applicable. This study analysed only publicly available bibliographic metadata and publicly available aggregate search-interest indices; it did not involve human participants, human material, or personal data, and institutional review board approval was therefore not required.
Informed Consent Statement
Not applicable.
Data Availability Statement
The original contributions presented in this study are included in the article and its Supplementary Materials. The screened corpus with thematic codes, the unthresholded and thresholded co-occurrence matrices in UCINET format, the UCINET output logs, the collection, screening and coding scripts, the keyword configuration and validation output, the anchored search-interest series and the platform responses from which they were derived are all provided as Supplementary Materials, and will additionally be deposited in a public repository with the DOI recorded in this statement upon acceptance. The search-interest data were derived from the following resources available in the public domain: Naver DataLab (https://datalab.naver.com) and Google Trends (https://trends.google.com). Both platforms return relative interest indices rather than absolute search volumes; the indices are reported as retrieved on 23 July 2026 and re-collected on 12 September 2026 for verification. API credentials required to re-execute the collection scripts are not distributed and must be obtained from the platform’s developer portal.
Acknowledgments
The authors did not use generative artificial intelligence tools to generate text, data or graphics, or to assist in study design, data collection, analysis or interpretation.
Conflicts of Interest
The authors declare no conflicts of interest.
Appendix A. Bibliographic Search Strategy
Axis A (commerce): digital commerce, e-commerce, electronic commerce, live commerce, livestream, social commerce, online retail, online shopping, mobile commerce, marketplace, omnichannel, online purchase, online consumer, e-tail.
Axis B (sustainability): sustainable, sustainability, green, eco-friendly, secondhand, circular economy, ethical consumption, greenwashing, environmental.
Axis C (perception): perception, attitude, awareness, consumer behaviour, purchase intention, adoption, intention, willingness.
Eligibility required at least one term from each axis in the title or abstract, applied post hoc to retrieved records. The identification query executed in Publish or Perish against Google Scholar on 23 July 2026 used the relevance-ranked keyword string reported in the Supplementary Materials (n = 700); the platform does not support field-delimited conjunction, so the three-axis criterion could not be executed as a search expression. The screening script that applies the criterion is included in the supplementary repository.
Appendix B
Appendix B.1. Search-Interest Keyword Groups and Anchoring
Table A1.
Keyword groups and their Boolean correspondence.
Anchoring procedure. Let a denote the anchor series within a request and ā its mean, and let ā0 denote the anchor mean in the reference request. Each non-anchor series s within that request is rescaled as s′ = s × (ā0/ā). The property was verified empirically rather than analytically: a probe group was included in every request alongside the anchor, and after rescaling, it was reproduced identically across all three requests and all fifty-five months (mean and maximum relative deviation 0.000%; Table A2). The rescaling factor was exactly 1.000 in every request, because the anchor is large enough to set the index ceiling irrespective of the other groups present. The operative safeguard is therefore the anchor’s presence in every request rather than the arithmetic rescaling.
Appendix B.2. Anchoring Verification and Anchor-Relative Change
Table A2.
Empirical verification of anchor rescaling (Naver DataLab). The probe group was included in every request alongside the anchor; after rescaling it should reproduce identically across requests.
Table A3.
Anchor-relative search interest, 2022–2025. Each group is expressed as a percentage of the anchor’s annual mean, which removes the common denominator shared by all series.
Table A4.
Anchor sensitivity. Each group is expressed against two alternative mainstream-commerce denominators, with 2022–2025 change under each.
Table A5.
Trend tests on the monthly anchor-relative series, 2022–2025 (n = 48 months).
Appendix C
Appendix C.1. Semantic Network Construction
Titles and abstracts of the 303 included studies were lowercased and tokenised. Function words and generic academic vocabulary were removed, multi-word concepts were consolidated into single tokens (for example, purchase intention, circular economy, social commerce), and morphological variants were merged. The thirty-three most frequent remaining keywords were retained as nodes and ties defined by document-level co-occurrence. The unthresholded network had 469 ties at a density of 0.888; a threshold of nine co-occurrences (seventieth percentile) reduced this to 160 ties at a density of 0.303. Centrality and k-core analyses were performed in UCINET 6.780 [46] with ties treated as valued, and visualisation in NetDraw.
Appendix C.2. Robustness of the Semantic Network
Table A6.
Threshold sensitivity of the full network. The same unthresholded matrix is cut at six percentiles of the co-occurrence distribution.
Table A7.
Network after removal of the sixteen eligibility-criterion (axis) terms, re-thresholded on the remaining distribution.
Table A8.
Lateral ties among subdomain keywords, computed on the unthresholded matrix and therefore independent of the threshold.
Table A9.
Frequency-normalised association between subdomain keywords and between subdomain and core keywords, with a randomisation test holding keyword frequencies fixed.
Appendix D. Thematic Coding Rules and Multi-Label Results
Coding was applied to the concatenation of title and abstract, lowercased. Each record was assigned to the first matching theme in the priority order below, which runs from the most lexically specific category to the most general. The complete regular-expression pattern set and the executable script are provided in the Supplementary Materials; the coding is deterministic and reproduces exactly from those files.
Table A10.
Multi-label prevalence compared with single-label assignment.
Table A11.
Multi-label prevalence by publication year (%). Columns do not sum to 100 because records may match several themes.
Table A12.
Manual validation of the rule-based thematic coding (stratified sample, n = 100).
Table A13.
Thematic distribution re-estimated from the manual consensus codes, with the sampling design weighted out.
References
- Bar Am, J.; Doshi, V.; Malik, A.; Noble, S.; Frey, S. Consumers Care About Sustainability—And Back It up with Their Wallets; McKinsey & Company and NielsenIQ: New York, NY, USA, 2023; Available online: https://www.mckinsey.com/industries/consumer-packaged-goods/our-insights/consumers-care-about-sustainability-and-back-it-up-with-their-wallets (accessed on 11 October 2026).
- Rita, P.; Ramos, R.F. Global research trends in consumer behavior and sustainability in e-commerce: A bibliometric analysis of the knowledge structure. Sustainability 2022, 14, 9455. [Google Scholar] [CrossRef] [Scilit]
- Zhang, M. Sustainability transitions in e-commerce research—Academic achievements and impediments. Circ. Econ. Sustain. 2023, 3, 1725–1746. [Google Scholar] [CrossRef] [Scilit] [PubMed]
- Cano, J.A.; Londoño-Pineda, A.; Rodas, C. Sustainable logistics for e-commerce: A literature review and bibliometric analysis. Sustainability 2022, 14, 12247. [Google Scholar] [CrossRef] [Scilit]
- Mucowska, M. Trends of environmentally sustainable solutions of urban last-mile deliveries on the e-commerce market—A literature review. Sustainability 2021, 13, 5894. [Google Scholar] [CrossRef] [Scilit]
- Aziz, S.; Maltese, I.; Marcucci, E.; Gatta, V.; Benmoussa, R.; Irhirane, E.H. Energy consumption and environmental impact of e-grocery: A systematic literature review. Energies 2022, 15, 7289. [Google Scholar] [CrossRef] [Scilit]
- Bălan, C. How does retail engage consumers in sustainable consumption? A systematic literature review. Sustainability 2021, 13, 96. [Google Scholar] [CrossRef] [Scilit]
- Shafi, S.; Mohamed, W.N.; Damaianti, I.; Salleh, H.S. Environmental consciousness in the digital era of online shopping: A systematic and bibliometric review. Int. J. Des. Nat. Ecodyn. 2024, 19, 971–984. [Google Scholar] [CrossRef] [Scilit]
- Song, J.; Jung, K.; Kam, J. Evidence of the time-varying impacts of the COVID-19 pandemic on online search activities relating to shopping products in South Korea. Humanit. Soc. Sci. Commun. 2023, 10, 669, Correction in Humanit. Soc. Sci. Commun. 2023, 10, 756. [Google Scholar] [CrossRef] [Scilit]
- Page, M.J.; McKenzie, J.E.; Bossuyt, P.M.; Boutron, I.; Hoffmann, T.C.; Mulrow, C.D.; Shamseer, L.; Tetzlaff, J.M.; Akl, E.A.; Brennan, S.E.; et al. The PRISMA 2020 statement: An updated guideline for reporting systematic reviews. BMJ 2021, 372, n71. [Google Scholar] [CrossRef] [Scilit] [PubMed]
- Bhardwaj, S.; Sreen, N.; Das, M.; Chitnis, A.; Kumar, S. Product specific values and personal values together better explains green purchase. J. Retail. Consum. Serv. 2023, 74, 103434. [Google Scholar] [CrossRef] [Scilit]
- Chan, R.Y.K. Determinants of Chinese consumers’ green purchase behavior. Psychol. Mark. 2001, 18, 389–413. [Google Scholar] [CrossRef] [Scilit]
- Paul, J.; Modi, A.; Patel, J. Predicting green product consumption using theory of planned behavior and reasoned action. J. Retail. Consum. Serv. 2016, 29, 123–134. [Google Scholar] [CrossRef] [Scilit]
- Yadav, R.; Pathak, G.S. Determinants of consumers’ green purchase behavior in a developing nation: Applying and extending the theory of planned behavior. Ecol. Econ. 2017, 134, 114–122. [Google Scholar] [CrossRef] [Scilit]
- Padmavathy, C.; Swapana, M.; Paul, J. Online second-hand shopping motivation: Conceptualization, scale development, and validation. J. Retail. Consum. Serv. 2019, 51, 19–32. [Google Scholar] [CrossRef] [Scilit]
- Onel, N. Transforming consumption: The role of values, beliefs, and norms in promoting four types of sustainable behavior. J. Consum. Behav. 2024, 23, 491–513. [Google Scholar] [CrossRef] [Scilit]
- Dong, X.; Zhao, H.; Li, T. The role of live-streaming e-commerce on consumers’ purchasing intention regarding green agricultural products. Sustainability 2022, 14, 4374. [Google Scholar] [CrossRef] [Scilit]
- Guo, Y.; Zhang, K.; Wang, C. Way to success: Understanding top streamer’s popularity and influence from the perspective of source characteristics. J. Retail. Consum. Serv. 2022, 64, 102786. [Google Scholar] [CrossRef] [Scilit]
- Sun, Y.; Shao, X.; Li, X.; Guo, Y.; Nie, K. How live streaming influences purchase intentions in social commerce: An IT affordance perspective. Electron. Commer. Res. Appl. 2019, 37, 100886. [Google Scholar] [CrossRef] [Scilit]
- Wongkitrungrueng, A.; Assarut, N. The role of live streaming in building consumer trust and engagement with social commerce sellers. J. Bus. Res. 2020, 117, 543–556. [Google Scholar] [CrossRef] [Scilit]
- Nemes, N.; Scanlan, S.J.; Smith, P.; Smith, T.; Aronczyk, M.; Hill, S.; Lewis, S.L.; Montgomery, A.W.; Tubiello, F.N.; Stabinsky, D. An integrated framework to assess greenwashing. Sustainability 2022, 14, 4431. [Google Scholar] [CrossRef] [Scilit]
- Szabo, S.; Webster, J. Perceptions of greenwashing: The interplay of empirical evidence, consumer skepticism, multidimensional perceptions, and corporate reputation. J. Bus. Ethics 2021, 171, 719–739. [Google Scholar] [CrossRef] [Scilit]
- Ohanian, R. Construction and validation of a scale to measure celebrity endorsers’ perceived expertise, trustworthiness, and attractiveness. J. Advert. 1990, 19, 39–52. [Google Scholar] [CrossRef] [Scilit]
- Park, H.J.; Lin, L.M. The effects of match-ups on the consumer attitudes toward internet celebrities and their live streaming contents in the context of product endorsement. J. Retail. Consum. Serv. 2020, 52, 101934. [Google Scholar] [CrossRef] [Scilit]
- Rungruangjit, W. What drives Taobao live streaming commerce? The role of parasocial relationships, congruence and source credibility. Heliyon 2022, 8, e09676. [Google Scholar] [CrossRef] [Scilit] [PubMed]
- Feng, Z.; Al Mamun, A.; Masukujjaman, M.; Wu, M.; Yang, Q. Impulse buying behavior during livestreaming: Moderating effects of scarcity persuasion and price perception. Heliyon 2024, 10, e28347. [Google Scholar] [CrossRef] [Scilit] [PubMed]
- Fu, J.-R.; Hsu, C.-W. Live-streaming shopping: The impacts of para-social interaction and local presence on impulse buying through shopping value. Ind. Manag. Data Syst. 2023, 123, 1861–1886. [Google Scholar] [CrossRef] [Scilit]
- Lu, B.; Chen, Z. Live streaming commerce and consumers’ purchase intention: An uncertainty reduction perspective. Inf. Manag. 2021, 58, 103509. [Google Scholar] [CrossRef] [Scilit]
- Ajzen, I. The theory of planned behavior. Organ. Behav. Hum. Decis. Process. 1991, 50, 179–211. [Google Scholar] [CrossRef] [Scilit]
- Steg, L. Psychology of climate change. Annu. Rev. Psychol. 2023, 74, 391–421. [Google Scholar] [CrossRef] [Scilit] [PubMed]
- Steg, L.; Bolderdijk, J.W.; Keizer, K.; Perlaviciute, G. An integrated framework for encouraging pro-environmental behaviour: The role of values, situational factors and goals. J. Environ. Psychol. 2014, 38, 104–115. [Google Scholar] [CrossRef] [Scilit]
- Stern, P.C. Toward a coherent theory of environmentally significant behavior. J. Soc. Issues 2000, 56, 407–424. [Google Scholar] [CrossRef] [Scilit]
- Podsakoff, P.M.; MacKenzie, S.B.; Lee, J.-Y.; Podsakoff, N.P. Common method biases in behavioral research: A critical review of the literature and recommended remedies. J. Appl. Psychol. 2003, 88, 879–903. [Google Scholar] [CrossRef] [Scilit] [PubMed]
- Youn, C.; Jung, H.J. Semantic network analysis to explore the concept of sustainability in the apparel and textile industry. Sustainability 2021, 13, 3813. [Google Scholar] [CrossRef] [Scilit]
- Mustak, M.; Salminen, J.; Plé, L.; Wirtz, J. Artificial intelligence in marketing: Topic modeling, scientometric analysis, and research agenda. J. Bus. Res. 2021, 124, 389–404. [Google Scholar] [CrossRef] [Scilit]
- Netzer, O.; Feldman, R.; Goldenberg, J.; Fresko, M. Mine your own business: Market-structure surveillance through text mining. Mark. Sci. 2012, 31, 521–543. [Google Scholar] [CrossRef] [Scilit]
- Choi, H.; Varian, H. Predicting the present with Google Trends. Econ. Rec. 2012, 88, 2–9. [Google Scholar] [CrossRef] [Scilit]
- Nghiem, L.T.P.; Papworth, S.K.; Lim, F.K.S.; Carrasco, L.R. Analysis of the capacity of Google Trends to measure interest in conservation topics and the role of online news. PLoS ONE 2016, 11, e0152802. [Google Scholar] [CrossRef] [Scilit] [PubMed]
- Dabbous, A.; Horn, M.; Croutzet, A. Measuring environmental awareness: An analysis using Google search data. J. Environ. Manag. 2023, 346, 118984. [Google Scholar] [CrossRef] [Scilit] [PubMed]
- Springer, S.; Strzelecki, A.; Holmes, B.; Ziermann-Canabarro, J.M.; Kaatz, M.; Zieger, M. Setting trends with Google: Limits and perspectives when utilising search engine data. Qual. Quant. 2026, 60, 3923–3942. [Google Scholar] [CrossRef] [Scilit]
- Rovetta, A. Reliability of Google Trends: Analysis of the limits and potential of web infoveillance during COVID-19 pandemic and for future research. Front. Res. Metr. Anal. 2021, 6, 670226. [Google Scholar] [CrossRef] [Scilit] [PubMed]
- Cebrián, E.; Domenech, J. Addressing Google Trends inconsistencies. Technol. Forecast. Soc. Change 2024, 202, 123318. [Google Scholar] [CrossRef] [Scilit]
- Hölzl, J.; Keusch, F.; Sajons, C. The (mis)use of Google Trends data in the social sciences—A systematic review, critique, and recommendations. Soc. Sci. Res. 2025, 126, 103099. [Google Scholar] [CrossRef] [Scilit] [PubMed]
- Harzing, A.W. Publish or Perish. 2007. Available online: https://harzing.com/resources/publish-or-perish (accessed on 23 July 2026).
- Tricco, A.C.; Lillie, E.; Zarin, W.; O’Brien, K.K.; Colquhoun, H.; Levac, D.; Moher, D.; Peters, M.D.J.; Horsley, T.; Weeks, L.; et al. PRISMA extension for scoping reviews (PRISMA-ScR): Checklist and explanation. Ann. Intern. Med. 2018, 169, 467–473. [Google Scholar] [CrossRef] [Scilit] [PubMed]
- Borgatti, S.P.; Everett, M.G.; Freeman, L.C. Ucinet for Windows: Software for Social Network Analysis; Analytic Technologies: Harvard, MA, USA, 2002. [Google Scholar]
- van Eck, N.J.; Waltman, L. How to normalize cooccurrence data? An analysis of some well-known similarity measures. J. Am. Soc. Inf. Sci. Technol. 2009, 60, 1635–1651. [Google Scholar] [CrossRef] [Scilit]
- Mann, H.B. Nonparametric tests against trend. Econometrica 1945, 13, 245–259. [Google Scholar] [CrossRef] [Scilit]
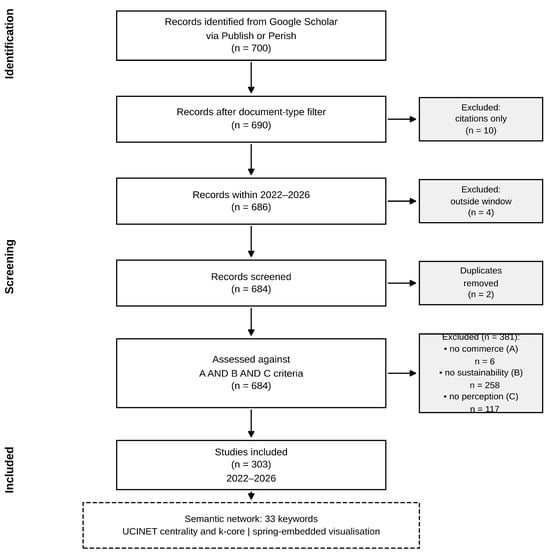
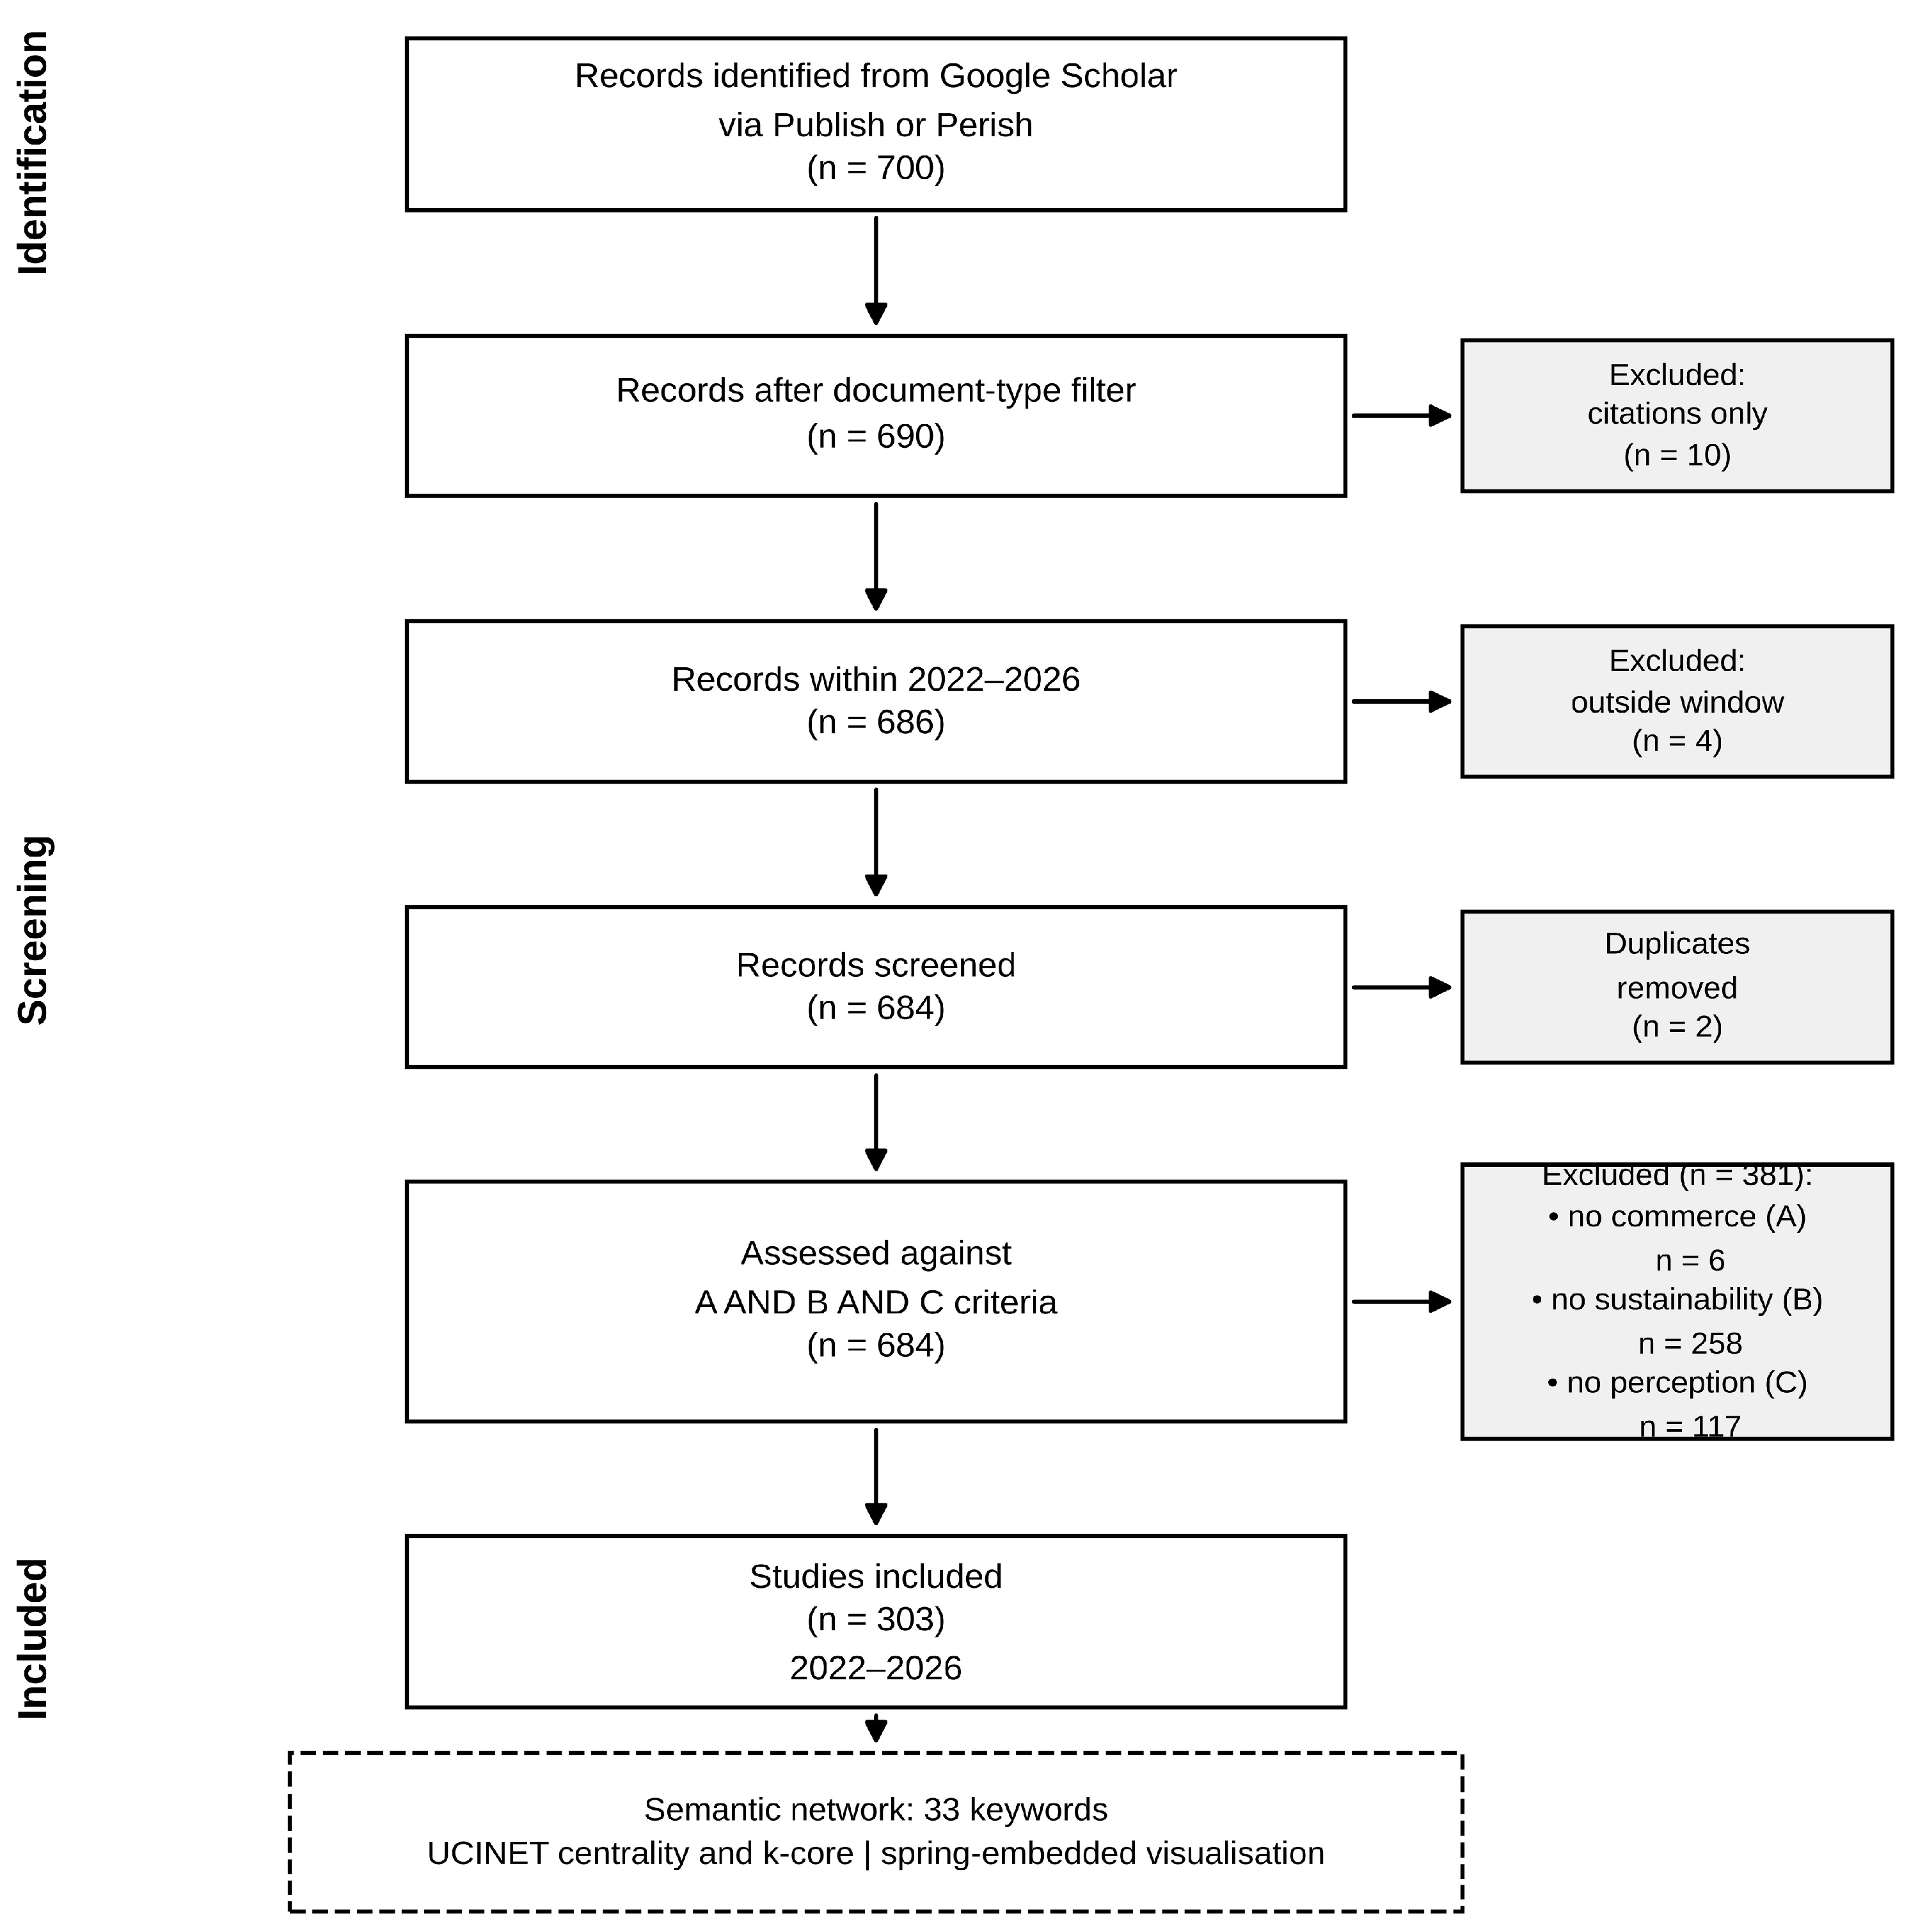
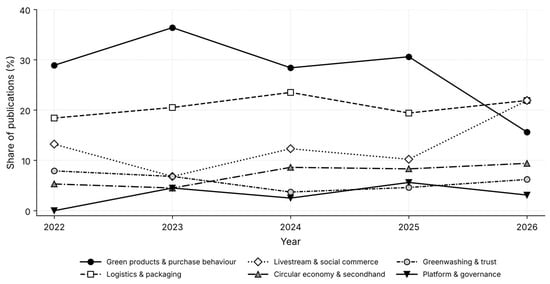
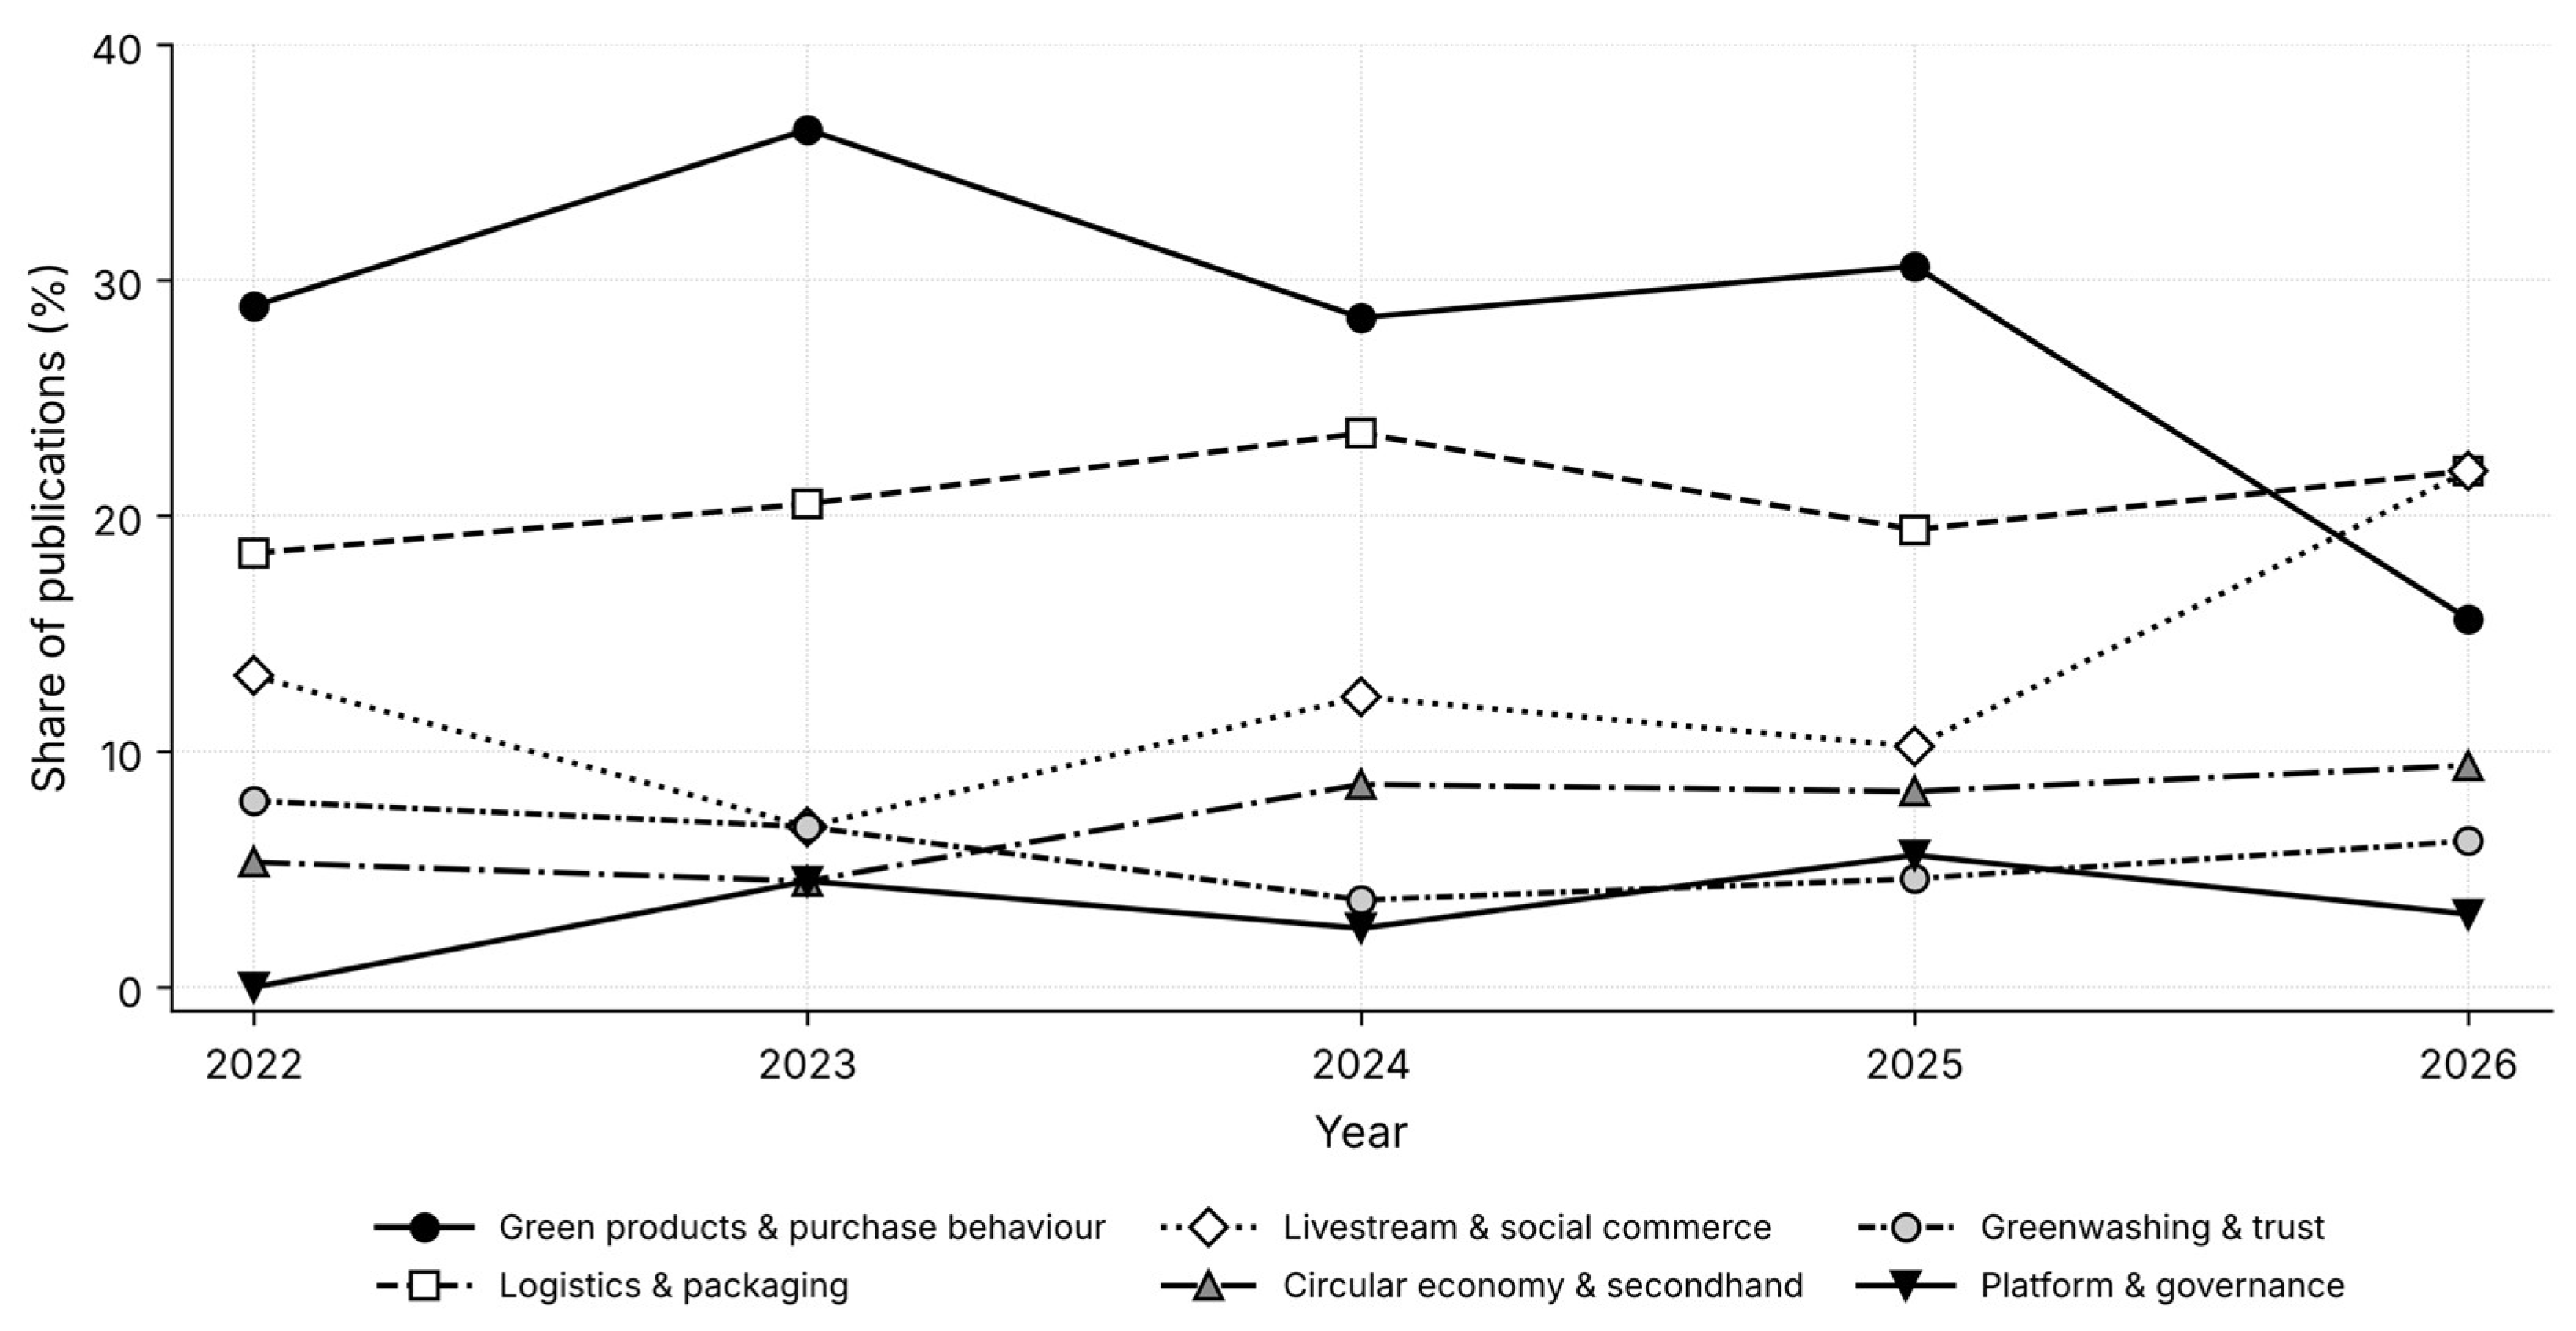
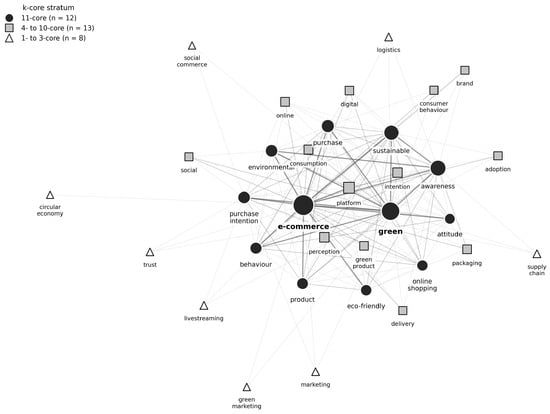
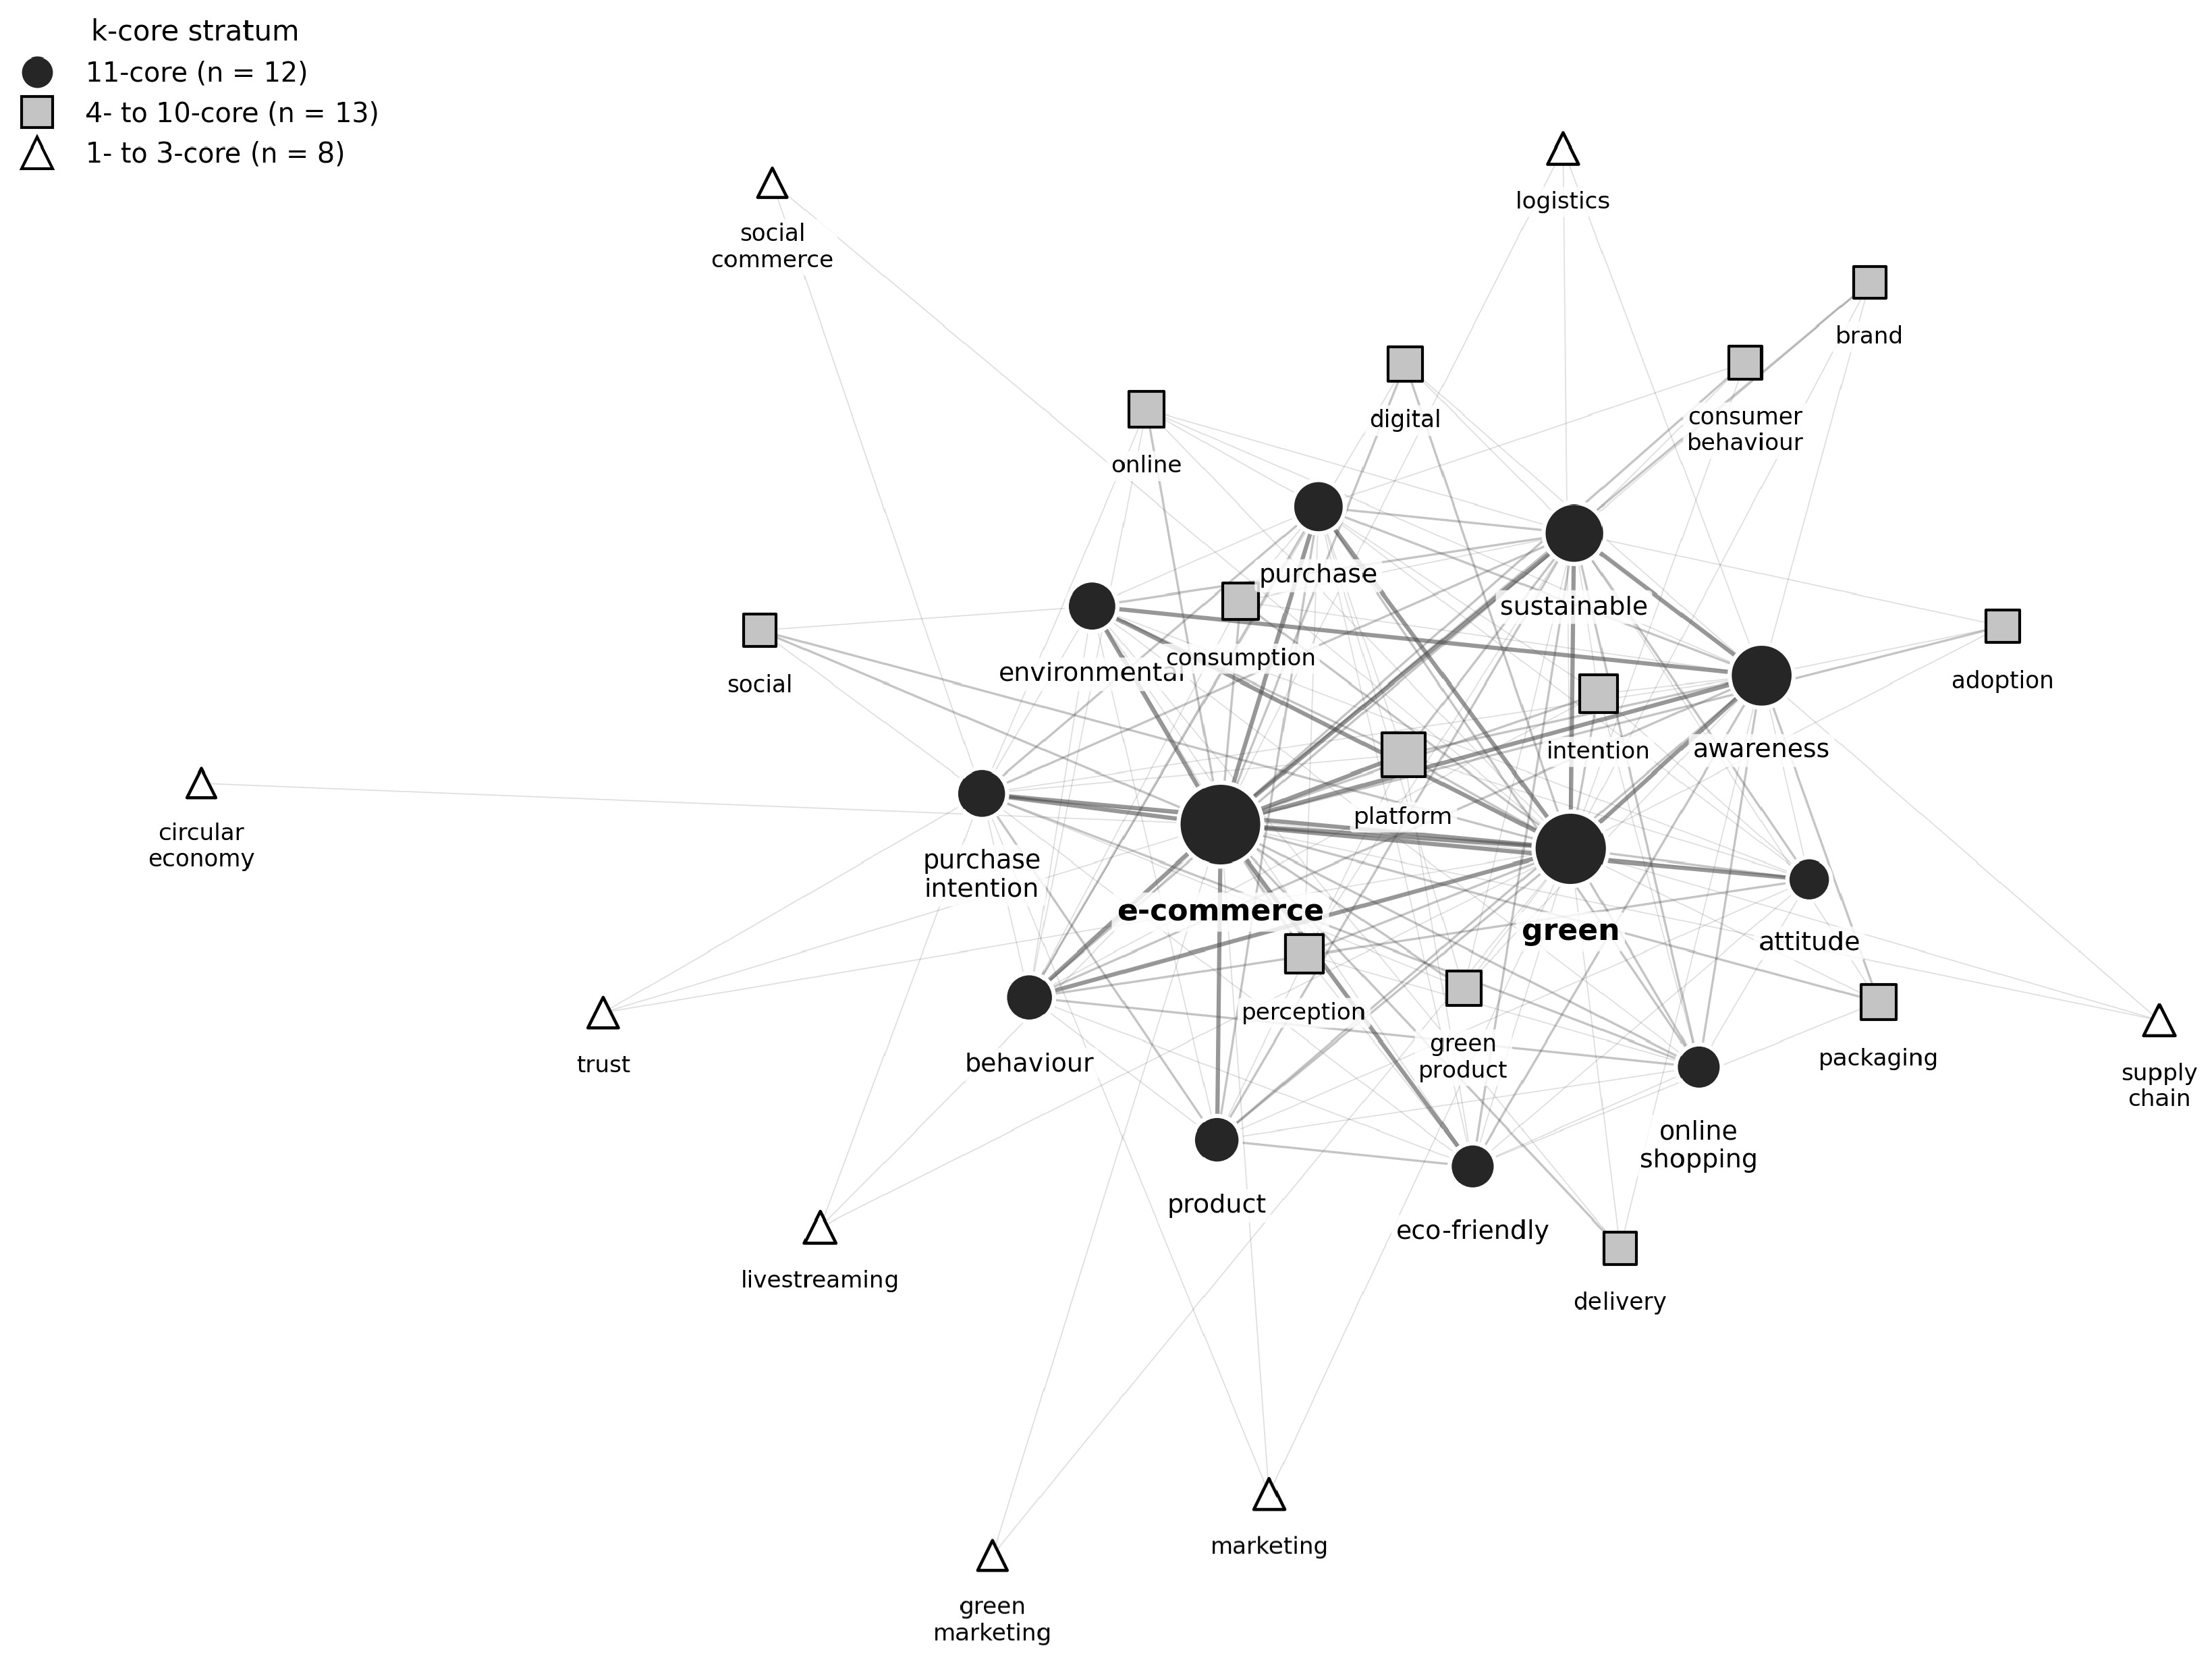
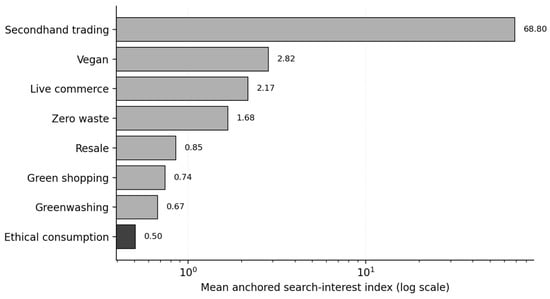
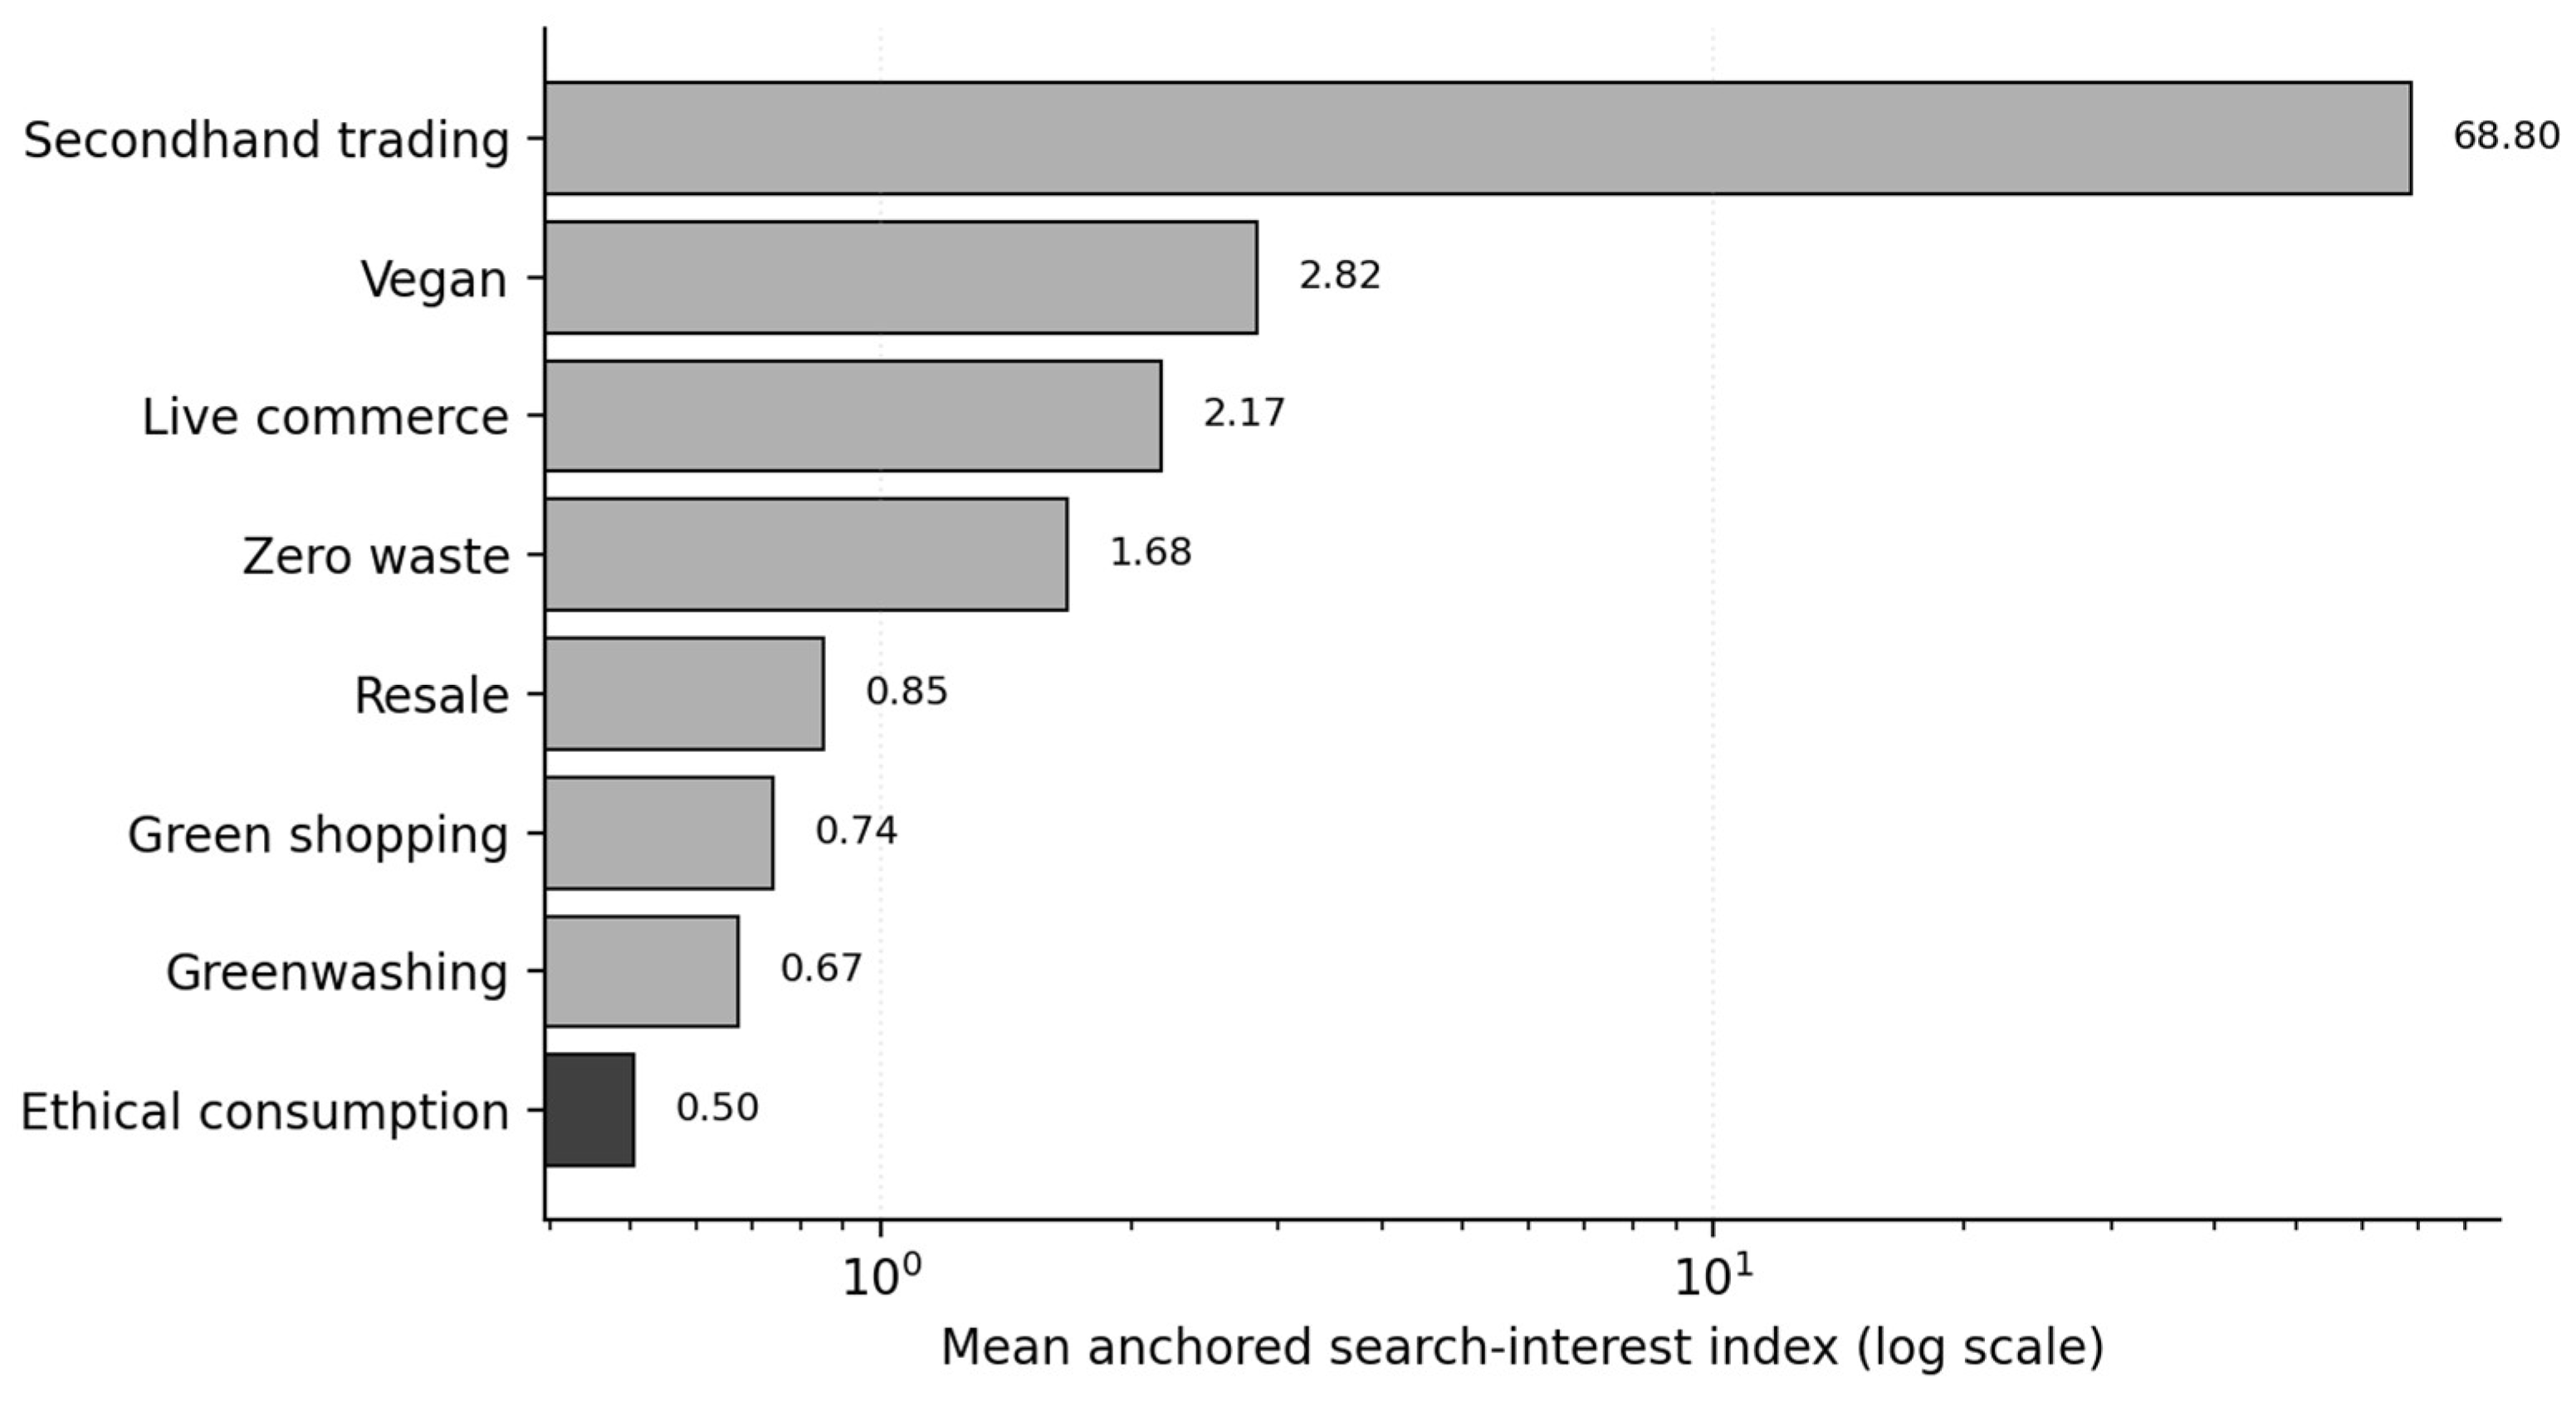
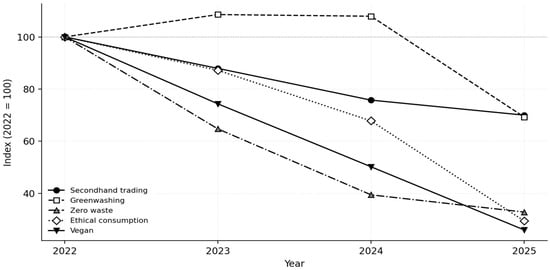
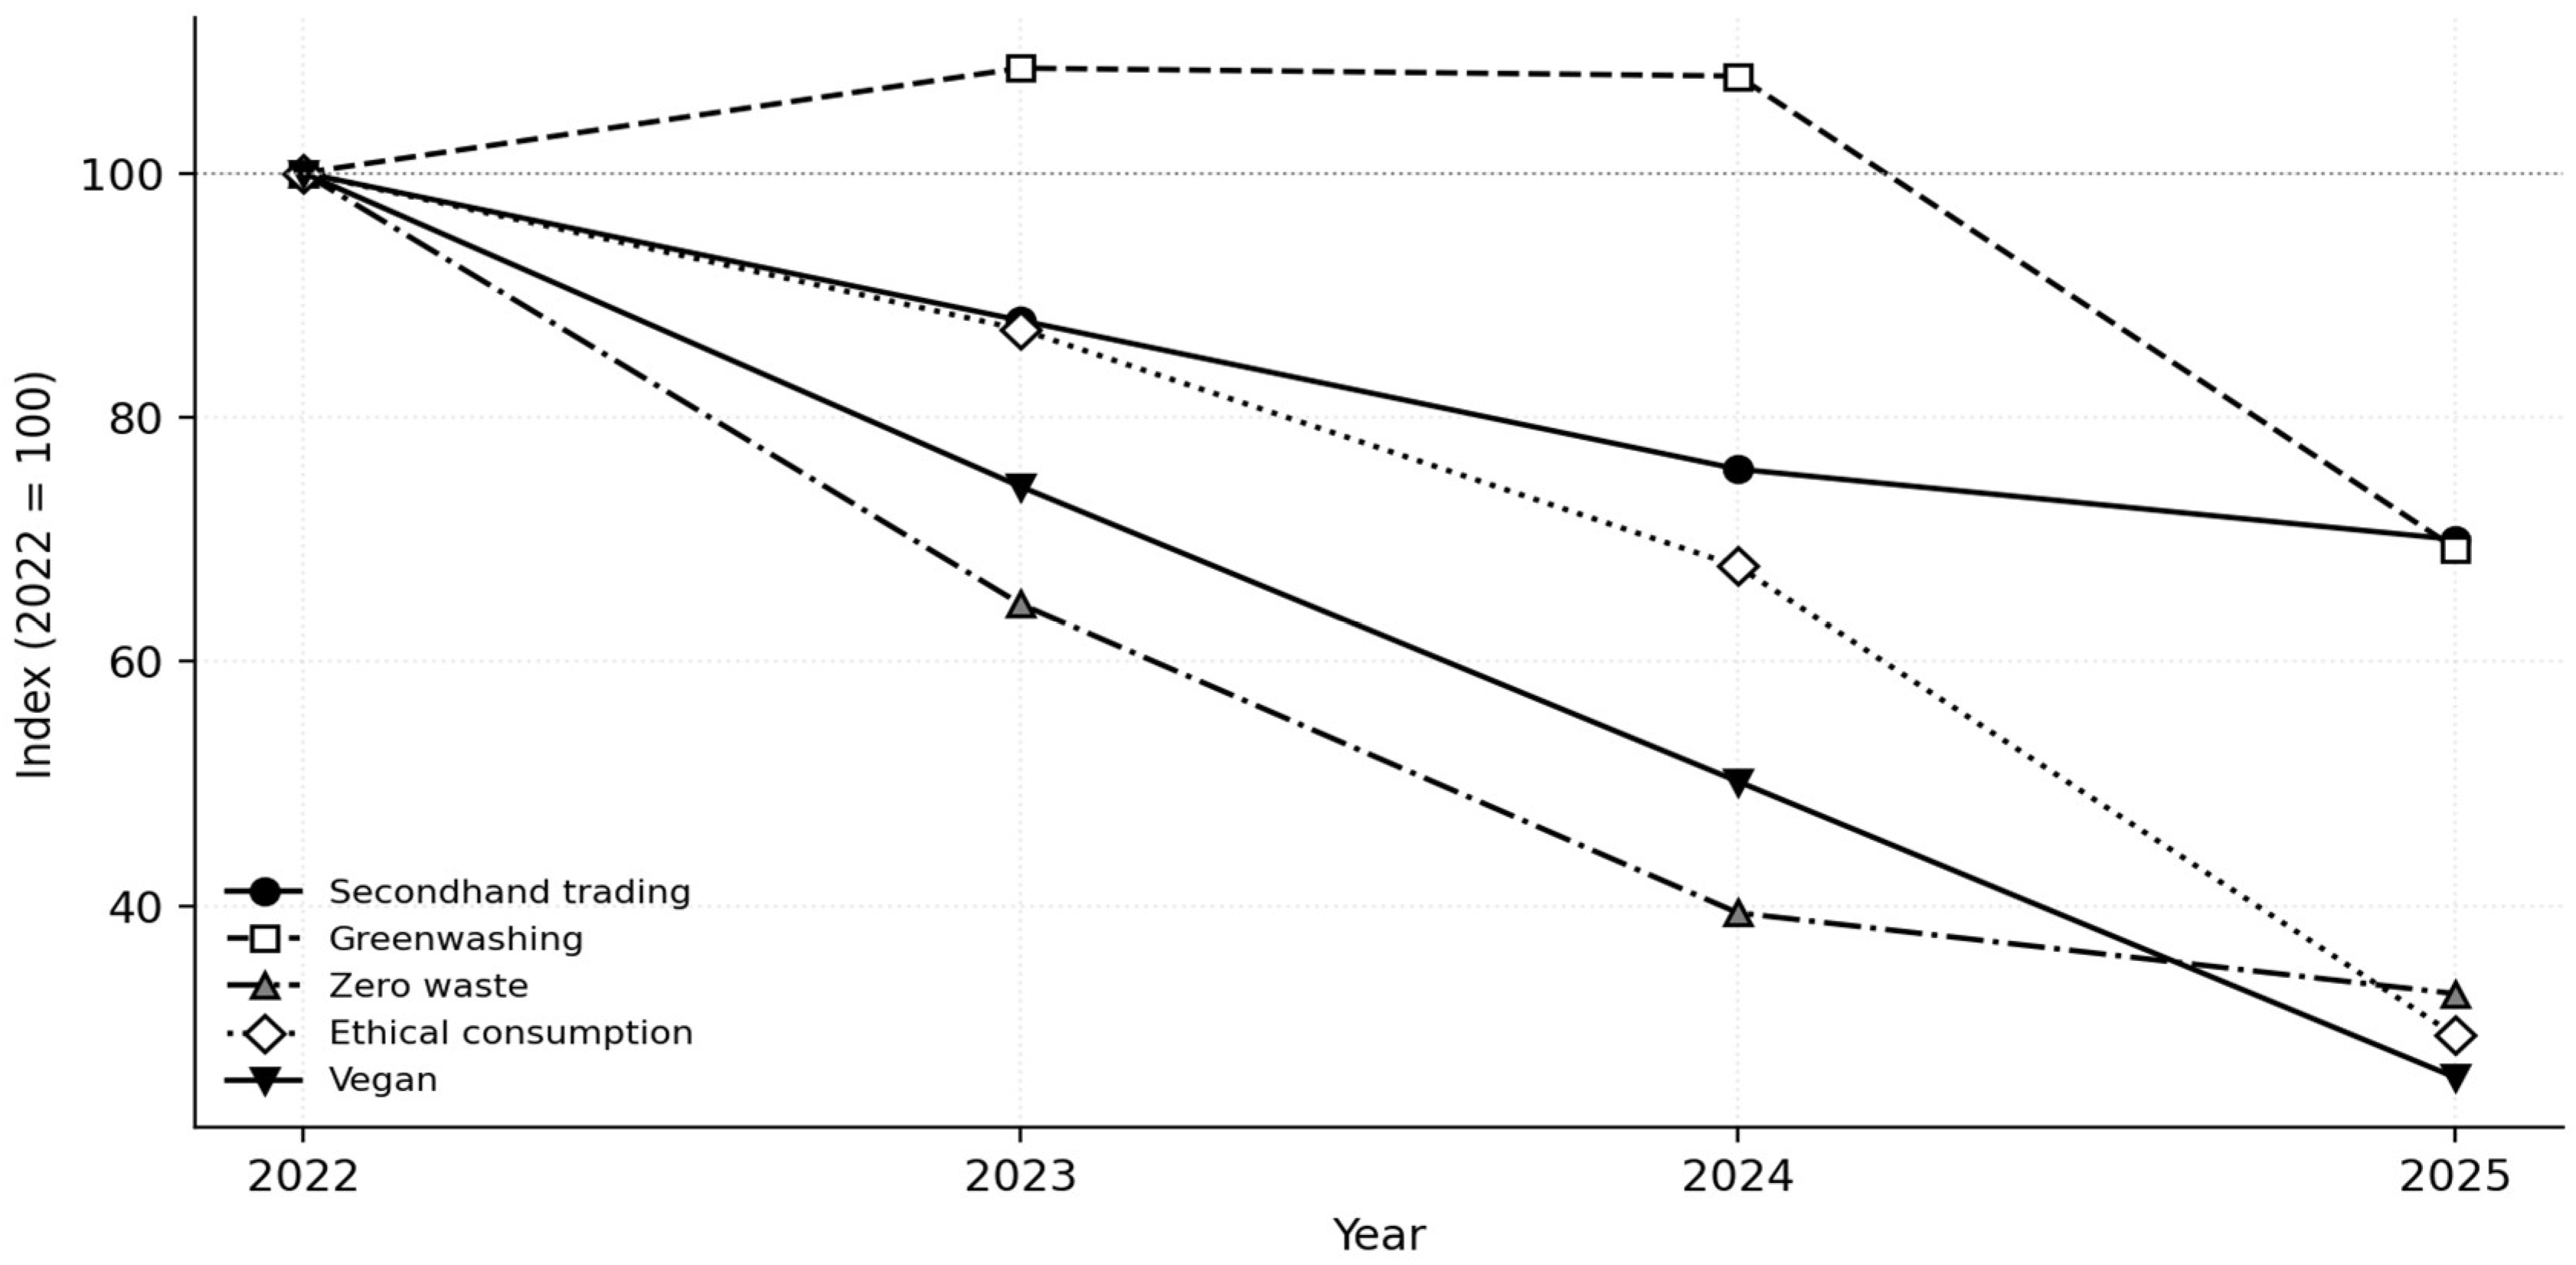

Disclaimer/Publisher’s Note: The statements, opinions and data contained in all publications are solely those of the individual author(s) and contributor(s) and not of MDPI and/or the editor(s). MDPI and/or the editor(s) disclaim responsibility for any injury to people or property resulting from any ideas, methods, instructions or products referred to in the content. |
© 2026 by the authors. Licensee MDPI, Basel, Switzerland. This article is an open access article distributed under the terms and conditions of the Creative Commons Attribution (CC BY) license.