


Abstract
Increasingly, hotel guests form expectations about their stay based on content that is available through digital channels before they arrive, while at the same time hotels are incorporating digital technologies into the services they provide on site; however, these two aspects have mostly been examined in isolation, and the combined impact of them on the multisensory impression associated with satisfaction and loyalty has not yet been thoroughly investigated. The present study proposes and tests a structural model in which the influence of digital content is associated with tourists’ sensory expectations prior to their arrival, and this, together with the degree of digital service integration, is associated with the multisensory experience reported during the stay, which in turn is associated with visitor satisfaction and loyalty via both direct and indirect paths. Data from 553 Romanian tourists were analyzed using covariance-based structural equation modeling, and the full and partial mediation models were compared by means of a nested chi-square test. All six hypotheses were confirmed. The partial mediation model provided superior fit (Δχ2(1) = 162.53, p < 0.001), and the direct effect of Multisensory Experience on Loyalty (β = 0.561) substantially exceeded the satisfaction-mediated indirect path (β = 0.119), while Digital Content Influence was the strongest single predictor in the model (β = 0.785 on Sensory Expectations). This research extends both servicescape theory and expectation-confirmation theory to the context of digitally mediated hospitality, with practical relevance for hotel managers and digital travel platforms regarding the joint role of pre-arrival content and on-site digital infrastructure associated with the guest experience, and potential, though untested, implications for destination-level standards relating to review authenticity and content quality.
1. Introduction
Digitalization has fundamentally changed the tourist decision-making process. Prospective guests no longer rely primarily on brochures, agents, or word-of-mouth confined to their close-knit social circle; instead, they draw on online reviews, user-generated photographs and videos, social media content, and influencer-generated material to evaluate hotels they have never physically encountered [1,2]. This shift matters because hotel services are intangible and experiential by nature: unlike a physical product, a hotel stay cannot be inspected, tested, or returned before purchase, which leaves prospective guests reliant on digitally mediated cues to reduce the uncertainty inherent in the booking decision [3].
The hotel experience is increasingly understood as multisensory. Guests respond not only to price or location, but also to visual design, sounds, ambient scents, the comfort of the room and bedding, and the quality of food. This perspective is consistent with servicescape theory, which emphasizes the role of the physical environment in shaping customers’ cognitive, emotional, and behavioral responses [4]. It is also supported by sensory marketing research showing that experiences involving multiple senses can influence perceptions, judgments, and behavior more strongly than stimulation through a single sense [5]. In hospitality, the guest experience therefore reflects the combined sensory interaction with the hotel environment, rather than simply the individual services or amenities provided.
These two developments are increasingly connected, although their relationship has received limited attention in the literature. Before a stay, exposure to online reviews, photographs, and influencer content is related to the expectations guests hold and the impression they form of the hotel before arrival, consistent with expectation-confirmation theory [6]. At the same time, digital technologies have become an important part of the hotel experience itself, through services such as mobile check-in, smart-room controls, and digital concierge systems [7]. However, greater use of technology does not necessarily lead to a better guest experience. When digital services are poorly designed or difficult to use, they may create inconvenience rather than improve the stay [8].
Pre-arrival digital content and digital services used during the stay have generally been examined separately. Research on digital content has focused mainly on outcomes such as booking intentions and review credibility, while studies of digital service integration have concentrated more on technology acceptance. Less is known about how these factors relate to the multisensory experience during a stay and how this experience, in turn, is linked to satisfaction and loyalty. Previous research shows that positive perceptions of service quality increase guests’ intentions to return and recommend [9,10], but it remains unclear whether an integrated five-sense experience is related to loyalty entirely through satisfaction or also has a direct association. More broadly, this highlights the need to understand whether digital cues encountered before purchase remain associated with consumers’ evaluations after consumption, rather than being related only to the initial purchase decision.
This study addresses the gap by proposing and empirically testing a conceptual model that combines two complementary digital pathways into one structural framework. The first of these is an informational pathway that occurs before consumption, whereby Digital Content Influence is related to tourists’ Sensory Expectations before their arrival. The second is an on-site experiential pathway, through which Digital Service Integration is linked to the Multisensory Experience that guests create during their stay. The two pathways come together with Multisensory Experience as the key experiential element in the model, and it is hypothesized that this experience is in turn related to Satisfaction and to Loyalty, both directly and through Satisfaction. The model as a whole sets out and tests six hypotheses (H1 to H6), one of which involves a formal comparison between the cases of full and partial mediation regarding the relationship between Multisensory Experience and Loyalty.
The research was carried out among tourists who had previous experience of staying in hotels, employing a structured questionnaire which was administered in Romanian and then back-translated into English in accordance with standard cross-cultural translation methods. The final sample consisted of 553 valid responses (92.4% of the respondents having stayed in a hotel in the 12 months before the study), and the proposed model was estimated using covariance-based structural equation modeling, which allowed the measurement properties of each construct to be assessed separately from the structural relationships.
This study makes three key contributions to the fields of electronic commerce and digital hospitality by bringing together the pre-consumption digital environment, the on-site physical and digitally mediated experience, and the post-consumption behavioral response into one explanatory framework. Specifically, the study provides retrospective, cross-sectional evidence that pre-purchase digital cues are associated not only with the initial booking decision but also with later evaluation, through their link with sensory expectations, which in turn go together with the guest’s on-site experience, satisfaction, and loyalty—evidence consistent with online-to-offline informational persistence. By jointly modeling pre-arrival digital content and on-site digital service integration as two pathways converging on a single experiential construct, the study also speaks to omnichannel e-commerce research concerned with how digital and physical touchpoints jointly relate to a unified customer experience, rather than operating as independent episodes.
This study extends previous research on digital influence, which has largely focused on booking intentions and technology acceptance, by examining the multisensory experience as a link between pre-arrival digital content, on-site digital services, satisfaction, and loyalty. It also examines whether the link between the multisensory experience and loyalty runs entirely through satisfaction or whether a direct relationship remains. From a managerial perspective, the findings provide insight into how both pre-arrival digital content and on-site digital services relate to the guest experience and, ultimately, to loyalty.
2. Literature Review and Hypothesis Development
2.1. Digital Content Influence, Sensory Expectations, and the Multisensory Experience
The process by which tourists make up their minds about holidays has been fundamentally transformed, as potential visitors now obtain, assess, and interpret hospitality information through digital means. Since hotel products are intangible and experience-based, their features cannot be fully judged before consumption; tourists therefore rely on digitally mediated information—online reviews, photographs, videos, blogs, social media, and influencer content—to reduce uncertainty and form initial ideas about the accommodation experience [1,2,11]. The way this influence works is usually illustrated by the Elaboration Likelihood Model, which distinguishes central-route processing (careful examination of review content) from peripheral-route processing (heuristic cues such as reviewer reputation) [12], and the closely related Information Adoption Model, centered on argument quality and source credibility [13]. ELM and IAM are invoked here as motivating, contextual frameworks rather than directly tested mechanisms: the present study does not separately measure argument quality, involvement, processing route, or source credibility, and DCI instead captures a broad evaluative judgment of digital content’s influence.
Electronic word-of-mouth is especially significant here, since it lets potential guests read detailed, experience-based accounts of service encounters, facilities, and environmental conditions that would otherwise be hard to assess prior to arrival, shaping the expectations guests bring to their own visit [1,14]. The growing importance of online reviews in accommodation choice confirms that digitally shared experiences function as a key reference point for consumers [2,3], shaped in turn by the motivations behind why reviews are written and by their cumulative influence on how future guests select a property. Visually rich content—photographs, videos, and vlogger-created material—has a particularly strong impact, since it allows consumers to form detailed mental pictures of hospitality environments and can measurably influence booking intentions [15,16,17]. Yet this inferential ability should not be exaggerated: digital content is inevitably indirect and mediated, and guests discount reviews that seem overly promotional or inconsistent with other sources [11]. The strength of this relationship depends on perceived credibility, shaped by provider disclosure on booking platforms [18], guests’ own hedonic motivations [19], and platform or website quality [20], rather than simply on the amount or vividness of content encountered.
This mechanism matters most at the sensory level, since a hotel stay is inherently multisensory (visual, auditory, olfactory, tactile, and gustatory dimensions, detailed further below), and guests can only directly experience these stimuli on site. Digital content instead provides hints—descriptions of comfort, breakfast quality, noise level, cleanliness, or interior aesthetics—that let potential guests infer the sensory qualities of a hotel before arrival [14]. Prior research has mainly examined how such content affects credibility, engagement, and behavioral intentions [1,11,15], giving comparatively little attention to its role in setting sensory expectations specifically; the present study addresses this gap by treating Digital Content Influence as a factor associated with the sensory characteristics guests anticipate. On this basis:
H1.
Digital Content Influence has a positive and significant effect on tourists’ Sensory Expectations regarding the hotel experience.
These sensory expectations—mental representations of anticipated perceptual features—function as a cognitive reference point against which the real hotel environment is assessed. The expectation–confirmation approach explains why: consumers form expectations before consumption, then compare perceived performance against them, shaping how on-site stimuli are interpreted [6]. Digital mediation reinforces this: virtual tours affect evaluations of the real experience [21], customer experience includes both conscious and less explicit perceptual processes [22], and servicescapes are increasingly understood as multidimensional rather than isolated features [23,24]—so anticipated and actual environments should not be treated as fully separate stages of consuming hospitality.
However, this effect does not always lead to a positive outcome. When expectations are set too high, the actual experience may fail to meet them, resulting in negative disconfirmation and a less favorable evaluation [6]. Vivid and idealized digital content can contribute to this by raising expectations before the stay. Expectations about aspects such as design, comfort, and food quality may then serve as reference points against which guests evaluate their actual experience. In this way, sensory expectations help connect what guests see and anticipate online before their stay with what they experience at the hotel. Although expectations, servicescapes, and customer evaluations have been widely studied, the connection between the pre-arrival digital experience and the multisensory experience during the stay has received less attention. Based on this reasoning:
H2.
Sensory Expectations have a positive and significant effect on tourists’ perceived Multisensory Experience during the hotel stay.
2.2. Multisensory Experience and Satisfaction
Since the hospitality services are experiential, customer satisfaction must be understood in a way that extends beyond an evaluation of functional performance. When people use hotels, they have a series of continuous interactions with the physical and atmospheric environment and are thus exposed to a number of sensory stimuli during their stay. The way in which a hotel experience is assessed is therefore influenced not just by service efficiency or by the meeting of functional requirements, but also by the way in which the environment is perceived by means of sight, sound, smell, touch, and taste. In this context, the multisensory experience is a key element in the overall assessment of hospitality consumption.
The theoretical basis for this relationship can be found in the servicescape framework, which considers the physical service environment as a factor that influences customers’ cognitive, affective, and behavioral responses [4]. This is particularly important in the hospitality industry, since guests stay in the service environment for long periods and have repeated interactions with its physical and atmospheric features. More up-to-date research into servicescapes supports this multi-dimensional perspective by demonstrating that environmental characteristics form an essential part of the hospitality experience and affect customers’ later evaluations [23,24]. This applies not only to traditional hotel settings but also to specialized servicescapes such as ski resorts, where the physical, social and symbolic environmental dimensions similarly influence the guest experience and lead to loyalty [25].
Sensory marketing theory provides further support for this perspective by emphasizing that consumption experiences are shaped by multiple senses working together, influencing how consumers perceive, evaluate, and respond to their environment [5]. In hospitality, the guest experience therefore extends beyond visual appeal. Interior design, spatial layout, lighting, sound, scent, tactile comfort, and taste all contribute to how guests perceive and experience the hotel as a whole.
The various senses are involved throughout the different stages and areas of a stay. Visual stimuli have an effect on the first impressions of the rooms and common areas; the acoustic environment can contribute to a feeling of tranquillity, privacy or disturbance; olfactory signals affect the way people perceive the cleanliness and the atmosphere; and the tactile features—such as the bedding, the furniture, the temperature and the texture of the materials—are closely linked to physical comfort. Analysis of the reviews written by guests shows that these non-visual senses do indeed have real importance in terms of evaluation: the haptic and auditory cues included in online reviews have an influence on hotel ratings that is stronger than that of visual cues or general sentiment, especially in cases where the actual experience had been negative [26]. The taste sensations, which are mostly experienced during breakfast, at the restaurant and through beverage services, provide an additional aspect that can affect the overall assessment of the stay. Rather than acting on their own, these sensory inputs come together to form a unified perceptual understanding of the hospitality experience.
Recent empirical studies provide increasing support for this idea. Liu, Xiao, and Wang [22] demonstrate that the customer experience in hotels includes both conscious and less explicitly expressed perceptual processes, highlighting the role of the environmental and sensory features in influencing the customers’ evaluations of the experience. As discussed above, servicescape research confirms the strategic significance of environmental design for hospitality evaluations [23,24].
The connection between multisensory experience and satisfaction may also be explained by considering the evaluative character of satisfaction. Satisfaction results from consumers’ general judgement as to whether a consumption experience provides the expected or desired value [6]. Positive sensory experiences can help this judgement by increasing comfort, pleasure, perceived quality, and the sense of coherence of the experience; on the other hand, sensory inconsistencies such as excessive noise, unpleasant odours, uncomfortable rooms, or disappointing food can weaken the evaluation of a stay even if the essential functional services are adequately provided. Satisfaction in the hospitality sector is therefore at least in part based on the cumulative interpretation of a number of environmental and sensory encounters.
Current research into the hotel experience supports the connection between the quality of the experience and the evaluation afterwards. Hussain et al. [9] regard service quality and customer satisfaction as key factors in achieving positive tourism results, and studies of experiences in thematically designed hotels show that both experiential and environmental features are important sources of customer value [22]. Evidence from smart hotel environments also indicates the same thing: satisfaction is determined not only by the technological functions but also by the wider range of service features that contribute to the experience. Evidence of this kind supports an integrated rather than a technology-driven approach to the hotel experience.
Not all sensory aspects carry equal weight in a guest’s overall assessment, and their relative importance likely varies by hotel type and trip purpose—a business traveler may prioritize acoustic comfort and connectivity, while a leisure guest may prioritize food. Compensatory or threshold effects are also possible: one strongly negative sensory experience could disproportionately depress satisfaction regardless of how positively other senses are perceived, rather than being simply averaged in. Treating ME as a single integrated construct is therefore a boundary condition of the proposed relationship. The multisensory experience can therefore be considered an important antecedent of satisfaction. When visual, auditory, olfactory, tactile, and gustatory elements work together to create a positive experience, they can enhance guests’ overall evaluation of their stay. This perspective extends beyond traditional approaches to service quality by recognizing that satisfaction depends not only on functional aspects of the service but also on how guests experience the hotel through their senses. This is particularly relevant in hospitality, where creating memorable experiences has become an important way for hotels to differentiate themselves.
On this basis, the following hypothesis is proposed:
H3.
Multisensory Experience has a positive and significant effect on tourists’ Satisfaction with the hotel experience.
2.3. Satisfaction and Loyalty
Customer satisfaction is at the heart of research in the fields of hospitality and tourism since it can account for the way people evaluate their experience after using a service and the actions they take as a result. In service situations, satisfaction means a general judgement as to whether the experience delivered meets or goes beyond what was expected [6]. In the hospitality industry, this kind of evaluation is especially complicated since it is the result of a cumulative judgement based on a number of interactions—these include encounters with staff, the physical facilities, technological interfaces, the service processes, and the wider experiential environment. Satisfaction is therefore an integrative judgement made after the consumption of a service by means of which guests assess the overall quality and value of their hotel experience.
The link between customer satisfaction and loyalty is based on the idea that positive assessments of previous purchases decrease the uncertainty consumers face when making future buying decisions and strengthen their preference for a particular provider. Yet loyalty extends beyond simply making repeat purchases; it also has attitudinal and behavioral aspects. In the field of hospitality, loyalty is usually expressed through customers’ intentions to go back to a property, to recommend it, to share their positive opinions, and to keep the hotel as one of their preferred choices when planning future visits. These actions are especially important in a highly competitive market in which offers can be easily compared and switching costs are low.
As discussed in Section 2.1, the relationship between satisfaction and loyalty follows the expectation–confirmation logic [6], whereby positive satisfaction ratings increase the likelihood of favorable behavioral intentions. Satisfaction therefore functions as a mechanism for evaluation that converts the experience of consumption into future behavior.
Recent empirical evidence continues to support satisfaction as a precursor to loyalty across hospitality, retail, and brand-experience contexts: Hussain et al. [9] confirm this in resort hotels, the same mechanism holds in digital retail environments where perceived value mediates online service quality and loyalty [27], and Brakus et al. [28] show that satisfaction mediates the effect of customer experience on loyalty—together indicating that the satisfaction-loyalty link is not confined to face-to-face hotel encounters.
Although this relationship is well established, the broader body of literature on satisfaction and loyalty includes qualifications. It is not the case that satisfied guests always turn their evaluation into loyalty, especially in hospitality markets where prices are highly sensitive, where booking is driven by aggregators, or where certain groups of travellers prefer novelty—factors which can weaken the link between satisfaction and loyalty even if satisfaction is high. As a result, loyalty in the choice of accommodation may be more dependent than it is in other service industries, since switching in those industries involves greater relational or financial costs. It therefore follows that in the hospitality context satisfaction should be regarded as a necessary but not always sufficient condition for loyalty.
Within the conceptual framework of this study, satisfaction is placed right before loyalty since it is the main evaluative reaction to the multisensory hotel experience. This arrangement enables a clear distinction to be made between the experience itself—that is, the guest’s combined sensory perceptions—and the assessment of that experience as measured by satisfaction, loyalty then being the future-oriented behavioral result of that evaluation. The need for this distinction lies in the fact that it allows us to see how the guest’s experiential perceptions are turned into intentions to return to and to recommend the hotel.
This is in agreement with both existing theory and with more recent empirical evidence obtained from studies in the hospitality and digitally mediated service areas, since greater satisfaction is likely to increase tourists’ loyalty towards the accommodation provider. The following hypothesis is thus developed:
H4.
Tourist Satisfaction has a positive and significant effect on Loyalty toward the hotel.
2.4. Digital Service Integration and Multisensory Experience
The hospitality industry has gradually undergone digital transformation, with technological interaction now spanning the pre-arrival and on-site phases of the hotel experience, from before booking through to their stay on site. Today’s hotels increasingly make use of mobile check-in, digital concierge services, smart-room controls, and AI-driven interfaces. These technologies are not merely concerned with improving operational efficiency or facilitating transactions any longer—they are now an integral part of the environment in which the hotel experience is both created and enjoyed [7,8].
Guest acceptance of these technologies is commonly explained via the Technology Acceptance Model (perceived usefulness and ease of use driving adoption intention [29]) and the related UTAUT framework (performance expectancy, effort expectancy, facilitating conditions [30]); both are invoked here as contextual motivation rather than directly tested mechanisms, since DSI captures a broad evaluative judgment of technology’s contribution to the experience rather than these constructs or acceptance behavior specifically.
Research into technologies designed to improve the hotel experience backs this conclusion. Han et al. [7] looked at tourists’ acceptance of smart technologies aimed at enhancing their hotel experience and discovered that acceptance is related to people’s perceptions of usefulness, convenience, and the experiential benefits. These technologies alter the way guests interact with the property and access its services, taking digitalization far beyond the usual reservation and payment functions. Recent studies have likewise maintained that smart tourism technologies should be assessed according to the quality of the experience they provide, not merely on the basis of their technical specifications [31,32].
It is in this area that the integration of digital services becomes important for the multisensory experience: today’s hotel technologies play an increasing role in determining how guests interact with the physical environment. With smart-room systems, guests are able to control the lighting, temperature, curtains, entertainment, and other ambient factors using a single digital interface. Apps can make it easier to access food and beverage services, wellness facilities, housekeeping, concierge assistance, and personal recommendations, while voice-controlled devices and AI go on to alter the way guests interact with the room and get the services they need. Thus, technology does not just affect the efficiency with which a service is provided but also the specific conditions under which the visual, auditory, tactile, thermal, and—indirectly—gustatory elements of the stay are experienced.
The combination of technological and physical environments tends to blur the distinction between research on digital service quality and that on servicescapes, which was originally concerned with how physical surroundings influence customer reactions [4] and is now understood to extend to digitally mediated components as well [33] (discussed further in Section 2.5). Guest-written online reviews offer additional insight into this combined servicescape: an analysis of review data indicates that a smart hotel’s competitive position relies on a particular arrangement of strengths and weaknesses across both technological and traditional services, rather than simply on the adoption of technology [34].
Just because a certain level of technological sophistication is present does not mean that the experience will be better. Wong et al. [8] have identified a ‘smartness paradox’ in hotel settings: greater technological complexity does not always result in more positive reactions from customers. The experiential value of technology depends on whether the smart services actually meet guest needs and are meaningfully incorporated into the hospitality experience. Technologies that increase complexity, decrease the sense of control, cause technical difficulties, or replace valuable human interaction can have a detrimental effect rather than an improving one. In short, what is important is not the amount of technology used but rather how well it becomes part of the overall service experience.
AI and personalization further illustrate this. AI-powered, tailored hotel services to guest satisfaction, and personalization of temperature, lighting, food, and other conditions is now achievable through digital systems, with effects extending to happiness and loyalty [35,36]. Personalization is not necessarily a net benefit, however: such systems rely on guest data that some find intrusive, and privacy concerns can offset the benefits of a customized environment. Its sensory benefits therefore depend on guests’ acceptance of the underlying data practices, not on personalization being uniformly positive.
Unlike Digital Content Influence, which shapes pre-arrival expectations, Digital Service Integration operates during the stay itself, directly shaping the multisensory experience as it unfolds.
Even though there has been a growing amount of research carried out on smart hotels, technology acceptance, digital touchpoints, and e-servicescapes, the direct incorporation of digital service technologies into a comprehensive multisensory framework is still relatively unexplored. The existing research has so far mainly concentrated on technology adoption, perceived usefulness, service innovation, satisfaction, and behavioral intentions [7,8], while having paid much less attention to the way in which digitally integrated services affect guests’ combined visual, auditory, olfactory, tactile, and gustatory perceptions of the hotel environment. Viewing Digital Service Integration as something that leads to a Multisensory Experience provides a conceptual foundation for considering digitalization as an experiential rather than merely a technological phenomenon.
Based on these theoretical considerations and the available empirical evidence, the following hypothesis is proposed:
H5.
Digital Service Integration has a positive and significant effect on tourists’ perceived Multisensory Experience during the hotel stay.
2.5. Multisensory Experience, Satisfaction and Loyalty
The connection between customer experience and loyalty is a key area of study in the hospitality industry, since people’s intentions to act are influenced not just by their assessment of the functional aspect of the service but also by the experiential value obtained during their stay. In this situation, multisensory experience can have an impact on loyalty in more than one way: satisfaction acts as the basic evaluative route by which positive experiences lead to behavioral intentions, but the experiential features of consuming hospitality services may also affect loyalty directly. It is especially useful to look at both of these mechanisms together in order to find out whether or not satisfaction fully mediates the relationship between multisensory experience and loyalty.
As discussed in Section 2.2, sensory marketing theory holds that sensory inputs affect consumer perception, judgment, and behavior through the simultaneous stimulation and integration of multiple sensory channels [5]. In a hotel, when people at the same time perceive visual, auditory, olfactory, tactile, and gustatory stimuli, they form an integrated account of the experience which extends beyond the evaluation of any one service feature. These experiences acquire behavioral significance when the sensory coherence, distinctiveness, or intensity contributes to positive and lasting impressions of the property.
The servicescape literature provides further support for this relationship. The physical environment can influence not only customers’ immediate cognitive and emotional responses but also their approach or avoidance behavior [4]. Recent studies also highlight its importance for customer loyalty. For example, Ariffin, Nadesan, and Alamssi [33] found that physical, social, and electronic servicescapes all contribute to guest loyalty in resort hotels. This is consistent with other studies that view environmental characteristics as an important part of the overall guest experience rather than as secondary factors [23,24].
The way in which multisensory experience affects loyalty can initially be seen as an indirect process involving satisfaction; positive sensory impressions contribute to a favorable assessment of the stay, and this satisfaction then leads to greater intentions to return and to recommend the property. This sequence is in line with the expectation–confirmation approach, since post-consumption evaluations are derived from comparing the expected and actual performance and then influence future behavior [6]—and also corresponds with empirical research in the field of hospitality which has found that satisfaction is a significant predecessor of loyalty [9] and acts as the mechanism connecting customer experience to loyalty outcomes [28].
However, focusing merely on satisfaction when considering the connection between multisensory experience and loyalty may lead to undervaluing the impact of experiential consumption on behavior. Sensory stimuli can contribute to the uniqueness and memorability of a hotel stay in a way that a general satisfaction assessment does not fully account for. Since hospitality environments vary greatly in an experiential sense, guests tend to keep in mind sensory aspects—such as the atmosphere, the design, the comfort, and the food—long after their stay has finished. These memories can enter into how a property is recalled and assessed, and thus influence future decisions about which hotel to choose.
Direct empirical evidence for a two-pathway model is provided by research on unmanned smart hotels, in which both psychological states and satisfaction were found to act sequentially as mediators in the relationship between the quality of the experience and loyalty—showing that the experiential pathway functions in parallel with, not exclusively through, satisfaction [37].
The difference between indirect and direct effects is particularly important in the case of multisensory hospitality experiences. Satisfaction represents a conscious assessment of the entire stay, whereas sensory experience entails perceptual reactions which can affect memory, recognition, preference and behavioral intention even if they are not entirely reflected in an explicit satisfaction rating. As discussed in Section 2.2, hotel customer experience includes both conscious and less explicitly expressed perceptual processes [22], supporting a more comprehensive understanding of how experiential stimuli contribute to the consumer’s response. Accordingly, part of the impact of a multisensory experience on loyalty probably operates via satisfaction, while another part may stay directly linked to the experiential impression the hotel makes.
The way in which mediation is specified has consequences. When the effect of Multisensory Experience on Loyalty ceases to be statistically significant once Satisfaction is included as a mediator, this would indicate full mediation. On the other hand, if Multisensory Experience still has a significant direct effect on Loyalty together with a significant indirect effect via Satisfaction, this would imply partial mediation. By examining both pathways we obtain a more comprehensive understanding of how sensory experience leads to post-consumption behavioral intentions.
The distinction between direct and indirect effects also depends on how the constructs are measured. If the satisfaction measure captures some of the same sensory impressions included in the multisensory experience, the two pathways may be difficult to separate empirically. As a result, part of the observed direct effect may reflect overlap between the constructs rather than a completely separate mechanism. Examining both pathways remains important, but the size of the direct effect should therefore be interpreted with caution.
This mediation model brings the different relationships together. Digital content influences guests’ sensory expectations before arrival, are then associated with their multisensory experience during the stay. At the same time, digital service integration contributes to the on-site experience, while the multisensory experience itself influences both satisfaction and loyalty. In this way, the model links pre-arrival digital influences with the actual hotel experience and its subsequent effects on guest outcomes.
Although there has been a great deal of literature dealing separately with servicescape, satisfaction, and loyalty, only a small amount of research has examined satisfaction as the mechanism by which an integrated five-sense hotel experience leads to loyalty while at the same time taking into account a residual direct experiential effect. This is important in today’s hospitality industry, since competitive differentiation is increasingly based on creating unique experiences rather than simply on functional delivery. By estimating both the direct and indirect pathways at the same time, it becomes possible to obtain a more accurate understanding of the behavioral consequences of multisensory hospitality experiences.
Based on these theoretical arguments, the final hypothesis is split into two sub-hypotheses:
H6a.
Multisensory Experience has a positive and significant direct effect on Loyalty toward the hotel.
H6b.
Satisfaction positively mediates the relationship between Multisensory Experience and Loyalty.
Taken together, these gaps point to several areas that remain underexplored. Studies on digital content and eWOM have mainly examined credibility, engagement, and booking decisions, with less attention to how online content shapes sensory expectations before a visit and whether these expectations influence the on-site experience (Section 2.1). Research on digital service integration has similarly focused on technology adoption and satisfaction, while its relationship with guests’ sensory perceptions of the physical environment has received limited attention (Section 2.4). As a result, digital content and digital service integration have generally been studied separately, although both may contribute to how guests experience a destination or hospitality setting. In addition, while satisfaction is well established as an antecedent of loyalty (Section 2.3), its role in linking an integrated five-sense experience to loyalty, alongside a possible direct effect, remains less explored. To our knowledge, these relationships have not previously been examined together in a single structural model covering both pre- and post-consumption stages.
In order to fill this gap, the present study takes three approaches. Firstly, rather than considering the influence of digital content before consumption and the digital services provided during the stay as separate research questions, it incorporates both the pre-consumption informational pathway (Digital Content Influence → Sensory Expectations) and the on-site experiential pathway (Digital Service Integration → Multisensory Experience) into one conceptual model. Secondly, it establishes Multisensory Experience as the key mediating factor that links both of these digital pathways to Satisfaction and Loyalty, enabling the relative impact of the pre-arrival digital content and of the digital services experienced on-site to be estimated at the same time rather than one at a time. Thirdly, it examines both the indirect route by which Multisensory Experience affects Loyalty through Satisfaction and the direct route, making use of covariance-based structural equation modeling to formally compare the full and partial mediation models—an empirical distinction which most of the studies previously reviewed do not make.
2.6. Conceptual Model and Summary of Hypotheses
Based on the theoretical arguments set out above, the conceptual model in question combines two complementary digital routes—an informational pathway before consumption and an on-site experiential pathway—which come together to form the multisensory hotel experience and thereby influence satisfaction and loyalty. Digital Content Influence affects Sensory Expectations prior to arrival (H1), and these expectations then influence the way the Multisensory Experience is perceived during the stay (H2). At the same time, Digital Service Integration has a direct impact on the Multisensory Experience via the guest’s interactions with technologically assisted services (H5). The Multisensory Experience then serves as the key experiential element in the model, affecting Satisfaction (H3), which in turn leads to Loyalty (H4). It is also hypothesized that the Multisensory Experience affects Loyalty both directly and indirectly via Satisfaction (H6), enabling the model to examine whether satisfaction fully or only partially mediates this relationship. Together, these six hypotheses link the pre-arrival and on-site stages of the hotel experience into a single explanatory structure connecting digital influence before the stay, the on-site multisensory experience, and their evaluative and behavioral consequences. Table 1 summarizes the six hypotheses, the constructs involved, and the theoretical mechanism underlying each proposed relationship.
Table 1.
Summary of Research Hypotheses.
Figure 1 illustrates the complete conceptual model, with Digital Content Influence and Digital Service Integration serving as the two exogenous digital factors, Sensory Expectations and Multisensory Experience acting as the central experiential mediators, and Satisfaction and Loyalty as the sequential outcome constructs, together with a direct relationship also specified between Multisensory Experience and Loyalty in order to test partial mediation.
Figure 1.
Conceptual model: the solid arrows represent the hypothesized structural paths (H1–H5) and the dashed arrow stands for the additional direct path that was tested in relation to the indirect path which operates through satisfaction (H6).
3. Materials and Methods
3.1. Data Analysis Strategy
The study examines the relationships between tourists’ perceptions of digital content and their sensory expectations of hotels, as well as the links between these expectations, the multisensory experience, satisfaction, and loyalty. It also considers whether perceptions of digital services used during the stay are related to the multisensory experience. As explained in Section 3.4 and Section 6.2, these measures reflect respondents’ overall beliefs and impressions across hotel stays rather than their experience of one specific stay. The model should therefore be interpreted as examining relationships among these perceptions rather than as representing a sequence of events observed within a single hotel stay.
A quantitative analytical method was created in a Python version 3.11.16 computing environment, with data ingestion, structuring and the initial data manipulations carried out using the pandas library. For the first diagnostic stage—this involved assessing multivariate outliers by means of Mahalanobis distances and checking univariate normality—the matrix operations and the theoretical distribution functions from numpy and scipy.stats were used.
Covariance-based Structural Equation Modeling (CB-SEM) was chosen as the main statistical technique since it is able to estimate a number of interconnected dependence relationships at the same time and explicitly takes into account measurement error for the latent variables [38]. Different from regression models, which assume that the constructs are measured without error, SEM separates the measurement model (which includes the observed indicators and the latent constructs) from the structural model (which involves the directional, hypothesized pathways between the latent constructs; as noted in Section 6.2, the cross-sectional design does not permit causal inference from these paths).
The structural model was estimated using the semopy package within a Python (version 3.11.16) computational environment. Initial estimation relied on the Maximum Likelihood (ML) algorithm, treating the 5-point ordinal Likert indicators as continuous variables, a standard practice in covariance-based structural equation modeling. However, preliminary diagnostic screening revealed significant deviations from multivariate normality, specifically severe leptokurtic distributions in several sensory and behavioral indicators (e.g., kurtosis exceeding 10). Because conventional ML estimation does not automatically apply robust standard errors or scaled test statistics, its application to highly non-normal data risks underestimating standard errors and inflating Type I error rates.
To address this non-normality, a comprehensive non-parametric bootstrapping procedure was integrated directly into the estimation strategy. Rather than relying on asymptotic standard errors, 5000 random resamples with replacement were drawn from the dataset to calculate empirical, distribution-free standard errors and 95% bias-corrected confidence intervals for all direct structural paths and specific indirect effects. Although bootstrapping helps make statistical inference more robust when the data deviate from normality, it does not address the limitations of using ML estimation with ordinal data. This limitation is further discussed in Section 6.2.
Two nested structural models were estimated and compared: one was a baseline model in which the effect of the multisensory experience on loyalty is entirely mediated by satisfaction, and the other was a revised, partially mediated model that includes a direct path from the multisensory experience to loyalty. A chi-square difference test was carried out in order to decide between the two models [39]. In order to test Hypothesis 6, the indirect effect was assessed both analytically, by means of the product of the unstandardized path coefficients, and by means of a nonparametric bootstrapping procedure (involving 5000 resamples) to obtain bias-corrected confidence intervals [40].
3.2. Common Method Bias Assessment
To minimize the potential for Common Method Bias, both procedural and statistical remedies were applied. Procedurally, the survey instrument was designed to establish a psychological separation between the predictor variables (digital content influence) and the criterion variables (multisensory experience and loyalty). Item ambiguity was reduced through direct phrasing, and respondents were explicitly instructed that there were no right or wrong answers, a technique utilized to mitigate evaluation apprehension and social desirability. Statistically, a Common Latent Factor approach was executed. An unmeasured, orthogonal latent factor was introduced into the measurement model, loading simultaneously onto all 25 observed indicators. The analysis determined that the unmeasured method factor accounted for only 14.29% of the total variance. Because this value is substantially below the conventional 50% threshold, it is concluded that common method variance does not significantly confound the structural parameter estimates in this dataset.
3.3. Sample, Procedure, and Preliminary Data Screening
The group being studied comprised Romanian tourists who were living in or linked with the Constanța area and who were at least 18 years of age having had at least one previous travel experience; eligibility was reported by the individuals themselves, stating that they met these conditions before carrying on with the questionnaire.
The data were gathered from 9 March to 5 June 2026 (a period of 88 days) using a self-administered online questionnaire, which was presented in Romanian (the measurement items are listed in Appendix A.1 and the introductory instructions given to respondents in Appendix A.2). The questionnaire was sent out through Google Forms and made available via an open-access link on a number of different platforms, such as social media travel groups, tourism and travel discussion forums, and QR codes that were displayed at the partner hotels. Since the survey was not directed at a specific and countable group of people to whom invitations could be sent, it was not possible to determine a conventional response rate; the analysis therefore includes all those who accessed the link and completed the questionnaire in full. Because a single shared link was used across all distribution channels, without a channel-identifying parameter embedded in the survey design, the specific recruitment source (e.g., social media, discussion forums, or hotel-based QR codes) was not recorded for individual respondents, precluding a retrospective comparison between on-site and online-recruited participants.
The final dataset contained 553 independent observations and had no missing values for any of the variables. The adequacy of this sample size for SEM was evaluated and confirmed against both standard heuristic guidelines and statistical power thresholds. Specifically, the dataset satisfies the conservative heuristic requiring a minimum of 10 observations per measured variable; for the 25 indicators employed in the structural model, the minimum threshold of 250 cases is significantly exceeded, achieving a ratio of over 22 respondents per item. Additionally, a post-hoc statistical power analysis utilizing the RMSEA-based method [41] was conducted to evaluate the model’s capacity to reject a false null hypothesis of close fit. Given 268 degrees of freedom, a significance level of α = 0.05, and testing a close fit (RMSEA = 0.05) against the alternative of a mediocre fit (RMSEA = 0.08), the sample size of 553 yields a statistical power approaching 1.00, substantially exceeding the recommended benchmark of 0.80 and ensuring highly stable parameter estimates.
The questionnaire included 25 observed items measured on a five-point Likert scale (Table A1), together with five categorical variables covering demographic and behavioral characteristics. The target population consisted of Romanian tourists connected to the Constanța city or region who were at least 18 years old and had previous travel experience. Eligibility was based on self-reported information. The items measuring Sensory Expectations, Multisensory Experience, Satisfaction, and Loyalty asked respondents to consider their overall impressions of previous hotel stays rather than a single stay followed over time. The model therefore captures both the pre-arrival and on-site stages of the hotel experience, but does not represent a prospectively tracked customer journey for a specific stay.
Forty-two people (7.6%) stated that they had not stayed in a hotel over the previous 12 months (Table 2). Since the items relating to experience, satisfaction, and loyalty refer to the respondents’ general experience of hotels rather than to a stay in the 12 months just prior, these cases are still valid as respondents with respect to the constructs under examination and have therefore been included in the analysis. To check whether these cases influenced the findings, the structural model was re-estimated after excluding the 42 cases (N = 511). The standardized path coefficients and fit indices for both samples are reported in Table 3 and Table 4. The results were very similar across the two samples, with no meaningful changes in the direction or significance of the relationships. The survey did not set a maximum recall period, so participants may have based their responses on stays that took place some time ago. This is acknowledged as a limitation in Section 6.2.
Table 2.
Sample demographic and behavioral profile (N = 553).
Table 3.
Sensitivity analysis: standardized structural path coefficients, full sample (N = 553) vs. restricted sample (N = 511).
Table 4.
Sensitivity analysis: model fit indices, full sample (N = 553) vs. restricted sample (N = 511).
The skewness was between −3.09 and −0.22 (indicating negative skew, which is in keeping with self-reported satisfaction or other experiential assessments). The kurtosis values varied from −0.13 to 11.93; since a number of these values went beyond the conservative ±7 limit [38,42], the data exhibit a leptokurtic characteristic and fail to meet the criteria of strict multivariate normality—a situation that is typical when using bounded ordinal scales—which is the reason for adopting the ML/bootstrap method described above [43].
No pair of the 25 indicators had a correlation above the critical 0.85 level [39], which supported the stability of the covariance matrix and offered initial evidence of discriminant validity. The Mahalanobis distance (with a critical χ2 value of 52.62, 25 degrees of freedom, p < 0.001) identified 41 possible multivariate outliers (less than 8% of the total sample size of 553) [44]; since the scale used was bounded between 1 and 5, these cases were considered legitimate variation and therefore kept in the final dataset.
The last structural (partial mediation) model has 268 degrees of freedom compared with the 325 possible sample moments, which means that 57 parameters have been estimated freely. Since the number of cases N is 553, the ratio of cases to free parameters is about 9.7 to 1. The sample size achieved is well above the minimum suggestion of five cases per estimated parameter [45] and comes close to the more conservative ratio of 10:1 that is recommended for models of this kind [39], thus supporting the stability and reliability of the maximum likelihood parameter estimates.
3.4. Measurement Instrument and Scale Provenance
The questionnaire was first given to the respondents in Romanian. The English versions of all the items mentioned in this manuscript were obtained by means of a forward-translation/back-translation procedure [46]: a bilingual researcher translated the items into English, after which a second bilingual researcher independently back-translated them into Romanian, and the differences were settled through discussion until semantic equivalence had been reached. In keeping with the recommendations to combine back-translation with collaborative review in order to achieve both conceptual and literal equivalence [47], any remaining wording ambiguities detected during the discussion phase were resolved by agreement between the two translators.
Before the main data collection took place, the questionnaire went through a two-stage pretesting procedure. In the first stage, three experts in the fields of tourism and hospitality marketing examined it in order to judge its content validity, clarity, and relevance to the aims of the study. Taking into account their comments, a number of items were improved by refining the way they were worded and by removing any ambiguity. Then, the updated questionnaire was pilot-tested with 30 respondents who were drawn from the target population. The pilot study showed that the questionnaire was understandable and easy to complete, and only small changes to the wording were made before the full survey was carried out.
The measurement instrument was created by modifying and combining previously validated measurement scales drawn from the literature on hospitality, tourism, services marketing, and information systems. Since the conceptual model incorporates digital pre-consumption influences, multisensory service experiences, and post-consumption evaluations within one framework, no single existing instrument was able to capture all of the proposed relationships. For this reason, each construct was operationalized by adapting well-established scales to the situation of digitally mediated hotel experiences without altering their original conceptual domains. The items were all measured using five-point Likert scales going from 1 (‘strongly disagree’) to 5 (‘strongly agree’).
The Digital Content Influence (DCI) concept was developed by adapting research on electronic word-of-mouth (eWOM) and online reviews—particularly travellers’ adoption of online information, review credibility, and digital content’s impact on booking decisions [48,49]—complemented by hospitality studies on review effects, website quality, and expectation formation [50,51]. DCI was deliberately operationalized as a broad, first-order construct combining choice influence, expectation formation, and perceived credibility. We acknowledge that credibility is conceptually an antecedent of information adoption and influence—a peripheral cue conditioning persuasive impact [12,13]—rather than an interchangeable indicator of the same underlying construct as choice influence or expectation formation; this is discussed as a limitation in Section 6.2. It is also worth noting that the DCI item addressing expectation formation (‘Online content shapes my expectations before booking’) and the SE item addressing ambiance-related expectations (‘Online content contributes to creating expectations about the hotel’s ambiance’) are substantively overlapping in wording, which likely inflates the DCI–SE correlation and is a plausible contributor to the discriminant-validity concern reported between these two constructs in Section 4.4.
To further evaluate this operationalization, a reduced two-item specification (removing the credibility item, DCI3) was tested. This reduction degraded rather than improved the construct’s psychometric properties: AVE increased only marginally to 0.440 (still below the 0.50 threshold), CR fell to 0.610 (below the 0.70 threshold), and a new Fornell–Larcker violation emerged with Sensory Expectations. The original three-item specification was therefore retained, as it is empirically better supported than the tested alternative.
The Sensory Expectations (SE) concept was based on Expectation-Confirmation Theory [6], which states that consumers form cognitive expectations before using a service and that these then influence their perceptions and evaluations of the service experience. The items were modified so as to reflect the sensory images that tourists form in advance of their arrival regarding hotel environments as a result of being exposed to digital content, in accordance with research into expectation formation in the field of tourism and hospitality [6,52,53].
In contrast to the other constructs, the Multisensory Experience (ME) construct was not based on a single existing scale. Rather, it was conceived as a multidimensional, higher-order representation of tourists’ sensory evaluations by combining various theoretical viewpoints from the literature on hospitality and sensory marketing. The visual, auditory, olfactory, tactile, and gustatory dimensions were mainly influenced by Bitner’s Servicescape Theory [4], which stresses the impact of the physical environment on customer reactions, as well as later research into multisensory branding and hospitality [5,54]. The way the construct was operationalized also takes into account research specifically concerned with multisensory experiences in hotels [55,56,57], and the food items were taken from existing research on meal experiences [58,59]. Hence, the ME construct must be seen as an integrative composite scale developed by combining several validated theoretical frameworks, not as a straightforward adaptation of a single previously published instrument. For estimation purposes, ME was modeled as a reflective first-order latent factor with ten indicators—rather than as a formative composite, a second-order structure with five sensory sub-dimensions, or five separate sensory factors—given the sample size and the number of additional parameters these alternative specifications would require. We acknowledge that this choice requires stronger justification than model parsimony alone: the five sensory dimensions are not necessarily interchangeable manifestations of a single latent variable, since a guest may, for example, experience excellent visual and tactile conditions without using the hotel’s restaurant or encountering a distinctive scent. The reflective first-order specification is therefore best understood as a simplifying assumption made for estimation purposes, not as an empirically established claim that the five dimensions are fully interchangeable, and this specification is revisited as a limitation in Section 6.2. It should also be noted that one item (ME9, addressing culinary experience) contains conditional wording (‘when available’), which creates uneven applicability across respondents whose stays did or did not involve on-site food and beverage services. It should also be noted that the ME items largely capture respondents’ beliefs about whether particular sensory elements influence their experience (e.g., ‘The visual aspect… influences my experience’), rather than directly measured intensity, quality, or objective presence of those sensory elements; this belief-based operationalization, common in self-report hospitality research, is a further limitation discussed in Section 6.2.
As a robustness check on this specification, an alternative second-order measurement model was also estimated, with the ten items loading onto five first-order sensory sub-factors (visual, auditory, olfactory, tactile, gustatory), which in turn loaded onto a single higher-order ME factor. This alternative specification substantially improved measurement-model fit (CFI = 0.937, TLI = 0.928, RMSEA = 0.056) and convergent validity (AVE = 0.674), with all sub-factor loadings significant (p < 0.001; olfactory β = 0.887, tactile β = 0.891, auditory β = 0.811, visual β = 0.765, gustatory β = 0.739). These results support treating the five sensory dimensions as coherent facets of a single higher-order construct and corroborate the theoretical characterization of ME as multidimensional; the first-order specification is retained in the primary structural model reported here for parsimony, with the second-order model reported as confirmatory evidence.
This retention reflects a pragmatic trade-off with sample size and model complexity rather than evidence that the first-order structure is the superior or definitively validated representation of Multisensory Experience; indeed, the second-order model’s markedly better fit and AVE suggest it may more accurately represent the construct’s underlying structure, and researchers with larger samples are encouraged to adopt it as the primary specification.
The Digital Service Integration (DSI) construct was adapted from research investigating technology-enabled hospitality services, self-service technologies, and digital service innovation in hotels. The measurement primarily builds upon [60], complemented by literature on smart hospitality, hotel digitalization, and technology acceptance in tourism [61,62]. It should be noted that the DSI items measure respondents’ perceived benefits of hotel technology in general (e.g., ‘Digital services make the experience more efficient and comfortable’) rather than the extent to which digital services were actually used or integrated during a specific stay; this distinction between perceived benefit and actual behavioral integration is addressed as a limitation in Section 6.2.
The Satisfaction (SAT) scale was developed by adapting the broad body of literature on customer satisfaction which is based on Expectation-Confirmation Theory [6] and also taking into account later operationalisations in the field of service marketing [63,64]. The questions reflect tourists’ general assessment of their total hotel experiences in comparison with their previous expectations.
The Loyalty (LOY) construct was eventually developed from the loyalty intentions framework [10] and later enhanced by applications in the field of hospitality which stressed the importance of customers’ intent to return, positive word-of-mouth, and recommendation behavior [65,66].
Common Method Bias—Procedural Remedies
The survey design included a procedural measure to guard against common method bias: the introduction in Google Forms contained a statement guaranteeing the anonymity of the respondents’ answers, with the aim of reducing their evaluation apprehension and thus prompting more honest replies. This measure is supported by the two statistical tests reported in Section 4.9—Harman’s single-factor test and a Common Latent Factor analysis—both of which showed that common method bias is not a widespread issue with respect to the observed covariance structure.
4. Results
4.1. Descriptive Statistics
Descriptive statistics for the 25 manifest indicators are summarized by construct in Table 5. All items show negative skew, indicating generally favorable consumer evaluations, with elevated kurtosis concentrated in specific sensory and behavioral indicators (notably ME7 = 11.93 and LOY2 = 10.79), consistent with a ceiling effect typical of high-satisfaction hospitality research.
Table 5.
Descriptive statistics by construct (min = 1.0, max = 5.0 for all items).
4.2. Measurement Model (CFA)
Following the standard two-step approach [67], a Confirmatory Factor Analysis comprising six freely correlated latent constructs—Digital Content Influence (3 items), Sensory Expectations (3 items), Multisensory Experience (10 items), Satisfaction (3 items), Loyalty (3 items), and Digital Service Integration (3 items)—was fit separately before the structural model. Every unstandardized factor loading was statistically significant (p < 0.001), with parameter estimates ranging predominantly between 0.67 and 1.14. Statistical significance alone does not establish that indicators reliably capture their designated latent dimensions; this is assessed more directly through the reliability and convergent/discriminant validity indices reported in Section 4.3 and Section 4.4. On this basis, and given the significant loadings, we proceeded with structural estimation. Fit indices for the measurement and structural models are reported in Table 6.
Table 6.
Measurement model fit vs. structural model fit.
Although CFI and TLI for both models (0.858–0.877) remain below the conventional 0.90 convention, RMSEA (0.078–0.079) and SRMR (0.053)—indices less sensitive to model complexity and more sensitive to actual misspecification [68]—fall within commonly accepted ranges, and all individual factor loadings and structural paths are significant at p < 0.001 with substantial standardized magnitudes, with no modification index suggesting a theoretically defensible re-specification. While incremental indices such as CFI and TLI are known to be somewhat sensitive to the number of indicators in a model [38,69], this is treated here as relevant context rather than a sufficient explanation for the shortfall; the below-threshold values are acknowledged as a genuine limitation, and structural paths are interpreted with corresponding caution throughout.
4.3. Reliability and Convergent Validity
SAT, LOY and DSI show CR > 0.70 and AVE > 0.50 (Table 7), indicating excellent reliability and convergent validity. DCI and ME fall below the strict AVE = 0.50 threshold (0.382 and 0.447). ME’s CR (0.890) exceeds 0.70; DCI’s CR (0.648) falls clearly below 0.70 as well—a genuine reliability concern, not a borderline case. This trade-off is consistent with ME’s conceptual status as a multidimensional construct estimated here as a single first-order factor rather than a second-order structure, and is addressed explicitly as a limitation (Section 6).
Table 7.
Construct reliability and convergent validity.
4.4. Discriminant Validity
Discriminant validity was assessed with both the Fornell–Larcker criterion [70] (square root of each construct’s AVE compared against its correlations with other constructs) and the Heterotrait–Monotrait ratio (HTMT) [71]. Construct-level descriptive statistics (means and standard deviations) were calculated using composite scores and are presented alongside the discriminant validity matrix in Table 8, demonstrating generally favorable evaluations across all measured dimensions.
Table 8.
Descriptive statistics and Fornell–Larcker matrix.
The Fornell–Larcker comparison indicated adequate discriminant validity for Satisfaction, Loyalty, and Digital Service Integration, whose √AVE values (0.842, 0.825, and 0.838 respectively) exceeded all corresponding inter-construct correlations. Two conceptually adjacent construct pairs—Digital Content Influence–Sensory Expectations and Sensory Expectations–Multisensory Experience—did not meet the strict Fornell–Larcker criterion. While these constructs are theoretically expected to covary, this proximity does not by itself establish that they are empirically distinguishable; the failure is treated as a genuine discriminant-validity concern, plausibly linked to the DCI2/SE2 item-wording overlap discussed in Section 3.4. Applying the currently preferred HTMT criterion [71], all construct pairs fell below the conservative 0.85 threshold (range = 0.337–0.765; Table 9), supporting discriminant validity for the full six-construct model.
Table 9.
HTMT ratios. All values are below the conservative 0.85 threshold.
4.5. Structural Model Comparison: Full Versus Partial Mediation
To empirically validate the structure of the model, a fully mediated baseline (no direct ME → LOY path) was compared against a partially mediated, revised model that adds a direct structural path from Multisensory Experience to Loyalty (Table 10).
Table 10.
Nested model comparison.
The transition to partial mediation produced a substantial reduction in chi-square (Δχ2 = 162.53) for a single degree of freedom (Δdf = 1), a statistically significant improvement (p < 0.001) that favors the partial mediation model. Given this significant χ2 difference test and the consistent improvement across all fit indices, the partial mediation model is retained as the final structural model reported below; the full mediation model is reported only as the nested comparison baseline.
4.6. Hypothesis Testing—Standardized and Unstandardized Path Coefficients
As Table 11 shows, all six hypothesized paths were positive and significant (p < 0.001). The strongest effects were H1 (Digital Content Influence → Sensory Expectations) and H2 (Sensory Expectations → Multisensory Experience), while H5 (Digital Service Integration → Multisensory Experience) was comparatively modest, indicating that on-site digital touchpoints contribute to the sensory evaluation with less weight than pre-arrival expectations do.
Table 11.
Standardized and unstandardized structural path coefficients.
All six proposed pathways were statistically significant. The standardized direct effect of Multisensory Experience on Loyalty (H6a, β = 0.561) substantially exceeds the bootstrapped indirect effect through Satisfaction (≈0.119), indicating that the physical/sensory environment is associated with loyalty largely independent of satisfaction, with satisfaction acting as a genuine but partial mediator.
4.7. Explained Variance (R2)
- Sensory Expectations: R2 = 0.616 (61.6% of variance explained by Digital Content Influence).
- Multisensory Experience: R2 = 0.579 (57.9%, explained jointly by Sensory Expectations and Digital Service Integration).
- Satisfaction: R2 = 0.174 (17.4%, explained by Multisensory Experience).
- Loyalty: R2 = 0.531 (53.1%, explained jointly by Satisfaction and Multisensory Experience).
4.8. Mediation Analysis (H6b)
To validate Hypothesis 6b and formally test the joint contribution of the two digital pathways, specific indirect effects were estimated using a nonparametric bootstrapping procedure utilizing 5000 resamples to yield 95% bias-corrected confidence intervals.
The standardized indirect effect of the Multisensory Experience on Loyalty through Satisfaction (H6b) is statistically significant (Mean = 0.1191, 95% CI [0.0732, 0.1725]), consistent with the product of the standardized ME → SAT and SAT → LOY paths (0.417 × 0.286 ≈ 0.119). Because this confidence interval strictly excludes zero, H6b is supported. When contextualized alongside the robust direct effect identified in H6a, the data mathematically confirm a framework of partial mediation.
Furthermore, the extended serial and parallel indirect effects from both digital antecedents were tested via the same bootstrapping procedure. Both pathways showed significant downstream effects: DCI → SE → ME → SAT (0.1882, 95% CI [0.1125, 0.2819]), DCI → SE → ME → LOY (0.2398, [0.1516, 0.3489]), the full serial route DCI → SE → ME → SAT → LOY (0.0503, [0.0259, 0.0826]), and the equivalent DSI pathways (0.0779, [0.0387, 0.1273]; 0.0994, [0.0499, 0.1571]; and 0.0207, [0.0098, 0.0355] respectively), all reported in full in Table 12.
Table 12.
Bootstrapped specific indirect effects and 95% Confidence Intervals (N = 5000 resamples).
4.9. Control Variables and Robustness Checks
To address the potential confounding effects of the sample composition and assess the generalizability of the findings, a robustness check was conducted by introducing demographic and behavioral variables—gender, age, travel frequency, and preferred hotel category—as covariates within the structural equation model.
The analysis revealed specific, isolated effects of these control variables on the endogenous constructs. Gender exerted a statistically significant effect on sensory expectations (Estimate = −0.187, p < 0.001). Given the dichotomous coding of the variable (0 = Female, 1 = Male), this negative coefficient indicates that female respondents formulated significantly higher pre-arrival sensory expectations based on digital content than their male counterparts.
Age demonstrated a significant positive influence on the perceived multisensory experience (Estimate = 0.069, p = 0.006), suggesting that older generational cohorts evaluate the physical and sensory environments of hotels more favorably. Furthermore, the preferred hotel category positively impacted both the multisensory experience (Estimate = 0.073, p = 0.025) and overall satisfaction (Estimate = 0.089, p = 0.039). This aligns with the theoretical premise that higher-tier accommodations (e.g., 4- and 5-star hotels) deliver objectively superior sensory stimuli and service quality, thereby elevating baseline satisfaction. Travel frequency did not exhibit any statistically significant impact on the model’s constructs (p > 0.05).
None of the demographic or behavioral control variables significantly affected hotel loyalty directly (all p-values > 0.470). More importantly, the inclusion of these covariates did not attenuate or alter the statistical significance and directional valence of the primary hypothesized pathways (H1–H6). The core mediational model remains strictly robust, confirming that while variables such as gender and hotel category introduce minor variance at the expectation and satisfaction levels, the observed pattern of associations with loyalty holds across these demographic and behavioral groups.
Moderation analysis using interaction terms further examined whether these demographic and behavioral variables alter the strength of the primary structural relationships, rather than only exerting direct effects. Age did not significantly moderate the Digital Content Influence → Sensory Expectations relationship (B = −0.060, SE = 0.045, p = 0.186), indicating that this mechanism operates uniformly across generational cohorts. Gender significantly moderated the Multisensory Experience → Satisfaction relationship (B = 0.273, SE = 0.101, p = 0.007): given the coding (0 = Female, 1 = Male), the sensory environment’s impact on satisfaction was stronger for male respondents, whereas female respondents’ satisfaction appears to be shaped by a broader set of factors beyond the immediate sensory environment. Travel frequency significantly and negatively moderated the Digital Service Integration → Multisensory Experience relationship (B = −0.094, SE = 0.029, p = 0.002), consistent with a habituation effect whereby frequent travelers treat digital service integration as a baseline expectation rather than a novel enhancer of the sensory experience.
4.10. Common Method Bias
As a preliminary check, Harman’s Single Factor Test was conducted on all indicators. An unrotated Principal Component Analysis extracted a single factor accounting for 34.02% of total variance, well below the 50% critical threshold. As a stronger confirmatory test (Section 3.2), a Common Latent Factor analysis was also conducted, in which an unmeasured method factor accounted for only 14.29% of variance—jointly indicating that common method bias does not represent a pervasive concern for the estimated covariances.
4.11. Structural Model Diagrams
The standardized estimates of the final partial mediation model are shown in Figure 2, while Figure 3 presents the full mediation model used as the baseline in the nested model comparison (Table 10).
Figure 2.
Partial Mediation Structural Equation Model (primary reported model). *** p < 0.001; estimates of 1.00 denote reference items fixed to establish construct metric.
Figure 3.
Full (strict) Mediation Structural Equation Model—baseline used for the nested χ2 comparison in Section 4.5. *** p < 0.001.
5. Discussion
The empirical findings support all six hypotheses and confirm that the partial mediation model is the superior representation of the relationship between digital/sensory stimuli and tourist loyalty.
As reported in Table 12 and Section 4.8, the direct effect of Multisensory Experience on Loyalty considerably exceeds the indirect, satisfaction-mediated pathway, with satisfaction playing a complementary rather than exclusive role. This is consistent with dual-pathway evidence from unmanned smart hotels, where experiential quality was associated with loyalty both through and independent of satisfaction [37].
This finding builds on the servicescape evidence discussed in Section 2.4 [33] by testing whether satisfaction fully accounts for the relationship between the multisensory experience and loyalty; a direct relationship remained when satisfaction was included as a mediator. This may also help explain the “smartness paradox” reported by Wong et al. [8], who found that greater technological sophistication does not necessarily lead to more favorable guest responses: technology may contribute to loyalty when it enhances the overall guest experience, rather than through its presence or sophistication alone.
AVE for Digital Content Influence (0.382) and Multisensory Experience (0.447) falls below the 0.50 convergent-validity benchmark. Composite reliability is acceptable for Multisensory Experience (0.890) but falls below the 0.70 threshold for Digital Content Influence (0.648). The Multisensory Experience construct’s breadth (10 items spanning visual, auditory, olfactory, tactile, and gustatory dimensions) is the likely driver: although ME was conceptualized as multidimensional, it was estimated as a single first-order factor rather than as a second-order structure with five sensory sub-dimensions, which likely understates its true convergent validity; the second-order factor specification tested as a robustness check (Section 3.4) supports this interpretation.
Overall model fit remains below the conventional 0.90 benchmark (Section 4.2), which is not unusual in complex, multi-construct models estimated on ordinal self-report data [38], though it is treated here as a genuine limitation rather than a fully resolved concern.
These findings contribute to several areas of the literature. They extend Expectation-Confirmation Theory [6] by suggesting that pre-arrival expectations are associated with the multisensory experience itself (H1, H2), rather than influencing only how the experience is evaluated afterwards. The results also add to Servicescape Theory [4] and sensory marketing research [5], showing that the sensory environment may have a stronger and more direct role in building loyalty than satisfaction alone. This distinction has received limited attention in studies that formally compare full and partial mediation models. Finally, the findings for H1 and H5 are consistent with ideas from persuasion-based frameworks, such as ELM and IAM [12,13], as well as technology-acceptance frameworks, including TAM and UTAUT [29,30]. These theories were used in Section 2.1 and Section 2.4 to support the development of the hypotheses rather than being directly tested. The results should therefore be viewed as consistent with these theoretical mechanisms, rather than as direct evidence for the specific constructs proposed by either framework.
The DCI → SE (β = 0.785) and DSI → ME (β = 0.227) paths relate to different outcome constructs with distinct measurement properties, so their coefficients should not be directly compared. The results simply show that the strength of these relationships differs within the present model and sample. Since the study did not include expenditure or return-on-investment data, the findings cannot support specific recommendations about how resources should be allocated. However, the stronger direct experiential pathway discussed in Section 5 suggests that digital service technologies may relate to guest outcomes mainly through their contribution to the sensory experience, rather than through technological sophistication alone. This interpretation should be viewed as an implication of the findings rather than as a basis for investment decisions.
The substantial difference in magnitude between the DCI → SE and DSI → ME relationships raises an important theoretical question: why does pre-arrival digital content appear to be associated with expectations much more strongly than on-site digital services are with the actual sensory experience? One possible explanation lies in the way expectations are formed before arrival. At this stage, guests have no direct sensory experience of the destination or hotel and therefore rely largely on digitally mediated information to imagine what their stay will be like. Digital content may consequently become the primary reference point for forming sensory expectations. Once guests arrive, however, their experience is influenced by a much broader range of factors, including the physical environment, architecture, staff interactions, and ambient conditions. The contribution of any single digital service may therefore be less pronounced. A methodological explanation is also possible. The DSI items capture perceived technological benefits in general rather than actual use of digital services during a specific stay (Section 3.4), which may have attenuated the estimated strength of the DSI → ME relationship. The reliability and convergent validity of DSI were good (CR = 0.875, AVE = 0.702; Table 7), so this concern relates to what the items measure rather than to their reliability. Distinguishing between these explanations would require measures of actual digital service use during a focal stay.
An unexpected finding from the robustness checks (Section 4.9) was that older respondents reported a more favorable multisensory experience than younger respondents. This contrasts with the expectation that younger, more digitally engaged travelers might respond more positively. One possible explanation is that older guests may have different or less digitally influenced expectations, making those expectations easier to meet. Younger guests, by contrast, may form stronger expectations based on the digital content they encounter before a stay, which could make the actual experience more difficult to match. This interpretation is consistent with the expectation-confirmation logic underlying H2, but it was not directly tested in this study. Future research could examine this possibility by testing the interaction between age and sensory expectations.
6. Conclusions
This study set out to test whether digitally mediated pre-consumption content and on-site digital service integration are jointly related to the multisensory hotel experience, which in turn is associated with tourist satisfaction and loyalty, and whether that link operates through satisfaction alone or retains a direct component of its own. Using covariance-based structural equation modeling on a sample of 553 Romanian tourists, all six hypotheses were supported, and a formal comparison of full and partial mediation specifications indicated that satisfaction only partially mediates the relationship between the Multisensory Experience and Loyalty: the direct path (β = 0.561) substantially outweighs the satisfaction-mediated indirect path (β = 0.119). Given the cross-sectional and retrospective nature of the data, these findings reflect associations among participants’ general beliefs and experiences rather than a temporal or causal relationship.
These findings contribute to e-commerce and digital hospitality research by showing that digital cues encountered before purchase are related to how guests evaluate their experience afterward. They also bring together two pathways that have often been studied separately and highlight the multisensory experience as an important link between digital and physical touchpoints, satisfaction, and loyalty. Rather than focusing only on booking intentions or technology acceptance, the findings show the value of considering the guest experience as a whole. For hoteliers and digital platforms, this suggests that pre-arrival content and the sensory experience delivered during the stay should be considered together. Aligning the expectations created online with the actual experience at the hotel may therefore be relevant to guest satisfaction and loyalty.
6.1. Practical and Policy Implications
Beyond the managerial implications discussed in Section 5, these findings carry relevance for tourism policy makers, destination management organizations, and industry associations. Digital Content Influence was strongly associated with Sensory Expectations (β = 0.785). As credibility and source trust are central to the Elaboration Likelihood and Information Adoption mechanisms underlying H1 [12,13], the reliability of online information, including the authenticity of reviews and transparency of influencer disclosures, may have implications beyond consumer protection and potentially be relevant to destination competitiveness. However, the present study examined responses at the individual guest level only. Any broader implications for destination competitiveness should therefore be interpreted with caution, as they extend beyond the direct empirical evidence provided by this study. In parallel, because Digital Service Integration showed a smaller but still significant association with the Multisensory Experience (β = 0.227), and the smart-hospitality literature reviewed in Section 2.4 documents a ‘smartness paradox’ in which technology adoption alone does not guarantee improved guest outcomes [8], public digitalization-support programs aimed at small and medium hospitality enterprises may merit pairing with guidance on experiential integration, although this study did not test the effectiveness of such programs. For regional destination organizations, including those relevant to the Constanța area studied here, these results indicate that both destination-level digital content quality and on-site guest experience infrastructure are meaningfully related to guest outcomes.
6.2. Limitations
This study has several methodological and empirical limitations. First, the cross-sectional design captures guest perceptions at a single point in time, restricting the ability to establish the definitive temporal or causal ordering implied by the structural model. A longitudinal design tracking guests from pre-booking digital exposure through post-stay evaluation would yield stronger causal evidence. Furthermore, because the survey instrument captured respondents’ general retrospective impressions of hotel stays rather than tracking a specific stay prospectively, the model conceptualizes the pre-arrival and on-site phases rather than a sequentially mapped customer journey. Additionally, all constructs were measured via self-report. While procedural safeguards, Harman’s single-factor test, and a Common Latent Factor analysis (Section 3.2) jointly indicated minimal common method bias, self-report artifacts cannot be entirely ruled out.
Second, sampling constraints restrict the universal generalizability of the findings. The respondent pool exhibits a distinct demographic skew, being predominantly female (73.2%) and heavily concentrated within younger cohorts, specifically Generation Z (47.2%). The sample was also drawn exclusively from Romanian tourists connected to the Constanța region, relying on convenience sampling methods that combined open social-media distribution with on-site QR codes. This recruitment approach introduces inherent self-selection biases and limits the applicability of the findings to other cultural, economic, or hospitality market contexts with different digital infrastructures and travel norms. Furthermore, because a single shared survey link was used across all recruitment channels without an embedded channel-identifying parameter, the dataset does not permit a comparison between respondents recruited on-site (via hotel QR codes) versus those recruited through open online channels. Future studies using this recruitment strategy should embed distinct, channel-specific links or tracking parameters at the design stage to enable this comparison and to test for systematic differences between recruitment modes.
Future research should validate the proposed structural framework, particularly the dual direct and indirect pathways of partial mediation confirmed in this study, using stratified, cross-cultural samples to ensure a balanced representation of genders, varied age groups, and diverse hospitality markets. Additionally, no maximum recall period was enforced for respondents’ hotel experiences, which may introduce recall variability across participants.
Third, some aspects of the measurement model should be interpreted with caution. Digital Content Influence combines choice influence, expectation formation, and perceived credibility within a single factor. However, credibility may be better understood as an antecedent of digital content influence rather than as an indicator of the construct itself. Some similarity in the wording of the DCI and SE items may also have contributed to the observed concerns regarding discriminant validity.
The measurement of the other constructs also has some limitations. The Multisensory Experience items mainly reflect guests’ perceptions of how sensory elements influence their experience rather than directly measuring sensory intensity. Similarly, the Digital Service Integration items capture perceived benefits of technology rather than its actual use or integration into guest behavior. Future studies could address these issues by using more clearly differentiated measures and incorporating objective or behavioral indicators.
The first-order specification of Multisensory Experience should also be viewed as a simplifying modeling choice rather than a fully established representation of the construct. As reported in Section 3.4, a second-order model tested as a robustness check showed better fit and validity, although the first-order model was retained for parsimony. In addition, the conditional wording of one ME item (“when available”) may have made the item less applicable to some respondents.
Relatedly, the AVE for Digital Content Influence and Multisensory Experience fell below the conventional 0.50 threshold, and the incremental fit indices (CFI, TLI) remained marginally below the stringent 0.90 criterion. The below-threshold AVE for Multisensory Experience is largely attributable to its specification as a single first-order latent factor despite theoretically capturing five distinct sensory sub-dimensions; As reported in Section 3.4, a second-order measurement model testing this specification substantially improved both fit and AVE, confirming this attribution.
Fourth, the five-point ordinal indicators were treated as continuous variables and estimated using unadjusted maximum likelihood, an approach that does not fully account for the ordinal and potentially non-normal nature of the data. Although non-parametric bootstrapping with 5000 resamples strengthens the robustness of the statistical inference, it cannot fully replace an estimator specifically designed for ordinal and non-normal data, such as WLSMV. The use of maximum likelihood estimation should therefore be acknowledged as a limitation of the present analysis.
6.3. Future Research Directions
Future research could address these limitations in several ways. Longitudinal, diary-based, or critical-incident designs anchored to a single identifiable stay could trace how sensory expectations formed pre-arrival evolve into the experience actually perceived on-site, clarifying the direction of the calibrating, rather than purely additive, relationship proposed in Section 2.1. Cross-cultural replication across tourist populations with differing digital infrastructure and hospitality norms would test whether the relative strength of the Digital Content Influence and Digital Service Integration pathways observed here generalizes beyond a single regional context. Although the Multisensory Experience construct’s breadth was identified as a likely driver of its below-threshold AVE, a second-order specification and moderation by age and travel frequency were tested as robustness checks in the present study (Section 3.4 and Section 4.9). Future work could extend this by testing whether the relative importance of the five sensory dimensions is moderated by hotel category or travel purpose, as suggested in Section 2.2.
Author Contributions
Conceptualization, A.E.I., R.M.Z. and C.A.B.; methodology, A.E.I. and E.C.S.; software, C.F. and A.Ț.; validation, C.A.B., R.M.Z. and A.E.I.; formal analysis, C.F. and C.A.B.; investigation, A.Ț. and C.A.B.; resources, R.M.Z. and C.A.B.; data curation, C.F. and E.C.S.; writing—original draft preparation, R.M.Z., A.E.I., E.C.S. and C.A.B.; writing—review and editing, C.A.B., C.F. and A.Ț.; visualization, R.M.Z., C.A.B. and A.E.I.; supervision, E.C.S.; funding acquisition, A.E.I., R.M.Z., C.A.B., C.F., E.C.S., C.A.B. and A.Ț. All authors have read and agreed to the published version of the manuscript.
Funding
This research received no external funding.
Institutional Review Board Statement
Ethical review and approval were waived for this study due to its non-interventional design, which involved an anonymous and voluntary online survey of adult participants. No sensitive personal data, medical information, or involvement of vulnerable populations was included. The study complied with Romanian legislation (Law No. 206/2004 on Good Conduct in Scientific Research, Technological Development, and Innovation), the EU General Data Protection Regulation (GDPR), and the principles outlined in the Declaration of Helsinki.
Informed Consent Statement
Informed consent was obtained from all subjects involved in the study. Prior to completing the questionnaire, respondents were presented with an introductory statement explaining the study’s purpose (investigating tourists’ multisensory hotel experience and the role of digital content in perceptions and choice behavior), confirming that participation was voluntary, that responses were fully anonymous and confidential, and that data would be used exclusively for academic purposes without being linked to the respondent’s identity. Consent was implied through voluntary continuation of the questionnaire after reading this statement, and respondents were free to close the form at any point before submission without penalty. No email addresses or IP addresses were collected during data collection. Regarding the QR codes displayed at partner hotels, respondents accessed the survey independently via their own personal devices after check-in or during their stay, with no hotel staff involvement in survey administration or monitoring of participation, minimizing the risk of perceived pressure to participate. No financial incentives, discounts, or other forms of compensation were offered for participation.
Data Availability Statement
The dataset and analysis code are available on request from the authors.
Conflicts of Interest
The authors declare no conflicts of interest.
Abbreviations
The following abbreviations are used in this manuscript:
| DCI | Digital Content Influence |
| SE | Sensory Expectations |
| ME | Multisensory Experience |
| DSI | Digital Service Integration |
| SAT | Satisfaction |
| LOY | Loyalty |
| eWOM | Electronic word-of-mouth |
| CB-SEM | Covariance-based Structural Equation Modeling |
| CFA | Confirmatory Factor Analysis |
| ML | Maximum Likelihood |
| AVE | Average Variance Extracted |
| CR | Composite Reliability |
| RMSEA | Root Mean Square Error of Approximation |
| CFI | Comparative Fit Index |
| TLI | Tucker–Lewis Index |
| SRMR | Standardized Root Mean Square Residual |
| HTMT | Heterotrait–Monotrait ratio |
| CMB | Common Method Bias |
| ELM | Elaboration Likelihood Model |
| IAM | Information Adoption Model |
| TAM | Technology Acceptance Model |
| UTAUT | Unified Theory of Acceptance and Use of Technology |
Appendix A
Appendix A.1. Measurement Items
Original items were administered on a 5-point Likert scale.
Table A1.
Full measurement item list across all six constructs (N = 25 items).
Appendix A.2. Survey Introductory Instructions
English translation:
“This questionnaire is part of a study on tourists’ multisensory experience in hotels and the role of digital content (influencers, bloggers, online reviews) in shaping perceptions and choice behavior. The study aims to analyze how different dimensions of the hotel experience influence satisfaction and loyalty, and to identify directions for improving services in the hospitality industry. Participation is voluntary, and responses are completely anonymous and confidential. The data collected will be used exclusively for academic purposes and will not be linked to your identity. Completing this questionnaire takes approximately 5 min. By continuing, you indicate your voluntary agreement to participate in this study.”
References
- Wu, Q.-M. The Influence of Online Reviews on the Purchasing Decisions of Travel Consumers. Sustainability 2024, 16, 3213. [Google Scholar] [CrossRef] [Scilit]
- Sparks, B.A.; Browning, V. The Impact of Online Reviews on Hotel Booking Intentions and Perception of Trust. Tour. Manag. 2011, 32, 1310–1323. [Google Scholar] [CrossRef] [Scilit]
- Ciocoiu, P.E.; Ivasciuc, I.S.; Ispas, A. Decoding Consumer Minds in the Age of Online Accommodation Reviews: A Client Profiling Approach. Sustainability 2024, 16, 11085. [Google Scholar] [CrossRef] [Scilit]
- Bitner, M.J. Servicescapes: The Impact of Physical Surroundings on Customers and Employees. J. Mark. 1992, 56, 57–71. [Google Scholar] [CrossRef] [Scilit]
- Krishna, A. An integrative review of sensory marketing: Engaging the senses to affect perception, judgment and behavior. J. Consum. Psychol. 2012, 22, 332–351. [Google Scholar] [CrossRef] [Scilit]
- Oliver, R.L. A Cognitive Model of the Antecedents and Consequences of Satisfaction Decisions. J. Mark. Res. 1980, 17, 460–469. [Google Scholar] [CrossRef] [Scilit]
- Han, D.; Hou, H.; Wu, H.; Lai, J.H.K. Modelling Tourists’ Acceptance of Hotel Experience-Enhancement Smart Technologies. Sustainability 2021, 13, 4462. [Google Scholar] [CrossRef] [Scilit]
- Wong, I.A.; Xiao, Y.; Lin, Z.; Sun, D.; Huang, J.; Liu, M. Smart hotels but not necessarily smart decisions: The smartness paradox. Int. J. Contemp. Hosp. Manag. 2024, 36, 3378–3402. [Google Scholar] [CrossRef] [Scilit]
- Hussain, A.; Li, M.; Kanwel, S.; Asif, M.; Jameel, A.; Hwang, J. Impact of Tourism Satisfaction and Service Quality on Destination Loyalty: A Structural Equation Modeling Approach concerning China Resort Hotels. Sustainability 2023, 15, 7713. [Google Scholar] [CrossRef] [Scilit]
- Zeithaml, V.A.; Berry, L.L.; Parasuraman, A. The Behavioral Consequences of Service Quality. J. Mark. 1996, 60, 31–46. [Google Scholar] [CrossRef] [Scilit]
- Mohammad, A.A.A.; Elshaer, I.A.; Azazz, A.M.S.; Kooli, C.; Algezawy, M.; Fayyad, S. The Influence of Social Commerce Dynamics on Sustainable Hotel Brand Image, Customer Engagement, and Booking Intentions. Sustainability 2024, 16, 6050. [Google Scholar] [CrossRef] [Scilit]
- Petty, R.E.; Cacioppo, J.T. The Elaboration Likelihood Model of Persuasion. In Advances in Experimental Social Psychology; Academic Press: Cambridge, MA, USA, 1986; Volume 19, pp. 123–205. [Google Scholar] [CrossRef] [Scilit]
- Sussman, S.W.; Siegal, W.S. Informational Influence in Organizations: An Integrated Approach to Knowledge Adoption. Inf. Syst. Res. 2003, 14, 47–65. [Google Scholar] [CrossRef] [Scilit]
- Yu, W.; Cui, F.; Wang, P.; Liao, X. Dynamic Mining of Consumer Demand via Online Hotel Reviews: A Hybrid Method. J. Theor. Appl. Electron. Commer. Res. 2024, 19, 1831–1847. [Google Scholar] [CrossRef] [Scilit]
- Yin, J.; Chen, H.; Ni, Y. Vloggers and consumer choices in the hotel and hospitality sector: The double-edged sword of discounts. J. Hosp. Tour. Manag. 2024, 58, 333–344. [Google Scholar] [CrossRef] [Scilit]
- Han, T.-Y.; Bi, J.-W.; Wei, Z.-H.; Yao, Y. Visual cues and consumer’s booking intention in P2P accommodation: Exploring the role of social and emotional signals from hosts’ profile photos. Tour. Manag. 2024, 102, 104884. [Google Scholar] [CrossRef] [Scilit]
- Akhtar, N.; Hameed, Z.; Islam, T.; Pant, M.K.; Sharma, A.; Rather, R.A.; Kuzior, A. Avatars of influence: Understanding how virtual influencers trigger consumer engagement on online booking platforms. J. Retail. Consum. Serv. 2024, 78, 103742. [Google Scholar] [CrossRef] [Scilit]
- Akhtar, N.; Siddiqi, U.I. Effects of service providers’ self-disclosure on booking platforms on consumers’ trust, hesitation, and booking intentions: Moderating role of social media influencers. J. Hosp. Mark. Manag. 2024, 33, 470–498. [Google Scholar] [CrossRef] [Scilit]
- Biswas, A. Navigating the Travel Norms: The Interplay of Online Reviews, Credibility and Hedonic Motivation in the Hotel Industry. J. Qual. Assur. Hosp. Tour. 2025, in press. [Google Scholar] [CrossRef] [Scilit]
- Chan, S.; Amin, M.; Rasool, S.; Syed, O.R. From click to confirmation: The effect of hotel website quality and online reviews in fostering booking intentions. Int. J. Qual. Serv. Sci. 2025, 17, 220–242. [Google Scholar] [CrossRef] [Scilit]
- Liu, H.; Roehl, W.S. Do virtual tours really enhance customer satisfaction with physical experiences? A quasi-experimental study on Airbnb. J. Hosp. Tour. Manag. 2025, 62, 188–195. [Google Scholar] [CrossRef] [Scilit]
- Liu, H.; Xiao, Q.; Wang, H. Understanding Customer Experience for Sustainable Innovation: An Integration of Conscious and Unconscious Perspectives of Theme Hotel Guests. Sustainability 2024, 16, 5274. [Google Scholar] [CrossRef] [Scilit]
- Rassala, C.H.; Correia, A.; Serra, F. Understanding Online Reviews in All-Inclusive Hotels Servicescape: A Fuzzy Set Approach. J. Qual. Assur. Hosp. Tour. 2024, 25, 1607–1634. [Google Scholar] [CrossRef] [Scilit]
- Pai, A.; Shetty, D.K.; Shenoy, S.S.; Abhilash, R.; Shreepathy, R.; Panwar, N. Mapping the terrain of servicescape research in the hospitality industry: An analysis of hotels and restaurants. Cogent Soc. Sci. 2025, 11, 2524946. [Google Scholar] [CrossRef] [Scilit]
- Huang, S. The impact of ski servicescape on tourist loyalty: Evidence from Chinese market. Curr. Issues Tour. 2025, 28, 220–239. [Google Scholar] [CrossRef] [Scilit]
- Liu, Y.; Gao, X.; Zhong, K.; Liu, K. How senses matter? Exploring the diverse impact of haptic and auditory clues in online reviews on hotel ratings. Tour. Manag. 2026, 113, 105350. [Google Scholar] [CrossRef] [Scilit]
- Hanaysha, J.R.; Shriedeh, F.B.; Gulseven, O. Impact of website quality, product assortment, customer reviews, and perceived service quality on online loyalty: The role of perceived value as a mediator. Cogent Bus. Manag. 2024, 11, 2433706. [Google Scholar] [CrossRef] [Scilit]
- Brakus, J.J.; Schmitt, B.H.; Zarantonello, L. Brand Experience: What Is It? How Is It Measured? Does It Affect Loyalty? J. Mark. 2009, 73, 52–68. [Google Scholar] [CrossRef] [Scilit]
- Davis, F.D. Perceived Usefulness, Perceived Ease of Use, and User Acceptance of Information Technology. MIS Q. 1989, 13, 319–340. [Google Scholar] [CrossRef] [Scilit]
- Venkatesh, V.; Morris, M.G.; Davis, G.B.; Davis, F.D. User Acceptance of Information Technology: Toward a Unified View. MIS Q. 2003, 27, 425–478. [Google Scholar] [CrossRef] [Scilit]
- Pai, C.-K.; Chen, H.; Lai, I.; Li, T. Assessing the quality of smart tourism technology: Development and validation of a measurement scale. J. Hosp. Tour. Technol. 2025, 16, 645–664. [Google Scholar] [CrossRef] [Scilit]
- Kim, M.; Long, X.; Boo, S. Young luxury hotel guests’ smart hotel technology acceptance: Examining the influencing factors using TAM and the SOR model. J. Hosp. Tour. Technol. 2026, 17, 699–719. [Google Scholar] [CrossRef] [Scilit]
- Ariffin, A.A.M.; Nadesan, G.; Alamssi, A. The relative impacts of physical, social and e-servicescape on the resort hotel guest loyalty. Cogent Bus. Manag. 2025, 12, 2504123. [Google Scholar] [CrossRef] [Scilit]
- Song, B.; Xia, H.; Law, R.; Muskat, B.; Li, G. Discovery of smart hotels’ competitiveness based on online reviews. Int. J. Hosp. Manag. 2024, 123, 103926. [Google Scholar] [CrossRef] [Scilit]
- Dai, A.; Zhang, J.; Pai, C.-K.; Lee, T.J. The impact of the perception of smart hotel attributes and perceptions of service innovation on tourist happiness and brand loyalty. Int. J. Hosp. Manag. 2025, 127, 104107. [Google Scholar] [CrossRef] [Scilit]
- Tran Ngoc Dieu, H.; Kim, H.; Chung, N. Rethinking smartness in smart hotels: How perceived smartness shapes memorable experiences and loyalty. J. Hosp. Tour. Technol. 2026, advance online publication. [Google Scholar] [CrossRef] [Scilit]
- Chang, Y.-S.; Cheah, J.-H.; Lim, X.-J.; Morrison, A.M.; Kennell, J.S. Are unmanned smart hotels du jour or are they here forever? Experiential pathway analysis of antecedents of satisfaction and loyalty. Int. J. Hosp. Manag. 2022, 104, 103249. [Google Scholar] [CrossRef] [Scilit]
- Hair, J.F.; Black, W.C.; Babin, B.J.; Anderson, R.E. Multivariate Data Analysis, 8th ed.; Cengage Learning EMEA: Andover, UK, 2019. [Google Scholar]
- Kline, R.B. Principles and Practice of Structural Equation Modeling, 4th ed.; Guilford Press: New York, NY, USA, 2016. [Google Scholar]
- Hayes, A.F. Introduction to Mediation, Moderation, and Conditional Process Analysis: A Regression-Based Approach, 2nd ed.; Guilford Press: New York, NY, USA, 2018. [Google Scholar]
- MacCallum, R.C.; Browne, M.W.; Sugawara, H.M. Power analysis and determination of sample size for covariance structure modeling. Psychol. Methods 1996, 1, 130–149. [Google Scholar] [CrossRef]
- Curran, P.J.; West, S.G.; Finch, J.F. The robustness of test statistics to nonnormality and specification error in confirmatory factor analysis. Psychol. Methods 1996, 1, 16–29. [Google Scholar] [CrossRef]
- Byrne, B.M. Structural Equation Modeling with AMOS: Basic Concepts, Applications, and Programming, 2nd ed.; Routledge: New York, NY, USA, 2010. [Google Scholar]
- Tabachnick, B.G.; Fidell, L.S. Using Multivariate Statistics, 6th ed.; Pearson: Boston, MA, USA, 2013. [Google Scholar]
- Bentler, P.M.; Chou, C.-P. Practical issues in structural modeling. Sociol. Methods Res. 1987, 16, 78–117. [Google Scholar] [CrossRef] [Scilit]
- Brislin, R.W. Back-translation for cross-cultural research. J. Cross-Cult. Psychol. 1970, 1, 185–216. [Google Scholar] [CrossRef] [Scilit]
- Douglas, S.P.; Craig, C.S. Collaborative and iterative translation: An alternative approach to back translation. J. Int. Mark. 2007, 15, 30–43. [Google Scholar] [CrossRef] [Scilit]
- Filieri, R.; McLeay, F. E-WOM and accommodation: An analysis of the factors that influence travelers’ adoption of information from online reviews. J. Travel Res. 2014, 53, 44–57. [Google Scholar] [CrossRef] [Scilit]
- Cheung, C.M.Y.; Sia, C.L.; Kuan, K.K.Y. Is this review believable? A study of factors affecting the credibility of online consumer reviews from an ELM perspective. J. Assoc. Inf. Syst. 2012, 13, 618–635. [Google Scholar] [CrossRef] [Scilit]
- Casaló, L.V.; Flavián, C.; Guinalíu, M.; Ekinci, Y. Avoiding the dark side of positive online consumer reviews: Enhancing reviews’ usefulness for high risk-averse travelers. J. Bus. Res. 2015, 68, 1829–1835. [Google Scholar] [CrossRef] [Scilit]
- Confente, I.; Vigolo, V. Online travel behavior across cohorts: The impact of social influences and attitude on hotel booking intention. Int. J. Tour. Res. 2018, 20, 660–670. [Google Scholar] [CrossRef] [Scilit]
- Parasuraman, A.; Zeithaml, V.A.; Berry, L.L. SERVQUAL: A multiple-item scale for measuring consumer perceptions of service quality. J. Retail. 1988, 64, 12–40. [Google Scholar]
- Zeithaml, V.A.; Berry, L.L.; Parasuraman, A. The nature and determinants of customer expectations of service. J. Acad. Mark. Sci. 1993, 21, 1–12. [Google Scholar] [CrossRef] [Scilit]
- Spence, C. Sensehacking the guest’s multisensory hotel experience. Front. Psychol. 2022, 13, 1014818. [Google Scholar] [CrossRef] [Scilit]
- Wiedmann, K.-P.; Labenz, F.; Haase, J.; Hennigs, N. Soothe your senses: A multisensory approach to customer experience management and value creation in luxury tourism. Eur. Bus. Rev. 2016, 50–55. Available online: https://www.europeanbusinessreview.com/soothe-your-senses/ (accessed on 16 July 2026).
- Wiedmann, K.-P.; Labenz, F.; Haase, J.; Hennigs, N. The power of experiential marketing: Exploring the causal relationships among multisensory marketing, brand experience, customer perceived value and brand strength. J. Brand Manag. 2018, 25, 101–118. [Google Scholar] [CrossRef] [Scilit]
- Lee, M.; Lee, S.; Koh, Y. Multisensory experience for enhancing hotel guest experience: Empirical evidence from big data analytics. Int. J. Contemp. Hosp. Manag. 2019, 31, 4313–4337. [Google Scholar] [CrossRef] [Scilit]
- Gustafsson, I.-B.; Öström, Å.; Johansson, J.; Mossberg, L. The Five Aspects Meal Model: A tool for developing meal services in restaurants. J. Foodserv. 2006, 17, 84–93. [Google Scholar] [CrossRef] [Scilit]
- Björk, P.; Kauppinen-Räisänen, H. Interested in eating and drinking? How food affects travel satisfaction and the overall holiday experience. Scand. J. Hosp. Tour. 2017, 17, 9–26. [Google Scholar] [CrossRef] [Scilit]
- Kim, M.; Qu, H. Travelers’ behavioral intention toward hotel self-service kiosks usage. Int. J. Contemp. Hosp. Manag. 2014, 26, 225–245. [Google Scholar] [CrossRef] [Scilit]
- Morosan, C.; DeFranco, A. Modeling guests’ intentions to use mobile apps in hotels. Int. J. Contemp. Hosp. Manag. 2016, 28, 1968–1991. [Google Scholar] [CrossRef] [Scilit]
- Ivanov, S.; Webster, C. Conceptual framework of the use of robots, artificial intelligence and service automation in travel, tourism, and hospitality companies. In Robots, Artificial Intelligence, and Service Automation in Travel, Tourism and Hospitality; Ivanov, S., Webster, C., Eds.; Emerald Publishing: Bingley, UK, 2019; pp. 7–37. [Google Scholar] [CrossRef] [Scilit]
- Cronin, J.J.; Taylor, S.A. Measuring service quality: A reexamination and extension. J. Mark. 1992, 56, 55–68. [Google Scholar] [CrossRef] [Scilit]
- Oliver, R.L. Satisfaction: A Behavioral Perspective on the Consumer; McGraw-Hill: New York, NY, USA, 1997. [Google Scholar]
- Dick, A.S.; Basu, K. Customer loyalty: Toward an integrated conceptual framework. J. Acad. Mark. Sci. 1994, 22, 99–113. [Google Scholar] [CrossRef] [Scilit]
- Bowen, J.T.; Chen, S. The relationship between customer loyalty and customer satisfaction. Int. J. Contemp. Hosp. Manag. 2001, 13, 213–217. [Google Scholar] [CrossRef] [Scilit]
- Anderson, J.C.; Gerbing, D.W. Structural equation modeling in practice: A review and recommended two-step approach. Psychol. Bull. 1988, 103, 411–423. [Google Scholar] [CrossRef]
- Hu, L.; Bentler, P.M. Cutoff criteria for fit indexes in covariance structure analysis: Conventional criteria versus new alternatives. Struct. Equ. Model. 1999, 6, 1–55. [Google Scholar] [CrossRef] [Scilit]
- Kenny, D.A.; McCoach, D.B. Effect of the number of variables on measures of fit in structural equation modeling. Struct. Equ. Model. 2003, 10, 333–351. [Google Scholar] [CrossRef] [Scilit]
- Fornell, C.; Larcker, D.F. Evaluating structural equation models with unobservable variables and measurement error. J. Mark. Res. 1981, 18, 39–50. [Google Scholar] [CrossRef] [Scilit]
- Henseler, J.; Ringle, C.M.; Sarstedt, M. A new criterion for assessing discriminant validity in variance-based structural equation modeling. J. Acad. Mark. Sci. 2015, 43, 115–135. [Google Scholar] [CrossRef] [Scilit]
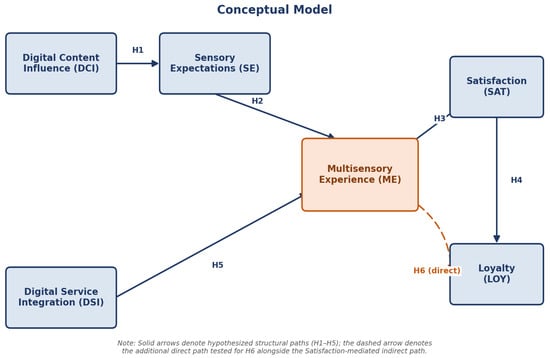
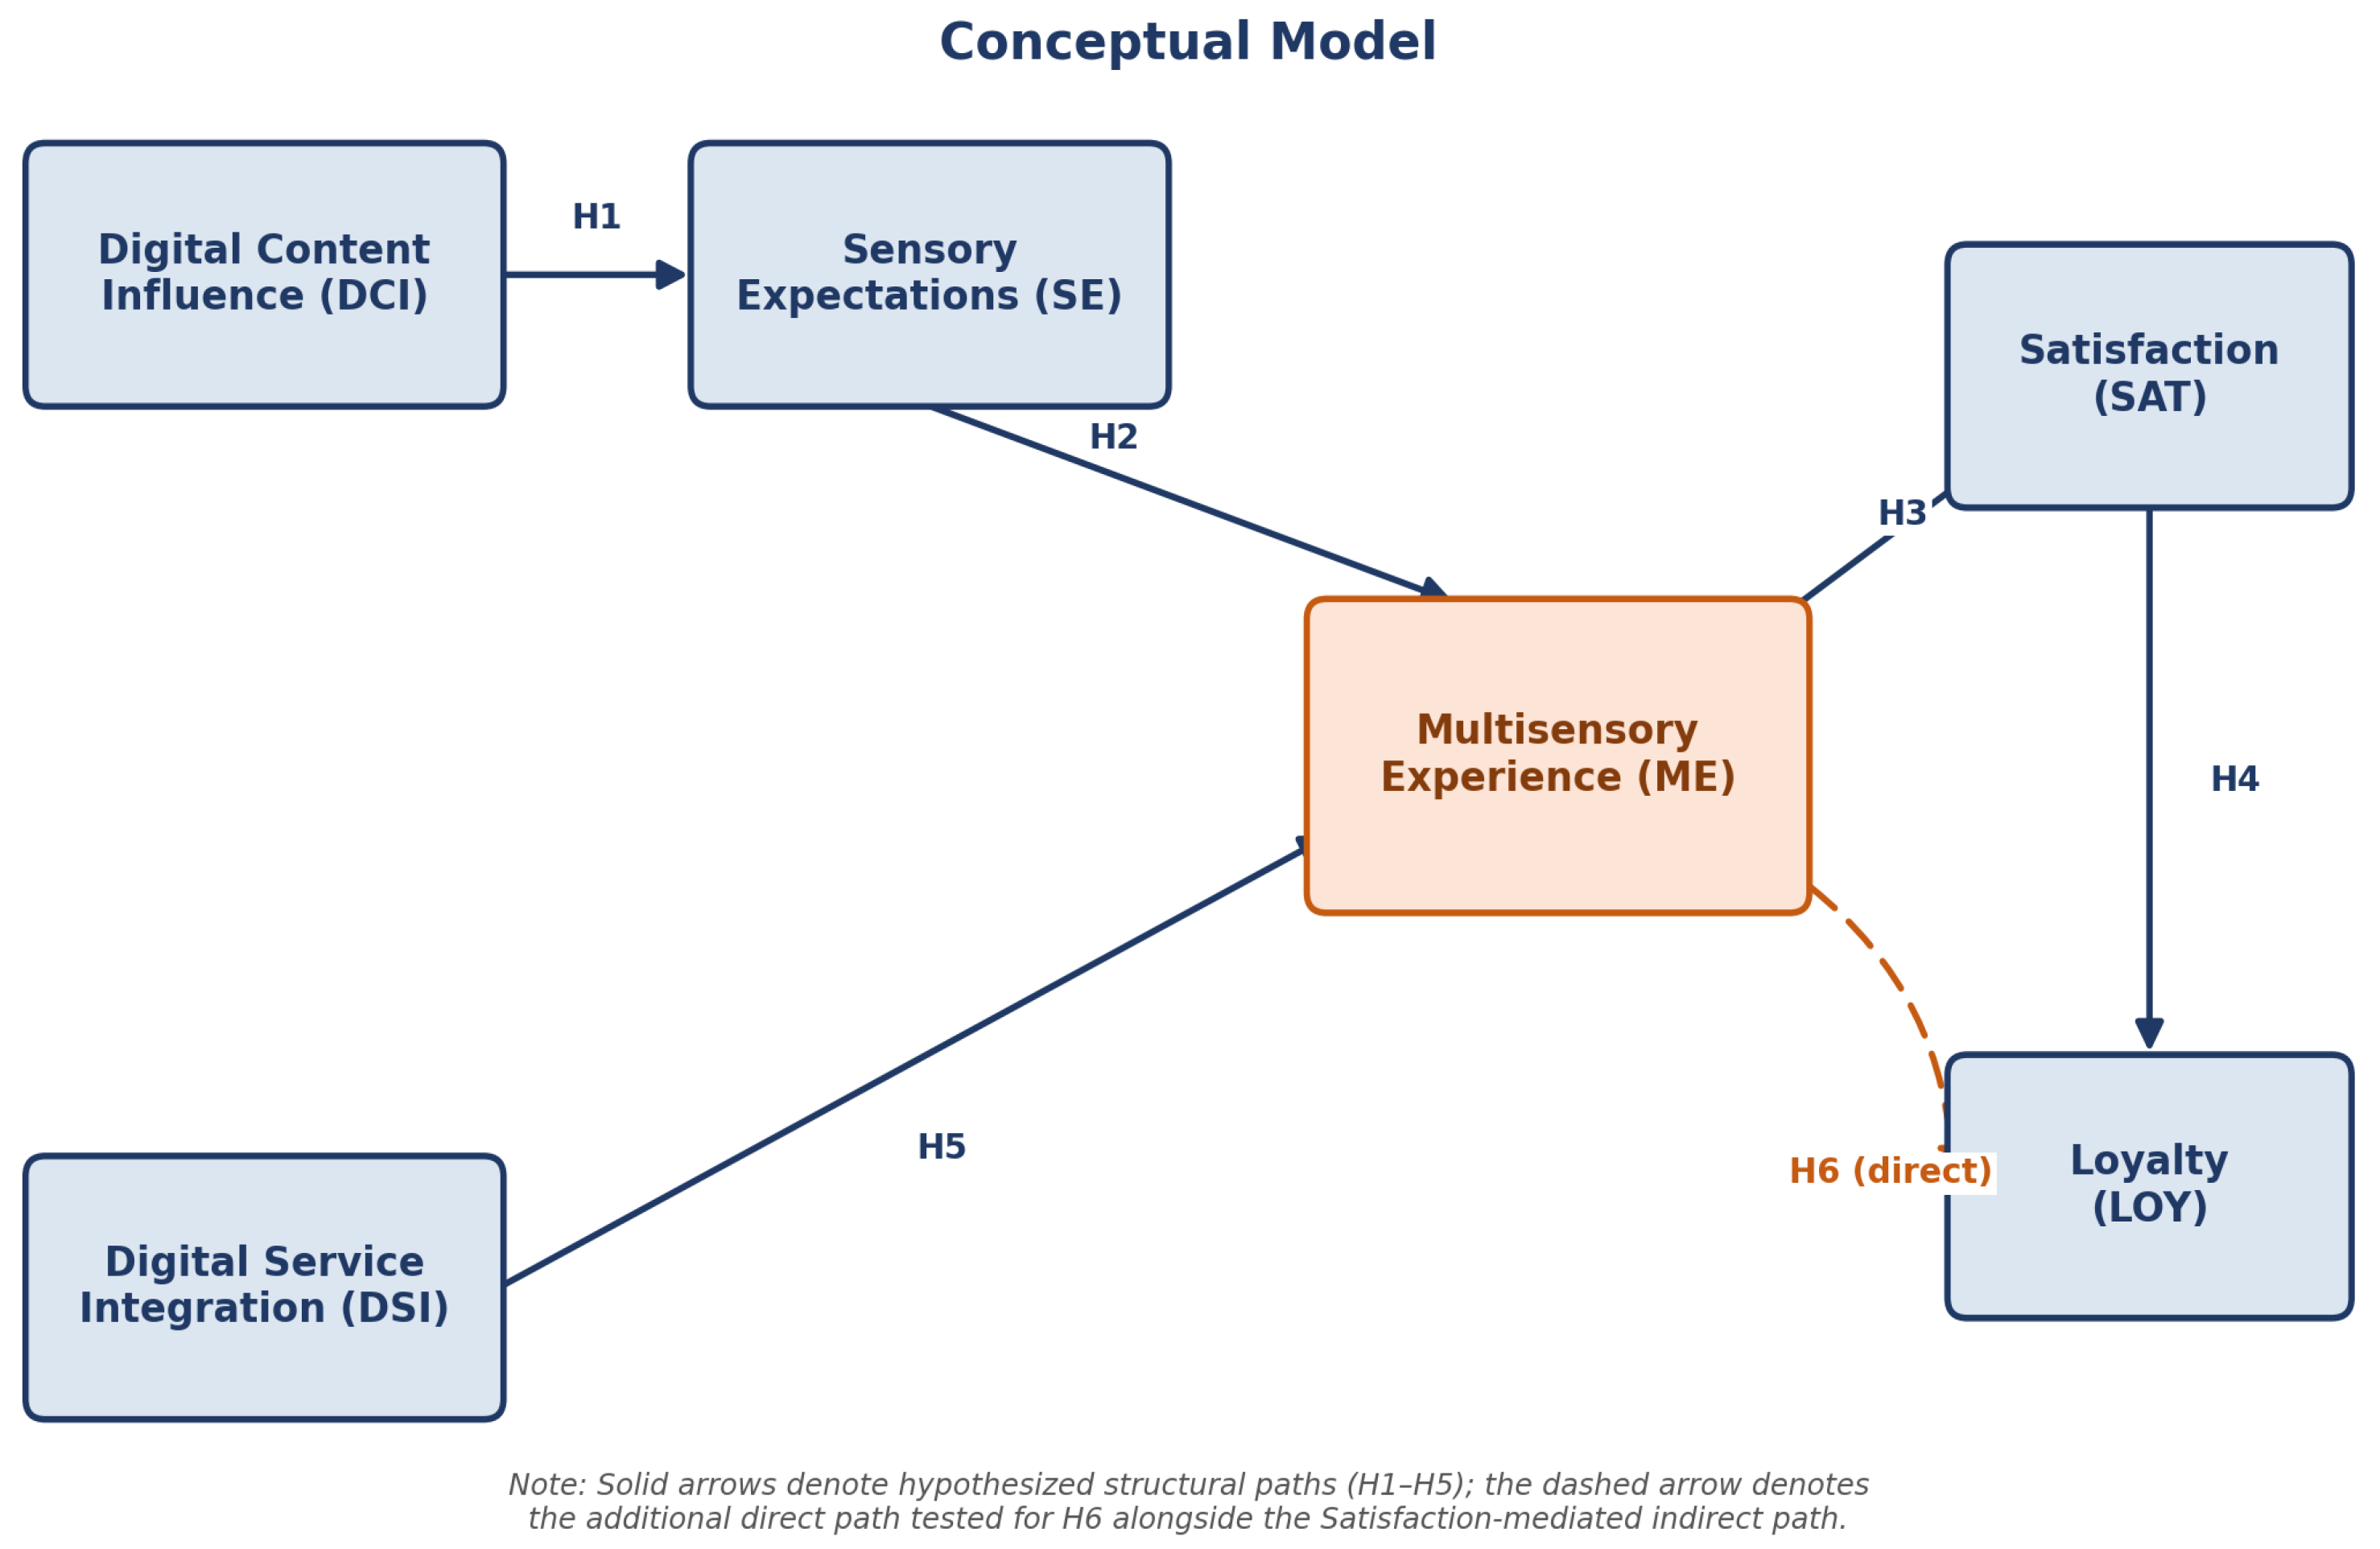
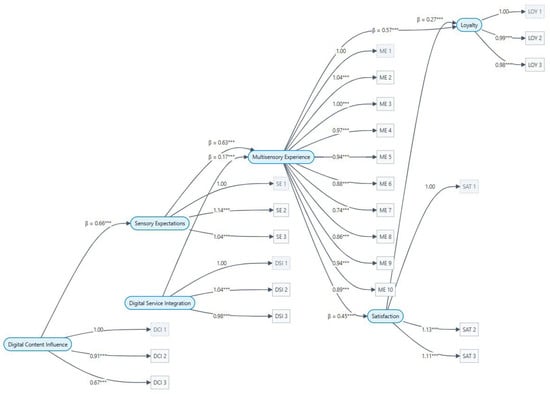
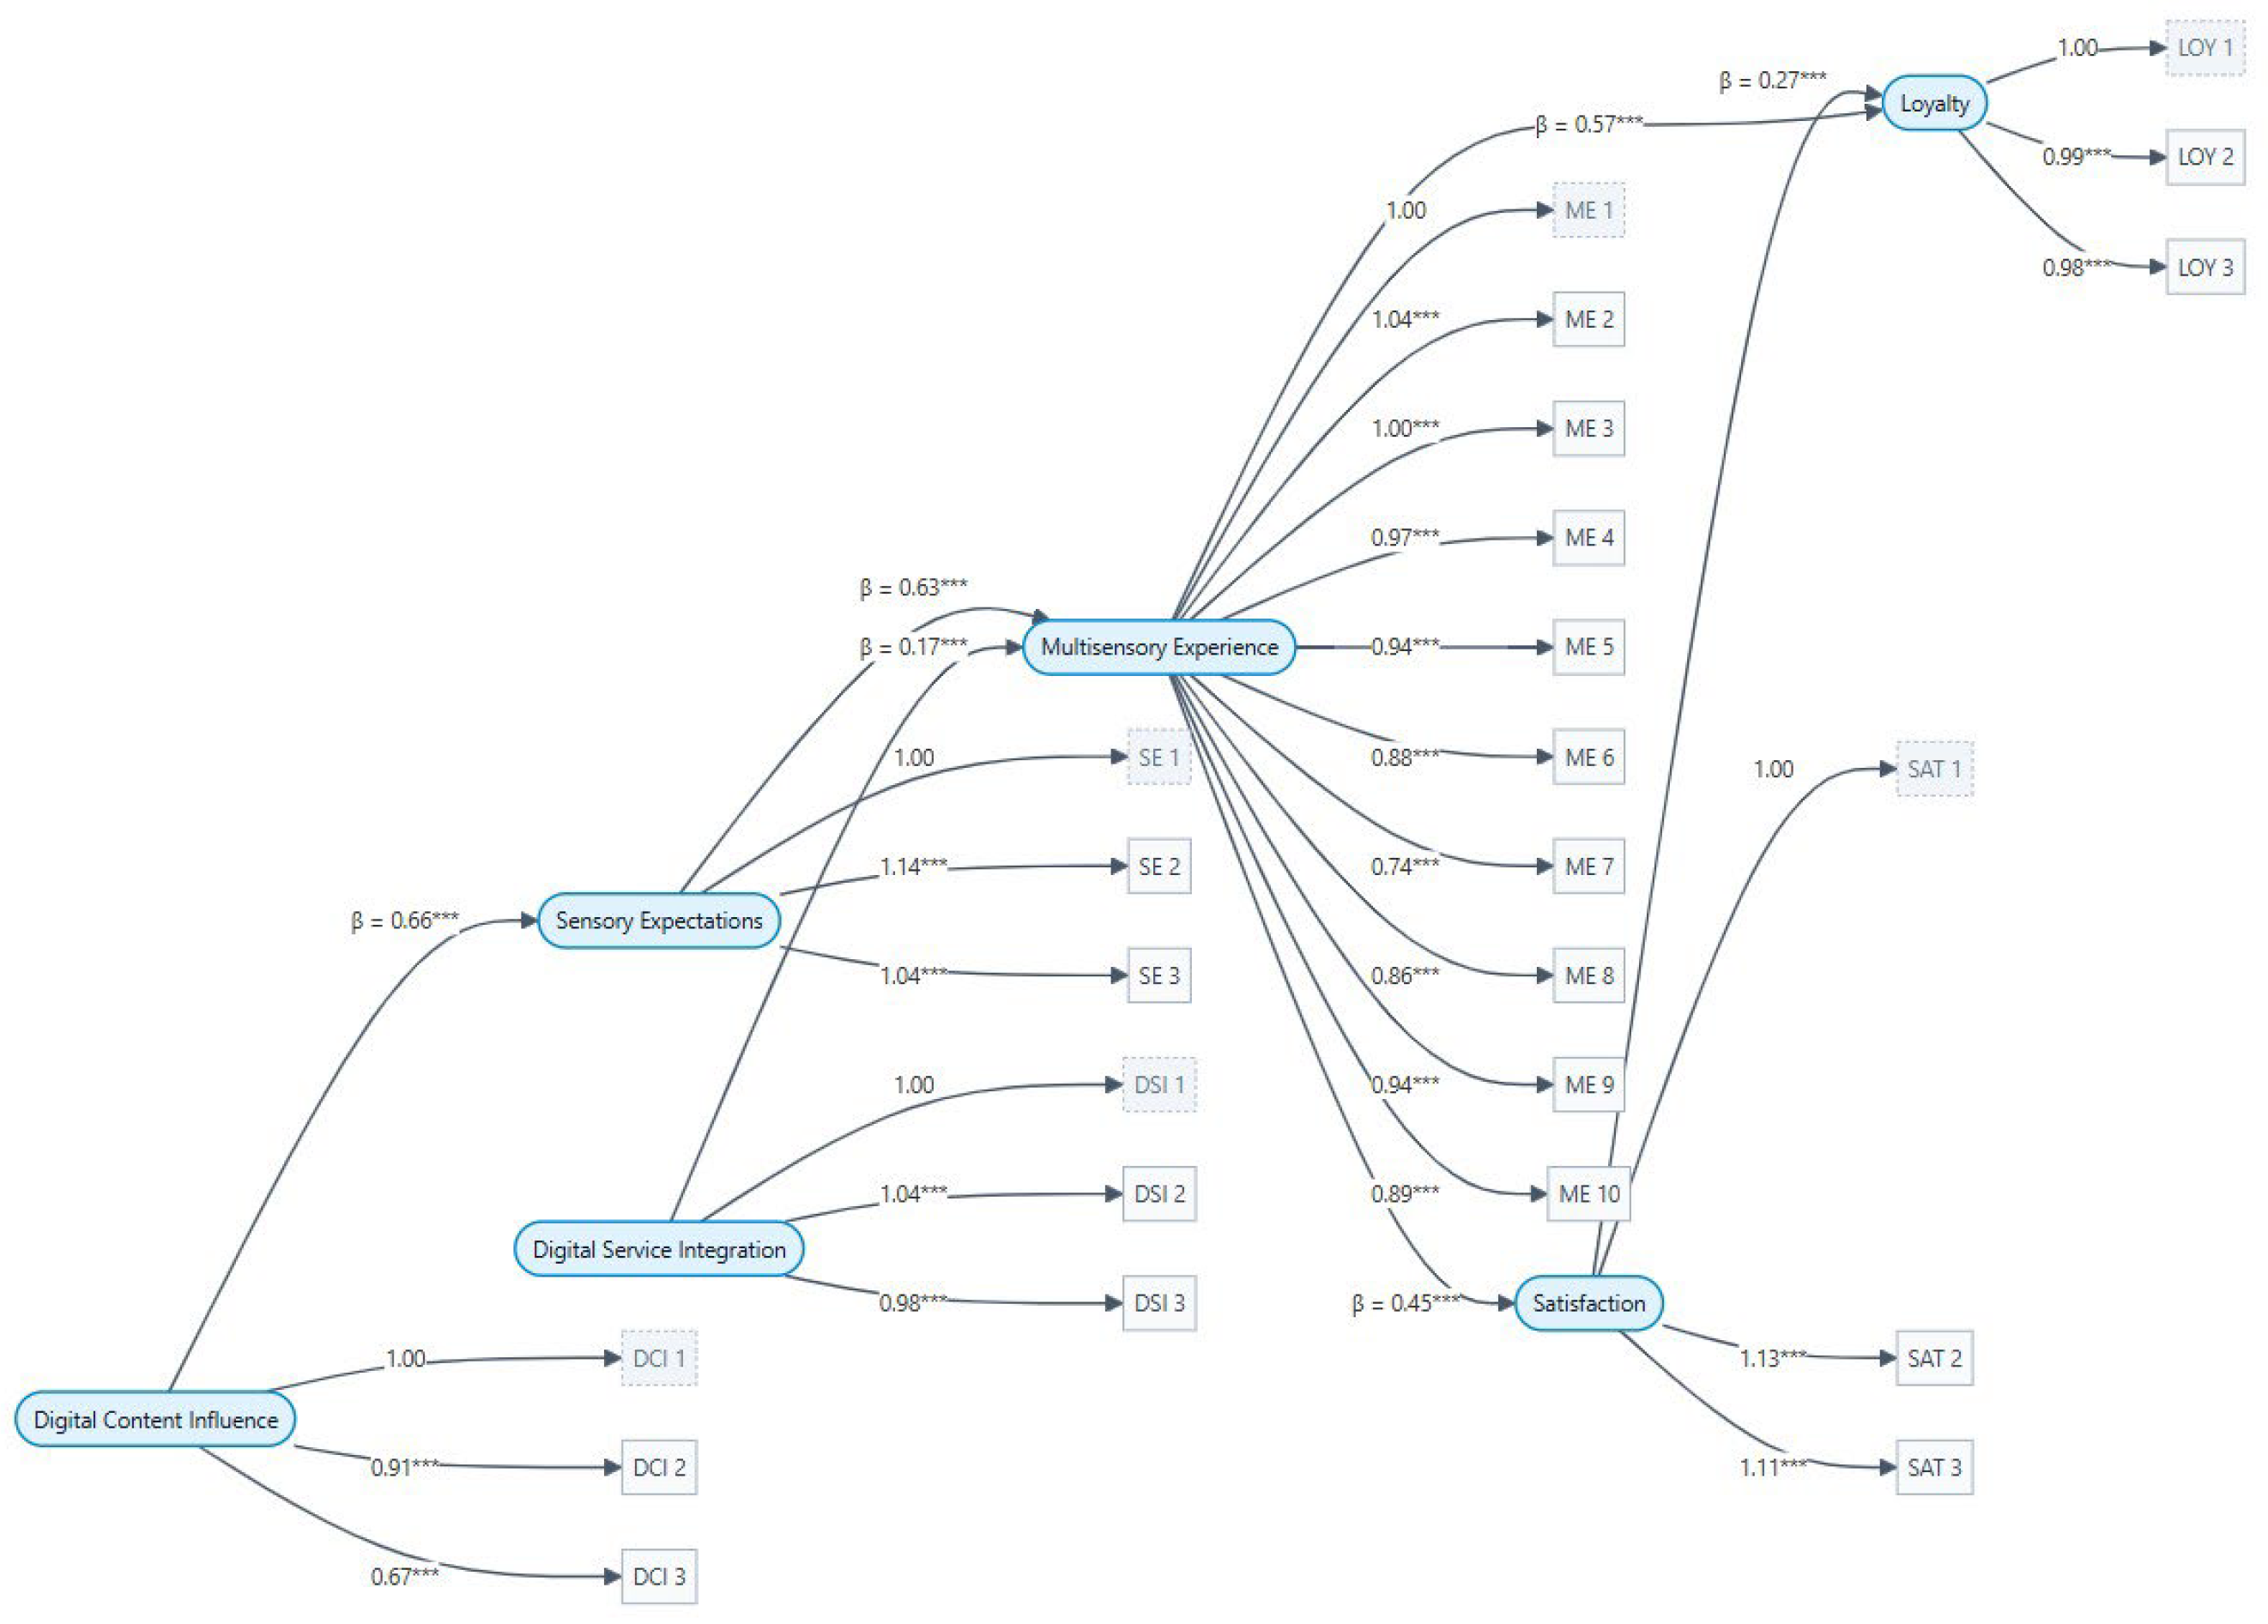
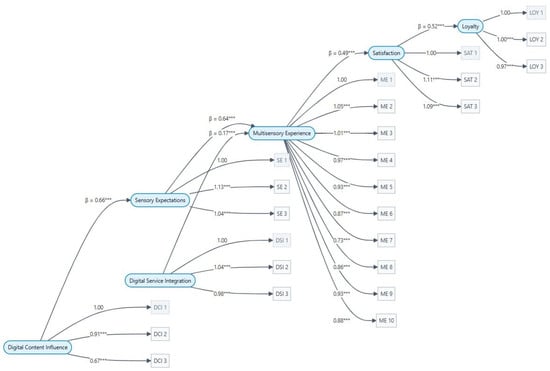
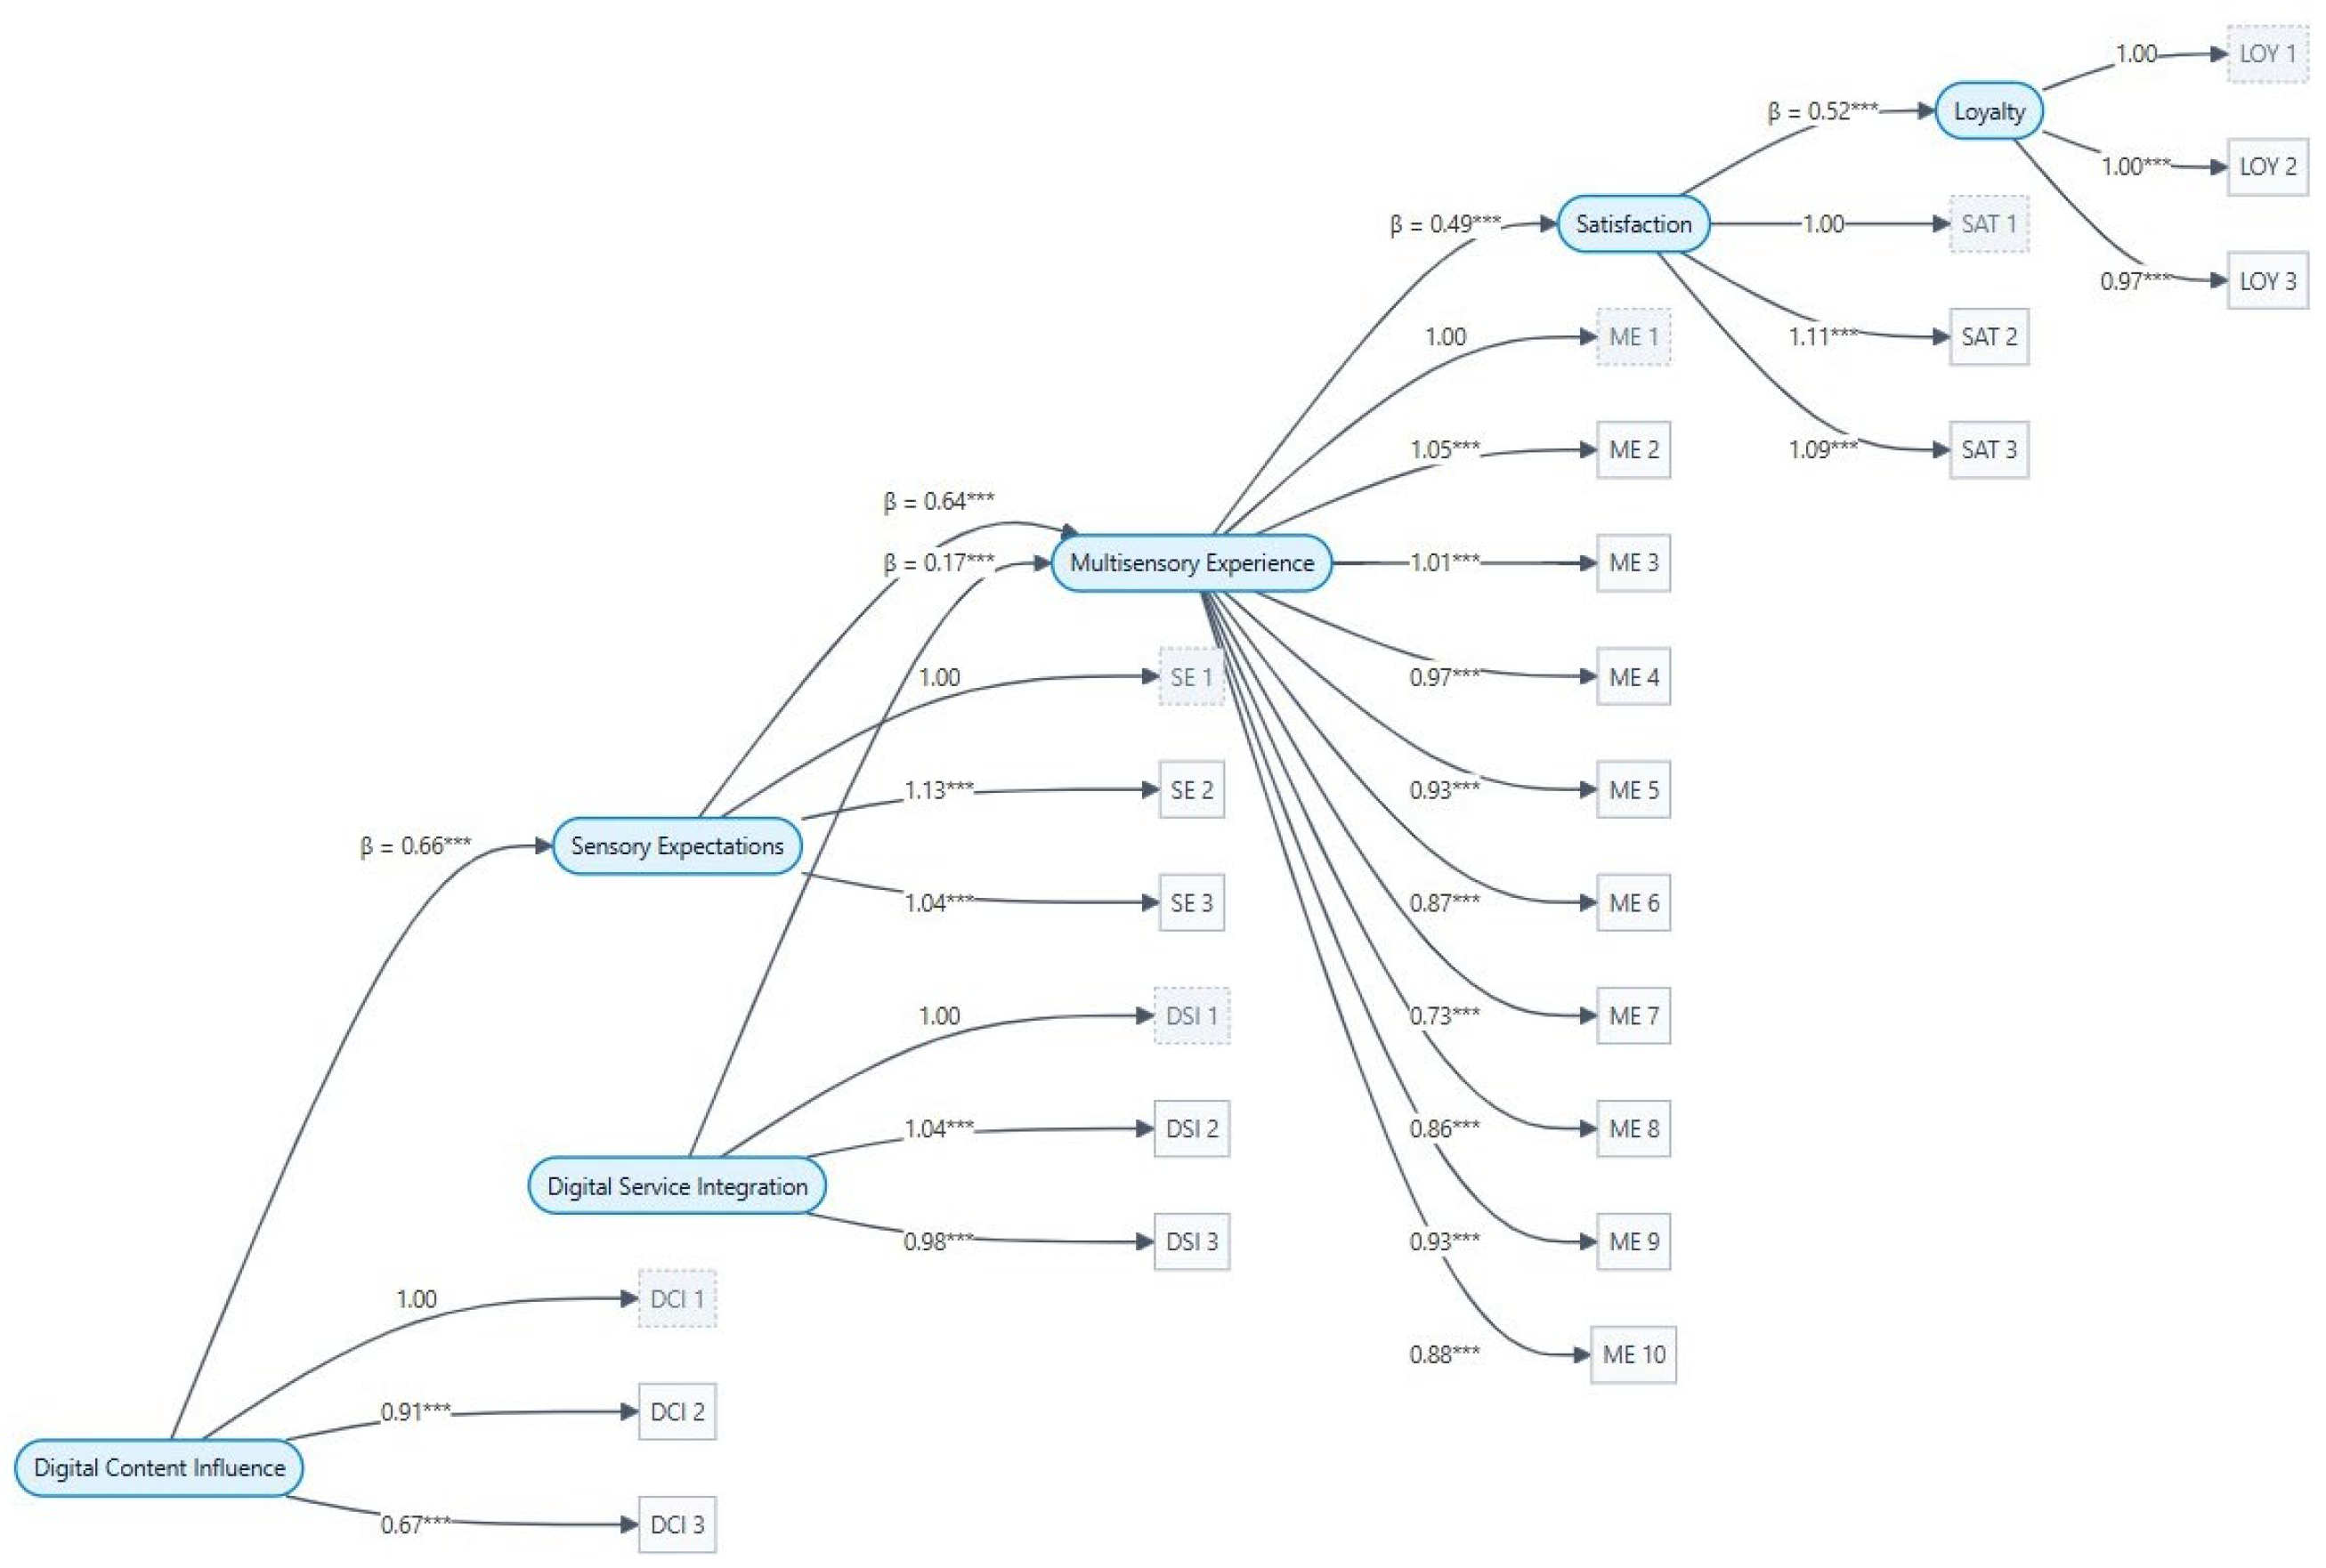

Disclaimer/Publisher’s Note: The statements, opinions and data contained in all publications are solely those of the individual author(s) and contributor(s) and not of MDPI and/or the editor(s). MDPI and/or the editor(s) disclaim responsibility for any injury to people or property resulting from any ideas, methods, instructions or products referred to in the content. |
© 2026 by the authors. Licensee MDPI, Basel, Switzerland. This article is an open access article distributed under the terms and conditions of the Creative Commons Attribution (CC BY) license.