


Abstract
This study examines the association between AI-driven personalization and brand loyalty toward smart tourism platforms, with two distinct consumer responses—perceived recommendation discovery and perceived AI recommendation quality—specified as parallel indirect pathways, while considering the conditional roles of need for cognition and perceived privacy risk. Using a cross-sectional online survey distributed through travel-related social media groups, data from 1232 eligible users of AI-enabled smart tourism platforms were analyzed through partial least squares structural equation modeling. The findings indicate that AI-driven personalization is positively associated with brand loyalty and with both recommendation responses. Perceived recommendation discovery and perceived AI recommendation quality are also positively associated with brand loyalty, and significant indirect associations are observed through both recommendation responses. Need for cognition is positively associated with perceived AI recommendation quality, while the personalization–quality association and its corresponding indirect association with brand loyalty are stronger at higher levels of need for cognition. In contrast, perceived privacy risk is negatively associated with perceived recommendation discovery, while the personalization–discovery association and its corresponding indirect association with brand loyalty are weaker at higher levels of perceived privacy risk. Given the cross-sectional design, these structural, indirect, and conditional findings are interpreted as contemporaneous associations rather than as evidence of causal or temporal ordering. The study’s originality lies in extending transparency- and trust-based explanations by distinguishing between a discovery-oriented recommendation response and the evaluative quality of AI-generated recommendations and examining how the focal associations vary across levels of cognitive motivation and perceived privacy risk. By integrating the Stimulus–Organism–Response framework with the Elaboration Likelihood Model and Privacy Calculus Theory, the study offers a more differentiated account of when personalized recommendations are associated with platform loyalty and offers practical considerations for balancing recommendation relevance, exploratory discovery, cognitive support, and privacy protection.
1. Introduction
Tourism decisions are unusually information-intensive because travelers must evaluate heterogeneous and often intangible alternatives before consumption. Digital technologies have progressively reorganized this process by altering tourism distribution, managerial practices, and interactions between travelers and service providers [1]. Smart tourism extended this transformation by integrating technological infrastructures, data resources, tourism organizations, and consumers within interconnected digital ecosystems [2]. Artificial intelligence represents a further development because it enables platforms to learn from user data, adapt their outputs, and provide analytical or interactive assistance throughout the customer journey [3]. Its relevance is particularly pronounced in tourism, where extensive information search intersects with experiential, financial, and socially sensitive decisions [4]. Consequently, smart tourism platforms increasingly participate in how consumers discover, compare, and revisit travel and hospitality alternatives rather than merely displaying available options.
AI-Driven Personalization is central to this transformation. In the present study, it refers specifically to users’ perceptions that a smart tourism platform tailors and adjusts travel information, content, and recommendations according to their individual preferences, inputs, and user profiles. It therefore represents perceived platform adaptation rather than the objective technical sophistication of the underlying AI system. Recommender systems address information overload by filtering and ranking alternatives according to user profiles, previous behavior, contextual information, and expressed preferences [5]. In tourism, such capabilities can reduce the effort required to compare destinations, accommodation services, transportation options, and activities, positioning recommendations as decision-support resources rather than simple search outputs [6]. Nevertheless, personalization is a technological capability, not an inherently valuable consumer outcome. A recommendation can be individually tailored while remaining repetitive, irrelevant, outdated, or insufficiently reliable. Tourism research has associated personalized recommendations with e-tourism user experience through information-quality and technology-trust evaluations [7], but favorable evaluations of individual recommendations do not necessarily correspond with stronger loyalty-related intentions toward the platform providing them.
This distinction reveals an important gap in the developing literature on AI-enabled tourism services. Ref. [8] examined how inspiration from generative AI relates to consumers’ acceptance of hotel recommendations, whereas ref. [9] examined the association between generative AI personalization and smart tourism platform brand loyalty through perceived transparency and consumer trust. Ref. [10] similarly showed that personalization was associated with tourists’ adoption of AI-driven smart tourism technologies, with trust dynamics operating as an important explanatory mechanism. Although these studies clarify important acceptance-, adoption-, and relationship-oriented responses, they leave the recommendation output itself insufficiently differentiated. Recent tourism research has not yet jointly examined whether the association between AI-driven personalization and platform loyalty can be statistically decomposed into distinct discovery-oriented and evaluative-quality pathways, or whether the strength of these associations varies with consumers’ cognitive motivation and perceived privacy risk. Outside tourism, ref. [11] connected algorithmic personalization with experiential brand loyalty in music-streaming services, while ref. [12] demonstrated the behavioral relevance of recommendation serendipity in mobile e-commerce. Neither study, however, examined discovery-oriented recommendation experience and perceived recommendation quality jointly within smart tourism platforms. The literature leaves unresolved how discovery-oriented recommendation experiences and perceived recommendation quality coexist as distinct correlates of loyalty toward an AI-enabled tourism platform and how theoretically relevant consumer characteristics correspond with variation in these relationships.
The present study addresses this problem by distinguishing two recommendation responses. Perceived Recommendation Discovery refers to users’ perceptions that personalized recommendations facilitate pleasant surprise, unexpected discovery, exposure to previously unconsidered travel or hospitality options, and expansion of the range of alternatives explored. The construct is conceptually rooted in the discovery-oriented component of recommendation serendipity but is not treated as equivalent to the full canonical serendipity construct. The broader recommender-systems literature commonly conceptualizes serendipity as unexpectedness accompanied by relevance or usefulness [13]. Because the retained indicators capture the discovery-oriented component rather than the complete combination of unexpectedness and usefulness, the present study adopts the label Perceived Recommendation Discovery rather than Perceived Recommendation Serendipity. Recommendation relevance and decision usefulness are assessed separately within Perceived AI Recommendation Quality. This terminology aligns the construct label with the actual indicator content and avoids implying that the study operationalizes recommendation serendipity in its broader canonical sense. Ref. [12] demonstrated that recommendation serendipity is behaviorally meaningful in mobile e-commerce, and the discovery-oriented elements adapted from this measurement stream provide the conceptual basis for the present discovery construct. Their role as a distinct correlate of personalization and platform-level loyalty intentions in smart tourism remains comparatively underexamined. Perceived AI Recommendation Quality, by contrast, captures users’ evaluation of recommendation output in terms of accuracy for their needs, relevance to the focal travel decision, usefulness for comparing alternatives, currency, and reliability for decision support. It therefore represents perceived output quality rather than an objective assessment of algorithmic accuracy. This evaluation reflects the fitness-for-use conception of information quality advanced by [14] and the decision-support function attributed to recommendation agents by [6]. Separating these constructs is theoretically informative because a recommendation can be dependable without being unexpected, while an unexpected suggestion can encourage exploration without providing sufficient confidence for a booking decision. Treating both as a general favorable experience would conceal the different reasons consumers might value the recommending platform.
The strength of these associations may also vary across consumers. Need for Cognition reflects an individual tendency to engage in and enjoy effortful thinking [15]. Individuals higher in this tendency generally display a stronger disposition toward cognitive effort and more extensive information processing; this does not imply that they necessarily evaluate AI-generated recommendations more favorably. Consistent with the Elaboration Likelihood Model’s distinction between different levels of information elaboration [16], such cognitive motivation is theoretically relevant to how extensively consumers scrutinize the accuracy, relevance, currency, comparison usefulness, and reliability of personalized recommendations. Need for Cognition is therefore positioned as a focal boundary condition of the personalization–recommendation quality association, without presuming that its moderating relevance is exclusive to this relationship. Perceived Privacy Risk refers to users’ perceived informational vulnerability when using the platform, including potential loss of control over personal information, misuse, unauthorized access, and broader threats to privacy. The data underlying an unexpectedly well-tailored recommendation can make discovery feel intrusive. The personalization paradox indicates that greater relevance can coexist with heightened perceptions of vulnerability when consumers recognize the extent of information collection involved [17]. Evaluations of digital personalization may also vary according to whether consumers regard the provider’s collection and use of personal information as sufficiently legitimate and trustworthy [18]. From a Privacy Calculus perspective, consumers evaluate personalization benefits alongside potential losses of control and exposure to information misuse [19]. Perceived Privacy Risk is consequently theorized as a focal boundary condition of the personalization–discovery association because unexpectedly well-matched recommendations may simultaneously signal valuable discovery and extensive informational reach. This theoretical placement identifies the relationship of primary interest without assuming in advance that privacy risk is irrelevant to other recommendation evaluations.
The three theoretical perspectives perform distinct but complementary functions in the proposed framework. Stimulus–Organism–Response Theory provides the overarching structural architecture by distinguishing the focal platform stimulus, users’ internal recommendation evaluations, and the downstream loyalty-related response [20]. Applications of this perspective to digital consumption similarly distinguish technological cues from the cognitive and affective states associated with subsequent online responses [21]. Accordingly, AI-Driven Personalization represents the focal stimulus, Perceived Recommendation Discovery and Perceived AI Recommendation Quality constitute distinct organismic evaluations, and Smart Tourism Platform Brand Loyalty represents the response. In this study, brand loyalty is deliberately operationalized as an attitudinal/intentional expression reflected in positive advocacy, intentions to use the platform more frequently, and future-use intentions rather than observed repeat behavior, first-choice preference, or resistance to switching. S–O–R alone, however, does not specify why consumers differ in how extensively they process the same personalized output or why data-intensive personalization may be evaluated simultaneously in terms of benefit and informational vulnerability. ELM addresses the first limitation by explaining heterogeneity in cognitive elaboration associated with Need for Cognition, whereas Privacy Calculus Theory addresses the second by explaining the coexistence of personalization benefits and perceived privacy costs. The three perspectives are therefore complementary rather than interchangeable: S–O–R organizes the stimulus–appraisal–response structure, ELM explains cognitive-processing heterogeneity, and Privacy Calculus Theory explains privacy-related appraisal.
This study consequently examines whether AI-Driven Personalization is associated with Smart Tourism Platform Brand Loyalty directly and through the distinct pathways of Perceived Recommendation Discovery and Perceived AI Recommendation Quality. It further examines whether the personalization–quality association and its corresponding indirect association differ across levels of Need for Cognition, and whether the personalization–discovery association and its corresponding indirect association differ across levels of Perceived Privacy Risk. The study contributes in three respects. First, it shifts attention from recommendation acceptance and continued AI use toward an attitudinal/intentional expression of loyalty to the smart tourism platform as a brand. Second, differentiates the exploratory value of recommendation discovery from the diagnostic value of recommendation quality, thereby avoiding an undifferentiated treatment of favorable recommendation responses. Third, it develops a theoretically differentiated account of consumer heterogeneity by locating Need for Cognition and Perceived Privacy Risk within distinct focal relationships and examining whether the observed associations vary accordingly, rather than presuming pathway exclusivity in advance. The resulting framework offers a conditional dual-pathway account of the associations among tailored AI recommendations, recommendation evaluations, and platform loyalty. Given the cross-sectional design, the ordering of these constructs is theoretically specified and analytically estimated rather than interpreted as demonstrated temporal or causal ordering.
2. Literature Review and Hypotheses Development
2.1. Theoretical Underpinnings
The Stimulus–Organism–Response (S–O–R) framework provides the overarching theoretical architecture for the proposed model. Ref. [20] originally conceptualized environmental cues as stimuli that are theoretically linked to internal evaluations and behavioral responses. In digital commerce, however, the relevant environment is not merely a visual interface; it also encompasses the platform’s informational logic, adaptive functionality, and interaction structure. Ref. [21] extended the S–O–R framework to online retail settings by conceptualizing consumers’ cognitive and affective states as intervening appraisals between digital environmental characteristics and behavioral responses. Ref. [22] further argued that organismic processes are indispensable because an observable stimulus does not possess a fixed behavioral meaning independently of how it is interpreted. This distinction is particularly important for AI-enabled tourism platforms, where the same personalized recommendation may be regarded as helpful adaptation, unexpected discovery, algorithmic competence, intrusive profiling, or some combination of these evaluations. In the present cross-sectional study, this stimulus–appraisal–response ordering serves as a theoretical organizing structure rather than as evidence that the constructs occurred in an empirically observed temporal sequence.
Within the present framework, AI-driven personalization represents the focal stimulus because it captures users’ perceptions that a smart tourism platform adjusts its information and recommendations according to their profiles, preferences, and inputs. It therefore reflects perceived platform adaptation rather than the objective technical sophistication of the underlying AI system. Perceived Recommendation Discovery and Perceived AI Recommendation Quality constitute distinct organismic appraisals associated with this perceived adaptation. Perceived Recommendation Discovery captures pleasant surprise, unexpected discoveries, exposure to previously unconsidered options, and expansion beyond the consumer’s anticipated search horizon. It is conceptually informed by the discovery-oriented component of recommendation serendipity but is not treated as equivalent to the broader serendipity construct, which typically also incorporates relevance or usefulness. Perceived AI Recommendation Quality, by contrast, represents an instrumental appraisal of whether the recommendations are accurate, relevant, current, useful, and reliable for the focal travel decision. This dual representation is consistent with user-centric recommender-system research, which rejects the assumption that algorithmic performance alone adequately represents the user experience. Ref. [23] distinguishes objective system properties from consumers’ subjective evaluations, while ref. [24] similarly positions perceived recommendation characteristics between system functionality and downstream user responses. Accordingly, smart tourism platform brand loyalty is conceptualized as the response component because it captures favorable communication about the platform and intentions to use it more frequently and in the future. The construct is therefore treated in this study as an attitudinal/intentional expression of loyalty rather than as observed repeat behavior or resistance to switching.
The S–O–R framework is sufficiently broad to organize the model but does not, by itself, specify why users differ in the way they interpret the same personalized output. The Elaboration Likelihood Model (ELM) addresses one part of this limitation by distinguishing between judgments grounded in effortful examination of diagnostic information and judgments formed through less demanding cues [16]. Need for cognition is theoretically relevant to this distinction because it represents a stable tendency to engage in and enjoy effortful thinking rather than a favorable disposition toward technology. Ref. [25] established this construct as an individual difference in cognitive motivation, and ref. [26] subsequently demonstrated its relevance to information seeking, argument scrutiny, and judgment formation. In personalized digital environments, ref. [27] showed that user responses depend partly on how consumers process personalized alternatives, thereby supporting the use of ELM to explain heterogeneity in the personalization–recommendation quality pathway. Crucially, ELM provides a rationale for differences in the extent of elaboration rather than for automatically more favorable recommendation evaluations among consumers more in need of cognition. Greater cognitive engagement may support closer recognition of recommendation strengths, but it may also make weaknesses more detectable. In the present model, ELM therefore motivates examination of whether the personalization–quality association varies with cognitive motivation, without assuming the direction of every evaluative judgment from Need for Cognition alone.
Privacy Calculus Theory addresses a different limitation of S–O–R. Unexpected personalization may simultaneously communicate helpful discovery and extensive data inference. Privacy Calculus Theory conceptualizes information-related judgments as evaluations involving anticipated benefits and privacy-related costs rather than as uniformly favorable or unfavorable reactions to data disclosure. Ref. [19] demonstrated that perceived benefits and privacy concerns can coexist within e-commerce evaluations, while ref. [28] showed that consumers’ desire for personalization is accompanied by reservations about being profiled. In travel websites specifically, ref. [29] found that personalization and privacy assurance represent interdependent elements of customer evaluation. Perceived privacy risk is therefore positioned as particularly relevant to the personalization–discovery association because unexpected but well-matched recommendations may be interpreted either as valuable discovery or as evidence of extensive informational reach. This positioning identifies the theoretically focal relationship rather than assuming that privacy risk can moderate no other recommendation evaluation.
The integration of the three theories is complementary rather than interchangeable. S–O–R specifies the model’s stimulus–appraisal–response structure; ELM explains heterogeneity in the depth of cognitive processing relevant to evaluating recommendation quality; and Privacy Calculus Theory explains how perceived informational benefits may coexist with privacy-related vulnerability when users encounter unexpectedly well-tailored recommendations. The theories are therefore not interchangeable. S–O–R identifies where the constructs are positioned within the overall framework but does not specify the individual-level processing logic underlying variation in those associations. ELM supplies the cognitive-elaboration mechanism relevant to Need for Cognition, whereas Privacy Calculus Theory supplies the benefit–risk appraisal logic relevant to Perceived Privacy Risk. This division of theoretical labor avoids treating every construct as evidence for a separate theory. It also prevents Perceived Recommendation Discovery and Perceived AI Recommendation Quality from becoming interchangeable indicators of a generally positive platform experience. The framework instead specifies two substantively different appraisal pathways and identifies different theoretically focal moderators for them, while leaving the exclusivity of these conditional associations to empirical examination rather than assuming it a priori.
2.2. AI-Driven Personalization and Consumer Recommendation Responses
AI-driven personalization refers to consumers’ perceptions that a smart tourism platform adjusts the content and recommendations it displays according to their preferences, inputs, interests, or user profiles. This conceptualization concerns perceived adaptation rather than the technical sophistication of the underlying algorithm. Ref. [30] distinguishes personalization from generic customization by emphasizing system-mediated adaptation to individual users, whereas ref. [5] positions recommender systems as mechanisms for matching extensive choice sets with user-specific interests. In tourism, this matching function is especially consequential because travel decisions involve interdependent alternatives, temporal constraints, heterogeneous preferences, and substantial information search. Ref. [7] consequently treats personalized tourism recommendations as an important component of the e-tourism user experience. Nevertheless, personalization should not be equated with successful recommendation outcomes: a platform may visibly adapt its content while still offering predictable, inaccurate, or unhelpful options.
At the platform level, personalization may be positively associated with brand loyalty when consumers interpret adaptive content as evidence that the platform recognizes their travel requirements and reduces the effort involved in re-establishing those requirements across successive interactions. Ref. [31] found that personalized content is processed partly through its relevance and self-referential value, suggesting that adaptation becomes meaningful when consumers can connect displayed content with their decision goals. Ref. [32] likewise showed that personalization and familiarity are relevant to consumers’ trust and adoption of recommendation agents. These findings do not imply that personalization is inherently loyalty-producing. Highly personalized encounters may appear intrusive or mechanically overfitted, and a technically adaptive platform may still be accompanied by weak advocacy or future-use intentions. Even so, when users perceive stronger alignment between platform output and their travel profiles, they may report more favorable platform-oriented intentions extending beyond their evaluation of a single transaction. This reasoning is compatible with hospitality evidence connecting technology-mediated brand experiences with brand loyalty [33] and with recent research treating loyalty toward generative AI services as a distinctive outcome in hospitality and tourism [34].
The association between AI-driven personalization and perceived recommendation discovery concerns whether personalization expands the consumer’s exploration space rather than merely reproducing familiar options. The broader recommender-systems literature on serendipity provides an important conceptual foundation for this discovery-oriented response. Ref. [13], for example, identifies unexpectedness, novelty, and relevance as recurrent elements of serendipitous recommendation, while ref. [35] emphasizes that serendipity cannot be reduced to random diversification. Ref. [12] similarly conceptualizes serendipitous recommendation as involving discoveries that are unexpected yet meaningful to the user. The present study draws specifically on the discovery-oriented elements of this literature rather than treating Perceived Recommendation Discovery as equivalent to the complete serendipity construct.
Personalization can potentially support such discovery because recommender systems use user-specific information to narrow large choice sets while still exposing consumers to alternatives they might not otherwise encounter [5,13]. When adaptive recommendation processes surface unfamiliar destinations, accommodations, activities, or other travel options that remain broadly aligned with users’ interests, the resulting experience may involve pleasant surprise, previously unconsidered alternatives, and expansion of the range explored [12]. Excessive similarity to prior behavior may instead produce repetitive recommendation sets, whereas excessive deviation may generate novelty with little personal significance [13,35]. Perceived Recommendation Discovery therefore captures the extent to which personalized recommendations broaden exploration in a personally meaningful way, without incorporating the separate relevance and decision-usefulness evaluations assessed within Perceived AI Recommendation Quality. AI-driven personalization is consequently expected to be positively associated with perceived recommendation discovery when adaptive recommendation processes expand, rather than merely reproduce, the consumer’s established search pattern.
Perceived AI recommendation quality represents a separate response to personalization. Whereas recommendation discovery concerns expansion of the consumer’s exploration space, recommendation quality concerns the decision utility and dependability of the displayed alternatives. Ref. [14] demonstrates that information quality is multidimensional from the user’s perspective, encompassing contextual relevance, accuracy, timeliness, and usefulness rather than technical correctness alone. Consistent with this user-oriented logic, ref. [24] argues that recommender quality must be evaluated through consumer perceptions, and ref. [6] shows that recommendation agents should be assessed according to their contribution to consumer decision processes. Personalization provides a plausible basis for a positive association with perceived recommendation quality because greater alignment with current inputs and travel preferences may correspond with recommendation sets that appear more pertinent to the focal decision. Yet the association remains perceptual: profile matching does not establish objective accuracy, and consumers may infer quality from visible fit even when the system’s underlying information is incomplete. The distinction therefore preserves AI-driven personalization as perceived platform adaptation and perceived AI recommendation quality as consumers’ evaluation of the resulting recommendation output.
H1.
AI-driven personalization is positively associated with smart tourism platform brand loyalty.
H2.
AI-driven personalization is positively associated with perceived recommendation discovery.
H3.
AI-driven personalization is positively associated with perceived AI recommendation quality.
2.3. Recommendation Responses and Smart Tourism Platform Brand Loyalty
Brand loyalty is theoretically broader than satisfaction with an isolated recommendation. Ref. [36] conceptualizes loyalty as a sustained commitment across future consumption situations, while ref. [37] distinguishes attitudinal loyalty from repeated behavioral preference. The present study examines a deliberately bounded expression of Smart Tourism Platform Brand Loyalty, reflected in favorable communication about the platform and intentions to use it more frequently and in future travel decisions. It therefore captures advocacy and intended future use rather than actual repeated behavior, first-choice preference, or resistance to switching. This operationalization is consistent with the indicators adapted from [33] and recognizes that favorable responses to AI-mediated interactions can become associated with the platform through which those interactions are experienced. Perceived Recommendation Discovery offers a plausible experiential basis for a positive association with such loyalty. Travel search is not always directed toward a fully specified alternative; consumers may enter the platform with incomplete preferences and refine their objectives as they encounter destinations, accommodation options, activities, or combinations they had not previously considered. Discovery-oriented recommendations can therefore distinguish a platform not simply by reducing search effort but by enlarging the consumer’s perceived opportunity set. The broader serendipity literature provides relevant support for this reasoning: Ref. [12] reports favorable relationships between recommendation serendipity, satisfaction, and purchase intention, indicating that unexpected and meaningful discovery can have downstream commercial relevance. However, the present construct is deliberately narrower than canonical serendipity and focuses on the discovery-oriented experience itself rather than incorporating relevance or usefulness within the same measure. As ref. [35] emphasizes, unexpected recommendation outcomes become meaningful when they move beyond arbitrary deviation from expected results. When users associate a smart tourism platform with pleasantly surprising discoveries, previously unconsidered alternatives, and expansion of the options they explore, the platform may acquire a distinctive exploratory value relative to competing services. Such an association provides a theoretical basis for stronger intentions to revisit and advocate the platform, without implying that recommendation discovery itself causally produces loyalty [12,35].
Perceived AI recommendation quality offers a more instrumental basis for its expected positive association with loyalty. Information-systems research distinguishes technical availability from the quality that users attribute to system output. Ref. [38] positions information quality as central to user evaluations of information-system success, while ref. [39] connects object-based quality beliefs with broader attitudes toward system use. In recommender systems, ref. [6] argues that recommendation agents acquire value when they assist consumers in evaluating alternatives and improving decision processes. Accuracy, relevance, currency, comparison usefulness, and reliability therefore represent diagnostic signals that the smart tourism platform may be regarded as dependable in subsequent travel decisions. This interpretation of dependable decision support is consistent with service research connecting favorable quality evaluations with retention-oriented intentions and positive word of mouth [40]. Because tourism choices often involve financial, temporal, and experiential consequences, more favorable perceptions of recommendation quality may therefore correspond with stronger future-use and advocacy intentions toward the platform. The two recommendation responses are related to loyalty for different reasons. Perceived Recommendation Discovery is associated with the platform’s exploratory value, whereas perceived AI recommendation quality is associated with its perceived decision-support competence. A recommendation can be accurate and reliable without extending the consumer’s search horizon; alternatively, it can introduce an unexpected option that is intriguing but insufficiently dependable for decision support. Ref. [23] cautions against evaluating recommender systems through a single performance criterion because different subjective system aspects capture distinct components of user experience. Treating discovery and quality as separate correlates of loyalty therefore offers greater explanatory precision than combining them into an undifferentiated favorable recommendation evaluation.
H4.
Perceived Recommendation Discovery is positively associated with smart tourism platform brand loyalty.
H5.
Perceived AI recommendation quality is positively associated with smart tourism platform brand loyalty.
2.4. Recommendation Responses as Indirect Pathways to Brand Loyalty
A direct association between AI-driven personalization and brand loyalty does not specify what consumers value in the personalized encounter. S–O–R reasoning instead requires analytical separation between the adaptive platform feature and the internal evaluations associated with how that feature is interpreted by consumers. Ref. [22] argues that stimuli should not be treated as behaviorally self-explanatory because their meaning depends on organismic processing. Similarly, ref. [23] demonstrates that objective or perceived system characteristics are connected with user outcomes through intervening evaluations of the recommendation experience. Applied to smart tourism platforms, personalization may be recognized by consumers, but its association with loyalty may be partly reflected in how the personalized output is evaluated during travel search. Perceived Recommendation Discovery constitutes the discovery-oriented pathway. AI-driven personalization may correspond with the platform’s capacity to move beyond generic or repetitive results while maintaining a connection with the consumer’s travel profile. When this perceived alignment is accompanied by pleasant surprise, previously unconsidered alternatives, or expansion of the range explored, the platform may become associated with distinctive exploratory value. The broader serendipity literature provides conceptual support for this discovery-oriented logic. Ref. [12] shows that serendipitous recommendation experiences are associated with favorable user responses, while ref. [13] emphasizes that unexpectedness and novelty are central components of serendipitous recommendation but are not sufficient on their own to represent the full construct. The present pathway therefore draws specifically on the discovery-oriented component of this literature rather than treating Perceived Recommendation Discovery as equivalent to canonical recommendation serendipity. The proposed indirect association is accordingly grounded in pleasant surprise, unexpected discovery, and expanded exploration rather than in unfamiliarity alone. Perceived AI recommendation quality represents the decision-support pathway. Personalization may correspond with recommendation content that users perceive as aligned with their expressed or inferred requirements, while recommendation quality reflects their evaluation of whether that content is sufficiently accurate, relevant, current, useful for comparison, and reliable. Ref. [31] shows that content relevance is associated with users’ information processing and decision outcomes, while ref. [24] places perceived recommendation quality between system characteristics and user attitudes. More favorable evaluations of personalized recommendation quality may, in turn, coincide with stronger intentions to rely on and advocate the platform in subsequent travel decisions. The proposed indirect pathway is therefore interpreted as a statistical and theoretically organized association, not as evidence that personalization temporally precedes recommendation quality or causally produces loyalty.
The hypothesized model specifies the two recommendation responses as parallel rather than serial pathways because the theoretical argument does not require one appraisal to temporally precede the other. Recommendation discovery does not necessarily precede a quality judgment, and a recommendation need not involve unexpected discovery to be judged accurate or reliable. Equally, consumers may value the expansion of their search horizon without having formed an equivalent judgment of the recommendation’s decision-support quality. Recommender-system research has repeatedly cautioned that accuracy, novelty, diversity, and subjective experience capture non-equivalent aspects of recommendation performance [24,35]. The parallel specification consequently examines whether AI-driven personalization is associated with smart tourism platform brand loyalty through two distinct forms of consumer appraisal: exploratory discovery and instrumental adequacy. Because the data are cross-sectional, these indirect pathways represent contemporaneous statistical associations organized according to theory rather than demonstrated temporal mediation processes.
H6.
AI-driven personalization has a positive indirect association with smart tourism platform brand loyalty through perceived recommendation discovery.
H7.
AI-driven personalization has a positive indirect association with smart tourism platform brand loyalty through perceived AI recommendation quality.
2.5. Need for Cognition in the Personalization–Recommendation Quality Pathway
Need for cognition captures consumers’ dispositional tendency to engage in and enjoy effortful cognitive activity [25]. It should not be interpreted as intelligence, technological readiness, expertise, or an inherently favorable attitude toward AI. Ref. [26] shows that individuals more in need for cognition are generally more inclined to seek information, examine arguments, and invest cognitive resources in judgment formation. Within the ELM, such individuals are more likely to base evaluations on the diagnostic merits of available information, whereas those lower in need for cognition are comparatively more receptive to accessible or peripheral cues [16]. Ref. [41] provides corresponding consumer evidence by showing that attitudes among high-need-for-cognition individuals are more closely grounded in product-attribute evaluations. At the main-effect level, Need for Cognition may be associated with perceived AI recommendation quality even independently of variation in the degree of personalization. Perceived recommendation quality is not a purely immediate reaction to the presence of a recommendation; it requires users to evaluate multiple diagnostic attributes, including accuracy, relevance to the current travel task, currency, comparison usefulness, and reliability [25]. Individuals higher in Need for Cognition are generally more willing to devote cognitive resources to examining such attribute-level information, comparing alternatives, detecting consistency across recommendation cues, and integrating multiple pieces of evidence into an overall judgment [26,41]. In recommender-system settings, this greater evaluative engagement provides a plausible mechanism through which users may form more elaborated judgments of recommendation quality rather than relying primarily on surface-level cues [9].
Importantly, greater cognitive engagement does not imply mechanically more favorable evaluations. More extensive scrutiny can also expose inaccurate, outdated, or weakly matched recommendations. The positive expectation in H8 therefore reflects a net directional association within the present context of experienced smart-tourism-platform users: when recommendation outputs contain diagnostic signs of accuracy, relevance, usefulness, currency, and reliability, users higher in Need for Cognition have greater opportunity to identify and integrate those qualities into their evaluations [25,26]. Conversely, poor recommendation performance may be judged more critically by the same users. The hypothesis therefore concerns the expected average direction of the association rather than implying that Need for Cognition is a strong determinant of recommendation quality or that cognitive elaboration necessarily produces favorable evaluations [9]. This main-effect argument is conceptually distinct from the subsequent moderation hypothesis. H8 concerns whether individuals with a stronger general disposition toward cognitive elaboration tend, on average, to report different levels of recommendation quality. H9 instead concerns whether the association between AI-driven personalization and recommendation quality varies according to that cognitive disposition. Distinguishing these two mechanisms prevents the positive NFC main effect from being inferred merely from the proposed interaction.
Need for cognition is also expected to condition the association between AI-driven personalization and perceived AI recommendation quality. Personalization cues—such as the alignment of recommendations with profile information or travel inputs—contain substantive evidence about whether the system has interpreted the user’s decision requirements. Under ELM reasoning, consumers higher in need for cognition are more likely to integrate these cues with the attributes of the recommended alternatives rather than treat personalization as a superficial convenience. Ref. [41] depicts that high-need-for-cognition consumers give greater weight to argument-relevant information, and ref. [27] establishes the relevance of elaborative processing to attitudes toward web personalization. More specifically, ref. [42] found that need for cognition strengthened the relationship between personalization quality and perceived empathy in an AI recommendation-service setting. Although perceived empathy differs from recommendation quality, their result supports the broader contention that the association between personalized content and user evaluations can vary with cognitive motivation. The conditional indirect expectation follows from this same first-stage contingency rather than from an assumed causal sequence. Perceived AI recommendation quality is proposed as one pathway through which the association between personalization and platform loyalty can be statistically represented, but the magnitude of this indirect association is expected to vary according to the extent to which users process personalization as diagnostic evidence of recommendation competence. Conditional process reasoning permits examination of whether an estimated indirect association varies across levels of a moderator [43]. Because consumers higher in need for cognition are expected to extract more evaluative meaning from the alignment between personalization cues and recommendation attributes, the indirect association through perceived AI recommendation quality is expected to be stronger at higher levels of need for cognition. This formulation concerns variation in contemporaneous associations and does not establish a temporal mediation process [9]. Moreover, positioning Need for Cognition as the focal moderator of this relationship does not presume that it is irrelevant to other recommendation responses; the specificity of this conditional association requires empirical examination rather than theoretical assumption.
H8.
Need for cognition is positively associated with perceived AI recommendation quality.
H9.
The positive association between AI-driven personalization and perceived AI recommendation quality is stronger at higher levels of need for cognition.
H10.
The positive indirect association between AI-driven personalization and smart tourism platform brand loyalty through perceived AI recommendation quality is stronger at higher levels of need for cognition.
2.6. Perceived Privacy Risk in the Personalization–Recommendation Discovery Pathway
Perceived privacy risk represents consumers’ assessment of potential loss of control, misuse, or unauthorized access to personal information associated with AI-enabled personalization. This construct concerns anticipated informational vulnerability rather than dissatisfaction with recommendation content. Ref. [44] conceptualizes privacy risk as a distinct facet of perceived risk in electronic services, while ref. [45] identifies collection, control, and awareness as central concerns surrounding the handling of personal information. The distinction is essential because a consumer may regard a recommendation as accurate while simultaneously questioning how the platform inferred the underlying preference. Perceived privacy risk can therefore coexist with favorable recommendation performance rather than simply operating as its conceptual opposite. Privacy Calculus Theory explains this coexistence through the simultaneous consideration of informational benefits and anticipated privacy costs. Ref. [19] highlights that online disclosure judgments reflect a balance between perceived benefits, trust-related beliefs, and privacy concerns. In personalization settings, the benefit often becomes visible through increased relevance or convenience, whereas the informational cost becomes salient when the output reveals that the platform possesses or has inferred sensitive user information. Ref. [28] characterizes this tension as the personalization–privacy paradox, and ref. [17] demonstrates that consumer responses to personalized communication vary according to how personal information is collected and whether trust-building conditions are present. Consequently, identical recommendation content can acquire different meanings depending on the privacy risk attributed to the platform.
This ambiguity is especially relevant to Perceived Recommendation Discovery because unexpectedly well-tailored discoveries may simultaneously reveal the platform’s informational reach. At lower levels of perceived privacy risk, unfamiliar or previously unconsidered travel options that appear closely aligned with the user’s broader preferences may be interpreted primarily as helpful exploration and pleasant surprise [9]. At higher levels of perceived privacy risk, the same unexpected fit may instead draw attention to hidden tracking, undisclosed data combination, or extensive profiling. Ref. [46] found that highly personalized communications can generate reactance when the basis for the personalized fit is insufficiently justified. In travel websites, ref. [29] similarly shows that personalization cannot be evaluated independently of privacy assurance. Perceived privacy risk is therefore expected to be negatively associated with Perceived Recommendation Discovery because greater perceived informational vulnerability may coincide with a less favorable discovery-oriented interpretation of unexpectedly personalized recommendations. The moderating proposition is more specific than a general negative relationship between privacy risk and platform evaluation. The positive association between AI-driven personalization and Perceived Recommendation Discovery is expected to be weaker at higher levels of perceived privacy risk. When risk perceptions are low, profile-consistent but unanticipated recommendations may be experienced primarily as pleasant discovery and expansion of the alternatives considered. When risk perceptions are high, personalization may remain recognizable, yet its unexpected accuracy may be interpreted as evidence of intrusive data practices rather than solely as helpful discovery. Also, ref. [17] argues that personalization responses depend on the perceived legitimacy of information collection, while ref. [28] reports that willingness to accept profiling varies with consumers’ informational concerns. This reasoning does not suggest that privacy risk eliminates all appreciation of personalized recommendations; rather, it identifies the personalization–discovery association as the theoretically focal relationship for Perceived Privacy Risk. This focal positioning does not assume that privacy risk is unrelated to other recommendation evaluations, which remains an empirical question.
The corresponding conditional indirect proposition concerns whether the estimated indirect association through Perceived Recommendation Discovery varies across levels of privacy risk. If the personalization–discovery association is weaker at higher levels of perceived privacy risk, the positive indirect association between AI-driven personalization and smart tourism platform brand loyalty through Perceived Recommendation Discovery is likewise expected to be weaker. In conditional process terms, the proposed variation is located in the first-stage association [43]. This specification is theoretically consistent with Privacy Calculus Theory because the positive interpretation of personalized discovery may become less pronounced as perceived informational costs become more salient. It also avoids the broader and less defensible assumption that privacy risk necessarily erodes every route to loyalty [47]. A consumer may still judge recommendations as useful or reliable while remaining uncomfortable with the data practices inferred from unexpected personalization. Accordingly, the proposed conditional pattern concerns variation in the observed indirect association rather than a demonstrated causal or temporal mediation process.
H11.
Perceived privacy risk is negatively associated with Perceived Recommendation Discovery.
H12.
The positive association between AI-driven personalization and Perceived Recommendation Discovery is weaker at higher levels of perceived privacy risk.
H13.
The positive indirect association between AI-driven personalization and smart tourism platform brand loyalty through Perceived Recommendation Discovery is weaker at higher levels of perceived privacy risk.
Based on the proposed hypotheses, the conceptual model integrates direct, indirect, and conditional associations among the study constructs, as illustrated in Figure 1.
Figure 1.
Conceptual Model of the Study.
3. Methods
3.1. Sample and Data Collection
A quantitative cross-sectional survey was employed to collect individual-level evaluations of AI-enabled smart tourism platforms. Accordingly, the data capture contemporaneous self-reported perceptions and do not establish temporal ordering among the study constructs. The target population comprised adult consumers with recent, first-hand experience using these platforms to search for, compare, evaluate, or plan travel and hospitality options. The individual platform user was therefore the unit of analysis. Because no comprehensive sampling frame exists for users of AI-enabled smart tourism platforms, a non-probability sampling approach was adopted. Recruitment was convenience-based and conducted through accessible travel-related social-media groups and communities, whereas inclusion in the analytical sample was criterion-based and purposive through the eligibility-screening procedure described below. Participation was also self-selected, as potential respondents independently decided whether to access and complete the online questionnaire. This approach facilitated access to individuals with the experience required to evaluate the focal constructs, although self-selection remains an inherent feature of open web surveys [48]. Accordingly, the resulting sample is not claimed to be statistically representative of the broader population of smart tourism platform users.
Before answering the screening questions, respondents were provided with the following definition: “In this study, a smart tourism platform refers to an AI-enabled digital platform, application, or website that provides personalized travel information, recommendations, and tourism-related content.” Eligible respondents were instructed to select the smart tourism platform they had used most recently for receiving personalized travel recommendations and to answer all subsequent questions with reference to that same platform. Eligibility was assessed through four questions asking whether respondents: (1) were at least 18 years old; (2) had personally used a smart tourism platform during the preceding 12 months; (3) had received travel or hospitality recommendations adapted to their preferences, inputs, interests, or user profile; and (4) had examined those recommendations while planning, comparing, or evaluating an actual or seriously contemplated trip. Respondents were required to satisfy all four conditions before accessing the principal measurement items, and failure to satisfy any one criterion resulted in exclusion from the substantive questionnaire. The screening procedure was therefore conjunctive rather than dependent on a single qualifying item. The survey records retained the aggregate number of ineligible screening entries but did not preserve a mutually exclusive item-by-item record of the first criterion failed. Consequently, the excluded cases are reported as respondents who failed at least one of the four eligibility requirements, and no unsupported retrospective allocation of exclusions to individual screening items is made. These criteria reduced the likelihood of obtaining hypothetical evaluations from individuals whose knowledge of AI-enabled travel platforms was based only on advertising, media coverage, or other people’s experiences [49].
The questionnaire was administered electronically through Google Forms and distributed through multiple travel-oriented groups and communities across social-media platforms. The selected communities focused on general travel planning, destinations, accommodation, digital booking services, and the exchange of travel experiences. A standardized invitation was used across communities to communicate the academic purpose of the study and the experience required for participation. The survey link was circulated across different groups and at different times to broaden access to eligible smart tourism platform users and reduce excessive concentration within a single online community. Main data collection was conducted from January through May 2026. Participation was entirely voluntary, and no monetary, material, prize-based, or other participation incentives were offered. Because recruitment relied on an open survey link rather than a closed sampling list, the probability of selection for individual members of the target population could not be determined.
Because respondents could report on different AI-enabled smart tourism platforms rather than on a single platform provider, there was no platform-specific registered-user population against which the realized sample could be statistically benchmarked. Moreover, no unified population-level demographic profile was available for the heterogeneous population of AI-enabled smart tourism platform users defined in this study. Accordingly, the demographic and platform-use characteristics reported in Table 1 are used to describe the composition of the obtained sample rather than as population benchmarks or evidence of statistical representativeness.
Table 1.
Respondent Profile, Platform-Use Characteristics, Descriptive Statistics, and Interconstruct Correlations.
Recruitment was not geographically targeted, and country or region of residence was not collected as a separate questionnaire variable. The study therefore cannot characterize the country-level or regional composition of the realized sample, and no geographical distribution is inferred from questionnaire language or other respondent characteristics. Similarly, although respondents were required to evaluate a platform satisfying the study definition and to retain that platform as their reference throughout the questionnaire, they were not asked to identify or classify it as an online travel agency, hotel application, destination platform, generative-AI travel assistant, or another platform type. Platform-type composition therefore cannot be reconstructed reliably from the collected data, and no retrospective classification was inferred from respondents’ reported platform-use purposes. These design features delimit the scope and generalizability of the findings.
The questionnaire was available in Arabic and English. Respondents selected their preferred language at survey entry and completed both the eligibility screening and substantive questionnaire in that language. Of the final analytical sample, 692 respondents (56.2%) completed the Arabic-language version and 540 (43.8%) completed the English-language version. Questionnaire language is reported solely as an administration characteristic and was not used as a proxy for nationality, country of residence, or geographical region.
Before proceeding, respondents were informed about the academic purpose of the study, the voluntary nature of participation, and the confidential treatment of their responses. They were advised that there were no correct or preferred answers and that they could discontinue participation before submitting the questionnaire. No names, social-media usernames, contact details, IP addresses, device identifiers, or other directly identifying information were requested or retained. Individual responses were not disclosed to travel-group administrators or smart tourism platform providers, and all analyses were conducted in aggregate form. Standardized administration, neutral instructions, and confidentiality assurances were used to reduce participation pressure, evaluation apprehension, and socially desirable responding [50].
A total of 2273 individuals entered the survey and completed the eligibility-screening stage. Of these, 1041 failed at least one of the four eligibility requirements and were excluded before accessing the principal measurement items, leaving 1232 eligible respondents who completed the substantive questionnaire. Because the available screening records preserved only the aggregate number of ineligible entries, the 1041 exclusions cannot be partitioned reliably according to the first eligibility criterion failed.
The 1232 eligible completed questionnaires were subsequently subjected to a post-collection data-quality audit before substantive statistical analysis. The original questionnaire did not contain an instructed-response attention-check item; therefore, no retrospective attention-check-based exclusion was imposed. Likewise, because IP addresses and device identifiers were not collected, duplicate screening based on these identifiers was neither possible nor claimed. The available audit therefore focused on completion time and response-pattern consistency. Rapid completion was operationalized using a predefined flagging threshold of less than one-third of the median questionnaire completion time, and no eligible questionnaire fell below this threshold. Straight-lining was assessed using the raw, unreversed responses to all 28 substantive Likert-scale indicators and was operationalized as zero within-respondent response variance across the complete measurement battery. No case met this criterion. Consequently, the data-quality audit generated zero rapid-completion flags, zero straight-lining flags, and no additional exclusions. The final analytical sample therefore remained 1232 respondents.
Eligible completed questionnaires constituted 54.2% of all recorded screening entries. This proportion represents the usable sample yield from the eligibility-screening process rather than a conventional survey response rate. Because the questionnaire link was circulated openly through social-media communities, the number of individuals who viewed the invitation but did not access the survey could not be observed. A conventional response rate based on the number of invitations delivered could therefore not be calculated reliably [48,49].
To provide an empirical diagnostic for potential nonresponse bias, a response-wave analysis was conducted using the chronological order of questionnaire submission. The earliest 25% of eligible completed questionnaires (n = 308) were compared with the latest 25% (n = 308). Following the extrapolation logic of [51], later respondents were treated as an imperfect proxy for individuals less inclined to respond. Independent-samples t-tests were used to compare the two groups across the six focal construct scores, whereas chi-square tests examined differences in the principal demographic and platform-use characteristics. The results of these comparisons are reported in Section 4.2. Because actual nonrespondents could not be observed directly, the response-wave analysis was interpreted as a diagnostic for systematic early–late differences rather than as evidence that nonresponse bias was absent. Likewise, it does not eliminate the distinct possibility of self-selection bias associated with voluntary participation through an open survey link.
3.2. Measures
The questionnaire measures were drawn from previously developed instruments and adapted where necessary to maintain consistency with AI-enabled smart tourism platforms and personalized travel recommendations. Scale adaptation followed a construct-preserving rather than wording-only approach. For each measure, the conceptual definition and indicator content were reviewed against the originating literature before contextual terms were changed. For most constructs, the adaptations primarily replaced the original product, service, or information-system referents with the focal platform and recommendation context while retaining the substantive meaning of the source items. Attention was given to AI-driven personalization because it served as the focal exogenous construct. Its item content was therefore benchmarked against established personalization research in addition to the tourism-specific source from which the final wording was adapted, as described below. Perceived Recommendation Discovery (PRD) involved a more explicit construct-bounding and item-selection procedure: discovery-oriented indicators were retained from the recommendation-serendipity measurement stream, whereas indicators explicitly representing relevance or usefulness were not retained because those attributes were operationalized separately within Perceived AI Recommendation Quality. The construct was therefore relabeled to align its name with the narrower content represented by the retained indicators rather than with the full canonical serendipity domain.
A five-point agreement scale ranging from 1 (“strongly disagree”) to 5 (“strongly agree”) was used for AI-driven personalization, Perceived Recommendation Discovery, perceived AI recommendation quality, smart tourism platform brand loyalty, and perceived privacy risk. Need for cognition was assessed using its original five-point response format, ranging from 1 (“extremely uncharacteristic of me”) to 5 (“extremely characteristic of me”). The complete wording, item codes, and measurement sources are reported in Appendix A.
The English questionnaire was translated into Arabic and then independently back-translated into English following the procedure proposed by [52]. Differences between the original and back-translated versions were reviewed at the semantic rather than literal level to preserve the intended meaning of each construct. A panel of six specialists with expertise in tourism and hospitality, AI-enabled services, consumer behavior, and survey design subsequently examined the two language versions for clarity, contextual appropriateness, and correspondence between the items and their intended constructs. Their review resulted in minor linguistic refinements but did not change the number of constructs or indicators. For AI-driven personalization specifically, the expert review also considered whether the four contextualized indicators remained consistent with the broader personalization domain represented in established information-systems and recommendation-agent research, thereby supplementing reliance on the tourism-specific adaptation source. The Arabic and English versions retained the same six-construct measurement structure, 28 substantive indicators, item ordering, response scales, construct definitions, and screening logic. Respondents remained within the language version selected at survey entry. Because data from the two language versions were pooled for the main structural analyses, configural and metric measurement invariance across Arabic- and English-language respondents was formally evaluated before interpreting the pooled structural results, as described in Section 3.3.
Because the measurement scales were adapted or contextualized for AI-enabled smart tourism platforms, the expert assessment also included a quantitative content-validity evaluation covering all 28 indicators across the six study constructs. Each expert independently rated the relevance of every item to its intended construct using a four-point relevance scale. Item-level content validity indices (I-CVIs) were calculated as the proportion of experts rating an item as relevant or highly relevant, while a scale-level content validity index based on the average of the item-level indices (S-CVI/Ave) was calculated separately for each construct and for the instrument overall [53]. This procedure was used to assess whether the contextualized indicators retained adequate substantive correspondence with their intended construct domains before administration of the main survey.
A pilot study involving 73 respondents who satisfied the substantive eligibility criteria was conducted before the main data collection. Participants evaluated the clarity of the platform definition, screening questions, measurement statements, response instructions, and overall survey flow. Minor wording adjustments were made where participants identified ambiguity or unnecessary complexity, without further altering the intended content of the finalized construct measures. The pilot was also used to provide preliminary psychometric evidence for all six measurement scales rather than selectively evaluating the focal AIP construct. Exploratory single-factor checks were conducted separately for each intended unidimensional scale using principal-axis factoring, and internal consistency was evaluated using Cronbach’s alpha and corrected item–total correlations. These pilot analyses were treated as item-screening diagnostics rather than as definitive evidence of factorial validity because of the pilot sample size; the full measurement structure was subsequently evaluated using the main analytical sample. All six scales demonstrated satisfactory preliminary performance. AIP item loadings ranged from 0.772 to 0.861 (α = 0.884; corrected item–total correlations = 0.641–0.758); PRD loadings ranged from 0.714 to 0.842 (α = 0.853; item–total correlations = 0.548–0.704); RAQ loadings ranged from 0.748 to 0.872 (α = 0.879; item–total correlations = 0.598–0.749); brand-loyalty loadings ranged from 0.812 to 0.889 (α = 0.836; item–total correlations = 0.642–0.719); NFC loadings ranged from 0.681 to 0.824 (α = 0.845; item–total correlations = 0.472–0.668); and PPR loadings ranged from 0.733 to 0.856 (α = 0.869; item–total correlations = 0.571–0.728). No item displayed a sufficiently weak loading or corrected item–total correlation to justify removal at the pilot stage. The pilot responses were not included in the final analytical sample. Accordingly, the pilot provided preliminary adaptation and item-performance evidence, whereas reliability, convergent validity, discriminant validity, cross-language invariance, and indicator performance of the finalized scales were evaluated more comprehensively using the main sample.
AI-driven personalization was measured using four items adapted from [54]. The items captured respondents’ perceptions that the focal smart tourism platform adjusted its travel content and recommendations according to individual preferences, inputs, and user profiles. Example items were: “The AI-enabled smart tourism platform provides travel information and recommendations tailored to my individual preferences” and “The platform adapts the travel content and recommendations it shows me based on my travel-related preferences and inputs.” Because ref. [54] is a doctoral dissertation rather than the sole established measurement foundation for perceived personalization, the four-item scale was additionally benchmarked at the construct-content level against established personalization research before finalization. Ref. [55] examined web personalization in terms of design characteristics that included the degree of preference matching, whereas ref. [32] examined perceived personalization in the context of recommendation agents. These established streams emphasize the individualized matching and adaptation of system-provided information or recommendations to users’ preferences and needs. The four AIP indicators used in the present study map onto this common personalization domain through perceived tailoring to individual preferences, personalization of suggestions, adaptation to user inputs and preferences, and adjustment according to the user profile. The benchmark review therefore supported the domain correspondence of the four indicators while maintaining wording appropriate to AI-enabled tourism platforms. Importantly, the AIP items were bounded to perceptions of personalization itself and did not incorporate downstream evaluations such as recommendation quality, usefulness, trust, or loyalty, which were represented separately elsewhere in the model. Ref. [54] was retained as the proximal tourism-context source because its measure had already operationalized AI-related personalization in tourism and had reported satisfactory psychometric properties, including standardized loadings ranging from 0.778 to 0.862, Cronbach’s α of 0.867, composite reliability of 0.895, and AVE of 0.680. The present study did not rely on that evidence alone. The scale was additionally subjected to established-scale benchmarking, six-expert content assessment, quantitative content-validity analysis, pilot psychometric screening, cross-language measurement-invariance testing, and full-sample measurement-model assessment. In the pilot sample, the four AIP indicators loaded between 0.772 and 0.861 on the intended factor, Cronbach’s α was 0.884, and corrected item–total correlations ranged from 0.641 to 0.758. Thus, the focal exogenous measure was retained on the basis of converging conceptual and empirical evidence rather than provenance from a single dissertation source.
Perceived Recommendation Discovery (PRD) was measured using five discovery-oriented indicators derived from the recommendation-serendipity measurement stream represented by [12]. During questionnaire development, the source indicator content was reviewed against the conceptual distinction between discovery-oriented unexpectedness and recommendation relevance or usefulness. Indicators explicitly representing relevance or usefulness were not retained in the present PRD measure because those attributes were operationalized separately through Perceived AI Recommendation Quality. The five retained indicators therefore focused on pleasant surprise, exposure to previously unconsidered alternatives, unexpected discovery, and expansion of the range of options explored. This procedure constituted an intentional construct-bounding and item-selection process rather than direct adoption of the complete serendipity scale. Because the resulting measure captures the discovery-oriented component of the broader serendipity domain rather than canonical serendipity in its entirety, the construct was relabeled Perceived Recommendation Discovery. The revised terminology therefore aligns the construct name with the content measured and does not imply equivalence with a full serendipity measure. Dedicated pre-study evidence was obtained for the resulting five-item PRD measure before the main data collection. During the six-expert content-validity assessment, each PRD indicator achieved an I-CVI of either 0.83 or 1.00, and the construct-level S-CVI/Ave was 0.93, indicating strong agreement regarding the relevance of the retained indicators to the discovery-focused construct definition. In the pilot study (n = 73), principal-axis factoring supported a single-factor structure, with item loadings ranging from 0.714 to 0.842. Internal consistency was satisfactory (Cronbach’s α = 0.853), and corrected item–total correlations ranged from 0.548 to 0.704. No PRD indicator was removed following the pilot assessment. These results provided preliminary evidence that the narrowed discovery-focused item set operated as a coherent unidimensional measure before its subsequent evaluation in the full measurement model. Example items were: “The recommendations introduced me to travel or hospitality options I would not have discovered by myself” and “The recommendations expanded the range of travel or hospitality options I explored.”
Perceived AI recommendation quality was measured using five items adapted from the consumer-oriented information-quality framework developed by [14]. The items were contextualized to assess the accuracy, decision relevance, comparison usefulness, currency, and reliability of AI-generated tourism and hospitality recommendations. Example items were: “The AI recommendations were accurate for my needs” and “The recommendations were reliable enough to support my decision.” The pilot assessment produced item loadings ranging from 0.748 to 0.872, Cronbach’s α = 0.879, and corrected item–total correlations ranging from 0.598 to 0.749.
Smart tourism platform brand loyalty was measured using three items adapted from [33]. The scale captured favorable communication about the focal platform and intentions to use it more frequently and in future travel decisions. Example items were: “I say positive things about this smart tourism platform to others” and “I would like to use this smart tourism platform in the future.” Accordingly, the measure represents an attitudinal and intentional expression of brand loyalty rather than observed behavioral loyalty, such as actual repeat usage, first-choice behavior, or resistance to switching. The three pilot indicators loaded between 0.812 and 0.889, with Cronbach’s α = 0.836 and corrected item–total correlations of 0.642–0.719.
Need for cognition was assessed using the six-item version developed and validated by [56]. The construct reflects an individual’s tendency to engage in and enjoy cognitively demanding activities rather than technological competence or familiarity with AI. Example items were: “I would prefer complex to simple problems” and “Thinking is not my idea of fun.” The latter item and the statement “I would rather do something that requires little thought than something that challenges my thinking abilities” were reverse-coded before the analyses. Thus, higher recoded values consistently indicated higher levels of need for cognition. The item-level performance of the positively and negatively worded indicators was subsequently assessed within the measurement model. In the pilot sample, the six indicators produced loadings of 0.681–0.824, Cronbach’s α = 0.845, and corrected item–total correlations of 0.472–0.668 after appropriate reverse coding.
Perceived privacy risk was measured using five items adapted from [44]. The items assessed anticipated loss of control over personal information, potential misuse, unauthorized access, and privacy threats associated with the collection of information for personalized recommendations. Example items were: “There is a high possibility of losing control over my personal information when using this platform” and “The collection of my personal information for personalized recommendations could threaten my privacy.” Pilot item loadings ranged from 0.733 to 0.856, Cronbach’s α was 0.869, and corrected item–total correlations ranged from 0.571 to 0.728.
3.3. Data Analysis
The hypothesized model was estimated using partial least squares structural equation modeling (PLS-SEM) in SmartPLS 4. The choice of PLS-SEM was driven by the analytical objectives of the study rather than by sample-size considerations. The proposed framework combines direct associations, two parallel indirect pathways, two latent interaction terms, conditional indirect associations, and an explicit assessment of out-of-sample predictive performance. PLS-SEM therefore served as the primary estimation framework, while supplementary covariance-based structural equation modeling (CB-SEM) and alternative structural-model comparisons were subsequently employed to examine whether the principal structural conclusions were robust to the estimation approach and to competing representations of the direct and indirect association structure [57,58]. Its use was not intended to imply causal identification. Given the cross-sectional design, the estimated structural coefficients were interpreted as theory-organized contemporaneous associations. Statistical inference was based on two-tailed testing at the 5% significance level.
The analytical procedure followed a sequential structure. Preliminary analyses examined construct means, standard deviations, skewness, kurtosis, and Pearson interconstruct correlations. Potential common method bias was addressed through both procedural and statistical measures. Procedurally, respondents were informed that participation was voluntary and confidential, that there were no correct or preferred answers, and that responses would be analyzed only in aggregate form. Neutral instructions and standardized administration were used, while expert review, translation and back-translation, and pilot testing were employed to reduce item ambiguity and contextually unclear wording. The Need for Cognition measure also retained its construct-specific response anchors rather than imposing a completely identical response format across all constructs. No marker variable was embedded in the original questionnaire; consequently, no retrospective marker-variable analysis was claimed.
Statistically, potential common method variance was initially examined using Harman’s single-factor test and full-collinearity variance inflation factors (VIFs) [50,59,60]. Given the limited sensitivity of these diagnostics to common method variance, they were supplemented by an unmeasured latent method factor (ULMF) analysis following the logic described by [50,61]. A supplementary confirmatory factor analysis was first estimated in which each indicator loaded only on its theoretically specified construct, producing a trait-only model. This specification was then compared with an otherwise equivalent trait-plus-method model in which all 28 measurement indicators additionally loaded on a common latent method factor specified as orthogonal to the substantive constructs. The assessment considered changes in model fit, the magnitude of the standardized method-factor loadings, the proportion of indicator variance associated with the method factor, and changes in the substantive trait loadings after accounting for the common method factor. The corresponding results are reported in Section 4.3. Harman’s test, full-collinearity VIFs, and the ULMF analysis were treated as complementary diagnostics rather than as definitive evidence that common method variance was absent.
The PLS-SEM assessment followed the conventional two-stage procedure for models containing reflective constructs, with evaluation of the measurement model preceding interpretation of the structural relationships [57]. Indicator reliability was assessed from the standardized outer loadings. Internal consistency reliability was evaluated jointly using Cronbach’s alpha, rho_A, and composite reliability (rho_C), rather than relying on a single coefficient. Values of approximately 0.70 or higher were considered satisfactory. Convergent validity was assessed using the average variance extracted (AVE), with values above 0.50 indicating that a construct explained more than half of the variance in its indicators. Discriminant validity was examined using both the Fornell–Larcker criterion and the heterotrait–monotrait ratio of correlations (HTMT). Under the Fornell–Larcker criterion, the square root of each construct’s AVE was required to exceed its correlations with the remaining constructs. HTMT values were additionally inspected against conventional thresholds and supplemented by bootstrap inference; discriminant validity was considered supported when the upper limit of the 95% bootstrap confidence interval remained below 1.00 [62,63].
To establish whether the measurement structure was comparable across questionnaire languages, cross-language measurement invariance was examined before interpreting the pooled structural results. A multi-group confirmatory factor analysis was conducted using the same six-factor, 28-indicator measurement structure for the Arabic-language (n = 692) and English-language (n = 540) samples. Configural invariance was first assessed by estimating the same pattern of factor–indicator relationships simultaneously across the two groups while allowing corresponding factor loadings to vary freely. Metric invariance was subsequently examined by constraining corresponding factor loadings to equality across the Arabic- and English-language groups while leaving the remaining measurement parameters freely estimated.
The configural and metric models were evaluated using χ2, CFI, TLI, RMSEA, and SRMR. Given the sensitivity of chi-square difference testing to sample size, the assessment of metric invariance placed greater emphasis on changes in approximate fit indices. A decrease in CFI not exceeding 0.010 and an increase in RMSEA not exceeding 0.015 were interpreted as indicating that equality constraints on the factor loadings did not materially worsen model fit [64]. Changes in SRMR were also inspected as a supplementary diagnostic. Scalar invariance was not assessed because the study did not undertake latent-mean comparisons between the Arabic- and English-language groups. The invariance evidence was therefore used to support pooled association-based analyses rather than any claim of cross-language equivalence in latent construct means.
The presence of both forward- and reverse-worded indicators in the six-item Need for Cognition scale warranted an additional item-level assessment of potential wording-related method effects. The reverse-worded indicators were first recoded so that higher scores consistently represented higher need for cognition. Pearson inter-item correlations were then inspected across all six items, with particular attention to the correlation structure among forward-worded items, between forward- and reverse-worded items, and between the two reverse-worded indicators. This assessment examined whether the recoded reverse-worded items remained positively associated with the substantive NFC item set or instead displayed a distinct clustering pattern attributable to wording direction.
The factor structure of the NFC scale was subsequently examined through supplementary confirmatory factor analysis. A baseline one-factor model was estimated in which all six indicators loaded on a single substantive NFC factor. This specification was compared with an otherwise equivalent model in which the residuals of the two reverse-worded indicators, NFC3R and NFC4R, were allowed to correlate. The latter specification captured residual covariance potentially attributable to their common wording direction without introducing a separate two-indicator method factor. Model comparison considered the chi-square difference together with changes in CFI, TLI, RMSEA, and SRMR, as well as the magnitude and statistical significance of the residual covariance between NFC3R and NFC4R. Evidence of a material reverse-wording method effect would be reflected in a meaningful improvement in model fit accompanied by a substantive residual association between the two reverse-worded indicators. Conversely, limited improvement in fit together with a small residual association would support retention of the unidimensional six-item NFC specification. This supplementary analysis was treated as a diagnostic assessment of potential wording-related method variance rather than as proof that all method effects were absent.
Quantitative content-validity evidence obtained during questionnaire development provided an additional assessment of the measurement instrument. Item-level content validity indices (I-CVIs) and scale-level average content validity indices (S-CVI/Ave) were calculated from the six expert relevance ratings for all six constructs. With six experts, an I-CVI of 0.83 represented agreement by five of the six panel members, whereas an I-CVI of 1.00 indicated unanimous agreement. Construct-level S-CVI/Ave values summarized the average relevance agreement across the indicators belonging to each scale [53]. The content-validity procedure was applied consistently across all adapted and contextualized measures rather than selectively to a single construct.
A supplementary post hoc assessment was also undertaken in response to the concern regarding the criterion-related validity of the Perceived AI Recommendation Quality (RAQ) measure. Respondents’ frequency of smart tourism platform use, an independently collected variable already included in the original questionnaire, was used for this purpose; no additional data were collected. Given that platform-use frequency was measured using five ordered categories, its association with the RAQ construct score was examined using Spearman’s rank-order correlation. A complementary known-groups analysis compared respondents reporting relatively low platform-use frequency—less than once a month or 1–3 times a month—with those reporting relatively high use—several times a week or daily/almost daily. Respondents reporting approximately weekly use were excluded from this extreme-group comparison to increase separation between the two groups but remained included in the full-sample rank-order analysis. Group differences in RAQ scores were evaluated using Welch’s independent-samples t-test, with Cohen’s d reported as a standardized effect-size estimate. Importantly, platform-use frequency represents an external usage-related characteristic rather than an objective benchmark of recommendation accuracy or system performance. These analyses were therefore interpreted as supplementary criterion-related and known-groups evidence rather than as validation against a gold-standard criterion.
Following satisfactory assessment of the measurement properties, the structural model was evaluated for collinearity, explanatory power, local effect sizes, and the hypothesized structural associations. Inner VIFs were inspected before interpreting the path coefficients to identify potentially problematic overlap among predictors. The coefficients of determination (R2 and adjusted R2) were used to quantify the variance explained in Perceived Recommendation Discovery, Perceived AI Recommendation Quality, and smart tourism platform brand loyalty. Local effect sizes (f2) were also reported for the individual structural relationships. For the interaction terms, f2 values were interpreted as incremental contributions to explained variance rather than as evidence of substantial practical importance solely because the corresponding interaction coefficient was statistically significant. The standardized root mean square residual (SRMR) and normed fit index (NFI) were reported as supplementary model diagnostics rather than treated as definitive global goodness-of-fit tests for the PLS-SEM model [57].
The incremental explanatory contribution of each theorized interaction was additionally quantified using ΔR2. For each interaction, the corresponding endogenous equation was re-estimated after removing the focal interaction term while retaining its constituent main effects and the remaining predictors. ΔR2 was calculated as the difference between the R2 of the full interaction model and that of the corresponding reduced model. The f2 and ΔR2 statistics were interpreted jointly so that statistical significance of an interaction was not treated as evidence of substantial practical magnitude.
Potential endogeneity was examined as a supplementary robustness issue because the cross-sectional design permits omitted-variable bias and reciprocal association between perceived personalization and brand loyalty. A Gaussian-copula assessment was therefore conducted following [65] and its application to PLS-SEM described by [66]. Particular attention was given to the residual direct AIP → brand-loyalty association because respondents with stronger pre-existing loyalty could potentially evaluate the focal platform’s personalization more favorably. Perceived Recommendation Discovery and Perceived AI Recommendation Quality were also examined as potentially endogenous predictors of brand loyalty so that the diagnostic was not restricted selectively to the focal exogenous construct.
The standardized PLS construct scores for AIP, PRD, and RAQ were first examined for non-normality, a prerequisite for application of the conventional Gaussian-copula procedure. Kolmogorov–Smirnov tests with Lilliefors correction were used for this assessment. Gaussian copula terms were then generated and incorporated into the brand-loyalty structural equation. Single-predictor, pairwise, and simultaneous three-copula specifications were examined, and statistical inference for the copula coefficients was based on bootstrap standard errors and 95% confidence intervals. A statistically significant copula coefficient was interpreted as evidence of detectable regressor–disturbance dependence and hence potential endogeneity. Stability of the original structural coefficients was additionally examined after inclusion of the copula terms [66]. Given the assumption-dependent nature of the Gaussian-copula procedure and its inability to establish temporal direction, nonsignificant copula terms were interpreted as an absence of detectable endogeneity under this diagnostic rather than as proof that reverse causality was impossible [67].
The significance of the direct and indirect structural associations was evaluated using nonparametric bootstrapping with 10,000 subsamples. Standardized path coefficients, bootstrap standard errors, t-values, p-values, and percentile-bootstrap 95% confidence intervals were reported. A direct association was regarded as statistically supported when its coefficient was in the hypothesized direction and its confidence interval excluded zero. Specific indirect associations were evaluated using the same bootstrap procedure. The indirect pathways from AI-driven personalization to brand loyalty through Perceived Recommendation Discovery and Perceived AI Recommendation Quality were therefore considered statistically supported when their respective bootstrap confidence intervals did not contain zero.
The simultaneous estimation of the direct AIP–brand-loyalty association and the two indirect pathways allowed the direct, specific indirect, and total associations to be interpreted jointly when characterizing the direct–indirect association pattern. To provide an association decomposition, the total indirect association was calculated as the sum of the two specific indirect associations. The proportion of the total AIP–brand-loyalty association represented by each direct and indirect component was then calculated by dividing the corresponding standardized association by the total association. Percentile-bootstrap 95% confidence intervals for these proportions were obtained directly from the bootstrap distributions of the corresponding association-to-total-association ratios rather than by dividing the endpoints of separate confidence intervals. As the model contains moderated pathways, this decomposition was evaluated at the mean levels of the corresponding moderators. The resulting indirect coefficients were interpreted as statistical decompositions of the overall association rather than as evidence that the proposed mediators temporally or causally transmitted an effect of personalization to brand loyalty.
To determine whether the two parallel indirect pathways differed statistically in magnitude, a formal bootstrap contrast was additionally conducted. Consistent with the preceding decomposition, the comparison was evaluated at the mean levels of the corresponding moderators. For each bootstrap resample, the specific indirect association through Perceived Recommendation Discovery was subtracted from the corresponding indirect association through Perceived AI Recommendation Quality. The difference was considered statistically significant when its percentile-bootstrap 95% confidence interval excluded zero [68].
Moderation was examined using the two-stage approach for constructing latent interaction terms. In the first stage, latent-variable scores were estimated for the constituent constructs; in the second stage, these scores were used to form the AIP × NFC and AIP × PPR interaction terms. This procedure assessed whether the AIP–recommendation–quality association varied across levels of Need for Cognition and whether the AIP–recommendation–discovery association varied across levels of Perceived Privacy Risk. Interaction coefficients were evaluated using the same 10,000-subsample bootstrap procedure and percentile-bootstrap 95% confidence intervals. Statistically supported interactions were subsequently probed by estimating conditional AIP associations at low, mean, and high levels of the relevant moderator, operationalized as the mean minus one standard deviation, the mean, and the mean plus one standard deviation, respectively. Interaction plots were generated from these conditional estimates to facilitate interpretation of the direction and magnitude of the conditional associations.
To move beyond the three conventional spotlight values of −1 SD, the mean, and +1 SD, the statistically supported interactions were additionally examined using Johnson–Neyman region-of-significance analysis. Conditional AIP associations and their 95% confidence limits were evaluated across the continuous range of each moderator, and the Johnson–Neyman transition point was defined as the moderator value at which the confidence interval for the conditional AIP association crossed zero. The resulting standardized thresholds were also expressed as raw-scale equivalents to facilitate substantive interpretation [69]. The Johnson–Neyman analysis was interpreted as identifying regions in which the conditional AIP association was statistically distinguishable from zero, rather than as identifying values at which the interaction coefficient itself became significant.
A supplementary curvature assessment was undertaken because Johnson–Neyman analysis does not itself test whether moderation is nonlinear. Using the standardized latent-variable scores, separate extended interaction models included the squared moderator term and the corresponding quadratic interaction term: AIP × NFC2 for Perceived AI Recommendation Quality and AIP × PPR2 for Perceived Recommendation Discovery. Evidence of curvature was considered present only when the bootstrap confidence interval for the quadratic interaction excluded zero. This procedure allowed the linear interaction specification to be evaluated against the alternative possibility that the conditional AIP association changed nonlinearly across moderator values.
To evaluate whether the theorized pathway-specific moderator assignments were empirically distinguishable from alternative cross-path assignments, an additional competing cross-moderation model was estimated. The theorized specification assigned Need for Cognition specifically to the recommendation–quality pathway and Perceived Privacy Risk specifically to the recommendation–discovery pathway. The expanded model therefore added the AIP × NFC interaction to the Perceived Recommendation Discovery equation and the AIP × PPR interaction to the Perceived AI Recommendation Quality equation. The corresponding NFC → PRD and PPR → RAQ main effects were included in the expanded equations to preserve hierarchical model specification. These additional terms were treated as competing-model tests rather than as newly hypothesized relationships.
Evaluation of the competing cross-moderation model considered the bootstrap coefficients and 95% confidence intervals of the two added cross-interaction terms, their local f2 effect sizes, and changes in R2 and adjusted R2 for Perceived Recommendation Discovery and Perceived AI Recommendation Quality relative to the theorized model. The objective was to assess the robustness and pathway specificity of the theoretically specified moderation structure rather than to formulate additional post hoc hypotheses. The competing-model results were consequently interpreted jointly in terms of statistical precision, incremental explained variance, and model parsimony.
Conditional indirect associations were then estimated to evaluate H10 and H13. For Need for Cognition, the AIP → Perceived AI Recommendation Quality → brand loyalty indirect association was estimated at low, mean, and high NFC. The corresponding AIP → Perceived Recommendation Discovery → brand loyalty indirect association was estimated across the same relative levels of Perceived Privacy Risk. Statistical support for conditional indirect variation was not inferred merely from the significance of individual conditional indirect estimates. Instead, the formal decision was based on the statistic conventionally termed the index of moderated mediation and its percentile-bootstrap confidence interval. The corresponding conditional-indirect hypothesis was considered statistically supported when the 95% confidence interval for this index excluded zero [70]. Within the present cross-sectional setting, this statistic was interpreted as evidence that the magnitude of an estimated indirect association varied with the moderator, not as evidence of a causal moderated-mediation process.
A supplementary CB-SEM analysis was conducted to examine whether the principal substantive conclusions were robust to the estimation framework. The same six latent constructs and all 28 measurement indicators were retained. The CB-SEM robustness model re-estimated the principal direct associations among AI-driven personalization, Perceived Recommendation Discovery, Perceived AI Recommendation Quality, smart tourism platform brand loyalty, Need for Cognition, and Perceived Privacy Risk, together with the two specific indirect associations linking AI-driven personalization to brand loyalty through the two recommendation-response constructs. The latent interaction terms and conditional indirect associations were not re-estimated in this supplementary analysis, as the objective was to assess the robustness of the core structural architecture rather than to reproduce every component of the PLS-SEM model. Model adequacy was evaluated using the chi-square statistic, comparative fit index (CFI), Tucker–Lewis index (TLI), root mean square error of approximation (RMSEA), and standardized root mean square residual (SRMR). Standardized structural coefficients and bootstrap confidence intervals for the specific indirect associations were compared descriptively with the corresponding PLS-SEM estimates. Consistency was evaluated in terms of coefficient direction, approximate magnitude, and substantive statistical conclusion rather than numerical equivalence across the two estimation frameworks.
Two additional structural specifications were examined within the CB-SEM framework. First, a serial-mediation competitor specified AIP → PRD → RAQ → BL while retaining the residual AIP → BL association and the NFC → RAQ and PPR → PRD paths. To represent a genuinely serial alternative rather than a partially parallel model, the direct AIP → RAQ and PRD → BL paths were omitted. The serial indirect association was evaluated using 5000 bootstrap resamples and its percentile-bootstrap 95% confidence interval. The nonnested nature of the serial competitor and the theorized parallel model precluded the use of a chi-square difference test. Their relative adequacy was therefore evaluated using CFI, TLI, RMSEA, SRMR, AIC, and BIC.
Second, a nested restricted model constrained the direct AIP → brand-loyalty association to zero while retaining the two theorized parallel indirect pathways and the remaining structural specification. This restricted model was compared with the theorized parallel model using the chi-square difference test together with CFI, TLI, RMSEA, SRMR, AIC, and BIC. A significant deterioration in fit after removing the direct path was interpreted as evidence that the residual AIP → BL association contributed to the structural representation beyond the two specific indirect associations. The coexistence of positive direct and indirect associations, together with poorer fit when the direct path was omitted, was treated as a pattern statistically consistent with what is conventionally termed complementary partial mediation. The cross-sectional design limits this terminology to a descriptive statistical interpretation rather than a causal or temporal one.
The two CB-SEM competitors addressed different structural questions. The serial specification examined whether PRD and RAQ were better represented as sequentially ordered structural stages rather than as parallel recommendation responses, whereas the restricted model examined whether the residual direct AIP → BL association could be omitted without materially worsening model adequacy. Neither comparison was interpreted as establishing temporal precedence or a uniquely correct causal ordering.
Finally, the model’s out-of-sample predictive performance was assessed using PLSpredict and the cross-validated predictive ability test (CVPAT). PLSpredict was implemented using 10-fold cross-validation with 10 repetitions. Predictive relevance was first examined through Q2_predict values for all indicators of the endogenous constructs, with values greater than zero indicating prediction errors below those of the indicator-average benchmark [58]. Prediction errors from the PLS-SEM model were then compared with those generated by a linear-model (LM) benchmark using root mean squared error (RMSE) and mean absolute error (MAE). Negative differences in prediction error indicated an advantage for the PLS-SEM predictions, whereas positive differences indicated lower prediction error for the linear-model benchmark. Indicator-level evidence was therefore interpreted jointly rather than assuming that PLS-SEM should outperform the LM benchmark for every endogenous indicator.
CVPAT provided a complementary inferential assessment of predictive performance by statistically comparing cross-validated prediction losses rather than relying exclusively on indicator-by-indicator error differences. Squared prediction error was used as the loss criterion, consistent with the RMSE-based PLSpredict assessment. The PLS-SEM model was compared separately with the indicator-average and linear-model benchmarks. A statistically significant negative average loss difference was interpreted as evidence that PLS-SEM produced lower aggregate out-of-sample prediction error than the corresponding benchmark [71,72]. Statistical significance of an average loss difference was nevertheless distinguished from its substantive magnitude. In particular, a small loss difference relative to the linear-model benchmark was interpreted as only a marginal aggregate predictive advantage even when statistically significant. This final analytical stage allowed predictive capability to be evaluated separately from in-sample explanatory performance. Predictive superiority over a benchmark was not interpreted as evidence of causal validity or as proof that the proposed theoretical ordering was uniquely correct.
4. Results
4.1. Sample Characteristics and Preliminary Statistics
The final sample comprised 1232 respondents. As shown in Panel A of Table 1, the sample included respondents across different gender, age, educational, employment, and platform-use categories. Female and male respondents accounted for 49.35% and 48.38% of the sample, respectively, while respondents aged 25–44 years represented 55.19%. Most participants had meaningful prior exposure to smart tourism platforms: 69.08% had used such platforms for at least one year, 56.41% reported using them approximately weekly or more frequently, and 71.35% had undertaken at least two trips during the preceding 12 months. Respondents also used the platforms for a range of travel-planning purposes, indicating that the analytical sample was not concentrated in a single use category. These characteristics describe the sample but should not be interpreted as evidence of population representativeness. Panel B of Table 1 reports the descriptive statistics and zero-order Pearson correlations calculated from unit-weighted arithmetic construct scores. Each construct score was computed as the arithmetic mean of its retained indicators, with the two negatively worded NFC items reverse-coded before score construction. Construct means ranged from 2.91 for perceived privacy risk to 3.83 for smart tourism platform brand loyalty. Skewness ranged from −0.58 to 0.11 and kurtosis from −0.38 to 0.15, indicating no pronounced univariate departures in the construct-score distributions. The correlations were consistent with the anticipated directions: brand loyalty was positively associated with AI-driven personalization, perceived recommendation discovery, and perceived AI recommendation quality, while perceived privacy risk showed its strongest negative correlation with recommendation discovery and need for cognition showed its strongest correlation with recommendation quality. Because these statistics are based on unit-weighted observed construct scores, they are descriptive zero-order associations and are analytically distinct from the latent-variable correlations used in the subsequent PLS-SEM discriminant-validity assessment. These zero-order correlations provide an initial description of the relationships and do not substitute for the subsequent structural-model tests.
4.2. Assessment of Potential Nonresponse Bias
Potential nonresponse bias was examined through a response-wave comparison between the earliest and latest respondents. As reported in Appendix B, the first 25% of eligible completed questionnaires (n = 308) were compared with the final 25% (n = 308). The mean differences across the six focal constructs were small, and none of the independent-samples t-tests was statistically significant. The largest absolute mean difference was 0.05, observed for smart tourism platform brand loyalty and perceived privacy risk, while all p-values exceeded 0.40. The chi-square comparisons similarly showed no statistically significant early–late differences in gender, age, education, employment status, smart tourism platform experience, platform-use frequency, number of trips, primary travel purpose, or primary purpose of platform use (all p > 0.05). Thus, the observed data do not indicate systematic response-wave differences in the measured constructs or the principal sample characteristics. These findings provide some reassurance that the composition and focal responses of later participants did not differ materially from those of earlier participants. However, because late respondents constitute only an indirect proxy for actual nonrespondents, the analysis cannot establish that nonresponse bias was absent. Moreover, the response-wave results do not address the separate possibility of self-selection bias arising from voluntary participation in an open social-media survey. The findings are therefore interpreted as a diagnostic of observed early–late response stability rather than as evidence of population representativeness.
4.3. Common Method Bias and Endogeneity Diagnostics
4.3.1. Assessment of Potential Common Method Bias
Potential common method bias was evaluated using multiple complementary diagnostics rather than relying on a single statistical procedure. As described in Section 3.3, procedural safeguards were incorporated during questionnaire development and administration, including confidentiality assurances, voluntary participation, neutral instructions, clarification that there were no correct or preferred responses, expert review, translation and back-translation, and pilot-based refinement of potentially ambiguous wording. No marker variable was embedded in the original questionnaire; consequently, no retrospective marker-variable analysis was claimed. Appendix C reports the statistical diagnostics used to assess potential common method variance. Harman’s single-factor analysis extracted six factors with eigenvalues greater than one, collectively accounting for 69.84% of the total variance. The first unrotated factor accounted for 34.67%, and no single dominant factor emerged. Because Harman’s procedure has limited sensitivity and cannot independently establish the absence of common method bias, it was interpreted only as an initial diagnostic [50]. The full-collinearity results reported in Panel B of Appendix C provided a second diagnostic. VIF values ranged from 1.064 for Need for Cognition to 2.083 for smart tourism platform brand loyalty, with all values remaining below the conservative threshold of 3.3 suggested by [60]. The results therefore did not indicate excessive full collinearity across the six constructs.
A more direct supplementary assessment was conducted using an unmeasured latent method factor (ULMF). As shown in Panel C of Appendix C, the trait-only CFA demonstrated satisfactory fit, with CFI = 0.951, TLI = 0.944, RMSEA = 0.041, and SRMR = 0.040. Adding a common latent method factor produced modestly improved fit, with CFI = 0.959, TLI = 0.950, RMSEA = 0.038, and SRMR = 0.033. Because the trait-plus-method specification estimated additional parameters, the improvement in overall fit was not interpreted by itself as evidence that common method variance materially influenced the substantive relationships. The standardized method-factor loadings ranged from 0.080 to 0.210, with a mean absolute loading of 0.147. Their squared values indicated that the common method factor accounted for an average of approximately 2.3% of indicator variance. By comparison, the substantive trait factors accounted for an average of approximately 67.3% of indicator variance after the method factor was introduced, yielding a substantive-to-method variance ratio of approximately 29.3:1. The substantive standardized loadings remained between 0.733 and 0.884, while their mean absolute change relative to the trait-only model was 0.012 and the maximum absolute change was 0.017. The procedural safeguards, Harman test, full-collinearity assessment, and ULMF analysis did not indicate that the observed construct relationships were dominated by a common measurement factor. The ULMF results nevertheless identified a small amount of shared method-related variance, which is plausible given the same-source, self-reported design. Accordingly, the evidence is interpreted as indicating limited detectable common method variance rather than demonstrating that common method bias was entirely absent.
4.3.2. Gaussian-Copula Endogeneity Assessment
Because common method bias and endogeneity represent conceptually distinct threats, a separate Gaussian-copula analysis was conducted to examine potential endogeneity in the brand-loyalty structural equation. Particular attention was given to the residual direct association between AI-driven personalization and brand loyalty because the observed AIP → BL coefficient could potentially reflect reciprocal association; for example, users with stronger pre-existing loyalty might evaluate the personalization provided by the focal platform more favorably. Perceived Recommendation Discovery and Perceived AI Recommendation Quality were also treated as potentially endogenous predictors of brand loyalty so that the diagnostic did not focus selectively on AIP alone. The conventional Gaussian-copula procedure requires the potentially endogenous regressors to depart from normality. As shown in Panel D of Appendix C, Kolmogorov–Smirnov tests with Lilliefors correction rejected normality for AIP (D = 0.083, p < 0.001), PRD (D = 0.071, p < 0.001), and RAQ (D = 0.089, p < 0.001). This conclusion was also consistent with their observed skewness values of −0.48, −0.34, and −0.52, respectively. The distributional prerequisite for applying the Gaussian-copula diagnostic was therefore satisfied for all three predictors.
Single-copula, pairwise-copula, and simultaneous three-copula specifications were subsequently estimated. The substantive conclusion was consistent across the alternative specifications. Panel D of Appendix C reports the most comprehensive model, in which the three Gaussian-copula terms were entered simultaneously into the brand-loyalty equation. None of the copula coefficients was statistically significant. The AIP copula coefficient was −0.031 (SE = 0.025, t = 1.240, p = 0.215, 95% CI [−0.080, 0.018]), the PRD copula coefficient was 0.016 (SE = 0.021, t = 0.762, p = 0.446, 95% CI [−0.025, 0.057]), and the RAQ copula coefficient was −0.022 (SE = 0.021, t = 1.048, p = 0.295, 95% CI [−0.063, 0.019]). Thus, none of the three confidence intervals excluded zero. The substantive structural coefficients also remained stable after simultaneous inclusion of the copula terms. The AIP → brand-loyalty coefficient changed only from β = 0.210 in the primary PLS-SEM specification to β = 0.203 in the copula-adjusted model. Similarly, the PRD → brand-loyalty coefficient changed from β = 0.310 to β = 0.305, while the RAQ → brand-loyalty coefficient changed from β = 0.390 to β = 0.382. All three substantive associations remained statistically significant at p < 0.001. The residual direct AIP → BL association therefore remained materially similar after the supplementary endogeneity adjustment. Overall, the Gaussian-copula analysis did not provide detectable evidence that regressor–disturbance dependence materially accounted for the principal predictors of brand loyalty under the assumptions of this diagnostic. Importantly, this result is not interpreted as demonstrating strict exogeneity or eliminating the possibility of reverse causality. In particular, the cross-sectional design cannot determine whether perceived personalization preceded brand loyalty or whether previously loyal users subsequently evaluated personalization more favorably. The Gaussian-copula analysis is therefore treated as a robustness diagnostic rather than as causal identification, and stronger directional inference would require longitudinal, experimental, or defensible instrumental-variable designs.
4.4. Measurement Model Assessment
4.4.1. Cross-Language Measurement Invariance
Before interpreting the pooled measurement and structural results, measurement invariance was assessed across the Arabic- and English-language questionnaire versions. As shown in Appendix D, the unconstrained configural model, in which the same six-factor measurement structure was specified across the two language groups while the corresponding factor loadings were freely estimated, demonstrated satisfactory fit, χ2(670) = 1988.70, CFI = 0.952, TLI = 0.946, RMSEA = 0.040, 90% CI [0.038, 0.042], and SRMR = 0.041. This result supported the same basic factor configuration across the Arabic- and English-language versions. Metric invariance was subsequently examined by constraining the corresponding factor loadings to equality across the two groups. The metric model also demonstrated satisfactory fit, χ2(692) = 2020.12, CFI = 0.951, TLI = 0.947, RMSEA = 0.039, 90% CI [0.037, 0.041], and SRMR = 0.043. Relative to the configural model, the changes were ΔCFI = −0.001, ΔRMSEA = −0.001, and ΔSRMR = 0.002. The chi-square difference was not statistically significant, Δχ2(22) = 31.42, p = 0.088. More importantly, the changes in the approximate fit indices remained well within the adopted criteria for metric invariance, particularly ΔCFI ≤ 0.010 and ΔRMSEA ≤ 0.015 [64]. Accordingly, the results supported both configural and metric measurement invariance across the Arabic- and English-language questionnaire versions. The two language groups were therefore pooled for the subsequent analyses of associations among the constructs. This conclusion is limited to equivalence of the factor configuration and factor loadings and should not be interpreted as evidence that latent construct means were equivalent across questionnaire languages, because scalar invariance was not assessed and latent-mean comparisons were not undertaken.
4.4.2. Reliability, Convergent Validity, and Discriminant Validity
Following support for configural and metric invariance across questionnaire languages, the pooled measurement model was evaluated for indicator reliability, internal consistency, convergent validity, and discriminant validity. The indicator-level results are presented in Panel A of Table 2. Outer loadings ranged from 0.742 for NFC3R to 0.901 for BL2, and all loadings were statistically significant at the 0.001 level. Their percentile-bootstrap confidence intervals remained above zero. All loadings therefore exceeded the commonly applied 0.70 benchmark, including the reverse-coded Need for Cognition indicators. Accordingly, all 28 indicators were retained for the structural analysis. Relative to the measurement assessment criteria outlined by [57], the loading pattern provided adequate indicator reliability across the six constructs. Panel B of Table 2 reports the internal consistency and convergent validity results. Cronbach’s alpha values ranged from 0.858 to 0.901, rho_A values ranged from 0.872 to 0.907, and composite reliability values ranged from 0.910 to 0.926. The average variance extracted ranged from 0.628 for Need for Cognition to 0.779 for brand loyalty, with every construct exceeding the recommended minimum of 0.50. The three reliability coefficients and the AVE values supported adequate internal consistency and convergent validity across all six constructs. Discriminant validity was examined using the results in Table 3. Under the Fornell–Larcker criterion, the square root of the average variance extracted for each construct was greater than its correlations with the other constructs, satisfying the criterion proposed by [62]. The HTMT ratios reported in Panel B ranged from 0.101 to 0.651, with the highest value observed between Perceived AI Recommendation Quality and brand loyalty. All HTMT values were therefore below the more conservative 0.85 threshold, indicating substantial empirical separation among the constructs. The bootstrap inference presented in Panel C of Table 3 provided a more direct assessment of the HTMT results. All upper confidence limits were below 1.00, ranging from 0.160 to 0.692. This pattern is consistent with the inferential approach recommended by [63] and does not indicate a discriminant-validity problem for any construct pair. The results therefore supported proceeding to the structural analysis without combining or removing constructs.
Table 2.
Indicator Reliability, Internal Consistency, and Convergent Validity.
Table 3.
Discriminant Validity Assessment.
4.4.3. Reverse-Worded Item and Factor-Structure Assessment for Need for Cognition
Because the six-item Need for Cognition (NFC) scale contained both forward- and reverse-worded items, supplementary analyses were conducted to examine whether the reverse wording introduced a discernible method-related structure. The two negatively worded items were first reverse-coded so that higher scores on all six indicators consistently represented higher levels of need for cognition. The resulting inter-item correlation matrix is reported in Panel A of Appendix E. All correlations among the six NFC indicators were positive after reverse coding, ranging from 0.470 to 0.620. Correlations among the four forward-worded items averaged 0.577, while correlations between the reverse-coded and forward-worded items averaged 0.500. The correlation between the two reverse-coded items was 0.550. Thus, although the reverse-coded items displayed slightly lower average correlations with the forward-worded items than the forward-worded items displayed with one another, the difference was limited, and the two reverse-coded indicators did not form an isolated correlational cluster. Their positive associations with all four forward-worded indicators were consistent with their intended membership in the same substantive NFC construct.
A supplementary confirmatory factor analysis was then conducted to assess whether the common wording direction of NFC3R and NFC4R produced a material residual method effect. As shown in Panel B of Appendix E, the baseline one-factor model, in which all six indicators loaded on a single NFC factor, exhibited satisfactory fit (χ2 = 20.84, df = 9, CFI = 0.996, TLI = 0.993, RMSEA = 0.033, SRMR = 0.021). An alternative model was subsequently estimated in which the residuals of NFC3R and NFC4R were allowed to correlate while retaining the same single substantive NFC factor. The residual-covariance model also showed satisfactory fit (χ2 = 18.47, df = 8, CFI = 0.996, TLI = 0.993, RMSEA = 0.033, SRMR = 0.019). However, allowing the two reverse-worded items to share residual covariance did not produce a statistically significant improvement over the one-factor model, Δχ2(1) = 2.37, p = 0.124. The standardized residual correlation between NFC3R and NFC4R was also small and statistically nonsignificant (r = 0.045, p = 0.128). The correlational and factor-structure evidence did not indicate a material reverse-wording method effect within the NFC scale. The reverse-coded items remained positively integrated with the forward-worded indicators, and explicitly allowing for their shared wording direction produced negligible improvement in model fit. The original unidimensional six-item NFC specification was therefore retained for the subsequent PLS-SEM analyses. These findings should be interpreted as indicating an absence of detectable material wording-related distortion in the present data rather than as definitive evidence that wording effects were entirely absent.
4.4.4. Supplementary Content and Criterion-Related Validity Assessment
Because the study adapted or contextualized the measurement scales for AI-enabled smart tourism platforms, the expert-review procedure was supplemented by a quantitative content-validity assessment covering all 28 indicators across the six study constructs. Six specialists independently evaluated the relevance of each indicator to its intended construct. The resulting item-level and scale-level content-validity indices are reported in Panel A of Appendix F. All 28 indicators achieved an I-CVI of either 0.83 or 1.00, indicating that every item was judged relevant or highly relevant by at least five of the six experts. All item-level values therefore met the commonly recommended content-validity criterion for a six-member expert panel [53]. AI-Driven Personalization recorded an S-CVI/Ave of 0.96. The corresponding values were 0.93 for Perceived Recommendation Discovery, 0.93 for Perceived AI Recommendation Quality, 0.94 for Smart Tourism Platform Brand Loyalty, 0.94 for Need for Cognition, and 0.97 for Perceived Privacy Risk. Across the complete measurement instrument, the overall S-CVI/Ave was 0.95.
At the item level, 19 of the 28 indicators received unanimous relevance judgments from all six experts, whereas the remaining nine indicators were rated as relevant or highly relevant by five of the six experts. No indicator recorded an I-CVI below 0.83. The quantitative expert assessment therefore provided support for the substantive correspondence between the adapted indicators and their intended construct domains following the linguistic and contextual refinements undertaken during questionnaire development. Because the Perceived AI Recommendation Quality measure involved contextual adaptation from the broader information-quality framework to AI-generated tourism recommendations, a supplementary post hoc validity analysis was additionally conducted using a usage-related variable already collected in the original questionnaire. No additional data were collected for this analysis. Respondents’ frequency of smart tourism platform use was used as the external criterion, and the results are presented in Panel B of Appendix F. Across the full analytical sample, Perceived AI Recommendation Quality was positively associated with frequency of smart tourism platform use (Spearman’s ρ = 0.240, p < 0.001). Thus, respondents reporting more frequent platform use tended to report higher perceived recommendation quality. The magnitude of the association was modest, indicating systematic correspondence between the two variables without suggesting that they represented the same phenomenon.
A complementary known-groups analysis compared respondents with relatively low and high frequencies of platform use. Respondents who reported using smart tourism platforms less than once a month or 1–3 times a month formed the lower-frequency group (n = 537), whereas those reporting use several times a week or daily/almost daily formed the higher-frequency group (n = 410). Respondents reporting approximately weekly use were excluded from this extreme-group comparison to increase separation between the groups but remained included in the full-sample Spearman analysis. The higher-frequency group reported a mean RAQ score of 3.97 (SD = 0.63), compared with 3.62 (SD = 0.72) among lower-frequency users. The mean difference of 0.35 scale points was statistically significant, Welch’s t(927.58) = 7.96, p < 0.001, 95% CI [0.264, 0.436]. The standardized mean difference was Cohen’s d = 0.51. The results provide complementary forms of validity evidence. The expert assessments support the content correspondence of the complete 28-item measurement instrument, while the post hoc usage-related analyses provide supplementary criterion-related evidence and a criterion-defined known-groups comparison specifically for the contextualized RAQ measure. The latter findings should nevertheless be interpreted cautiously because platform-use frequency is not an objective benchmark of recommendation accuracy, reliability, or technical system performance and may itself reflect multiple behavioral and contextual influences. Accordingly, these analyses are treated as supplementary validity evidence rather than as validation against an external gold-standard criterion.
4.5. Model Diagnostics and Explanatory Power
The model diagnostics are reported in Table 4. As shown in Panel A, the SRMR was 0.047 for the saturated model and 0.052 for the estimated model. The corresponding NFI values were 0.914 and 0.907. When treated as supplementary PLS-SEM diagnostics rather than conclusive tests of global fit, these values do not indicate pronounced discrepancy between the estimated model and the observed relationships [57]. Structural collinearity was assessed using the inner VIF values reported in Panel B of Table 4. The values ranged from 1.018 to 1.802 across the three endogenous constructs. The largest value was associated with AI-driven personalization as a predictor of brand loyalty, but it remained well below levels commonly associated with problematic collinearity. The structural coefficients were therefore estimated without evidence of substantial overlap among the predictor constructs. Panel C of Table 4 shows that the model accounted for 31.0% of the variance in perceived recommendation discovery, 34.5% in perceived AI recommendation quality, and 52.0% in smart tourism platform brand loyalty. The corresponding adjusted values were 30.8%, 34.4%, and 51.9%. The small differences between the unadjusted and adjusted estimates indicate limited sensitivity to the number of predictors included in the respective equations.
Table 4.
Model Fit and Structural Model Diagnostics.
4.6. Direct Structural Associations
Table 5 reports the direct structural associations. AI-driven personalization was positively associated with smart tourism platform brand loyalty, with a standardized coefficient of 0.210 and a 95% confidence interval ranging from 0.157 to 0.259. The association was significant at the 0.001 level, supporting H1. Its corresponding effect-size value was 0.051, indicating that its incremental contribution was smaller than those of the two recommendation-response variables. AI-driven personalization was also positively associated with both recommendation responses. The coefficient for perceived recommendation discovery was 0.490, with a confidence interval from 0.441 to 0.535, supporting H2. The corresponding coefficient for perceived AI recommendation quality was 0.530, with a confidence interval from 0.482 to 0.573, supporting H3. Both associations were significant at the 0.001 level. Their effect-size values were 0.343 and 0.418, respectively, representing the largest local effect-size values among the structural associations reported in Table 5. The two recommendation responses were positively associated with brand loyalty. Perceived recommendation discovery recorded a coefficient of 0.310 and a confidence interval from 0.254 to 0.361, supporting H4. Perceived AI recommendation quality recorded a coefficient of 0.390 and a confidence interval from 0.336 to 0.439, supporting H5. Their effect-size values were 0.148 and 0.218, respectively. Although the coefficient for recommendation quality was numerically larger, Table 5 does not provide a formal statistical comparison between the two coefficients. Need for cognition was positively associated with perceived AI recommendation quality. As presented in Table 5, the standardized coefficient was 0.150, and its confidence interval ranged from 0.094 to 0.201, supporting H8. Perceived privacy risk was negatively associated with perceived recommendation discovery, with a coefficient of −0.180 and a confidence interval from −0.231 to −0.133, supporting H11. Both associations were statistically significant at the 0.001 level. However, their local effect sizes were small: f2 = 0.033 for NFC → RAQ and f2 = 0.046 for PPR → PRD. H8 and H11 are therefore supported in terms of the hypothesized directions and statistical precision, but the two predictors make comparatively modest unique contributions to explained variance. Their theoretical relevance should consequently not be interpreted as evidence of large practical effects.
Table 5.
Direct Structural Associations.
4.7. Decomposition and Comparison of Direct and Indirect Associations
The direct and specific indirect associations are decomposed in Table 6. The indirect association between AI-driven personalization and smart tourism platform brand loyalty through perceived recommendation discovery was positive at 0.152. Its 95% bootstrap confidence interval ranged from 0.119 to 0.190 and excluded zero, providing support for H6. The indirect association through perceived AI recommendation quality was also positive at 0.207, with a 95% confidence interval ranging from 0.169 to 0.251, supporting H7. Together, the two specific indirect associations produced a total indirect association of 0.359. At the mean levels of the corresponding moderators, the total AIP–brand-loyalty association was 0.569, while the direct association was 0.210. Decomposition of the total association showed that the direct component represented 36.9% of the overall association. The specific indirect association through perceived recommendation discovery accounted for 26.7%, whereas the indirect association through perceived AI recommendation quality accounted for 36.4%. Collectively, the two indirect pathways represented 63.1% of the total estimated association. The corresponding percentile-bootstrap confidence intervals were 30.0–43.5% for the direct component, 21.2–32.3% for the discovery pathway, 30.4–42.6% for the recommendation–quality pathway, and 56.5–70.0% for the combined indirect component.
Table 6.
Decomposition and Bootstrap Comparison of Direct and Indirect Associations between AI-Driven Personalization and Smart Tourism Platform Brand Loyalty.
Because the recommendation–quality indirect association was numerically larger than the recommendation–discovery indirect association, a formal bootstrap contrast was conducted to determine whether the difference was statistically distinguishable from zero. As reported in Panel B of Table 6, subtracting the discovery indirect association from the recommendation–quality indirect association produced a difference of 0.055. The bootstrap standard error was 0.019, and the 95% confidence interval ranged from 0.019 to 0.094. Because the interval excluded zero (p = 0.004), the indirect association through perceived AI recommendation quality was statistically larger than the indirect association through perceived recommendation discovery. The results therefore indicate the coexistence of a positive direct association and two statistically supported positive indirect pathways, with the recommendation–quality pathway accounting for a larger indirect association than the discovery pathway. However, the comparison concerns the relative magnitude of the estimated contemporaneous indirect associations. Because the study used cross-sectional data, neither the decomposition percentages nor the difference between the two indirect pathways should be interpreted as evidence that a corresponding proportion of a causal effect was transmitted through the mediators or that recommendation quality constitutes a causally stronger mechanism.
4.8. Moderating Associations
Panel A of Table 7 shows that the interaction between AI-driven personalization and Need for Cognition was positively associated with perceived AI recommendation quality. The interaction coefficient was 0.130, with a 95% confidence interval ranging from 0.085 to 0.176, supporting H9. Its local effect size was small (f2 = 0.026). Consistently, removal of the AIP × NFC interaction reduced the R2 of perceived AI recommendation quality from 0.345 to 0.328, corresponding to ΔR2 = 0.017. Thus, the interaction accounted for approximately 1.7 additional percentage points of variance in recommendation quality beyond the constituent main effects and other predictors. H9 is therefore statistically supported, but the incremental explanatory contribution of NFC as a moderator is practically modest.
Table 7.
Interaction Terms, Incremental Explanatory Contributions, and Conditional Associations.
Panel B of Table 7 summarizes the incremental explanatory contribution of the two theorized interaction terms. Both interactions produced limited increases in explained variance. The AIP × NFC interaction increased R2 for perceived AI recommendation quality by 0.017 and met the conventional benchmark for a small local effect (f2 = 0.026), while the AIP × PPR interaction increased R2 for perceived recommendation discovery by 0.012 and produced an f2 value of 0.017, slightly below the conventional 0.02 benchmark for a small effect. These results distinguish statistical detectability from practical magnitude: the interaction terms contribute systematic explanatory information, but neither accounts for a large additional proportion of variance in its respective endogenous construct.
The conditional associations reported in Panel C of Table 7 clarify the form of the NFC interaction at conventional spotlight values. The association between AI-driven personalization and recommendation quality increased from 0.402 at a low level of Need for Cognition to 0.530 at the mean and 0.658 at a high level. All three coefficients were statistically significant at the 0.001 level, and their confidence intervals excluded zero. As illustrated in Figure 2, the positive AIP–recommendation–quality association therefore became stronger as Need for Cognition increased. These conditional differences describe the direction and form of the moderation pattern and should be interpreted together with the small f2 and ΔR2 values rather than as evidence of a large moderating effect.
Figure 2.
Moderating Role of Need for Cognition in the AIP–RAQ Association.
Perceived privacy risk displayed the opposite moderating pattern. As reported in Panel A of Table 7, the interaction between AI-driven personalization and perceived privacy risk was negatively associated with recommendation discovery. The interaction coefficient was −0.110, with a 95% confidence interval ranging from −0.158 to −0.067, supporting H12. The interaction nevertheless had a very small local effect size (f2 = 0.017), falling slightly below the conventional 0.02 benchmark for a small effect. When the AIP × PPR interaction was omitted, R2 for perceived recommendation discovery decreased from 0.310 to 0.298, corresponding to ΔR2 = 0.012. The interaction therefore contributed approximately 1.2 additional percentage points of explained variance beyond the constituent main effects and other predictors. Accordingly, H12 is statistically supported, but perceived privacy risk represents a modest rather than dominant boundary condition of the personalization–discovery association.
Panel D of Table 7 shows that the conditional AIP–discovery association declined from 0.599 at low perceived privacy risk to 0.490 at its mean and 0.381 at a high level. Each conditional coefficient remained positive and statistically significant. Figure 3 therefore illustrates attenuation rather than reversal: AI-driven personalization remained positively associated with recommendation discovery at the three spotlight values, but the magnitude of the association decreased as perceived privacy risk increased. As with the NFC interaction, this conditional pattern is statistically reliable but limited in its incremental explanatory magnitude. Because the preceding spotlight analyses evaluate only three selected moderator values, Appendix G reports the Johnson–Neyman analyses across the continuous moderator ranges. For Need for Cognition, the Johnson–Neyman transition point occurred at a standardized moderator value of approximately z = −3.03 SD, corresponding to a raw-scale NFC value of approximately 1.46. Within the 1–5 response scale, the conditional AIP–recommendation–quality association was statistically distinguishable from zero when NFC exceeded approximately 1.46. At extremely low NFC values at or below this threshold, the confidence interval included zero. Thus, the positive conditional association applied across almost the entire scale-supported range of NFC rather than only at the three spotlight values shown in Panel C of Table 7.
Figure 3.
Moderating Role of Perceived Privacy Risk in the AIP–PRD Association.
For perceived privacy risk, the Johnson–Neyman transition point occurred at approximately z = +3.10 SD, corresponding to a raw-scale value of approximately 5.46. Because this value lies above the maximum of the five-point response scale, no Johnson–Neyman transition occurred within the scale-supported range. The conditional AIP–recommendation–discovery association therefore remained positive and statistically distinguishable from zero throughout PPR values from 1 to 5, although its magnitude progressively declined as privacy risk increased. The transition point above 5 should be understood only as a model-implied boundary and not as a substantively observed moderator value.
Importantly, the Johnson–Neyman results refine the range over which the conditional AIP associations are statistically distinguishable from zero; they do not alter the conclusion from the f2 and ΔR2 statistics that the incremental explanatory contribution of both interaction terms is limited. The NFC interaction reached the conventional small-effect benchmark, whereas the PPR interaction fell slightly below it. Statistical significance across a broad moderator range should therefore not be interpreted as evidence of a large moderation effect. The corresponding Johnson–Neyman plots are presented in Figure A1 and Figure A2 in Appendix G.
The supplementary curvature tests reported in Appendix G provided no evidence that either moderation pattern departed materially from linearity. The quadratic AIP × NFC2 interaction was small and statistically nonsignificant (β = 0.018, bootstrap SE = 0.019, p = 0.344, 95% CI [−0.019, 0.055]). Similarly, the AIP × PPR2 interaction was nonsignificant (β = −0.014, bootstrap SE = 0.019, p = 0.461, 95% CI [−0.052, 0.023]). Because both confidence intervals contained zero, the data did not provide evidence of curvature in the way NFC or PPR conditioned the respective AIP associations. The linear interaction specifications underlying H9 and H12 were therefore retained for substantive interpretation.
Competing Cross-Moderation Model
The theorized moderation structure assigned need for cognition specifically to the AIP–recommendation–quality association and perceived privacy risk specifically to the AIP–recommendation–discovery association. This specification reflected the distinction between cognitively effortful evaluation of recommendation quality and the privacy-related concerns that may accompany personalized and unexpected discovery. Nevertheless, the theoretical assignment of the moderators does not imply that the alternative cross-moderation associations are necessarily zero. A competing model was therefore estimated to examine whether allowing each moderator to operate on the alternative pathway provided additional explanatory value.
The expanded model added the AIP × NFC interaction to the perceived recommendation discovery equation and the AIP × PPR interaction to the perceived AI recommendation quality equation. The corresponding moderator main effects were retained in the respective equations to preserve hierarchical model specification. As shown in Panel A of Appendix H, neither cross-interaction was statistically significant. The AIP × NFC → PRD interaction was positive but small (β = 0.027, bootstrap SE = 0.022, p = 0.220), and its 95% confidence interval [−0.016, 0.070] included zero. Likewise, the AIP × PPR → RAQ interaction was negative but nonsignificant (β = −0.025, bootstrap SE = 0.021, p = 0.234), with a confidence interval ranging from −0.066 to 0.016. Both cross-interactions produced negligible local effect sizes (f2 = 0.001).
The theoretically specified interactions remained statistically supported after the competing terms were introduced. The AIP × NFC interaction predicting perceived AI recommendation quality remained positive (β = 0.127, 95% CI [0.081, 0.173], p < 0.001), while the AIP × PPR interaction predicting perceived recommendation discovery remained negative (β = −0.108, 95% CI [−0.154, −0.064], p < 0.001). Their direction and magnitude were therefore substantively consistent with the corresponding estimates obtained from the theorized model.
Panel B of Appendix H further compares the explanatory performance of the two specifications. For perceived recommendation discovery, R2 increased only from 0.310 in the theorized model to 0.311 in the expanded model, representing an incremental increase of 0.001. Adjusted R2 remained unchanged at 0.308. For perceived AI recommendation quality, R2 increased from 0.345 to 0.346, again producing an incremental increase of only 0.001, while adjusted R2 decreased slightly from 0.344 to 0.343 after accounting for the additional parameters.
The competing-model results provide no empirical evidence that the two cross-moderation terms add meaningful explanatory information. Their bootstrap confidence intervals included zero, their local effect sizes were negligible, and their inclusion produced virtually no improvement in explained variance. The more parsimonious theorized specification was therefore retained for substantive interpretation. This result should not be interpreted as demonstrating that need for cognition can never condition recommendation discovery or that privacy risk can never condition recommendation quality; rather, the present data did not provide support for these additional interaction terms within the specified model.
4.9. Conditional Indirect Associations
Panel A of Table 8 reports the conditional indirect association through perceived AI recommendation quality. The coefficient increased from 0.157 at a low level of Need for Cognition to 0.207 at the mean and 0.257 at a high level. The confidence intervals for all three estimates excluded zero. More importantly, the index of moderated mediation was positive at 0.051, with a confidence interval from 0.033 to 0.073. Following the inferential criterion proposed by [70], the exclusion of zero from this interval supports H10. The estimated positive indirect association through recommendation quality was therefore statistically stronger at higher observed levels of Need for Cognition. However, this conditional variation should be interpreted in conjunction with the small first-stage AIP × NFC interaction (f2 = 0.026; ΔR2 = 0.017), rather than as indicating a large change in the indirect pathway.
Table 8.
Conditional Indirect Associations and Indices of Moderated Mediation.
A different pattern emerged for perceived privacy risk. As shown in Panel B of Table 8, the indirect association through perceived recommendation discovery decreased from 0.186 at low privacy risk to 0.152 at the mean and 0.118 at high privacy risk. Although each conditional estimate remained positive, their progressive decline was consistent with the negative interaction reported in Table 7. The pattern therefore indicates attenuation of the positive indirect association as perceived privacy risk increased, rather than elimination or reversal of the discovery pathway.
The moderated-mediation index reported in Panel C of Table 8 was −0.034, and its confidence interval ranged from −0.054 to −0.018. Because the interval excluded zero, H13 was supported. The result indicates that the positive indirect association through perceived recommendation discovery was smaller at higher observed levels of perceived privacy risk, while remaining positive at all three examined levels. As with H10, the magnitude of this conditional variation should be considered alongside the small first-stage AIP × PPR interaction (f2 = 0.017; ΔR2 = 0.012). H13 therefore identifies a statistically detectable but practically modest variation in the discovery-based indirect association across levels of privacy risk.
The indices of moderated mediation support H10 and H13 statistically, but the conditional indirect findings should not be interpreted as evidence that NFC or PPR fundamentally transforms the two recommendation-response pathways. The associated first-stage interactions account for only modest increments in explained variance—approximately 1.7 percentage points for the NFC-conditioned recommendation–quality equation and 1.2 percentage points for the PPR-conditioned recommendation–discovery equation. The theoretical implication is therefore one of systematic but limited boundary conditioning: NFC and PPR help explain variation in the strength of the estimated indirect associations, while the underlying personalization–recommendation relationships remain positive across most or all of the substantively relevant moderator ranges. These conditional indirect results describe variation in contemporaneous statistical associations and do not establish temporal or causal moderated-mediation processes.
4.10. Supplementary CB-SEM Robustness and Competing-Model Assessment
A supplementary CB-SEM analysis was conducted to assess whether the principal structural conclusions were sensitive to reliance on the variance-based PLS-SEM estimation framework. The robustness analysis retained the same six latent constructs and 28 measurement indicators but focused on the core structural architecture, excluding the latent interaction terms and conditional indirect associations. As reported in Panel A of Appendix I, the theorized CB-SEM model demonstrated satisfactory overall fit, χ2(340) = 648.21, CFI = 0.958, TLI = 0.952, RMSEA = 0.027, 90% CI [0.024, 0.030], and SRMR = 0.041. These indices indicated that the covariance structure implied by the core theoretical model was reasonably consistent with the observed data. Panel B of Appendix I compares the principal standardized structural coefficients obtained from CB-SEM with the corresponding PLS-SEM estimates. The pattern was substantively consistent across the two estimation frameworks. AI-driven personalization remained positively associated with Perceived Recommendation Discovery in CB-SEM (β = 0.478, p < 0.001) and Perceived AI Recommendation Quality (β = 0.514, p < 0.001), compared with PLS-SEM estimates of 0.490 and 0.530, respectively. The direct AIP–brand-loyalty association also remained positive and statistically significant (β = 0.196, p < 0.001), compared with the PLS-SEM estimate of 0.210.
The two recommendation-response constructs displayed the same substantive relationships with brand loyalty under CB-SEM. Perceived Recommendation Discovery was positively associated with brand loyalty (β = 0.298, p < 0.001), while Perceived AI Recommendation Quality recorded a coefficient of 0.376 (p < 0.001). These estimates were close in direction and magnitude to the corresponding PLS-SEM coefficients of 0.310 and 0.390. Similarly, the positive NFC–recommendation–quality association and the negative privacy-risk–discovery association remained statistically supported under CB-SEM. The specific indirect associations were also robust across estimation frameworks. The CB-SEM indirect association between AI-driven personalization and brand loyalty through Perceived Recommendation Discovery was 0.142, with a bootstrap 95% confidence interval of [0.111, 0.177]. The corresponding indirect association through Perceived AI Recommendation Quality was 0.193, with a confidence interval of [0.157, 0.232]. Both intervals excluded zero. Their corresponding PLS-SEM estimates were 0.152 and 0.207, respectively. Thus, the two estimation approaches yielded the same substantive conclusion regarding the presence and relative pattern of the parallel indirect associations.
The CB-SEM model accounted for 29.5% of the variance in Perceived Recommendation Discovery, 32.6% in Perceived AI Recommendation Quality, and 49.3% in smart tourism platform brand loyalty. These values were moderately lower than the PLS-SEM R2 values of 0.310, 0.345, and 0.520, respectively, but the overall pattern of explanatory performance was similar.
A serial-mediation competitor was additionally estimated to examine whether the two recommendation responses were better represented as sequentially ordered structural stages rather than as parallel appraisals. In this alternative specification, AI-driven personalization predicted Perceived Recommendation Discovery, which subsequently predicted Perceived AI Recommendation Quality, which in turn predicted smart tourism platform brand loyalty. The residual AIP → BL association and the NFC → RAQ and PPR → PRD associations were retained, whereas the direct AIP → RAQ and PRD → BL paths were omitted to provide a structurally distinct serial alternative.
As shown in Panel E of Appendix I, the serial model retained acceptable absolute fit but was comparatively less adequate than the theorized parallel specification, χ2(341) = 726.84, CFI = 0.947, TLI = 0.941, RMSEA = 0.030, 90% CI [0.027, 0.033], and SRMR = 0.053. Its information criteria were also higher, with AIC = 12,619.23 and BIC = 12,982.91, compared with AIC = 12,542.60 and BIC = 12,911.40 for the theorized parallel model. Because the two specifications are nonnested, no chi-square difference test was used for this comparison.
The structural estimates reported in Panel F of Appendix I show that the sequential specification contained statistically supported associations at each stage. AIP remained positively associated with PRD (β = 0.478, p < 0.001), while PPR remained negatively associated with PRD (β = −0.169, p < 0.001). PRD was positively associated with RAQ (β = 0.235, bootstrap SE = 0.028, p < 0.001, 95% CI [0.181, 0.290]), and NFC remained positively associated with RAQ (β = 0.148, p < 0.001). RAQ was positively associated with brand loyalty (β = 0.421, bootstrap SE = 0.025, p < 0.001, 95% CI [0.372, 0.470]), while the residual AIP → BL association also remained positive and statistically significant (β = 0.447, bootstrap SE = 0.024, p < 0.001, 95% CI [0.400, 0.494]). The resulting AIP → PRD → RAQ → BL serial indirect association was 0.047 (bootstrap SE = 0.007, p < 0.001, 95% CI [0.034, 0.063]).
Accordingly, the serial competitor indicates that a sequential structural representation is statistically feasible, but it does not provide a comparatively better representation of the data. Its less favorable overall fit and higher information criteria provide less support for treating recommendation discovery as a necessary structural antecedent of recommendation quality than for representing PRD and RAQ as parallel recommendation responses. Given the cross-sectional design, this comparison concerns relative structural-model adequacy and does not establish temporal precedence between discovery and quality.
Panel E of Appendix I also reports the nested comparison in which the direct AIP → brand-loyalty association was fixed to zero while the two parallel indirect pathways were retained. The restricted model continued to display broadly acceptable absolute fit, but its fit was weaker than that of the theorized parallel model. It produced χ2(341) = 681.77, CFI = 0.953, TLI = 0.947, RMSEA = 0.029, 90% CI [0.026, 0.032], and SRMR = 0.048. Constraining the direct association to zero significantly worsened model fit, Δχ2(1) = 33.56, p < 0.001.
The information criteria produced the same comparative pattern. The restricted model recorded AIC = 12,574.16 and BIC = 12,937.84, both higher than the corresponding values for the theorized parallel model. The results therefore support retaining the residual AIP → BL association alongside the two statistically supported parallel indirect associations. The coexistence of positive direct and specific indirect associations, together with the significant deterioration in model fit when the direct path was constrained to zero, is statistically consistent with the pattern conventionally described as complementary partial mediation. In the present cross-sectional study, however, this characterization refers only to the configuration of observed associations and should not be interpreted as evidence of causal mediation or temporal transmission.
In this vein, the supplementary analyses indicate that the principal structural relationships were not dependent on the exclusive use of PLS-SEM. The CB-SEM estimates reproduced the direction and substantive statistical conclusions of the principal direct and indirect associations. The serial competitor demonstrated that a sequential PRD → RAQ specification was statistically feasible but comparatively less consistent with the observed covariance structure than the theorized parallel specification, whereas the nested no-direct-path comparison showed that removing the residual AIP → BL association materially reduced model adequacy. These findings strengthen the robustness of the reported structural pattern but should not be interpreted as demonstrating causal relationships, establishing temporal precedence between PRD and RAQ, or proving that the theorized specification is the only possible representation of the observed covariance structure.
4.11. Out-of-Sample Predictive Assessment
Panel A of Appendix J presents the indicator-level PLSpredict results. All predictive relevance values were positive and ranged from 0.223 for PRD3 to 0.371 for BL2. Under the procedure outlined by [58], this pattern indicates that the PLS-SEM predictions generated lower errors than the indicator-average benchmark for every endogenous indicator.
The comparison with the linear-model benchmark was less uniform and provides a more conservative assessment of predictive performance. PLS-SEM generated lower RMSE and MAE values for 11 of the 13 endogenous indicators. The two exceptions were PRD3 and RAQ5, for which the linear model produced slightly lower prediction errors on both criteria. For PRD3, the LM reduced RMSE by 0.003 and MAE by 0.004 relative to PLS-SEM; for RAQ5, the corresponding differences were 0.002 and 0.003. Although these differences were small, they show that the predictive advantage of PLS-SEM was not uniform across all endogenous indicators.
The CVPAT results in Panel B of Appendix J provide an overall statistical comparison. The average PLS-SEM loss was 0.461, compared with 0.654 for the indicator-average benchmark. The resulting loss difference was −0.193 and was significant at the 0.001 level. Relative to the linear-model benchmark, the corresponding losses were 0.461 and 0.472. The resulting difference of −0.011 was statistically significant (p = 0.007) but marginal in substantive magnitude. Thus, the aggregate improvement over the linear benchmark was considerably smaller than the improvement observed relative to the indicator-average benchmark.
Following the CVPAT interpretation developed by [71] and extended by [72], the negative average loss differences indicate lower aggregate out-of-sample prediction error for PLS-SEM relative to both benchmarks. However, the strength of this evidence differed materially across the two comparisons. The advantage over the indicator-average benchmark was comparatively pronounced (Δ loss = −0.193), whereas the advantage over the linear-model benchmark was marginal (Δ loss = −0.011). Moreover, the linear model slightly outperformed PLS-SEM for PRD3 and RAQ5 at the indicator level. The predictive results support modest incremental predictive performance at the aggregate level relative to the linear benchmark rather than uniform or broad predictive superiority. The evidence is therefore consistent with useful out-of-sample predictive capability, but it does not indicate that PLS-SEM provides better predictions for every endogenous indicator or that its advantage over a conventional linear benchmark is large.
5. Discussion
The findings offer a qualified account of how AI-driven personalization is associated with brand loyalty in smart tourism platforms. Personalization was not related to loyalty only as a convenient platform feature; the overall association also included statistically significant indirect associations through consumers’ evaluations of the recommendation encounter. This distinction is important because existing tourism research has largely interpreted personalized recommendations through broad evaluations such as technology trust and attitude. Ref. [7], for example, positioned perceived personalization and information quality as antecedents of trust and attitudes toward personalized tourism recommendations. More recently, ref. [9] examined the association between generative AI personalization and tourism-platform loyalty through transparency and consumer trust. The present findings complement that work by identifying two additional recommendation-level correlates of platform loyalty: whether the output is considered decision-relevant and dependable, and whether it facilitates pleasantly surprising discoveries and expands the alternatives considered by the traveler.
The recommendation–quality pathway reflects the informational demands of digital travel decisions. Tourism products are difficult to evaluate before consumption, frequently involve several interdependent choices, and are compared under constraints relating to price, timing, location, and personal preference. Under these conditions, personalization may be particularly valuable when users perceive the resulting recommendations as closely aligned with their decision requirements. Ref. [31] found that personalized content can direct attention and function as a decision aid when it is relevant to the user’s goals, while ref. [6] argued that recommendation agents become useful by reducing search complexity and supporting product evaluation. The present evidence is consistent with this reasoning: respondents reporting stronger personalization also tended to evaluate the recommendations more favorably in terms of accuracy, relevance, currency, comparison usefulness, and reliability, and these quality evaluations were positively associated with advocacy and intended future platform use. In a tourism setting, ref. [7] similarly demonstrated the centrality of information quality to users’ responses to personalized recommendations, while ref. [73] connected recommendation-supported decision quality with loyalty in social shopping communities.
Perceived Recommendation Discovery represents the complementary exploratory pathway. The results indicate that stronger perceived personalization was associated not only with evaluative quality but also with greater pleasant surprise, unexpected discovery, exposure to previously unconsidered alternatives, and expansion of the range explored. The broader serendipity literature provides an important conceptual foundation for interpreting this pattern. Ref. [13] distinguished serendipity from random novelty by emphasizing that unexpectedness is typically accompanied by relevance or usefulness, while ref. [12] associated meaningful surprise with favorable consumer responses. The present construct, however, is deliberately labeled Perceived Recommendation Discovery because the retained indicators represent the discovery-oriented elements of this broader literature rather than the complete canonical serendipity construct. Relevance and decision usefulness are assessed separately through Perceived AI Recommendation Quality. The findings therefore extend the discovery-oriented side of recommendation research without claiming to reproduce the full conceptual domain of serendipity.
This pattern is particularly relevant in tourism because travelers often begin searching without fully specified preferences, allowing their consideration sets to evolve as new destinations, accommodations, and activities become visible. The positive association between Perceived Recommendation Discovery and Smart Tourism Platform Brand Loyalty indicates that respondents who reported greater pleasant surprise, unexpected discovery, and option broadening also expressed stronger advocacy and intentions to use the platform more frequently and in the future. However, exploratory value alone may not fully explain why discovery-oriented recommendation experiences correspond with platform loyalty. Enlarging the consideration set describes what discovery accomplishes cognitively, but it does not fully specify why an unexpectedly appealing discovery may become associated with stronger intentions toward the platform that produced it.
An additional affective mechanism is theoretically plausible. Within S–O–R reasoning, organismic responses may include affective as well as cognitive reactions to an environmental stimulus [20]. A recommendation that reveals an appealing destination, accommodation, activity, or travel option that the user had not anticipated may therefore do more than broaden the available choice set. When unexpectedness is positively valenced, the discovery experience may generate enjoyment, pleasure, happiness, or delight. This interpretation is consistent with customer-delight research showing that unexpectedly favorable experiences can generate positive affect and delight [74], marketplace-serendipity research linking positive unexpected encounters with enjoyment, satisfaction, recommendation intentions, and subsequent purchase-related responses [75], and recommender-system evidence associating serendipitous recommendations with emotional reactions such as surprise and happiness [76]. Such positive affect may become associated with the platform through which the discovery occurred, providing a plausible bridge from discovery-oriented experience to advocacy and intended future use.
This interpretation must nevertheless remain qualified. The present study did not measure enjoyment, delight, happiness, arousal, or another affective organism state. Perceived Recommendation Discovery should therefore not be treated as a proxy for those constructs merely because its indicators include pleasant surprise and unexpected discovery. The observed PRD–loyalty association establishes that discovery-oriented evaluations and loyalty intentions covary, but it cannot determine whether positive affect explains part of that relationship. Enjoyment or delight consequently represents a theoretically plausible but unmeasured mechanism rather than an empirically demonstrated mediator in the present model.
Importantly, the empirical distinction between Perceived Recommendation Discovery and Perceived AI Recommendation Quality indicates that exploratory discovery and diagnostic recommendation evaluation represent different aspects of the personalized encounter rather than a single undifferentiated favorable response. The former concerns whether the platform broadens what the traveler encounters, whereas the latter concerns whether the resulting recommendations are sufficiently relevant, useful, current, accurate, and reliable for decision support [12,35]. This distinction may also extend to organismic response type: recommendation quality primarily reflects cognitive–instrumental appraisal, whereas discovery may additionally evoke affective responses that were not measured separately in the present model.
The two recommendation responses therefore appear to represent different correlates of advocacy and intended future platform use. Perceived AI recommendation quality concerns whether the system can be relied upon as a decision aid, whereas Perceived Recommendation Discovery concerns whether the platform broadens the user’s exploration and introduces pleasantly surprising or previously unconsidered alternatives. The indirect association through perceived AI recommendation quality was statistically larger than the corresponding indirect association through perceived recommendation discovery. The formal bootstrap contrast yielded a difference of 0.055, with a 95% confidence interval ranging from 0.019 to 0.094, indicating that recommendation quality represented the larger of the two contemporaneous indirect pathways at the mean levels of the corresponding moderators. This relative pattern is consistent with the possibility that dependable decision support is especially salient in travel decisions characterized by financial, temporal, and experiential uncertainty. The discovery-oriented pathway complements the quality pathway, but the statistically larger recommendation–quality pathway should be interpreted as a difference in the magnitude of the estimated indirect associations rather than as evidence that recommendation quality is a causally stronger mechanism. Moreover, the smaller estimated discovery pathway should not be interpreted as evidence that discovery lacks experiential importance. Part of its relevance to loyalty may operate through affective reactions not represented as separate constructs in the current model, a possibility that cannot be evaluated from the present data. Ref. [73] similarly found that decision quality occupies a central position in recommendation-based loyalty, while ref. [33] showed that experiential and cognitive evaluations of technology-mediated services can become connected with brand-level outcomes through broader brand evaluations.
The continued association between AI-driven personalization and brand loyalty after considering both recommendation responses is equally informative. It suggests that the two recommendation appraisals do not exhaust the statistical association between personalization and platform loyalty. Other evaluations may remain involved, including convenience, perceived recognition, trust, transparency, enjoyment, and reduced search effort. This residual association is compatible with [9] evidence regarding transparency and trust and with [42] emphasis on perceived empathy in AI recommendation acceptance. The affective account considered above provides another potential extension: enjoyment or delight may represent an additional organismic response arising from personalized discovery that is not absorbed fully by either PRD or RAQ. The contribution of the present model is therefore not a claim that two mechanisms replace established explanations. Rather, it identifies recommendation-level appraisals as an additional explanatory layer alongside broader evaluations of the platform and its technology.
The findings concerning Need for Cognition provide a more nuanced interpretation of heterogeneity in recommendation–quality evaluation and in the personalization–quality association. According to [16], individuals with a stronger need for cognition are more inclined to scrutinize message content and assess the merits of the information presented. This theoretical logic is relevant not only to moderation but also to the positive NFC main association observed for recommendation quality. Forming a judgment about recommendation quality requires users to integrate several diagnostic attributes—such as accuracy, relevance to the current travel task, currency, comparison usefulness, and reliability—rather than merely notice that recommendations have been presented. Consumers higher in Need for Cognition are more disposed to engage in this attribute-level scrutiny, compare available alternatives, attend to consistency across informational cues, and integrate those cues into an overall evaluation. This provides a plausible cognitive-elaboration account of why higher NFC was positively associated with RAQ in the present data.
Importantly, this mechanism does not imply that greater cognitive effort necessarily yields more favorable evaluations. More extensive scrutiny can expose inaccurate, outdated, inconsistent, or superficially personalized recommendations as readily as it can reveal high-quality output. The positive NFC → RAQ association should therefore be understood as the net empirical pattern observed in the present sample rather than as a general proposition that cognitively motivated consumers inherently evaluate AI more favorably. Its practical magnitude was also limited: although the association was statistically supported (β = 0.150), its local effect size was small (f2 = 0.033). NFC should consequently be viewed as one modest contributor to perceived recommendation quality rather than as a primary determinant of users’ quality judgments.
The moderation result represents a conceptually different role for NFC. In personalized environments, ref. [55] demonstrated that the effectiveness of preference matching and recommendation design varies with consumers’ cognitive motivation. The stronger personalization–quality association among consumers higher in Need for Cognition is consistent with the interpretation that these users may place greater evaluative weight on whether personalized recommendations correspond to their preferences and withstand closer examination. The pattern is therefore consistent with more extensive evaluation among consumers higher in Need for Cognition, although the study did not directly measure the processing activity itself. At the same time, the interaction should not be overstated. Its local effect size was small (f2 = 0.026), and inclusion of the interaction increased the variance explained in recommendation quality by 0.017, or approximately 1.7 percentage points. Thus, NFC statistically conditioned the personalization–quality association, but its incremental explanatory contribution was modest.
The Johnson–Neyman analysis further clarified the range of this conditional pattern. The AIP–RAQ association became statistically distinguishable from zero above an NFC raw-scale value of approximately 1.46 and was therefore positive across almost the entire substantively available NFC range. This broad region of statistical significance does not contradict the small interaction effect size. Rather, it shows that the underlying positive personalization–quality association was robust across most NFC values, while NFC produced a comparatively modest change in its strength. The Johnson–Neyman result should consequently be interpreted as evidence about where the conditional association is statistically detectable, not as evidence that NFC exerts a large moderating influence.
This distinction also refines the comparison with [42]. Their study showed that Need for Cognition strengthened the relationship between personalization quality and perceived empathy, whereas technology quality was more influential under lower cognitive motivation. In the present model, NFC was positively but modestly associated with perceived AI recommendation quality, while the personalization–quality association also became stronger as NFC increased. The findings therefore distinguish two roles: a small average association between cognitive motivation and quality evaluation, and a small but statistically detectable difference in how strongly personalization corresponds with recommendation quality across levels of cognitive motivation. Nevertheless, the personalization–quality association remained positive at lower levels of Need for Cognition. Cognitive motivation therefore refined the strength of the observed association rather than determining whether personalization was positively evaluated.
Perceived Privacy Risk was associated with a different conditional pattern in the hypothesized model. At the main-effect level, higher privacy risk was negatively associated with Perceived Recommendation Discovery, but the unique contribution was again small (β = −0.180; f2 = 0.046). This finding suggests that perceived informational vulnerability corresponds with less favorable discovery-oriented evaluations, while also indicating that privacy risk explains only a limited additional portion of discovery perceptions once the other predictors are taken into account. The result should therefore not be interpreted as suggesting that privacy concerns dominate consumers’ discovery experience.
The weaker association between personalization and Perceived Recommendation Discovery among privacy-sensitive consumers is consistent with the personalization–privacy paradox identified by [17]. An unexpectedly well-tailored recommendation can be pleasantly surprising while simultaneously revealing how much the platform appears to know about the user. When concerns about data misuse, unauthorized access, or loss of control become salient, the same unexpected fit may be interpreted less exclusively as helpful discovery and more as evidence of extensive or intrusive data inference. Ref. [18] showed that responses to personalized communications depend on trust in the provider, while ref. [77] found that personalization can reduce trust when it makes the consequences of information disclosure more visible.
The privacy result is not equivalent to uniform rejection of personalization. Even among respondents reporting greater privacy risk, the association between personalization and discovery remained positive but was weaker. Privacy risk therefore corresponded with attenuation rather than reversal of the observed association. The interaction itself was small (f2 = 0.017), and its inclusion increased the variance explained in Perceived Recommendation Discovery by only 0.012, or approximately 1.2 percentage points. The moderating role of privacy risk is therefore statistically detectable but practically modest, indicating refinement of the personalization–discovery relationship rather than a substantial restructuring of it. This interpretation complements [78], who found that privacy-sensitive tourism users display heightened appraisal sensitivity rather than automatic resistance to AI personalization. It also aligns with [79], whose experimental evidence indicated more favorable privacy responses under conditions providing greater information autonomy and carefully framed recommendation labels. These findings indicate that consumers do not respond to personalization through a simple acceptance–rejection dichotomy. They may value personalized recommendation benefits while simultaneously remaining sensitive to the informational implications of how those benefits are produced.
The Johnson–Neyman analysis reinforces this qualified interpretation. The model-implied transition for the AIP–PRD association occurred at a perceived-privacy-risk value of approximately 5.46, above the maximum of the five-point scale. The conditional association therefore remained positive and statistically distinguishable from zero throughout the scale-supported range from 1 to 5, even though its magnitude progressively declined as privacy risk increased. As with NFC, this broad region of statistical significance should not be confused with practical effect size: the interaction remained small in both f2 and ΔR2 terms. The evidence therefore suggests that privacy risk attenuates the personalization–discovery association without approaching a reversal of that relationship within the substantively observed range.
The conditional indirect results should be interpreted with the same distinction between statistical detectability and practical magnitude. The indirect association through recommendation quality increased as NFC increased, and the corresponding index of moderated mediation supported H10. Likewise, the indirect association through recommendation discovery decreased as privacy risk increased, supporting H13. However, these patterns originate from first-stage interactions with small local effects and modest ΔR2 values. The results therefore indicate systematic but limited variation in the strength of the two indirect associations rather than large changes in the recommendation-response pathways. NFC and privacy risk function as modest boundary conditions around otherwise comparatively stronger personalization–recommendation associations.
Viewed as a whole, the results show two focal conditional patterns within the hypothesized model. The personalization–quality association was stronger at higher levels of Need for Cognition, whereas the personalization–discovery association was weaker at higher levels of perceived privacy risk. The corresponding indirect associations varied in the same directions. The competing cross-moderation analysis further showed that Need for Cognition did not significantly condition the personalization–discovery association and that perceived privacy risk did not significantly condition the personalization–quality association. The two theoretically specified interactions remained statistically supported in the expanded model, whereas the cross-interactions were nonsignificant, had negligible local effect sizes, and added virtually no explanatory variance. This pattern provides evidence consistent with empirical differentiation of the two focal moderation pathways within the present model, while not implying that Need for Cognition and perceived privacy risk are universally exclusive to those pathways across contexts.
At the same time, the magnitude evidence places an important boundary on the theoretical interpretation. The NFC → RAQ and PPR → PRD main associations had small local effect sizes (f2 = 0.033 and 0.046, respectively), and the focal NFC and PPR interaction effects were also small (f2 = 0.026 and 0.017), contributing only ΔR2 = 0.017 and 0.012 to their respective endogenous constructs. The contribution of NFC and privacy risk therefore lies less in identifying dominant determinants of recommendation responses than in identifying systematic, theoretically interpretable heterogeneity around the stronger personalization-related associations. In this sense, the moderators refine rather than fundamentally transform the broader personalization pattern.
Given the cross-sectional design, these pathways should be interpreted as theoretically organized associations rather than demonstrated temporal mechanisms. The findings nevertheless illustrate how the same personalized encounter can coincide with perceptions of dependable decision support, exploratory discovery, and informational vulnerability, while also showing that the extent to which individual cognitive motivation and privacy risk modify these associations is statistically discernible but practically limited.
6. Theoretical Implications
The study first refines the application of the Stimulus–Organism–Response framework by differentiating two internal responses to AI-driven personalization. In the original formulation of [20], environmental stimuli, internal organismic states, and subsequent responses constitute analytically distinct components of the framework. Prior tourism applications have frequently represented these states through broad constructs such as trust, attitude, emotional response, or perceived value. Ref. [7] used trust and attitude to explain responses to personalized tourism recommendations, while ref. [9] emphasized transparency and trust in the personalization–loyalty relationship. The present model adds analytical precision by distinguishing perceived AI recommendation quality as a diagnostic evaluation from perceived recommendation discovery as an exploratory appraisal centered on pleasant surprise, unexpected discovery, previously unconsidered alternatives, and expansion of the traveler’s exploration space. This discovery construct is conceptually informed by the discovery-oriented component of the recommendation-serendipity literature without being treated as equivalent to the broader serendipity construct, which typically also incorporates relevance or usefulness [12,13]. Its theoretical contribution to S–O–R therefore lies less in adding another intervening construct than in differentiating qualitatively different forms of organismic appraisal at the level of the recommendation output itself. This distinction shows how the organism component can accommodate both instrumental evaluation and discovery-oriented experience without collapsing them into a general favorable response to personalization.
The coexistence of direct and indirect associations also places a useful boundary on this extension. Perceived AI recommendation quality and perceived recommendation discovery accounted for statistically meaningful indirect associations within the personalization–loyalty relationship, but they did not exhaust it. This finding discourages a closed interpretation of the organism component and supports treating it as a theoretically selectable set of internal states rather than a complete inventory of consumer cognition and experience. The study consequently develops S–O–R through greater specificity without claiming that all internal responses to AI personalization have been represented. Equally, the cross-sectional evidence does not establish that the proposed S–O–R ordering constitutes an observed temporal sequence; its contribution is to the theoretical organization and empirical differentiation of the associations.
Second, the findings refine the application of the Elaboration Likelihood Model to consumer evaluations of personalized AI recommendations. Ref. [16] conceptualized need for cognition as a motivation for more effortful scrutiny of message-relevant information. Ref. [55] later demonstrated its relevance to web personalization, and ref. [42] applied it to AI recommendation acceptance. The present evidence identifies cognitive motivation as theoretically relevant to variation in the association between perceived personalization and recommendation quality rather than merely as a general individual-difference predictor of technology acceptance. This provides a more specific role for ELM within AI personalization research: it helps explain why the same degree of perceived adaptation may correspond with different recommendation–quality evaluations across consumers differing in their propensity for cognitive effort.
Importantly, the positive association between need for cognition and recommendation quality should not be treated as an implication of ELM itself. Greater elaboration can expose deficiencies as well as strengths in recommendation output. The observed positive association is therefore context-specific evidence from the present sample, whereas the more general theoretical implication concerns heterogeneity in evaluative processing. This interpretation remains deliberately bounded. The study measured need for cognition but did not directly observe elaboration, argument scrutiny, or central-route processing. The findings are therefore consistent with ELM but do not independently demonstrate the cognitive process proposed by the theory. Moreover, the relatively small interaction effect size indicates that Need for Cognition should be regarded as a refinement of the personalization–quality association rather than as a dominant explanation of recommendation evaluation. Future research should measure elaboration or use process-tracing designs before concluding that the observed moderation represents central-route processing in a strict sense.
Third, the study broadens the application of Privacy Calculus Theory by examining perceived privacy risk in relation to how consumers evaluate discovery-oriented personalization, rather than limiting privacy considerations to disclosure or adoption decisions. Ref. [19] conceptualized privacy-related behavior as a balance between expected benefits and information-related risks. Ref. [17] showed that personalization outcomes depend on how information has been collected, while ref. [77] demonstrated that privacy calculations vary across personalized contexts. The present findings indicate that perceived privacy risk is relevant not only to disclosure or adoption decisions but also to consumers’ evaluations of unexpectedly personalized discovery. The weaker personalization–discovery association at higher levels of privacy risk is consistent with the proposition that the same informational reach that supports exploratory discovery may also make informational vulnerability more salient. The corresponding variation in the indirect association with loyalty extends this privacy-related contingency to platform-oriented intentions.
This contribution should not be overstated as a complete test of privacy calculus. The model measured perceived privacy risk but did not directly examine disclosure behavior or estimate an explicit comparison between privacy costs and personalization benefits. It therefore identifies a risk-contingent evaluation consistent with Privacy Calculus Theory rather than reproducing the entire calculus. The small interaction effect size further suggests that privacy risk qualifies the association rather than fundamentally reversing the value associated with personalization. The supplementary cross-moderation analysis further showed that perceived privacy risk did not significantly condition the personalization–quality association, while Need for Cognition did not significantly condition the personalization–discovery association. This pattern strengthens the empirical differentiation of the two focal moderation pathways within the present model, but it should not be interpreted as establishing universal exclusivity across contexts, platforms, or populations.
The theoretical value of integrating the three perspectives lies in their distinct explanatory roles rather than in simply combining multiple theories. S–O–R provides the architecture for distinguishing platform stimulus, recommendation-level appraisals, and loyalty-related response; ELM explains why cognitive motivation is relevant to heterogeneity in evaluative scrutiny; and Privacy Calculus Theory explains why the informational benefits of personalization can coexist with perceived informational vulnerability. The resulting framework therefore offers a differentiated account of AI personalization in which recommendation quality and Perceived Recommendation Discovery are analytically distinct and their associations may vary across consumers for theoretically different reasons. This distinction is especially important because it separates exploratory broadening of the recommendation experience from evaluative judgments concerning recommendation accuracy, relevance, usefulness, currency, and reliability, rather than treating both as manifestations of a single favorable recommendation response. This integration should be interpreted as a bounded explanation of contemporaneous relationships rather than as proof of causal mechanisms or exclusive pathway assignments.
7. Practical Implications
Smart tourism platforms may benefit from managing personalization as a dual-objective recommendation problem rather than optimizing only for recommendation fit or click-through performance. The first objective is to maintain a quality threshold based on preference fit, decision relevance, reliability, comparison usefulness, and information currency. The second is to introduce controlled discovery by presenting unfamiliar alternatives that remain connected to the traveler’s stated goals. Although the broader serendipity literature emphasizes the value of combining unexpectedness with relevance [12], the present findings specifically concern Perceived Recommendation Discovery: whether recommendations generate pleasant surprise, reveal previously unconsidered alternatives, and broaden the range explored. Ref. [73] emphasized the role of recommendation quality in reducing decision difficulty. Platforms should therefore apply relevance and reliability safeguards before exposing users to discovery-oriented recommendations, so that exploratory content does not come at the expense of basic decision support.
This principle can be operationalized through separate recommendation slots. Core recommendations should closely match stated constraints, whereas a clearly labelled discovery section can introduce less obvious destinations, accommodations, or activities and explain their connection to the traveler’s profile. Recommendation teams should evaluate these components separately. Accuracy, freshness, comparison usefulness, and booking suitability are appropriate indicators for the quality layer; pleasant surprise, exposure to previously unconsidered alternatives, exploration depth, option broadening, saves, and engagement with newly discovered options are more appropriate indicators for the discovery layer. For example, quality monitoring could track user-rated relevance, the proportion of stale or unavailable recommendations, comparison-tool usage, and post-recommendation abandonment, whereas discovery monitoring could track saves of previously unexplored options, expansion of the consideration set, and subsequent interaction with discovery recommendations. Treating clicks as the sole success criterion would conceal whether users value the platform for dependable assistance or for exploratory discovery.
The moderator-related implications should be interpreted more cautiously than the implications associated with the core recommendation pathways. Although the Need for Cognition and perceived privacy risk interactions were statistically detectable, their local effect sizes were small (f2 = 0.026 and 0.017, respectively), and they increased the explained variance in their corresponding recommendation responses by only 0.017 and 0.012. These variables should therefore be treated as secondary design considerations rather than primary determinants of personalization strategy. Platform managers should prioritize stronger personalization, recommendation–quality, and recommendation–discovery relationships, while using cognitive-motivation and privacy-sensitive adaptations as incremental refinements where operationally feasible.
The conditional role of Need for Cognition supports offering different levels of informational depth without covertly classifying users by personality. A concise recommendation card can serve users seeking rapid guidance, while an optional comparison view can provide attribute-level matching, trade-offs, source information, update dates, and reasons for the recommendation. Ref. [55] showed that personalization design elements acquire different relevance across levels of cognitive motivation, while ref. [80] demonstrated the value of explanation facilities in recommendation-agent evaluations. Because the observed interaction was relatively small, the findings do not justify rigid personality-based segmentation. User-controlled information depth is therefore a more proportionate design response than attempting to infer Need for Cognition and automatically redesign the interface around it.
Privacy safeguards should appear at the point where personalization becomes visible, not remain confined to a general privacy policy. Each recommendation interface should provide an accessible “Why am I seeing this?” function identifying the preference categories and recent inputs used. Users should be able to exclude individual data categories, pause personalization, delete travel-search history, and choose session-only recommendations. Ref. [17] showed that overt information practices produce different responses from covert collection, while ref. [79] demonstrated that perceived information autonomy can reduce travelers’ privacy concerns. These controls may be particularly useful for recommendations whose unexpected fit or discovery value could otherwise reveal an uncomfortable level of inferred knowledge. However, given the small magnitude of the privacy-risk interaction, such safeguards should be viewed as proportionate privacy-support features rather than as evidence that platforms should redesign personalization primarily around perceived privacy risk. Managers could monitor the use of these controls through indicators such as personalization opt-out rates, deletion or pause requests, interaction with explanation features, and privacy-related complaint rates. These indicators would provide a more direct operational signal of user discomfort than relying solely on aggregate engagement metrics.
Recommendation wording also requires calibration. When user preferences are incomplete, the platform should avoid presenting inferred interests as established facts. Expressions such as “You may also wish to consider” or “Based on the preferences selected in this session” communicate both relevance and uncertainty. Ref. [79] found that appropriately hedged recommendation labels can support information autonomy and reduce privacy concern. This approach can preserve recommendation discovery while reducing the impression that the platform is monitoring users beyond the information they knowingly supplied. A/B testing of such labels could compare perceived relevance, explanation use, opt-out behavior, and continuation of the search session, while avoiding the assumption that one disclosure style will be optimal for all users.
Finally, platform evaluation should extend beyond conversion rates. Because the findings associate recommendation responses with positive advocacy and intentions to use the platform more frequently and in the future, managerial dashboards should monitor willingness to recommend, stated reuse intentions, return searches, saved recommendations, and repeated platform sessions. Behavioral indicators such as actual repeat use and switching should be treated as managerial extensions rather than outcomes directly observed in this study. Where longitudinal platform data are available, managers could compare stated reuse intentions with subsequent return sessions, recommendation reuse, booking completion, and switching behavior. This would help distinguish short-term satisfaction with a recommendation from durable platform-level loyalty. Tracking these indicators longitudinally alongside recommendation quality, discovery-related engagement, and privacy-control use would help managers determine whether favorable intentions subsequently correspond with repeated platform behavior.
8. Limitations and Future Research
The cross-sectional design limits claims about temporal ordering. Although the proposed indirect and conditional associations were theoretically specified, the data cannot establish that AI-driven personalization preceded recommendation evaluations or that those evaluations subsequently preceded brand loyalty. Ref. [81] depicted that cross-sectional mediation estimates can differ from longitudinal processes. Future studies should employ panel designs that separate exposure, evaluation, and loyalty across time, or field experiments that vary personalization features while observing later platform use. Accordingly, the present indirect and conditional indirect estimates should be understood as theory-organized statistical associations rather than evidence of temporal mediation or causal transmission.
Two measurement boundaries should also guide interpretation of the findings. Perceived Recommendation Discovery was operationalized through pleasant surprise, unexpected discovery, exposure to previously unconsidered options, and expansion of the range explored. The construct is conceptually informed by the discovery-oriented component of the recommendation-serendipity literature but should not be interpreted as a complete operationalization of serendipity. Broader conceptualizations of serendipity typically combine unexpectedness with relevance or usefulness [12,35], whereas relevance and decision usefulness were assessed separately in the present study through Perceived AI Recommendation Quality. The findings concerning PRD should therefore be interpreted specifically as pertaining to discovery-oriented recommendation experience rather than to the full canonical serendipity construct. Future research could employ measures that explicitly combine unexpectedness with relevance or usefulness and assess whether the identified conditional associations remain consistent. Similarly, the brand-loyalty measure adapted from [33] captured positive advocacy and intended future or more frequent use, but it did not assess first-choice preference, resistance to switching, or actual repeated behavior. Moreover, because brand loyalty was measured in the same survey wave and from the same respondents as the predictor and appraisal constructs, the design does not provide temporal or source separation for this outcome. Longitudinal studies and platform-use records could determine whether these stated intentions subsequently correspond with behavioral loyalty.
The sample was recruited through online travel communities using a nonprobability procedure without a predefined geographical boundary. This approach facilitated access to users with relevant platform experience but does not support statistical generalization to a particular national or global population. As [48] explains, self-selection in online surveys can produce coverage and participation biases even when the final sample is large. The achieved sample should therefore be interpreted as an experience-qualified, self-selected sample rather than a probability-based representation of smart tourism platform users. Because country or region of residence was not collected, the study cannot characterize the geographical composition of the realized sample or examine whether the reported associations vary across national or regional settings. Future studies could employ stratified or quota-based designs across clearly defined national settings and examine whether the measurement and structural relationships remain comparable across countries.
The bilingual administration of the questionnaire was evaluated through multi-group CFA, and the results supported configural and metric measurement invariance across the Arabic- and English-language versions. This supports pooling the two language groups for association-based analyses at the level of factor-structure and loading equivalence. However, scalar invariance was not assessed because latent mean comparisons were outside the scope of the study. Accordingly, the present findings should not be interpreted as establishing cross-language equivalence of latent construct means. Future research specifically interested in Arabic–English mean comparisons should examine scalar invariance before drawing such conclusions.
The broad definition of a smart tourism platform also introduces contextual heterogeneity. Online travel agencies, hotel applications, destination platforms, and generative AI travel assistants differ in their data requirements, recommendation logic, and consumer decision roles. Although all respondents were instructed to anchor their answers to one recently used platform satisfying the study definition, the questionnaire did not record the identity or categorical type of that platform. Platform type therefore cannot be retrospectively reconstructed from the data, and the study cannot determine whether the estimated relationships differ systematically among OTAs, hotel applications, destination platforms, and generative-AI travel assistants. Future studies should record the focal platform and platform category explicitly, replicate the model within clearly bounded platform categories, and compare planning, comparison, booking, and post-purchase stages. Platform-specific studies could also examine whether the relative importance of recommendation quality, discovery, and privacy appraisal changes when the platform controls booking execution, merely supports search, or operates as a conversational travel assistant.
All central constructs were based on respondents’ perceptions and collected from the same questionnaire. Harman’s single-factor test, full-collinearity diagnostics, and the supplementary unmeasured latent method factor analysis did not indicate that the substantive relationships were dominated by a common measurement factor. Nevertheless, the ULMF analysis identified a small amount of shared method-related variance, and no statistical diagnostic can establish the complete absence of same-source bias. The single-source design also prevents direct comparison between subjective recommendation evaluations and objective recommendation characteristics. Subsequent research should combine surveys with recommendation logs, clickstream behavior, booking records, data-control choices, and objective indicators of recommendation accuracy and diversity. Such multi-source designs would permit examination of whether perceived personalization and recommendation quality correspond with observable system behavior rather than relying exclusively on users’ retrospective evaluations.
A further limitation concerns the affective mechanism potentially linking Perceived Recommendation Discovery with brand loyalty. The present model captures whether personalized recommendations generate pleasant surprise, previously unconsidered alternatives, and broader exploration, but it does not measure the emotional response that may follow such discoveries. S–O–R theory allows organismic states to include affective as well as cognitive responses, and prior research suggests that positively unexpected encounters can generate enjoyment, pleasure, happiness, or delight [74,75,76]. Future research should therefore separate the appraisal of discovery from the affective experience it may generate and directly test whether enjoyment or customer delight helps account for the association between recommendation discovery and platform loyalty. One useful extension would be to examine a sequential pathway in which AI-driven personalization is associated with Perceived Recommendation Discovery, discovery is associated with enjoyment or delight, and these affective states are subsequently associated with advocacy and future-use intentions (AIP → PRD → enjoyment/delight → BL). Such a design would clarify whether discovery contributes to loyalty primarily because it expands the consideration set, because it creates a positively valenced experience, or through both processes. Experimental or longitudinal designs would be particularly valuable for establishing whether discovery precedes the affective response and whether that response subsequently predicts platform loyalty, rather than assuming this temporal sequence from cross-sectional associations.
Finally, the primary structural specification focused on linear associations and linear moderation, although supplementary quadratic interaction tests were also conducted to examine whether the conditional personalization associations displayed detectable curvature. These tests did not provide evidence of significant nonlinear moderation in the present data. Nevertheless, nonlinear patterns may emerge under different platform conditions, recommendation intensities, or consumer populations. The value of personalization or recommendation discovery could, for example, become weaker when recommendations are excessively narrow, overly surprising, or perceived as intrusive. The comparatively limited interaction magnitudes also indicate that Need for Cognition and Perceived Privacy Risk are relevant but not comprehensive boundary conditions. Future studies could extend the present curvature assessment using broader ranges of personalization intensity, experimental manipulations, or nonlinear latent-variable specifications; identify latent consumer profiles; and examine whether information transparency or user control is associated with different patterns of recommendation evaluation. They could also compare alternative structural specifications, including sequential rather than parallel appraisal structures, where theory and research design provide a basis for temporal ordering. These extensions would refine the model without assuming that additional variables necessarily improve its explanatory value.
Author Contributions
Conceptualization, H.H.S.A. and B.S.A.-R.; methodology, H.H.S.A. and B.S.A.-R.; software, H.H.S.A. and B.S.A.-R.; validation, H.H.S.A. and B.S.A.-R.; formal analysis, H.H.S.A. and B.S.A.-R.; investigation, H.H.S.A. and B.S.A.-R.; resources, H.H.S.A. and B.S.A.-R.; data curation H.H.S.A. and B.S.A.-R.; writing—original draft preparation, H.H.S.A. and B.S.A.-R.; writing—review and editing, H.H.S.A. and B.S.A.-R.; visualization, H.H.S.A. and B.S.A.-R.; supervision, H.H.S.A. and B.S.A.-R.; project administration, H.H.S.A.; funding acquisition, H.H.S.A. All authors have read and agreed to the published version of the manuscript.
Funding
The authors gratefully acknowledge the Deanship of Scientific Research (DSR) at King Abdulaziz University, Jeddah, Saudi Arabia, for funding this project under grant No. (IPP: 672-209-2026) and for providing technical support.
Institutional Review Board Statement
The study was conducted according to the guidelines of the Declaration of Helsinki and approved by the Scientific Research Ethical Committee of Faculty of Tourism and Hotels—University of Sadat City (date of approval: 26 February 2025).
Informed Consent Statement
Informed consent was obtained from all subjects involved in this study.
Data Availability Statement
Data are available upon request from researchers who meet the eligibility criteria. Kindly contact the first author privately through e-mail.
Conflicts of Interest
The authors declare no conflicts of interest.
Appendix A. Measurement Items
| Variable | Code | English Measurement Item | Arabic Measurement Item | Source |
| AI-Driven Personalization | AIP1 | The AI-enabled smart tourism platform provides travel information and recommendations tailored to my individual preferences. | توفر لي المنصة السياحية الذكية المدعومة بالذكاء الاصطناعي معلومات وتوصيات سفر مصممة بما يتناسب مع تفضيلاتي الفردية. | [54] |
| AIP2 | The platform provides personalized travel suggestions based on my preferences. | تقدم لي المنصة اقتراحات سفر مخصصة استنادًا إلى تفضيلاتي. | ||
| AIP3 | The platform adapts the travel content and recommendations it shows me based on my travel-related preferences and inputs. | تكيّف المنصة محتوى السفر والتوصيات التي تعرضها لي استنادًا إلى تفضيلاتي ومدخلاتي المتعلقة بالسفر. | ||
| AIP4 | The platform adjusts the type of travel content and recommendations displayed according to my user profile. | تعدّل المنصة نوع محتوى السفر والتوصيات المعروضة وفقًا لملفي كمستخدم. | ||
| Perceived Recommendation Discovery (PRD) | PRD1 | The recommendations introduced me to travel or hospitality options I would not have discovered by myself. | عرّفتني التوصيات على خيارات سفر أو ضيافة لم أكن لأكتشفها بنفسي. | [12] |
| PRD2 | The recommendations pleasantly surprised me. | فاجأتني التوصيات بصورة سارة. | ||
| PRD3 | The recommendations introduced me to travel or hospitality options I had not previously considered. | عرّفتني التوصيات على خيارات سفر أو ضيافة لم أكن قد فكرت فيها من قبل. | ||
| PRD4 | The recommendations expanded the range of travel or hospitality options I explored. | وسّعت التوصيات نطاق خيارات السفر أو الضيافة التي قمت باستكشافها. | ||
| PRD5 | The recommendations led me to unexpected travel or hospitality discoveries during my travel search. | قادتني التوصيات إلى اكتشافات غير متوقعة تتعلق بالسفر أو الضيافة أثناء بحثي عن خيارات السفر. | ||
| Perceived AI Recommendation Quality | RAQ1 | The AI recommendations were accurate for my needs. | كانت توصيات الذكاء الاصطناعي دقيقة بما يتناسب مع احتياجاتي. | [14] |
| RAQ2 | The AI recommendations were relevant to my travel decision. | كانت توصيات الذكاء الاصطناعي ذات صلة بقرار السفر الخاص بي. | ||
| RAQ3 | The AI recommendations were useful for comparing travel alternatives. | كانت توصيات الذكاء الاصطناعي مفيدة في مقارنة بدائل السفر المختلفة. | ||
| RAQ4 | The AI recommendations were up to date. | كانت توصيات الذكاء الاصطناعي حديثة ومواكبة للمعلومات الحالية. | ||
| RAQ5 | The recommendations were reliable enough to support my decision. | كانت التوصيات موثوقة بدرجة كافية لدعم قراري. | ||
| Smart Tourism Platform Brand Loyalty | BL1 | I say positive things about this smart tourism platform to others. | أتحدث بصورة إيجابية عن هذه المنصة السياحية الذكية أمام الآخرين. | [33] |
| BL2 | I would like to use this smart tourism platform more often when planning my travel. | أرغب في استخدام هذه المنصة السياحية الذكية بصورة أكثر تكرارًا عند التخطيط لرحلاتي. | ||
| BL3 | I would like to use this smart tourism platform in the future. | أرغب في استخدام هذه المنصة السياحية الذكية في المستقبل. | ||
| Need for Cognition | NFC1 | I would prefer complex to simple problems. | أفضل المشكلات المعقدة على المشكلات البسيطة. | [56] |
| NFC2 | I like to have the responsibility of handling a situation that requires a lot of thinking. | أحب أن أتحمل مسؤولية التعامل مع موقف يتطلب قدرًا كبيرًا من التفكير. | ||
| NFC3 | Thinking is not my idea of fun. (R) | لا أعتبر التفكير نشاطًا ممتعًا بالنسبة لي. (R) | ||
| NFC4 | I would rather do something that requires little thought than something that challenges my thinking abilities. (R) | أفضل القيام بشيء لا يتطلب قدرًا كبيرًا من التفكير على القيام بشيء يتحدى قدراتي على التفكير. (R) | ||
| NFC5 | I really enjoy a task that involves coming up with new solutions to problems. | أستمتع كثيرًا بالمهمة التي تتطلب التوصل إلى حلول جديدة للمشكلات. | ||
| NFC6 | I would prefer a task that is intellectual, difficult, and important to one that is somewhat important but does not require much thought. | أفضل مهمة فكرية وصعبة ومهمة على مهمة لها قدر من الأهمية لكنها لا تتطلب كثيرًا من التفكير. | ||
| Perceived Privacy Risk | PPR1 | There is a high possibility of losing control over my personal information when using this platform. | توجد احتمالية كبيرة لأن أفقد السيطرة على معلوماتي الشخصية عند استخدام هذه المنصة. | [44] |
| PPR2 | My personal information could be misused by this platform. | قد تُساءُ استخدام معلوماتي الشخصية من قِبل هذه المنصة. | ||
| PPR3 | Unauthorized persons could gain access to my personal information when I use this platform. | قد يتمكن أشخاص غير مصرح لهم من الوصول إلى معلوماتي الشخصية عند استخدامي لهذه المنصة. | ||
| PPR4 | The collection of my personal information for personalized recommendations could threaten my privacy. | قد يشكل جمع معلوماتي الشخصية بغرض تقديم توصيات مخصصة تهديدًا لخصوصيتي. | ||
| PPR5 | Overall, using this platform involves significant privacy risks. | بوجه عام، ينطوي استخدام هذه المنصة على مخاطر كبيرة تتعلق بالخصوصية. |
Appendix B. Early–Late Response-Wave Analysis for Potential Nonresponse Bias
| Panel A. Comparison of Study Constructs | ||||||||
| Construct | Early respondents (n = 308) M | SD | Late respondents (n = 308) M | SD | t | p | ||
| AI-driven personalization (AIP) | 3.76 | 0.72 | 3.72 | 0.75 | 0.675 | 0.500 | ||
| Perceived recommendation discovery (PRD) | 3.63 | 0.75 | 3.59 | 0.78 | 0.649 | 0.517 | ||
| Perceived AI recommendation quality (RAQ) | 3.80 | 0.68 | 3.76 | 0.70 | 0.719 | 0.472 | ||
| Smart tourism platform brand loyalty (BL) | 3.85 | 0.74 | 3.80 | 0.77 | 0.822 | 0.412 | ||
| Need for cognition (NFC) | 3.44 | 0.65 | 3.48 | 0.67 | −0.752 | 0.452 | ||
| Perceived privacy risk (PPR) | 2.89 | 0.80 | 2.94 | 0.83 | −0.761 | 0.447 | ||
| Panel B. Comparison of Sample and Platform-Use Characteristics | ||||||||
| Characteristic | χ2 | df | p | |||||
| Gender | 1.490 | 3 | 0.685 | |||||
| Age group | 4.930 | 5 | 0.424 | |||||
| Education | 3.870 | 5 | 0.568 | |||||
| Employment status | 5.440 | 6 | 0.489 | |||||
| Experience using smart tourism platforms | 3.720 | 4 | 0.445 | |||||
| Frequency of smart tourism platform use | 4.710 | 4 | 0.318 | |||||
| Number of trips during the preceding 12 months | 2.960 | 4 | 0.565 | |||||
| Primary travel purpose | 5.120 | 5 | 0.401 | |||||
| Primary purpose of platform use | 6.840 | 7 | 0.446 | |||||
Appendix C. Common Method Bias and Endogeneity Diagnostics
| Panel A. Harman’s Single-Factor Test | ||||||||||||||
| Diagnostic | Result | |||||||||||||
| Total number of measurement indicators | 28 | |||||||||||||
| Number of factors with eigenvalues greater than 1 | 6 | |||||||||||||
| Variance explained by the first unrotated factor (%) | 34.67 | |||||||||||||
| Total variance explained by extracted factors (%) | 69.84 | |||||||||||||
| Emergence of a single dominant factor | No | |||||||||||||
| Panel B. Full-Collinearity VIF Values | ||||||||||||||
| Construct | Full-Collinearity VIF | |||||||||||||
| AI-driven personalization | 1.896 | |||||||||||||
| Perceived Recommendation Discovery | 1.627 | |||||||||||||
| Perceived AI Recommendation Quality | 1.804 | |||||||||||||
| Smart Tourism Platform Brand Loyalty | 2.083 | |||||||||||||
| Need for Cognition | 1.064 | |||||||||||||
| Perceived Privacy Risk | 1.070 | |||||||||||||
| Minimum | 1.064 | |||||||||||||
| Maximum | 2.083 | |||||||||||||
| Panel C. Unmeasured Latent Method Factor Assessment | ||||||||||||||
| Diagnostic | Trait-only model | Trait + method factor model | ||||||||||||
| CFI | 0.951 | 0.959 | ||||||||||||
| TLI | 0.944 | 0.950 | ||||||||||||
| RMSEA | 0.041 | 0.038 | ||||||||||||
| SRMR | 0.040 | 0.033 | ||||||||||||
| Standardized substantive loading range | 0.750–0.896 | 0.733–0.884 | ||||||||||||
| Standardized method-loading range | — | 0.080–0.210 | ||||||||||||
| Mean absolute method loading | — | 0.147 | ||||||||||||
| Average substantive variance (%) | — | 67.3 | ||||||||||||
| Average method-related variance (%) | — | 2.3 | ||||||||||||
| Substantive-to-method variance ratio | — | 29.3:1 | ||||||||||||
| Mean absolute change in substantive loadings | — | 0.012 | ||||||||||||
| Maximum absolute change in substantive loadings | — | 0.017 | ||||||||||||
| Panel D. Gaussian-Copula Endogeneity Assessment | ||||||||||||||
| Potentially Endogenous Predictor | Lilliefors D | Normality p | Copula β | Bootstrap SE | t-value | p-value | 95% LLCI | 95% ULCI | Original BL Path β | Copula-Adjusted BL Path β | ||||
| AIP | 0.083 | <0.001 | −0.031 | 0.025 | 1.240 | 0.215 | −0.080 | 0.018 | 0.210 | 0.203 | ||||
| PRD | 0.071 | <0.001 | 0.016 | 0.021 | 0.762 | 0.446 | −0.025 | 0.057 | 0.310 | 0.305 | ||||
| RAQ | 0.089 | <0.001 | −0.022 | 0.021 | 1.048 | 0.295 | −0.063 | 0.019 | 0.390 | 0.382 | ||||
Appendix D. Cross-Language Measurement Invariance Across Arabic and English Questionnaire Versions
| Model | χ2 | df | CFI | TLI | RMSEA | RMSEA 90% CI | SRMR | Δχ2 | Δdf | p | ΔCFI | ΔRMSEA | ΔSRMR | Conclusion |
| Configural invariance | 1988.70 | 670 | 0.952 | 0.946 | 0.040 | [0.038, 0.042] | 0.041 | — | — | — | — | — | — | Supported |
| Metric invariance | 2020.12 | 692 | 0.951 | 0.947 | 0.039 | [0.037, 0.041] | 0.043 | 31.42 | 22 | 0.088 | −0.001 | −0.001 | 0.002 | Supported |
Appendix E. Supplementary Assessment of Reverse-Worded Items in the Need for Cognition Scale
| Panel A. Inter-Item Correlations after Reverse Coding | |||||||||||||
| Item | NFC1 | NFC2 | NFC3R | NFC4R | NFC5 | NFC6 | |||||||
| NFC1 | 1.000 | ||||||||||||
| NFC2 | 0.560 | 1.000 | |||||||||||
| NFC3R | 0.480 | 0.500 | 1.000 | ||||||||||
| NFC4R | 0.510 | 0.530 | 0.550 | 1.000 | |||||||||
| NFC5 | 0.580 | 0.620 | 0.490 | 0.520 | 1.000 | ||||||||
| NFC6 | 0.540 | 0.570 | 0.470 | 0.500 | 0.590 | 1.000 | |||||||
| Panel B. Supplementary NFC Factor-Structure Assessment | |||||||||||||
| Model | χ2 | df | CFI | TLI | RMSEA | SRMR | Comparison | ||||||
| One-factor NFC model | 20.84 | 9 | 0.996 | 0.993 | 0.033 | 0.021 | Baseline | ||||||
| One-factor model + NFC3R ↔ NFC4R residual covariance | 18.47 | 8 | 0.996 | 0.993 | 0.033 | 0.019 | Δχ2(1) = 2.37, p = 0.124 | ||||||
Appendix F. Supplementary Content and Criterion-Related Validity Assessment
| Panel A. Expert Content-Validity Assessment of the Measurement Instrument | ||||||||||
| Construct | Item | Experts Rating Relevant/Highly Relevant | I-CVI | |||||||
| AI-Driven Personalization | AIP1 | 6/6 | 1.00 | |||||||
| AIP2 | 6/6 | 1.00 | ||||||||
| AIP3 | 5/6 | 0.83 | ||||||||
| AIP4 | 6/6 | 1.00 | ||||||||
| AIP S-CVI/Ave | 0.96 | |||||||||
| Perceived Recommendation Discovery | PRD1 | 6/6 | 1.00 | |||||||
| PRD2 | 5/6 | 0.83 | ||||||||
| PRD3 | 6/6 | 1.00 | ||||||||
| PRD4 | 5/6 | 0.83 | ||||||||
| PRD5 | 6/6 | 1.00 | ||||||||
| PRD S-CVI/Ave | 0.93 | |||||||||
| Perceived AI Recommendation Quality | RAQ1 | 6/6 | 1.00 | |||||||
| RAQ2 | 6/6 | 1.00 | ||||||||
| RAQ3 | 5/6 | 0.83 | ||||||||
| RAQ4 | 5/6 | 0.83 | ||||||||
| RAQ5 | 6/6 | 1.00 | ||||||||
| RAQ S-CVI/Ave | 0.93 | |||||||||
| Smart Tourism Platform Brand Loyalty | BL1 | 6/6 | 1.00 | |||||||
| BL2 | 5/6 | 0.83 | ||||||||
| BL3 | 6/6 | 1.00 | ||||||||
| BL S-CVI/Ave | 0.94 | |||||||||
| Need for Cognition | NFC1 | 6/6 | 1.00 | |||||||
| NFC2 | 6/6 | 1.00 | ||||||||
| NFC3R | 5/6 | 0.83 | ||||||||
| NFC4R | 5/6 | 0.83 | ||||||||
| NFC5 | 6/6 | 1.00 | ||||||||
| NFC6 | 6/6 | 1.00 | ||||||||
| NFC S-CVI/Ave | 0.94 | |||||||||
| Perceived Privacy Risk | PPR1 | 6/6 | 1.00 | |||||||
| PPR2 | 6/6 | 1.00 | ||||||||
| PPR3 | 5/6 | 0.83 | ||||||||
| PPR4 | 6/6 | 1.00 | ||||||||
| PPR5 | 6/6 | 1.00 | ||||||||
| PPR S-CVI/Ave | 0.97 | |||||||||
| Overall instrument | 28 indicators | 19 unanimous; 9 with 5/6 agreement | S-CVI/Ave = 0.95 | |||||||
| Panel B. Supplementary Post Hoc Criterion-Related Assessment of Perceived AI Recommendation Quality | ||||||||||
| Assessment | Criterion/Group | n | RAQ Mean | SD | Statistic | p-value | Effect/Association | |||
| Rank-order association | Frequency of smart tourism platform use | 1232 | — | — | Spearman’s ρ = 0.240 | <0.001 | 0.240 | |||
| Known-groups comparison | Lower-frequency users | 537 | 3.62 | 0.72 | ||||||
| Higher-frequency users | 410 | 3.97 | 0.63 | Welch’s t(927.58) = 7.96 | <0.001 | Cohen’s d = 0.51 | ||||
Appendix G. Supplementary Curvature Tests and Johnson–Neyman Regions of Significance
| Conditional Association | Quadratic Interaction Tested | β | Bootstrap SE | t-Value | p-Value | 95% LLCI | 95% ULCI | J–N Point (SD) | Raw-Scale J–N Point | Region of Significant Conditional Association |
| AIP → RAQ conditional on NFC | AIP × NFC2 → RAQ | 0.018 | 0.019 | 0.947 | 0.344 | −0.019 | 0.055 | −3.03 | 1.46 | NFC > 1.46 within the 1–5 scale |
| AIP → PRD conditional on PPR | AIP × PPR2 → PRD | −0.014 | 0.019 | 0.737 | 0.461 | −0.052 | 0.023 | +3.10 | 5.46 | Significant throughout PPR = 1–5; transition lies above scale maximum |
Figure A1.
Johnson–Neyman Analysis for Need for Cognition in the AIP–RAQ Association.
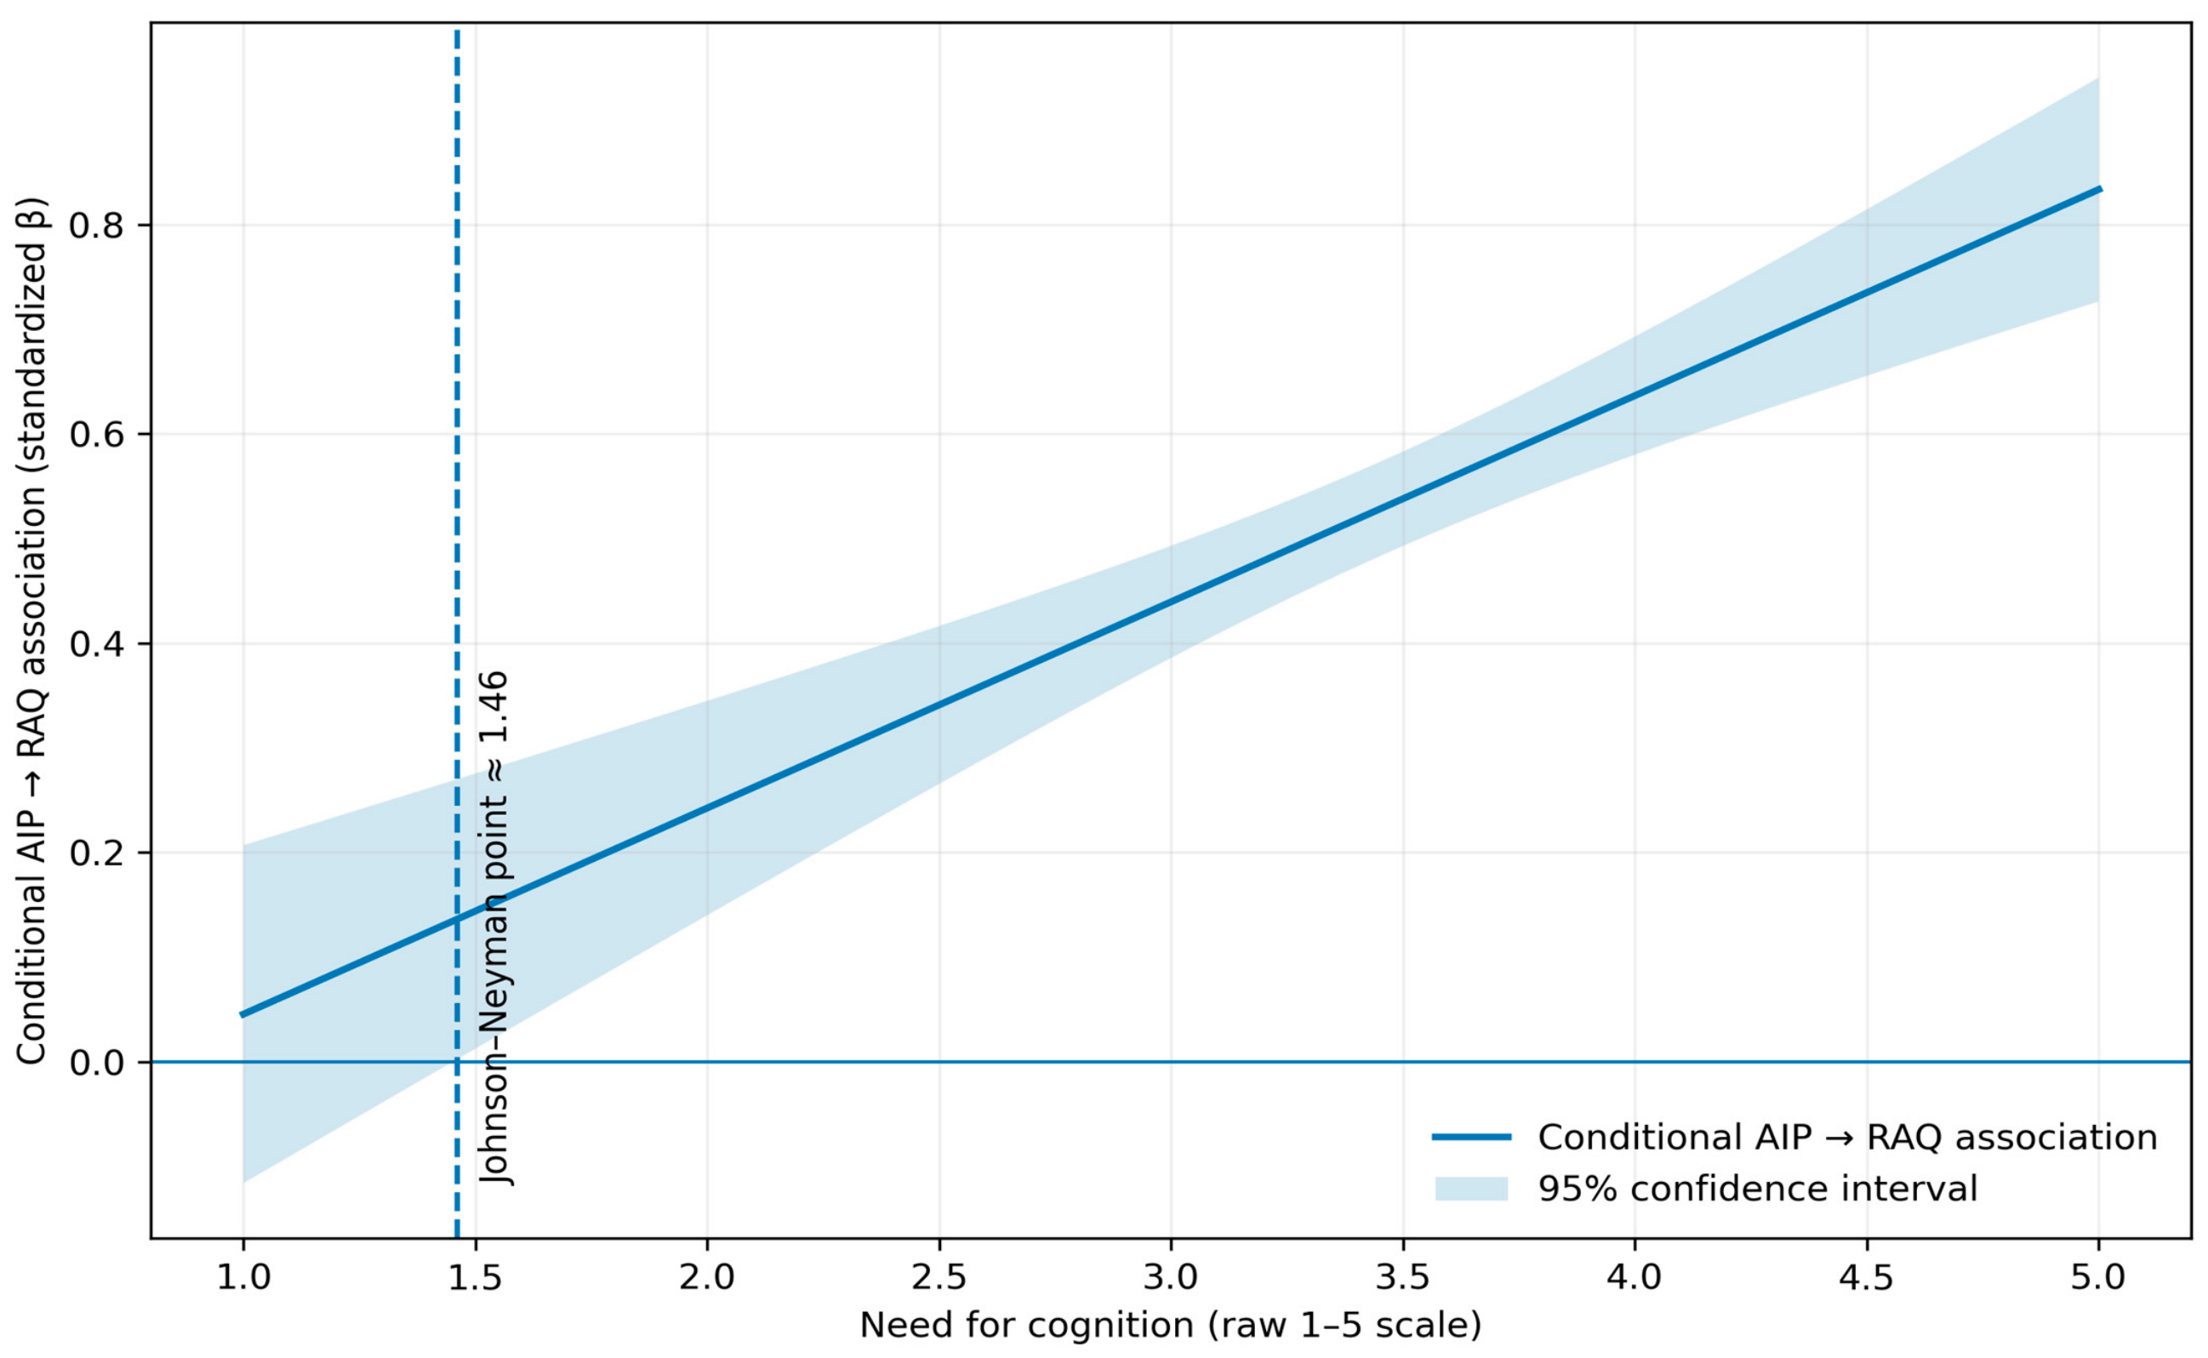
Figure A2.
Johnson–Neyman Analysis for Perceived Privacy Risk in the AIP–PRD Association.
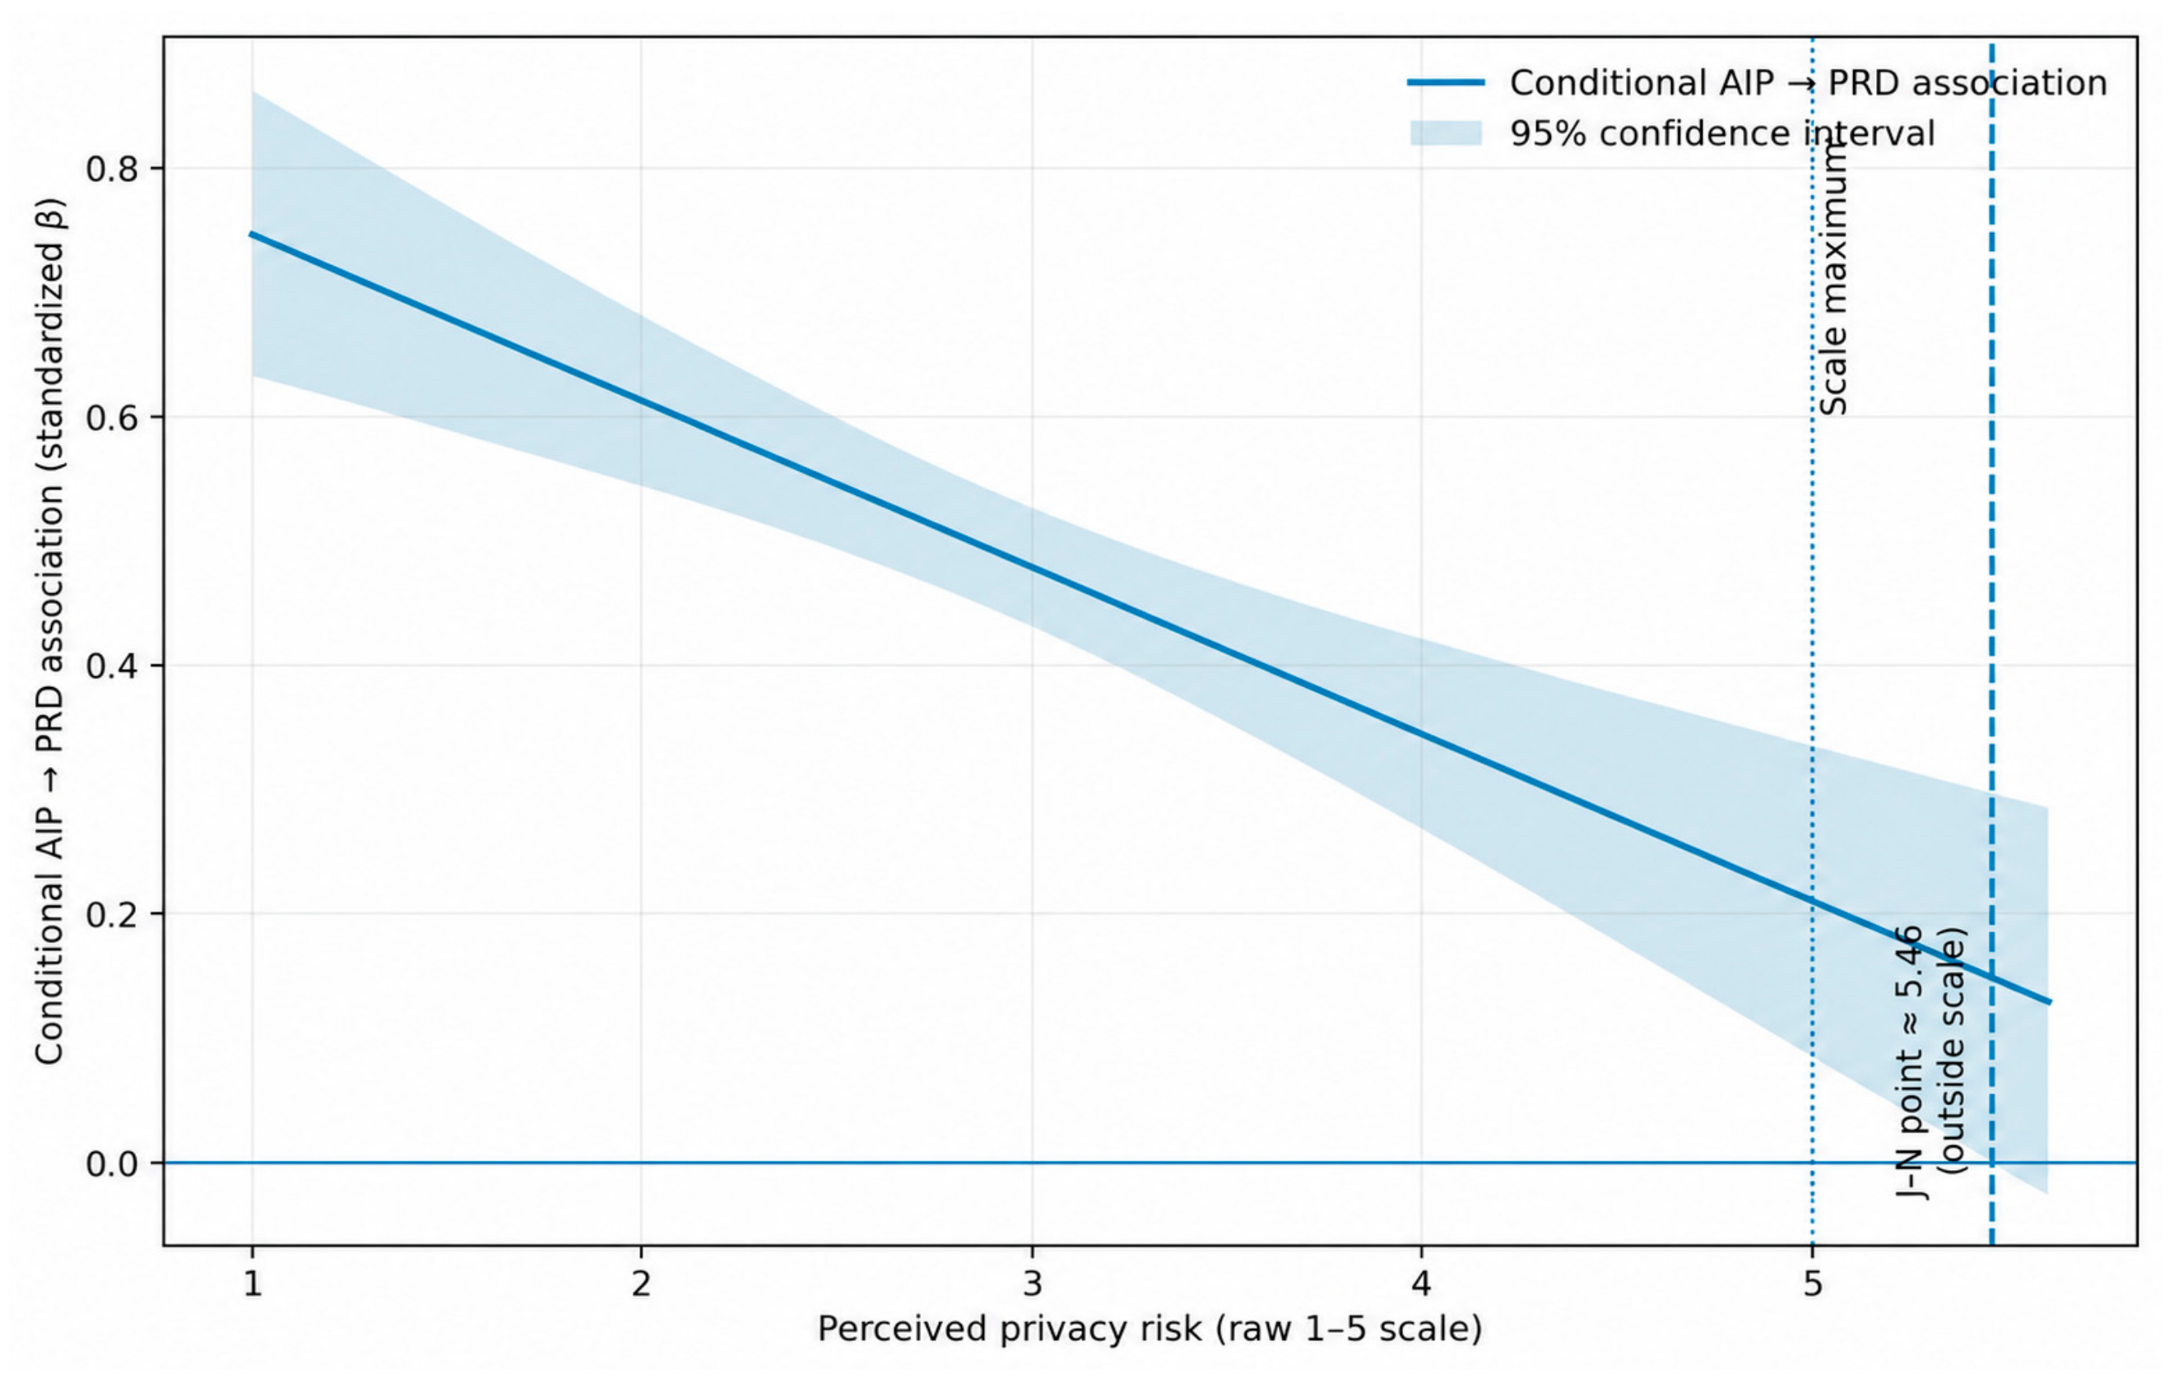
Appendix H. Competing Cross-Moderation Model Assessment
| Panel A. Interaction Terms in the Expanded Competing Model | ||||||||||||||
| Interaction Path | Role in Model | β | Bootstrap SE | t-value | p-value | 95% LLCI | 95% ULCI | f2 | Result | |||||
| AIP × NFC → RAQ | Theorized interaction | 0.127 | 0.023 | 5.522 | <0.001 | 0.081 | 0.173 | 0.024 | Significant | |||||
| AIP × PPR → PRD | Theorized interaction | −0.108 | 0.023 | 4.696 | <0.001 | −0.154 | −0.064 | 0.016 | Significant | |||||
| AIP × NFC → PRD | Cross-interaction | 0.027 | 0.022 | 1.227 | 0.220 | −0.016 | 0.070 | 0.001 | Not significant | |||||
| AIP × PPR → RAQ | Cross-interaction | −0.025 | 0.021 | 1.190 | 0.234 | −0.066 | 0.016 | 0.001 | Not significant | |||||
| Panel B. Explanatory-Power Comparison | ||||||||||||||
| Endogenous Construct | Theorized Model R2 | Expanded Model R2 | ΔR2 | Theorized Model Adjusted R2 | Expanded Model Adjusted R2 | |||||||||
| Perceived recommendation discovery | 0.310 | 0.311 | 0.001 | 0.308 | 0.308 | |||||||||
| Perceived AI recommendation quality | 0.345 | 0.346 | 0.001 | 0.344 | 0.343 | |||||||||
Appendix I. Supplementary CB-SEM Robustness and Competing Structural-Model Assessment
| Panel A. Fit of the Core Theorized CB-SEM Model | ||||||||||||||||||||||||||
| Fit Statistic | Value | |||||||||||||||||||||||||
| χ2 | 648.21 | |||||||||||||||||||||||||
| df | 340 | |||||||||||||||||||||||||
| CFI | 0.958 | |||||||||||||||||||||||||
| TLI | 0.952 | |||||||||||||||||||||||||
| RMSEA | 0.027 | |||||||||||||||||||||||||
| RMSEA 90% CI | [0.024, 0.030] | |||||||||||||||||||||||||
| SRMR | 0.041 | |||||||||||||||||||||||||
| Panel B. Comparison of Core Structural Estimates across PLS-SEM and CB-SEM | ||||||||||||||||||||||||||
| Structural Association | PLS-SEM β | CB-SEM β | CB-SEM SE | t-value | p-value | 95% LLCI | 95% ULCI | Substantive Conclusion | ||||||||||||||||||
| AIP → PRD | 0.490 | 0.478 | 0.023 | 20.783 | <0.001 | 0.433 | 0.523 | Consistent | ||||||||||||||||||
| AIP → RAQ | 0.530 | 0.514 | 0.022 | 23.364 | <0.001 | 0.471 | 0.557 | Consistent | ||||||||||||||||||
| AIP → BL | 0.210 | 0.196 | 0.025 | 7.840 | <0.001 | 0.147 | 0.245 | Consistent | ||||||||||||||||||
| PRD → BL | 0.310 | 0.298 | 0.026 | 11.462 | <0.001 | 0.247 | 0.349 | Consistent | ||||||||||||||||||
| RAQ → BL | 0.390 | 0.376 | 0.025 | 15.040 | <0.001 | 0.327 | 0.425 | Consistent | ||||||||||||||||||
| NFC → RAQ | 0.150 | 0.142 | 0.026 | 5.462 | <0.001 | 0.091 | 0.193 | Consistent | ||||||||||||||||||
| PPR → PRD | −0.180 | −0.169 | 0.024 | 7.042 | <0.001 | −0.216 | −0.122 | Consistent | ||||||||||||||||||
| Panel C. Specific Indirect Associations across Estimation Frameworks | ||||||||||||||||||||||||||
| Specific Indirect Association | PLS-SEM β | CB-SEM β | Bootstrap SE | p-value | 95% LLCI | 95% ULCI | Conclusion | |||||||||||||||||||
| AIP → PRD → BL | 0.152 | 0.142 | 0.017 | <0.001 | 0.111 | 0.177 | Consistent | |||||||||||||||||||
| AIP → RAQ → BL | 0.207 | 0.193 | 0.020 | <0.001 | 0.157 | 0.232 | Consistent | |||||||||||||||||||
| Panel D. Explanatory Power across Estimation Frameworks | ||||||||||||||||||||||||||
| Endogenous Construct | PLS-SEM R2 | CB-SEM R2 | ||||||||||||||||||||||||
| Perceived Recommendation Discovery | 0.310 | 0.295 | ||||||||||||||||||||||||
| Perceived AI Recommendation Quality | 0.345 | 0.326 | ||||||||||||||||||||||||
| Smart Tourism Platform Brand Loyalty | 0.520 | 0.493 | ||||||||||||||||||||||||
| Panel E. Competing CB-SEM Structural Models | ||||||||||||||||||||||||||
| Criterion | Theorized Parallel Model | Serial-Mediation Competitor | Restricted No-Direct-Path Model | |||||||||||||||||||||||
| χ2 | 648.21 | 726.84 | 681.77 | |||||||||||||||||||||||
| df | 340 | 341 | 341 | |||||||||||||||||||||||
| CFI | 0.958 | 0.947 | 0.953 | |||||||||||||||||||||||
| TLI | 0.952 | 0.941 | 0.947 | |||||||||||||||||||||||
| RMSEA | 0.027 | 0.030 | 0.029 | |||||||||||||||||||||||
| RMSEA 90% CI | [0.024, 0.030] | [0.027, 0.033] | [0.026, 0.032] | |||||||||||||||||||||||
| SRMR | 0.041 | 0.053 | 0.048 | |||||||||||||||||||||||
| AIC | 12,542.60 | 12,619.23 | 12,574.16 | |||||||||||||||||||||||
| BIC | 12,911.40 | 12,982.91 | 12,937.84 | |||||||||||||||||||||||
| Δχ2 versus theorized model | — | Not applicable (nonnested) | 33.56 | |||||||||||||||||||||||
| Δdf | — | — | 1 | |||||||||||||||||||||||
| p-value for Δχ2 | — | — | <0.001 | |||||||||||||||||||||||
| Panel F. Structural Estimates for the Serial-Mediation Competitor | ||||||||||||||||||||||||||
| Association | β | Bootstrap SE | t-value | p-value | 95% LLCI | 95% ULCI | ||||||||||||||||||||
| AIP → PRD | 0.478 | 0.023 | 20.783 | <0.001 | 0.433 | 0.523 | ||||||||||||||||||||
| PPR → PRD | −0.169 | 0.024 | 7.042 | <0.001 | −0.216 | −0.122 | ||||||||||||||||||||
| PRD → RAQ | 0.235 | 0.028 | 8.393 | <0.001 | 0.181 | 0.290 | ||||||||||||||||||||
| NFC → RAQ | 0.148 | 0.027 | 5.481 | <0.001 | 0.095 | 0.201 | ||||||||||||||||||||
| RAQ → BL | 0.421 | 0.025 | 16.840 | <0.001 | 0.372 | 0.470 | ||||||||||||||||||||
| AIP → BL | 0.447 | 0.024 | 18.625 | <0.001 | 0.400 | 0.494 | ||||||||||||||||||||
| AIP → PRD → RAQ → BL | 0.047 | 0.007 | 6.714 | <0.001 | 0.034 | 0.063 | ||||||||||||||||||||
Appendix J. Out-of-Sample Predictive Assessment
| Panel A. Indicator-Level PLSpredict Results | |||||||||||||
| Endogenous Construct | Indicator | Q2_predict | PLS-SEM RMSE | LM RMSE | ΔRMSE | PLS-SEM MAE | LM MAE | ΔMAE | |||||
| Perceived Recommendation Discovery | PRD1 | 0.248 | 0.736 | 0.749 | −0.013 | 0.568 | 0.577 | −0.009 | |||||
| PRD2 | 0.272 | 0.702 | 0.710 | −0.008 | 0.542 | 0.548 | −0.006 | ||||||
| PRD3 | 0.223 | 0.758 | 0.755 | 0.003 | 0.586 | 0.582 | 0.004 | ||||||
| PRD4 | 0.291 | 0.688 | 0.700 | −0.012 | 0.527 | 0.535 | −0.008 | ||||||
| PRD5 | 0.257 | 0.721 | 0.731 | −0.010 | 0.554 | 0.562 | −0.008 | ||||||
| Perceived AI Recommendation Quality | RAQ1 | 0.314 | 0.664 | 0.676 | −0.012 | 0.507 | 0.516 | −0.009 | |||||
| RAQ2 | 0.339 | 0.638 | 0.645 | −0.007 | 0.489 | 0.495 | −0.006 | ||||||
| RAQ3 | 0.286 | 0.685 | 0.693 | −0.008 | 0.522 | 0.528 | −0.006 | ||||||
| RAQ4 | 0.326 | 0.651 | 0.659 | −0.008 | 0.496 | 0.503 | −0.007 | ||||||
| RAQ5 | 0.271 | 0.698 | 0.696 | 0.002 | 0.534 | 0.531 | 0.003 | ||||||
| Smart Tourism Platform Brand Loyalty | BL1 | 0.356 | 0.621 | 0.634 | −0.013 | 0.472 | 0.481 | −0.009 | |||||
| BL2 | 0.371 | 0.603 | 0.611 | −0.008 | 0.459 | 0.465 | −0.006 | ||||||
| BL3 | 0.329 | 0.641 | 0.652 | −0.011 | 0.487 | 0.495 | −0.008 | ||||||
| Panel B. Cross-Validated Predictive Ability Test Results | |||||||||||||
| Comparison | PLS-SEM Average Loss | Benchmark Average Loss | Average Loss Difference | t-value | p-value | Predictive Interpretation | |||||||
| PLS-SEM versus indicator-average benchmark | 0.461 | 0.654 | −0.193 | −10.846 | <0.001 | Clear aggregate advantage | |||||||
| PLS-SEM versus linear-model benchmark | 0.461 | 0.472 | −0.011 | −2.731 | 0.007 | Marginal aggregate advantage | |||||||
References
- Buhalis, D.; Law, R. Progress in information technology and tourism management: 20 years on and 10 years after the Internet—The state of eTourism research. Tour. Manag. 2008, 29, 609–623. [Google Scholar] [CrossRef] [Scilit]
- Gretzel, U.; Sigala, M.; Xiang, Z.; Koo, C. Smart tourism: Foundations and developments. Electron. Mark. 2015, 25, 179–188. [Google Scholar] [CrossRef] [Scilit]
- Huang, M.-H.; Rust, R.T. Engaged to a robot? The role of AI in service. J. Serv. Res. 2021, 24, 30–41. [Google Scholar] [CrossRef] [Scilit]
- Tussyadiah, I.P. A review of research into automation in tourism: Launching the Annals of Tourism Research curated collection on artificial intelligence and robotics in tourism. Ann. Tour. Res. 2020, 81, 102883. [Google Scholar] [CrossRef] [Scilit]
- Adomavicius, G.; Tuzhilin, A. Toward the next generation of recommender systems: A survey of the state-of-the-art and possible extensions. IEEE Trans. Knowl. Data Eng. 2005, 17, 734–749. [Google Scholar] [CrossRef] [Scilit]
- Xiao, B.; Benbasat, I. E-commerce product recommendation agents: Use, characteristics, and impact. MIS Q. 2007, 31, 137–209. [Google Scholar] [CrossRef] [Scilit]
- Yang, X.; Zhang, L.; Feng, Z. Personalized tourism recommendations and the E-tourism user experience. J. Travel Res. 2024, 63, 1183–1200. [Google Scholar] [CrossRef] [Scilit]
- Huang, G.Q.I.; Wong, I.K.A.; Zhang, C.J.; Liang, Q. Generative AI inspiration and hotel recommendation acceptance: Does anxiety over lack of transparency matter? Int. J. Hosp. Manag. 2025, 126, 104112. [Google Scholar] [CrossRef] [Scilit]
- Alshiha, A.A. From personalization to loyalty: How generative AI shapes tourist brand loyalty through transparency and trust in smart tourism platforms. J. Theor. Appl. Electron. Commer. Res. 2026, 21, 244. [Google Scholar] [CrossRef] [Scilit]
- Koo, I.; Zaman, U.; Ha, H.; Nawaz, S. Assessing the interplay of trust dynamics, personalization, ethical AI practices, and tourist behavior in the adoption of AI-driven smart tourism technologies. J. Open Innov. Technol. Mark. Complex. 2025, 11, 100455. [Google Scholar] [CrossRef] [Scilit]
- Obiegbu, C.J.; Larsen, G. Algorithmic personalization and brand loyalty: An experiential perspective. Mark. Theory 2025, 25, 199–219. [Google Scholar] [CrossRef] [Scilit]
- Chen, L.; Yang, Y.; Wang, N.; Yang, K.; Yuan, Q. How serendipity improves user satisfaction with recommendations? A large-scale user evaluation. In Proceedings of the World Wide Web Conference; Association for Computing Machinery: New York, NY, USA, 2019; pp. 240–250. [Google Scholar] [CrossRef] [Scilit]
- Kotkov, D.; Wang, S.; Veijalainen, J. A survey of serendipity in recommender systems. Knowl.-Based Syst. 2016, 111, 180–192. [Google Scholar] [CrossRef] [Scilit]
- Wang, R.Y.; Strong, D.M. Beyond accuracy: What data quality means to data consumers. J. Manag. Inf. Syst. 1996, 12, 5–33. [Google Scholar] [CrossRef] [Scilit]
- Cacioppo, J.T.; Petty, R.E.; Kao, C.F. The efficient assessment of need for cognition. J. Personal. Assess. 1984, 48, 306–307. [Google Scholar] [CrossRef] [Scilit] [PubMed]
- Petty, R.E.; Cacioppo, J.T. Communication and Persuasion: Central and Peripheral Routes to Attitude Change; Springer: Berlin/Heidelberg, Germany, 1986. [Google Scholar]
- Aguirre, E.; Mahr, D.; Grewal, D.; de Ruyter, K.; Wetzels, M. Unraveling the personalization paradox: The effect of information collection and trust-building strategies on online advertisement effectiveness. J. Retail. 2015, 91, 34–49. [Google Scholar] [CrossRef] [Scilit]
- Bleier, A.; Eisenbeiss, M. The importance of trust for personalized online advertising. J. Retail. 2015, 91, 390–409. [Google Scholar] [CrossRef] [Scilit]
- Dinev, T.; Hart, P. An extended privacy calculus model for e-commerce transactions. Inf. Syst. Res. 2006, 17, 61–80. [Google Scholar] [CrossRef] [Scilit]
- Mehrabian, A.; Russell, J.A. An Approach to Environmental Psychology; MIT Press: Cambridge, MA, USA, 1974. [Google Scholar]
- Eroglu, S.A.; Machleit, K.A.; Davis, L.M. Atmospheric qualities of online retailing: A conceptual model and implications. J. Bus. Res. 2001, 54, 177–184. [Google Scholar]
- Jacoby, J. Stimulus–organism–response reconsidered: An evolutionary step in modeling (consumer) behavior. J. Consum. Psychol. 2002, 12, 51–57. [Google Scholar] [CrossRef] [Scilit]
- Knijnenburg, B.P.; Willemsen, M.C.; Gantner, Z.; Soncu, H.; Newell, C. Explaining the user experience of recommender systems. User Model. User-Adapt. Interact. 2012, 22, 441–504. [Google Scholar] [CrossRef] [Scilit]
- Pu, P.; Chen, L.; Hu, R. A user-centric evaluation framework for recommender systems. In Proceedings of the Fifth ACM Conference on Recommender Systems; Association for Computing Machinery: New York, NY, USA, 2011; pp. 157–164. [Google Scholar] [CrossRef] [Scilit]
- Cacioppo, J.T.; Petty, R.E. The need for cognition. J. Personal. Soc. Psychol. 1982, 42, 116–131. [Google Scholar] [CrossRef] [Scilit]
- Cacioppo, J.T.; Petty, R.E.; Feinstein, J.A.; Jarvis, W.B.G. Dispositional differences in cognitive motivation: The life and times of individuals varying in need for cognition. Psychol. Bull. 1996, 119, 197–253. [Google Scholar] [CrossRef] [Scilit]
- Ho, S.Y.; Bodoff, D. The effects of Web personalization on user attitude and behavior: An integration of the elaboration likelihood model and consumer search theory. MIS Q. 2014, 38, 497–520. [Google Scholar] [CrossRef] [Scilit]
- Awad, N.F.; Krishnan, M.S. The personalization privacy paradox: An empirical evaluation of information transparency and the willingness to be profiled online for personalization. MIS Q. 2006, 30, 13–28. [Google Scholar] [CrossRef] [Scilit]
- Lee, C.H.; Cranage, D.A. Personalisation–privacy paradox: The effects of personalisation and privacy assurance on customer responses to travel Web sites. Tour. Manag. 2011, 32, 987–994. [Google Scholar] [CrossRef] [Scilit]
- Fan, H.; Poole, M.S. What is personalization? Perspectives on the design and implementation of personalization in information systems. J. Organ. Comput. Electron. Commer. 2006, 16, 179–202. [Google Scholar] [CrossRef] [Scilit]
- Tam, K.Y.; Ho, S.Y. Understanding the impact of web personalization on user information processing and decision outcomes. MIS Q. 2006, 30, 865–890. [Google Scholar] [CrossRef] [Scilit]
- Komiak, S.Y.X.; Benbasat, I. The effects of personalization and familiarity on trust and adoption of recommendation agents. MIS Q. 2006, 30, 941–960. [Google Scholar] [CrossRef] [Scilit]
- Hwang, J.; Choe, J.Y.J.; Kim, H.M.; Kim, J.J. Human baristas and robot baristas: How does brand experience affect brand satisfaction, brand attitude, brand attachment, and brand loyalty? Int. J. Hosp. Manag. 2021, 99, 103050. [Google Scholar] [CrossRef] [Scilit]
- Fakfare, P.; Manosuthi, N.; Lee, J.S.; Han, H.; Jin, M. Exploring the drivers of hospitality and tourism customer loyalty for generative artificial intelligence (AI): A multi-analytic approach. Curr. Issues Tour. 2025. [Google Scholar] [CrossRef] [Scilit]
- Ziarani, R.J.; Ravanmehr, R. Serendipity in recommender systems: A systematic literature review. J. Comput. Sci. Technol. 2021, 36, 375–396. [Google Scholar] [CrossRef] [Scilit]
- Oliver, R.L. Whence consumer loyalty? J. Mark. 1999, 63, 33–44. [Google Scholar] [CrossRef] [Scilit]
- Chaudhuri, A.; Holbrook, M.B. The chain of effects from brand trust and brand affect to brand performance: The role of brand loyalty. J. Mark. 2001, 65, 81–93. [Google Scholar] [CrossRef] [Scilit]
- DeLone, W.H.; McLean, E.R. The DeLone and McLean model of information systems success: A ten-year update. J. Manag. Inf. Syst. 2003, 19, 9–30. [Google Scholar] [CrossRef] [Scilit]
- Wixom, B.H.; Todd, P.A. A theoretical integration of user satisfaction and technology acceptance. Inf. Syst. Res. 2005, 16, 85–102. [Google Scholar] [CrossRef] [Scilit]
- Zeithaml, V.A.; Berry, L.L.; Parasuraman, A. The behavioral consequences of service quality. J. Mark. 1996, 60, 31–46. [Google Scholar] [CrossRef] [Scilit]
- Haugtvedt, C.P.; Petty, R.E.; Cacioppo, J.T. Need for cognition and advertising: Understanding the role of personality variables in consumer behavior. J. Consum. Psychol. 1992, 1, 239–260. [Google Scholar] [CrossRef] [Scilit]
- Yoon, N.; Lee, H.-K. AI recommendation service acceptance: Assessing the effects of perceived empathy and need for cognition. J. Theor. Appl. Electron. Commer. Res. 2021, 16, 1912–1928. [Google Scholar] [CrossRef] [Scilit]
- Preacher, K.J.; Rucker, D.D.; Hayes, A.F. Addressing moderated mediation hypotheses: Theory, methods, and prescriptions. Multivar. Behav. Res. 2007, 42, 185–227. [Google Scholar] [CrossRef] [Scilit] [PubMed]
- Featherman, M.S.; Pavlou, P.A. Predicting e-services adoption: A perceived risk facets perspective. Int. J. Human–Comput. Stud. 2003, 59, 451–474. [Google Scholar] [CrossRef] [Scilit]
- Malhotra, N.K.; Kim, S.S.; Agarwal, J. Internet users’ information privacy concerns (IUIPC): The construct, the scale, and a causal model. Inf. Syst. Res. 2004, 15, 336–355. [Google Scholar] [CrossRef] [Scilit]
- White, T.B.; Zahay, D.L.; Thorbjørnsen, H.; Shavitt, S. Getting too personal: Reactance to highly personalized email solicitations. Mark. Lett. 2008, 19, 39–50. [Google Scholar] [CrossRef] [Scilit]
- Cloarec, J.; Meyer-Waarden, L.; Munzel, A. Transformative privacy calculus: Conceptualizing the personalization-privacy paradox on social media. Psychol. Mark. 2024, 41, 1574–1596. [Google Scholar] [CrossRef] [Scilit]
- Bethlehem, J. Selection bias in web surveys. Int. Stat. Rev. 2010, 78, 161–188. [Google Scholar] [CrossRef] [Scilit]
- Dillman, D.A.; Smyth, J.D.; Christian, L.M. Internet, Phone, Mail, and Mixed-Mode Surveys: The Tailored Design Method, 4th ed.; Wiley: Hoboken, NJ, USA, 2014. [Google Scholar]
- Podsakoff, P.M.; MacKenzie, S.B.; Lee, J.Y.; Podsakoff, N.P. Common method biases in behavioral research: A critical review of the literature and recommended remedies. J. Appl. Psychol. 2003, 88, 879–903. [Google Scholar] [CrossRef] [Scilit] [PubMed]
- Armstrong, J.S.; Overton, T.S. Estimating nonresponse bias in mail surveys. J. Mark. Res. 1977, 14, 396–402. [Google Scholar] [CrossRef] [Scilit]
- Brislin, R.W. Back-translation for cross-cultural research. J. Cross-Cult. Psychol. 1970, 1, 185–216. [Google Scholar] [CrossRef] [Scilit]
- Polit, D.F.; Beck, C.T.; Owen, S.V. Is the CVI an acceptable indicator of content validity? Appraisal and recommendations. Res. Nurs. Health 2007, 30, 459–467. [Google Scholar] [CrossRef] [Scilit] [PubMed]
- Farahat, E. Applications of Artificial Intelligence as a Marketing Tool and Their Impact on the Competitiveness of the Egyptian Tourist Destination. Doctoral Dissertation, Minia University, Minya, Egypt, 2023. [Google Scholar]
- Tam, K.Y.; Ho, S.Y. Web personalization as a persuasion strategy: An elaboration likelihood model perspective. Inf. Syst. Res. 2005, 16, 271–291. [Google Scholar] [CrossRef] [Scilit]
- Coelho, G.L.d.H.; Hanel, P.H.P.; Wolf, L.J. The very efficient assessment of need for cognition: Developing a six-item version. Assessment 2020, 27, 1870–1885. [Google Scholar] [CrossRef] [Scilit] [PubMed]
- Hair, J.F.; Hult, G.T.M.; Ringle, C.M.; Sarstedt, M. A Primer on Partial Least Squares Structural Equation Modeling (PLS-SEM), 3rd ed.; Sage: New York, NY, USA, 2022. [Google Scholar]
- Shmueli, G.; Sarstedt, M.; Hair, J.F.; Cheah, J.H.; Ting, H.; Vaithilingam, S.; Ringle, C.M. Predictive model assessment in PLS-SEM: Guidelines for using PLSpredict. Eur. J. Mark. 2019, 53, 2322–2347. [Google Scholar] [CrossRef] [Scilit]
- Harman, H.H. Modern Factor Analysis, 3rd ed.; University of Chicago Press: Chicago, IL, USA, 1976. [Google Scholar]
- Kock, N. Common method bias in PLS-SEM: A full collinearity assessment approach. Int. J. e-Collab. 2015, 11, 1–10. [Google Scholar]
- Richardson, H.A.; Simmering, M.J.; Sturman, M.C. A tale of three perspectives: Examining post hoc statistical techniques for detection and correction of common method variance. Organ. Res. Methods 2009, 12, 762–800. [Google Scholar]
- Fornell, C.; Larcker, D.F. Evaluating structural equation models with unobservable variables and measurement error. J. Mark. Res. 1981, 18, 39–50. [Google Scholar] [CrossRef] [Scilit]
- Henseler, J.; Ringle, C.M.; Sarstedt, M. A new criterion for assessing discriminant validity in variance-based structural equation modeling. J. Acad. Mark. Sci. 2015, 43, 115–135. [Google Scholar] [CrossRef] [Scilit]
- Chen, F.F. Sensitivity of goodness of fit indexes to lack of measurement invariance. Struct. Equ. Model. Multidiscip. J. 2007, 14, 464–504. [Google Scholar] [CrossRef] [Scilit]
- Park, S.; Gupta, S. Handling endogenous regressors by joint estimation using copulas. Mark. Sci. 2012, 31, 567–586. [Google Scholar] [CrossRef] [Scilit]
- Hult, G.T.M.; Hair, J.F., Jr.; Proksch, D.; Sarstedt, M.; Pinkwart, A.; Ringle, C.M. Addressing endogeneity in international marketing applications of partial least squares structural equation modeling. J. Int. Mark. 2018, 26, 1–21. [Google Scholar] [CrossRef] [Scilit]
- Becker, J.M.; Proksch, D.; Ringle, C.M. Revisiting Gaussian copulas to handle endogenous regressors. J. Acad. Mark. Sci. 2022, 50, 46–66. [Google Scholar] [CrossRef] [Scilit]
- Preacher, K.J.; Hayes, A.F. Asymptotic and resampling strategies for assessing and comparing indirect effects in multiple mediator models. Behav. Res. Methods 2008, 40, 879–891. [Google Scholar] [CrossRef] [Scilit] [PubMed]
- Spiller, S.A.; Fitzsimons, G.J.; Lynch, J.G., Jr.; McClelland, G.H. Spotlights, floodlights, and the magic number zero: Simple effects tests in moderated regression. J. Mark. Res. 2013, 50, 277–288. [Google Scholar] [CrossRef] [Scilit]
- Hayes, A.F. An index and test of linear moderated mediation. Multivar. Behav. Res. 2015, 50, 1–22. [Google Scholar] [CrossRef] [Scilit] [PubMed]
- Liengaard, B.D.; Sharma, P.N.; Hult, G.T.M.; Jensen, M.B.; Sarstedt, M.; Hair, J.F.; Ringle, C.M. Prediction: Coveted, yet forsaken? Introducing a cross-validated predictive ability test in partial least squares path modeling. Decis. Sci. 2021, 52, 362–392. [Google Scholar] [CrossRef] [Scilit]
- Sharma, P.N.; Liengaard, B.D.; Hair, J.F.; Sarstedt, M.; Ringle, C.M. Predictive model assessment and selection in composite-based modeling using PLS-SEM: Extensions and guidelines for using CVPAT. Eur. J. Mark. 2023, 57, 1662–1677. [Google Scholar] [CrossRef] [Scilit]
- Zhang, H.; Zhao, L.; Gupta, S. The role of online product recommendations on customer decision making and loyalty in social shopping communities. Int. J. Inf. Manag. 2018, 38, 150–166. [Google Scholar] [CrossRef] [Scilit]
- Oliver, R.L.; Rust, R.T.; Varki, S. Customer delight: Foundations, findings, and managerial insight. J. Retail. 1997, 73, 311–336. [Google Scholar] [CrossRef] [Scilit]
- Kim, A.; Affonso, F.M.; Laran, J.; Durante, K.M. Serendipity: Chance encounters in the marketplace enhance consumer satisfaction. J. Mark. 2021, 85, 141–157. [Google Scholar] [CrossRef] [Scilit]
- De Gemmis, M.; Lops, P.; Semeraro, G.; Musto, C. An investigation on the serendipity problem in recommender systems. Inf. Process. Manag. 2015, 51, 695–717. [Google Scholar] [CrossRef] [Scilit]
- Bol, N.; Dienlin, T.; Kruikemeier, S.; Sax, M.; Boerman, S.C.; Strycharz, J.; Helberger, N.; de Vreese, C.H. Understanding the effects of personalization as a privacy calculus: Analyzing self-disclosure across health, news, and commerce contexts. J. Comput.-Mediat. Commun. 2018, 23, 370–388. [Google Scholar] [CrossRef] [Scilit]
- Duan, H.; Dawod, A.Y.; Wan, G. The personalization paradox in AI-driven tourism e-commerce: Psychological reactance, threat-substitution, and the moderating role of privacy concerns. J. Theor. Appl. Electron. Commer. Res. 2026, 21, 127. [Google Scholar] [CrossRef] [Scilit]
- Lv, L.; Chen, S.; Liu, G.G.; Chen, M. Alleviating travelers’ privacy concern in personalized recommendations through perceived information autonomy: Strategies via hedge words and communication styles. J. Travel Res. 2025, 64, 1974–1988. [Google Scholar] [CrossRef] [Scilit]
- Wang, W.; Benbasat, I. Recommendation agents for electronic commerce: Effects of explanation facilities on trusting beliefs. J. Manag. Inf. Syst. 2007, 23, 217–246. [Google Scholar] [CrossRef] [Scilit]
- Maxwell, S.E.; Cole, D.A. Bias in cross-sectional analyses of longitudinal mediation. Psychol. Methods 2007, 12, 23–44. [Google Scholar] [CrossRef] [Scilit] [PubMed]
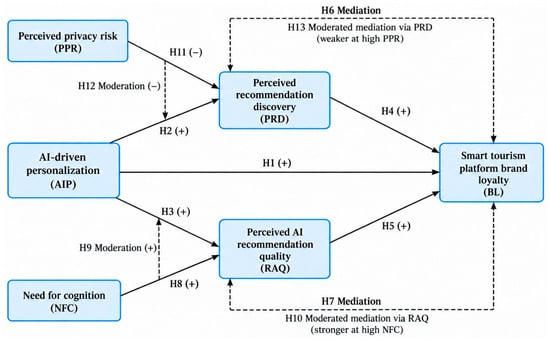
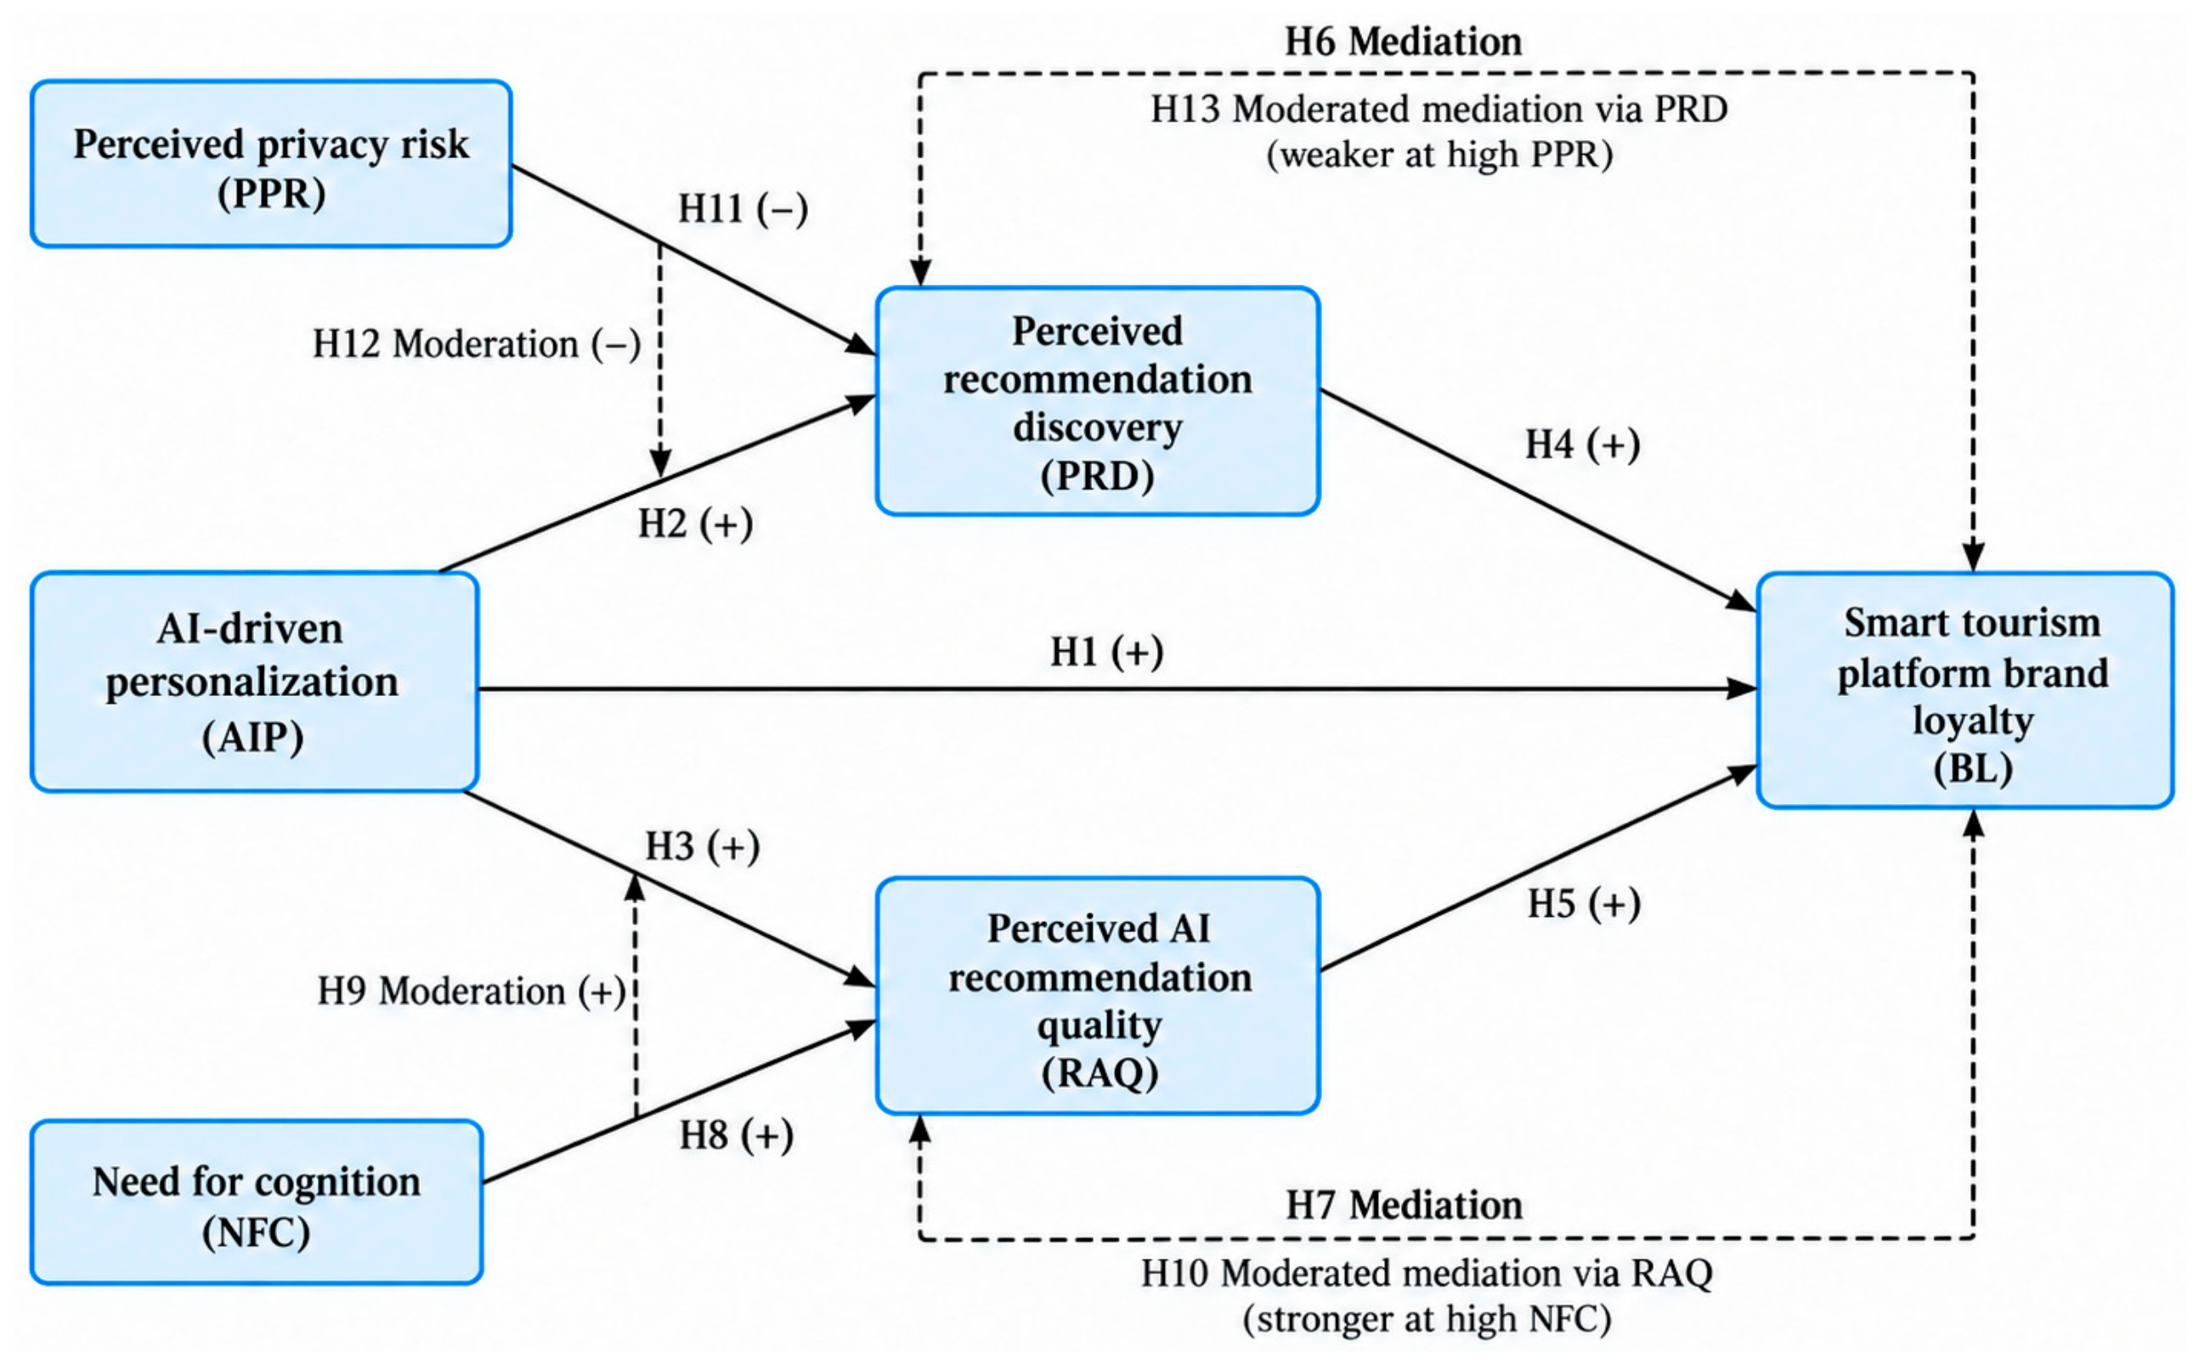
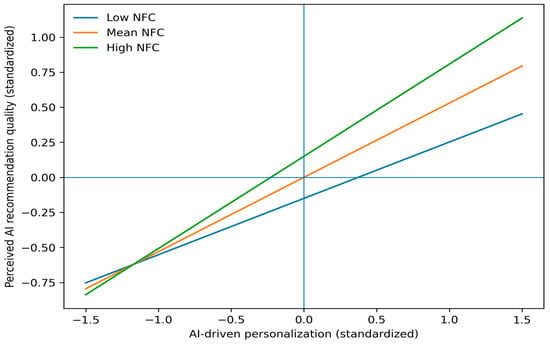
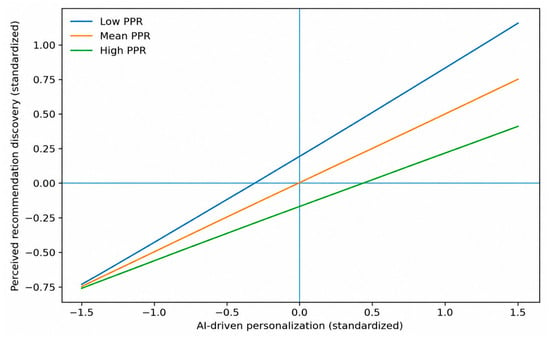

Disclaimer/Publisher’s Note: The statements, opinions and data contained in all publications are solely those of the individual author(s) and contributor(s) and not of MDPI and/or the editor(s). MDPI and/or the editor(s) disclaim responsibility for any injury to people or property resulting from any ideas, methods, instructions or products referred to in the content. |
© 2026 by the authors. Licensee MDPI, Basel, Switzerland. This article is an open access article distributed under the terms and conditions of the Creative Commons Attribution (CC BY) license.