


Abstract
In the Cerrado, phosphorus (P) availability is limited inter alia by the chemical characteristics of the soil. This study aimed to evaluate the effects of different sources and rates of phosphate fertilizers on P dynamics, soybean productivity, and plant nutrition in Glycine max cultivated in a Yellow Oxisol of the Maranhão Cerrado. Two experiments were conducted in a randomized complete block design during the 2021/2022 growing season. The first experiment followed a 5 × 3 factorial design, with five P sources (one control and four corrective sources) and three soil sampling depths. The second experiment used the corrective fertilization history of the areas from the first study as the first factor and three P2O5 rates applied at sowing as the second factor, with three replications. In the soil, Fe-bound P (P-Fe), Ca-bound P (P-Ca), Al-bound P (P-Al), and available P were evaluated; in the plant, grain yield, thousand-grain weight, total dry matter, and P concentration in leaves, grains, and the whole plant were determined. An interaction between P sources and soil depths was observed for P-Fe and P-Ca (0–0.10 > 0.10–0.20 > 0.20–0.40 m), indicating low vertical mobility of P in the soil profile. In addition, increasing P2O5 rates raised P contents in the soil and plant tissues across all treatments. For the Itafós source, soil P increased from 2.66 to 4.22 mg kg−1 at 0.0 and 120.0 kg ha−1 of P2O5, respectively, which resulted in a marked increase in soybean grain yield, rising from 1484.93 kg ha−1 at 0.0 kg ha−1 to 3418.60 kg ha−1 at 120.0 kg ha−1 of P2O5, highlighting the importance of adequate phosphate fertilization for agricultural systems in Cerrado soils. P-Al showed a positive correlation with soil available P, whereas P-Fe was correlated with the treatments TSP10, TSP0, and Itafós20.
1. Introduction
The Brazilian Cerrado is the second largest biome in Brazil in terms of territorial extent (2,045,064 km2) [1,2], with a significant presence in several states, such as Bahia, Maranhão, and Piauí in northeastern Brazil, which, together with the state of Tocantins, form the agricultural frontier popularly known as MATOPIBA.
In these areas, agriculture has shown steady growth, particularly for crops such as soybean (Glycine max (L.) Merrill), maize (Zea mays), cotton (Gossypium hirsutum L.), and rice (Oryza sativa L.) [1]. This agricultural development in the region results from the adoption of technologies and management practices aimed at increasing productivity [3], including rational soil use, improvements in nutrient availability, and enhanced efficiency of nutrient uptake by plants.
Among the crops grown in the Cerrado region, Glycine max currently occupies approximately 23 million hectares [4], consolidating its position as the main agricultural crop in terms of cultivated area. For this crop to reach its maximum yield potential, the adoption of appropriate management practices and the selection of fertilizer sources that enhance nutrient availability to plants are essential.
Phosphorus (P) is an essential chemical element for plant nutrition, directly contributing to energy supply, growth, and increased crop productivity [5,6]. Its role is associated with participation in fundamental physiological processes, such as energy transfer through the adenosine triphosphate (ATP) molecule, as well as carbohydrate and lipid metabolism [7,8].
Due to its importance and considering the characteristics of Cerrado soils, which are generally acidic and have a high capacity for P fixation, the annual application of phosphate fertilizers is required [9,10] to meet crop demands and maintain adequate P levels in the soil. In soils, P is mainly associated with minerals of the clay fraction, such as iron (Fe), aluminum (Al), and calcium (Ca) oxides and hydroxides. Electrochemical factors, including soil pH, cation exchange capacity (CEC), and clay mineralogy, directly influence adsorption reactions and the availability of this nutrient to plants [11].
Phosphorus loss through fixation is one of the main factors affecting crop productivity in the Cerrado [12]. Therefore, it is essential to identify fertilizer sources that exhibit lower soil fixation and higher agronomic efficiency, especially in highly weathered soils such as those of the Cerrado.
Soil P availability, considered one of the most limiting nutrients in the Cerrado region, is strongly affected by edaphic conditions [13,14], mainly due to rapid adsorption by soil colloids, followed by specific adsorption processes that render it unavailable to plants [15,16]. In soils, P may occur in both inorganic forms (calcium, iron, and aluminum phosphates) and organic forms (phospholipids, nucleotides, among others), the latter being gradually mineralized through microbial activity.
Overall, the low utilization efficiency of mineral phosphate fertilizers has a direct impact on production costs for crops such as Glycine max, as fertilizers account, on average, for approximately 30% of total production costs [17]. In addition, fertilizer performance varies according to region, soil type, and climatic conditions [18]. Consequently, the use of alternative fertilizer sources, such as natural and reactive phosphates or organomineral fertilizers, has been adopted as a strategy to improve P or P2O5 availability in Cerrado soils [16].
In agronomic research, phosphorus rates are conventionally expressed as P2O5, following fertilizer labeling standards and soil fertility recommendation manuals widely adopted in agricultural practice and scientific studies [8,9,10]. This standardization facilitates comparisons among phosphate sources with different chemical compositions and solubilities, while the applied rates correspond to equivalent amounts of elemental phosphorus (P), ensuring consistency in the evaluation of fertilizer performance under Cerrado soil conditions.
According to the Ministry of Agriculture, Livestock and Supply (MAPA) [19], natural phosphate fertilizers are obtained through the direct grinding of phosphate rock, involving only physical treatments to enhance field performance. These fertilizers must contain a minimum of 5% P2O5, of which approximately 15% should be soluble in citric acid. In contrast, reactive phosphate fertilizers are produced by grinding the rock, combined with chemical treatments aimed at increasing efficiency relative to natural phosphate fertilizers. These products must have a minimum P2O5 content of 27%, with at least 30% of the total P2O5 being soluble in citric acid.
The use of natural and reactive phosphate fertilizers has emerged as a viable alternative to the high market prices per kilogram of P2O5, an important factor to consider in corrective and maintenance phosphorus fertility management in Cerrado areas of Brazil. This is due to the high P sorption capacity of iron and aluminum oxides, which reduces P availability to crops in soils of the region. This study is based on the hypothesis that reactive natural phosphate fertilizers are effective in meeting the nutritional requirements and promoting the productivity of Glycine max grown in Cerrado soils.
In this context, this study aimed to evaluate the effects of phosphate fertilizer sources and rates on soil P dynamics, nutritional status, and productivity of Glycine max in the Maranhão Cerrado, located in northeastern Brazil.
2. Materials and Methods
2.1. Characterization of the Experimental Area
The study was conducted under field conditions in an experimental area of the Brazilian Agricultural Research Corporation (EMBRAPA), located at Penitente Range in Tasso Fragoso (8°33′29.49″ S, 46°05′19.67″ W), in the southern region of the state of Maranhão, Brazil. According to the Köppen climate classification, the regional climate is tropical Aw, characterized as hot and humid, with a mean annual temperature ranging from 23 to 31 °C.
The study region is located within the Cerrado biome, in an ecotonal area influenced by the Caatinga and the Legal Amazon biomes. The region has a mean annual rainfall of approximately 1200 mm, with precipitation concentrated between November and March. The soil of the study area is classified as dystrophic Yellow Oxisol, characterized as deep, well-drained, acidic, and of low natural fertility, with mineralogy dominated by kaolinite and iron and aluminum oxides in varying proportions. The results of the routine soil fertility analysis are shown in Table 1.
Table 1.
Chemical characterization of dystrophic Yellow Oxisol at the depths of 0–0.10, 0.10–0.20, 0.20–0.30, and 0.30–0.40 m in the Maranhão Cerrado, Brazil.
The soil at the experimental site has a medium-textured classification, with 613.00 g kg−1 of sand, 126.00 g kg−1 of silt, and 261.00 g kg−1 of clay in the 0–0.10 m layer. The levels of micronutrients and soil texture are shown in Table 2.
Table 2.
Levels of micronutrients and soil texture of dystrophic Yellow Oxisol at the depths of 0–0.10, 0.10–0.20, 0.20–0.30, and 0.30–0.40 m in the Maranhão Cerrado, Brazil.
2.2. Description of the Treatments
The study comprised two stages, arranged in a randomized complete block design with three replications. The first stage evaluated the effects of P sources used in corrective phosphate fertilization, broadcast-applied during the 2012/2013 and 2016/2017 growing seasons, on soil P dynamics (Al-bound P, Fe-bound P, Ca-bound P, and available P) at the depths of 0.00–0.10, 0.10–0.20, and 0.20–0.40 m. The experiment followed a 5 × 3 factorial design. The first factor consisted of one control and four P sources used for corrective soil phosphating: control (Control–0 kg P2O5), single superphosphate (SSP–200 kg ha−1 P2O5), triple superphosphate (TSP–200 kg ha−1 P2O5), Bayovar reactive natural phosphate (Bayovar–200 kg ha−1 P2O5), and Itafós reactive natural phosphate (Itafós–200 kg ha−1 P2O5), all broadcast-applied in the 2012/2013 and 2016/2017 growing seasons. The second factor corresponded to three soil sampling depths (0.00–0.10, 0.10–0.20, and 0.20–0.40 m). The history of soil acidity correction and corrective phosphate fertilization is presented in Table 3, according to established recommendations [9].
Table 3.
Periods of soil acidity correction and corrective phosphate fertilization in dystrophic Yellow Oxisol of the Maranhão Cerrado, Brazil.
The plots measured 60 m2, with dimensions of 10 m in length and 6 m in width, and a harvestable area of 16.2 m2 per experimental plot, comprising 6 m in length and 2.7 m in width. All treatments were replicated in three blocks, totaling 45 experimental units.
The second stage of the study evaluated the effects of phosphate fertilizer sources and rates applied at sowing on soil P availability and on the growth parameters, nutritional status, and productivity of Glycine max. The experiment was arranged in a 5 × 3 factorial design, with the first factor consisting of the areas from the first study with a history of corrective phosphate fertilization (Control–0 kg ha−1 P2O5; SSP–200 kg ha−1 P2O5; TSP–200 kg ha−1 P2O5; Bayovar–200 kg ha−1 P2O5; and Itafós–200 kg ha−1 P2O5), and the second factor consisting of three P rates applied at sowing or for maintenance fertilization, band-applied in the seeding row (0, 60, and 120 kg P2O5 ha−1), with three replications.
The fertilizers used for corrective and maintenance (or at-sowing) phosphate fertilization had the following characteristics: single superphosphate (SSP; 18% P2O5, 16% calcium (Ca), and 10% sulfur (S), with P determined as P2O5 soluble in neutral ammonium citrate (NAC) plus water, and at least 24% of the P2O5 soluble in water); triple superphosphate (TSP; 41% P2O5, 10% Ca, with P determined by NAC, and a minimum of 36% of P2O5 soluble in water) [19]; Bayovar reactive phosphate (29.5% P2O5, 32% Ca, with 2% solubility in citric acid and at least 14.2% total solubility) [20]; and Itafós reactive phosphate (24.7% P2O5, 33.2% CaO, with 5.45% solubility in citric acid) [21].
2.3. Evaluation of Phosphorus Dynamics in Soil Based on Phosphate Fertilizer Sources
For the evaluation of P-Al, P-Fe, P-Ca, and available P (Mehlich-1) levels in the first study, soil samples were collected during the 2021/2022 growing season (March–April), after the harvest of Glycine max, from the depths of 0–0.10, 0.10–0.20, and 0.20–0.40 m. Initially, in each cultivated plot, three subsamples were systematically collected from the central area of each plot, using a trench opening, at the respective soil depths, to compose one composite sample per replication. (one sample from each trench). In total, 15 composite soil samples were collected per depth, totaling 45 samples across the three soil depths.
Soil analyses were performed at the Soil Analysis Center of the Federal University of Piauí (UFPI), located in Bom Jesus, Piauí, Brazil. Initially, the soil samples were air-dried, gently disaggregated, and passed through a 2 mm mesh sieve. In each soil sample, pH in water was determined at 1:2.5 ratio; exchangeable acidity (Al3+) was extracted with 1 mol L−1 KCl and quantified by titration with 0.025 mol L−1 sodium hydroxide; and potential acidity (H + Al) was determined by titration.
Phosphorus was extracted using Mehlich-1 and determined by colorimetry. Calcium (Ca2+) and magnesium (Mg2+) were extracted with 1 mol L−1 KCl and determined by atomic absorption spectrophotometry. Zinc (Zn2+), manganese (Mn2+), and copper (Cu2+) were extracted using Mehlich-1. The soil particle-size distribution was also determined in each sample using the pipette method [22]. Both the soil chemical fertility parameters and particle-size analysis were determined according to [23].
Phosphorus fractionation was performed according to the method proposed by Chang and Jackson [24], which separates P fractions bound to aluminum (P-Al), extracted with 0.5 mol L−1 NH4F at pH 8.2; P bound to iron (P-Fe), extracted with 0.1 mol L−1 NaOH; and P bound to calcium (P-Ca), extracted with 0.5 mol L−1 H2SO4. After the extraction of P-Al and P-Fe, the residual soil was centrifuged twice with 1 mol L−1 NaCl, and the supernatant was discarded. Phosphorus concentrations in the extracts were determined by spectrophotometry using the method of Murphy and Riley [25]. This method is based on the formation of a blue phosphomolybdate complex in a sulfuric medium, using ascorbic acid as the reducing agent. Analytical calibration curves were obtained using reference solutions prepared by serial dilution of a standard solution containing 1000 mg L−1 P.
2.4. Evaluation of the Effects of Phosphate Fertilizer Sources and Rates Applied at Sowing on the Growth, Nutritional Status, and Productivity of Glycine max
To evaluate the effects on plant traits and productivity, the following variables were assessed: grain yield (GY), thousand-grain weight (TGW), shoot dry matter (SDM), and P concentrations in the whole plant (P-Pl), leaves (P-Fl), and grains (P-G).
Soybean grain yield (GY) was determined by harvesting and weighing the usable area of each plot, consisting of six central rows, 6 m in length, totaling 16.2 m2, with border rows discarded. Thousand-grain weight (TGW) was estimated by counting and weighing 300 grains, followed by extrapolation to 1000 grains. Shoot dry matter (SDM) was determined from plants collected from 1 m of row per plot, which were oven-dried at 60 °C for 72 h and subsequently weighed. The P concentrations in the whole plant (P-Pl), leaves (P-Fl), and grains (P-G), as well as available soil P, were determined following the recommended procedures for grain and plant tissue analysis, using dry ashing in a muffle furnace and determination by the vanadate–molybdate yellow method using spectrophotometry [26].
2.5. Statistical Analyses of Soil and Plant Parameters as Affected by Phosphate Fertilizer Sources and Rates
The data were subjected to analysis of variance using the SISVAR statistical analysis system. Treatment means were compared using the Scott–Knott test at a 5% probability level. For the P-Al variables, data were transformed using the square root of (Y + 1.0).
To assess the similarity among treatments (sources, depths, and application rates), a cluster analysis was performed using the UPGMA method (Unweighted Pair-Group Method with Arithmetic Mean), based on the formation of homogeneous groups [27]. Subsequently, principal component analysis (PCA) was employed as an exploratory analysis with the aim of identifying environmental gradients and the variables responsible for most of the observed variations, reducing the number of dependent variables without substantial loss of information, and exploring the correlations between the evaluated attributes. All multivariate analyses were conducted in R software version 4.3.1 [28], using the FactoMineR package (v2.13) [29].
The PCA was performed using the treatment means for each variable included in the analysis. These means were organized into a standardized matrix (z-score), and the analysis was conducted based on the correlation matrix. This approach allowed us to synthesize the overall multivariate pattern among treatments, reduce data dimensionality, and highlight the principal axes explaining the greatest proportion of variability.
3. Results
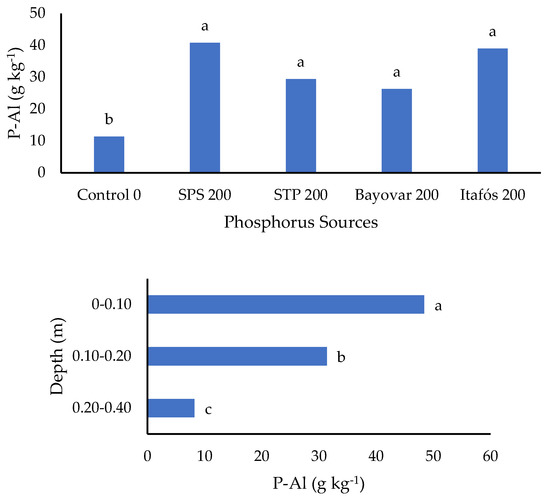
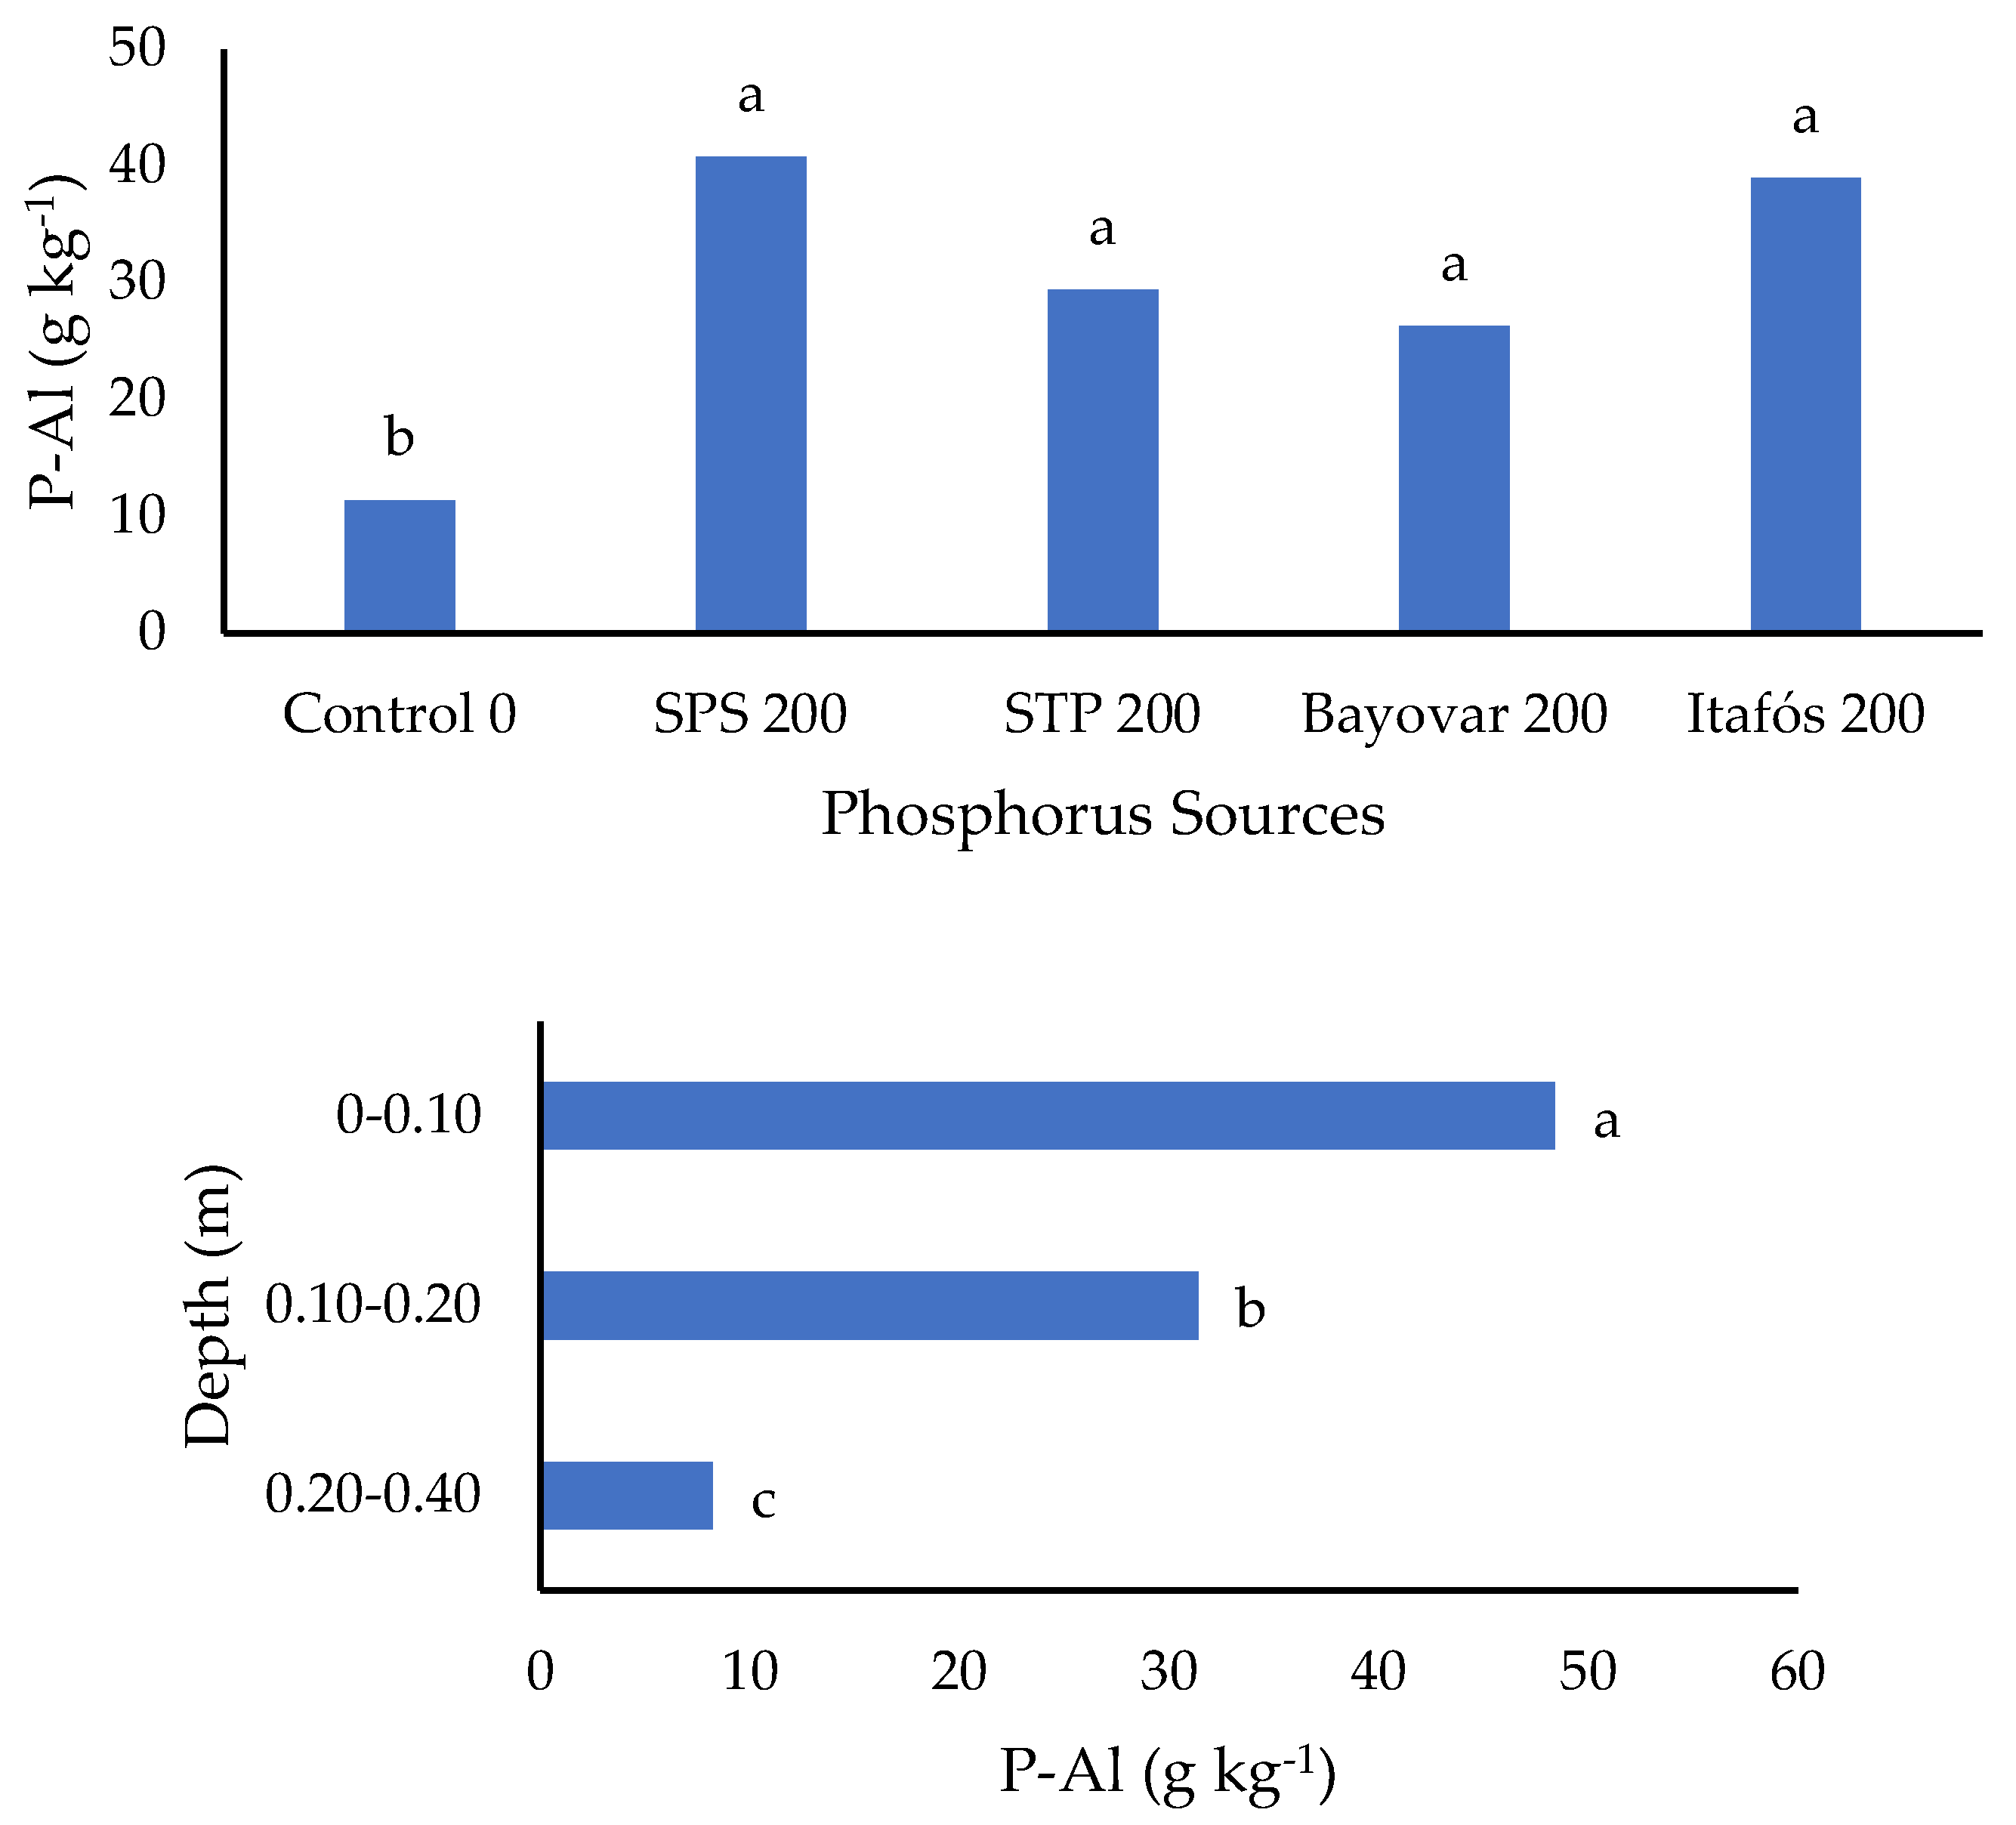
The P sources used for corrective phosphate fertilization, as well as the soil depths evaluated, resulted in significant differences in soil P dynamics. For Al-bound P (P-Al), independent effects of fertilizer sources and soil depths were observed, with concentrations decreasing along the profile (0–0.10 > 0.10–0.20 > 0.20–0.40 m) (Figure 1). In contrast, for Fe-bound P (P-Fe), significant interactions between P sources and soil depths were detected (Table 4). For Ca-bound P (P-Ca), the data did not meet the assumptions of normality, which limited the detection of significant effects and requires a more cautious interpretation, for which a detailed explanation is provided in the subsequent sections.
Figure 1.
Individual effects of phosphorus sources used in corrective phosphate fertilization and soil depths on Al-bound P (P-Al) contents in dystrophic Yellow Oxisol of the Maranhão Cerrado under Glycine max cultivation. Control 0.0: Control (0.0 kg ha−1 P2O5); SPS–200: single superphosphate (200.0 kg ha−1 P2O5); STP–200: triple superphosphate (200.0 kg ha−1 P2O5); Bayovar–200: Bayovar reactive natural phosphate (200.0 kg ha−1 P2O5); Itafós–200: Itafós reactive natural phosphate (200.0 kg ha−1 P2O5), applied in the 2012/2013 and 2016/2017 growing seasons. Means followed by the same letter do not differ according to the Scott–Knott test at the 5% probability level.
Table 4.
Effects of the interaction between phosphorus sources used in corrective phosphate fertilization and soil depths on Fe-bound P (P-Fe) and Ca-bound P (P-Ca) contents in dystrophic Yellow Oxisol of the Maranhão Cerrado under Glycine max cultivation.
Phosphorus sources increased Fe-bound P (P-Fe) contents compared with the control (Control–0.0); however, no significant differences among sources were observed at the 0–0.10 and 0.10–0.20 m soil depths (Table 4). With increasing soil depth, P-Fe contents decreased (0–0.10 > 0.10–0.20 > 0.20–0.40 m) for the SSP–200 and Itafós–200 treatments, and followed the pattern (0–0.10 > 0.10–0.20 = 0.20–0.40 m) for the TSP–200 treatment and (0–0.10 = 0.10–0.20 > 0.20–0.40 m) for the Bayovar–200 treatment.
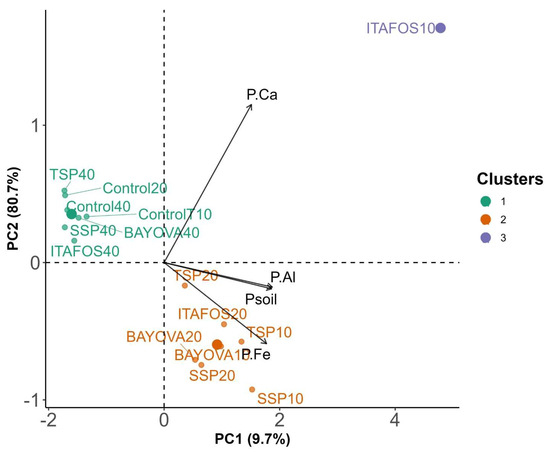
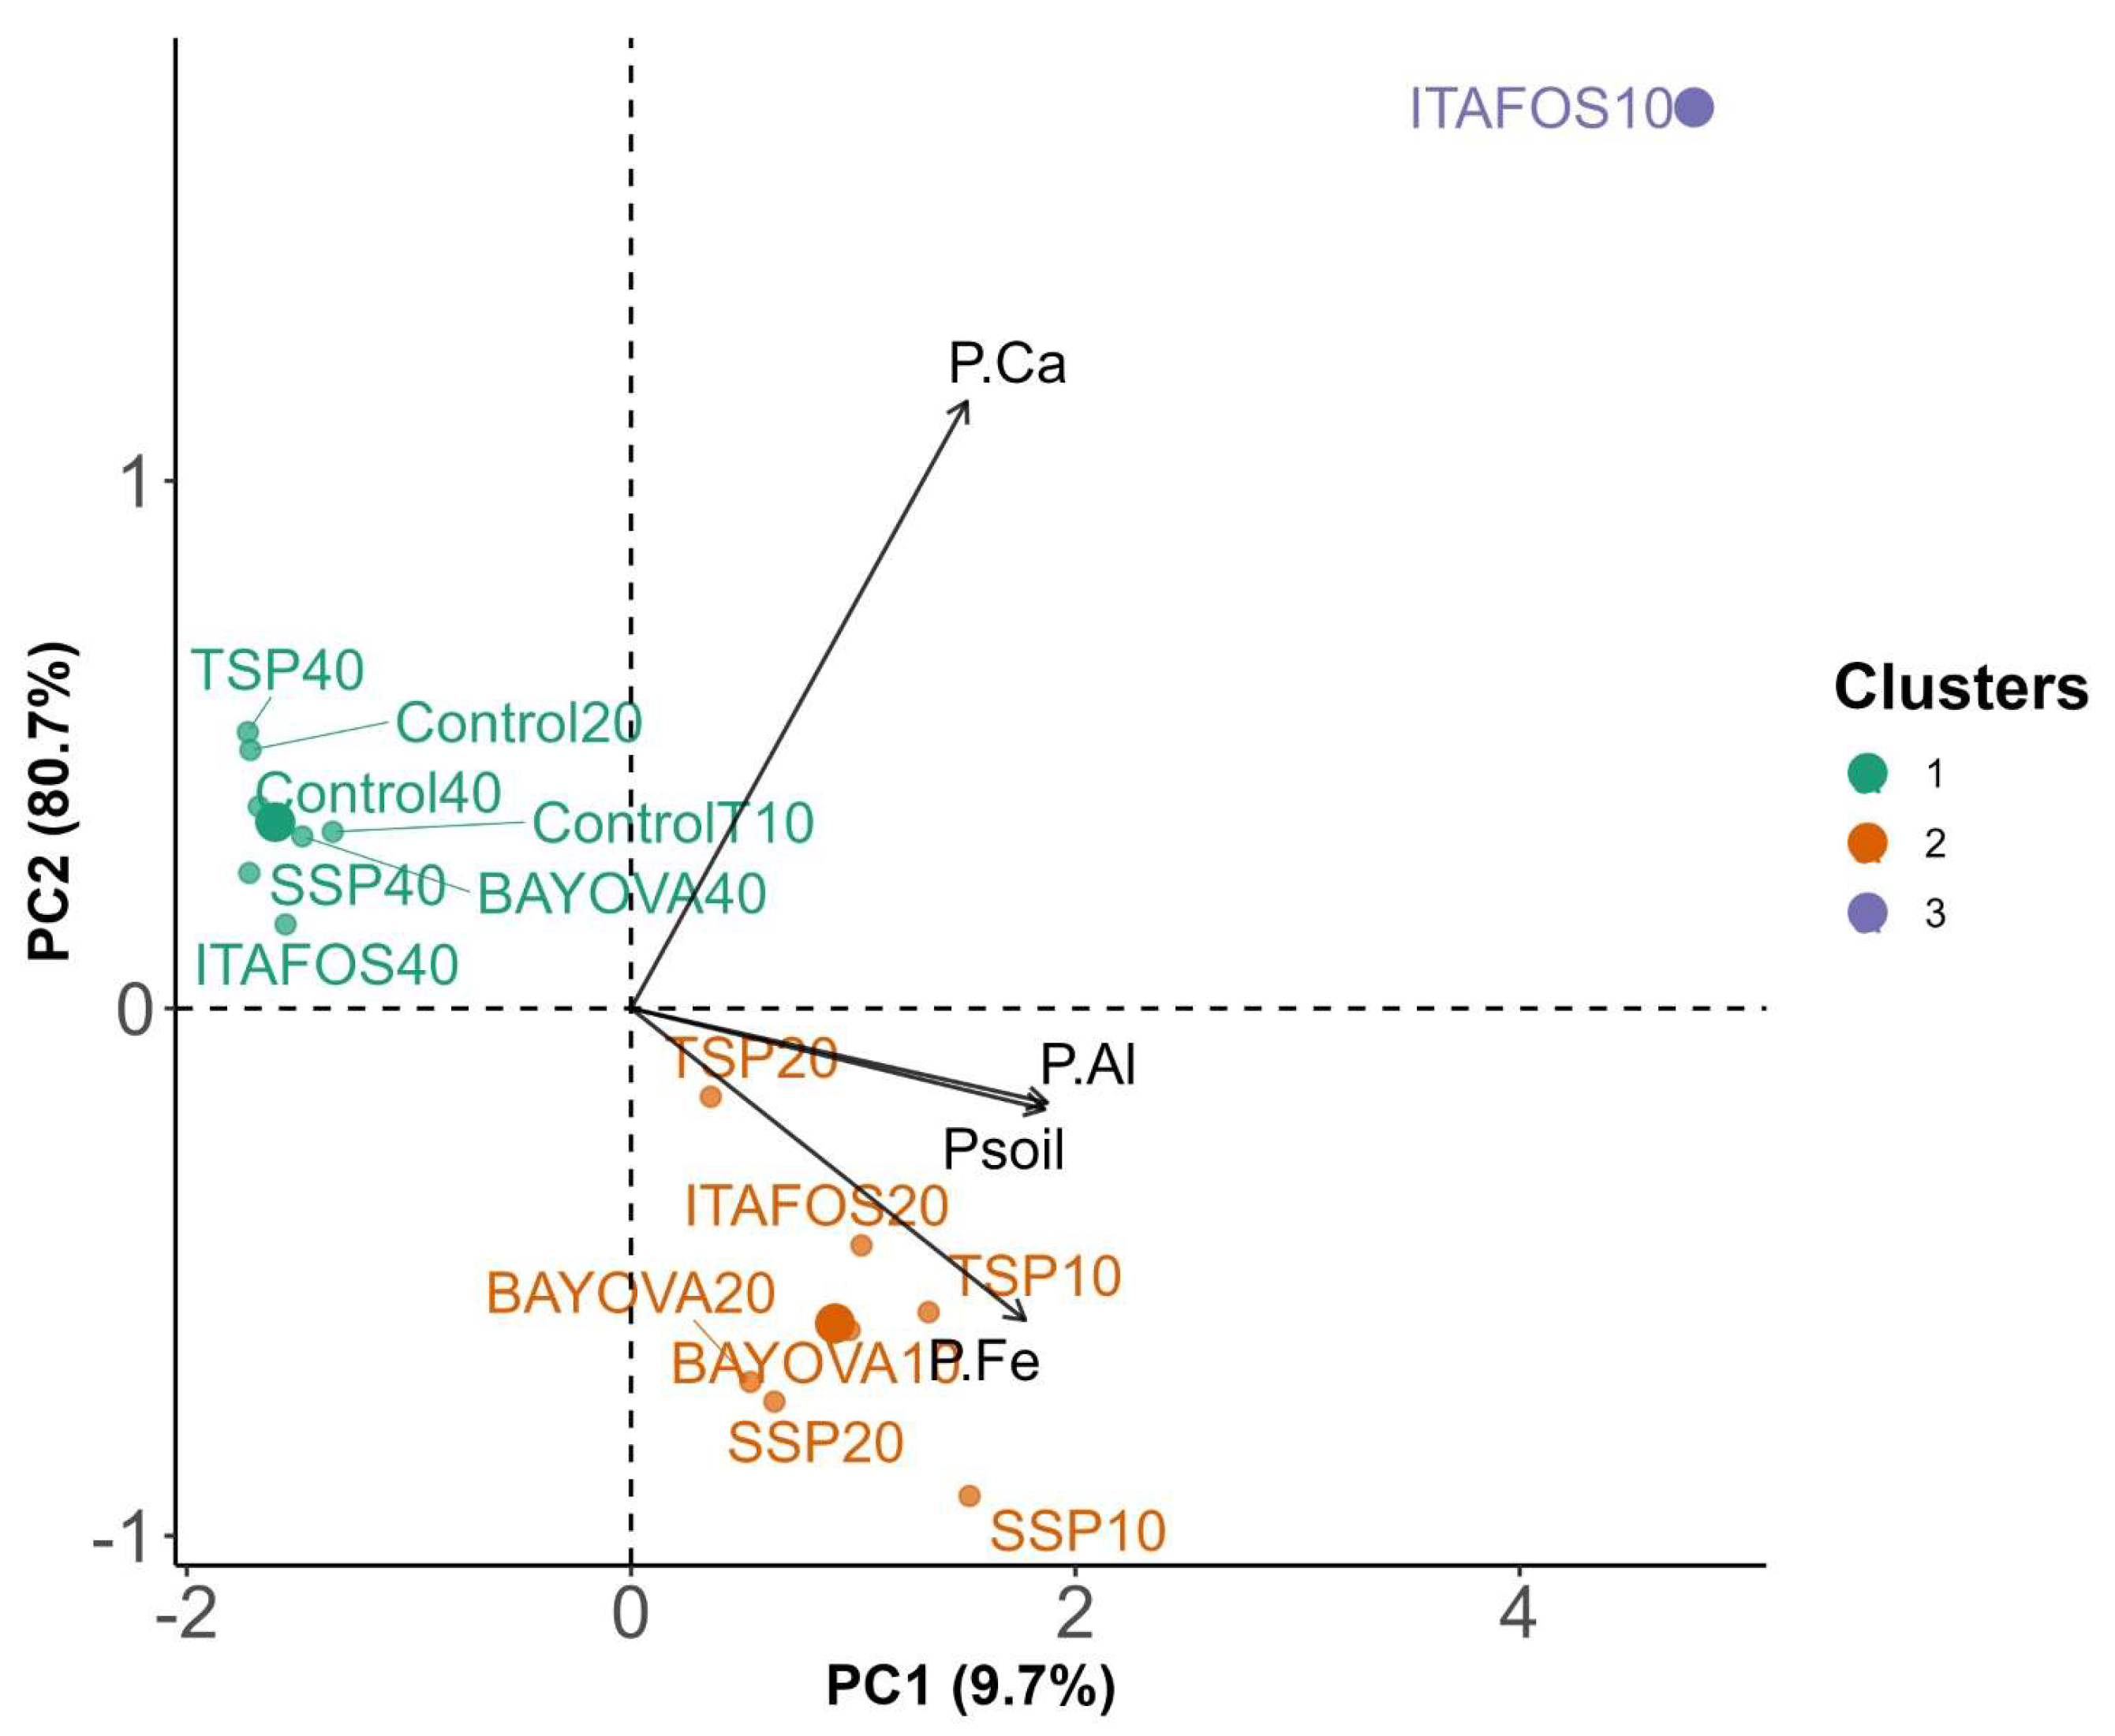
Principal component analysis (PCA) explained 97.7% of the total variation in the evaluated data, and the treatments were grouped into three clusters by cluster analysis (Figure 2). Group 1 consisted of the treatments TSP40, SSP40, Bayovar40, and Itafós40, which were negatively correlated with the phosphate fractions and clustered together with the treatments Control 10, 20, and 40. Group 2 comprised the treatments TSP10 and TSP20, Itafós20, Bayovar10 and Bayovar20, and SSP10 and SSP20, which showed a positive correlation with Fe-bound P (P.Fe). The Ca-bound P fraction (P.Ca) showed a stronger association with the Itafós10 treatment. Available P exhibited a high correlation with Al-bound P (P.Al). The variables P-Al, available P, and P-Fe were associated with the treatments forming Group 2.
Figure 2.
Principal component analysis of phosphorus sources and soil depths and their relationship with available phosphorus (Psoil), iron-bound phosphorus (P.Fe), calcium-bound phosphorus (P.Ca), and aluminum-bound phosphorus (P.Al) in dystrophic Yellow Oxisol of the Maranhão Cerrado, Brazil. Control10: Control depth 0–0.10 m, Control20: control depth 0.10–0.20 m, Control40: control depth 0.20–0.40 m; SSP10: SSP depth 0–0.10 m, SSP20: SSP depth 0.10–0.20 m, SSP40: SSP depth 0.20–0.40 m; TSP10: TSP depth 0–0.10 m, TSP20: TSP depth 0.10–0.20 m, TSP40: TSP depth 0.20–0.40 m; Bayovar10: Bayovar depth 0–0.10 m, Bayovar20: Bayovar depth 0.10–0.20 m, Bayovar40: Bayovar depth 0.20–0.40 m; Itafós10: Itafós depth 0–0.10 m, Itafós20: Itafós depth 0.10–0.20 m, Itafós40: Itafós depth 0.20–0.40 m.
The sources and rates of P also influenced the levels of available P in the soil, in the plant, leaves, grains, and productive parameters of G. max (Table 5).
Table 5.
Effects of the interaction between phosphorus sources and rates applied as maintenance phosphate fertilization on soil phosphorus contents (0–0.10 m layer), plant, leaf, and grain phosphorus concentrations, and yield-related parameters of Glycine max grown in dystrophic Yellow Oxisol previously subjected to corrective phosphate fertilization in the Maranhão Cerrado, Brazil.
Overall, increasing P2O5 rates in maintenance fertilization promoted a marked increase in grain yield (GY), shoot dry matter (SDM), and P concentrations in the different plant compartments and in the soil (Table 5). The absence of maintenance fertilization (0 kg ha−1) resulted in the lowest values for all evaluated variables, with a mean yield below 1600 kg ha−1, highlighting the natural P limitation of soils in the region. From the maintenance rate of 60 kg ha−1 P2O5 onward, a substantial increase in grain yield was observed, exceeding 3000 kg ha−1 for the most efficient sources, particularly Itafós, which also showed the highest soil P contents (58.76 mg dm−3).
At the highest maintenance rate (120 kg ha−1 P2O5), grain yield stabilized, with no significant differences among sources, indicating a possible saturation of crop demand. However, the Bayovar and Itafós sources maintained the highest soil P contents (above 70 mg dm−3), suggesting a more gradual release of the nutrient and favoring a residual effect for subsequent crops.
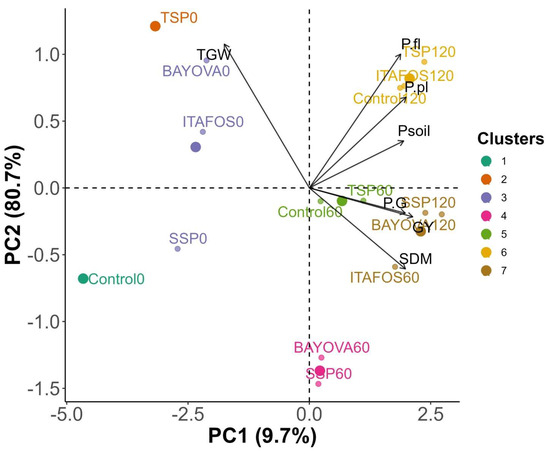
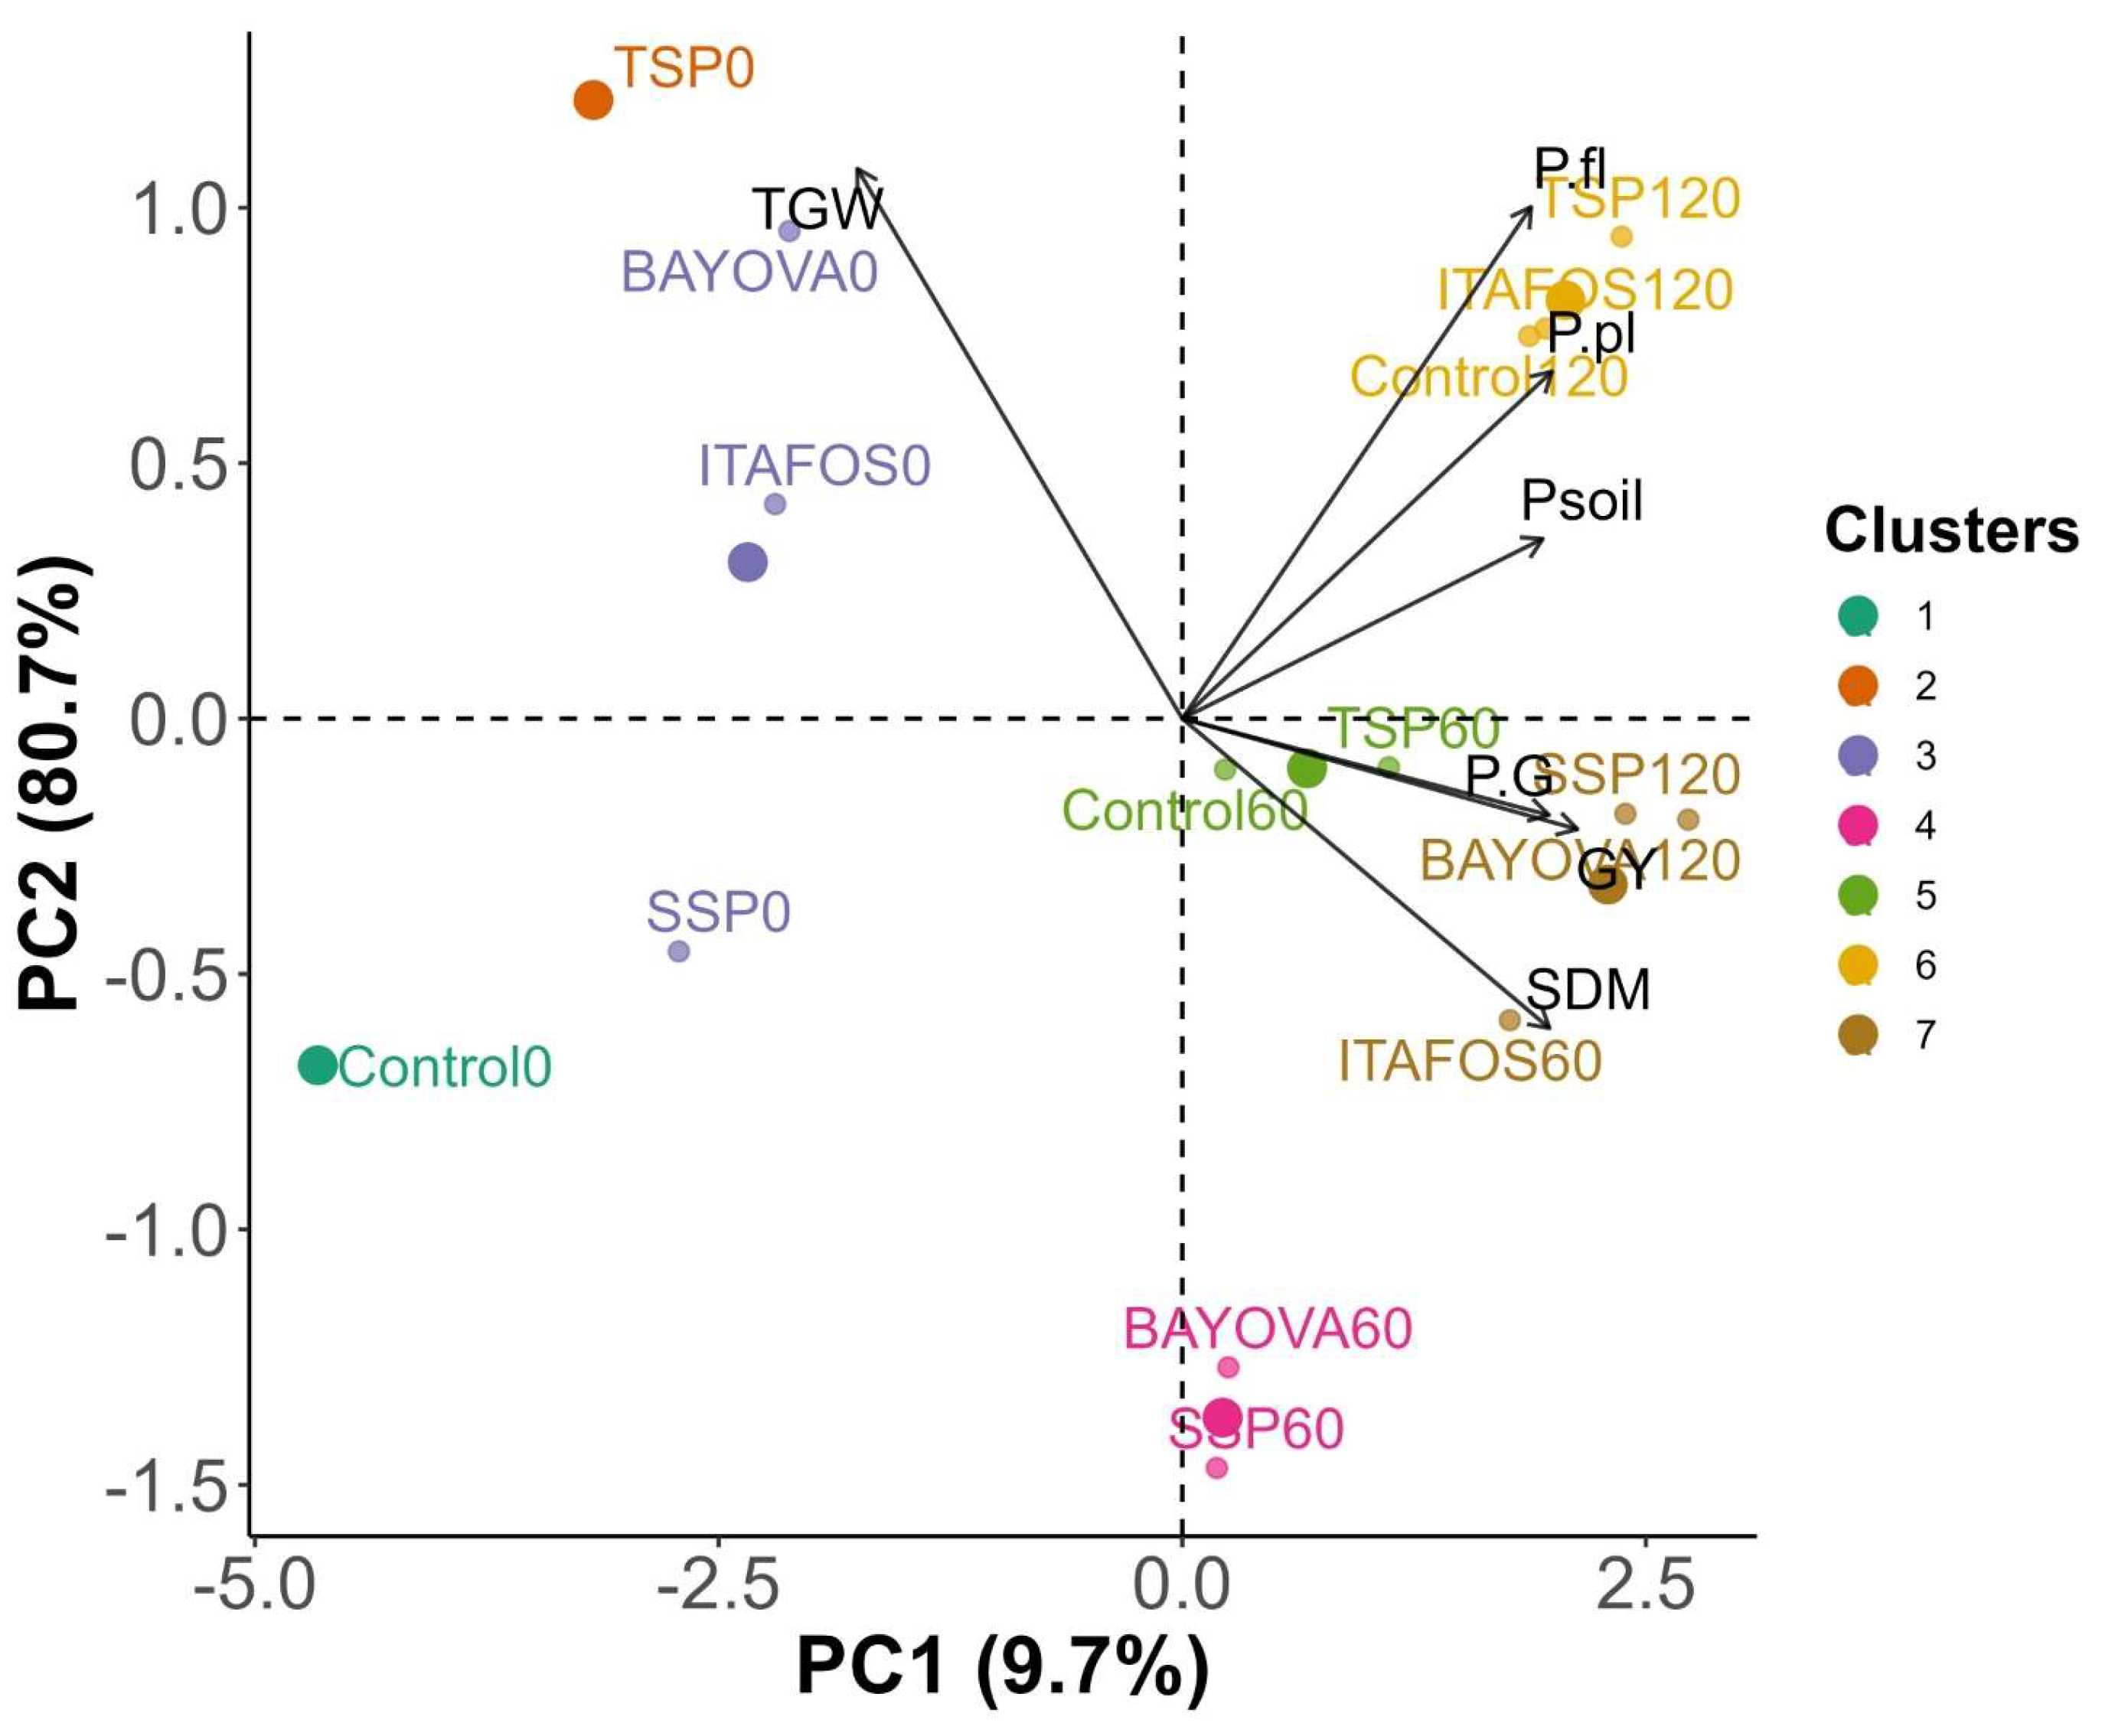
Principal component analysis (PCA) explained 90.4% of the total data variation (Figure 3). Group 1 was composed of the Control0 treatment, Group 2 of TSP0, Group 3 of Bayovar0, Itafós0, and SSP0, Group 4 of Bayovar60 and SSP60, Group 5 of Control60 and TSP60, and Group 6 of the interaction between fertilizer sources (Control, Itafós, and TSP) at the 120 kg ha−1 rate; these treatments were positively correlated with leaf P, whole-plant P, and soil P variables. The variables grain P (P.G), grain yield (GY), and shoot dry matter (SDM) were positively correlated with the treatments forming Groups 5, 6, and 7, which included the treatments SSP120, Bayovar120, and TSP60. The highest positive correlation with Glycine max yield was observed for the SSP120 treatment. Thousand-grain weight (TGW) was most strongly correlated with the Bayovar0 treatment. The treatments Control0, TSP0, Itafós0, Bayovar0, and SSP0 showed negative correlations with Glycine max production.
Figure 3.
Principal component analysis of phosphorus rates and sources and their relationships with P contents in grains, leaves, and soil, as well as yield components of Glycine max cultivated in dystrophic Yellow Oxisol of the Maranhão Cerrado, Brazil. Control0: Control (0.0 kg ha−1 P2O5), Control60: Control (60 kg ha−1 P2O5), Control120: Control (120 kg ha−1 P2O5); SSP0: SSP (0 kg ha−1 P2O5), SSP60: SSP (60 kg ha−1 P2O5), SSP120: SSP (120 kg ha−1 P2O5); TSP0: TSP (0 kg ha−1 P2O5), TSP60: TSP (60 kg ha−1 P2O5), TSP120: TSP (120 kg ha−1 P2O5); Bayovar0: Bayovar (0 kg ha−1 P2O5), Bayovar60: Bayovar (60 kg ha−1 P2O5), Bayovar120: Bayovar (120 kg ha−1 P2O5); and Itafós0: Itafós (0 kg ha−1 P2O5), Itafós60: Itafós (60 kg ha−1 P2O5), Itafós120: Itafós (120 kg ha−1 P2O5), applied as maintenance phosphate fertilization in the 2012/2013 and 2016/2017 growing seasons. GY: Grain yield; TGW: thousand-grain weight; SDM: shoot dry matter; P.pl: phosphorus in the whole plant; P.fl: phosphorus in leaves; P.G: phosphorus in grains; Psoil: soil phosphorus.
4. Discussion
The observed data for Al-bound P (P-Al), showing only an individual effect of soil depth (0–0.10 > 0.10–0.20 > 0.20–0.40 m), and for Fe-bound P (P-Fe), showing interaction effects between P sources and soil depths, indicate the low mobility of phosphorus within the soil profile [10]. This interpretation is further supported by the results showing a decrease in P-Fe adsorption with increasing depth. In addition, for the SSP–200 and Itafós–200 sources, a reduction in P-Fe contents was also observed between the 0.10 and 0.20 m soil layers.
These results indicate that phosphorus availability and mobility with depth are limited, which may be associated with a decrease in pH in subsurface layers as well as with its natural availability. This behavior reinforces the need for management strategies that consider the use of phosphate sources with greater efficiency in nutrient release throughout the soil profile, in order to promote P supply not only in the surface layer but also at depth.
The differences observed among P sources may be related to soil pH and the solubility of each fertilizer. In acidic soils, such as those of the Brazilian Cerrado, P tends to bind predominantly to Fe and Al, forming poorly soluble compounds (P-Fe and P-Al), which limits the formation of Ca-bound P (P-Ca). Under these conditions, even fertilizer sources containing Ca in their formulation, such as SSP–200 and TSP–200, do not promote a marked increase in P-Ca, because the localized acidification generated during granule dissolution favors P adsorption onto Fe and Al oxides [8,13].
In our study, although pH was not statistically significant, it ranged from 4.54 to 6.17, which reinforces the availability of P in labile forms. Supporting our findings [30], working with organic and inorganic P sources (STP) incubated in a sandy loam soil, observed that P solubility increased by 1.16 times as pH decreased from 6.00 to 4.8.
The distinct behavior of Itafós–200 can be explained by its low solubility and gradual P release, which allow greater interaction with Ca2+ in the surface soil layer, where microbial activity is higher, organic matter accumulates, and pH is slightly higher. In addition, high concentrations of Ca in the soil may enhance P fixation to Ca [31], which may result from lime application in the same cropping year. These conditions favor the formation of Ca-P compounds (P-Ca), resulting in the highest values observed at this depth.
Although all evaluated phosphate sources contain calcium in their composition, Itafós stands out for providing the highest Ca input, with a total application of 266 kg ha−1 to supply 200 kg of P2O5. This characteristic may explain the greater association of phosphorus with the P-Ca fraction observed under this treatment. Similar results were reported by [32], who highlighted the influence of calcium on soil P2O5 dynamics and availability, as well as the effect of production processes without the use of acids, which promote a more gradual release of phosphorus.
With increasing depth, the reduction in Ca-bound P (P-Ca) contents reflects the lower availability of exchangeable Ca2+, and the low mobility of P, which are typical characteristics of soils under no-tillage systems [33]. Thus, the results confirm that the distribution and adsorption forms of P are strongly influenced by soil chemical conditions, especially pH, and by the solubility of the phosphate source used.
Phosphorus sources and rates applied as maintenance fertilization also influenced available soil P; P concentrations in the whole plant (P-Pl), leaves (P-Fl), and grains (P-G); and the yield parameters of Glycine max (Table 4). This highlights the importance of maintenance phosphate fertilization for the productive performance of the crop in the Maranhão Cerrado.
The positive response of Glycine max to the different phosphorus sources and rates applied as maintenance fertilization highlights the strong dependence of the crop on P availability, especially in highly weathered tropical soils such as those of the Maranhão Cerrado [34]. The low productivity observed in the absence of maintenance phosphate fertilization reflects the inherent P limitation of these soils, resulting from the high fixation of the nutrient by iron and aluminum oxides, which reduces its availability to plants. This behavior is typical of soils with low P-buffering capacity, in which the application of phosphate fertilizers as maintenance fertilization is essential to meet crop requirements and to ensure the adequate formation of vegetative and reproductive structures [35]. Thus, the increase in yield (GY) and shoot dry matter (SDM) with increasing P2O5 rates in maintenance fertilization confirms that P plays a direct role in root growth and in the efficiency of water and nutrient uptake, which are key factors for plant development and grain filling [36].
The thousand-grain weight (TGW) showed low variation among treatments, indicating that phosphorus (P) influenced the number of pods and grains more strongly than seed size. In contrast, shoot dry matter (SDM), leaf phosphorus concentration (P-Leaf), and grain phosphorus content (P-Grain) increased progressively with increasing rates applied in maintenance fertilization, reflecting improvements in phosphorus nutrition and the physiological efficiency of the crop.
The difference in performance among P sources reflects not only the nutrient concentration but also their solubility and release dynamics in the soil. Highly soluble sources, such as triple superphosphate (TSP), showed a more immediate effect, increasing grain yield and plant P concentrations (P-Pl), whereas Bayovar, with lower solubility, promoted gradual P accumulation in the soil, which may enhance residual effects and the long-term sustainability of the production system [37]. This difference indicates that the choice of P source should consider both the immediate crop response and soil fertility management over successive cropping cycles [38]. Thus, intermediate doses, close to 60 kg P2O5 ha−1, with STP and Itafós in maintenance phosphate fertilization proved to be more agronomically efficient in (SDM, P-Pl and P-Fl) and (SDM, P-Fl and P-G), avoiding waste and reducing the risk of losses due to P fixation. Moreover, the small variation in thousand-grain weight (TGW) suggests that P influenced the number of pods and grains per plant more strongly than seed size, confirming its role in the reproductive development and photosynthetic efficiency of the crop [39].
5. Conclusions
The dynamics of phosphorus in the soil were influenced by the fertilizer sources and soil depths, further evidencing the low mobility of this nutrient. The Itafós and Bayovar sources significantly increased soil available P at the dose of 120 kg ha−1. These results reinforce the importance of proper phosphorus fertilization management to optimize crop performance in the Cerrado region of Maranhão.
Increasing P2O5 rates enhanced P concentrations in both soil and plant tissues, resulting in a positive effect on Glycine max productivity, highlighting the relevance of adequate phosphorus fertilization for agricultural systems established on Cerrado soils.
P-Al showed a positive correlation with soil available P, whereas P-Fe was correlated with the treatments TSP10, TSP0, and Itafós20. The treatments SSP120, Bayovar120, and TSP60 exhibited positive correlations with the yield components of Glycine max.
In light of the results obtained, it is recommended that future studies assess soil phosphorus dynamics in an integrated manner, with emphasis on the interactions among pH, organic matter, and P adsorption–desorption processes, as well as on the relationship between different phosphorus fractions, plant growth, and yield attributes.
Author Contributions
Conceptualization, D.K., J.J.d.J.L., E.M.d.C. and J.C.A.N.; Methodology, L.B.R., D.K., R.S.A.N., M.d.S.A., A.d.J.C., A.P.M.d.S., M.d.F.M.P. and J.C.A.N.; Investigation, L.B.R.; Data curation, L.B.R., R.S.A.N., A.d.J.C., A.P.M.d.S. and M.d.F.M.P.; Writing—original draft, L.B.R. and J.C.A.N.; Writing—review & editing, L.B.R., D.K., J.J.d.J.L., E.M.d.C., R.S.A.N. and J.C.A.N.; Visualization, L.B.R., M.d.S.A., A.P.M.d.S. and M.d.F.M.P.; Supervision, D.K., J.J.d.J.L., E.M.d.C. and J.C.A.N.; Project administration, D.K. All authors have read and agreed to the published version of the manuscript.
Funding
This research received no external funding.
Data Availability Statement
Data are contained within the article.
Conflicts of Interest
Author Dirceu Klepker was employed by the company Empresa Brasileira de Pesquisa Agropecuária. The remaining authors declare that the research was conducted in the absence of any commercial or financial relationships that could be construed as a potential conflict of interest.
References
- Sano, E.E.; Rosa, R.; Brito, J.L.; Ferreira, L.G. Land cover mapping of the tropical savanna region in Brazil. Environ. Monit. Assess. 2010, 166, 113–124. [Google Scholar] [CrossRef]
- IBGE. Instituto Brasileiro de Geografia e Estatística. Manual Técnico da Vegetação Brasileira: Sistema Fitogeográfico, Inventário das Formações Florestais e Campestres, Técnicas e Manejo de Coleções Botânicas, Procedimentos para Mapeamentos. 2a ed. Available online: https://uc.socioambiental.org/sites/uc/files/2019-12/liv63011.pdf (accessed on 10 August 2025).
- Alvares, C.A.; Stape, J.L.; Sentelhas, P.C.; Gonçalves, J.; Moraes, L.; Sparovek, G. Köppen’s climate classification map for Brazil. Meteorol. Z. 2013, 22, 711–728. [Google Scholar] [CrossRef]
- CONAB. Acompanhamento da Safra Brasileira de Grãos, Safra 2023/24, 9th ed.; CONAB: Brasília, Brazil, 2024. [Google Scholar]
- Cui, H.; Ou, Y.; Wang, L.; Wu, H.; Yan, B.; Li, Y. Distribution and release of phosphorus fractions associated with soil aggregate structure in restored wetlands. Chemosphere 2019, 223, 319–329. [Google Scholar] [CrossRef]
- Luo, L.; Ye, H.; Zhang, D.; Gu, J.; Deng, O. The dynamics of phosphorus fractions and the factors driving phosphorus cycle in Zoige Plateau peatland soil. Chemosphere 2021, 278, 130501. [Google Scholar] [CrossRef]
- Marschner, P. (Ed.) Mineral Nutrition of Higher Plants, 3rd ed.; Amsterdam Academic Press; Elsevier: Boston, MA, USA, 2012. [Google Scholar]
- Raij, B.V. Fertilidade do Solo e Manejo de Nutrientes, 2nd ed.; NPCT—Nutrição de Plantas Ciência e Tecnologia: Piracicaba, Brazil, 2019. [Google Scholar]
- Sousa, D.M.G.; Lobato, E. Cerrado: Correção do Solo e Adubação, 2nd ed.; Planaltina: Embrapa Cerrados, Brazil, 2004. [Google Scholar]
- Novais, R.F.; Venegas, V.H.A.; De Barros, N.F.; Fontes, R.L.F.; Cantarutti, R.B.; Neves, J.C.L. Fertilidade do Solo; Sociedade Brasileira de Ciência do solo: Viçosa, Brazil, 2007. [Google Scholar]
- Roy, E.D.; Willing, E.; Richards, P.D.; Martinelli, L.A.; Vazquez, F.F.; Pegorini, L.; Spera, S.A.; Porder, S. Soil phosphorus sorption capacity after three decades of intensive fertilization in Mato Grosso, Brazil. Agric. Ecosyst. Environ. 2017, 249, 206–214. [Google Scholar] [CrossRef]
- Shen, J.; Yuan, L.; Zhang, J.; Li, H.; Bai, Z.; Chen, X.; Zhang, W.; Zhang, F. Phosphorus dynamics: From soil to plant. Plant Physiol. 2011, 156, 997–1005. [Google Scholar] [CrossRef]
- Fink, J.R.; Inda, A.V.; Bayer, C.; Torrent, J.; Barron, V. Mineralogy and phosphorus adsorption in soils of south and central-west Brazil under conventional and no-tillage systems. Acta Sci. Agron. 2014, 36, 379–387. [Google Scholar] [CrossRef]
- Ara, I.; Islam, M.S.; Kashem, M.A.; Osman, K.T. A comparative study of phosphorus availability in an acidic soil and an alkaline soil amended with organic and inorganic phosphorus sources. J. Soil Sci. Plant Nutr. 2018, 18, 466–478. [Google Scholar] [CrossRef]
- Maluf, H.J.G.M.; Silva, C.A.; Curi, N.; Norton, L.D.; Rosa, S.D. Adsorption and availability of phosphorus in response to humic acid rates in soils limed with CaCO3 or MgCO3. Ciência Agrotécnica 2018, 42, 7–20. [Google Scholar] [CrossRef]
- Menezes-Blackburn, D.; Giles, C.; Darch, T.; George, T.S.; Blackwell, M.; Stutter, M.; Shand, C.; Lumsdon, D.; Cooper, P.; Wendler, R.; et al. Opportunities for mobilizing recalcitrant phosphorus from agricultural soils: A review. Plant Soil 2018, 427, 5–16. [Google Scholar] [CrossRef]
- USDA—United States Department of Agriculture. Corn and Soybean Production Costs and Export Competitiveness in Argentina, Brazil, and the United States. Available online: https://ers.usda.gov/sites/default/files/_laserfiche/publications/44087/59672_eib-154_errata.pdf?v=62417eutm_source=chatgpt.com (accessed on 1 November 2025).
- Resende, J.C.F.; Markewitz, D.; Klink, C.A.; Bustamante, M.M.C.; Davidson, E.A. Phosphorus cycling in a small watershed in the Brazilian Cerrado: Impacts of frequent burning. Biogeochemistry 2011, 105, 105–118. [Google Scholar] [CrossRef]
- Ministério da Agricultura e Pecuária—MAPA. Instrução Normativa Nº 39, de 8 de Agosto de 2018. Available online: https://www.gov.br/agricultura/pt-br/assuntos/insumos-agropecuarios/insumos-agricolas/fertilizantes/legislacao/in-39-2018-fert-minerais-versao-publicada-dou-10-8-18.pdf (accessed on 1 November 2025).
- Baldoino, R.d.O. Concentração de Fosfato de Bayovar: Aspectos Fundamentais e Tecnológicos. Doctoral Dissertation, Escola Politécnica da Universidade de São Paulo, São Paulo, Brazil, 2017. [Google Scholar]
- Job, R.B.; Bevilaqua, G.A.P.; Olanda, G.B.; Pinheiro, R.A.; Muller, P.d.C. Recobrimento de Sementes de Feijão-Miúdo Com Agrominerais No Controle de Sitophilus sp.; Pelotas: Embrapa Clima Temperado, Brazil, 2020. [Google Scholar]
- Donagemma, G.K.; Viana, J.H.M.; de Almeida, B.G.; Ruiz, H.A.; Klein, V.A.; Dechen, S.C.F.; Fernandes, R.B.A. Análise granulométrica. In Manual de Métodos de Análises de Solo; Teixeira, P.C., Donagemma, G.K., Fontana, A., Teixeira, W.G., Eds.; Brasília: Embrapa Solos, Brazil, 2017; pp. 95–116. [Google Scholar]
- Teixeira, P.C.; Donagemma, G.K.; Fontana, A.; Teixeira, W.G. (Eds.) Manual de Métodos de Análise de Solo, 3rd ed.; Embrapa: Brasília, Brazil, 2017; pp. 439–442. [Google Scholar]
- Chang, S.C.; Jackson, M.L. Frationation of soil phosphorus. Soil Sci. 1957, 84, 133–144. [Google Scholar] [CrossRef]
- Murphy, J.; Riley, J.P. A modified single solution methods for the determination of phosphate in natural waters. Anal. Chim. Acta 1962, 26, 31–36. [Google Scholar] [CrossRef]
- Silva, F.C.d. Manual de Análises Químicas de Solo, Planta e Fertilizantes, 2nd ed.; Embrapa Informação Tecnológica: Rio de Janeiro, Brazil, 2009. [Google Scholar]
- Mingoti, S.A. Análise de Dados Através de Métodos de Estatística Multivariada: Uma Abordagem Aplicada; Universidade Federal de Minas Gerais: Belo Horizonte, Brazil, 2005. [Google Scholar]
- R Core Team. R: A Language and Environment for Statistical Computing; R Foundation for Statistical Computing: Vienna, Austria, 2024; Available online: http://www.R-project.org/ (accessed on 8 December 2025).
- Lê, S.; Josse, J.; Husson, F. Facto Mine R: An R Package for multivariate analysis. J. Stat. Softw. 2008, 25, 1–18. [Google Scholar] [CrossRef]
- Sousa, R.N.; Pessoa, T.N.; Libardi, P.L.; Alleoni, L.R.F. Liming and soil texture affect the miscible displacement of phosphorus from organic and mineral sources in tropical oxisols. Sci. Total Environ. 2025, 961, 178341. [Google Scholar] [CrossRef]
- Zavaschi, E.; de Abreu Faria, L.; Ferraz-Almeida, R. Dinâmica do fluxo de P em solos ácidos tropicais fertilizados com fosfato complexado com ácido húmico. J. Soil Sci. Plant Nutr. 2020, 20, 1937–1948. [Google Scholar] [CrossRef]
- Barrow, N.J. The effects of pH on phosphate uptake from the soil. Plant Soil 2017, 410, 401–410. [Google Scholar] [CrossRef]
- de Oliveira, L.E.Z.; de Souza Nunes, R.; de Figueiredo, C.C.; Rein, T.A. Spatial distribution of soil phosphorus fractions in a clayey Oxisol submitted to long-term phosphate fertilization strategies. Geoderma 2022, 418, 115847. [Google Scholar] [CrossRef]
- Nunes, R.D.S.; Sousa, D.M.G.D.; Goedert, W.J.; De Oliveira, L.E.Z.; E Pinheiro, T.D. Crops’ yield and roots response to soil phosphorus distribution resulting from long-term soil and phosphate fertilization management strategies. Front. Agron. 2021, 3, 757100. [Google Scholar] [CrossRef]
- Fan, Y.; Zhong, X.; Lin, F.; Liu, C.; Yang, L.; Wang, M.; Chen, G.; Chen, Y.; Yang, Y. Responses of soil phosphorus fractions after nitrogen addition in a subtropical forest ecosystem: Insights from decreased Fe and Al oxides and increased plant roots. Geoderma 2019, 337, 246–255. [Google Scholar] [CrossRef]
- Khan, F.; Siddique, A.B.; Shabala, S.; Zhou, M.; Zhao, C. Phosphorus plays key roles in regulating plants’ physiological responses to abiotic stresses. Plants 2023, 12, 2861. [Google Scholar] [CrossRef]
- Zhang, J.; Wen, J.; Zhang, T.; Zhang, Y.; Peng, Z.; Tang, C.; Wang, Y.; Su, S.; Zhang, N.; Zeng, X. Effects of five–year inorganic and organic fertilization on soil phosphorus availability and phosphorus resupply for plant P uptake during maize growth. Agriculture 2023, 13, 858. [Google Scholar] [CrossRef]
- Ibrahim, M.; Iqbal, M.; Tang, Y.; Tang, T.; Khan, S.; Guan, D.; Li, G. Phosphorus mobilization in plant–soil environments and inspired strategies for managing phosphorus: A review. Agronomy 2022, 12, 2539. [Google Scholar] [CrossRef]
- Taliman, N.A.; Dong, Q.; Echigo, K.; Raboy, V.; Seneoka, H. Effect of phosphorus fertilization on the growth, photosynthesis, nitrogen fixation, mineral accumulation, seed yield, and seed quality of a soybean low-phytate line. Plants 2019, 8, 119. [Google Scholar] [CrossRef] [PubMed]

Disclaimer/Publisher’s Note: The statements, opinions and data contained in all publications are solely those of the individual author(s) and contributor(s) and not of MDPI and/or the editor(s). MDPI and/or the editor(s) disclaim responsibility for any injury to people or property resulting from any ideas, methods, instructions or products referred to in the content. |
© 2026 by the authors. Licensee MDPI, Basel, Switzerland. This article is an open access article distributed under the terms and conditions of the Creative Commons Attribution (CC BY) license.