Skip to Content

Remote Sensing

Remote Sensing is an international, peer-reviewed, open access journal about the science and application of remote sensing technology, published semimonthly online by MDPI.
The Remote Sensing Society of Japan (RSSJ) and Japan Society of Photogrammetry and Remote Sensing (JSPRS) are affiliated with Remote Sensing and their members receive discounts on the article processing charge.
Quartile Ranking JCR - Q1 (Geosciences, Multidisciplinary)

All Articles (40,854)

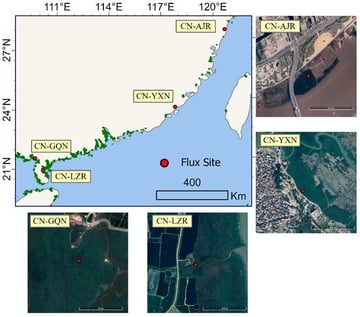
Mangrove ecosystems are important blue carbon systems and play a critical role in understanding carbon cycling and responses to climate change. However, accurate regional estimation of Net Ecosystem Exchange (NEE) remains challenging due to the environmental complexity and spatial heterogeneity. This study combined eddy covariance observations from four mangrove sites along China’s southeastern coast (natural and restored mangrove forests) with multi-source remote sensing and environmental reanalysis data to construct three variable schemes (site observations only, with added vegetation indices, and comprehensive multi-source variables). We compared three machine learning models for daily NEE prediction, including eXtreme Gradient Boosting (XGBoost), Random Forest (RF), and Support Vector Machine (SVM). The results showed that: (1) Restored and natural mangroves exhibited similar temporal NEE dynamics and consistently functioned as carbon sinks, restored mangrove sites showed greater cross-site variability. Among the study sites, CN-LZR exhibited the strongest cumulative carbon uptake. (2) Scheme 3 combined with the XGBoost algorithm achieved the highest predictive accuracy, reaching an R2 of 0.73 across sites. Differences among machine learning models were primarily associated with their ability to capture nonlinear interactions between atmospheric and hydrological variables, with tree-based models outperforming SVM. (3) SHAP analysis indicated that radiation-related variables were the dominant drivers of NEE, while hydrological influences were site-dependent; and (4) Regional upscaling indicated that all sites consistently functioned as long-term carbon sinks, with CN-LZR exhibiting slightly higher daily mean carbon uptake than the other sites. This study presented the first machine learning framework for estimating daily-scale NEE in mangroves, providing methodological and data support for regional carbon flux assessment and blue carbon management.

22 February 2026

Study area and EC tower locations. The suffix “N” indicates natural mangrove sites, and “R” indicates restored mangrove sites. From north to south, the sites are: Restored mangroves in Aojiang County, Wenzhou City, Zhejiang Province (CN-AJR); Natural mangroves in Yunxiao County, Zhangzhou City, Fujian Province (CN-YXN); Natural mangroves in Gaoqiao Town, Lianjiang City, Guangdong Province (CN-GQN); and Restored mangroves in Leizhou City, Guangdong Province (CN-LZR).

The China Aerosol Raman Lidar Network (CARLNET), developed by the China Meteorological Administration, currently comprises 49 multiwavelength polarization Raman lidars used for meteorological and atmospheric-environment monitoring. Timely and automatic quality assessment of the lidar raw signal is vital for a large atmospheric lidar network. This study proposes a quality assessment method of lidar raw data for the CARLNET. By scoring three factors, signal saturation at near-range, Rayleigh fit and effective detection range, and weighting each influence factor according to its importance, each lidar raw data is tagged by a composite score. These scores reflect the quality of lidar raw data, as well as potential issues of lidar systems. Three lidars under three typical weather scenarios are used to analyze the impact of observation scenarios on lidar raw data, and the results show that the proposed method can effectively distinguish the lidar raw data quality under different scenarios. By analyzing the scores of lidar raw data, two potential hardware issues (optical-axis misalignment and signal-receiving issues) are identified, which provide guidance for equipment maintenance. In addition, we applied the method to one-year CARLNET measurement data. Temporally, five representative sites were selected for analysis of their annual data, revealing the seasonal and overall scores of the raw data. Spatially, the signals at the 355 nm, 532 nm, and 1064 nm channels of 49 nationwide distributed lidars were evaluated and categorized into six groups based on their scores, which provides support for lidar network data quality monitoring, operational applications, and scientific research.

22 February 2026

The data-processing flowchart for CARLNET.

As large-scale remote sensing data continue to proliferate, research on remote sensing image–text retrieval (RSITR) has become progressively more prominent. Nevertheless, RSITR still faces two primary challenges. First, remote sensing data exhibit substantially higher intra-modal similarity than typical natural image–text corpora, complicating the discrimination of positive and negative pairs. Second, vision–language models pretrained on natural images (VLP), such as CLIP, are not readily adaptable to remote sensing scenarios without undergoing large-scale remote sensing pretraining that entails substantial cost. To tackle these challenges, we introduce DCCA, a novel framework designed for discriminative and consistent cross-modal alignment. We develop a global contrastive learning strategy with negative pair expansion mechanism to boost representation discrimination when intra-modal similarity is pronounced. Additionally, we introduce a bidirectional distribution matching constraint that jointly aligns intra- and inter-modal distributions, promoting consistent cross-modal alignment beyond the instance level. To further enhance domain adaptation, we propose a remote sensing information injection module that transfers knowledge from a pretrained remote sensing image recognition model into VLP, thereby improving its visual discriminability in remote sensing scenarios. Evaluations conducted on publicly available RSITR benchmarks indicate that DCCA consistently surpasses baseline methods, while attaining performance on par with models trained using large-scale remote sensing datasets under markedly reduced data requirements. These findings verify that the framework is both effective and well-suited for practical deployment.

22 February 2026

Average image and text intra-modal similarity scores for natural datasets (Flickr30K and MSCOCO) and remote sensing datasets (RSITMD and RSICD) using different encoders. The ViT variants are derived from the CLIP image encoder. Paraphrase-MiniLM-L6-v2 [20], all-mpnet-base-v2 [20], and bge-large-en-v1.5 [21] are specifically trained for text similarity computation.

Satellite-derived bathymetry holds significant value for acquiring nearshore bathymetric data. However, in coastal waters, bathymetry is affected by in-water particle scattering and seafloor substrate variability, leading to spatial inconsistency between the logarithmic green band profile derived from multispectral satellite imagery and the actual water depth profile. According to the position information of interpolated points and the inverse distance square relationship with the surrounding 16 points from low-reference bathymetric data (such as the bathymetric map from GEBCO, NOAA Electronic Navigational Charts), this model adopts a third-order inverse distance square bicubic convolution interpolation method to resample a high-resolution bathymetric map with the size of the satellite image. Normalized underwater topography trend data (derived from the low-resolution reference bathymetric map) were combined with normalized green band data to compute an averaged dataset. In this way, a linear bathymetric model was constructed. We invert this model’s parameters and calculate the water depth by using the average data and reference points from reference bathymetric data. Validation tests were conducted across three test areas using independent validation bathymetric data: Weizhou Island, China (Case II waters); Saipan, Northern Mariana Islands, USA (Case I waters); and Molokai Island, Hawaii, USA (Case I waters). Each test area was studied using five error analysis methods (i.e., scatterplot, error histogram, regional bathymetric error, three check lines, and seven check points). Compared to four classic bathymetric models (i.e., single-band model, log-ratio model, ratio-log model, and multi-band model), the proposed model achieved lower root mean square errors (RMSE) of 2.08 m, 1.40 m, and 2.01 m in the three test areas, representing reductions of 35%, 43%, 45%, and 20% and overall averages of 48%, 62%, 64%, and 43%, respectively. Its goodness of fit (R2) reached 0.87, 0.97, and 0.97, showing improvements of at least 5%, 5%, 9%, and 9% and overall averages of 17%, 77%, 84%, and 12%, respectively. The results demonstrate that the proposed model significantly improves bathymetry accuracy while maintaining algorithmic simplicity, providing a new model for acquiring nearshore foundational bathymetric maps.

21 February 2026

Weizhou Island waters.

News & Conferences

Issues

Open for Submission

Editor's Choice

Reprints of Collections

Remote Sensing of Vegetation Function and Traits
Reprint

Remote Sensing of Vegetation Function and Traits

Editors: Tawanda W. Gara, Cletah Shoko, Timothy Dube
Remote Sensing of Vegetation
Reprint

Remote Sensing of Vegetation

Mapping, Trend Analysis, and Drivers of Change
Editors: Sadegh Jamali, Torbern Tagesson, Feng Tian, Meisam Amani, Per-Ola Olsson, Arsalan Ghorbanian

Get Alerted

Add your email address to receive forthcoming issues of this journal.

XFacebookLinkedIn
Remote Sens. - ISSN 2072-4292