


Abstract
Kiwifruit brown spot caused by Corynespora cassiicola is the most significant fungal disease in Sichuan, resulting in premature defoliation, which had a significant impact on yield and fruit quality. The objective of the study was to determine the occurrence regularity and suitability of kiwifruit brown spot in Sichuan. The occurrence of the disease in the main producing region was continuously monitored, the maximum entropy (MaxEnt) model was used to predict its potential distribution, and the key environmental variables were identified using the jackknife method. The results indicated that kiwifruit brown spot was widely distributed across the entire producing region in Sichuan, predominantly affecting the variety “Hongyang”. The incidence (p < 0.01) and disease index (p < 0.05) showed a significant positive correlation with the cultivar, and decreased with the altitude increasing. The average area under the ROC curve (AUC) of 10 replicates was 0.933 ± 0.012, with an accuracy of 84.44% in a field test, confirming the reliability of the predicted results. The highly suitable distribution areas of kiwifruit brown spot were mainly located in the Chengdu and Ya’an regions. The entire Panzhihua region was an unsuitable distribution area, and the entire Pujiang County and Mingshan District were highly suitable distribution areas. The key environmental variables affecting the potential distribution of kiwifruit brown spot included isothermality (24.3–33.7%), minimum temperature in August (16.3–23.6 °C), maximum temperature in July (25.5–31.2 °C), minimum temperature in June (15.6–20.9 °C), precipitation in August (158–430 mm), and average temperature in October (15.6–18.8 °C). This study provides a theoretical basis for the reasonable layout of the cultivar and the precise prevention and control of the disease.
1. Introduction
Kiwifruit is one of the most popular fruits worldwide due to its special flavor and abundant nutrient contents, especially vitamin C, minerals, and dietary fiber [1,2]. Kiwifruit is a perennial cash crop, which can provide continuous considerable economic benefit to growers [3]. At present, kiwifruit occupies an important position in the international fruit business. In leading producing countries, such as China, New Zealand, and Italy, kiwifruit is the main source of income for local families, making it a vital parameter in their economy [4]. The kiwifruit industry in Sichuan has experienced unprecedented development since 2008, with its current output ranking second in China [5]. Among the cultivated varieties, red-fleshed kiwifruit, especially “Hongyang”, has been widely cultivated, with a planting area reaching 50,000 hectares until 2018. Kiwifruit brown spot caused by Corynespora cassiicola is a fungal airborne disease [6,7], which is the second most significant disease, followed by kiwifruit bacterial canker disease, in Sichuan [8]. The disease spreads rapidly, and the incidence can reach 90% to 100% during the harvest stage. In some orchards, functional leaves are almost entirely lost, leading to the premature sprouting of autumn shoots, and the fruits lose water severely, shrivel, and soften, losing commodity value and causing huge yield loss [8]. With the continuous cultivation of highly susceptible varieties, kiwifruit brown spot has become an escalating concern and a significant limiting factor for industry development. Therefore, understanding the occurrence regularity and distribution regionalization of the disease is of utmost importance.
Previous studies on the epidemic of plant diseases and pests have been limited by technical barriers and other factors, restricting their spatial development to relatively small scales, typically within a confined infected field. However, recent advancements in geographic information system (GIS) technology have enabled the analysis of large-scale spatial data, which makes it possible to regionalize the occurrence and development regularity of diseases and pests in large-scale regions, even on a global scale. Zou et al. [9] regionalized the oversummer range of wheat powdery mildew using the GIS ordinary kriging method combined with the digital elevation model (DEM) of China. Kistner-Thomas et al. [10] assessed the relationship between grasshopper density survey data and 72 biologically relevant GIS-based environmental variables and developed a regression model to predict the mean density of an adult grasshopper from 2012 to 2016. At present, in the research on the suitable regionalization of diseases and pests, correlation analysis, weight coefficient distribution, and assignment of each impact factor are first carried out with mathematical methods; then the comprehensive factors are graded by the index classification method, the data are rasterized by GIS, the value of the vacant area is inserted, and the regionalization results are finally determined [11]. The accuracy of the model primarily relies on the key factors. Accurately understanding occurrence regularity could lay a good foundation for the subsequent distribution regionalization. Peng et al. [12] successfully identified the occurrence and epidemic regularity of wheat stripe rust in Nanchong, achieving 100%, 98%, and 95% accuracy rates for short-term, medium-term, and long-term predictions, respectively. Chen et al. [13] used trajectory analysis and an effective accumulated temperature model to simulate the migration process and development progress of Spodoptera frugiperda, clarifying its migration path and occurrence regionalization in China.
The maximum entropy theory was the most objective criterion for selecting the statistical characteristics of random variables. Based on this theory, the maximum entropy (MaxEnt) model is a quantitative analysis tool, which has been widely applied in plant protection due to its stable operation, simplicity, rapid calculation, and high accuracy [14,15,16]. Zhang et al. [17] collected geographic location information on Prunus salicina and one of the brown rot pathogenic species (Monilinia fructicola), applying the MaxEnt model to simulate their potential suitable distribution in China. Wang et al. [18,19] utilized the MaxEnt model based on distribution information and environmental variables to investigate the suitability of kiwifruit bacterial canker disease in Sichuan and predict its potential distribution under climate change. Evaluating the accuracy of the model is an essential step, accomplished by employing different evaluation methods and standards with effective evaluation indexes. Among these, the area under the receiver operating characteristic (ROC) curve (AUC) has been widely used. Wei et al. [20] used the AUC to evaluate the accuracy of the MaxEnt model in predicting the potential distribution of maize chlorotic mottle virus (MCMV) under historical and future climatic conditions. Cho et al. [21] evaluated the accuracy of spatial (regression kriging) and nonspatial (MaxEnt) models to simulate the distribution of two invasive plant species (Ambrosia artemisiifolia and Ambrosia trifida) by AUC.
Kiwifruit brown spot primarily occurs during high temperature and high humidity seasons, and initially appears in late June and lasts until October. On the other hand, kiwifruit bacterial canker disease is a low-temperature disease, occurring from November to May the following year. Both diseases significantly threaten the healthy development of the kiwifruit industry and substantially impact the variety layout. Meanwhile, their phenological periods and the physiological and biochemical characteristics are completely different. Therefore, the development of this study can provide more scientific and rational guidance for the variety layout of kiwifruit in Sichuan. At present, the occurrence regularity of kiwifruit brown spot in Sichuan has not been clearly elucidated, resulting in blind prevention and control and serious pesticide abuse in production, which is not conducive to the healthy development of the industry. The international scientific community has dedicated many efforts to enhancing resilience and sustainability in agriculture, with a particular emphasis on reducing pesticides [22], including in kiwifruit cultivation [23,24]. Disease prediction is a prerequisite for disease management and plays an important role in integrated pest management [25]. The database established based on long-term monitoring is the foundation for an accurate disease prediction [26]. Early preparation for prevention can not only improve the effectiveness and benefits, but also reduce unnecessary costs and environmental pollution caused by pesticide abuse [27]. Moreover, studies on kiwifruit brown spot are still in the initial stage and mainly focus on pathogen identification, population diversity, resistance of cultivars, and disease control method [3,6,7,28]. However, a suitable regionalization based on climate conditions remains unknown, warranting further study.
In this study, the epidemic of kiwifruit brown spot in the main producing region was monitored over the long term, and the potential distribution of this disease in Sichuan was employed to predict it using the MaxEnt model. The objectives of this study were to (1) clarify the disease occurrence regularity to provide rational guidance for the variety layout; (2) to evaluate the key environmental variables affecting the distribution of this disease; (3) to determine the suitability of this disease in Sichuan, aiming to provide a theoretical basis for the prediction, precise prevention, and control of the disease.
2. Materials and Methods
2.1. Sources of Software and Map
MaxEnt software (version 3.4.1) was downloaded from the Museum of Natural History (https://biodiversityinformatics.amnh.org/open_source/maxent/, accessed on 29 November 2022), Java software was downloaded from its official website (https://www.oracle.com/java/, accessed on 31 July 2022), ArcGIS software (version 10.8.1) was downloaded from the ESRI website (https://support.esri.com/en/Products/Desktop/arcgisdesktop/arcmap, accessed on 1 December 2022), and the base map was provided by the National Meteorological Information Centre of China.
2.2. Determination of the Occurrence of Kiwifruit Brown Spot
During 2012–2022, the occurrence and distribution of kiwifruit brown spot in the main production regions in Sichuan were continuously assessed. Detailed geographical information (longitude, latitude, and altitude), cultivar, and disease occurrence were recorded. The assessment involved six prefecture-level administrative regions, including Chengdu, Ya’an, Guangyuan, Deyang, Mianyang, and Meishan, and was conducted at the end of the disease logistic phase, namely, mid- to late September.
2.3. Measurement of Disease Severity
Each experimental site consisted of five plots, with three trees per plot, totaling fifteen trees. Each tree was examined from five directions (east, west, south, north, and middle), with two branches per direction. From each branch, five leaves were selected, starting from the base upwards, resulting in a total of fifty leaves per tree. The standard of classification for disease severity is presented in Table 1. The disease index (DI) was calculated according to the following formula [3]. The disease level was divided into three categories [8]: high (DI ≥ 66.67), moderate (33.33 ≤ DI < 66.67), and low (0 < DI < 33.33).

Table 1.
The standard of classification for kiwifruit brown spot.
2.4. Correlation Analysis
The Pearson correlation between variety and disease index was determined by SPSS 21.0. The altitude and disease index of the “Hongyang” variety were extracted for correlation analysis.
2.5. Acquisition and Processing of Distribution Information
Kiwifruit brown spot disease primarily occurred in red-fleshed kiwifruit, widely cultivated in Sichuan. It has also been reported in Guangxi, Hubei, and Chongqing, exhibiting strong regional characteristics. Therefore, the other distribution information was mainly obtained by searching published papers [3,7,28], inquiring the kiwifruit disease and pest prediction and forecast reports issued by local plant protection stations and agricultural technology and meteorological cooperative service reports, and consulting local plant protection staff. Through the above procedure, 108 occurrence records were evaluated. By incorporating the 122 available experimental sites collected during the initial stages, a total of 230 distribution points were obtained.
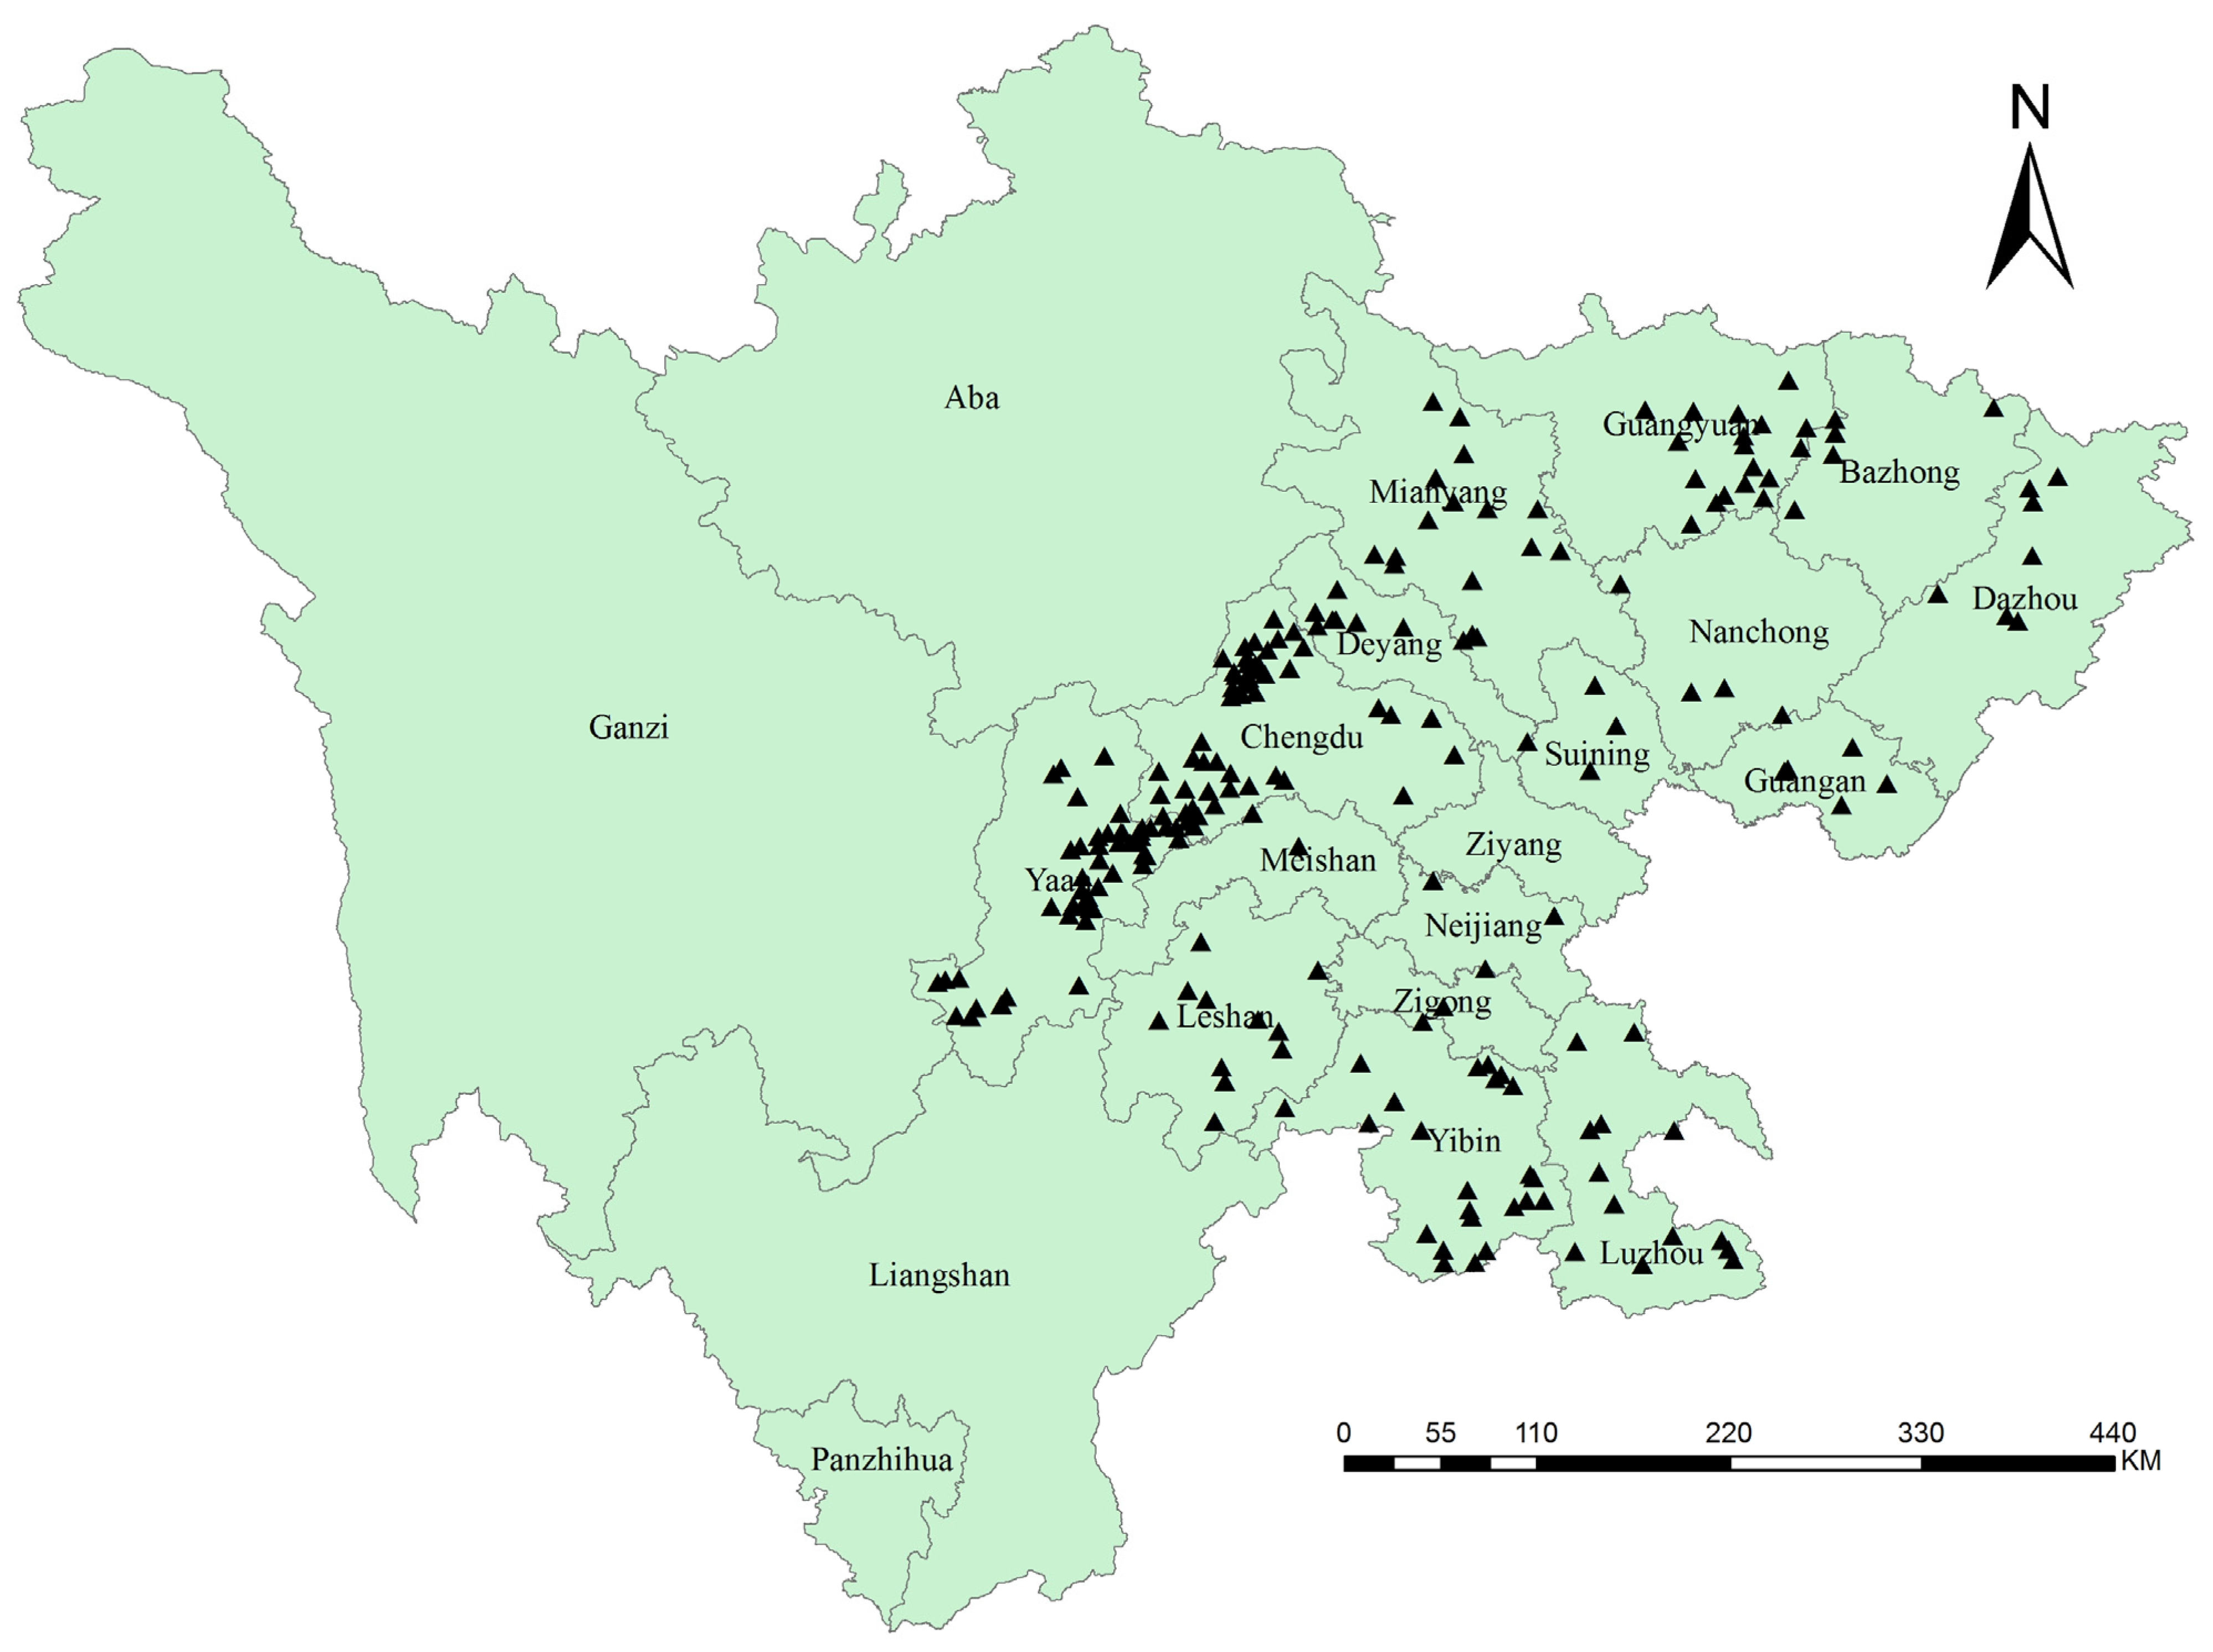
The distribution points with specific information were directly applied, while those lacking latitude and longitude were inquired in the global geographic information integrated database GeoName and the Baidu coordinate picking system to extract the coordinate information. The buffering area analysis function of ArcGIS was used to calculate the distance between the grid center and distribution points. Only the closest record to the center was retained within the same grid. The above distribution records in the order of species, longitude, and latitude were imported into Excel, with a positive north latitude and east longitude and a negative south latitude and west longitude. After the screening process, 225 valid points were retained for constructing the models (Figure 1), and the species distribution information was transferred to the CSV file required by MaxEnt.
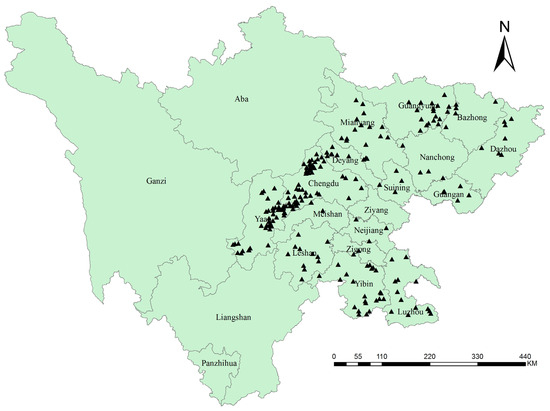
Figure 1.
Sample distribution points of kiwifruit brown spot.
2.6. Acquisition and Processing of Environmental Variables
All environmental data were obtained for free from the WorldClim database (http://www.worldclim.org/, accessed on 28 August 2023), which provides interpolated raster data based on global meteorological record information. The above data were in TIFF format with a spatial resolution of 2.5 arc-minutes, including 67 environmental variables, among which were 19 bioclimatic factors, monthly mean precipitation, monthly mean temperature, maximum and minimum temperature, and other bioclimatic indices (Table 2). The environmental variables were extracted from the administrative zoning map of Sichuan as the base map. The TIFF format was transferred to the ASCII format required by MaxEnt using the format conversion function of ArcGIS. Initially, 67 environmental variables were extracted to build an initial model. The contribution rates and importance of environmental variables were determined by the jackknife method, and those rates of less than 1% were eliminated. The attribute values of environmental variables at 225 distribution points were extracted using the extraction analysis tool of ArcGIS. Pearson correlations between environmental variables were calculated using SPSS 21.0. Variables with a strong correlation were removed, and the relationship between kiwifruit brown spot and meteorological factors was considered to finally screen out variables.
Table 2.
Bioclimatic factors used in the initial model.
2.7. Construction and Evaluation of MaxEnt Model
The distribution information of kiwifruit brown spot and environmental variables were imported into MaxEnt, and the climate response curve was created to analyze the relationship between each environmental variable and the distribution probability. The prediction map was drawn, and the importance of environmental variables was measured using the jackknife method. The random test percentage was set to 25% and repeated 10 times. The default values of the model were selected for other parameters, and the output path was set for modeling. In this study, AUC was used to evaluate the accuracy of the model simulation. The AUC value ranges from 0.5 to 1, with values closer to 1 indicating a stronger correlation between environmental variables and species distribution and a higher model accuracy. The evaluation criterion is 0.5 ≤ AUC < 0.6, fail; 0.6 ≤ AUC < 0.7, poor; 0.7 ≤ AUC < 0.8, general; 0.8 ≤ AUC < 0.9, good; AUC ≥ 0.9, excellent.
2.8. Geographic Division of Suitability
The ASCII format files output by MaxEnt were transferred to raster format files using the format conversion function of ArcGIS. The potential distribution map of kiwifruit brown spot was extracted from the administrative zone map of Sichuan as the base map, and then the spatial analysis tool was used for reclassification. According to previous studies [29,30], the suitable area was divided into four categories, displaying them in different colors: highly suitable area (p > 0.66, red), moderately suitable area (0.33 < p ≤ 0.66, orange), lowly suitable area (0.05 < p ≤ 0.33, yellow), and unsuitable area (p ≤ 0.05, white). The distribution area of each region and district (county) was calculated using the statistical analysis function of ArcGIS.
2.9. Field Evaluation of the Model
A field test of species distribution was conducted as the most direct and reliable method for model validation. In order to further verify the accuracy of the simulation results, additional 45 actual occurrence records from supplementary determination were introduced for the field test. The actual distribution points were mapped onto the reclassified map, and the corresponding suitable levels were extracted by ArcGIS, and then compared with the actual level of disease occurrence. Both are equally regarded as accurate.
3. Results
3.1. Occurrence of Kiwifruit Brown Spot
A long-term monitoring of the epidemic of kiwifruit brown spot in the main production region revealed that the disease was widely distributed and seriously occurred in all regions (Table 3). Out of 122 investigation sites in the province, 83 sites (68.03%) exhibited a high occurrence level. The disease occurrence was particularly severe in the main cultivated variety, ‘Hongyang’, and the damage was serious, with an average incidence of 92.87% and a disease index of 81.99. Among them, the occurrence in the Chengdu region was particularly severe, with the incidence and disease index reaching 97.15% and 91.96 respectively. Apart from ‘Hongyang’, the disease also occurred commonly in other red-fleshed varieties, such as ‘Donghong’, with an incidence of 83.63%, but the severity was relatively low, with a disease index of 31.08. The disease occurrences in yellow-fleshed varieties, such as Jinyan and Jinshi, and green-fleshed varieties, such as Hayward, Cuiyu, and Actinidia arguta varieties, were relatively low. Pearson correlation analysis showed a significant positive correlation between the incidence and disease index with the cultivar, with the correlation coefficient reaching 0.929 (p = 0.002 < 0.01) and 0.795 (p = 0.033 < 0.05), respectively (Table 4). The correlation analysis between the occurrence and altitude in the ‘Hongyang’ variety showed that the incidence and disease index were significantly negatively correlated with altitude, with the correlation coefficient reaching −0.780 (p = 0.000 < 0.01) and −0.604 (p = 0.000 < 0.01), respectively. The incidence and disease index decreased with the increase in altitude.
Table 3.
Survey information of kiwifruit brown spot.
Table 4.
Pearson correlation analysis between the occurrence of kiwifruit brown spot and varieties and altitude.
3.2. Screening of Environmental Variable
The initial model was constructed using 67 environmental variables (Table 2), with an AUC value of 0.930. The contribution rate of each variable to the model was calculated, and variables with a contribution rate of less than 1% were excluded through the jackknife test. This process resulted in the selection of 11 variables, including bio3, tmin8, tmin6, prec8, tmax7, prec2, prec4, tavg10, bio2, tmin7, and prec6, with a cumulative contribution rate of 93.2% (Table 5). Pearson correlation analysis among environmental variables revealed high correlations between bio2 and bio3 (correlation coefficient: 0.924) and between tmin7 and tavg10, tmax7, tmin6, and tmin8 (correlation coefficients: 0.924, 0.983, 0.983, and 0.996, respectively), all exceeding 0.90 (Table 6). There will be some problems, such as autocorrelation and multiple linear repetition, and redundant information will be introduced in the process of modeling, which will have an impact on prediction accuracy. To eliminate collinearity between variables and avoid overfitting in the simulation process, bio2 and tmin7 were eliminated. Based on the biological characteristics of kiwifruit brown spot, prec2 was eliminated for low biological significance. In summary, 8 variables, including bio3, prec4, prec6, prec8, tavg10, tmax7, tmin6, and tmin8, were selected to construct the final model.
Table 5.
The accumulated contribution of each environmental variable to the potential distribution of kiwifruit brown spot.
Table 6.
Pearson correlation analysis of environmental variables affecting the distribution of kiwifruit brown spot.
3.3. Suitability Test of MaxEnt Model
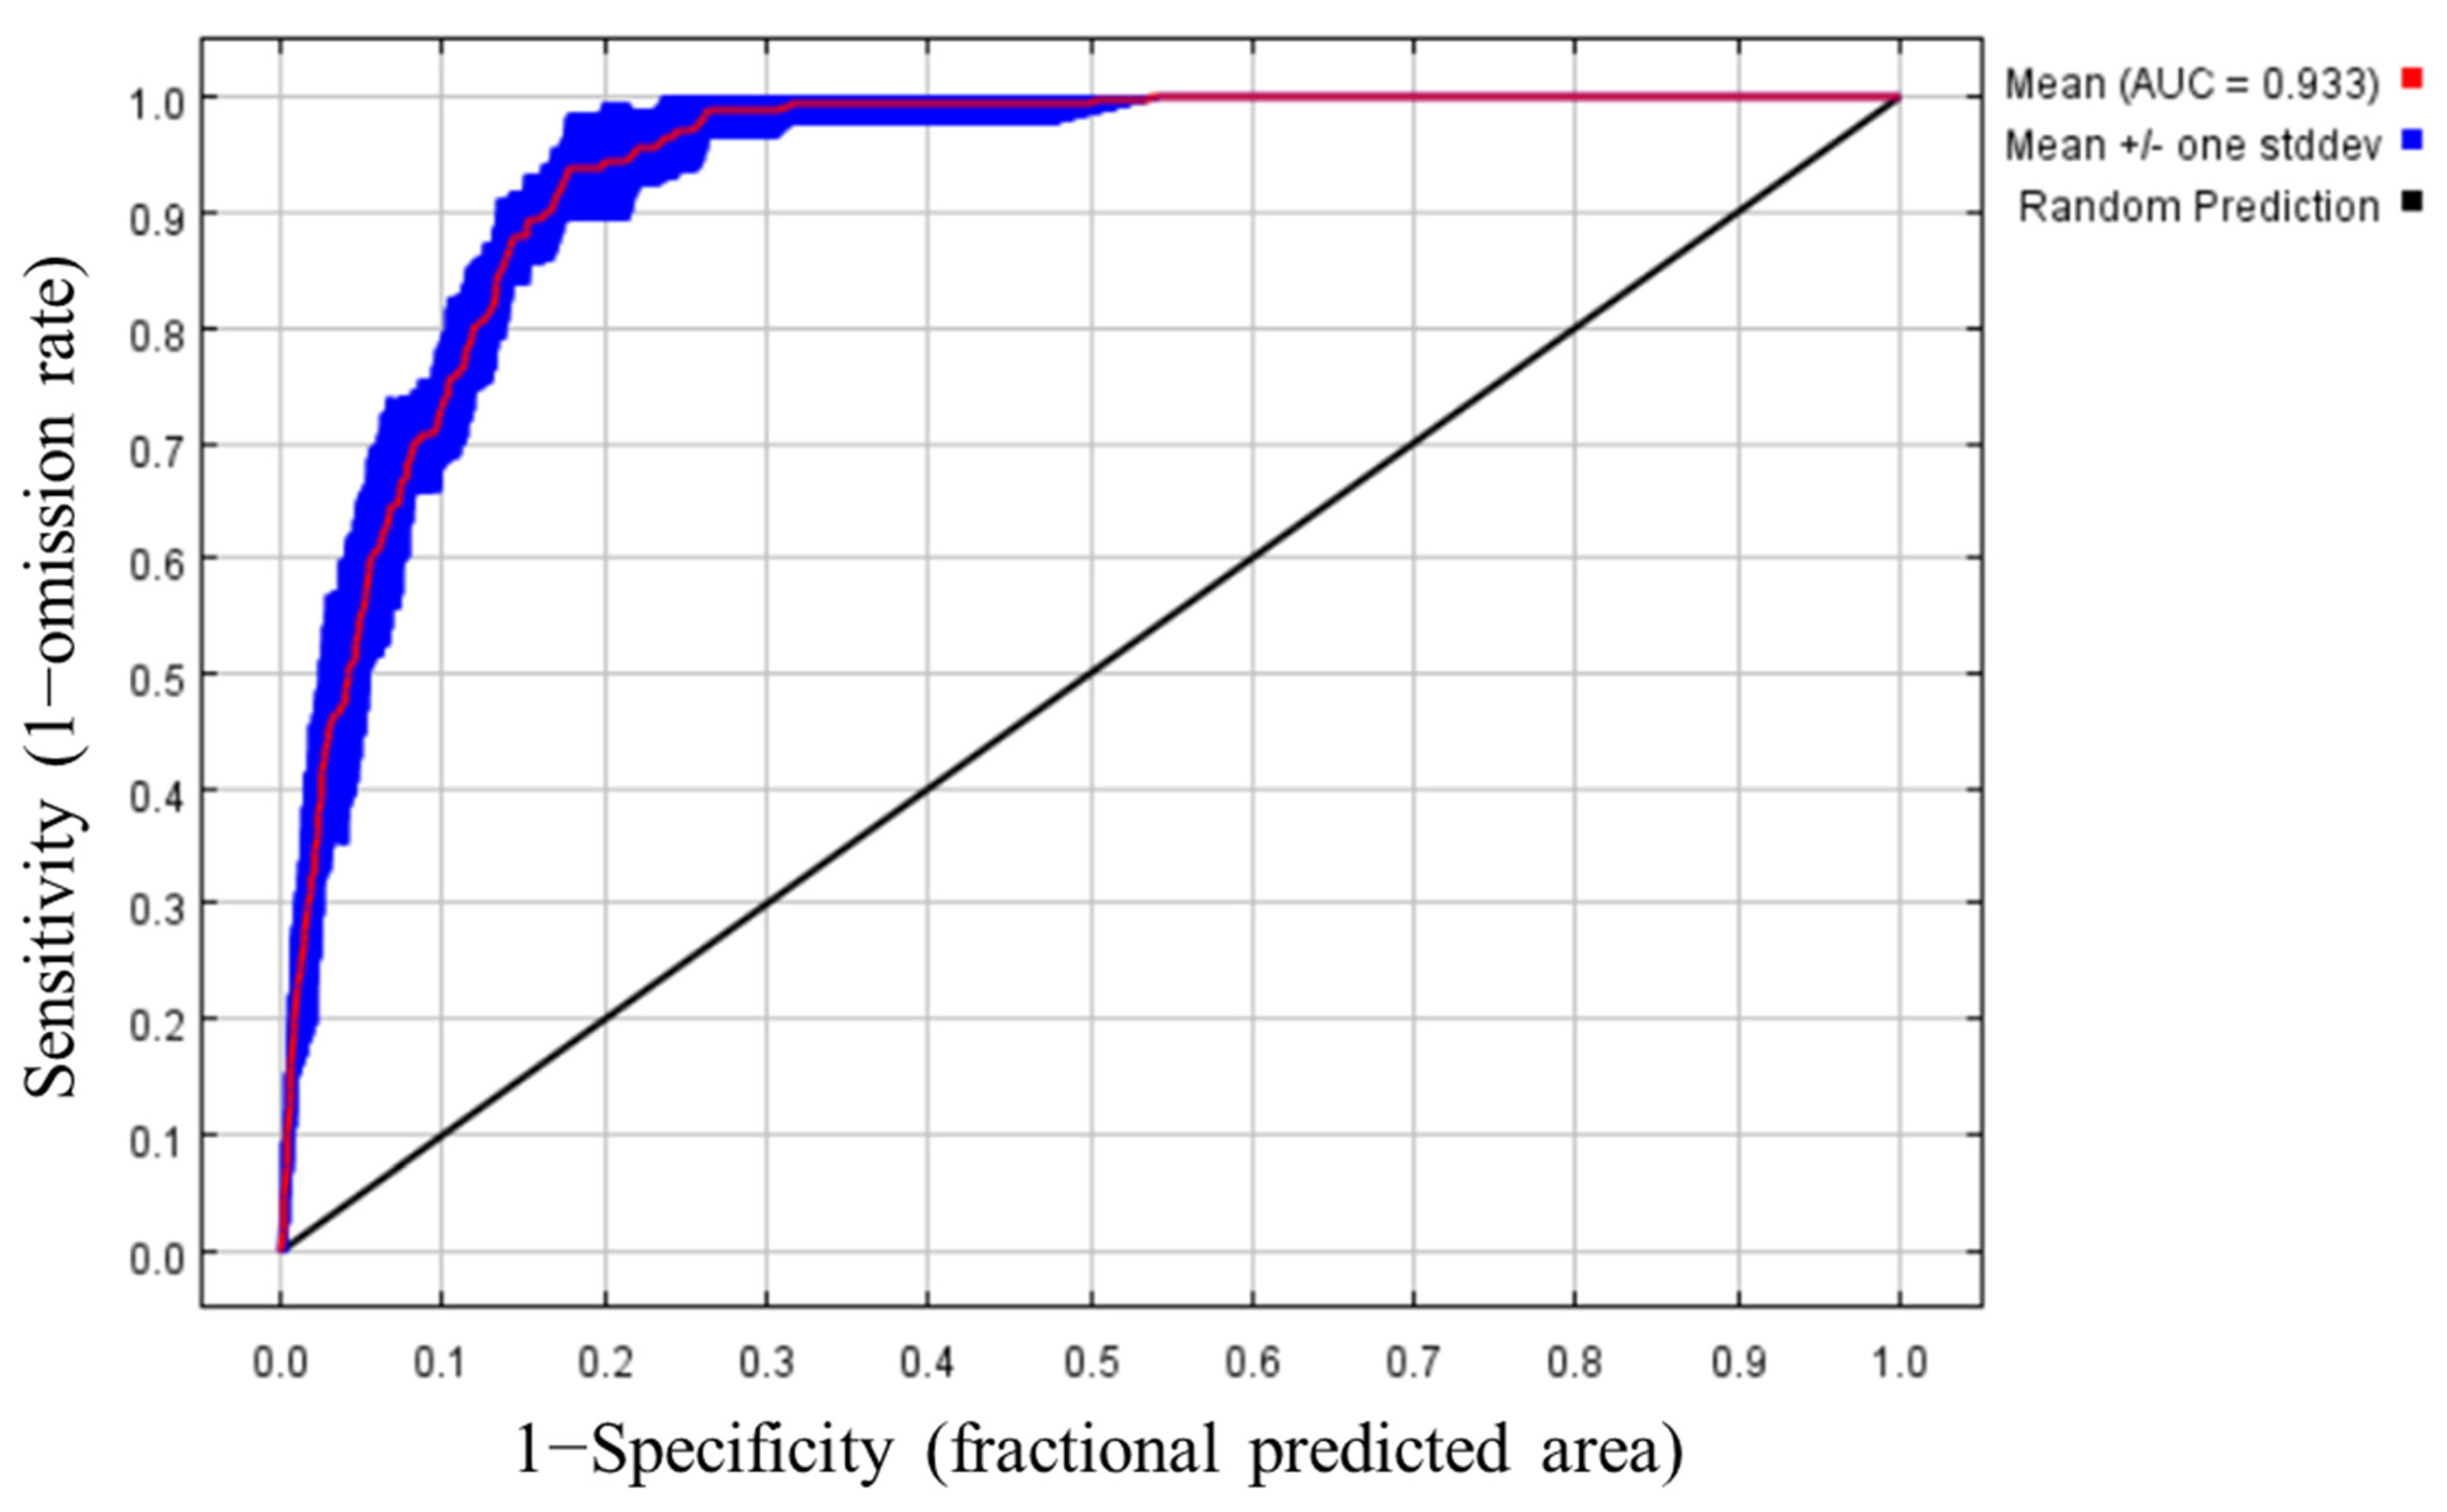
ROC curve analysis of the geographical distribution of kiwifruit brown spot using the MaxEnt model showed that the average AUC value of 10 replicates was 0.933 ± 0.012 (Figure 2), which was significantly higher than the random predicted value of 0.5. According to the evaluation criteria, the accuracy of the model was ‘excellent’. The above results demonstrated that the model had high reliability and could be used for subsequent analysis.
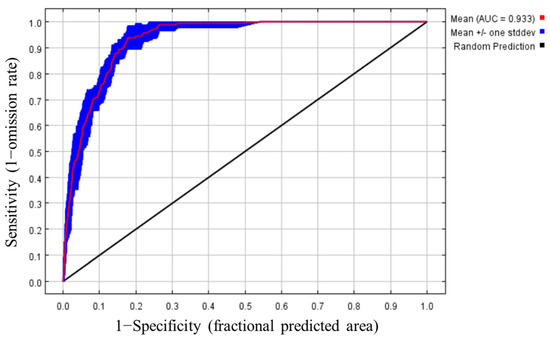
Figure 2.
ROC curve analysis and AUC values for the MaxEnt model.
3.4. Selection of the Key Environmental Factors
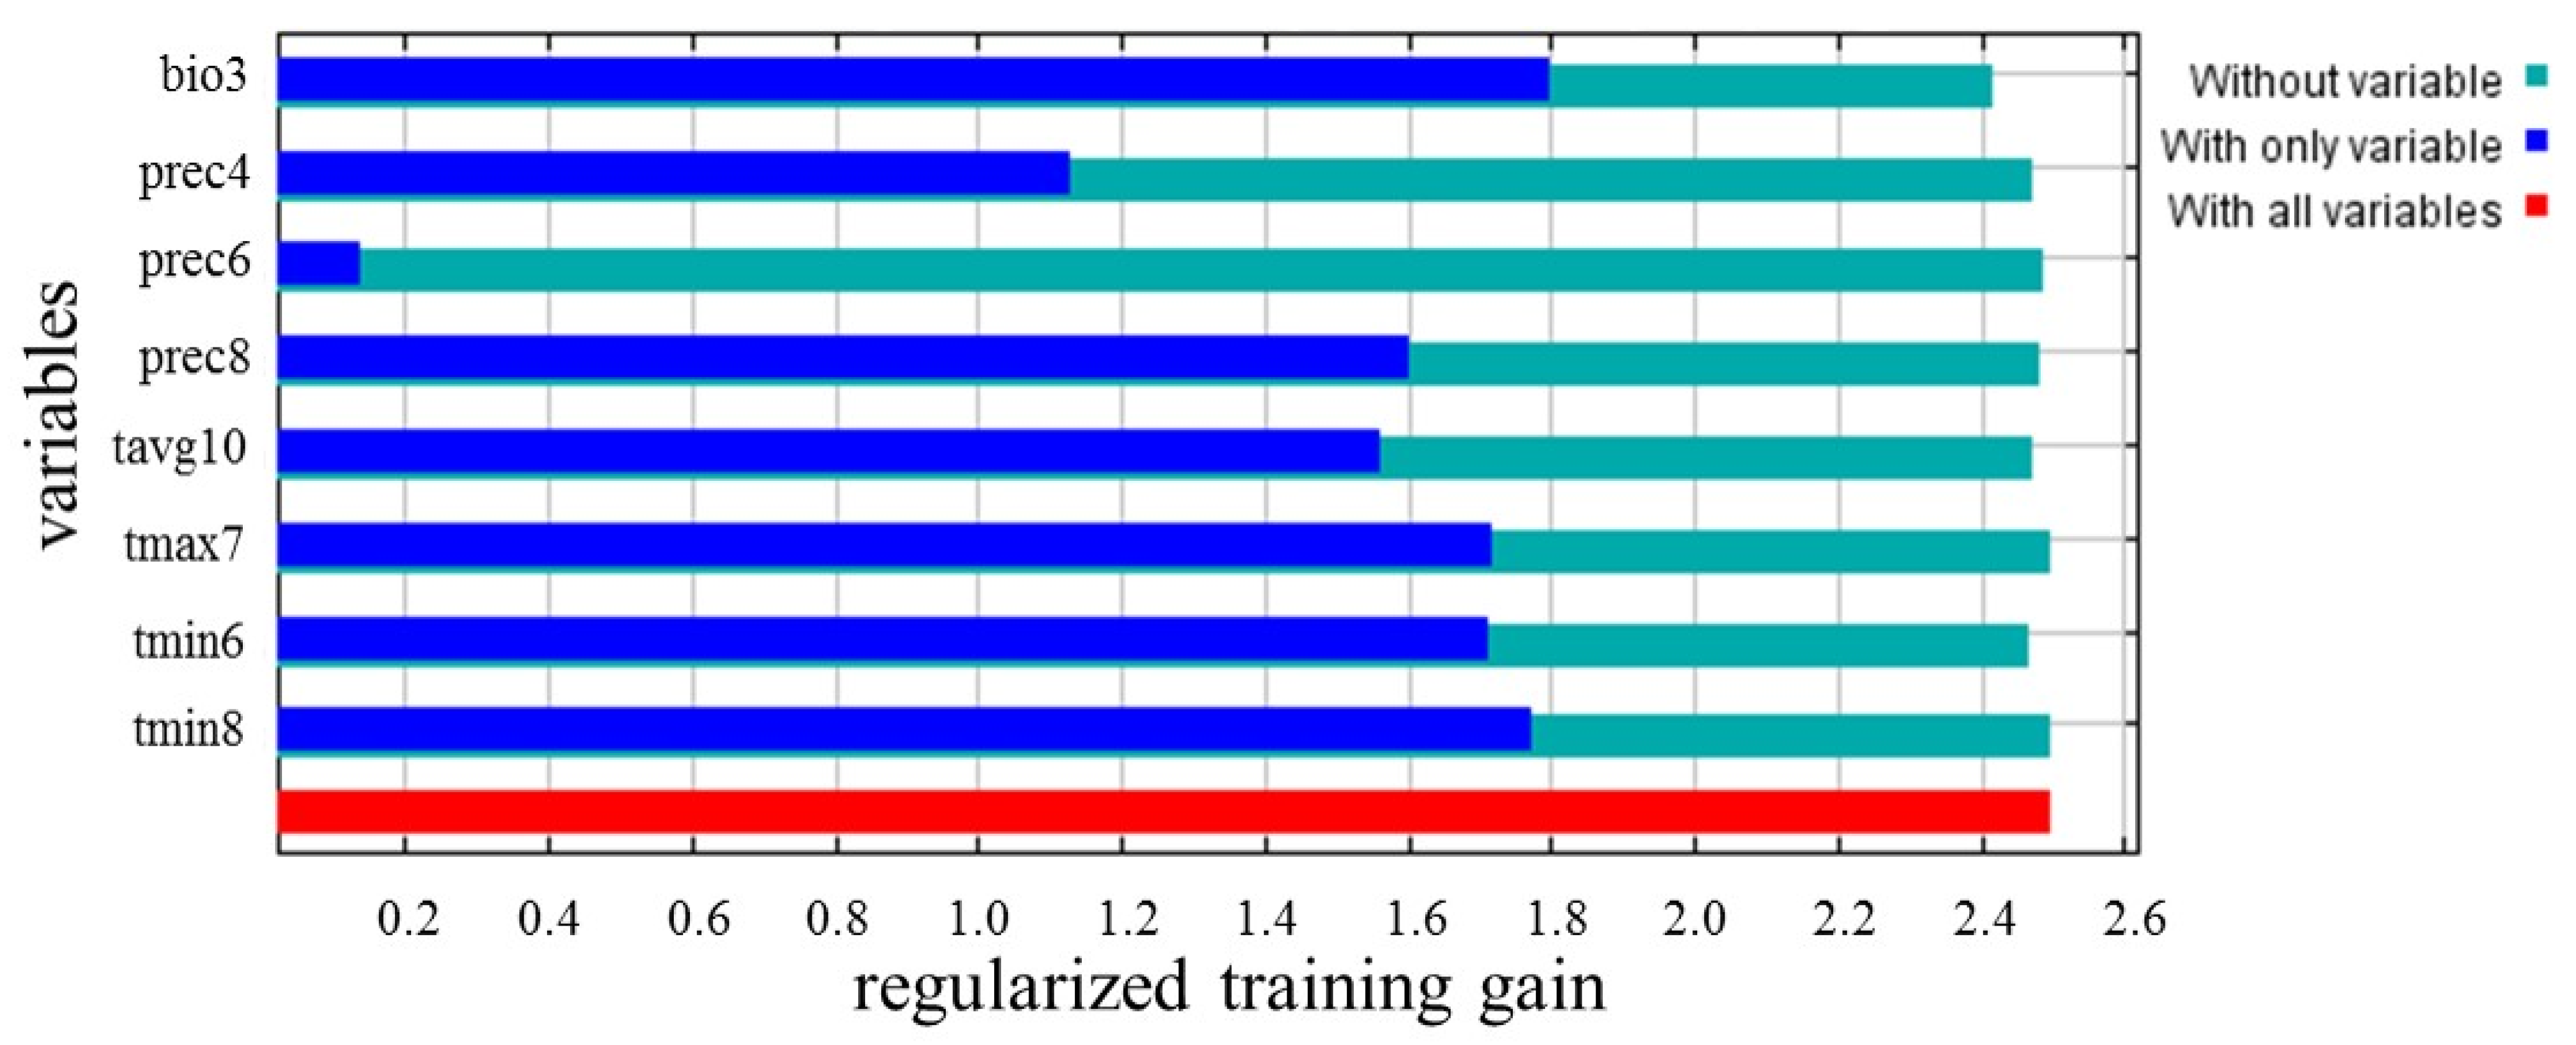
The importance of each variable in the final model was determined by examining the regularized training gains when ‘with only variable’, ‘without variable’, and ‘with all variables’ were used for the simulation. As shown in Figure 3, bio3 was identified as the most important factor affecting the distribution of kiwifruit brown spot, and its training gain reached 1.8. tmin8, tmax7, and tmin6 were also important factors, and their individual training gains exceeded 1.7. prec8 and tavg10 were also important for the disease distribution, with training gains of 1.60 and 1.56, respectively. The contribution of prec6 to the model was the lowest. In conclusion, bio3, tmin8, tmax7, tmin6, prec8, and tavg10 were the key environmental factors affecting the distribution of kiwifruit brown spot.
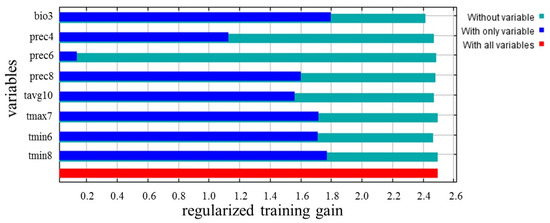
Figure 3.
Jackknife test for the importance of environmental variables in the suitability distribution.
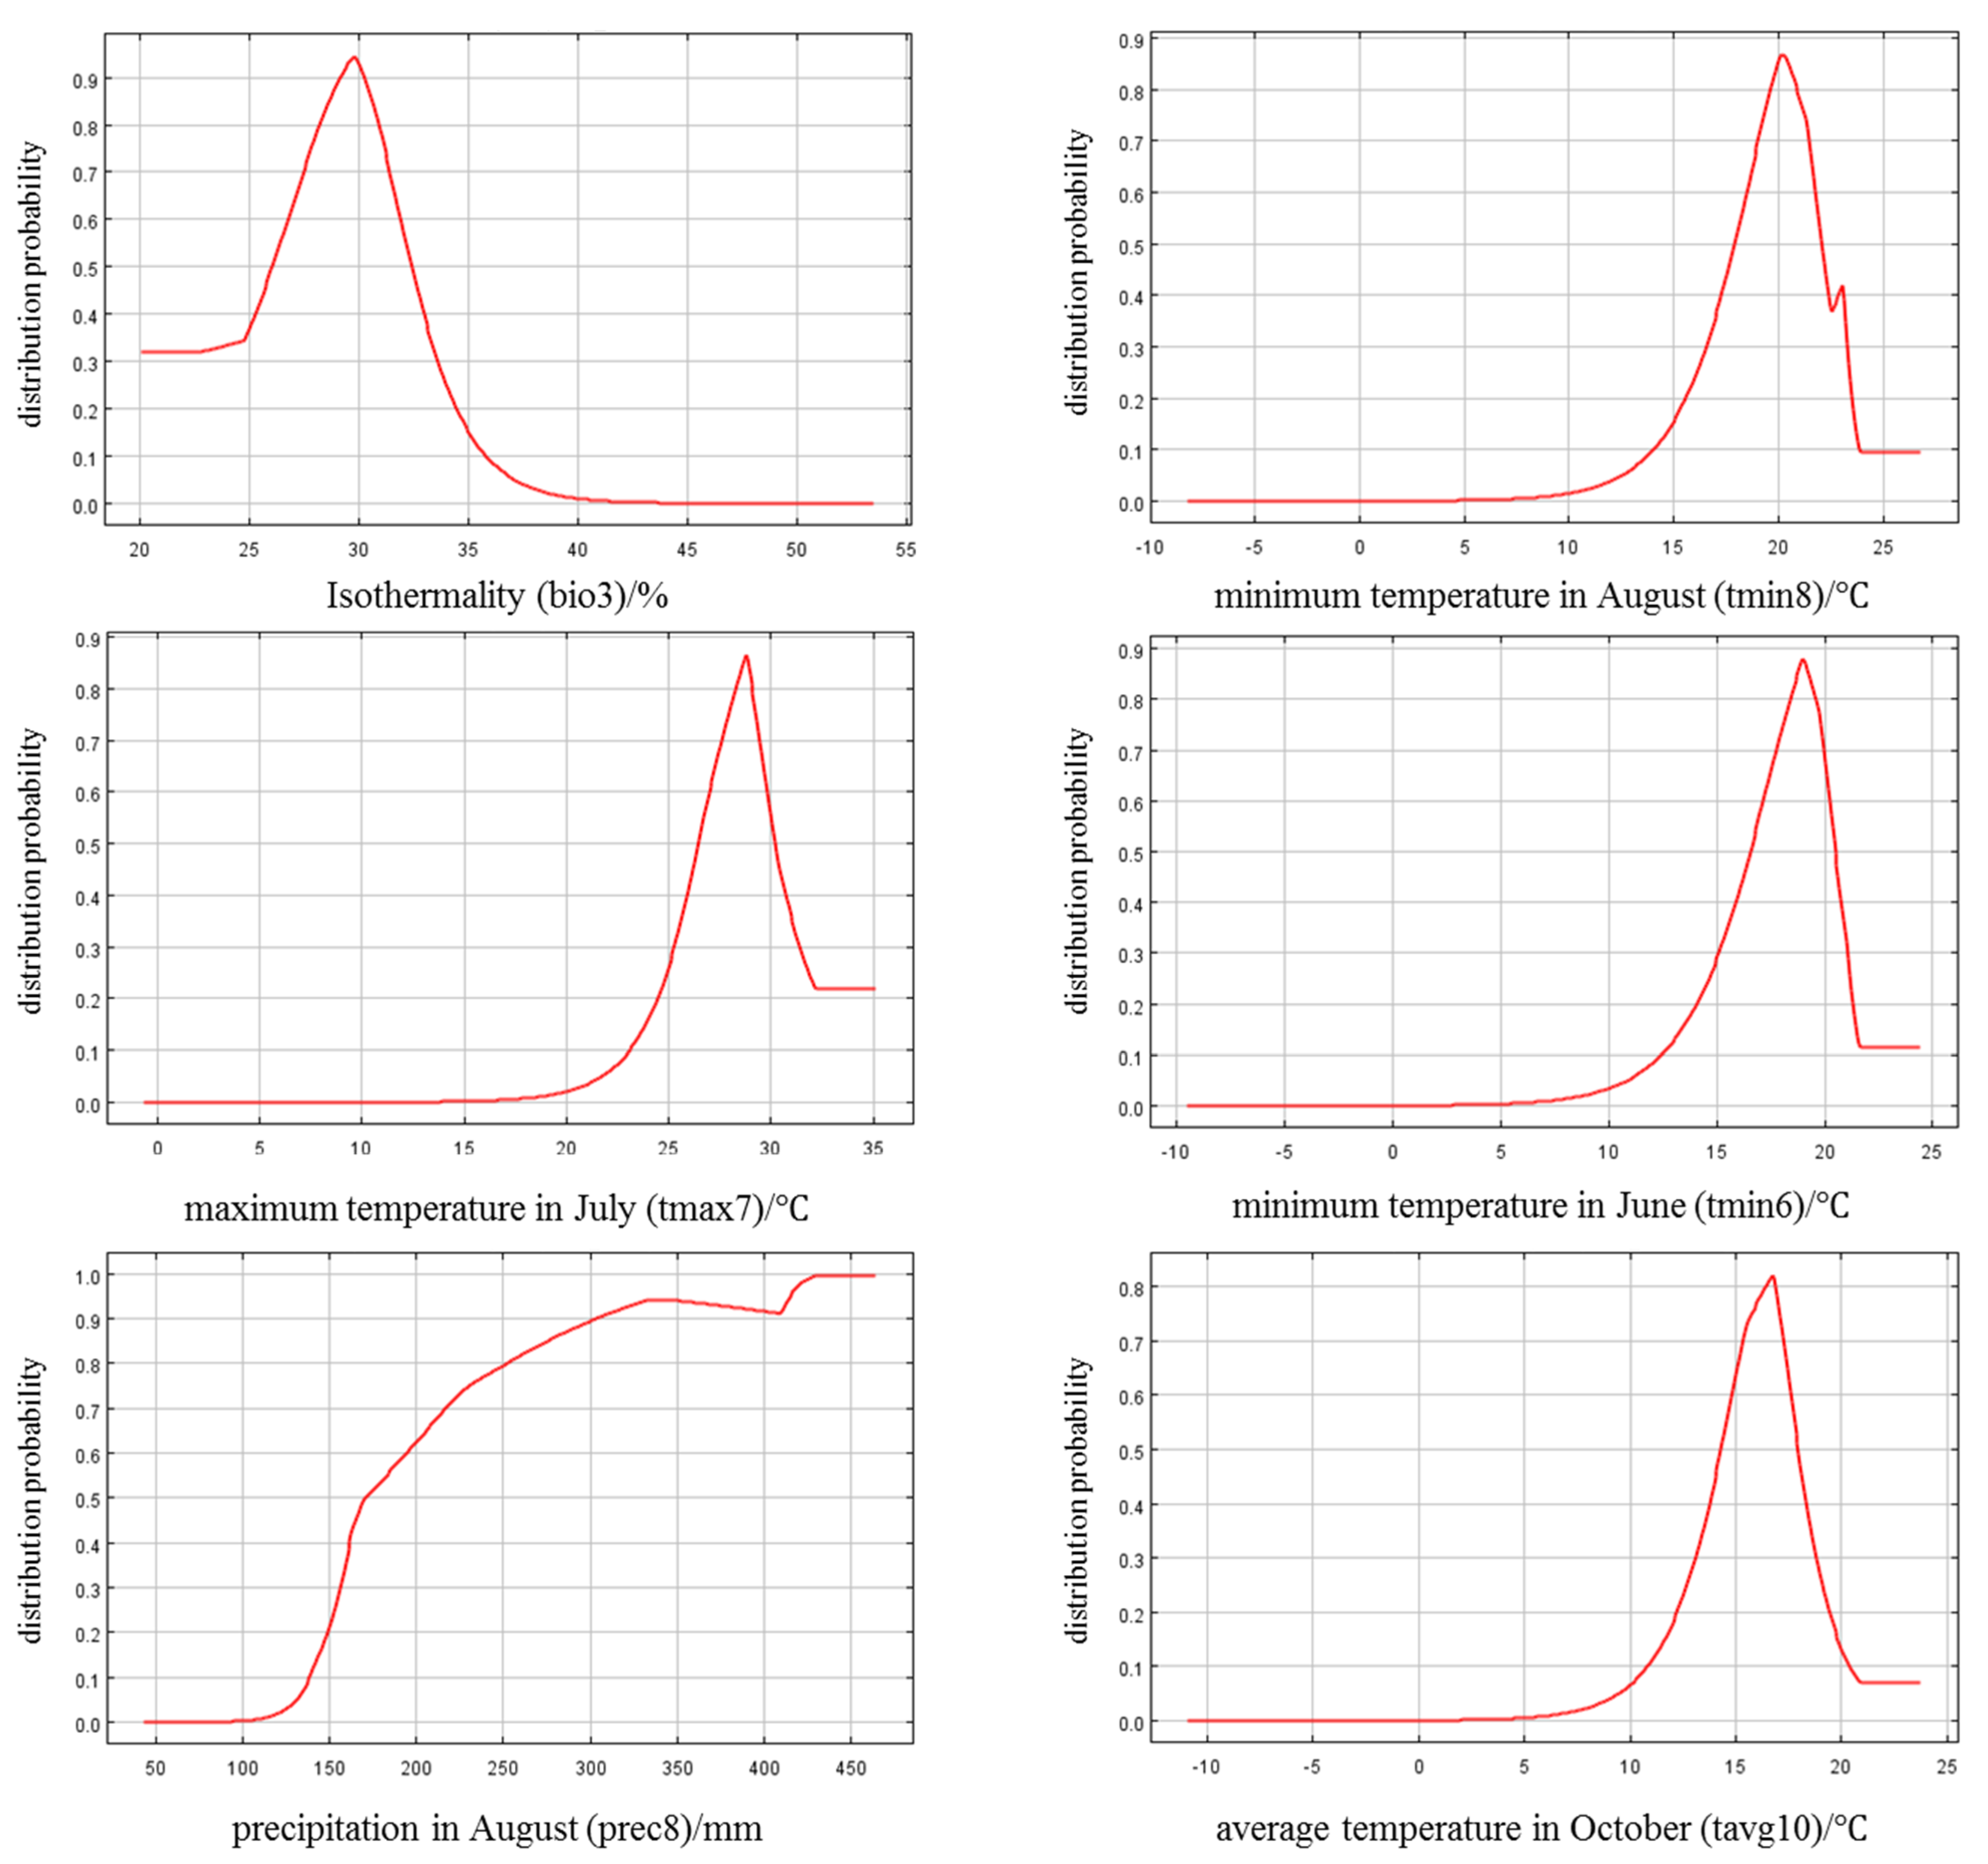
3.5. Analysis of Response Curve
Figure 4 was displays the response curves between the distribution probability and environmental variables, with a probability of 0.33 as the threshold for dividing the suitability of each variable. The results showed that when the suitable range of bio3 was 24.3–33.7%, the distribution probability exceeded 0.33 and reached its highest value at 29.8%, indicating that it was most conducive to the occurrence of kiwifruit brown spot. Low temperatures in August were not conducive to disease occurrence. When tmin8 was below 16.3 °C or above 23.6 °C, the distribution probability was lower than 0.33 and reached its highest value at 20.2 °C. At 22.7–23.1 °C, the probability fluctuated and reached a small peak at 23.0 °C. High temperatures in July were also unfavorable for disease occurrence. When the range of tmax7 was 25.5–29.1 °C, the distribution probability increased with the temperature increasing, and decreased with the temperature increasing at 29.1–31.2 °C. When the range of tmin6 was 15.6–18.8 °C, the distribution probability increased with the temperature increasing, and decreased rapidly at 18.8–20.9 °C. prec8 exceeding 158 mm indicated a rapid occurrence and epidemic of kiwifruit brown spot. The distribution probability reached the highest at 331 and 430 mm, with no further changes when the precipitation exceeded 430 mm. The suitable range of tavg10 was 15.6–18.8 °C, with the peak value at 16.2 °C.
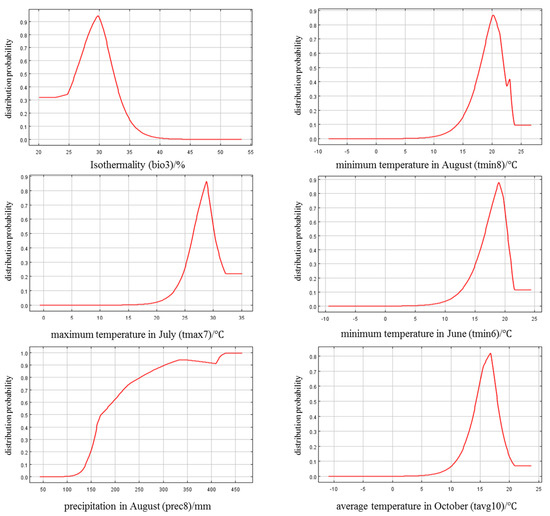
Figure 4.
Response curve between distribution probability and environmental variables.
3.6. Prediction of Potential Distribution
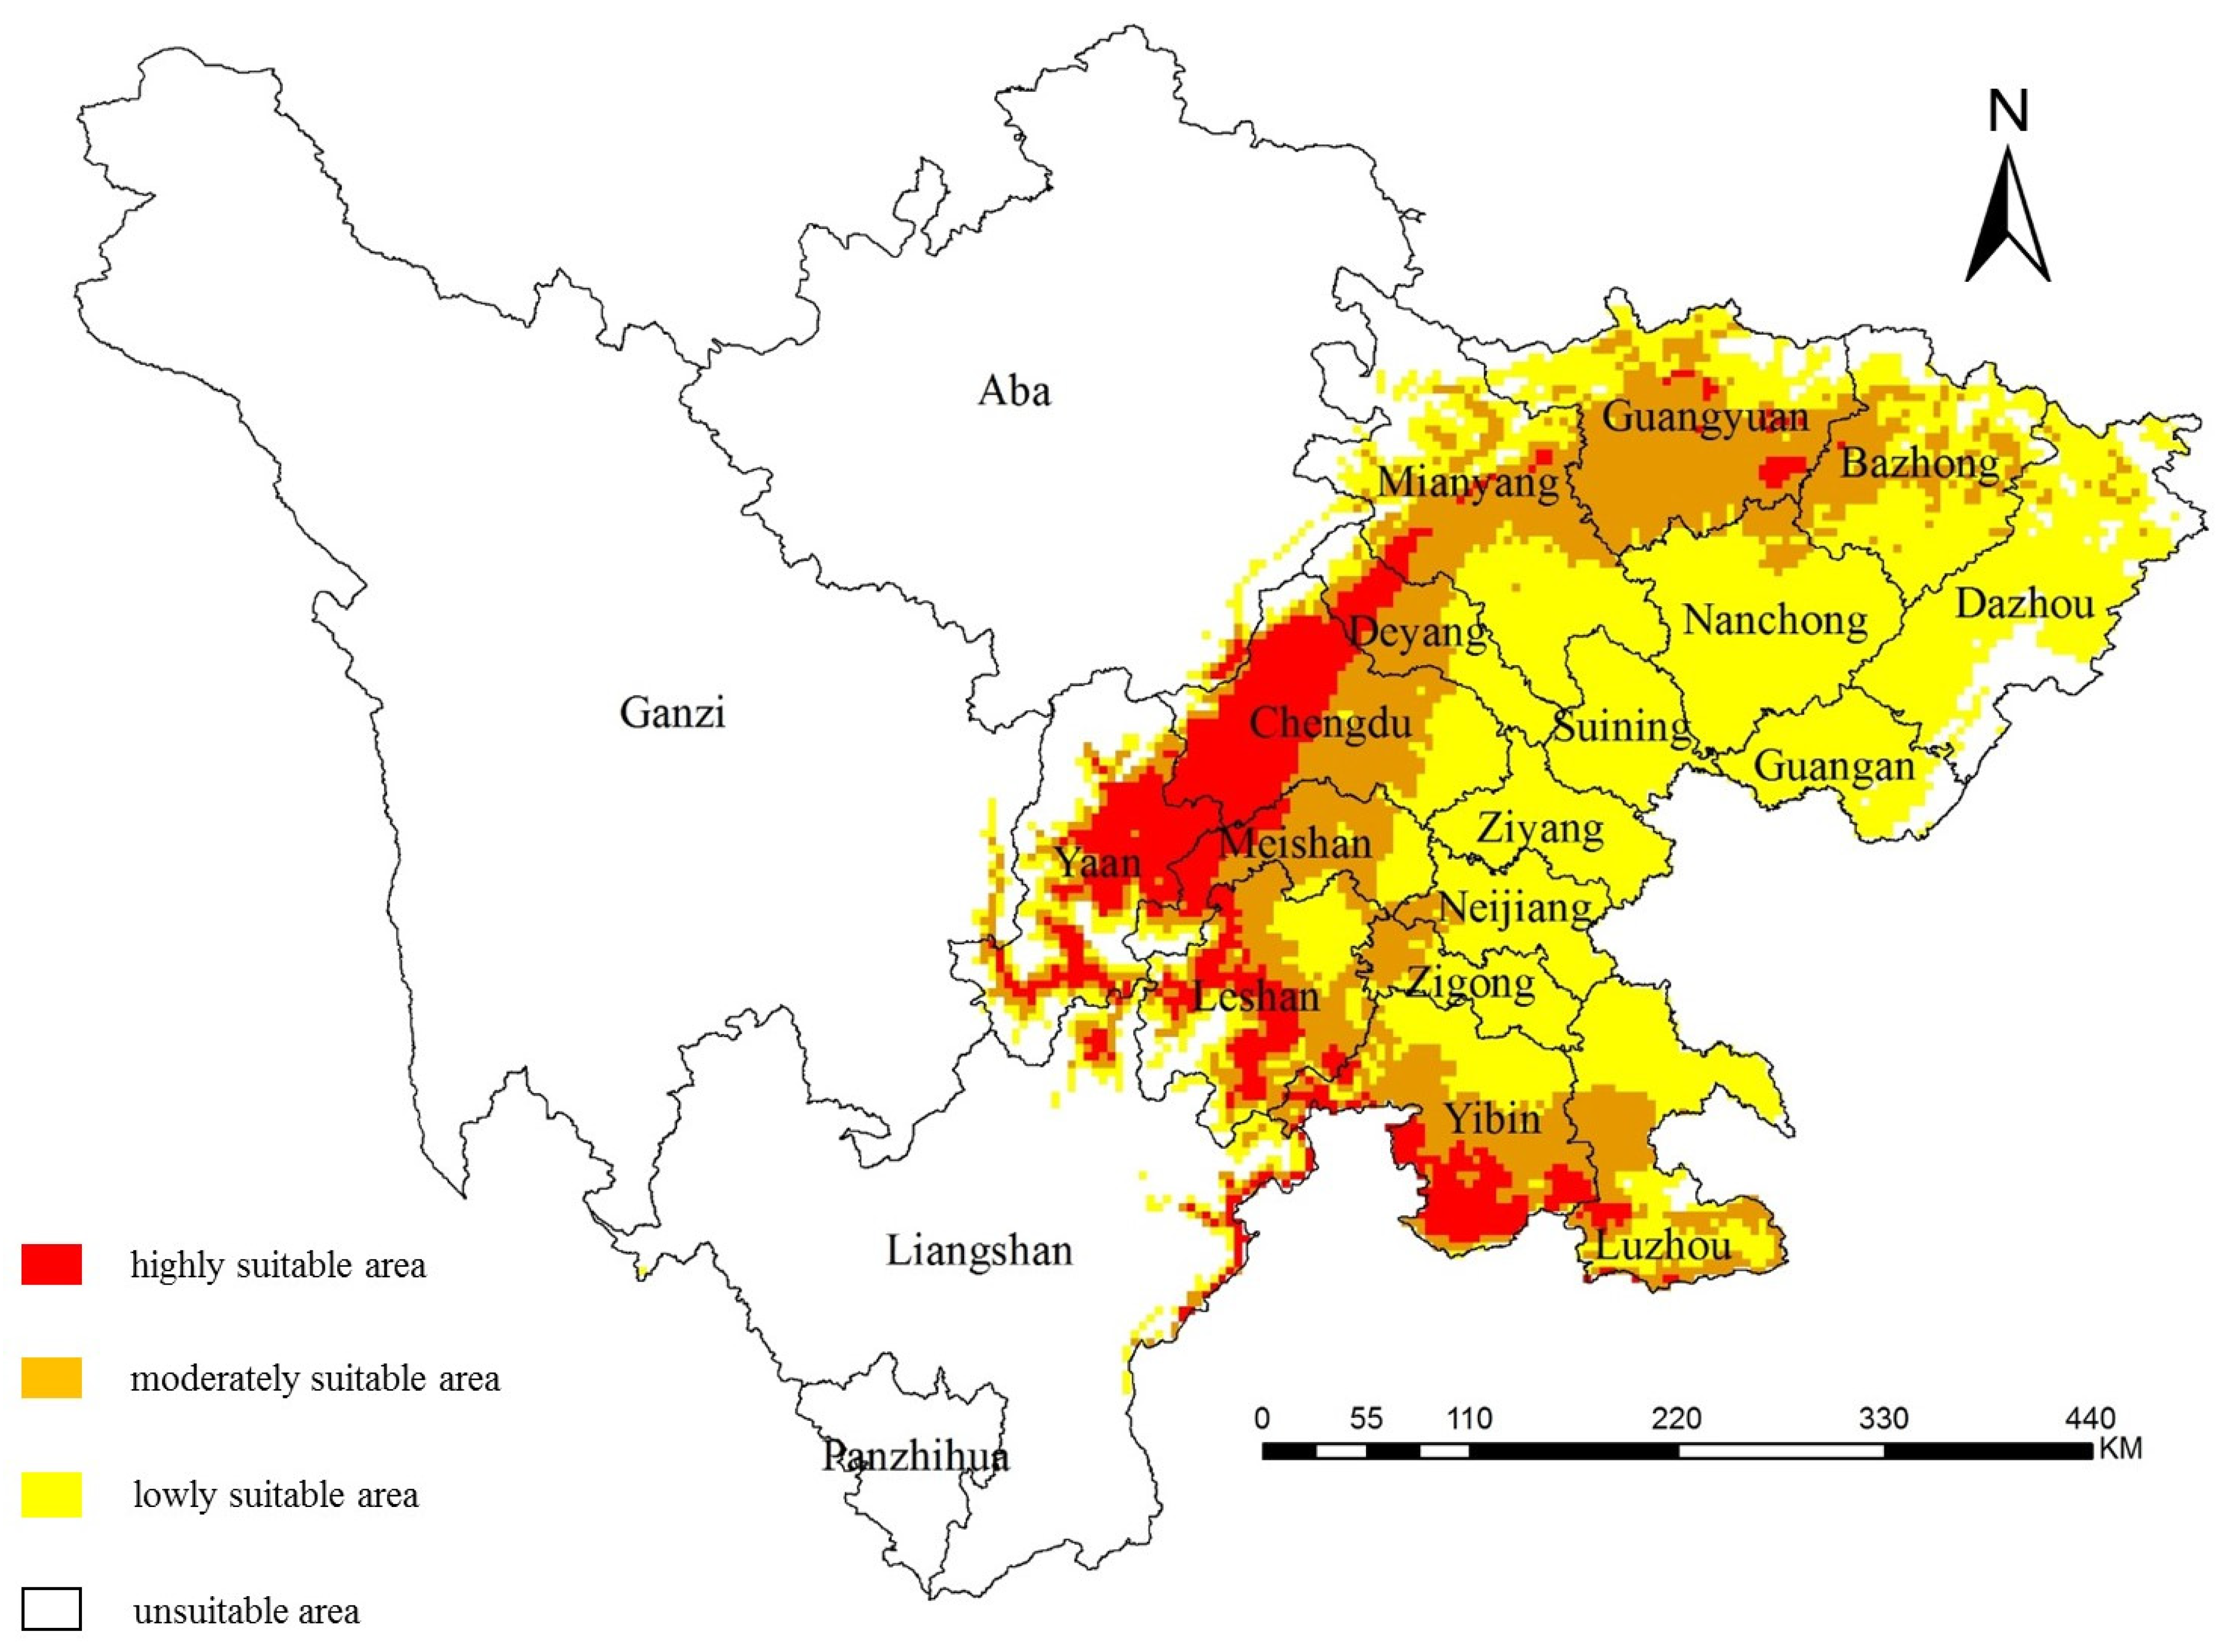
According to Figure 5 and Table 7, the highly suitable areas of kiwifruit brown spot in Sichuan were mainly located in the eastern part of the Chengdu region, the central part of the Ya’an region, the southern part of the Yibin region, the central part of Leshan region, and the eastern part of Meishan region, with a total area of 21,849.83 km2, accounting for 4.49% of the area of the provincial territory. Among them, the Chengdu and Ya’an regions had the highest proportion of highly suitable areas, with 28.12% and 20.94%, respectively. There were no highly suitable areas in the Dazhou, Ganzi, Guang’an, Nanchong, Neijiang, Panzhihua, Suining, Ziyang, and Zigong regions and no moderately suitable areas in the Guang’an, Panzhihua, Suining, and Ziyang regions. Lowly suitable areas were widely distributed in the whole province, except for the Panzhihua region. The entire Ziyang region was classified as lowly suitable areas. The largest area was occupied by unsuitable areas, reaching 318,185.83 km2, mainly distributed in the Ganzi, Aba, and Liangshan regions, with the Ganzi region accounting for the largest proportion, nearly 50%. The entire Panzhihua region was classified as unsuitable areas.
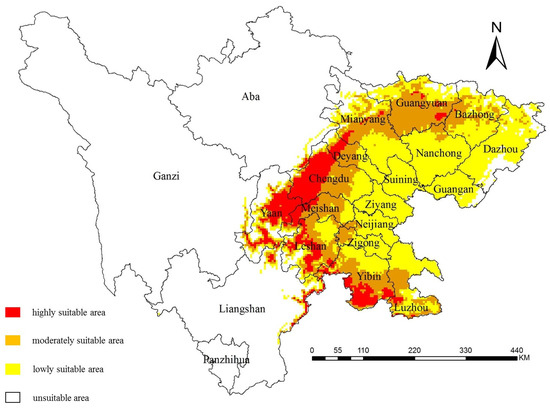
Figure 5.
Prediction of the potential distribution of kiwifruit brown spot in Sichuan (city boundary).
Table 7.
Prediction of the potential distribution area of kiwifruit brown spot (regions).
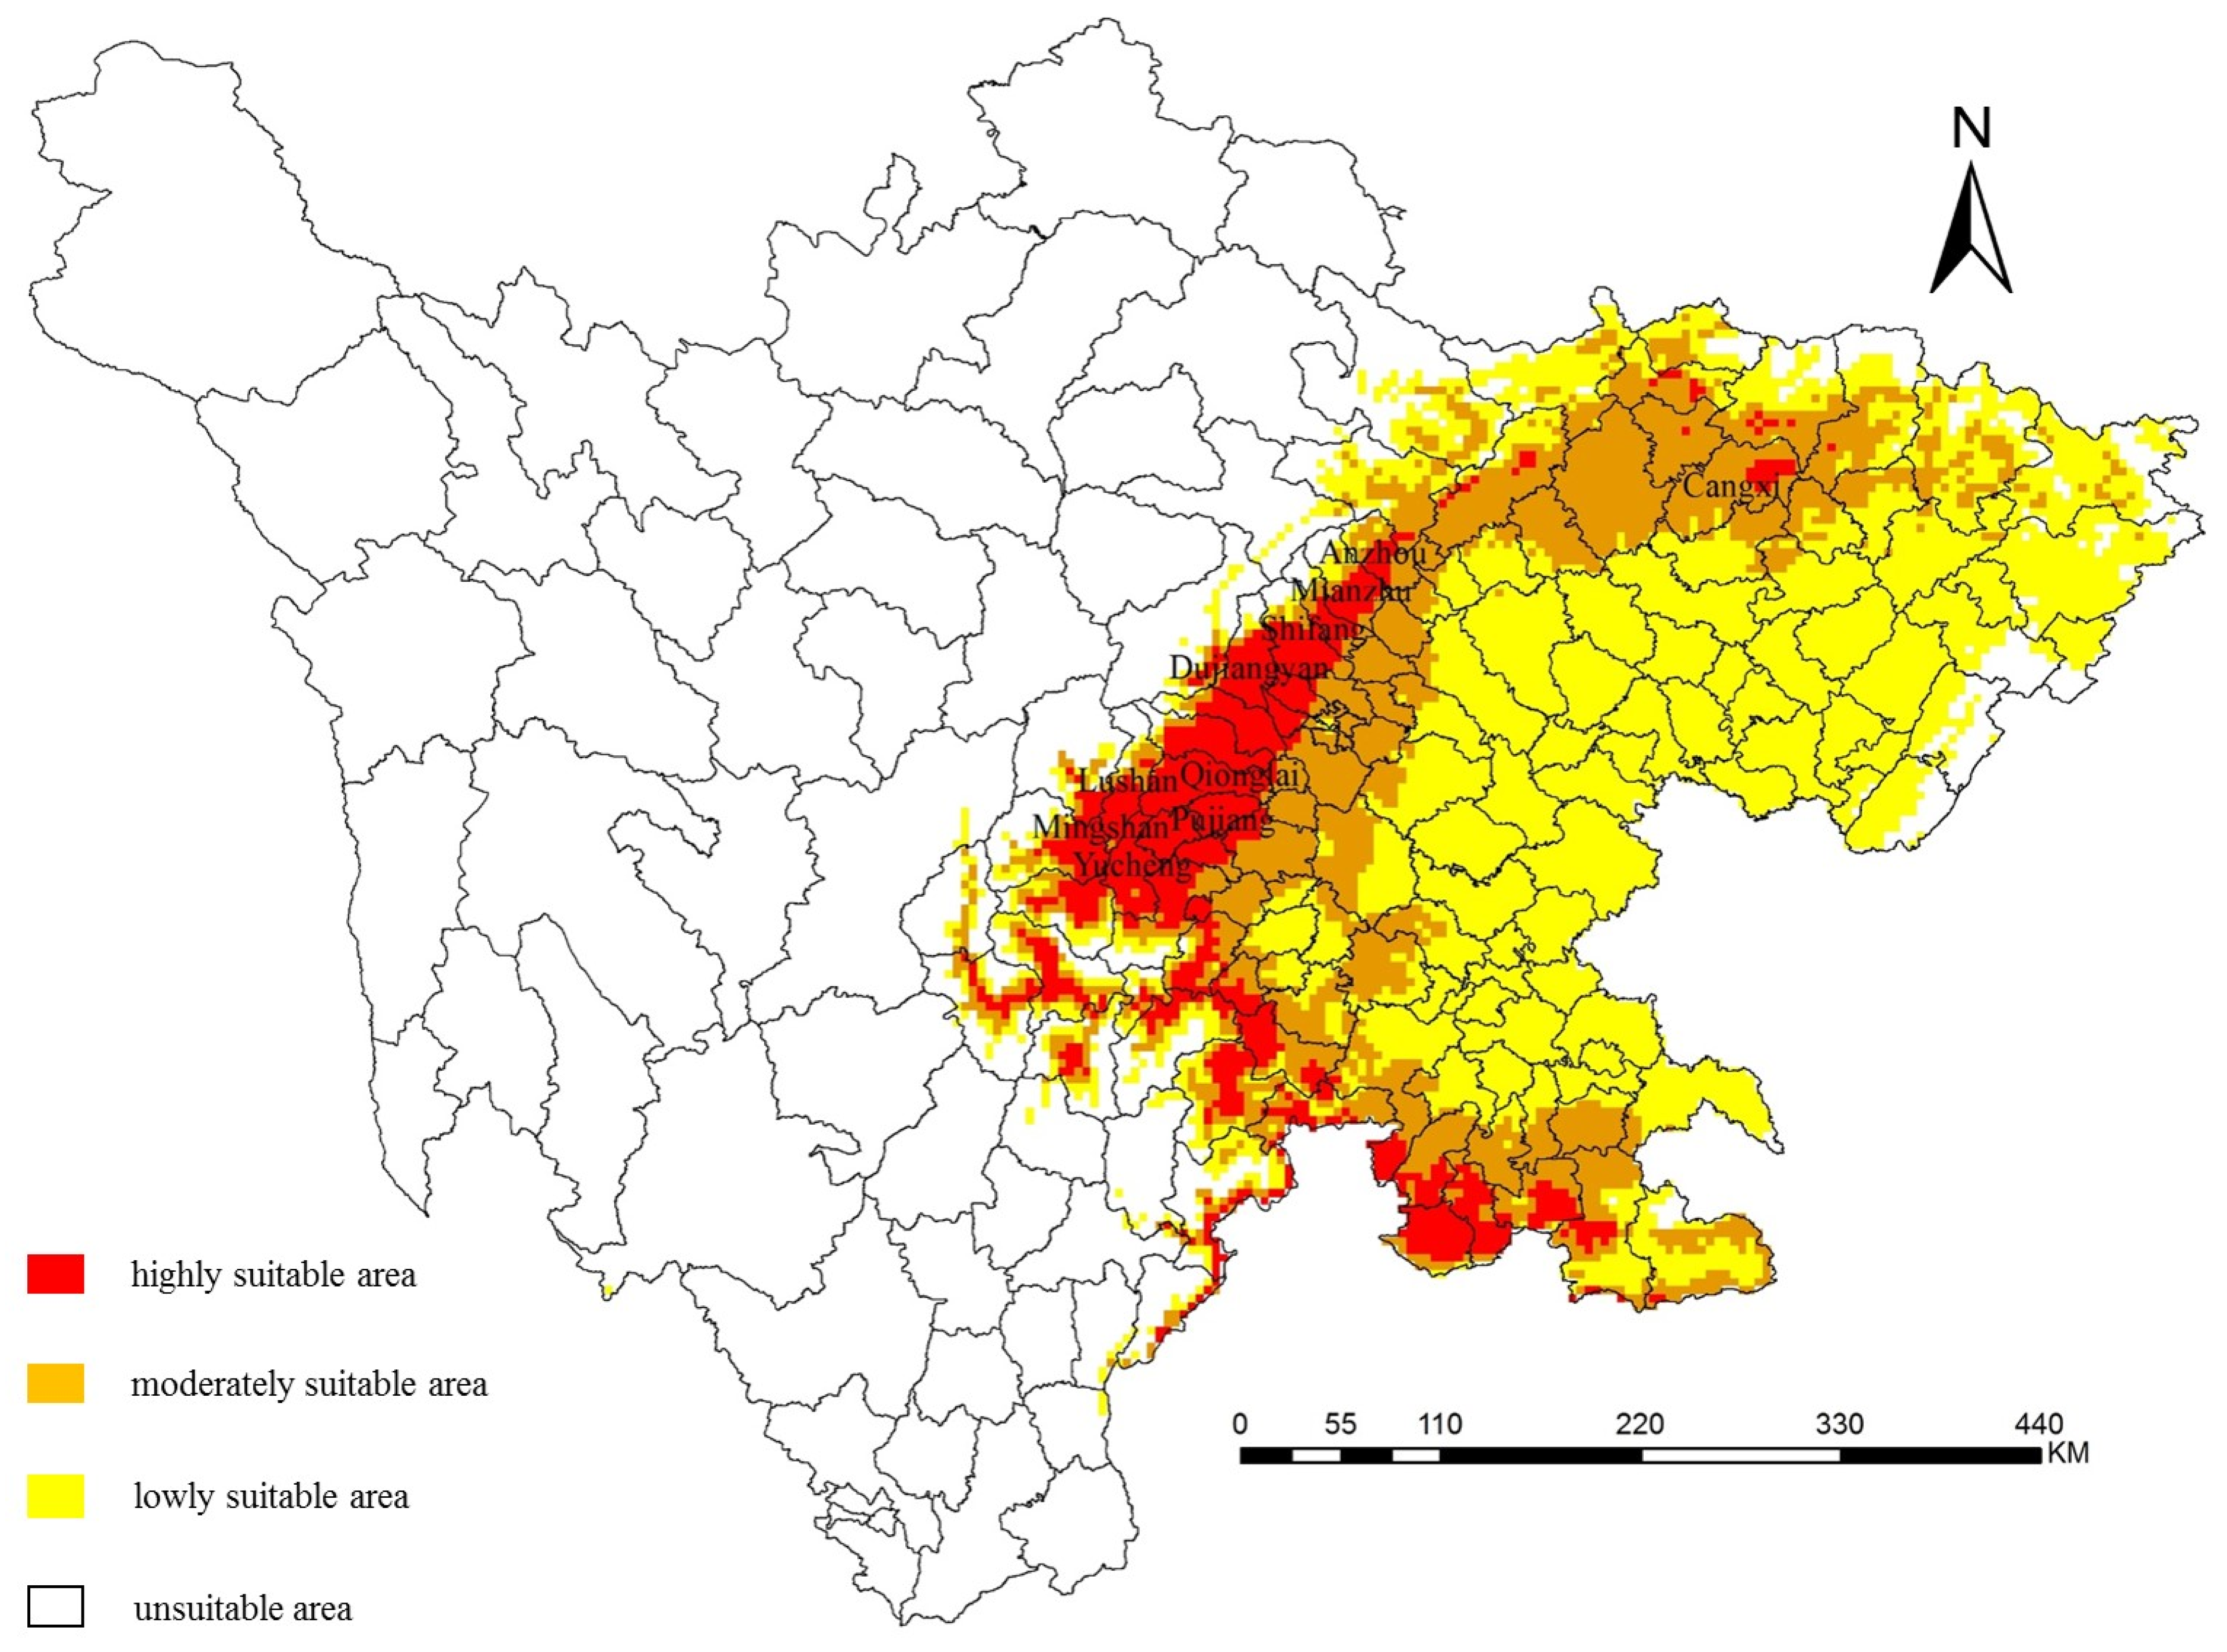
According to Figure 6 and Table 8, highly suitable areas were distributed in all eleven central planting areas of kiwifruit. Except for the Anzhou District and Cangxi County, other regions had highly suitable areas accounting for the largest proportion of their total areas. Moreover, the highly suitable area of Qionglai City was the largest, reaching 1348.75 km2. More than 90% of the total area in Pujiang County, Qionglai City, Mingshan District, and Yucheng District were classified as highly suitable areas. Among them, Pujiang County and Mingshan District were entirely classified as highly suitable areas. The whole area of the Anzhou District and Cangxi County were mainly moderately suitable areas, accounting for 65.15% and 82.31%, respectively. Mianzhu City had the largest lowly and unsuitable areas in among the eleven regions, covering 197.82 and 261.45 km2, respectively.
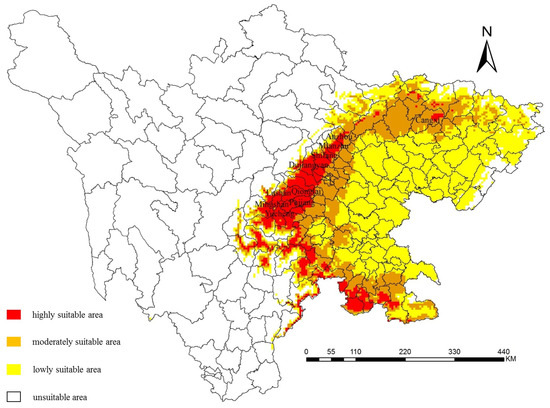
Figure 6.
Prediction of the potential distribution of kiwifruit brown spot in Sichuan (country boundary).
Table 8.
Prediction of the potential distribution area of kiwifruit brown spot (central planting areas).
3.7. Field Test of the Model
Out of the 45 test points, 38 of them were accurately simulated (Table 9). The model accuracy calculated was 84.44%, demonstrating high reliability. Among the 7 inaccurate simulation points, all were overfitted, indicating that the level of the predicted suitability was higher than the actual occurrence.
Table 9.
Detailed information of the actual survey points for the field test.
4. Discussion
In this study, continuous monitoring of the epidemic of kiwifruit brown spot in Sichuan revealed that the occurrence of the disease was more severe in the red-fleshed varieties and less severe in the yellow-fleshed and green-fleshed varieties. These findings were consistent with the resistance evaluation of Huang et al. [28] in the kiwifruit germplasm materials to kiwifruit brown spot. The study also highlighted the close relationship between variety layout and the occurrence and epidemic of kiwifruit brown spot. With the continuous expansion of the highly susceptible variety cultivation, kiwifruit brown spot has become the most significant fungal disease in the Sichuan-producing region. However, the impact of variety simplification becomes increasingly evident, and has led to an increased risk of disaster caused by the disease. At present, the prevention of the disease in production is still mainly dependent on chemical control, which is not conducive to the healthy and sustainable development of the kiwifruit industry. The breeding and utilization of resistant varieties are recommended as the most economical and effective measures to control the disease. Therefore, in highly suitable areas, the introduction of resistant varieties, such as Ruiyu and Jinyan, should be recommended. Additionally, the “technical regulations for comprehensive control of kiwifruit brown spot” [31] formulated by Sichuan Agricultural University should be adopted for the scientific and efficient control of the disease. Consistent with the research conclusion of Cui [32], the incidence and disease index were significantly negatively correlated with altitude; as the altitude increased, they decreased gradually. However, further research is needed to determine the altitude boundary for disease occurrence. Since WorldClim datasets are generated by integrating and interpolating the basic data of meteorological stations at different altitudes around the world, altitude information has been implied [18]. Therefore, altitude was not selected as an environmental variable for the MaxEnt prediction model in this study.
Currently, there is limited information on the occurrence and epidemic regularity of kiwifruit brown spot in large-scale areas. Our group has conducted some work on the epidemic dynamics in the early stage, mainly focusing on field disease monitoring and data collection, providing a certain foundation for the construction of prediction models. In this study, the MaxEnt model was employed to simulate and predict the potential distribution of kiwifruit brown spot in Sichuan, and suitability regionalization was conducted using ArcGIS. The suitable areas of each region were calculated, the distribution of central planting areas was analyzed, and the accuracy of the model was verified through field tests. The results indicated that the highly suitable areas of kiwifruit brown spot were mainly located in the Chengdu and Ya’an regions, while the unsuitable areas were mainly distributed in the Ganzi, Aba, and Liangshan regions. The Panzhihua region was entirely classified as an unsuitable area. According to the central planting areas of red-fleshed kiwifruit, Pujiang County and Mingshan District were entirely classified as highly suitable distribution areas. Both kiwifruit brown spot and bacterial canker disease had an adverse impact on the healthy development of the industry. Therefore, in the layout of varieties, both diseases should be comprehensively considered. Ma. [33] demonstrated that the potential severe and suitable areas for kiwifruit bacterial canker disease were mainly distributed along the Longmen Mountains from south to north, connected with the Qinba Mountains, and concentrated in the Ya’an, Chengdu, and Guangyuan regions, which had a high contact ratio with the highly suitable areas for kiwifruit brown spot in this study. Wang et al. [18] indicated that the unsuitable areas of kiwifruit bacterial canker disease in Sichuan were mainly located in the Ganzi, Liangshan, and Panzhihua regions, consistent with the findings of kiwifruit brown spot in this study. The occurrence regionalization of kiwifruit brown spot in Sichuan has been clarified, which not only provided a scientific and effective theoretical basis for the formulation of a prevention and control strategy, but also played an important role in the layout and development of the kiwifruit industry in combination with previous studies on kiwifruit bacterial canker disease.
A disease epidemic is a result of the interaction between host plants and pathogens under the influence of environmental conditions. Environmental conditions mainly include meteorological factors, soil conditions, tillage system, and cultivation measures, with meteorological factors playing an extremely important role. Many researchers have utilized modeling to select key meteorological factors for disease prediction. For instance, Chen et al. [34] found that the amount of rainfall in spring significantly influenced the date of the grapevine downy mildew symptom onset. Chaulagain et al. [35] used correlation analysis and stepwise logistic regression to identify afternoon humid thermal ratio (AHTR), temperature-based duration variables, and their interaction terms as the most significant variables associated with brown rust epidemics of sugarcane in Florida. Kiwifruit brown spot initially occurred in late June, rapidly spread in mid-July, and gradually slowed down until the end of October. In this study, the key environmental variables affecting the potential distribution were identified using the jackknife method, including bio3, tmin8, tmax7, tmin6, prec8, and tavg10, which completely coincide with the actual phenology period of kiwifruit brown spot. Additionally, kiwifruit brown spot develops rapidly under high temperature and humidity conditions, with excessive temperatures inhibiting its development [3,7], which is consistent with the response curve results that the temperature in June and August should not be too low, the temperature in July should not be too high, and the precipitation in August reaches a certain amount. Although our study did not include all factors contributing to the distribution, the selected environmental variables can provide a basis for the future refinement and assessment of a prediction model of kiwifruit brown spot.
An ecological niche model is an emerging technology based on ecological principles, according to the known geographical distribution information of species and corresponding environmental variables, using specific algorithms to calculate the niche demand of target species in the designated area and combining GIS technology to project its distribution probability onto the map [36,37]. However, species distribution models usually lead to overestimating or underestimating the species distribution, namely, false positive and false negative. In this study, the suitability levels predicted by the MaxEnt model were often higher than the actual disease occurrence level, resulting in many false positives. We supposed that the reason for this phenomenon might be attributed to the species distribution model only distinguishing “existence” or “nonexistence” when extracting distribution information, without considering the disease occurrence level, resulting in overfitting. Additionally, the distribution information in this study was mainly obtained through field investigations and local reports inquiry, with a total of 225 distribution points. The data were true, reliable, and relatively systematic, but there might be some omissions in their completeness, which might also cause some errors. Furthermore, previous studies have indicated that the occurrence and epidemic of leaf spot disease were not only affected by meteorological factors, altitude, and cultivars, but also closely related to abiotic factors, such as planting density, site conditions, and canopy density [14,38,39]. Gonzalez-Dominguez et al. [40] developed a model using weather and host phenology to predict the infection period and disease progression of Phomopsis cane and leaf spot throughout the season, and validated its performance using ROC analysis (AUROC > 0.7). Ortega-Acosta et al. [41] established a Weibull model using multiple abiotic factors to describe the epidemic dynamics of Roselle leaf and calyx spot induced by C. cassiicola. Therefore, various factors should be considered comprehensively in future research to further improve the prediction model of kiwifruit brown spot.
5. Conclusions
In this study, the correlation between the occurrence of kiwifruit brown spot and variety and altitude was revealed, its potential distribution was predicted, and the suitable areas were regionalized, which could provide scientific suggestions for the variety layout of kiwifruit in Sichuan. At the same time, six key environmental variables were identified, which could lay the foundation for the subsequent disease prediction and forecast, and provide a theoretical basis for the precise prevention and control of kiwifruit brown spot.
Author Contributions
Y.Z.: conceptualization, methodology, formal analysis, investigation, writing—original draft, visualization. K.Y.: software, validation, investigation, writing—reviewing and editing. M.M.: methodology, writing—reviewing and editing, supervision. Y.C.: investigation, data curation. J.X.: investigation, data curation. W.C.: investigation, data curation. R.Y.: software, investigation. C.W.: investigation. G.G.: validation, resources, writing—reviewing and editing, supervision, project administration, funding acquisition. All authors have read and agreed to the published version of the manuscript.
Funding
This work was supported by Key R&D Projects of Sichuan Science and Technology Plan (grant numbers 2021YFN0120, 2021YFN0026) (G.G.), Key R&D Projects of Chengdu Science and Technology Innovation Plan (grant number 2022-YF05-01151-SN) (G.G.), and Sichuan Innovational Team of Industry Technology System of Modern Agriculture (grant number sccxtd-2023-02) (G.G.).
Institutional Review Board Statement
Not applicable.
Informed Consent Statement
Not applicable.
Data Availability Statement
The data presented in this study are available on request from the corresponding author.
Acknowledgments
We would like to thank Wang, R. L., at the Sichuan Provincial Rural Economic Information Center and Chen, L., at Sichuan Agricultural University for their technical guidance on the MaxEnt model.
Conflicts of Interest
The authors declare no conflict of interest.
References
- Nieuwenhuizen, N.J.; Allan, A.C.; Atkinson, R.G. The Genetics of Kiwifruit Flavor and Fragrance. In The Kiwifruit Genome; Springer: Berlin/Heidelberg, Germany, 2016; pp. 135–147. [Google Scholar]
- Richardson, D.P.; Ansell, J.; Drummond, L.N. The nutritional and health attributes of kiwifruit: A review. Eur. J. Nutr. 2018, 57, 2659–2676. [Google Scholar] [CrossRef] [PubMed]
- Xu, J.; Gong, G.S.; Cui, Y.L.; Zhu, Y.H.; Wang, J.; Yao, K.K.; Chen, W.; Wu, C.P.; Yang, R.; Yang, X.D.; et al. Comparison and correlation of Corynespora cassiicola populations from kiwifruit and other hosts based on morphology, phylogeny, and pathogenicity. Plant. Dis. 2022, 106, 1979–1992. [Google Scholar] [CrossRef] [PubMed]
- Wang, K.L.; Li, M.; Wang, Y.X.; Liu, Z.H.; Ni, Y.Y. Effects of extraction methods on the structural characteristics and functional properties of dietary fiber extracted from kiwifruit (Actinidia deliciosa). Food Hydrocoll. 2021, 110, 106162–106172. [Google Scholar] [CrossRef]
- Yang, H.; Wu, X.Y.; Tang, J.Y. Analysis on the current situation and development strategies of kiwifruit industry. China Fruit News. 2018, 35, 16–19. [Google Scholar]
- Yuan, G.Q.; Xie, Y.L.; Tan, D.C.; Li, Q.Q.; Lin, W. First report of leaf spot caused by Corynespora cassiicola on kiwifruit (Actinidia chinensis) in China. Plant Dis. 2014, 98, 1586. [Google Scholar] [CrossRef] [PubMed]
- Cui, Y.L.; Gong, G.G.; Yu, X.M.; Xu, J.; Wen, X.W.; Zhang, M.; Chen, H.B.; Zheng, X.; Zhou, Y.; Chang, X.L. First report of brown leaf spot on kiwifruit caused by Corynespora cassiicola in Sichuan, China. Plant Dis. 2015, 99, 725. [Google Scholar] [CrossRef]
- Gong, G.S.; Li, Q.; Zhang, M.; Cui, Y.L. Primary Color Map and Control Technology of Kiwifruit Pests and Diseases; Science Press: Beijing, China, 2020; pp. 21–29. [Google Scholar]
- Zou, Y.F.; Qiao, H.B.; Cao, X.R.; Liu, W.; Fan, J.R.; Song, Y.L.; Wang, B.T.; Zhou, Y.L. Regionalization of wheat powdery mildew oversummering in China based on digital elevation. J. Int. Agric. 2018, 17, 901–910. [Google Scholar] [CrossRef]
- Kistner-Thomas, E.; Kumar, S.; Jech, L.; Woller, D.A. Modeling rangeland Grasshopper (Orthoptera: Acrididae) population density using a landscape-level predictive mapping approach. J. Econ. Entomol. 2021, 114, 1557–1567. [Google Scholar] [CrossRef]
- Hong, B.; Zhang, F.; Li, Y.M.; Zhang, S.L.; Chen, Z.J.; Gao, F.; Liang, Y.L. GIS-based regional classification for overwintering of southern root-knot nematode in Shaanxi Province. Acta. Ecol. Sin. 2014, 16, 4603–4611. [Google Scholar]
- Peng, C.J.; Bai, T.K.; Feng, L.B.; Ding, P.; Yang, Y.H. Occurrence and epidemic regularity of wheat stripe rust in Nanchong city of Sichuan province. Plant. Dis. Pests 2015, 6, 17–23. [Google Scholar]
- Chen, H.; Wu, M.F.; Liu, J.; Chen, A.D.; Jiang, Y.Y.; Hu, G. Migratory routes and occurrence divisions of the fall armyworm Spodoptera frugiperda in China. J. Plant. Prot. 2020, 47, 747–757. [Google Scholar]
- Silva, D.P.A.; Carlos, B. Potential distribution of Nysius simulans (Hemiptera: Lygaeidae) in soybean crops in South America under current and future climate. J. Econ. Entomol. 2020, 113, 1702–1710. [Google Scholar]
- Liu, J.Y.; Yu, C.; Huang, Y.M.; Tian, Y.M.; Qin, Y.J.; Zhu, Y.J.; Teng, K.; Cui, J.L.; Wang, Y.P.; Lin, S. Potential geographical distribution prediction of maize dwarf mosaic virus based on MaxEnt model. J. Plant. Prot. 2022, 49, 1383–1391. [Google Scholar]
- Du, Z.H.; Liu, W.; Cao, X.R.; Nie, X.; Fang, J.R.; Wang, B.T.; Zhou, Y.L.; Liu, W.X.; Xu, X.M. Suitability analysis of wheat blast in the world and China under climate change scenarios based on MaxEnt. Plant. Prot. 2022, 48, 158–166. [Google Scholar]
- Zhang, Z.; Chen, L.; Zhang, X.Y.; Li, Q. Prediction of the potential distributions of Prunus salicina Lindl., Monilinia fructicola, and their overlap in China using MaxEnt. J. Fungi 2023, 9, 189. [Google Scholar] [CrossRef]
- Wang, R.L.; Guo, X.; Li, Q.; Wang, M.T.; You, C. Potential distribution and suitability regionalization of kiwifruit canker disease in Sichuan Province, China. J. Appl. Ecol. 2019, 30, 4222–4230. [Google Scholar]
- Wang, R.L.; Liu, Y.; Li, Q.; Shen, Z.H.; Lu, X.L.; Zhao, J.P.; Wang, Y.L.; Wang, M.T. Analysis of geographical distribution of Pseudomonas syringae pv. actinidiae in Sichuan under climate change. Plant. Prot. 2020, 46, 38–47. [Google Scholar]
- Wei, P.; Zhang, Y.; He, J.Y.; Zhou, T.; Liu, H.; Qin, Y.J.; Zhao, S.Q.; Fan, Z.F.; Li, Z.H. Potential geographic distribution of maize chlorotic mottle virus under climate changes based on MaxEnt model. J. Plant. Prot. 2022, 49, 1367–1376. [Google Scholar]
- Cho, K.H.; Park, J.S.; Kim, J.H.; Kwon, Y.S.; Lee, D.H. Modeling the distribution of invasive species (Ambrosia spp.) using regression kriging and Maxent. Front. Ecol. Evol. 2022, 10, 1036816. [Google Scholar] [CrossRef]
- González-Núñez, M.; Sandín-España, P.; Mateos-Miranda, M.; Cobos, G.; De Cal, A.; Sánchez-Ramos, I.; Alonso-Prados, J.; Larena, I. Development of a disease and pest management program to reduce the use of pesticides in sweet-cherry orchards. Agronomy 2022, 12, 1986. [Google Scholar] [CrossRef]
- Nerva, L.; Costa, L.D.; Ciacciulli, A.; Sabbadini, S.; Pavese, V.; Dondini, L.; Vendramin, E.; Caboni, E.; Perrone, I.; Moglia, A.; et al. The role of Italy in the use of advanced plant genomic techniques on fruit trees: State of the art and future perspectives. Int. J. Mol. 2023, 24, 977. [Google Scholar] [CrossRef]
- Todd, J.H.; Malone, L.A.; McArdle, B.H.; Benge, J.; Poulton, J.; Thorpe, S.; Beggs, J.R. Invertebrate community richness in New Zealand kiwifruit orchards under organic or integrated pest management. AEE 2011, 141, 32–38. [Google Scholar] [CrossRef]
- Green, K.K.; Stenberg, J.A.; Lankinen, A. Making sense of Integrated Pest Management (IPM) in the light of evolution. Evol. Appl. 2020, 13, 1791–1805. [Google Scholar] [CrossRef] [PubMed]
- Luquet, M.; Sylvain, P.; Buchard, C.; Plantegenest, M.; Tricault, Y. Predicting the seasonal flight activity of Myzus persicae, the main aphid vector of Virus Yellows in sugar beet. Pest. Manag. Sci. 2023, 79. [Google Scholar] [CrossRef] [PubMed]
- Li, R.X.; Xie, H.G.; Zhang, C.G.; Sun, Y.Q.; Yin, H. ROS-responsive polymeric micelle for improving pesticides efficiency and intelligent Release. J. Agric. Food Chem. 2020, 68, 9052–9060. [Google Scholar] [CrossRef]
- Huang, X.L.; Cui, Y.L.; Xu, J.; Zhu, Y.H.; Chen, H.B.; Chang, X.L.; Yang, J.Z.; Gong, G.S. Resistance evaluation of kiwifruit germplasm materials to brown leaf spot caused by Corynespora cassiicola. Acta phytopathol. Sin. 2018, 48, 711–715. [Google Scholar]
- Masumeh, A.; Ahmadreza, Y.; Morteza, G. Ecological monitoring and assessment of habitat suitability for brown bear species in the Oshtorankooh protected area, Iran. Ecol. Indic. 2021, 126, 107606. [Google Scholar]
- de Almeida, T.M.; Neto, I.R.; Consalter, R.; Brum, F.T.; Rojas, E.A.G.; da Costa-Ribeiro, M.C.V. Predictive modeling of sand fly distribution incriminated in the transmission of Leishmania (Viannia) braziliensis and the incidence of Cutaneous Leishmaniasis in the state of Paraná, Brazil. Acta Trop. 2022, 229, 106335. [Google Scholar] [CrossRef]
- Gong, G.S.; Xu, J.; Cui, Y.L.; Tu, M.Y.; Chen, H.B.; Zhang, M.; Ma, L.; Zhu, J.; Tang, H.J.; Huang, X.L.; et al. DB51/T 2814-2021; Technical Regulation for Comprehensive Prevention and Control of Kiwifruit Brown Spot. Administration for Market Regulation of Sichuan Province: Chengdu, China, 2021.
- Cui, Y.L. Study of Kiwifruit Brown Leaf Spot; Sichuan Agricultural University: Ya’an, China, 2015. [Google Scholar]
- Ma, L. Occurrence Regionalization and Integrated Management of Kiwifruit Canker Caused by Pseudomonas syringae pv. actinidiae in Sichuan; Sichuan Agricultural University: Ya’an, China, 2018. [Google Scholar]
- Chen, M.; Brun, F.; Raynal, M.; Makowski, D. Timing of grape downy mildew onset in Bordeaux vineyards. Phytopath 2019, 109, 787–795. [Google Scholar] [CrossRef]
- Chaulagain, B.; Small, I.; Shine, J.M.; Raid, R.N.; Rott, P.C.E. Predictive modeling of brown rust of sugarcane based on temperature and relative humidity in Florida. Phytopath 2021, 111, 1401–1409. [Google Scholar] [CrossRef]
- Zhu, G.P.; Liu, G.Q.; Pu, W.J.; Gao, Y.B. Ecological niche modeling and its applications in biodiversity conservation. Biodivers. Sci. 2013, 21, 90–98. [Google Scholar]
- Bai, J.J.; Hou, P.; Zhao, Y.H.; Xu, H.T.; Zhang, B. Research progress of species habitat suitability models and their verification. J. Ecol. 2022, 41, 1423–1432. [Google Scholar]
- Bowen, K.L.; Hagan, A.K.; Pegues, M.; Jones, J.; Miller, H.B. Epidemics and Yield Losses due to Corynespora cassiicola on Cotton. Plant Dis. 2018, 102, 2494–2499. [Google Scholar] [CrossRef]
- Fulmer, A.M.; Mehra, L.K.; Kemerait, R.C.; Brenneman, T.B.; Culbreath, A.K.; Stevenson, K.L.; Cantonwine, E.G. Relating peanut Rx risk factors to epidemics of early and late leaf spot of peanut. Plant Dis. 2019, 103, 3226–3233. [Google Scholar] [CrossRef]
- Gonzalez-Dominguez, E.; Caffi, T.; Paolini, A.; Mugnai, L.; Latinović, N.; Latinović, J.; Languasco, L.; Rossi, V. Development and validation of a mechanistic model that predicts infection by Diaporthe ampelina, the causal agent of Phomopsis cane and leaf spot of grapevines. Front. Plant Sci. 2022, 25, 872333. [Google Scholar] [CrossRef]
- Ortega-Acosta, S.Á.; Mora-Aguilera, J.A.; Velasco-Cruz, C.; Ochoa-Martínez, D.L.; Leyva-Mir, S.G.; Hernández-Morales, J. Temporal progress of roselle (Hibiscus sabdariffa L.) leaf and calyx spot disease (Corynespora cassiicola) in Guerrero, Mexico. J. Plant Pathol. 2020, 102, 1007–1013. [Google Scholar] [CrossRef]
Disclaimer/Publisher’s Note: The statements, opinions and data contained in all publications are solely those of the individual author(s) and contributor(s) and not of MDPI and/or the editor(s). MDPI and/or the editor(s) disclaim responsibility for any injury to people or property resulting from any ideas, methods, instructions or products referred to in the content. |
© 2023 by the authors. Licensee MDPI, Basel, Switzerland. This article is an open access article distributed under the terms and conditions of the Creative Commons Attribution (CC BY) license (https://creativecommons.org/licenses/by/4.0/).