


Abstract
With the acceleration of urbanization in the world, the number of multi-story buildings has continued to increase, and glass curtain walls, as the primary envelope form of modern multi-story buildings, have been widely adopted. However, during strong wind and rainstorm disasters such as typhoons, glass curtain walls are prone to damage, and rainwater consequently intrudes into the building interior, causing severe property losses. Existing studies mostly focus on envelope damage under wind actions, paying insufficient attention to the combined wind and rain actions, especially the indoor property losses induced by rainwater intrusion. To this end, this paper establishes a damage-assessment method for glass curtain walls of multi-story buildings under combined wind and rain actions. First, based on stochastic simulation techniques and considering the progressive damage process, a fragility analysis framework for multi-story buildings under combined wind and rain actions is proposed, which involves the probabilistic wind-load model, the impact load model of wind-borne debris, the glass resistance capacity model, the numerical simulation of wind-driven rain, the volumetric quantification model of wind-driven rain intrusion, and the economic loss assessment model. Then, based on the proposed framework, a numerical case study of a typical multi-story building is conducted. The results indicate that the proposed method can reasonably account for wind-driven rain intrusion, envelope damage, and indoor property losses.
1. Introduction
With the acceleration of global urbanization, glass curtain walls have been increasingly applied to multi-story buildings. Nevertheless, the brittle nature of glass and the viscoelasticity of sealants make curtain walls highly susceptible to damage under strong winds, and large amounts of rainwater can flow rapidly into the building interior through the damaged regions, giving rise to secondary economic losses and safety risks such as damage to interior decoration and mechanical and electrical systems. In recent years, curtain-wall damage accidents of multi-story buildings caused by typhoons/hurricanes have occurred frequently. For example, in 2016 the super typhoon “Meranti” caused the failure of about 40,000 m of glass curtain walls in Xiamen [1]; in 2018 the super typhoon “Mangkhut” damaged the curtain walls of several landmark multi-story buildings in Hong Kong, where rainwater intrusion into the interior amplified the damage, with direct economic losses as high as HK$4.6 billion [2]. Tang et al. showed debris impact on building-group curtain walls becomes severe above 40 m/s [3]. Liu et al. documented widespread curtain-wall failures and hotel panel fallout after typhoon ‘Yagi’ in Hainan [4]. Other than China, USA is often devastated by the strong wind and rain as well. For example, in 2017, Hurricane Harvey made landfall in Houston, USA, and the curtain walls of several super multi-story office buildings suffered large-area glass breakage and rainwater leakage under the combined action of sustained strong winds and high-intensity wind-driven rain, and the rainwater intrusion caused severe damage to the mechanical and electrical systems and interior decoration, highlighting the key contribution of rainwater to the chain-like evolution of envelope damage [5].
In extreme wind disaster events, the damage to glass curtain walls of multi-story buildings is mainly caused by strong wind loads and the impact of wind-borne debris. At present, wind disaster assessment models mainly include data-driven models (e.g., [6].) and mechanical mechanism assessment models based on structural reliability (e.g., [7]). Among them, data-driven models construct fitting relationships relying on massive disaster damage statistics, featuring wide applicability but vague physical mechanisms and limited generalization ability. In recent years, driven by rapid advances in machine learning, data-driven approaches, especially deep neural networks, have demonstrated strong performance in structural damage identification. For example, an explainable AI-driven optimal feature selection method [8], an incremental broad ensemble learning framework for damage identification under data scarcity and non-stationarity [9], and a transfer learning-enhanced residual attention temporal network have been developed [10]. Whereas reliability assessment models based on structural mechanics, owing to their clear physical meaning, controllable parameters, and close alignment with the actual load-bearing and damage process of structures, have become the mainstream method for wind disaster fragility and loss assessment of building envelopes.
In recent years, many scholars have carried out extensive research on reliability-based assessment models. Lee and Rosowsky carried out a wind disaster fragility analysis of roof panels of low-rise timber-frame structures based on the wind-load parameters specified in building codes, providing a standardized research approach for early component-level wind damage-assessment [11]. To effectively improve the accuracy of wind damage assessment for roof components, Huang et al. constructed a refined wind-induced fragility prediction method suitable for asphalt shingle roofs based on wind tunnel pressure data [12]. On the basis of this research, Ji et al. further considered the coupling effect of potential opening defects on building walls, revealing the aggravating effect of building internal–external pressure mutation and load redistribution induced by wall openings on the wind-induced fragility of roof panels, and improving the multi-component coupled wind damage-assessment system [13]. In addition, Wu et al. proposed a rapid wind-induced fragility analysis method for low-rise building envelopes that comprehensively considers progressive damage and wind directionality [14].
Apart from the single wind, a large number of wind disaster investigations indicate that after the failure of building envelopes under extreme wind disasters, wind-driven rain (WDR) will intrude into the interior through building envelope openings such as curtain-wall cracks, door and window breakages, and wall defects, triggering a series of secondary disasters including damage to interior decoration, failure of mechanical and electrical equipment due to dampness, and deterioration of the durability of structural components, which is the core cause of the aggravated overall building damage under extreme typhoon conditions. The degree of interior disaster loss is highly correlated with the cumulative total amount of wind-driven rain intrusion, while the rain intrusion amount is jointly regulated by multiple factors such as extreme wind speed, rainfall intensity, and the size and location of envelope openings. Hence, only considering the wind is unable to cover such secondary disaster damage characteristics.
At present, coupled wind–rain disaster damage assessment has been gradually carried out. Pita et al. constructed a synchronized coupled simulation system of wind load, rainfall action, and envelope damage, realizing the quantitative transformation between wind-driven rain intrusion amount and building interior damage, and successfully embedding it into the Florida Public Hurricane Loss Model (FPHLM) for engineering application [15]. Baheru et al. constructed a refined numerical model of wind-driven rain intrusion relying on physical component rain tests and full-scale building test data, specifically simulating the rainwater intrusion effect induced by hidden defects such as window cracks and fine wall cracks, and verified the accuracy and applicability of the model in wind–rain intrusion assessment of various building envelopes through comparison between measured test data and model simulation results [16]. Qin and Stewart integrated the whole-process mechanisms of wind-load damage, wind-driven rain intrusion, and indoor secondary loss, establishing a refined risk assessment framework for low-rise buildings under combined wind and rain actions, and improving the quantitative assessment system for wind–rain coupled damage. The aforementioned scholars primarily focused on the impact of rainwater on low-rise buildings [17]. Ouyang and Spence proposed the damage estimation framework for the high-rise building envelope under the combined wind and rain actions. However, the wind-borne debris, one of the most important factors affecting disaster damage, was not considered in this framework [18]. It can be seen that, among the damage-assessment methods for the envelopes of multi-story buildings under combined wind and rain actions, few systematically account for such factors as wind loads, wind-borne debris, progressive damage, and the uncertainty of interior contents.
For multi-story building glass curtain-wall envelopes, a refined and efficient loss assessment method that simultaneously accounts for direct wind-load damage and secondary wind-driven rain damage is still lacking, and the actual indoor property has also not been effectively considered. To this end, this paper proposes a damage-assessment method for glass curtain walls of multi-story buildings under combined wind and rain actions, systematically considering the combined wind–rain damage effect of envelope damage and indoor property. First, relying on Monte Carlo stochastic simulation techniques, a complete fragility analysis framework for multi-story buildings under combined wind and rain actions is established, integrating the probabilistic wind-load model, the wind-borne debris-impact load model, the glass resistance capacity model, the wind-driven rain numerical simulation, the rainwater intrusion quantification model, and the economic loss assessment model. Then, based on this framework, numerical case analysis is carried out on a typical multi-story building, and relevant research conclusions are presented. Finally, the conclusions and observations will be given.
2. Progressive Damage Process of Glass Curtain Walls Under Combined Wind and Rain Actions
Post-disaster investigations indicate that, under strong winds, glass curtain walls are prone to damage caused by strong wind pressure or wind-induced debris. When some glass curtain walls are damaged, a multi-story building becomes a building with openings, and wind-driven rainwater enters the interior through the openings, causing indoor property losses. Meanwhile, the openings also cause significant changes in the internal wind pressure of the building, further leading to complex evolution of the net wind load acting on the envelope components and of the impact position and impact velocity of wind-borne debris, thereby inducing a new round of envelope component damage and generating more and larger openings. More openings further intensify rainwater intrusion, causing more severe indoor property damage. It can be seen that the damage of multi-story buildings under combined wind and rain actions is a typical progressive chain-like damage process, which is jointly controlled by multiple uncertainties such as the spatial distribution of wind pressure, the impact characteristics of wind-borne debris, and the amount of wind-driven rain intrusion, and the envelope component damage and indoor property losses simultaneously. Since the refined simulation of this whole process involves a huge computational workload, the overall damage analysis faces high computational costs, restricting the engineering practicality and rapid assessment capability of such refined models.
To achieve rapid wind–rain damage assessment of multi-story buildings, this paper simplifies the progressive damage process of the building envelope under combined wind and rain actions into a three-stage evolution model, as shown in Figure 1 (the coefficients GCpi and GCp represent the external and internal wind pressure coefficients acting on the envelope, respectively).
Figure 1.
Progressive damage process of glass curtain walls under combined wind and rain actions.
Stage 1: The envelope remains intact, the slight leakage caused by tiny gaps such as window joints is neglected, and the building can be approximated as an ideally airtight system with negligible internal wind pressure.
Stage 2: The envelope components are subjected to the combined action of external wind pressure, debris impact, and rain loads, and some components fail, transforming the building into a perforated structure with openings; rainwater intrudes into the interior through the damaged openings and causes property losses, the internal wind pressure rises, increasing the net wind pressure on the envelope components of the side and leeward walls and changing the load distribution of the overall envelope system.
Stage 3: The load redistribution changes the wind-induced damage mechanism and induces more envelope components to fail successively; compared with Stage 2, the building opening area further expands, the internal wind pressure level falls back to some extent, and large amounts of rainwater continuously pour into the interior, causing room inundation and more severe indoor property losses. Figure 1 illustrates the simplified three-stage progressive damage process of multi-story buildings.
3. Fragility Analysis for Multi-Story Buildings with Glass Curtain Walls Under Combined Wind and Rain Actions
3.1. Probabilistic Wind-Load Model
The wind disaster analysis of envelopes needs to account for the randomness of loads [19,20,21,22]. The ASCE 7-16 load code of the United States has a complete theoretical basis and facilitates the introduction of load randomness [23]; therefore, this paper adopts this code to carry out the damage assessment of glass curtain walls of multi-story buildings under combined wind and rain actions.
In the ASCE load code, for buildings with a height greater than 18.3 m, the wind load on the envelope can be calculated by Equations (1) and (2):
where q denotes the velocity pressure; for the windward wall at height z, q = qz, and for the leeward and side walls, q = qh, where qh is the velocity pressure obtained by Equation (2) when the height z equals the building height h; for the estimation of positive internal pressure, qi = qz, where z is taken as the height at the position of the highest opening; GCp and GCpi are the external and internal pressure coefficients, respectively, where G is the gust factor; Kz is the exposure coefficient; Kzt is the topographic factor, taken as 1.0; Kd is the wind directionality factor, taken as 0.85; V3s is the 3 s gust wind speed, and its relationship with the 10 min mean wind speed V10min can be approximately expressed as V3s≈1.43V10min. It should be noted that Equations (1) and (2) cannot be directly used for structural wind disaster assessment, because the pressure coefficients therein are the product of the envelope value of the pressure coefficients over all wind directions and the wind direction reduction factor. Therefore, the wind direction reduction factor used for design should be neglected, and the values should be determined according to the specific conditions of the pressure coefficients under each wind direction.
p = qGCp − qiGCpi
According to the ASCE 7-16 code, the exposure coefficient Kz is related to the height and can be determined by the following equations.
When z < 4.6m,
When 4.6m ≤ z ≤ zg,
where α and zg are related to the terrain category and can be determined by Table 1 according to the exposure category.
Table 1.
α and zg value.
The ASCE code considers the spatial variability of GCp and provides the values of GCp in the zones shown in Figure 2, where a is taken as the smaller of 10% and 0.9 m. Based on the different zones, the value of GCp is determined by linear interpolation according to the effective area of the building components.
Figure 2.
External wind pressure zones on the wall (ASCE 2016).
To account for load uncertainty, Ellingwood and Tekie provided an uncertainty model for the exposure coefficient and external pressure coefficient relevant to low-rise building envelopes [24]. The ratio of the mean to the nominal value and the coefficient of variation of Kz are related to the exposure category and height, while the ratio of the mean to the nominal value and the coefficient of variation of GCp are related to the building envelope region. The specific values can be found in the reference [24]. Due to the lack of data, the values presented in this paper can be referred to when modeling the uncertainty of wind load on multi-story building envelope structures.
Meanwhile, ASCE 7-16 provides recommended values for the internal pressure; if adopted directly, the correlation between internal and external pressures would be ignored. Research shows the internal pressure of a building roughly behaves as the area-averaged external pressure at the envelope openings [25], that is
where K is the number of openings in the envelope; Ak is the area of the k-th opening; and GCp,k is the external pressure coefficient at the k-th opening. It is worth noting that the internal pressure update is performed at every floor of the building.
It is worth noting that the internal pressure calculated based on Equation (5) in this paper is relatively simplified, and the actual internal pressure is also affected by factors such as compartmentation, leakage, and partition walls. Refined estimation of internal pressure is an important direction for improving this method to achieve more accurate loss estimation.
3.2. Wind-Borne Debris-Impact Load Model
Apart from wind pressure, wind-borne debris is one of the important causes of damage to multi-story building glass curtain walls. Establishing a general and accurate wind-borne debris hazard model requires comprehensive consideration of factors such as the initial conditions of the debris, the flight process, and the impact resistance of components, which is extremely difficult. Referring to [26], this paper obtains the number of wind-borne debris impacting a specified wall of the building by the following equationNdeb:
where Adeb and ρdeb respectively represent the area and distribution density of hazardous debris sources threatening the designated walls of the building, which are usually determined through investigation and statistics of the debris distribution around the target building and the building environment. Figure 3 provides a schematic plan view of the debris distribution around the target building, in which V and α denote the incoming wind speed and wind direction; the line segments AB, BC, CD, and DA are the four faces of the target building, respectively; R is the radius of the debris distribution region; the line segments EH, HG, GF, and FE define the boundary lines of the potential debris region; the symbol “+” denotes the potential debris locations; and the line segments DM, CQ, and BL are all parallel to the wind direction. As shown in Figure 3, the building faces BC and CD are the hazardous windward faces at this moment, and the corresponding hazardous debris source regions are the polygon BCQGL and the parallelogram DCQM. Meanwhile, scholars consider that potential debris is randomly distributed within the surrounding region of the target building, and its position (Figure 3) follows Poisson distribution (Xdeb, Ydeb) [27]. The symbols “+” in Figure 3 are the potential debris locations randomly generated based on the Poisson distribution.
Ndeb = ρdebAdeb
Figure 3.
Schematic diagram of debris distribution around the building [26].
Post-disaster investigations indicate that the debris around multi-story buildings mostly consists of stones and glass fragments on the ground. The diameter of stones and the geometric dimensions and positions of glass fragments are usually considered random variables, and their probabilistic models are related to the surrounding building environment of the target building. At present, due to the lack of data, there is no unified probabilistic model to describe these random variables. Therefore, this paper only adopts the probabilistic models proposed by some scholars in the numerical case study for analysis. For a given wind-borne debris, this paper adopts the method proposed by Fu et al. to simulate its flight trajectory [28], and then obtains the momentum of its impact on the glass panel.
3.3. Glass Resistance Capacity Model
The resistance of glass mainly includes the wind pressure resistance capacity and the impact resistance against wind-borne debris. Among them, the impact resistance of glass panels is influenced by multiple factors including the physical properties of wind-borne debris (mass, geometric shape, material hardness, and motion parameters), the characteristic parameters of glass (material constitutive relationship, boundary constraint conditions, geometric dimensions, and laminated structure), and the collision dynamics conditions (incident angle, impact velocity vector, and contact point position distribution), making its accurate assessment rather difficult. As known from Section 3.2, wind-borne debris mostly consists of stones and glass fragments on the ground, and the probabilistic models of their dimensions are unknown. Therefore, this paper retains a general modeling framework at the theoretical level and only adopts the probabilistic parameter models of existing mature studies in the numerical case analysis. Specifically, the random modeling rules for the initial position, material density, and geometric dimensions of stone-type debris refer to the research method of [26], adopting a uniform distribution model to characterize the randomness of geometric parameters; the material properties of glass fragments, the correlation between thickness and plan dimensions, and the form of their random distribution follow the modeling approach of [29], and the distribution interval of the vertical initial position of the debris is determined according to the building height range. For any type of wind-borne debris, this paper uniformly adopts the trajectory simulation method proposed by Fu et al. to carry out the dynamic calculation [28], and the impact momentum of the debris on the glass panel is obtained by solving the debris equations of motion, which can provide a general analysis means for the impact resistance assessment of building glass under different working conditions.
During long-term service, glass is prone to damage such as scratches and micro-cracks, and the micro-cracks continue to propagate, leading to the degradation of its wind resistance capacity. The surface scratches of in-service glass are affected by various factors with large variability, and there is currently no corresponding probabilistic model. This paper suggests that concentric double-ring tests can be carried out on glass specimens with scratches of different depths, and the design diagram of the test is shown in Figure 4. In the test, the peak load at specimen failure F is recorded, and then the failure stress of the glass specimen is calculated according to the European standard EN 1288-1 [30]:
where σf is the failure stress; h is the specimen thickness; F is the ultimate load; μ = 0.23 is the Poisson’s ratio of the material; R1 and R2 are the radii of the loading ring and the supporting ring, respectively; and R3 is the radius of the circular specimen. After obtaining σf , the ultimate wind pressure for a four-edge-supported monolithic glass panel can be obtained by [31]:
where σwk is the characteristic value of the maximum stress in the glass section under wind load; m is the bending moment coefficient, adopted based on the ratio of the short side to the long side of the glass panel; a is the length of the short side of the glass panel; t is the thickness of the glass panel; and η is the reduction coefficient as a function of θ = wka4/Et4, adopted according to the technical standard.
Figure 4.
Design diagram of the concentric double-ring test.
To account for the variability of damage, it is suggested that the resistance of in-service glass be determined for multiple working conditions (scratch force, tempered stress, specimens, etc.) by the above method, and finally a statistical analysis be conducted on all resistance samples to determine their probabilistic model.
3.4. Wind-Driven Rain Estimation
The WDR intensity RWDR(ζ) at any spatial point ζ on the building envelope can be estimated by [18]
where Rh is the rainfall intensity and η(ζ) is the catch ratio which measures the WDR impacting the envelope over all rain phases, and it is determined by [32,33,34,35]
where fh(•) is the raindrop size distribution which varies with rainfall intensity; d is the raindrop diameter; ηd(ζ) and (k = 1, 2, …, N) are the specific catch ratios associated with the raindrops with d and dk, respectively, in which N denotes the number of rain phases and the raindrops with diameter d in the interval [dk − (Δd/2),dk + (Δd/2)] belong to the k-th phase; Δd is the bin width; Vn(dk;ζ) denotes the velocity component of the k-th rain phase normal to the building surface at position ζ; and αk is the volume fraction associated with the k-th phase, which quantifies the proportion of raindrops falling within that diameter bin.
RWDR(ζ) = η(ζ)Rh
Commonly, fh(•) is approximated using the empirical distribution originally proposed by Best [36], which has been widely adopted in the literature:
where , A, p, and n are constants with typical values 1.30, 0.232, and 2.25, respectively.
αk can be obtained by the following mass and momentum balance equations [37,38]:
where represents the time-averaged (steady-state) velocity of the k-th rain phase in the i-th direction; denotes the steady-state air-phase velocity component in the same direction; g is the gravitational acceleration; μa is the dynamic viscosity of air; ρw is the density of water; Cd designates the drag coefficient; ReR is the Reynolds number based on the relative wind velocity; and is the turbulent dispersion term.
It is evident from Equations (13) and (14) that the air-phase velocity field must be known a priori before αk and can be solved. The approaches adopted in Ouyang and Spence are used to estimate and [18]. Specifically, is estimated by the 3D steady Reynolds-averaged Navier–Stokes (RANS) approach, and is estimated by
where is the turbulent dispersion term of the air phase and tp and tfl are respectively the particle relaxation time and characteristic lifetime of large eddies, and they are estimated by [37,39]
where k and ε are the turbulent kinetic energy and the turbulent dissipation rate respectively.
3.5. Quantitative Model of Wind-Driven Rain Intrusion Volume
In each stochastic simulation, based on the wind load, the wind-borne debris-impact load, and the glass resistance, the building damage condition can be obtained. At this stage, the volumetric rate of rainwater intrusion caused by wind-driven rain can be calculated according to the spatial distribution data of wind-driven rain (WDR) obtained in Section 3.4. The overall calculation needs to comprehensively consider the influence of three main intrusion pathways, including: direct intrusion through window openings, seepage through window construction gaps, and intrusion by rainwater runoff. Referring to the research of Qin and Stewart [17], the volumetric rates of rainwater intrusion through each pathway are calculated as follows.
(1) Direct intrusion through window openings.
Only the horizontal component of inclined wind-driven rain can intrude through window openings, and the volumetric rate of inclined wind-driven rain intrusion through window openings is [17]
where RWDR is the actual wind-driven rain intensity at the window, its mean value is obtained by Section 3.4 and the coefficient of variation is assumed to be 0.4 [17]; AW is the area of the damaged window.
VOLW = RWDR ⋅ AW
(2) Seepage through window construction gaps.
The volumetric rate of rainwater intrusion through the gaps around windows is [17]
where fv is the velocity ratio of air flowing through the gaps around the window and AWG is the gap area around the window. To account for the uncertainty of fv, according to the environmental design guide CIBSE [40], it is set as a random variable following a normal distribution with a mean of 2.5 and a standard deviation of 0.3.
VOLWG = fv ⋅ RWDR ⋅ AWG
(3) Intrusion by rainwater runoff.
When the building envelope is damaged, in addition to the rainwater that directly impacts and enters (RWDR), part of the rainwater accumulated on the surface of the upstream undamaged envelope due to inclined rainfall may also seep into the interior through the damaged regions. Upstream wall area refers to the area of the undamaged wall above a damaged opening, on the same elevation as the opening, where rainwater can flow along the wall and enter the opening. The volumetric rate of rainwater runoff entering through roof or window openings (VOLRO) can be determined by applying a reduction coefficient fr to the volumetric rate of rainstorm impact on the upstream undamaged surface. The reduction coefficient fr comprehensively accounts for rainwater losses caused by factors such as splashing, evaporation, absorption, and adhesion. In the probabilistic modeling considering uncertainty, its value follows a truncated normal distribution on the interval [0, 1] with a mean of 0.25 and a standard deviation of 0.15 [17].
After determining the volumetric rates of rainwater intrusion through each pathway, the total volume of rainwater intruding through the openings and gaps of the building envelope during the entire wind–rain event (with a rainfall duration of T) can be obtained by the following equation:
VOL = (VOLW + VOLWG + VOLRO) ⋅ T
3.6. Economic Loss Assessment Model
Economic loss estimation requires knowledge of the cost ratios of various sub-components within the building, that is, the ratio of the construction cost of a sub-component (including the cost of new construction, upgrade, repair, or replacement) to the total building cost (i.e., Lbuilding). For the external envelope component, i.e., the glass curtain wall, the following explicit calculation method is adopted to compute its economic loss ratio [17]:
where LW is the loss ratio of the glass curtain wall; CW is the cost ratio occupied by the glass curtain wall; and DW is the damage ratio of the glass curtain wall, i.e., the ratio of the number of damaged glass panels to the total number of glass panels.
LW = CW ⋅ DW
Unlike external building losses, which are directly determined by the damage ratio of external components, indoor property loss assessment adopts an implicit model for estimation. Indoor property includes building interiors (i.e., interior decoration and accessories, mechanical and electrical systems, etc.) and contents (i.e., furniture, appliances, etc.). In view of the high uncertainty of the spatial distribution of indoor property, it is difficult to directly quantify economic losses accurately. Therefore, simplified models based on experience and expert judgment are mainly used to estimate economic losses. According to related research, the interior building loss function for interior decoration, electrical and mechanical systems, etc., is defined as [17]
where LIN is the building interior loss ratio; CIN is the cost ratio occupied by the building interior; hI is the water depth intruding into the interior of each floor, equal to the rainwater intrusion volume of each floor divided by the plan area of that floor; and hT is the water depth threshold that causes the total interior loss. The higher the threshold, the lower the calculated indoor and item loss rate. The lower the threshold, the higher the loss rate. In practical applications, calibration should be based on on-site hotel survey data.
Content losses are directly correlated with the volume of rainwater intruding through window openings, and the corresponding formula is as follows.
where LCO is the content loss ratio of the building and CCO is the cost ratio occupied by the contents.
In addition to the above direct property losses, the indirect loss due to the inability to use the building caused by building damage is calculated as [17]
where CU is the cost ratio of annual use loss; Nlu is the construction use time loss caused by delays in decision-making, inspection, repair, etc.; Mmdf is the loss of use multiplier, used to account for the additional costs incurred because the building cannot be occupied during the repair period, such as indirect economic losses including temporary relocation costs of personnel; and LD is the overall loss of other components excluding content losses, calculated as LD = LW + LIN.
3.7. Analysis Procedure
The fragility analysis includes the failure probability analysis of a single window under different rainfall intensities and wind speeds, the analysis of the overall damage ratio of windows, and the assessment of the overall economic loss ratio caused by wind-driven rain intrusion into the building interior after envelope damage. By judging the failure probability of each window on the facade, the damage locations and damage degrees of different facades are determined, and then the overall damage ratio of the envelope (windows) is calculated. Combined with cost information and indoor property distribution information, the loss ratio is determined to predict the overall economic loss degree of the building.
3.7.1. Failure Probability of a Single Glass Panel
When the correlation between wind–rain action and wind-borne debris impact is neglected, the failure probability of the i-th (i = 1, 2, …, N) glass window panel Pi can be expressed as
where Pwr,i denotes the failure probability of the i-th glass panel under combined wind and rain actions and Pd,i denotes the failure probability of the i-th glass panel under wind-borne debris impact.
Pi = Pwr,i + Pd,i − Pwr,iPd,i
Some studies indicate that the rain load is relatively small and can be neglected (this is also confirmed in the numerical case study of this paper) compared with wind load [41]. Therefore, Pwr,i can be expressed as
where Pw,i denotes the failure probability of the i-th glass panel under wind pressure; is the cumulative distribution function of the wind load on the i-th glass panel; and is the probability density function of the glass resistance related to wind pressure.
Similarly, Pd,i can be expressed as
where is the cumulative distribution function of the wind-borne debris impact on the i-th glass panel and is the probability density function of the glass resistance related to wind-borne debris impact.
3.7.2. Overall Damage Ratio of Glass Windows
After clarifying the damage condition of glass windows, the overall damage ratio of the windows of the target building can be calculated. The glass window damage ratio DW is defined as the ratio of the number of failed windows to the total number of windows on the building facade, that is
where N denotes the total number of windows and Di denotes the failure condition of the i-th window. Di = 0 and Di = 1 denote the intact and damaged states of the glass, respectively.
Based on Equation (28), the mean and standard deviation of the damage ratio can be obtained as follows:
3.7.3. Fragility Analysis Considering Indoor Property
The damage of building envelopes under combined wind and rain actions is progressive. According to this characteristic, the fragility analysis in this study is carried out based on stochastic simulation, as shown in Figure 5, where NC simulations are performed.
Figure 5.
Flow chart of wind–rain-induced fragility analysis of multi-story buildings.
In each simulation, the damage locations and the overall damage ratio of glass windows on each facade are first obtained, and then the volume of rainwater intruding into the building interior through glass window openings is quantified. Combined with cost information and indoor property distribution information, the overall economic loss ratio is obtained by the economic loss assessment model in Section 3.6. The fragility analysis procedure under given wind speed and rainfall intensity is as follows:
(1) Initialize the simulation counter. Set l = 1, and initialize the damage states of all glass panels and indoor property as “intact without damage”.
(2) Determination of glass panel damage in the l-th simulation. In the l-th(l = 1, 2, …, Nc) simulation, the wind load Wf,i, wind resistance capacity Rf,i, and impact resistance capacity Rd,i of the i-th (i = 1, 2, …, N) glass panel are randomly generated.
(3) Randomly generate the spatial positions and shapes of wind-borne debris, then solve their trajectories according to the trajectory method in Appendix A, and obtain the impact positions and impact momenta of the debris. Let the impact effect of the j-th debris on the i-th glass curtain wall be denoted as Wd,i,j. When the landing point of the j-th debris is not on the i-th glass curtain wall, Wd,i,j = 0. Denote .
(4) Compare the magnitudes of Wf,i and Rf,i, and the magnitudes of Wd,i and Rd,i, to determine whether each glass panel fails. Let Qi,l denote the failure condition of the i-th glass panel in the l-th simulation. If Wf,i < Rf,i and Wd,i < Rd,i, the i-th glass panel does not fail in the l-th simulation, then Qi,l = 0, otherwise Qi,l = 1. Calculate the loss ratio of glass panels in the l-th simulation . At this time, the damaged opening condition of the envelope components can be represented by the vector Ql = [Q1,l, Q2,l, …, QN,l].
(5) According to the opening condition, use Equation (5) to update the internal pressure, and then calculate the net wind pressure on each glass component . Based on the net wind pressure, compare and Rf,i to determine whether the i-th envelope component that did not fail before fails at this time. If , the i-th envelope component still does not fail, then Qi,l = 0, otherwise Qi,l = 1. At this time, update the vector Ql according to the latest damage condition of the envelope components.
(6) Based on the latest damaged opening condition vector Ql of the envelope components and the wind-driven rain distribution, use Equation (20) to calculate the total amount of rainwater flowing into each floor of the building, and solve the water accumulation depth of each room in combination with the interior spatial layout and indoor drainage conditions of each floor.
(7) Based on the damage ratio of glass panels and the cost ratio occupied by glass, use Equation (21) to calculate the loss ratio of glass. Meanwhile, based on the water accumulation depth of each floor, use Equations (22)–(24) to calculate the indoor property loss ratio, and then obtain the total building loss ratio Ll in the l-th simulation.
(8) Repeat the above steps (1)–(7) for a total of Nc times to obtain Nc loss ratio samples. Based on these samples, the mean of the total building loss ratio can be calculated by the following equation:
Based on the above procedure, the mean loss ratios under different combinations of wind speed and rainfall intensity can be obtained, i.e., the fragility results of buildings under combined wind and rain actions. Although the above procedure identifies component damage through physics-based criteria, data-driven few-shot open-set recognition offers a complementary diagnostic route when labeled data are scarce and previously unseen damage states may arise [42].
4. Numerical Case Study
4.1. Description of the Multi-Story Building
In the numerical case study of this paper, the dimensions of the multi-story building are 86.5 m × 15 m × 23.8 m (length × width × height), with a floor height of 3.6 m and a total of six floors. The plan view of a typical floor is shown in Figure 6, which includes the wind direction definition for the subsequent fragility analysis. The spatial positions of the glass panels are shown in Figure 7, where there are four types of panel sizes, denoted as C1~C4, as shown in Table 2. The building is a hotel building and is assumed to be located in Exposure Category B.
Figure 6.
Plan view of a typical floor.
Figure 7.
Spatial positions of glass panels.
Table 2.
Glass panel types of the building in this case.
4.2. Fragility Analysis
4.2.1. Analysis of Actions and Resistance of Glass Curtain Walls
In this section, the wind load is first determined based on the method in Section 3.1. Second, the parameters of the wind-borne debris are determined from the relevant literature, and the debris trajectories are then simulated using the method presented in Section 3.2. Third, a probabilistic model of the debris-impact resistance of glass is established based on the relevant literature. Finally, a probabilistic model of the wind-load resistance of glass is established using the method described in Section 3.3.
The probabilistic wind-load model should be determined. The terrain in this case belongs to Exposure Category B, α = 7, zg = 365.76 m; therefore, Kz can be estimated according to Equation (4). For simplicity, the ratio of the mean to the nominal value of Kz is assumed to be 1, and the coefficient of variation is taken as 0.16. Therefore, its mean and standard deviation can be conveniently obtained. Meanwhile, based on the above glass panel areas, the positive and negative pressure values of GCp can be obtained by linear interpolation according to Figure 2 in Section 3.1, as shown in Table 3 (taking C1 as an example) (the ratio of the mean to the nominal value is assumed to be 1, and the coefficient of variation is taken as 0.12).
Table 3.
Distribution parameters of external pressure coefficient of glass curtain-wall panels (C1 panel).
When performing stochastic simulation of wind-borne debris, referring to the research of Song on wind-borne debris in urban areas and the field investigation situation, this paper takes ρdeb = 0.5 pieces/m2, R = 50 m [43]. Post-disaster investigations indicate that the debris of multi-story buildings mostly consists of stones and glass fragments on the ground. This paper refers to Song and Ou for the parameter values of stones: the position height H is 0 m, the density is 2000 kg/m3, and the diameter follows a uniform distribution in [5 mm, 15 mm] [26]. Meanwhile, referring to Huang and Lan for the parameter values of glass fragments: the density is 2700 kg/m3, the thickness is 6 mm, the width follows a uniform distribution in [0.05 m, 1.2 m], and the length is twice the width [29]. The height distribution of glass fragments is assumed to be uniform between 0 and the building height. For a given wind-borne debris, the trajectory is simulated by the method in Appendix A, and then the momentum of its impact on the glass panel is obtained. Meanwhile, referring to the results of Song and Masters et al. for the impact resistance of glass panels [43,44]: the resistance to plate-type wind-borne debris impact follows a lognormal distribution with a mean of 4.72 kg·m/s and a coefficient of variation of 0.23, and the resistance to spherical wind-borne debris impact follows a normal distribution with a mean of 0.08 kg·m/s and a coefficient of variation of 0.23. Note that the section “Numerical Case Study” is not intended to obtain the vulnerability curve validated by post-disaster data, but mainly to demonstrate the method. Accurate simulation of the debris is an important direction for improving this method and a focus of our future work.
In determining the wind resistance capacity of in-service glass, concentric double-ring tests were carried out on glass specimens with scratches of different depths (22 μm~232 μm), covering a variety of damage conditions (scratch force 1 N~60 N, tempered stress 40 MPa~90 MPa, two types of indenters of conical and triangular pyramidal shapes, and two loading rates of 20 MPa/s and 50 MPa/s), and at least five specimens were tested for each group to ensure statistical reliability. As shown in Figure 4, the loading ring size D1 = 150 mm, the supporting ring size D2 = 300 mm, and the surface scratches were introduced by a self-developed glass surface wear resistance testing instrument with a diamond indenter. During the scratching process, the indenter moving speed was 5 mm/s and the scratch length was fixed at 10 mm. Finally, according to Equation (8) the wind resistance capacity of a monolithic glass panel was determined. According to the “Technical Standard for Building Curtain Wall Engineering”, the wind load directly borne by the outer panel of insulating glass is 55% of the total wind pressure [31]. Therefore, the ultimate wind pressure of the whole insulating glass should be 181.82% of that of a monolithic glass panel. Based on this, the numerical samples of the ultimate wind pressure of the double-layer tempered insulating glass of the target multi-story building can be obtained and the sample size is 60. The scratch test results are presented in the form of histograms, as shown in Figure 8. It can be seen that the wind resistance capacity of glass approximately follows a normal distribution, and the probabilistic models of all target glass panels can be determined by fitting, as shown in Table 4. It is worth noting that when conducting wind disaster analysis on actual glass curtain walls, the analysis should be carried out according to the actual damage condition in the actual service environment. This paper only presents the demonstration of the analysis method.
Figure 8.
Probabilistic model of glass wind resistance capacity (insulating glass, 1272 mm × 427 mm).
Table 4.
Resistance parameters of the target glass curtain walls.
4.2.2. Numerical Simulation of Wind-Driven Rain
Before carrying out the wind-driven rain simulation of the target building, the building of [45] was simulated (the prototype dimensions of the building are a cube of 2 m × 2 m × 2 m), and the simulation results were compared with the measured results to verify the accuracy of the Eulerian–Eulerian multiphase numerical simulation of wind-driven rain adopted in this study.
When using Fluent software for numerical simulation, the geometric dimensions of the computational domain were determined according to the criteria proposed by Tominaga et al. and Franke et al. [46,47]. The length × width × height of the computational domain is 52 m × 30 m × 15 m, the distance from the windward face of the building to the inlet of the computational domain is 12 m (6H, where H is the maximum height of the building model, here 2.0 m), the distance from the leeward face to the outlet of the computational domain is 30 m (15H), the distances from the side faces of the building to the left and right walls of the computational domain are both 10 m (5H), and the distance from the roof of the building to the top of the computational domain is 13 m (6.5H). The blockage ratio of the building in the computational domain is 2.6%, which is less than the requirement of less than 3.0% proposed by Franke et al. [47]. In the numerical simulation of this study, the inlet boundary of the computational domain adopts a velocity profile, the walls of the flow domain adopt the standard wall function, the two side boundaries adopt a symmetric arrangement, and the outlet of the flow domain is set as a free flow. The computational domain is mainly divided by structured hexahedral meshes, and appropriate mesh refinement is carried out in the region near the building walls.
According to the measured results of Blocken et al. [48], the numerical wind-driven rain field simulation results were compared and verified with them. The calculation parameters of the numerical simulation were given according to the rainfall conditions of the measured working conditions, and the wind-driven rain catch ratio results on the building surface are detailed below Figure 9. The left side is the comparison chart of the rainwater catch ratio at nine monitoring points at the same positions as the wall rainwater collection devices in the measurement. Among them, the values in parentheses are the wind-driven rain amounts of the measured devices, and the values outside the parentheses are the results extracted from the monitoring points of the numerical simulation; the right side is the contour plot of the rainwater catch ratio obtained by the numerical simulation. It can be seen that the catch ratio simulated in this paper agrees well with the measured values.
Figure 9.
Comparison of rainwater catch ratio.
Blocken and Carmeliet carried out computational verification of several other wind–rain combination conditions for such low-rise buildings by numerical simulation based on the results of this test [49]. In the following, numerical simulation is carried out for several wind speed and rainfall intensity combination conditions described in the literature, so as to carry out further auxiliary verification of the wind-driven rain model of this study based on different wind–rain combination conditions. Figure 10 gives the comparison contour of the wind-driven rain catch ratio results under the combination condition of a horizontal rainfall intensity of 5 mm/h and an incoming wind speed of 5 m/s. According to the rainwater catch ratio results at the central axis position, it can be determined that the wind-driven rain multiphase calculation model established in this study is consistent with the numerical simulation results of [47]. Meanwhile, by comparing with the rainfall measurement data above, it is not difficult to find that the distribution law of the rainwater catch ratio is relatively consistent, and can better reflect the wind-driven rain distribution characteristics on building walls under different wind–rain combination conditions.
Figure 10.
Contour of rainwater catch ratio under wind speed of 5 m/s and rainfall intensity of 5 mm/h.
In this paper, Fluent software with the Eulerian multiphase model was used to carry out the wind-driven rain numerical simulation of the target building. The simulated conditions include the combination of three wind speeds and three rainfall intensities under wind directions of 0° and 90° (see Table 5), i.e., a total of 18 conditions. The geometric dimensions of the numerical wind field are 500 m (length) × 400 m (width) × 120 m (height). Figure 11 gives the mesh division diagram of the model in the wind-driven rain numerical simulation. The wind field and wind-driven rain simulations in this paper are performed using the RANS based Eulerian multiphase method. The core assumption of this model is that raindrops are treated as a continuous phase, and the coupling between wind flow and raindrops is realized through interphase momentum exchange. For boundary conditions, the inlet adopts the atmospheric boundary layer wind profile corresponding to terrain category B, with prescribed rainfall intensity, raindrop size distribution and vertical terminal velocity of raindrops. The outlet is set as outflow boundary, the lateral sides of computational domain are set to symmetry boundaries, and building surfaces as well as domain bottom are no slip walls. User defined functions (UDFs) are adopted to implement special wall treatment for raindrop capture so as to prevent raindrop rebound back into the computational domain. Key simulation parameters include the k ω SST turbulence model, computational domain dimensions, mesh resolution, the SIMPLEC pressure velocity coupling algorithm, together with the selected rainfall intensities (4 mm/h, 8 mm/h, 20 mm/h) and wind directions (0°, 90°) used in the present cases.
Table 5.
Combination conditions of wind speed and rainfall intensity for wind-driven rain simulation.
Figure 11.
Schematic diagram of building model mesh division.
Figure 12 and Figure 13 present the simulation results of the windward wall catch ratio under some conditions at wind directions of 0° and 90°. Comparing Figure 12a,b or in Figure 13b,c, it can be seen that the larger the wind speed and rainfall intensity, the larger the rainwater catch ratio; the rainwater catch ratio under different wind direction angles changes drastically in the edge regions of the building, such as the roof edge and the external wall corners, mainly because the flow separation in the edge regions is intense and the local wind speed is large. The rainwater catch ratio under different wind direction angles shows a gradually decreasing trend from top to bottom on the building facade; the maximum value of the rainwater catch ratio appears in the upper corner region of the windward face, while the minimum value generally appears in the lower middle region of the windward face, mainly because the wind speed in the upper region is high.
Figure 12.
Contour of rainwater catch ratio on windward wall at 0° wind direction angle.
Figure 13.
Contour of rainwater catch ratio on windward wall at 90° wind direction angle.
4.2.3. Indoor Property Distribution
The indoor property of the hotel consists of two core categories: furniture and household appliances. The furniture category includes daily living items such as beds, wardrobes, desks, coffee tables, TV cabinets, chairs, and sofas; the household appliance category covers common electrical equipment such as televisions, central air conditioners, desk lamps, kettles, and hair dryers, basically encompassing the main property types in the rooms.
To accurately obtain the price information of indoor property, this study adopted a multi-channel investigation approach, collecting the actual ownership situation of residents through offline questionnaire surveys, verifying market prices through on-site visits to offline furniture malls, and meanwhile querying real-time quotations on mainstream e-commerce platforms such as Taobao and JD, with multi-dimensional cross-validation to ensure the authenticity and accuracy of the data, laying a reliable data foundation for the subsequent fragility analysis considering indoor property. Relevant examples are shown in Table 6. Since the economic information of the decoration and accessories, mechanical and electrical systems, etc., of the hotel indoor property is not easy to obtain, it is not considered in the numerical case study of this paper.
Table 6.
Indoor property of a certain hotel.
4.2.4. Fragility Analysis Results Considering Indoor Property
Typical wind directions (0° and 90° wind directions) are selected for analysis, and the relevant wind direction definitions are shown in Figure 6. In addition, according to the provisions on rainfall intensity levels of short-term meteorological services in the association standard of China Meteorological Service Association, three typical heavy rainfall scenarios, namely moderate rain (4 mm/h), heavy rain (8 mm/h), and rainstorm (20 mm/h), are selected to analyze the influence of different rainfall intensities on the loss after considering indoor property. In the analysis, referring to the FPHLM, the water depth threshold hT is taken as 25 mm [15]. Construction use time loss Nlu and loss of use multiplier Mmdf are assigned values according to the building loss reference HAZUS model [50]. When the calculated LD values reach 0%, 2%, 10%, 50%, and 100%, respectively, the corresponding Nlu and Mmdf take values of 0, 5, 120, 360, 720 and 0, 0, 0.5, 1, 1, respectively. Referring to Qin and Stewart, the values for each cost ratio are: CW = 1%, CIN = 51.2%, CCO = 25.0%, andCU = 16.3% [17]. The gap area AWG is assumed to be 0.25 mm2. The rainfall duration T is set to 1 h. Active indoor drainage is not considered in this model; all intruded rainwater is retained inside the floor.
First, this study carried out simulation analysis for the rainstorm condition with a rainfall intensity of 20 mm/h within the wind speed range of 10~80 m/s. Preliminary simulations with different values of Nc indicate that the Monte Carlo results are basically stable when Nc = 10,000, and therefore this sample size is used in this work. All simulated damage results were analyzed as a whole, and the means and standard deviations of the glass window loss ratios of the hotel under the 0° and 90° wind directions considering only strong wind action and considering combined wind and rain actions were calculated respectively, as shown in Figure 14 and Figure 15, where the wind speed on the abscissa corresponds to the 10 min mean wind speed. The rain load is determined following the method in [51]. It is worth noting that here the vulnerability curve is expressed as the average loss rate at a given wind speed, rather than the probability of exceeding a certain damage state.
Figure 14.
Glass window loss ratio mean (without considering indoor property).
Figure 15.
Standard deviation of glass window loss ratio (without considering indoor property).
It can be seen from the figures that the mean glass window loss ratios under the two cases of considering only strong wind action and considering combined wind and rain actions are not significantly different. This reflects that, for the envelope loss of this multi-story building, the influence of rain load is very small, and the envelope damage is mainly caused by strong wind action. It can also be seen that, in either case, as the wind speed increases, the loss ratio of building glass windows gradually rises. At the same wind speed, the loss ratio under the 90° wind direction is larger than that under the 0° wind direction, mainly because under the 90° wind direction, the windward face of the building has a larger number of windows, which are more susceptible to damage under loads and debris impact. At high wind speeds, the probability of windows being damaged by loads and debris impact increases, leading to an increase in the standard deviation of the loss ratio.
After clarifying the influence of rain load, this study further carried out the overall economic loss analysis of the building considering indoor property losses under different wind directions and rainfall intensities. The wind speed range and the number of simulations both follow the settings in the aforementioned glass window loss ratio analysis. The analysis results of the overall loss ratio are shown in Figure 16 and Figure 17. Note that only the results under combined wind and rain actions are provided here. The analysis results indicate that the overall loss ratio shows an increasing trend with the increase in wind speed. This is mainly because the increase in wind speed aggravates the envelope damage, leading to a significant increase in the rainwater intrusion amount, and thus the overall loss increases. Under the same wind direction, design wind pressure, and wind speed, the larger the rainfall intensity, the larger the overall loss caused. It is worth noting that the loss ratio under the 90° wind direction is significantly higher than that under the 0° wind direction, because the facade corresponding to this wind direction has a larger number of windows, which are more prone to damage under wind loads, and the formed opening area is larger, thereby providing more pathways for rainwater intrusion and aggravating indoor property losses. The difference in the standard deviation of the overall loss ratio between the 0° and 90° wind directions is small, possibly because the standard deviation reflects the degree of dispersion of the loss results, whose magnitude is jointly determined by the random characteristics of glass envelope damage and the random input mechanism of wind–rain loads. The change in wind direction only changes the number of windows on the windward facade, but does not change the probability distribution of the damage of a single glass panel and the random statistical characteristics of wind–rain coupled action. Although the number of glass components involved in failure differs under the two wind directions, the variability of random damage remains consistent, ultimately making the standard deviation of the loss ratio basically similar under the two wind directions. For the operating conditions of V = 70 m/s and Rh = 20 mm/h, the coefficients of variation at 0° and 90° are 0.49 and 0.16, respectively. It can be seen that although the standard deviation is almost the same, the coefficient of variation in the 0° wind direction is larger.
Figure 16.
Mean overall loss ratio (considering indoor property).
Figure 17.
Standard deviation of overall loss ratio (considering indoor property).
5. Conclusions
Based on stochastic simulation techniques and considering the progressive damage process, this paper proposes a fragility analysis method for glass curtain walls of multi-story buildings under combined wind and rain actions, which involves the probabilistic wind-load model, the wind-borne debris-impact load model, the glass resistance capacity model, wind-driven rain estimation, the quantitative model of wind-driven rain intrusion volume, and the economic loss assessment model. This paper introduces for the first time the three-stage simplified progressive failure into the loss assessment under the combined action of wind and rain, and presents a Monte Carlo simulation process based on this progressive failure. Based on the proposed method, a numerical case study of a hotel is carried out, and the following conclusions and observations can be drawn:
(1) The fragility analysis method proposed in this paper can account for the indoor property losses caused by the progressive damage of the envelope and the multi-path intrusion of wind-driven rain under the combined action of wind pressure and wind-borne debris, and can also account for the uncertainties of key variables such as wind load, wind-borne debris parameters, gap seepage coefficient, and rainwater runoff reduction coefficient.
(2) The envelope loss ratios under combined wind and rain actions and under pure wind action are not significantly different, which indicates that the envelope damage is mainly controlled by strong wind pressure or wind-borne debris; compared with these two factors, the rain load is relatively small and can be neglected. However, when indoor property losses are incorporated, the rainfall intensity has a significant influence on the overall economic loss ratio of the building: under the same wind speed, the overall loss ratio under the rainstorm (20 mm/h) condition is significantly higher than that under the moderate rain (4 mm/h) condition, indicating that rainwater intruding into the interior through the damaged openings of the envelope is the key factor aggravating economic losses.
(3) With the increase in wind speed, the overall loss ratio of the building increases rapidly, mainly because the increase in wind speed not only directly aggravates the envelope damage, but also increases the rainwater intrusion amount through the dual pathways of increasing the wind-driven rain catch ratio and the damaged opening area, resulting in a sharp increase in indoor property losses.
(4) The case analysis in this paper is mainly aimed at demonstrating the application process of the proposed method. The actual wind disaster process is extremely complex, and this study mainly uses research data from others. Therefore, there are some assumptions in the numerical cases, and the analysis results may deviate from the actual wind disaster results. Therefore, using disaster investigation data to validate and calibrate methods is a necessary and meaningful task that will be promoted in subsequent research. Meanwhile, when the joint probability distribution of wind speed and rainfall intensity is available, the probability distribution of the annual maximum loss will be investigated in the future.
(5) It should be noted that this study focuses exclusively on glass-panel failure, while sealant ageing and connection-component damage of curtain walls, which can also generate rain-intrusion openings under real typhoon events, are not incorporated. This will be considered in the future analysis.
Author Contributions
Methodology, F.W. and G.H.; Software, M.L.; Validation, M.L. and X.W.; Formal analysis, X.W.; Investigation, B.C.; Data curation, B.C.; Writing—original draft, W.Y.; Writing—review & editing, F.W.; Supervision, G.H. All authors have read and agreed to the published version of the manuscript.
Funding
This research was funded by National Key R&D Plan of China (Grant No. 2023YFC3008500), National Natural Science Foundation of China (Grant Nos. 52408509, 52678640), and Chongqing Natural Science Foundation (Grant No. CSTB2025NSCQ-GPX0874).
Data Availability Statement
The original contributions presented in this study are included in the article. Further inquiries can be directed to the corresponding author.
Acknowledgments
The supports by National Key R&D Plan of China (Grant No. 2023YFC3008500), National Natural Science Foundation of China (Grant Nos. 52408509, 52678640), and Chongqing Natural Science Foundation (Grant No. CSTB2025NSCQ-GPX0874) are greatly acknowledged.
Conflicts of Interest
The authors declare no conflict of interest.
Appendix A
To better introduce the wind-borne debris trajectory model, three reference coordinate systems as shown in Figure A1 are considered, denoted as XeYeZe, XPYPZP, and XrYrZr. XeYeZe represents the global coordinate system fixed to the earth, XpYpZp represents a relative coordinate system whose axes are parallel to XeYeZe with the origin located at the center of gravity of the debris, while XrYrZr represents a rotating coordinate system fixed at the center of gravity of the debris and defined by the principal axes of the plate-type debris. In XrYrZr, the three-dimensional six-degrees-of-freedom rigid body dynamics of the debris can be given by the well-known Newton–Euler equations:
where m = ρdlxlylz denotes the mass of the debris; lx, ly, and lz respectively denote the dimensions of the debris along the Xr, Yr, and Zr axes; ρd is the material density of the debris; V = [Vx,Vy,Vz] is the velocity vector of the center of gravity of the debris in the XeYeZe coordinate system; Vx, Vy, and Vz respectively denote the velocities of the debris along the Xe axis, Ye axis, and Ze axis in the global inertial coordinate system; d(•)/dt denotes the derivative with respect to time; Fg = mg is the gravity vector acting on the debris, where g = [0,0,−9.8] is the gravitational acceleration vector; Fa is the aerodynamic force vector acting on the debris, whose value will be given later; Ir is the inertia tensor relative to its center of mass, which can be calculated from the geometric dimensions and material density of the debris; is the angular velocity vector of the debris, where , , and respectively denote the angular velocities of the debris around the Xr axis, Yr axis, and Zr axis in the rotating coordinate system; and Mr = ME + MD is the total moment acting on the debris, where ME and MD respectively denote the aerodynamic moment and the damping moment, whose specific values will be given later.
Figure A1.
Reference systems of wind-borne debris. (a) Global coordinate system (XeYeZe). (b) Relative coordinate system (XpYpZp) and rotating coordinate system (XrYrZr).
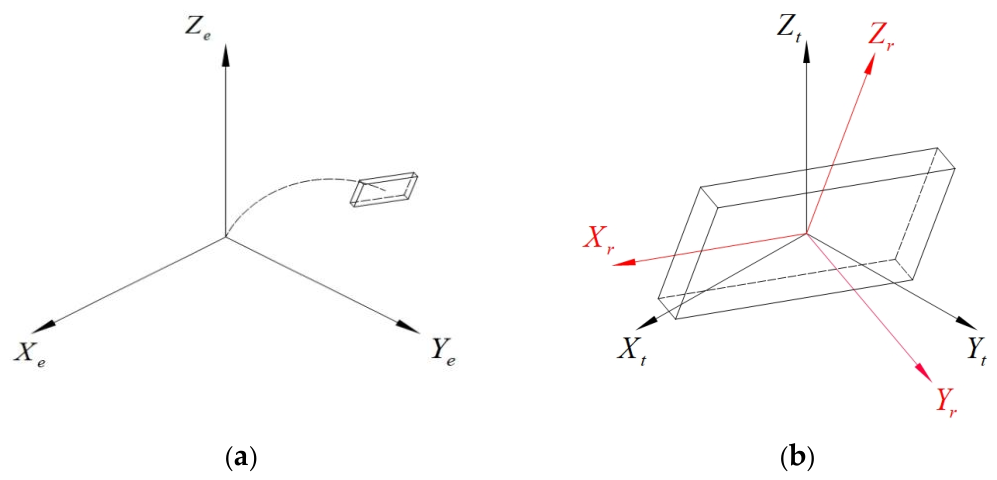
The rotational position defined in XpYpZp is a prerequisite for calculating Fa and Mr etc.; therefore, a rotation matrix must be introduced to carry out coordinate transformation between the XpYpZp and XrYrZr coordinate systems. The quaternion-based rotation representation method can efficiently simulate the complex three-dimensional rotational flight modes of plate-type wind-induced debris, because it avoids the limitations of Euler angle parameterization in orientation description and is not affected by gimbal lock.
Through the rotation quaternion, the vector XpYpZp in x can be transformed into the vector XrYrZr in xr [52]:
where R(q) is the rotation matrix and denotes the unit quaternion and satisfies . The rate of change q of is related to the angular velocity ωr as
xr = R(q)x
Obviously, the velocity of the debris is relative to the flowing air U = V − W (in the XpYpZp coordinate system), where denotes the wind speed in the XeYeZe coordinate system, and the velocity XrYrZr in the Ur coordinate system can be related by the following equation:
Ur = Rq(q)U
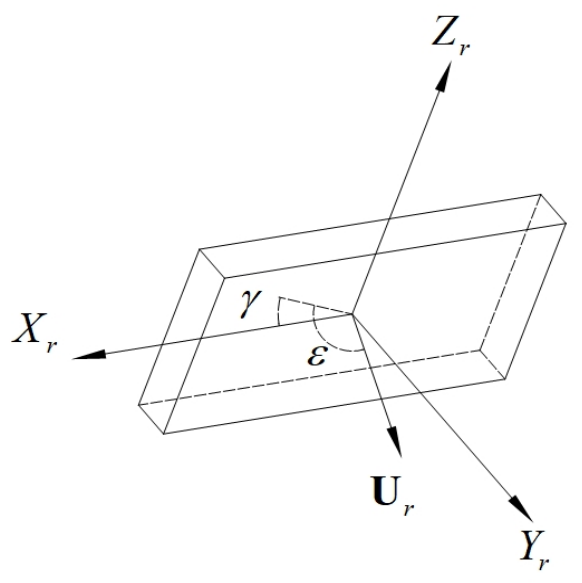
With the relative velocity Ur known, the angle of attack ε and the angle of inclination γ of the debris can be obtained, as shown in Figure A2. Then, the aerodynamic force XrYrZr in Fr can be calculated by the following equation:
where Ar is the reference area of the debris, defined as the effective area perpendicular to the principal axis of inertia of the debris and CF(ε,γ,G) is the aerodynamic force coefficient, which is a function of the angle of attack ε, the angle of inclination γ, and the relative velocity G, and its values can be found in the relevant research [53,54].
The damping moment ΜD is usually obtained through a parameterized model. For unsteady flow effects, its form is given by the following equation:
where CDM is the damping moment coefficient, whose constant values along the Xe, Ye and Ze directions in the global coordinate system are −0.01, −0.185, and −0.2, respectively [53].
Figure A2.
Definition of angle of attack ε and angle of inclination γ of the debris.
Based on Fr and the position of the center of pressure as a function of the angle of attack ε and the angle of inclination γ, the aerodynamic moment ME can be estimated by the method of Richards et al. [53]. Meanwhile, by applying the inverse transformation of Fr to Equation (A3), the aerodynamic force Fa acting on the debris in the global coordinate system can be obtained. It can be seen that, given the wind field (W), the debris parameters (m, Ir) and the aerodynamic characteristics (Fa, Mr) the debris trajectory can be obtained by jointly solving Equations (A1) and (A2). By numerically solving the coupled translational and rotational equations of motion using the Runge–Kutta method and updating the position, velocity, angular velocity, and quaternion of the debris step by step, the impact momentum at the instant of impact on the glass panel can be obtained.
References
- Lin, B. Post-disaster survey and analysis of glass curtain wall under influence of super typhoon “Meranti”. IOP Conf. Ser. Earth Environ. Sci. 2020, 455, 012044. [Google Scholar] [CrossRef] [Scilit]
- Wang, H.; Wang, Q.; Fu, Z.; Tang, J.; Chan, P.W.; Zheng, X. Wind impacts on buildings in Hong Kong during super typhoon Mangkhut. Build. Simul. 2025, 18, 385–401. [Google Scholar] [CrossRef] [Scilit]
- Tang, Y.; Zheng, D.; Cao, Z.; Xue, Y. Study on fragility of curtain wall under impact damage of the wind-borne debris around buildings. China Civ. Eng. J. 2025, 58, 58–64+76. [Google Scholar]
- Liu, W.; Wang, Q.; Huo, X.; Jiang, Y.; Sun, T.; Zhong, Y.; Jiang, L.; Shang, Z.; Zhang, H.; Duan, S.; et al. Field investigation of building and structural damage induced by super typhoon Yagi in Hainan Island and implications for disaster prevention and mitigation. Nat. Sci. Hainan Univ. 2026, 44, 239–336. [Google Scholar] [CrossRef] [Scilit]
- Aghababaei, M.; Koliou, M.; Paal, S.G. Performance assessment of building infrastructure impacted by the 2017 Hurricane Harvey in the Port Aransas region. J. Perform. Constr. Facil. 2018, 32, 04018069. [Google Scholar] [CrossRef] [Scilit]
- Wu, Q.; Zhang, C.; Wang, X.; Zhao, L.; Sun, S.; Hu, T.; Li, Z.; Chen, Y.; Lu, M. Nonlinear modeling and interpretation of typhoon disaster losses using machine learning and SHAP values: A case study in Zhejiang Province. Nat. Hazards 2026, 122, 123. [Google Scholar] [CrossRef] [Scilit]
- Li, Y.; Ellingwood, B.R. Hurricane damage to residential construction in the US: Importance of uncertainty modeling in risk assessment. Eng. Struct. 2006, 28, 1009–1018. [Google Scholar] [CrossRef] [Scilit]
- Wang, X.; Wei, Z.; Wang, Z.; Wei, S.; Li, Y.; Shahzad, M.M.; Biswas, A. Explainable AI-driven optimal feature selection for the identification of structural damage. Struct. Control Health Monit. 2025, 2025, 7253150. [Google Scholar] [CrossRef] [Scilit]
- Wang, X.; Wang, Z.; Yang, S.; Wei, S.; Wang, T.; Shahzad, M.M. An incremental broad ensemble learning framework for the identification of structural damage in conditions of data scarcity and non-stationarity. Eng. Struct. 2026, 353, 122261. [Google Scholar] [CrossRef] [Scilit]
- Wang, X.; Shahzad, M.M.; Wei, Z.; Yang, S.; Wang, T. Transfer learning-enhanced residual attention temporal network for structural damage identification. Buildings 2026, 16, 2779. [Google Scholar]
- Lee, K.H.; Rosowsky, D.V. Fragility assessment for roof sheathing failure in high wind regions. Eng. Struct. 2005, 27, 857–868. [Google Scholar] [CrossRef] [Scilit]
- Huang, G.; He, H.; Mehta, K.C.; Liu, X. Data-based probabilistic damage estimation for asphalt shingle roofing. J. Struct. Eng. 2015, 141, 04015065. [Google Scholar] [CrossRef] [Scilit]
- Ji, X.; Huang, G.; Wu, F.; Lu, Z.H. Wind-induced hazard assessment for low-rise building envelope considering potential openings. J. Struct. Eng. 2020, 146, 04020039. [Google Scholar] [CrossRef] [Scilit]
- Wu, F.B.; Gong, J.; Xin, J.; Zhou, J.; Zhang, H.; Zhao, N. Wind-induced damage estimation of envelope components for low-rise buildings: Incorporation of directionality and multiple openings. J. Wind Eng. Ind. Aerodyn. 2024, 246, 105676. [Google Scholar] [CrossRef] [Scilit]
- Pita, G.; Pinelli, J.P.; Cocke, S.; Gurley, K.; Mitrani-Reiser, J.; Weekes, J.; Hamid, S. Assessment of hurricane-induced internal damage to low-rise buildings in the Florida Public Hurricane Loss Model. J. Wind Eng. Ind. Aerodyn. 2012, 104–106, 76–87. [Google Scholar] [CrossRef] [Scilit]
- Baheru, T.; Chowdhury, A.G.; Pinelli, J.P. Estimation of wind-driven rain intrusion through building envelope defects and breaches during tropical cyclones. Nat. Hazards Rev. 2015, 16, 04014023. [Google Scholar] [CrossRef] [Scilit]
- Qin, H.; Stewart, M.G. Wind and rain losses for metal-roofed contemporary houses subjected to non-cyclonic windstorms. Struct. Saf. 2020, 86, 101979. [Google Scholar] [CrossRef] [Scilit]
- Ouyang, Z.; Spence, S.M. A performance-based damage estimation framework for the building envelope of wind-excited engineered structures. J. Wind Eng. Ind. Aerodyn. 2019, 186, 139–154. [Google Scholar] [CrossRef] [Scilit]
- Chen, S.; Huang, P.; Gu, M. Tests and numerical simulation of wind-induced flying projectile impacting building float glass. J. Vib. Shock 2022, 41, 24–30. (In Chinese) [Google Scholar]
- Wu, F.B.; Huang, G.Q.; Liu, M.; Peng, L.L. Extremes estimation of non-Gaussian wind pressures: A comparative study on sampling errors based on a moment-based translation process model. J. Vib. Shock 2020, 39, 20–26. (In Chinese) [Google Scholar]
- Yan, Y.; Sun, L. Multivariate seismic vulnerability analysis of bridges based on Gaussian process regression. J. Vib. Shock 2022, 41, 27–35. (In Chinese) [Google Scholar]
- Wu, F.B.; Jiang, Y.; Peng, L.L.; Wu, B.; Luo, Y. Simulation of “incompatible” non-Gaussian wind pressures based on a moment-based translation function model. J. Vib. Shock 2022, 41, 142–149. (In Chinese) [Google Scholar]
- ASCE/SEI 7-16; Minimum Design Loads and Other Associated Criteria for Buildings and Other Structures. American Society of Civil Engineers: Reston, VA, USA, 2016.
- Ellingwood, B.R.; Tekie, P.B. Wind load statistics for probability-based structural design. J. Struct. Eng. 1999, 125, 453–463. [Google Scholar] [CrossRef] [Scilit]
- Wu, F.B.; Yao, X.G.; Zhou, H.J.; Huang, G.Q.; Nie, S.D.; Ji, X.W.; Gong, T. Wind-induced vulnerability analysis for a whole light steel building. J. Vib. Shock 2024, 43, 84–93. (In Chinese) [Google Scholar]
- Song, F.F.; Ou, J.P. Typhoon-induced debris movement and impact damage analysis of structural envelopes. Eng. Mech. 2010, 27, 212–220. (In Chinese) [Google Scholar]
- Lin, N.; Vanmarcke, E. A windborne debris risk model. In Proceedings of the 12th International Conference on Wind Engineering, Cairns, Australia, 1–6 July 2007; pp. 1967–1974. [Google Scholar]
- Fu, A.M.; Huang, P.; Gu, M. Numerical model of three-dimensional motion of plate-type wind-borne debris based on quaternions and its improvement in unsteady flow. Appl. Mech. Mater. 2013, 405–408, 2399–2408. [Google Scholar]
- Huang, P.; Lan, X.Y. Impact damage probability model of building roofs impacted by plate-like debris. J. Tongji Univ. (Nat. Sci.) 2024, 52, 717–725. (In Chinese) [Google Scholar]
- EN 1288-1:2000; Glass in Buildings—Determination of the Bending Strength of Glass—Part 1: Fundamentals of Testing Glass. European Committee for Standardization: Brussels, Belgium, 2000.
- DG/TJ 08-56-2019, J 12028-2019; Technical Standard for Building Curtain Wall Engineering. Shanghai Research Institute of Building Sciences: Shanghai, China, 2019. (In Chinese)
- Kubilay, A.; Derome, D.; Blocken, B.; Carmeliet, J. CFD simulation and validation of wind-driven rain on a building facade with an Eulerian multiphase model. Build. Environ. 2013, 61, 69–81. [Google Scholar] [CrossRef] [Scilit]
- Choi, E.C.C. Determination of wind-driven-rain intensity on building faces. J. Wind Eng. Ind. Aerodyn. 1994, 51, 55–69. [Google Scholar] [CrossRef] [Scilit]
- Blocken, B.; Carmeliet, J. Spatial and temporal distribution of driving rain on a low-rise building. Wind Struct. 2002, 5, 441–462. [Google Scholar] [CrossRef] [Scilit]
- Blocken, B.; Carmeliet, J. Validation of CFD simulations of wind-driven rain on a low-rise building facade. Build. Environ. 2007, 42, 2530–2548. [Google Scholar] [CrossRef] [Scilit]
- Best, A.C. The size distribution of raindrops. Q. J. R. Meteorol. Soc. 1950, 76, 16–36. [Google Scholar] [CrossRef] [Scilit]
- Kubilay, A.; Derome, D.; Blocken, B.; Carmeliet, J. Numerical modeling of turbulent dispersion for wind-driven rain on building facades. Environ. Fluid Mech. 2015, 15, 109–133. [Google Scholar] [CrossRef] [Scilit]
- Huang, S.H.; Li, Q.S. Numerical simulations of wind-driven rain on building envelopes based on Eulerian multiphase model. J. Wind Eng. Ind. Aerodyn. 2010, 98, 843–857. [Google Scholar] [CrossRef] [Scilit]
- Shirolkar, J.S.; Coimbra, C.F.M.; McQuay, M.Q. Fundamental aspects of modeling turbulent particle dispersion in dilute flows. Prog. Energy Combust. Sci. 1996, 22, 363–399. [Google Scholar] [CrossRef] [Scilit]
- CIBSE Guide A: Environmental Design; Chartered Institution of Building Services Engineers: London, UK, 2015.
- Li, H.N.; Wang, Q. Dynamic response research on cable truss point-supporting glass curtain wall under coupling wind and rain loads. J. Archit. Civ. Eng. 2012, 29, 7–12. (In Chinese) [Google Scholar]
- Jia, Z.; Li, Z.; Wang, K.; Zhi, G.; Liu, Z.; Vong, C. Graph convolutional contrastive learning for few-shot open-set fault diagnosis in electro-hydrostatic actuators. IEEE Trans. Aerosp. Electron. Syst. 2026, 62, 3076–3092. [Google Scholar] [CrossRef] [Scilit]
- Song, F.F. Typhoon Damage Estimation and Prediction of Wind Vulnerable Structures. Ph.D. Thesis, Harbin Institute of Technology, Harbin, China, 2010. [Google Scholar]
- Masters, F.J.; Gurley, K.R.; Shah, N.; Fernandez, G. The vulnerability of residential window glass to lightweight windborne debris. Eng. Struct. 2010, 32, 911–921. [Google Scholar] [CrossRef] [Scilit]
- Kubilay, A.; Derome, D.; Blocken, B.; Carmeliet, J. High-resolution field measurements of wind-driven rain on an array of low-rise cubic buildings. Build. Environ. 2014, 78, 1–13. [Google Scholar] [CrossRef] [Scilit]
- Tominaga, Y.; Mochida, A.; Yoshie, R.; Kataoka, H.; Nozu, T.; Yoshikawa, M.; Shirasawa, T. AIJ guidelines for practical applications of CFD to pedestrian wind environment around buildings. J. Wind Eng. Ind. Aerodyn. 2008, 96, 1749–1761. [Google Scholar] [CrossRef] [Scilit]
- Franke, J.; Hellsten, A.; Schlunzen, K.H.; Carissimo, B. The COST 732 best practice guideline for CFD simulation of flows in the urban environment: A summary. Int. J. Environ. Pollut. 2011, 44, 419–427. [Google Scholar] [CrossRef] [Scilit]
- Blocken, B.; Roels, S.; Carmeliet, J. A combined CFD–HAM approach for wind-driven rain on building facades. J. Wind Eng. Ind. Aerodyn. 2007, 95, 585–607. [Google Scholar] [CrossRef] [Scilit]
- Blocken, B.; Carmeliet, J. Driving rain on building envelopes—II. Representative experimental data for driving rain estimation. J. Therm. Envel. Build. Sci. 2000, 24, 89–110. [Google Scholar] [CrossRef] [Scilit]
- HAZUS-MH 2.1: Multi-Hazard Loss Estimation Methodology—Hurricane Model; Technical Manual; Federal Emergency Management Agency: Washington, DC, USA, 2014.
- Yang, J.T.; Lou, W.J. Research on wind driven rain CFD simulation and method calculating mean rain load. Acta Aerodyn. Sin. 2011, 29, 600–606. (In Chinese) [Google Scholar]
- Kakimpa, B.; Hargreaves, D.M.; Owen, J.S. An investigation of plate-type windborne debris flight using coupled CFD–RBD models. Part I: Model development and validation. J. Wind Eng. Ind. Aerodyn. 2012, 111, 95–103. [Google Scholar] [CrossRef] [Scilit]
- Richards, P.J.; Williams, N.; Laing, B.; McCarty, M.; Pond, M. Numerical calculation of the three-dimensional motion of wind-borne debris. J. Wind Eng. Ind. Aerodyn. 2008, 96, 2188–2202. [Google Scholar] [CrossRef] [Scilit]
- Wu, B.; Yu, Y.; Zheng, Y.; Liao, H.; Li, Z.; Jiang, Y. Numerical insight into the nonlinear aeroelasticity of a 2DOF double deck truss girder bridge system with turbulent effects. J. Wind Eng. Ind. Aerodyn. 2026, 277, 106590. [Google Scholar] [CrossRef] [Scilit]
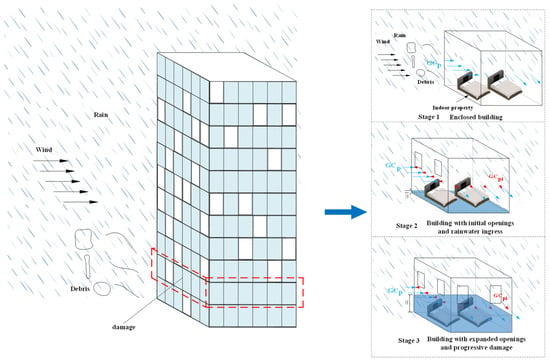
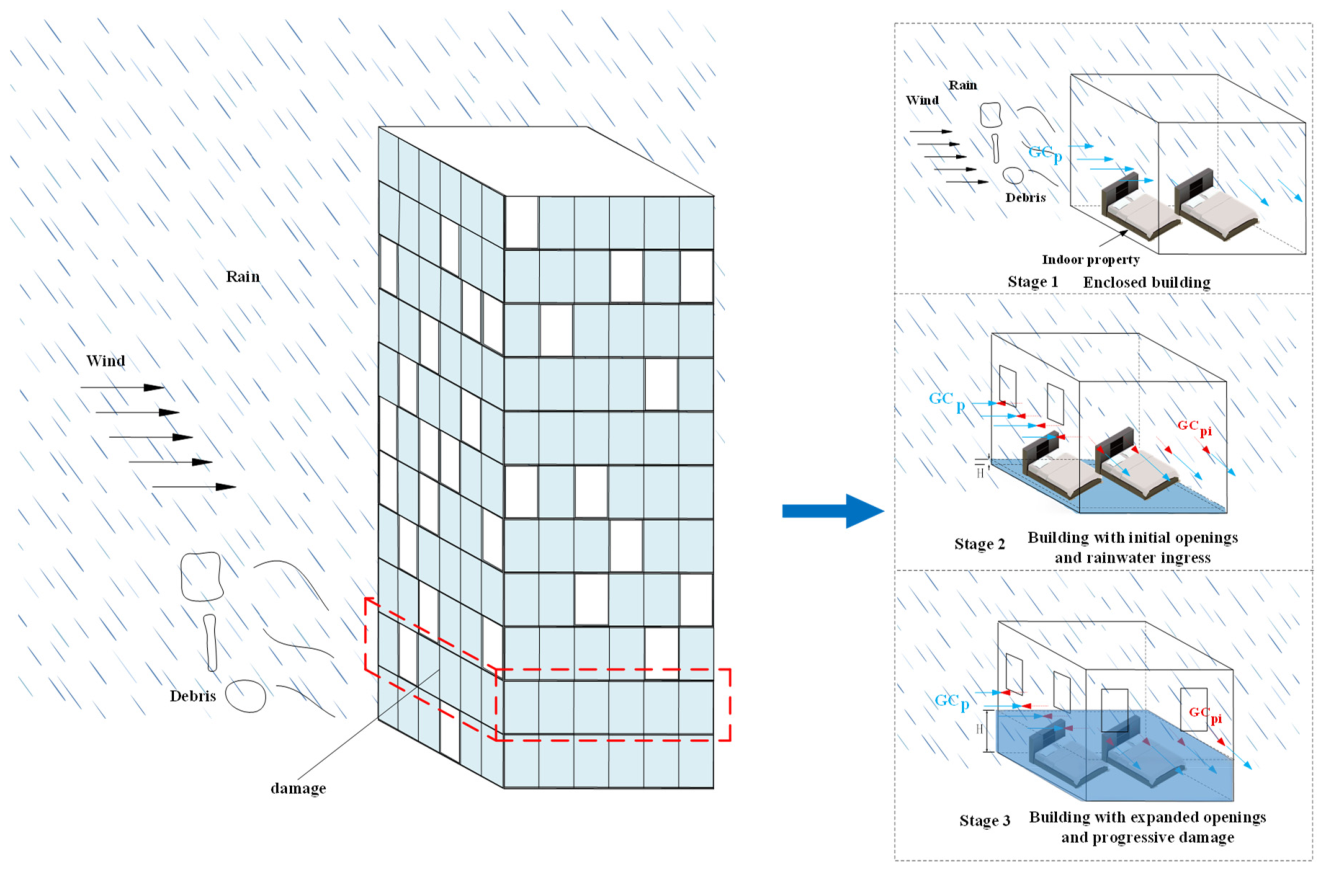
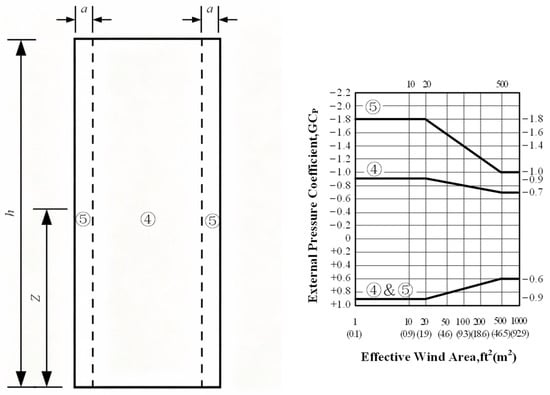
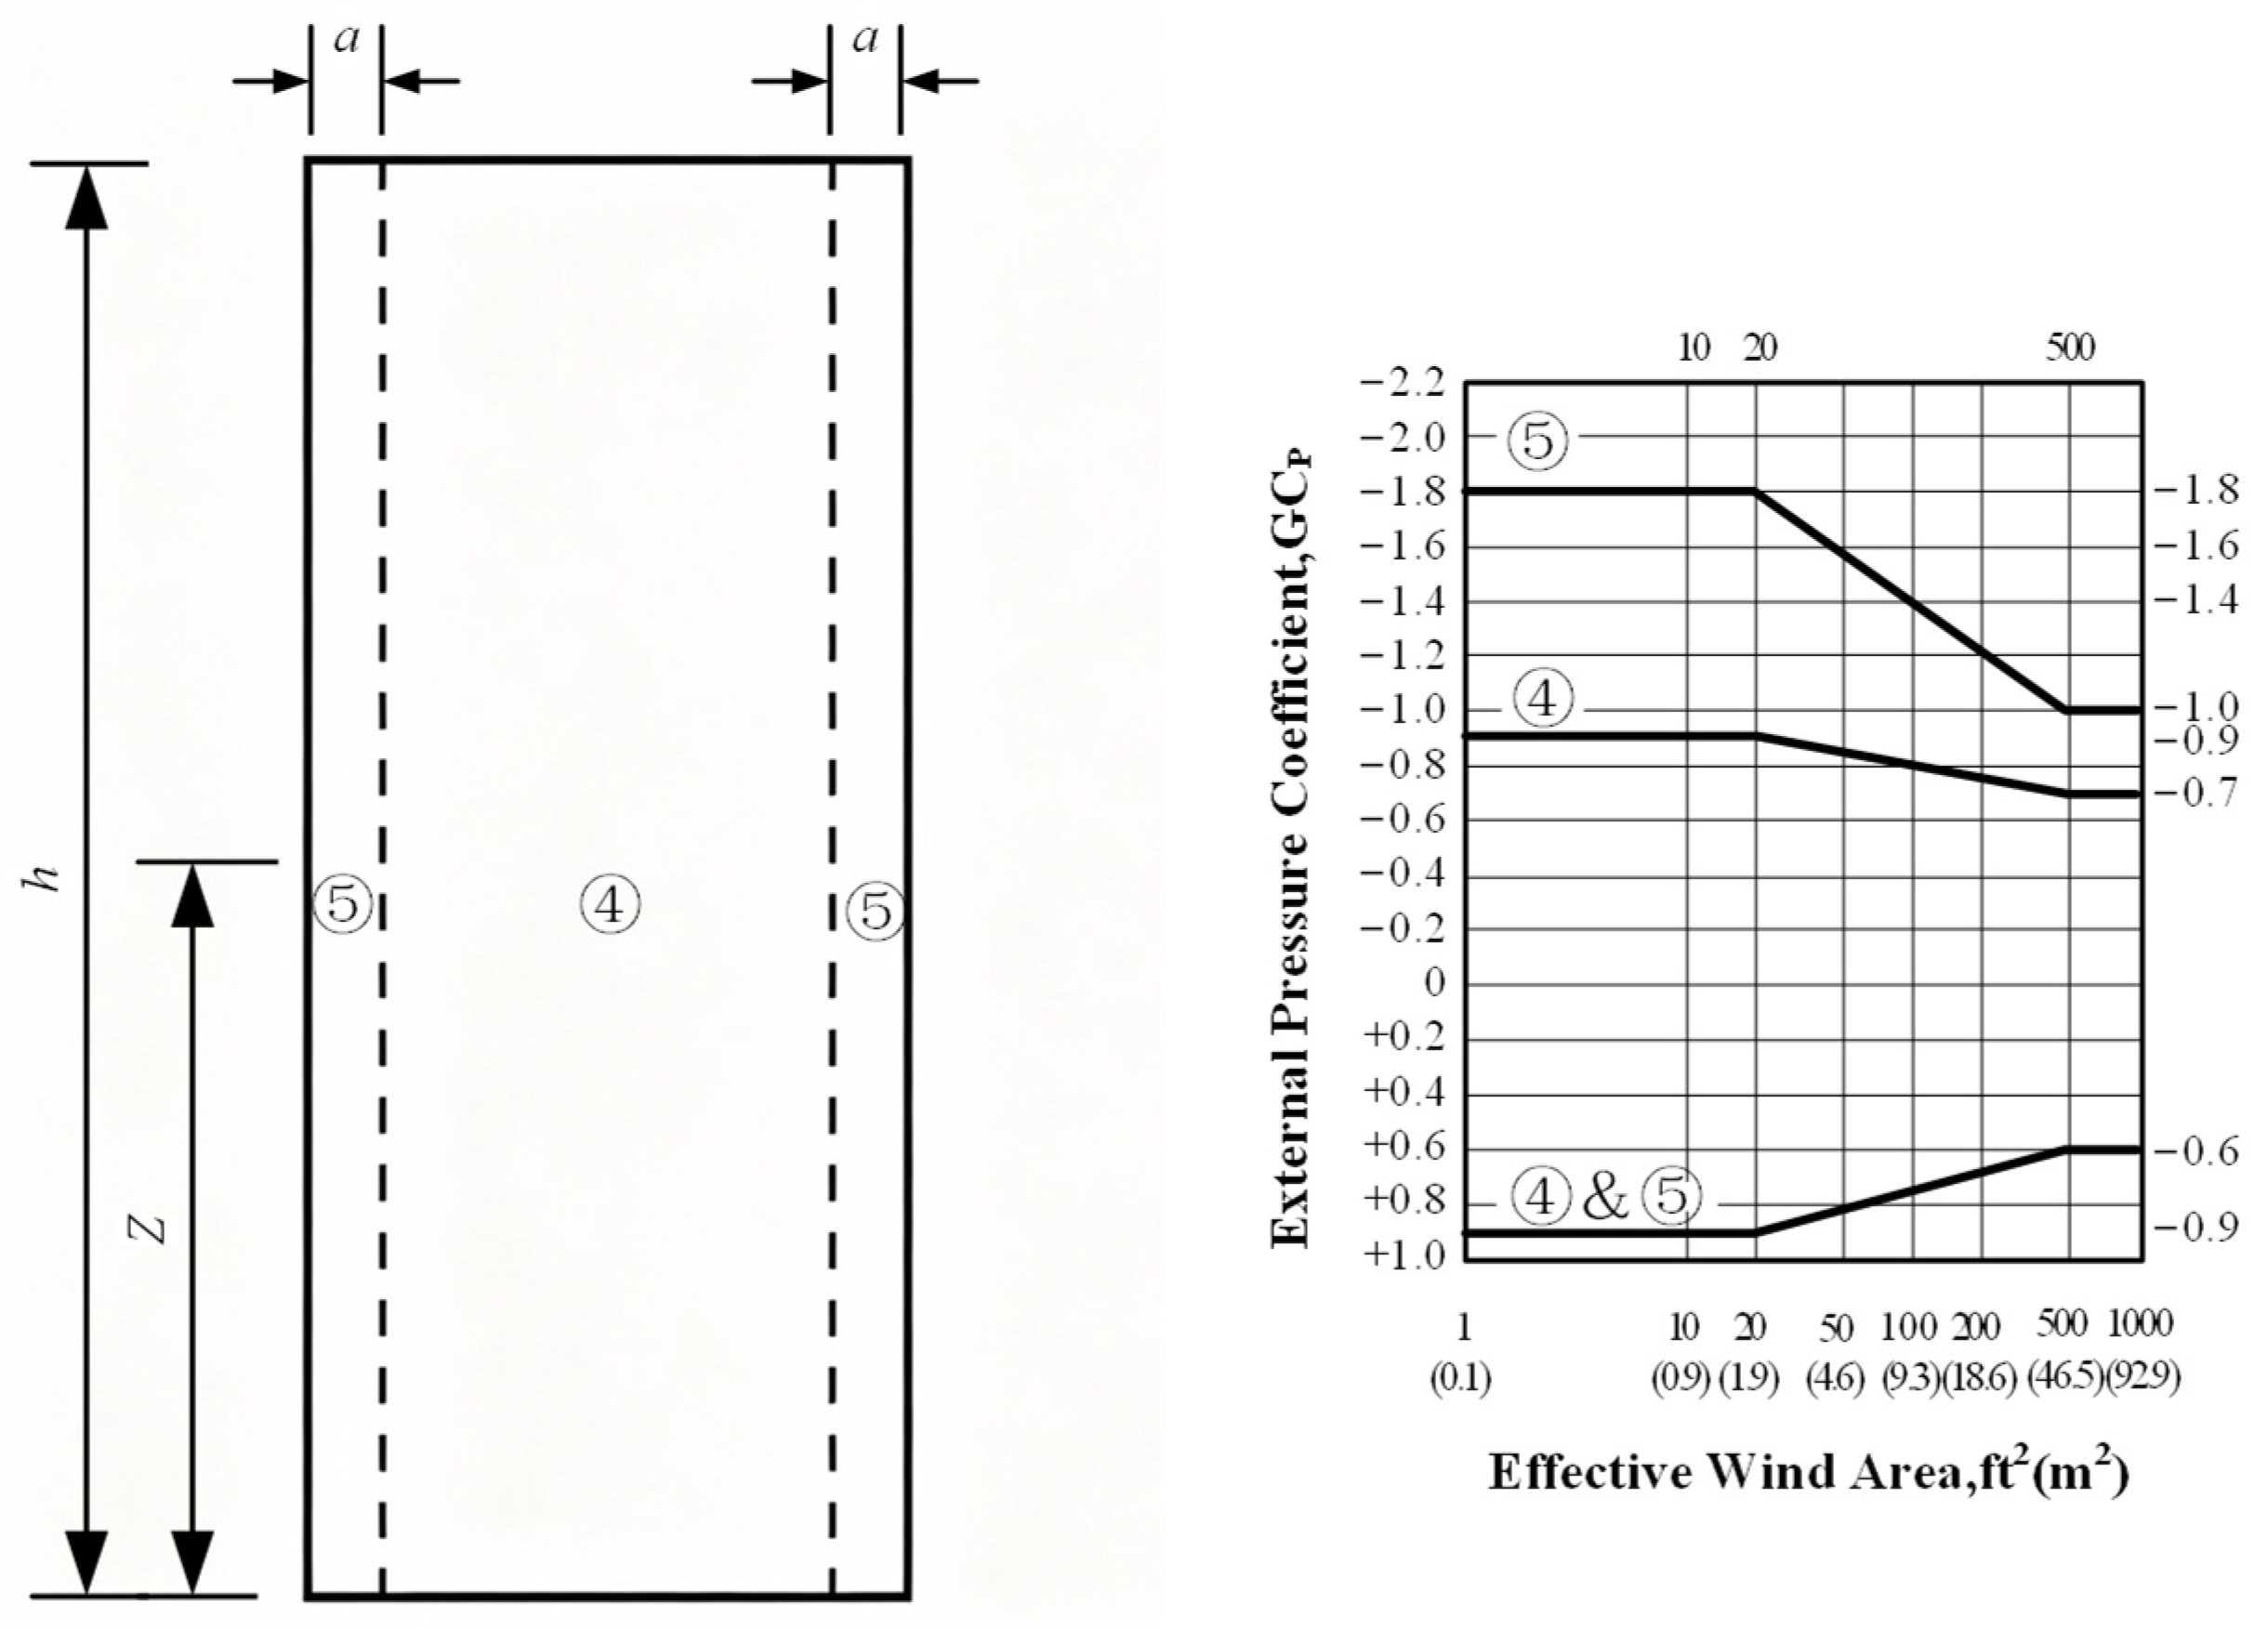
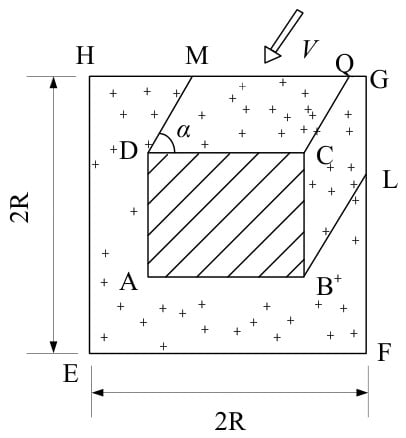
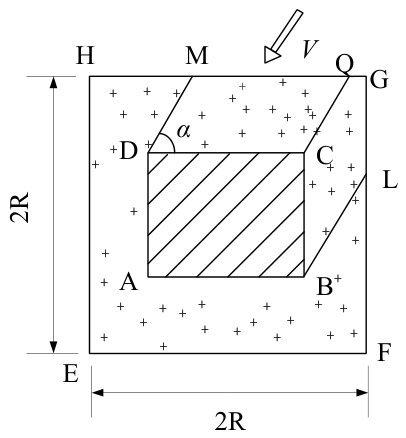
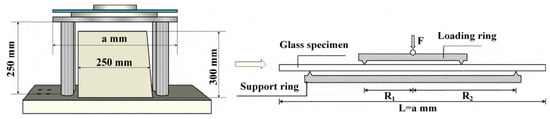
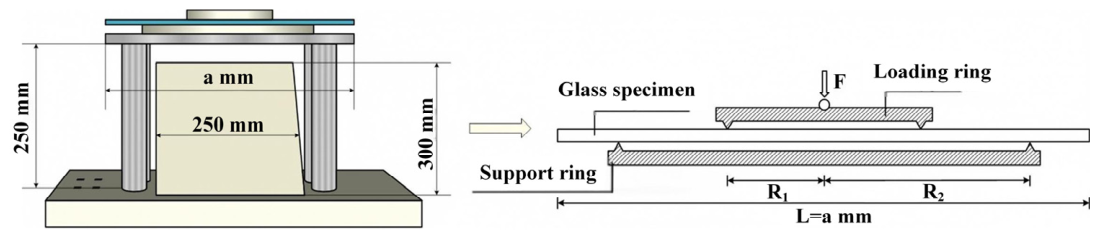
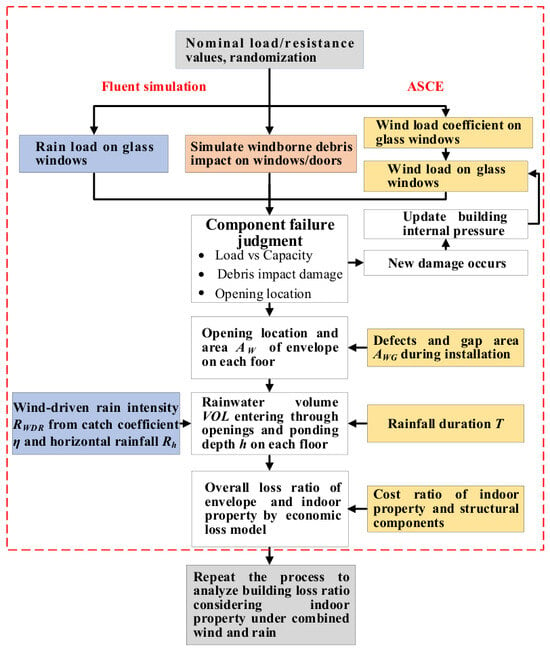
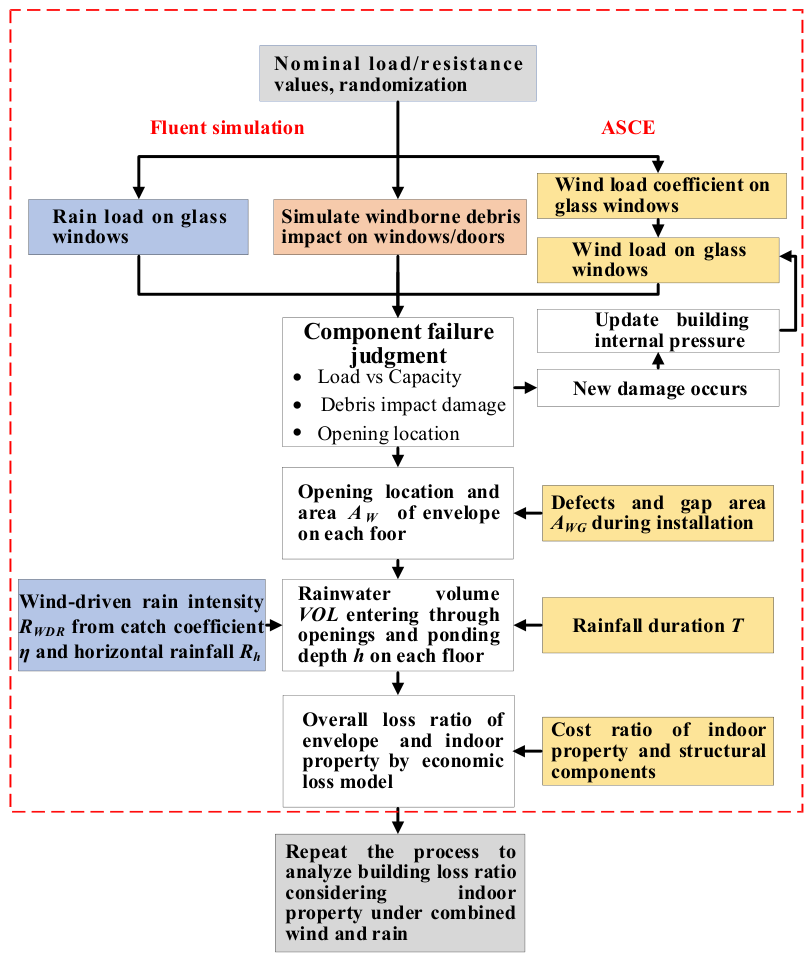
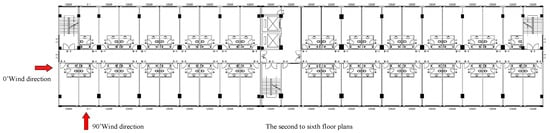
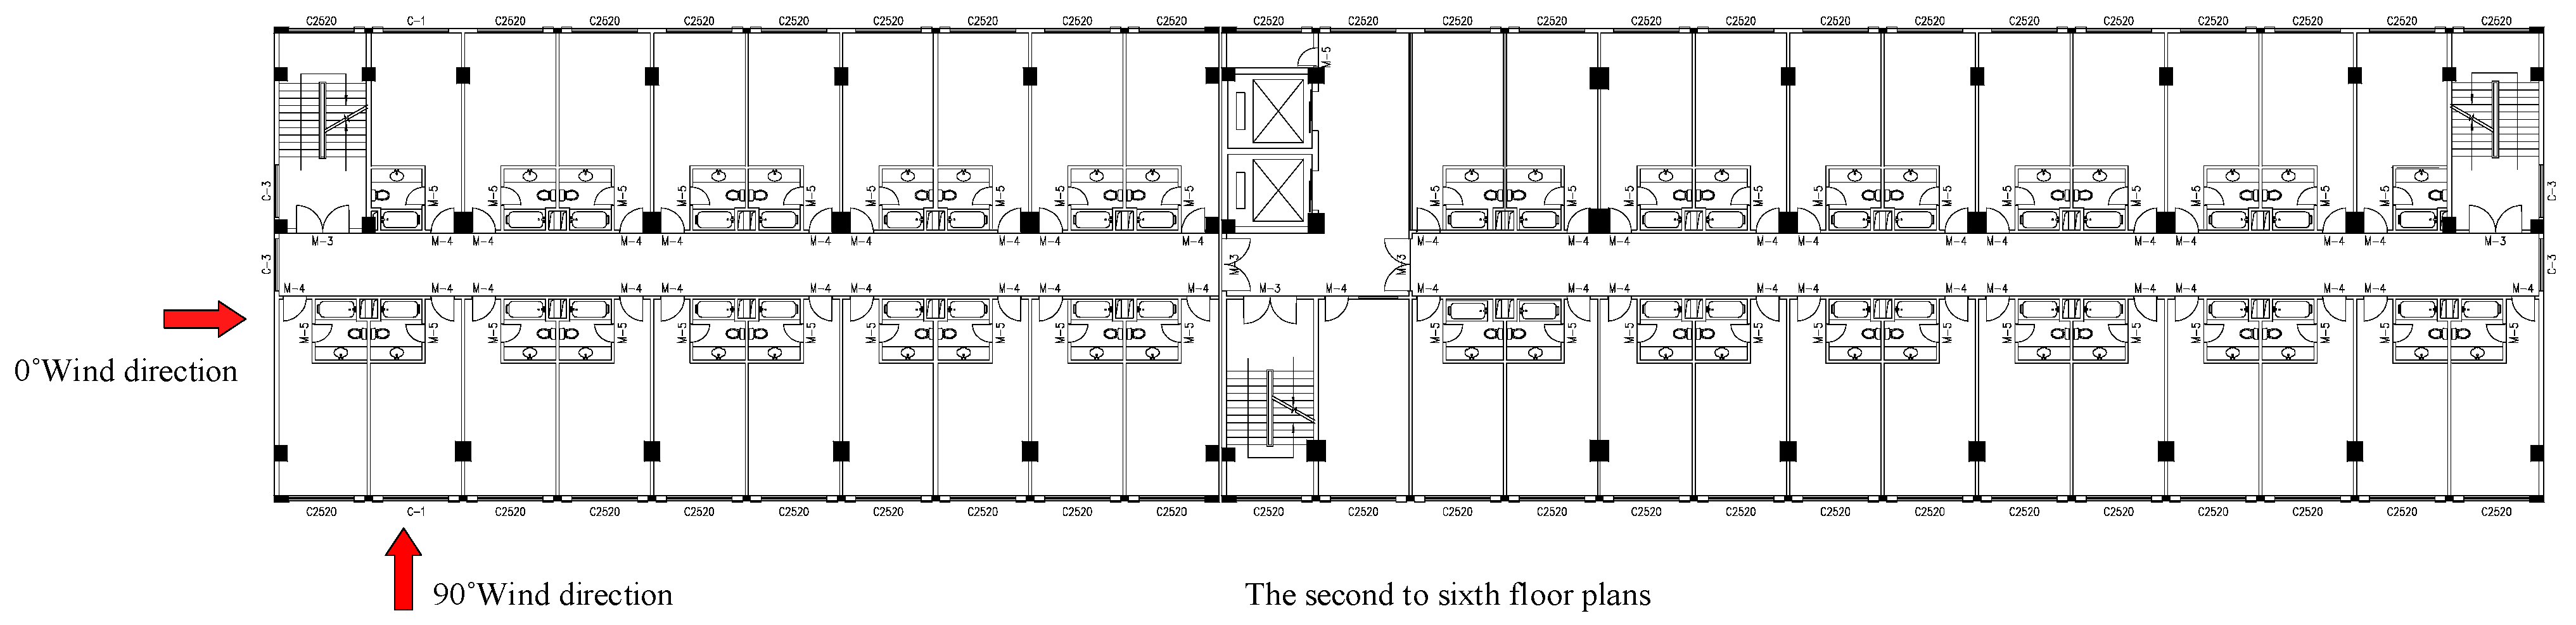
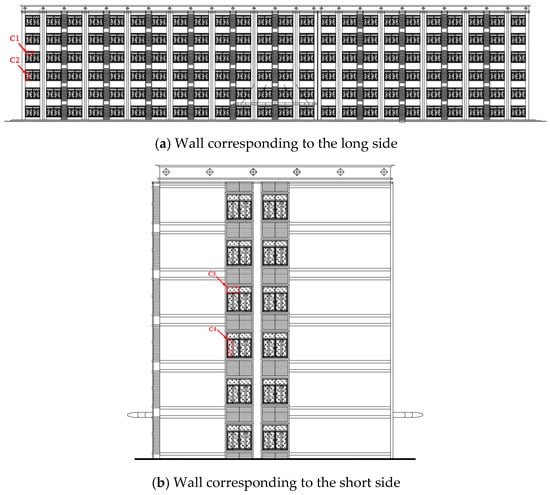
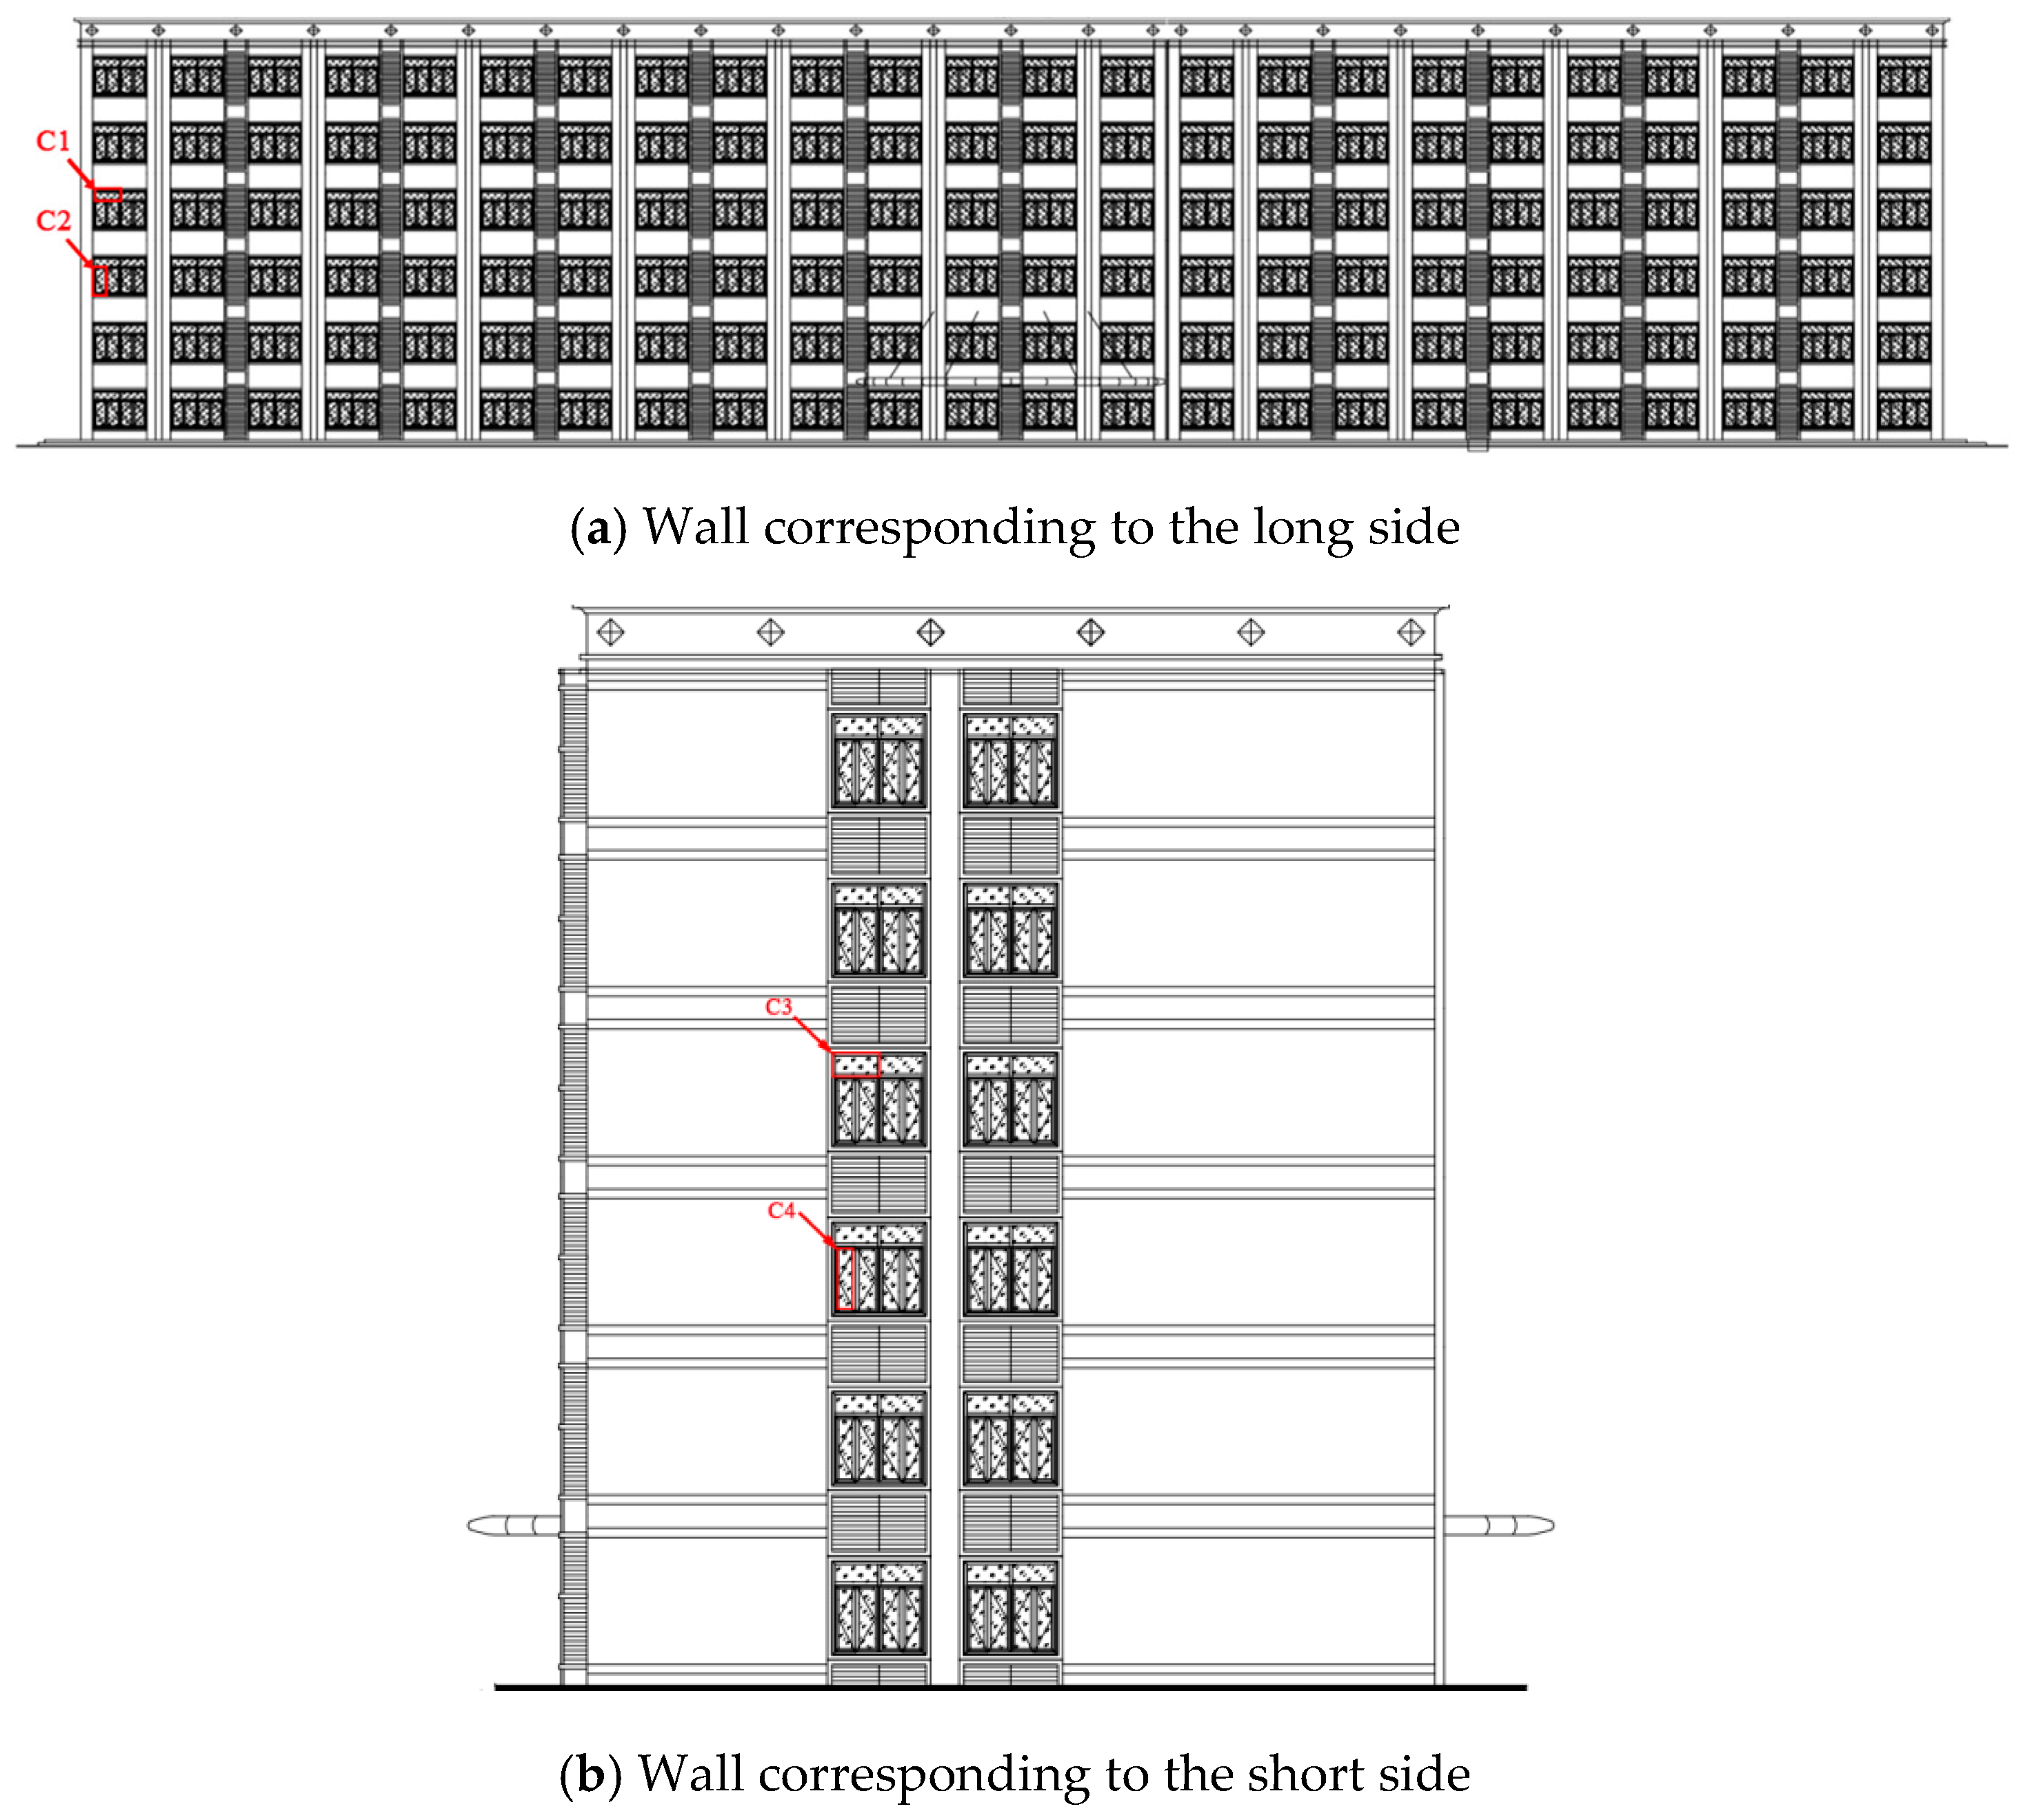
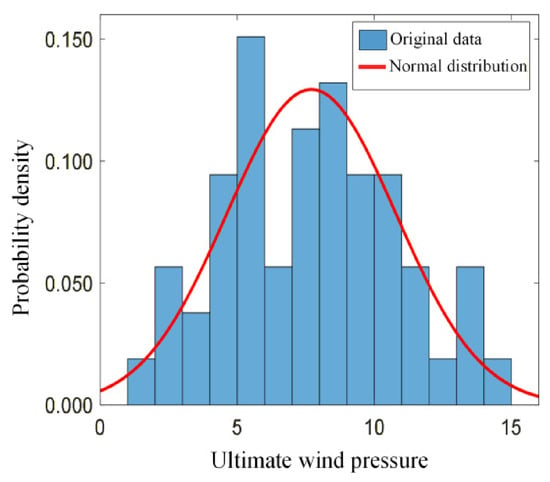
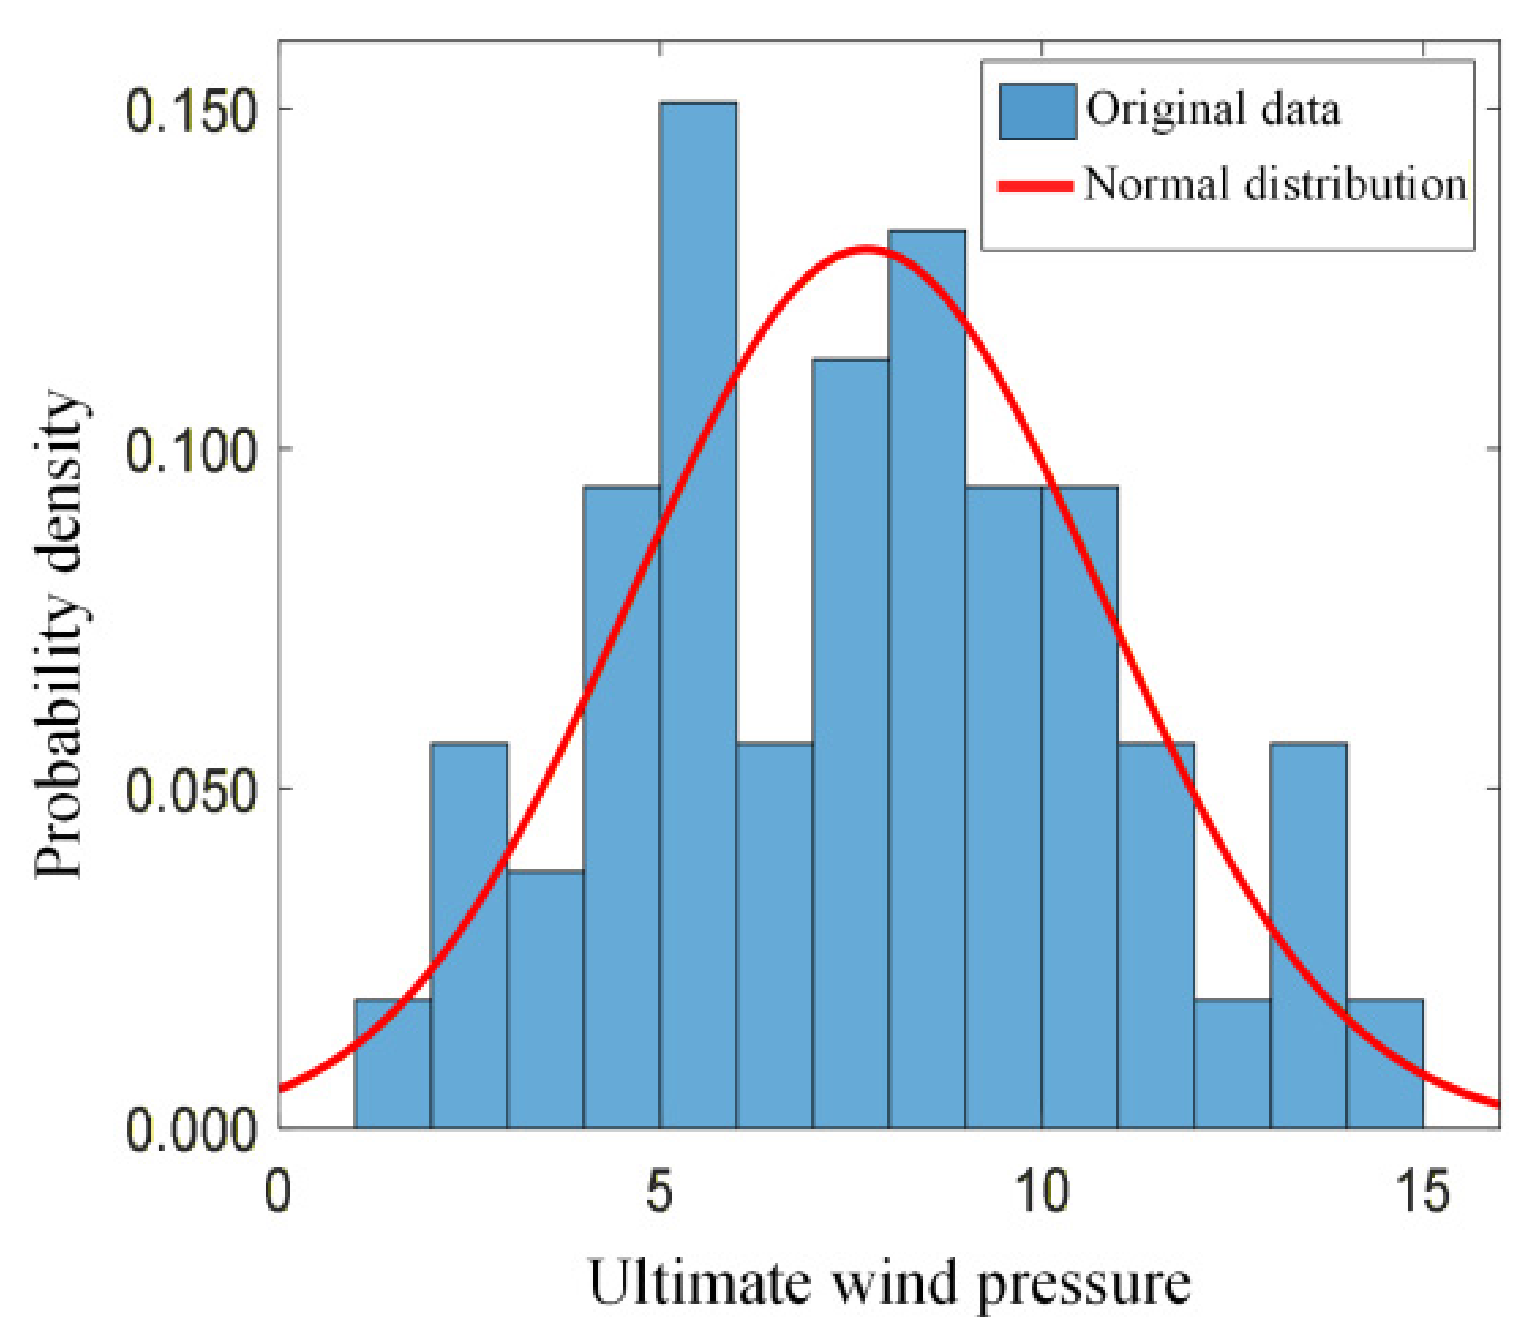
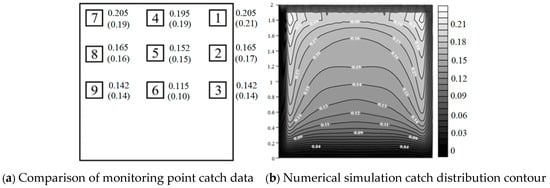
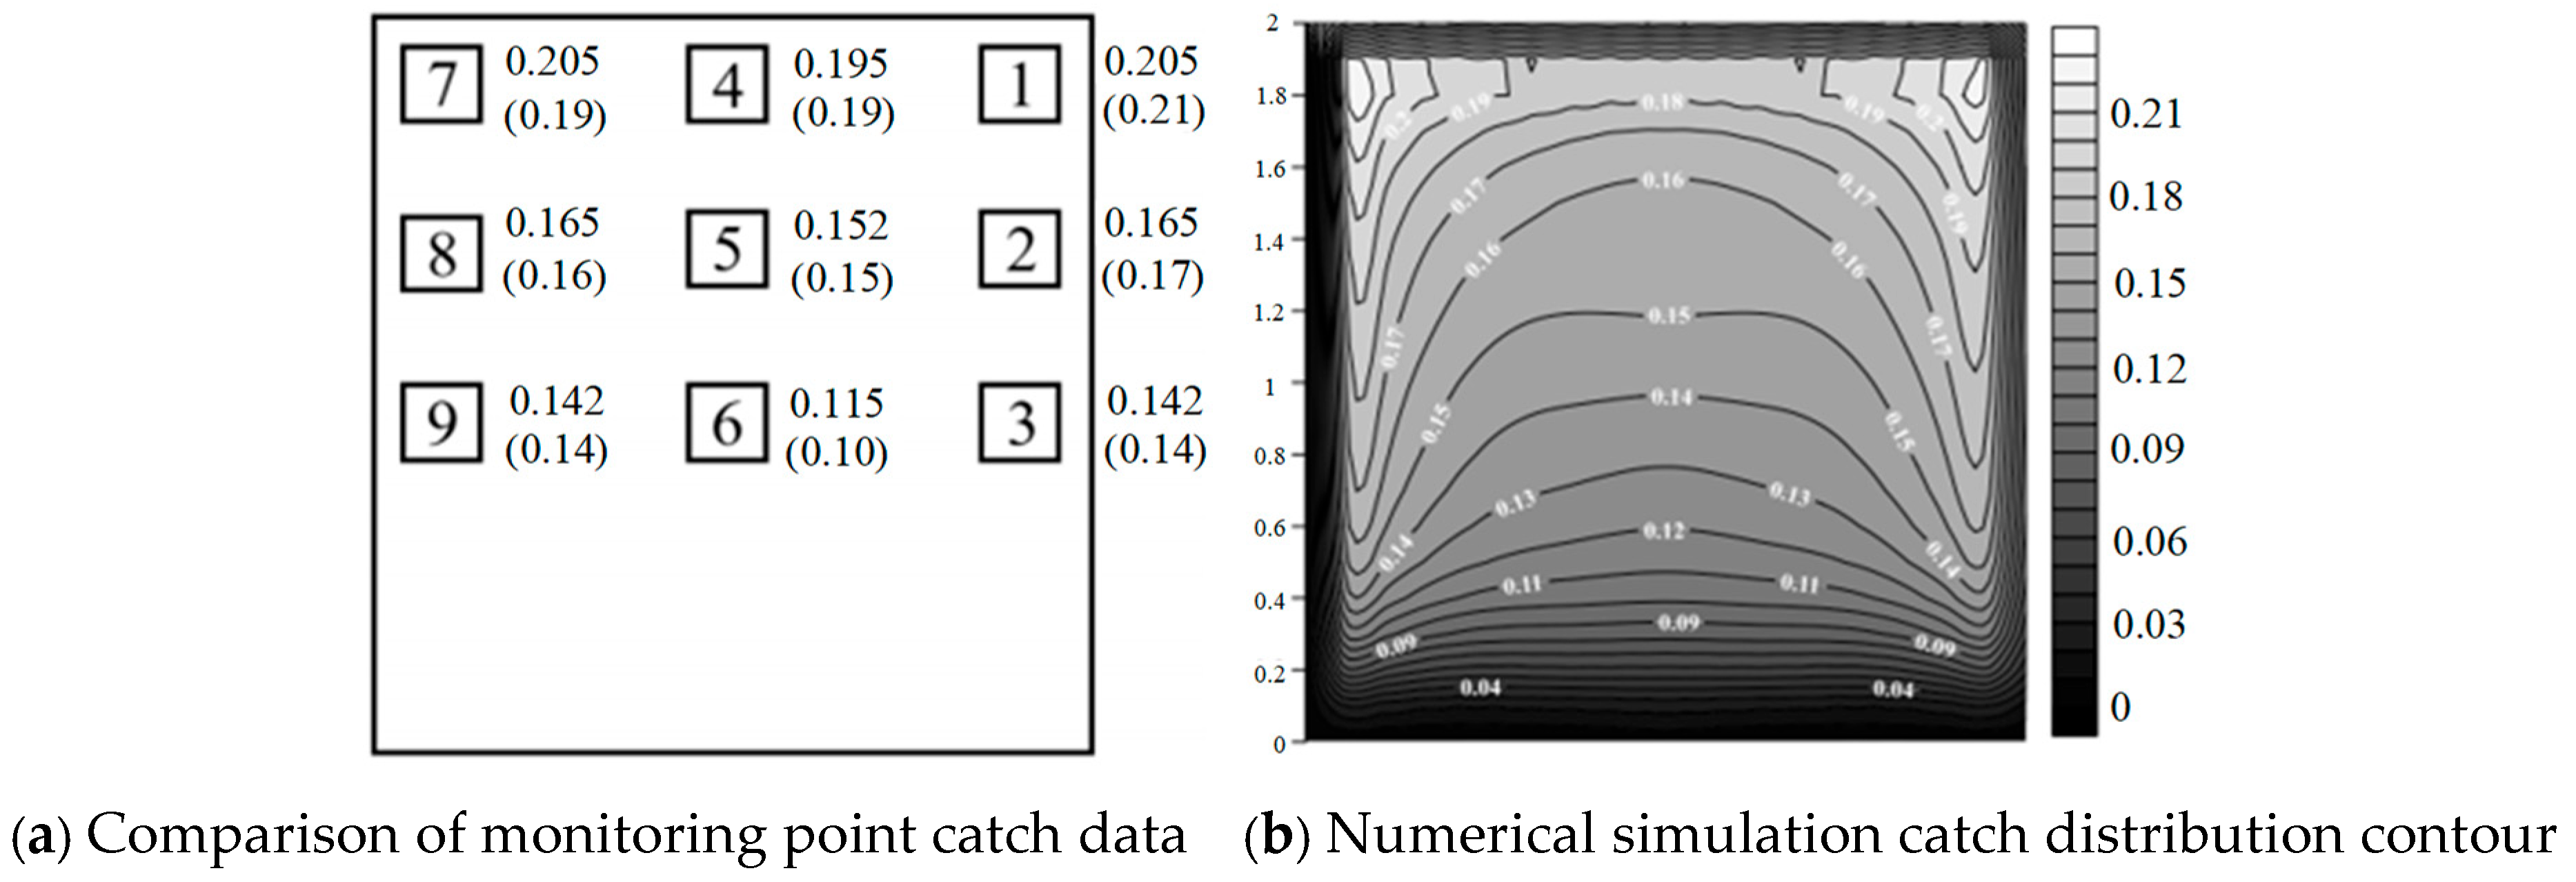
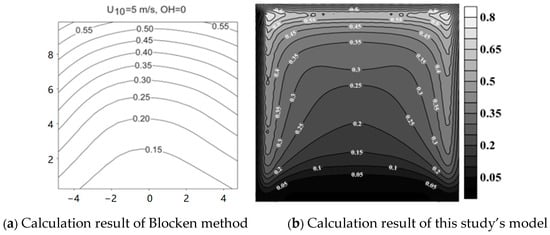
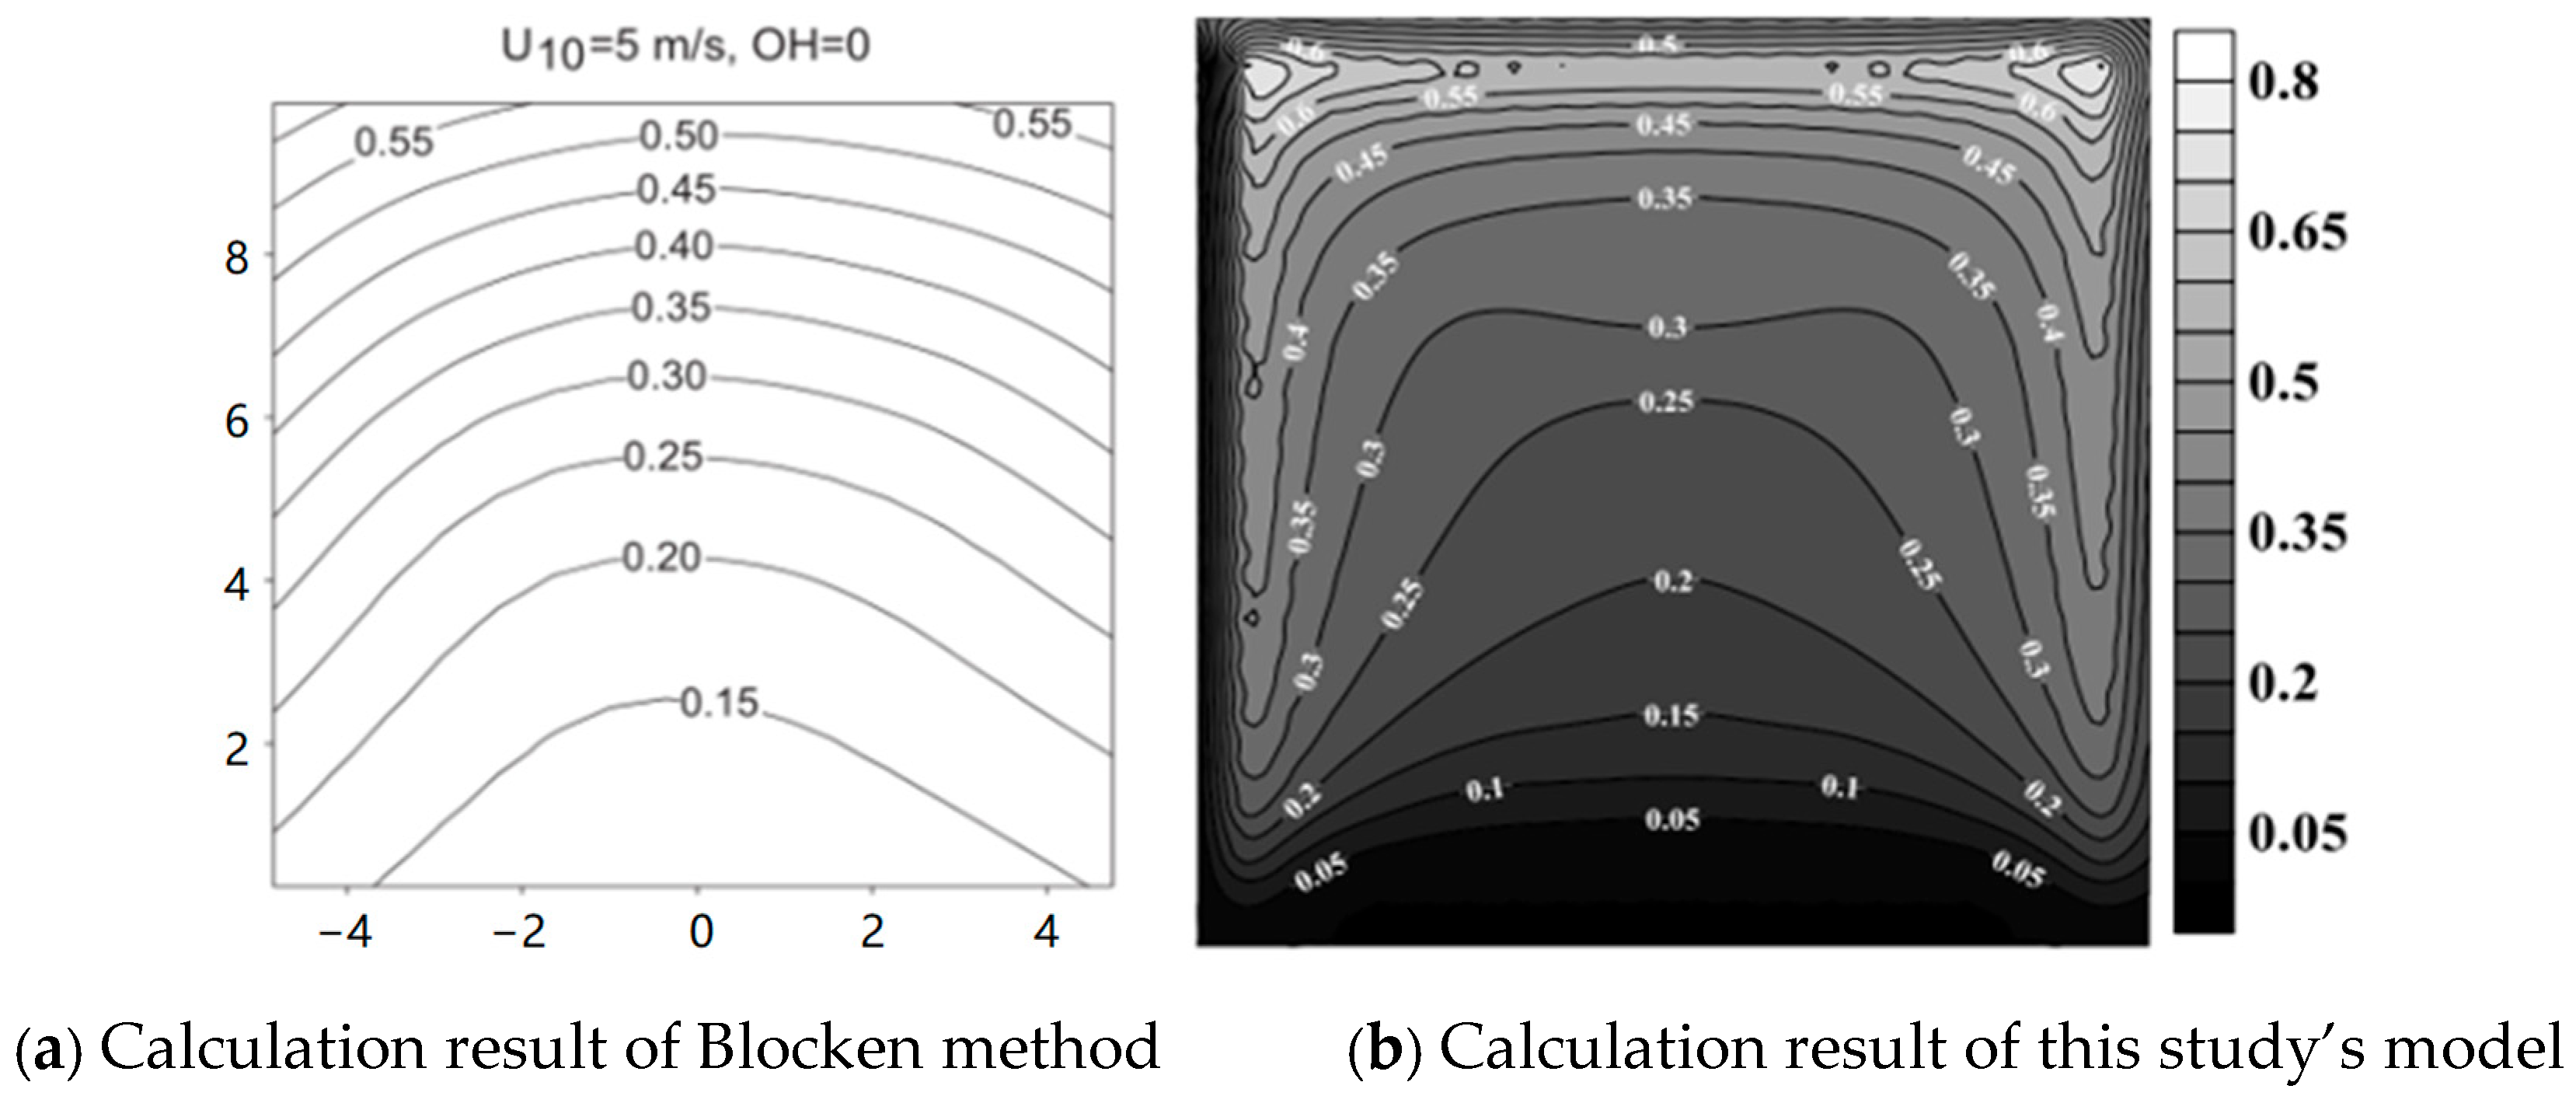
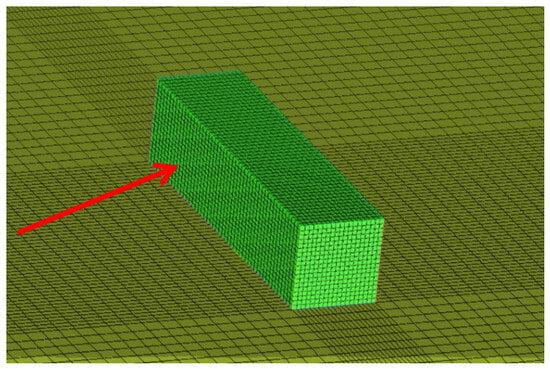
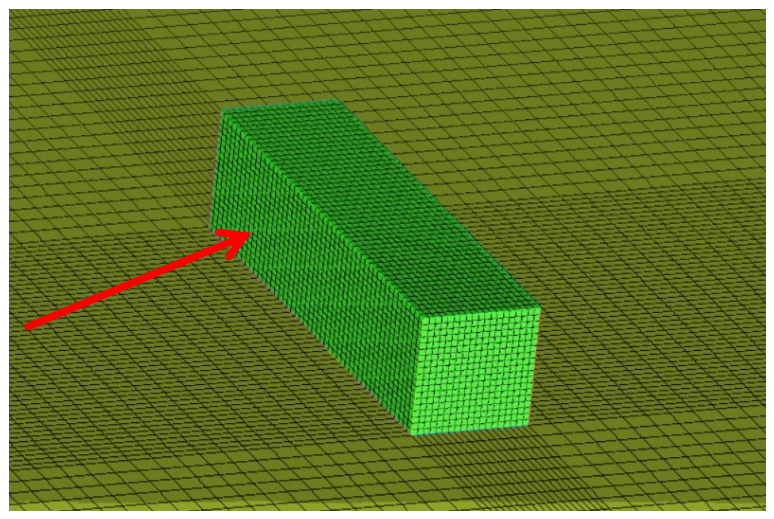
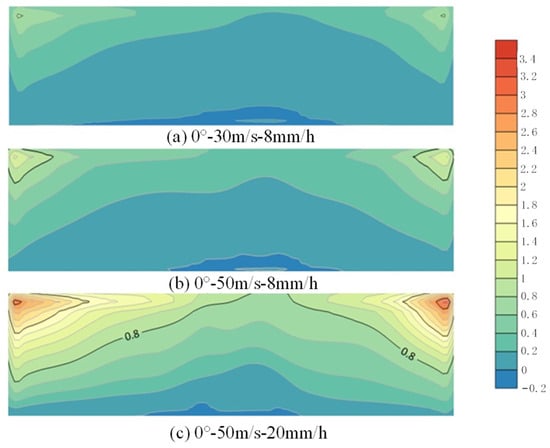
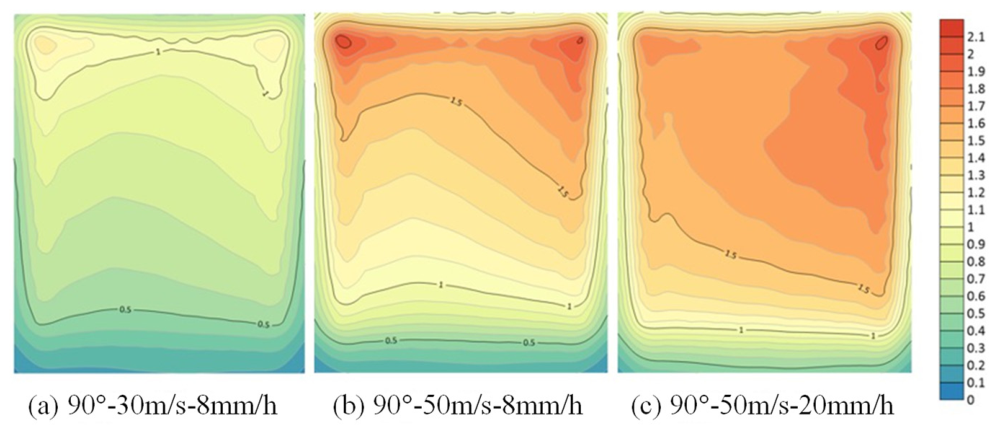
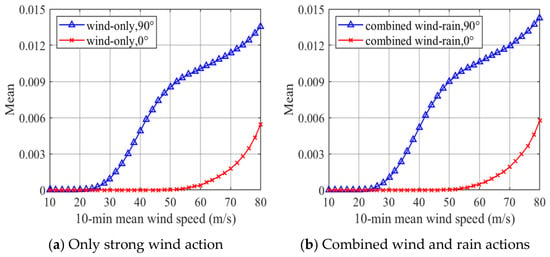
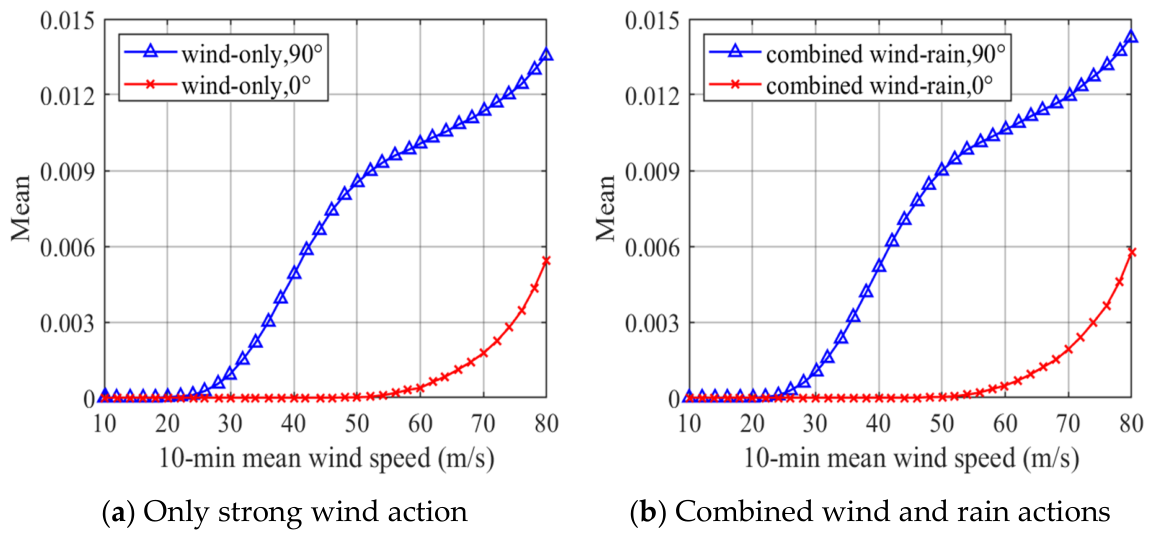
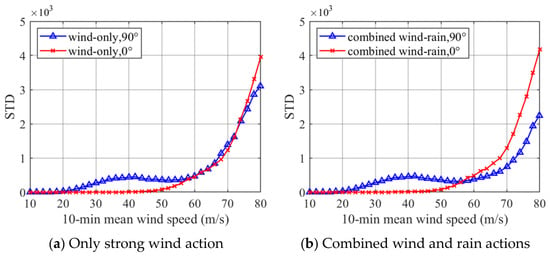
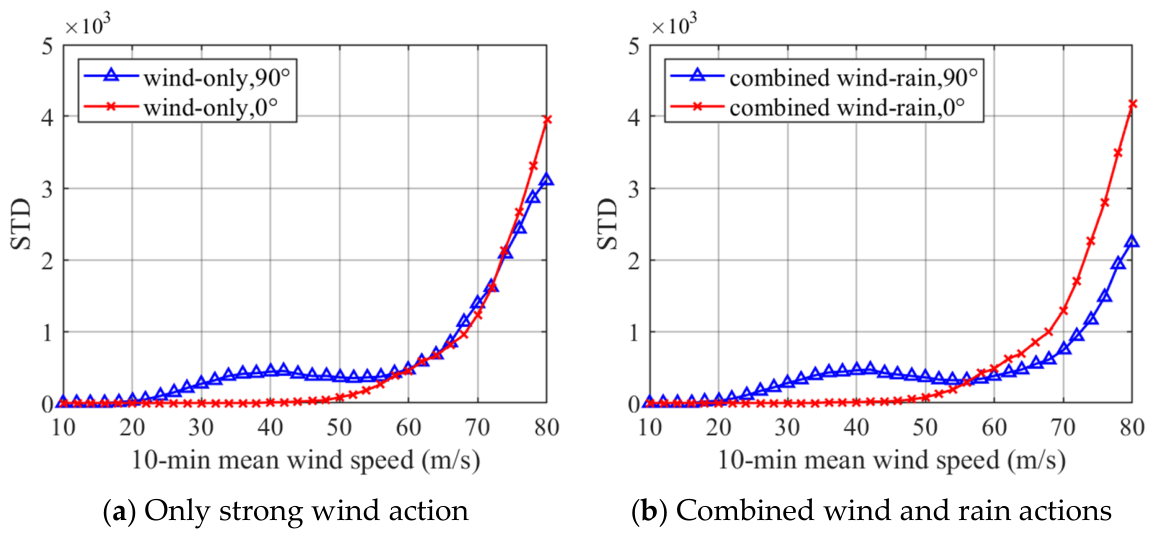
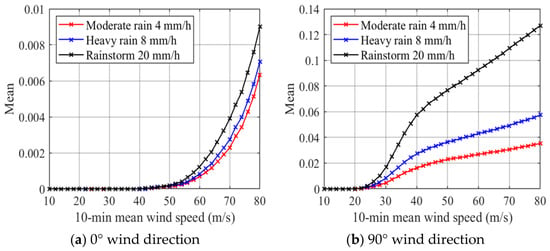
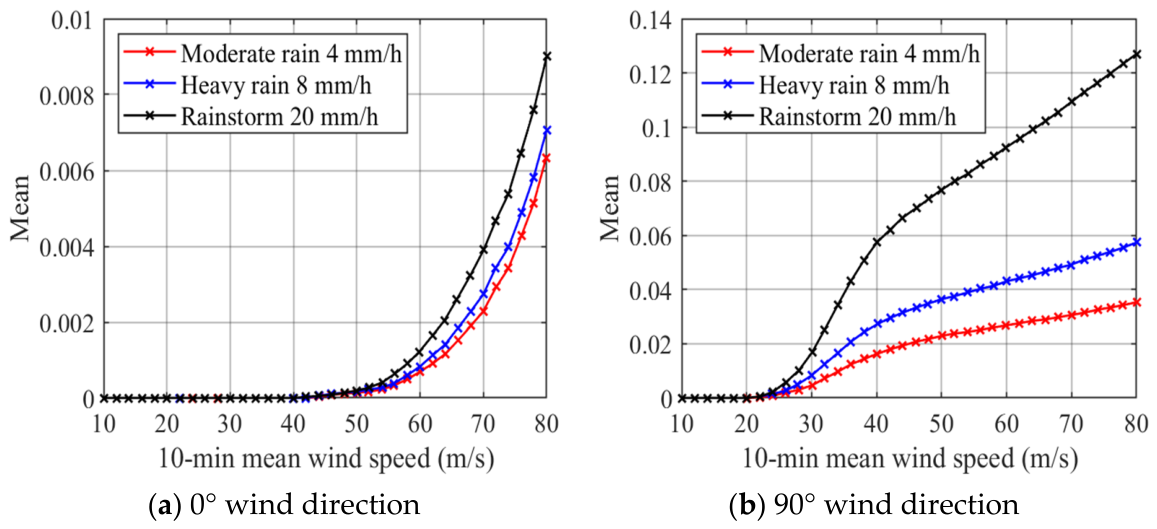
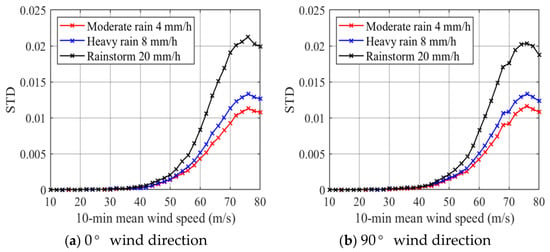
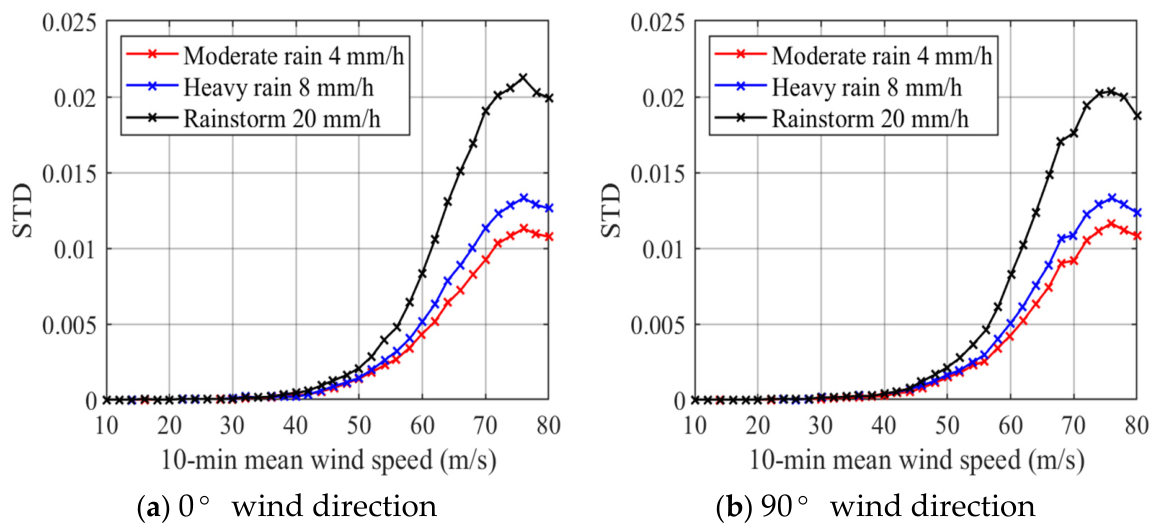

Disclaimer/Publisher’s Note: The statements, opinions and data contained in all publications are solely those of the individual author(s) and contributor(s) and not of MDPI and/or the editor(s). MDPI and/or the editor(s) disclaim responsibility for any injury to people or property resulting from any ideas, methods, instructions or products referred to in the content. |
© 2026 by the authors. Licensee MDPI, Basel, Switzerland. This article is an open access article distributed under the terms and conditions of the Creative Commons Attribution (CC BY) license.