


Abstract
To quantitatively evaluate the environmental performance of a Chinese solar greenhouse (CSG) in Northern China during the autumn–winter season and explore its matching relationship with the growth requirements of autumn–winter tomato production, continuous monitoring data collected throughout the tomato growing season were analyzed. The growth period was divided into four stages: Seedling, Flowering, Swelling, and Fruiting. An indicator framework was established to analyze air temperature, solar radiation, and humidity inside the CSG. Results showed that total indoor growing degree days (GDD) reached 1326.77 °C·d by harvest, substantially higher than outdoor conditions (476.30 °C·d). Stage-wise GDD exhibited a bimodal pattern, with the Seedling and Fruiting stages contributing 37% each, whereas the Swelling stage contributed only 10.38%. Notably, the relative GDD index (RGI) revealed a stage-specific thermal mismatch, peaking at 1.64 during the Seedling stage (indicating thermal surplus) and dropping to 0.67 during the Fruiting stage (reflecting heat insufficiency in deep winter). Across all growth stages, indoor daily mean accumulated radiation ranged from 7.05 to 8.12 MJ·m−2·d−1, and transmittance increased from 61% to 85%. Nevertheless, indoor radiation supply remained strongly constrained by the seasonal decline in outdoor radiation. Humidity regulation displayed pronounced diurnal asymmetry and stage-specific differences. Relative humidity (RH) suitability rates across the four growth stages were 57%, 16%, 12%, and 17%, respectively. Low humidity was prominent during the Seedling stage, with RH below 60% accounting for 32% of the time. High humidity dominated the Swelling and Fruiting stages, with RH above 80% accounting for 67% and 72% of the time, respectively, accompanied by frequent short-term low-humidity fluctuations. Overall, although CSGs in Northern China can effectively buffer external low temperatures during autumn–winter production, they still face challenges such as stage-specific imbalances in solar thermal energy storage and release, weak indoor light availability (especially during winter), and insufficient synergistic humidity regulation.
1. Introduction
Against the backdrop of intensifying global climate change, increasing pressure on arable land resources, and the growing demand for safe, high-quality, and transparent agricultural products, controlled environment agriculture has become a key pathway for modern agricultural transformation due to its ability to overcome natural constraints and ensure stable, efficient production [1,2,3]. Among various protected cultivation systems, the Chinese Solar Greenhouse (CSG), characterized by its reliance on solar energy, simple structure, and relatively low operating cost [4], has been widely adopted in temperate and cold-temperate regions and has become the dominant facility for winter vegetable production in Northern China [5]. During the autumn–winter season in Northern China, low outdoor temperatures, large diurnal temperature variations, frequent haze, consecutive overcast days that attenuate natural radiation, and dry cold air collectively induce pronounced stage-dependent and coupled variations in the greenhouse microclimate. Numerous studies have demonstrated that temperature, radiation, and humidity inside greenhouses directly determine crop photosynthetic assimilation, transpiration-driven mass transfer, and reproductive development [6], thereby critically influencing yield, quality, and energy consumption [7]. However, existing research has largely focused on single environmental factors or individual growth stages and has often relied on mean values or the proportion of time within suitable ranges as evaluation criteria. Such approaches make it difficult to reveal the degree of matching between environmental supply efficiency and crop physiological demand across growth stages, and they provide limited insight into the regulatory mechanism by which the greenhouse shifts from “passive buffering” to “active maintenance” as the season progresses.
Tomato, as a representative crop cultivated in CSG systems [8], is highly sensitive to temperature, sunlight, and air humidity. Previous studies have shown that supra-optimal temperatures during seedling production can promote stem elongation and excessive vegetative growth [9]; low light during flowering and fruit set can restrict assimilate supply and impair pollination and fertilization [10]; and during fruit enlargement and ripening, stable temperature and an appropriate vapor pressure deficit (VPD) are required to maintain transpiration, fruit growth, and quality [11]. Nevertheless, in practical autumn–winter production in Northern China, environmental control is still predominantly based on experience-driven segmented management, lacking systematic quantitative analysis grounded in stage-specific thermal efficiency, light energy supply structure, and vapor-driven physiological characteristics. This often results in over-regulation during some stages and under-regulation during others, creating a potential imbalance between energy consumption and environmental adaptation.
In recent years, greenhouse environmental studies have gradually shifted from static descriptions of individual factors to coupled analyses of light, heat, and humidity. Unlike modern multi-span greenhouses, the environmental regulation of the CSG largely depends on the passive energy process of daytime solar radiation input, wall heat storage, and nighttime heat release for insulation. It is also jointly affected by the light transmittance of covering materials, ventilation and dehumidification, the opening and closing of thermal insulation quilts, and external meteorological conditions. He et al. (2025) [12] pointed out that studies on environmental control in the CSG have mainly focused on light regulation, heat storage and insulation, ventilation and cooling, and automated control; however, future development should shift from single-factor environmental optimization to the coordinated regulation of the “environment–crop–energy” system. This suggests that the evaluation of greenhouse environmental performance should not be limited to whether air temperature, solar radiation, or humidity remains within suitable ranges, but should further examine whether the environmental regulation process matches crop requirements at different growth stages and whether such matching is achieved at a reasonable energy cost.
Regarding specific environmental factors, temperature studies commonly use mean temperature, diurnal temperature difference, duration within the suitable temperature range, and growing degree days (GDD) to characterize thermal supply. Among these indicators, growing degree days can transform the temperature process into a thermal time scale for crop development [13]; however, cumulative thermal quantity alone is insufficient to reflect the efficiency of heat supply per unit time across different growth stages. Studies on the light environment mainly focus on the light transmittance of covering materials, daily cumulative radiation, and supplemental lighting requirements. He et al. (2021) [14] indicated that covering and light-modulating materials can alter light intensity, spectral composition, and radiation distribution inside greenhouses, thereby affecting leaf photosynthesis, assimilate allocation, yield, and quality formation. However, in the CSG in Northern China during the autumn–winter season, the decline in solar elevation angle, increased frequency of foggy and overcast weather, and contamination and aging of covering materials jointly lead to a continuous decrease in natural radiation. Under such conditions, the greenhouse structure primarily attenuates incoming solar radiation through transmission rather than actively compensating for weak light. In terms of humidity, RH and VPD are important indicators linking temperature, ventilation, transpiration, and disease risk. Shamshiri et al. (2018) [7] showed that the suitable ranges of temperature, humidity, and VPD differ among growth stages. Šalagovič et al. (2024) [15] further found, based on multi-point monitoring, that temperature and VPD inside greenhouses exhibit pronounced spatial heterogeneity, and that a single central sensor may not accurately represent the actual microclimate around the crop canopy. In addition, Yu et al. (2024) [16] reported that VPD not only affects the transpiration driving force but is also closely related to tomato yield, crop water productivity (yield produced per unit water consumed), and fruit quality; non-optimal VPD conditions—both excessively low VPD (which suppresses transpiration-driven xylem flow) and excessively high VPD (which induces stomatal closure)—can restrict calcium uptake and transport, thereby increasing the risk of Ca-related physiological disorders (such as blossom-end rot) and adding to environmental regulation costs. Therefore, the core issue in light, heat, and humidity research is no longer whether a single factor is “within the suitable range”, but whether multi-factor regulation can achieve coordinated matching across time scales, growth stages, and energy constraints.
In response to these issues, this study focuses on autumn–winter tomato production in a CSG in Northern China. Based on continuous monitoring data throughout the whole growth period, we constructed an indicator system comprising GDD, relative growing degree index (RGI), thermal gain rate (Gain), transmittance (τ), and the suitable fraction rate (SFR). Unlike previous studies that mainly emphasized single environmental factors or average-state evaluation, this study quantitatively analyzes the stage-specific evolution of temperature, solar radiation, and humidity environments in a CSG, as well as their matching relationships with tomato physiological demands, from three perspectives: stage-specific heat supply efficiency, light energy input structure, and vapor-driven stability. Furthermore, this study reveals the bottlenecks in coordinated light–heat–humidity regulation during the transition of autumn–winter solar greenhouses from early-stage passive buffering to intensive heat-preservation maintenance in deep winter, thereby providing a theoretical basis and quantitative support for developing intelligent precision control strategies based on growth-stage requirements and multi-factor coupled feedback.
2. Materials and Methods
2.1. Experimental Greenhouse
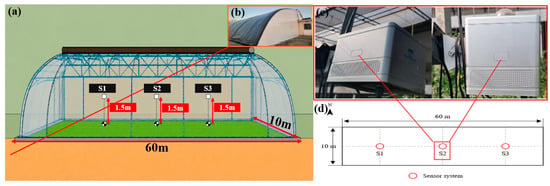
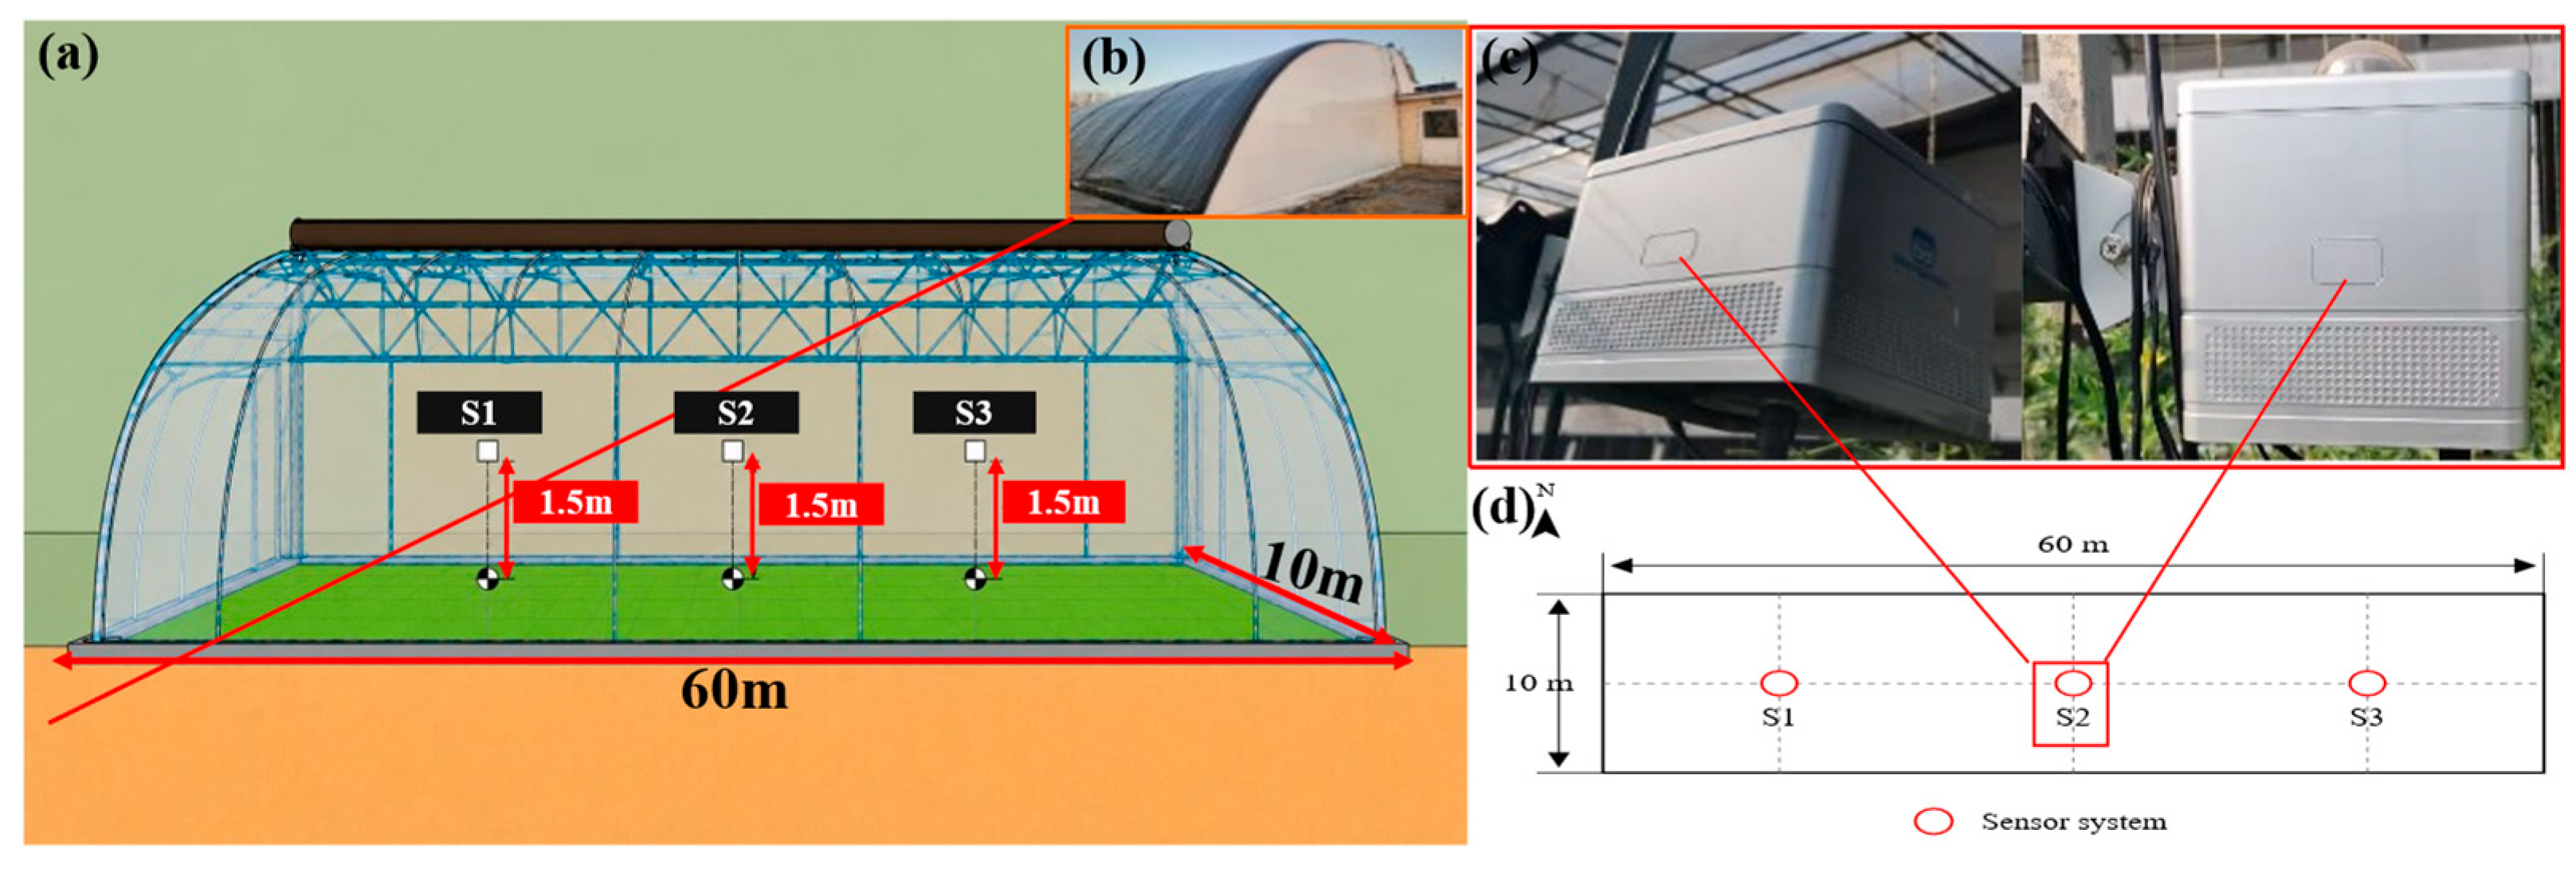
The experiment was conducted from 4 September 2024 to 27 January 2025 in Dasungezhuang Town, Shunyi District, Beijing, China (40°02′21″ N, 116°50′55″ E, altitude 34 m). The experimental greenhouse was a single-span structure-typical CSG in Northern China, oriented east–west, measuring 60 m in length, with a north–south span of 10 m and a ridge height of 5.5 m (Figure 1). The covering material was a polyolefin (PO) film (Shandong Shouzheng Plastics Co., Ltd., Zibo, China) with a thickness of approximately 0.16 mm. The back wall and gable walls were constructed using 1.5-cm-thick polystyrene boards (Langfang Chengfu Energy Conservation Technology Co., Ltd., Langfang, China) which were pieced together block by block and plastered with cement on both the interior and exterior surfaces. Additionally, a thermal insulation blanket was applied to the exterior walls to prevent air leakage. Nighttime insulation is achieved by relying on the back wall, gable wall, and covering insulation blankets, whereas daytime heat was mainly obtained from solar radiation. Temperature and humidity were regulated primarily by opening and closing the vents. Therefore, the greenhouse exhibited typical characteristics of passive heat storage/release and natural ventilation-based environmental regulation. Because such structures are widely used in autumn–winter protected vegetable production in Northern China, this greenhouse is considered representative and can reasonably reflect the environmental dynamics and regulation patterns of the CSG.
Figure 1.
Schematic diagram of the experimental CSG and sensor deployment. (a) Three-dimensional structural diagram of the experimental greenhouse; (b) exterior view of the greenhouse under field conditions; (c) photograph of the DEEPBERRY intelligent sensor system; (d) layout of sensor deployment inside the greenhouse, where three sensor units were evenly arranged along the east–west direction and labeled as S1, S2, and S3, respectively.
Tomato (Solanum lycopersicum L. cv. Glorioso) was used as the test crop. The seeds were provided by China Vegetable Seed Co., Ltd. (Beijing, China). This cultivar is a truss-harvest cocktail tomato characterized by regular and uniform truss formation and resistance to several common tomato diseases, making it suitable for greenhouse production [17]. The experiment was conducted using substrate cultivation. The substrate was prepared by mixing peat, vermiculite, and perlite at a volume ratio of 3:1:1. The cultivation ridges were designed with dimensions of 700 cm × 25 cm × 20 cm. Tomatoes were planted with a plant spacing of 20 cm and a row spacing of 155 cm. Seedlings were transplanted at the 3- to 4-true-leaf stage. A vine-hanging system was employed for plant support.
During the experiment, the greenhouse environment was regulated primarily through the use of thermal insulation blankets (Renqiu Hongfei Quilting Co., Ltd., Renqiu, China) and ventilation adjustments. Black needle-punched felt was used as the thermal blanket, with a thickness of approximately 2 cm and an overall heat transfer coefficient of 1.5 W/(m2·°C). The ventilation system consisted of upper and lower vents. The maximum opening widths of the upper and lower vents were 40 cm and 170 cm, respectively, with both having a length of 6000 cm. During the spring and autumn seasons, both vents were opened simultaneously, whereas in winter, only the upper vent was slightly opened.
2.2. Environmental Monitoring and Growth Stage Division
To quantitatively evaluate the relationship between greenhouse environmental variation and tomato growth responses, continuous fixed-point monitoring of key environmental factors, including air temperature, solar radiation intensity, and humidity, was conducted both inside and outside the greenhouse. After preprocessing, the raw data were segmented according to tomato growth stages, and a series of analytical indicators were subsequently calculated and constructed based on these stage-wise datasets.
The DEEPBERRY intelligent sensor system (Model: Green Satellite; Suzhou Deepberry Intelligent Technology Co., Ltd. Changsha, China) was used in this experiment. Three sensor units were evenly installed along the east–west direction inside the greenhouse. These sensors continuously recorded air temperature, solar radiation intensity, and relative humidity at a sampling interval of 10 min. Data were automatically logged and stored (Table 1). An outdoor sensor was installed on the greenhouse side room at a height of 4.5 m above ground level with no shading or obstruction.
Table 1.
Description of monitored variables and sensor specifications.
Based on the physiological characteristics and developmental patterns of autumn–winter tomato cultivation in Northern China, the entire growth cycle was divided into four stages (Table 2). Environmental monitoring, parameter calculation, and characteristic analysis were all conducted according to these phenological stages: Seedling establishment stage (Seedling, S), flowering and fruit-setting stage (Flowering, F), swelling stage (Swelling, SW), and fruit maturation and harvesting stage (Fruiting, FR).
Table 2.
Growth stage schedule of autumn–winter tomato cultivation in the CSG in Northern China.
2.3. Data Preprocessing
To improve data quality and ensure the reliability of subsequent analyses, the raw environmental data collected inside and outside the greenhouse including air temperature, relative humidity, and solar radiation were preprocessed. Missing values and abnormal observations were first examined to construct continuous and complete time series data. Subsequently, measurements from multiple sensors monitoring the same environmental variable were harmonized. The arithmetic mean value at each sampling time was used as the representative value to reduce random errors and the influence of local microenvironmental differences. The processed dataset was then used for time series variation analysis and indicator calculation.
During preprocessing, short missing segments were filled by linear interpolation to preserve temporal continuity, whereas data segments with prolonged continuous gaps were excluded from further analysis [18]. Outliers were identified using statistical criteria. Specifically, the 3σ rule was applied, and observations located more than three standard deviations from the mean were flagged as potential anomalies [19]. This screening was complemented by the interquartile range (IQR) method based on boxplot fences [20]. Detected outliers were then either removed or replaced by interpolation according to their distribution patterns, so as to reduce the influence of abnormal fluctuations on subsequent analyses.
2.4. Construction of Evaluation Indicators
To quantitatively evaluate greenhouse environmental regulation performance and tomato growth responses across different developmental stages, a set of environment-related indicators was established based on the actual variations in internal and external greenhouse conditions and the sensor data collected during the experiment. The specific indicators and their calculation methods are described below.
Growing Degree Days represent the cumulative daily mean temperature exceeding the minimum threshold required for crop growth and are a core quantitative indicator of thermal supply for plant development (°C·d). The calculation is given in Equation (1).
where is the daily mean temperature on day (°C), is the minimum base temperature for tomato growth (°C), and is the number of days in the given growth stage (d). When , the term is set to zero.
The Growing Degree Days Contribution Rate (GCR) is defined as the proportion of GDD in a specific growth stage relative to the total GDD across the entire growth cycle, reflecting the thermal contribution characteristics of each stage (%). The definition is given in Equation (2).
where is the GDD of a specific stage (°C·d) and is the total GDD over the whole growth period (°C·d).
Because the duration of tomato growth stages varies, GCR is strongly influenced by stage length and cannot objectively compare temperature response sensitivity among stages. Therefore, this study proposes the RGI to eliminate the influence of stage duration and evaluate the efficiency of heat accumulation per unit time. The resulting index is defined in Equation (3).
where is the duration of the stage (d) and is the total duration of the growth cycle (d).
To evaluate the heat preservation and warming performance of the greenhouse at different growth stages, the thermal gain rate (Gain) is defined to quantify the relative enhancement of thermal accumulation inside the greenhouse compared to outdoor conditions. The calculation is given in Equation (4).
where and are the accumulated GDD inside and outside the greenhouse, respectively, during stages.
To assess the light interception performance of the greenhouse during different tomato growth stages, transmittance () is introduced: The calculation is given in Equation (5).
where denotes the growth stage (S, F, Sw, Fr), is the number of days in the stage, and and are the daily cumulative global radiation inside and outside the greenhouse on day (MJ·m−2·d−1).
Vapor Pressure Deficit (VPD) is defined as the difference between saturated vapor pressure and actual vapor pressure at a given temperature, indicating the dryness of the air and the driving force for plant transpiration (kPa). VPD was calculated from air temperature and relative humidity as follows: The calculation is given in Equation (6).
where is the vapor pressure deficit (kPa), is the air temperature (°C), and is the relative humidity (%). The constant 0.6108 represents the saturated vapor pressure at 0 °C in kPa.
The Suitable Fraction Rate (SFR) is defined as the proportion of monitoring time during which an environmental factor remains within the optimal range for tomato growth during a given stage (%), reflecting the adaptability and stability of environmental regulation. The calculation is given in Equation (7).
where is the duration during which the environmental factor is within the suitable range (h), and is the total monitoring duration during the stage (h).
2.5. Statistical Analysis and Data Processing
Microsoft Excel 2016 (Microsoft Corporation, Redmond, WA, USA) and Python 3.10 (Python Software Foundation, Wilmington, DE, USA) were used for basic data organization and calculation of all quantitative indicators. Origin 2024 (OriginLab Corporation, Northampton, MA, USA) and Python 3.10 (Python Software Foundation, Wilmington, DE, USA) were employed for statistical analysis and visualization, including temperature heat maps, dynamic solar radiation curves, hourly boxplots of RH, and dynamic VPD variation plots. Linear regression analysis was conducted to evaluate the correlation between indoor and outdoor solar radiation intensity, and the corresponding regression equations and coefficients of determination () were obtained. Descriptive statistical methods were further applied to analyze the interval distribution and fluctuation characteristics of each environmental factor, enabling a quantitative assessment of environmental regulation performance and physiological suitability in the greenhouse.
3. Results
This section focuses on three primary environmental factors: air temperature, solar radiation, and relative humidity. Starting from the preprocessed raw data, the defined indicators were calculated according to the proposed formulas. Professional plotting tools and data analysis software were used to visualize the results through various figures, followed by detailed analysis to interpret the environmental regulation characteristics and their implications for tomato growth.
3.1. Temperature Characteristics Inside the Greenhouse
This subsection first compares indoor and outdoor air temperatures to identify overall trends. Growing Degree Days (Equation (1)) were then calculated, followed by the construction of key indicators including the Growing Degree Days Contribution Rate (Equation (2)), Relative GDD Index (Equation (3)), and thermal gain rate (Equation (4)), to analyze thermal differences between indoor and outdoor environments as well as heat accumulation within the greenhouse. Furthermore, temperature interval distribution plots and stage-wise hourly heat maps were used to reveal temperature distribution patterns across different growth stages.
3.1.1. Comparison of Indoor and Outdoor Air Temperature
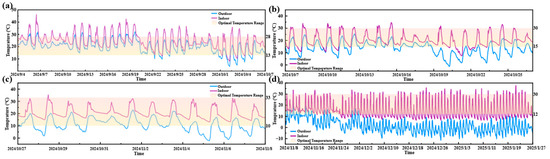
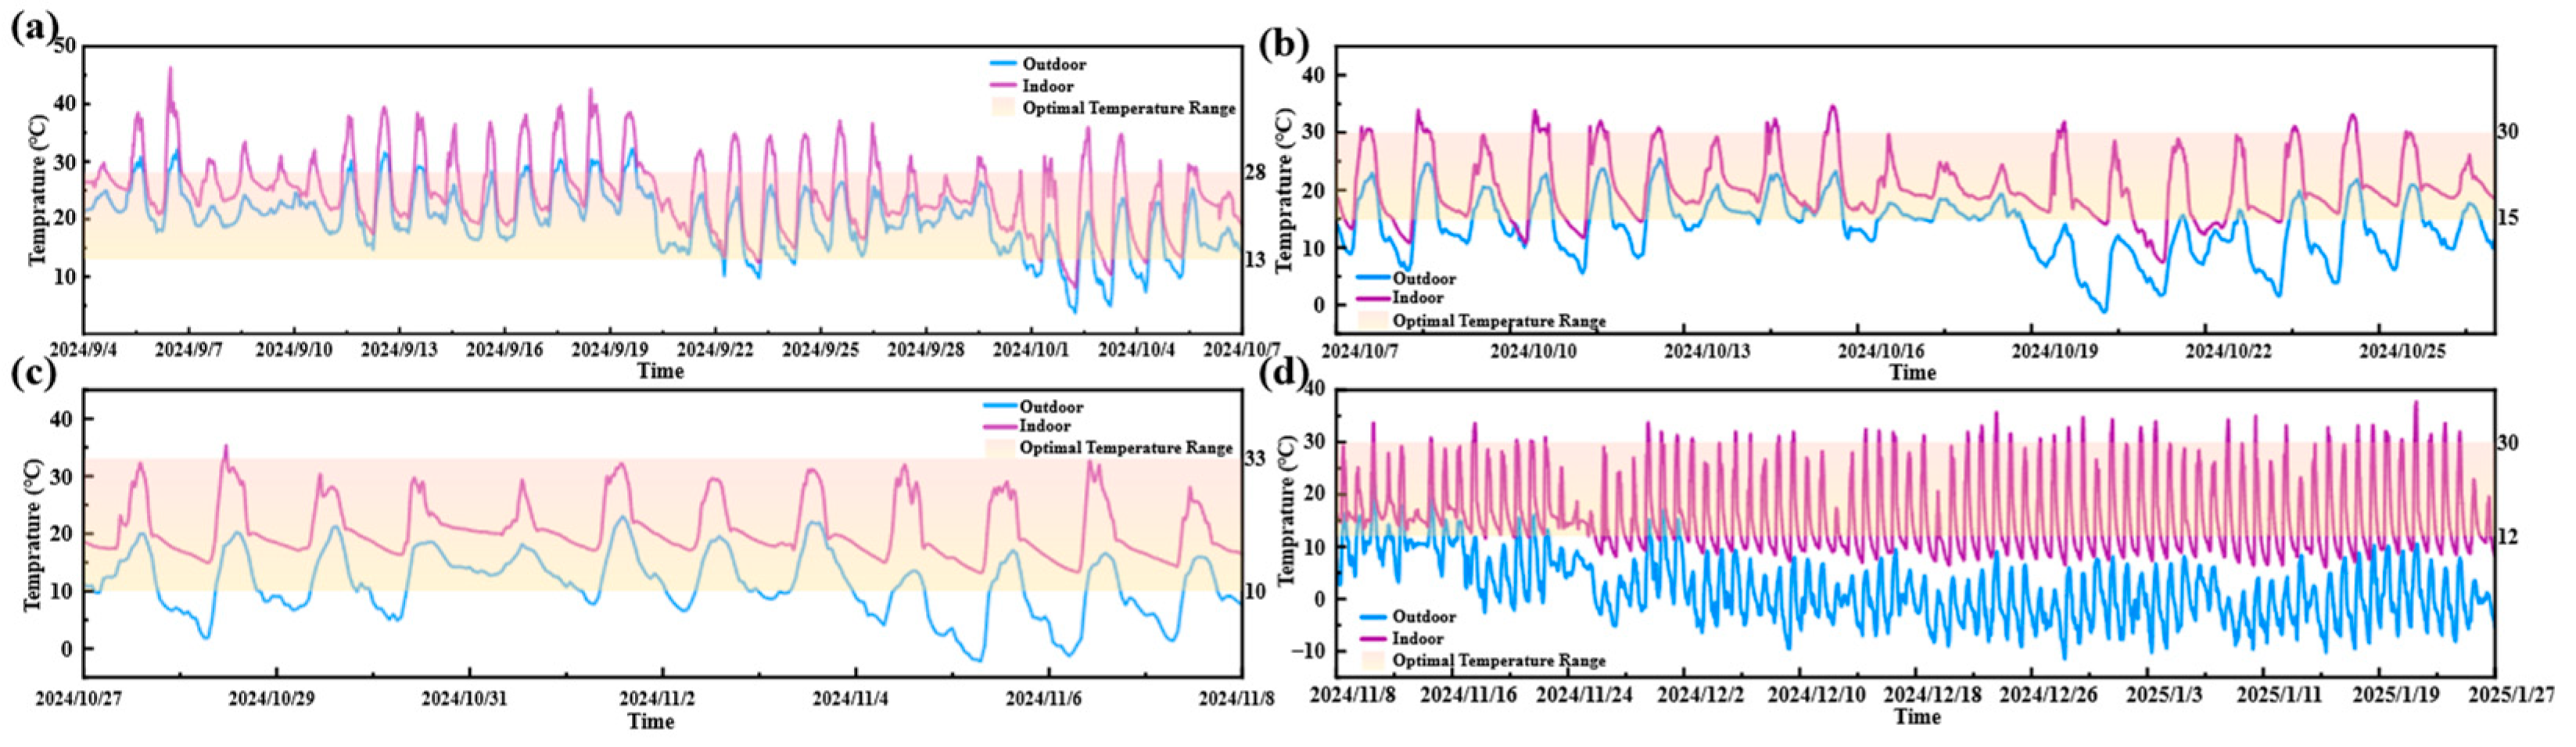
During the autumn–winter season in Northern China, outdoor air temperature shows a pronounced declining trend with strong fluctuations as the season progresses. In contrast, the indoor temperature of the CSG remains relatively stable, demonstrating effective climatic buffering and temperature regulation capacity (Figure 2).
Figure 2.
Comparison of indoor and outdoor temperatures during the four growth stages of tomato cultivation in a CSG in Northern China. (a–d) represent the four growth stages, respectively. Based on the stage-specific thermal requirements of tomato and previous studies on the optimal and marginal temperature ranges for greenhouse tomato cultivation, the suitable temperature ranges were set as 13~28 °C, 15~30 °C, 10~33 °C, and 12~30 °C for the S, F, SW, and FR stages, respectively [21,22].
During the seedling stage (Figure 2a), influenced by short-term recurring hot weather in early autumn and large diurnal temperature differences, the outdoor temperature ranged from 15 to 32 °C. The daytime indoor temperature was maintained between 20 and 30 °C, effectively mitigating heat stress on young seedlings during high-temperature periods. At night, the indoor temperature remained between 12 and 25 °C, generally satisfying the thermal requirements for seedling establishment and root development.
As the crop entered the flowering stage (Figure 2b), late-autumn cooling caused the outdoor temperature range to narrow to 5~25 °C. However, the indoor daytime temperature of the CSG remained stable within the optimal range of 20~30 °C, closely matching the thermal requirements for tomato flowering and pollination. Nighttime indoor temperatures were controlled within 12~20 °C, effectively preventing flower and fruit drop induced by outdoor low temperatures.
During the swelling stage (Figure 2c), outdoor temperatures further declined to 0~23 °C. The indoor daytime temperature was still maintained within 20~30 °C, tending toward the upper end of the suitable range, which provided a favorable thermal environment for cell division and dry matter accumulation in fruits. Nighttime indoor temperatures remained stable between 13 and 20 °C, facilitating nutrient translocation to fruits while counteracting the inhibitory effects of outdoor low temperatures. In the fruiting stage (Figure 2d), frequent cold waves occurred during the Northern China winter, and outdoor temperatures dropped sharply to −11 to 22 °C, with more frequent extreme low-temperature events. Despite slight fluctuations, the indoor daytime temperature remained within 20~30 °C, meeting the thermal requirements for fruit coloration and sugar accumulation. At night, indoor temperatures were maintained between 10 and 18 °C, significantly higher than the outdoor environment, effectively preventing chilling injury and frost damage to the fruits.
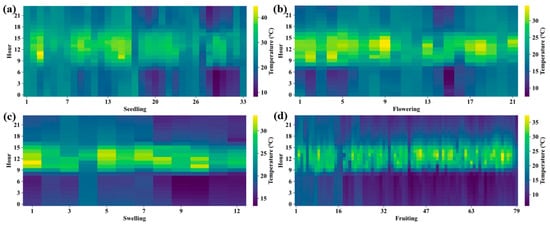
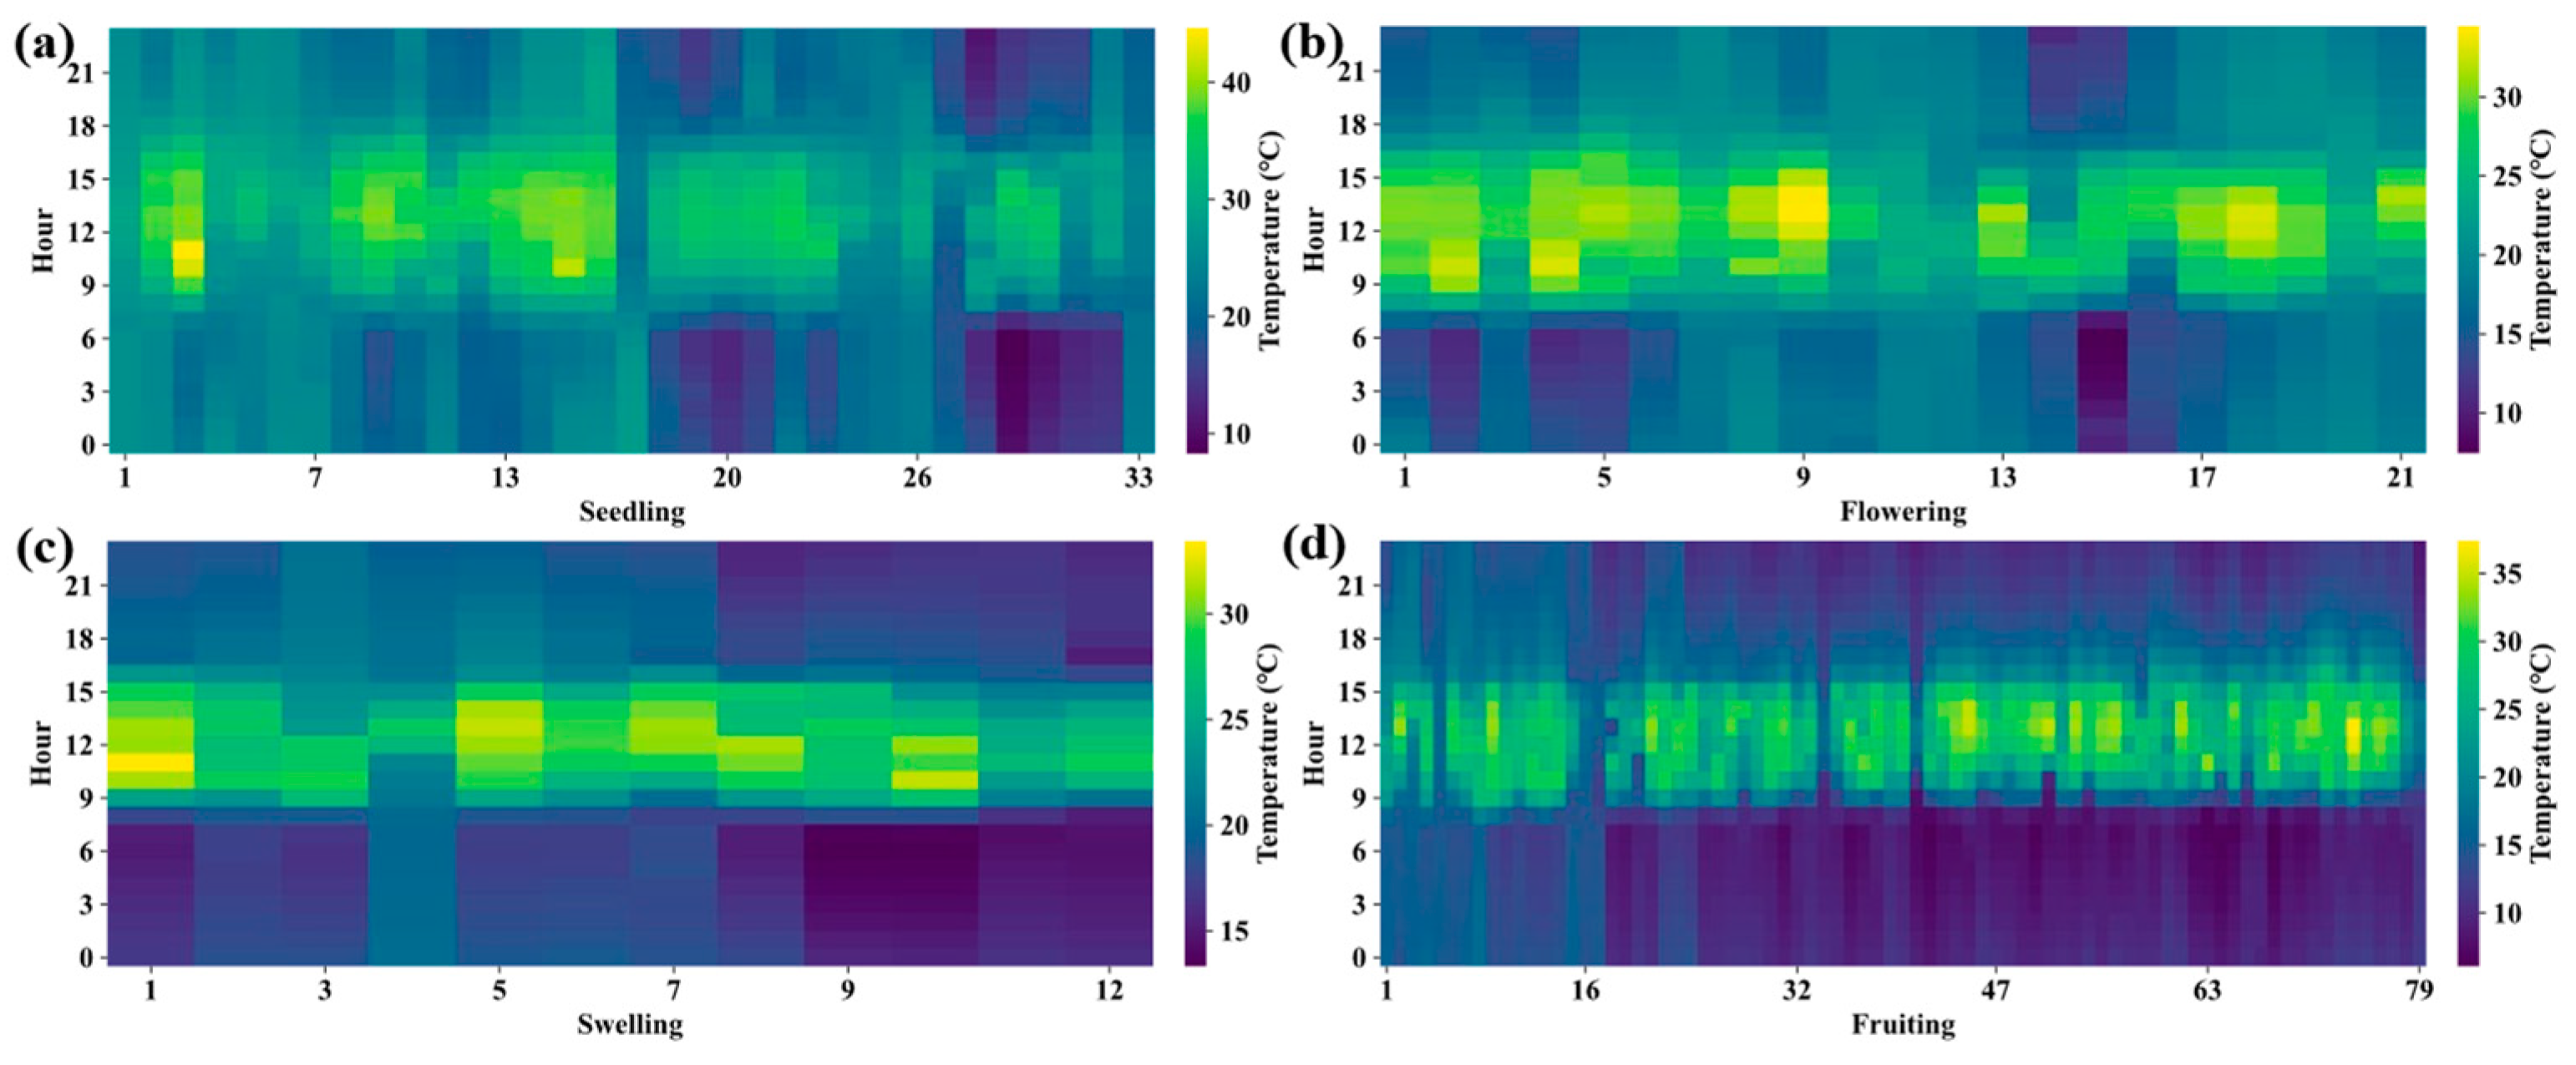
The temperature heat map (Figure 3) showed that the seedling stage (Figure 3a) had the highest daytime temperature peaks, approaching 40 °C, and the longest duration of high-temperature exposure, while nighttime low-temperature fluctuations were relatively small. During the flowering stage (Figure 3b), the diurnal temperature variation was the smoothest, with the smallest day-night temperature difference. In the swelling stage (Figure 3c), daytime peak temperatures decreased markedly, while nighttime low temperatures occurred earlier and persisted for longer periods, resulting in an enlarged diurnal temperature range. During the fruiting stage (Figure 3d), temperature fluctuated most frequently and showed the highest dispersion.
Figure 3.
Heat map of hourly temperature distribution across the four growth stages of greenhouse tomato. (a–d) correspond to the four developmental stages of tomato, respectively. The color scale from purple to yellow indicates temperatures from low to high. The x-axis unit is day.
Across the whole growth period, the maximum daytime temperature gradually decreased as development progressed. It ranged from 25 to 40 °C during the seedling stage, narrowed to 20~30 °C during the flowering stage, remained mostly below 30 °C during the swelling stage, and exhibited multi-peak fluctuations between 20 and 35 °C during the fruiting stage. Meanwhile, the minimum nighttime temperature continued to decline, decreasing from 10~20 °C during the seedling stage to 10~15 °C during the flowering and fruiting stages, and becoming further concentrated below 15 °C during the swelling stage. The day-night temperature difference gradually increased and reached its maximum during the fruiting stage.
In terms of stability, the flowering stage showed the most concentrated and continuous temperature distribution. The seedling stage exhibited large fluctuations in the early period and abrupt nighttime cooling in the later period. The swelling stage showed a gradual downward shift while maintaining relative continuity. In contrast, the fruiting stage had the highest dispersion, with fragmented and intermittent daytime high-temperature zones, resulting in the poorest overall uniformity.
3.1.2. Characteristics of GDD
According to Equation (1), the minimum base temperature for tomato growth was set to 8 °C and the upper threshold temperature to 38 °C. Instantaneous GDD values were first calculated at each 10-min interval based on the sensor sampling frequency. These values were then aggregated to obtain daily GDD both inside and outside the greenhouse, followed by stage-wise GDD accumulation.
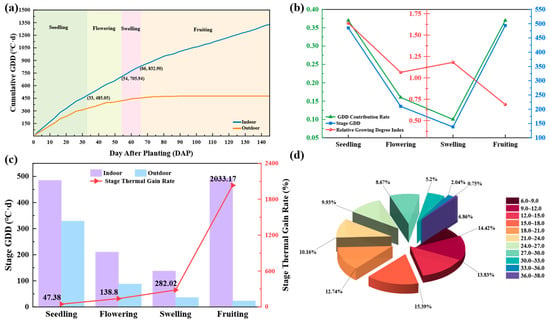
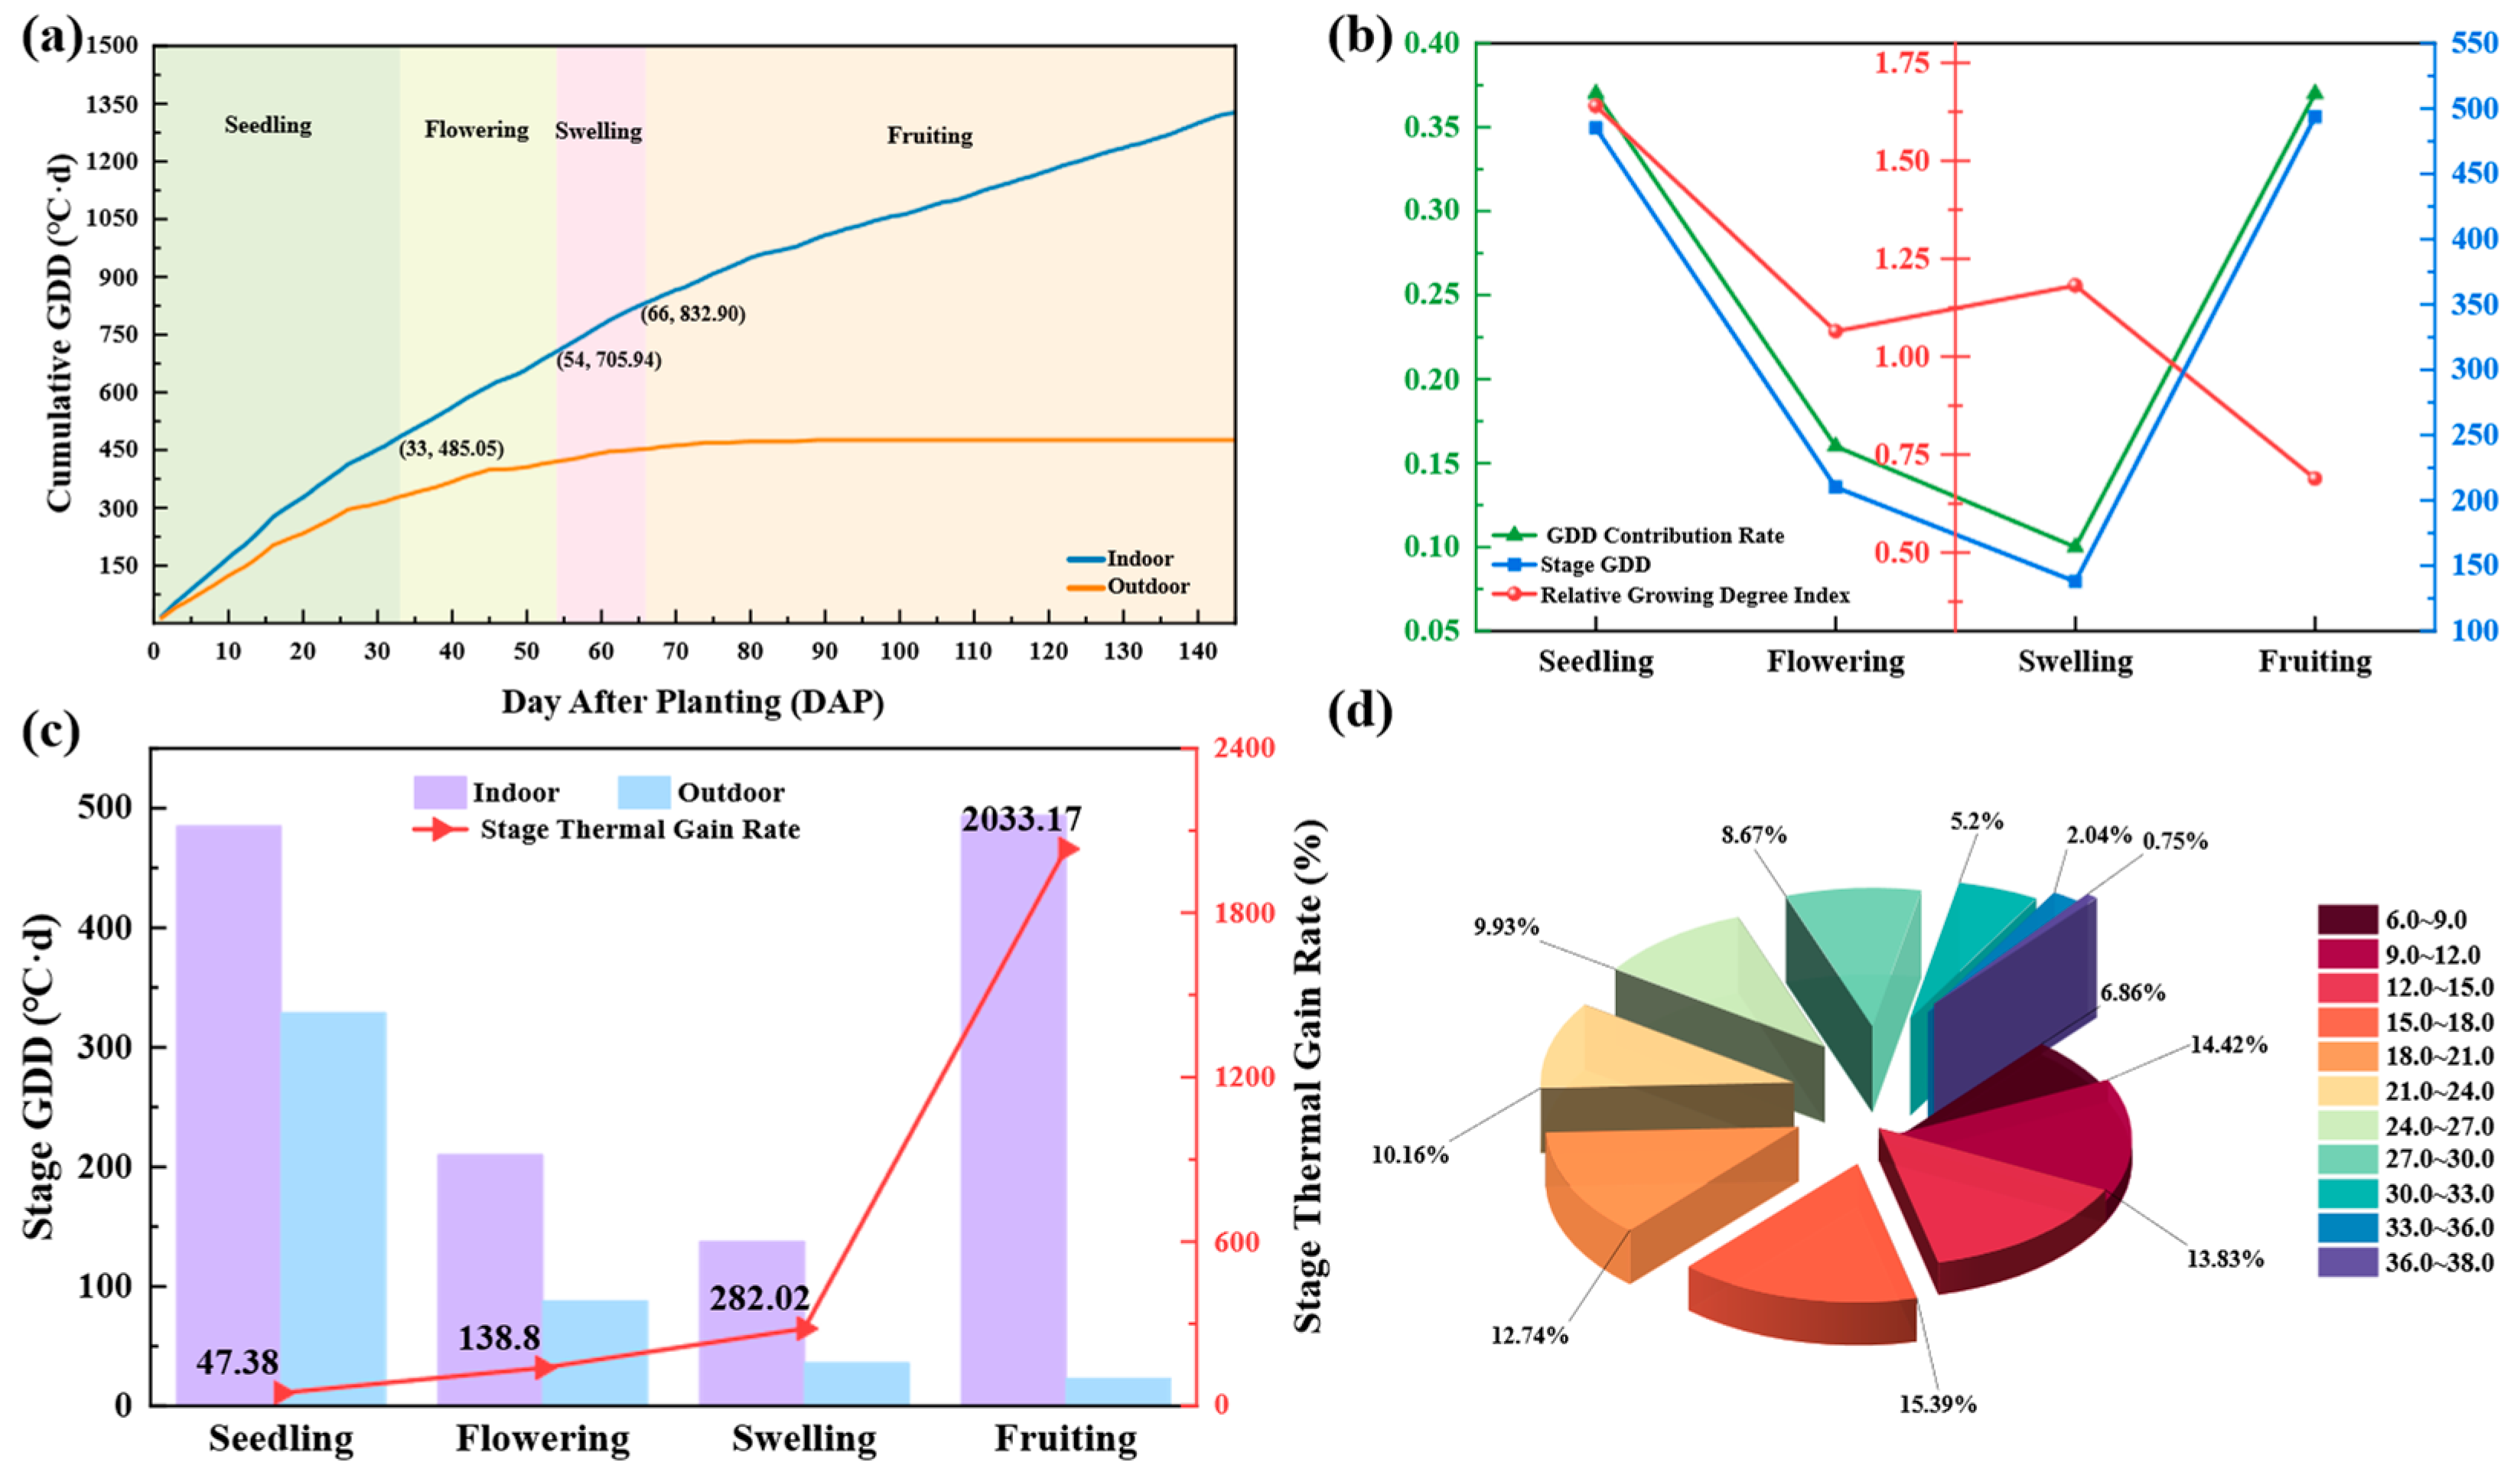
Analysis of the GDD data shows that indoor GDD in the CSG exhibits a continuous and stable linear increase throughout the growth cycle, whereas outdoor GDD tends to level off approximately 90 days after transplanting due to seasonal cooling (Figure 4a). During the seedling stage, indoor cumulative GDD reached 485.05 °C·d at 33 days after transplanting, significantly higher than the outdoor level during the same period. By day 54, indoor GDD increased to 705.94 °C·d, and by day 66 it reached 832.90 °C·d. During the fruit maturation and harvesting stage, indoor GDD continued to rise steadily, eventually reaching 1326.77 °C·d, while outdoor GDD remained nearly constant at approximately 450 °C·d.
Figure 4.
GDD dynamics, stage-wise heat allocation, and temperature interval distribution of tomato in the CSG. (a) Dynamic changes in GDD inside and outside the CSG across growth stages; (b) stage-wise GDD, GCR, and RGI, where blue squares indicate stage GDD (right axis, °C·d), green triangles indicate GCR (left axis), and red circles indicate RGI (middle red axis); (c) comparison of stage GDD inside and outside the CSG and stage thermal gain rate across growth stages; (d) time proportion of different temperature intervals over the whole growth period. Temperature classes were defined from the rounded minimum temperature to the rounded maximum temperature at 3 °C intervals.
Stage-wise effective GDD and GDD contribution rate exhibit a distinct bimodal pattern (Figure 4b). The seedling stage and the fruit maturation–harvesting stage represent the two peaks of thermal supply, with stage GDD values of approximately 485.05 °C·d and 493.87 °C·d, respectively, each contributing about 37% to the total GDD. In contrast, the flowering stage and the swelling stage form the troughs, with the swelling stage showing the lowest GDD at only 137.78 °C·d and a contribution rate of 10.38%.
The trend of the Stage-wise RGI (Figure 4b) reveals a mismatch between heat supply efficiency per unit time and total thermal supply. During the seedling stage, the RGI reached a maximum of 1.64, significantly higher than the average level for the entire growth period, indicating that the greenhouse has implemented enhanced temperature control to ensure the cultivation of slow-growing and robust seedlings, but caution is needed as excessive warming may increase the risk of excessive elongation. During the flowering stage, RGI declines to 1.07, close to the overall average, suggesting a relatively reasonable temperature regulation strategy, although this stage requires high temperature stability, and fluctuations may adversely affect pollination and fertilization. The swelling stage shows a slight increase to 1.18, where moderate heating benefits fruit growth, but rapid warming or frequent fluctuations may cause fruit cracking or uneven enlargement. In contrast, the fruit maturation–harvesting stage drops sharply to 0.67, well below the overall average. This stage lasts the longest and is strongly affected by extreme winter low temperatures in Northern China, leading to a significant decline in heating efficiency per unit time. Insufficient thermal supply during this period may delay fruit coloration and sugar accumulation, limiting quality improvement. The marked difference between the two contribution indicators demonstrates that although the greenhouse can match the tomato’s bimodal thermal demand in terms of total heat supply, stage-dependent imbalances persist in heat supply efficiency per unit time, particularly the insufficiency during the harvesting stage, which becomes a key constraint for high yield and quality in autumn–winter production.
A joint analysis of stage GDD and thermal gain rate (Figure 4c) further highlights this pattern. During the seedling stage, indoor stage GDD is approximately 485.05 °C·d, while the thermal gain rate is only 47.38%, the lowest across the entire growth cycle. At this stage, outdoor GDD remains relatively high (329.11 °C·d), resulting in surplus thermal conditions inside the greenhouse, which may trigger temporary overheating and seedling elongation. The relatively low gain rate also reflects limited temperature regulation effectiveness when outdoor heat is still abundant. During the flowering and swelling stages, indoor GDD values are 210.06 °C·d and 137.78 °C·d, respectively, while thermal gain rates rise sharply to 138.8% and 282.02%. The rapid increase in gain rate indicates increasing temperature control pressure as outdoor temperatures decline, where improper regulation may lead to physiological flower and fruit drop. In the fruit maturation–harvesting stage, indoor GDD rebounds to 493.87 °C·d, and the thermal gain rate surges to 2033.17%. At this point, outdoor GDD is extremely limited (23.15 °C·d), and indoor heat accumulation depends almost entirely on active regulation. The system operates near its thermal limit, and failure of insulation or supplemental measures may cause chilling injury, resulting in halted coloration and reduced quality. Meanwhile, such an extremely high gain rate implies exponentially increasing energy consumption, making the balance between thermal supply and energy use a critical challenge in winter production.
The temperature-interval proportion analysis (Figure 4d) showed that the cumulative SFR within the 12.0~27.0 °C range was 62.05%, which was highly consistent with the suitable temperature requirements of tomato across different growth stages. The low-temperature range of 6.0~12.0 °C accounted for 21.28%, mainly corresponding to nighttime and low-temperature periods. This pattern was consistent with the crop’s preference for higher daytime and lower nighttime temperatures. However, the proportion exceeding 20% suggests a potential risk of cumulative chilling stress during extreme weather events or in greenhouses with poor insulation performance. The cumulative proportion of high-temperature conditions above 27.0 °C was 16.66%, among which extreme high temperatures above 33.0 °C accounted for 2.79%.
3.2. Characteristics of Solar Radiation Inside the Greenhouse
This subsection first compares the overall variation trends of solar radiation intensity inside and outside the greenhouse to clarify the radiation environment within the facility. Differences in cumulative solar radiation between indoor and outdoor conditions across the four tomato growth stages are then analyzed. Meanwhile, the transmittance indicator (Equation (5)) is constructed to quantitatively evaluate the greenhouse’s light interception and compensation capacity as well as its threshold effect.
3.2.1. Comparison of Indoor and Outdoor Solar Radiation Intensity
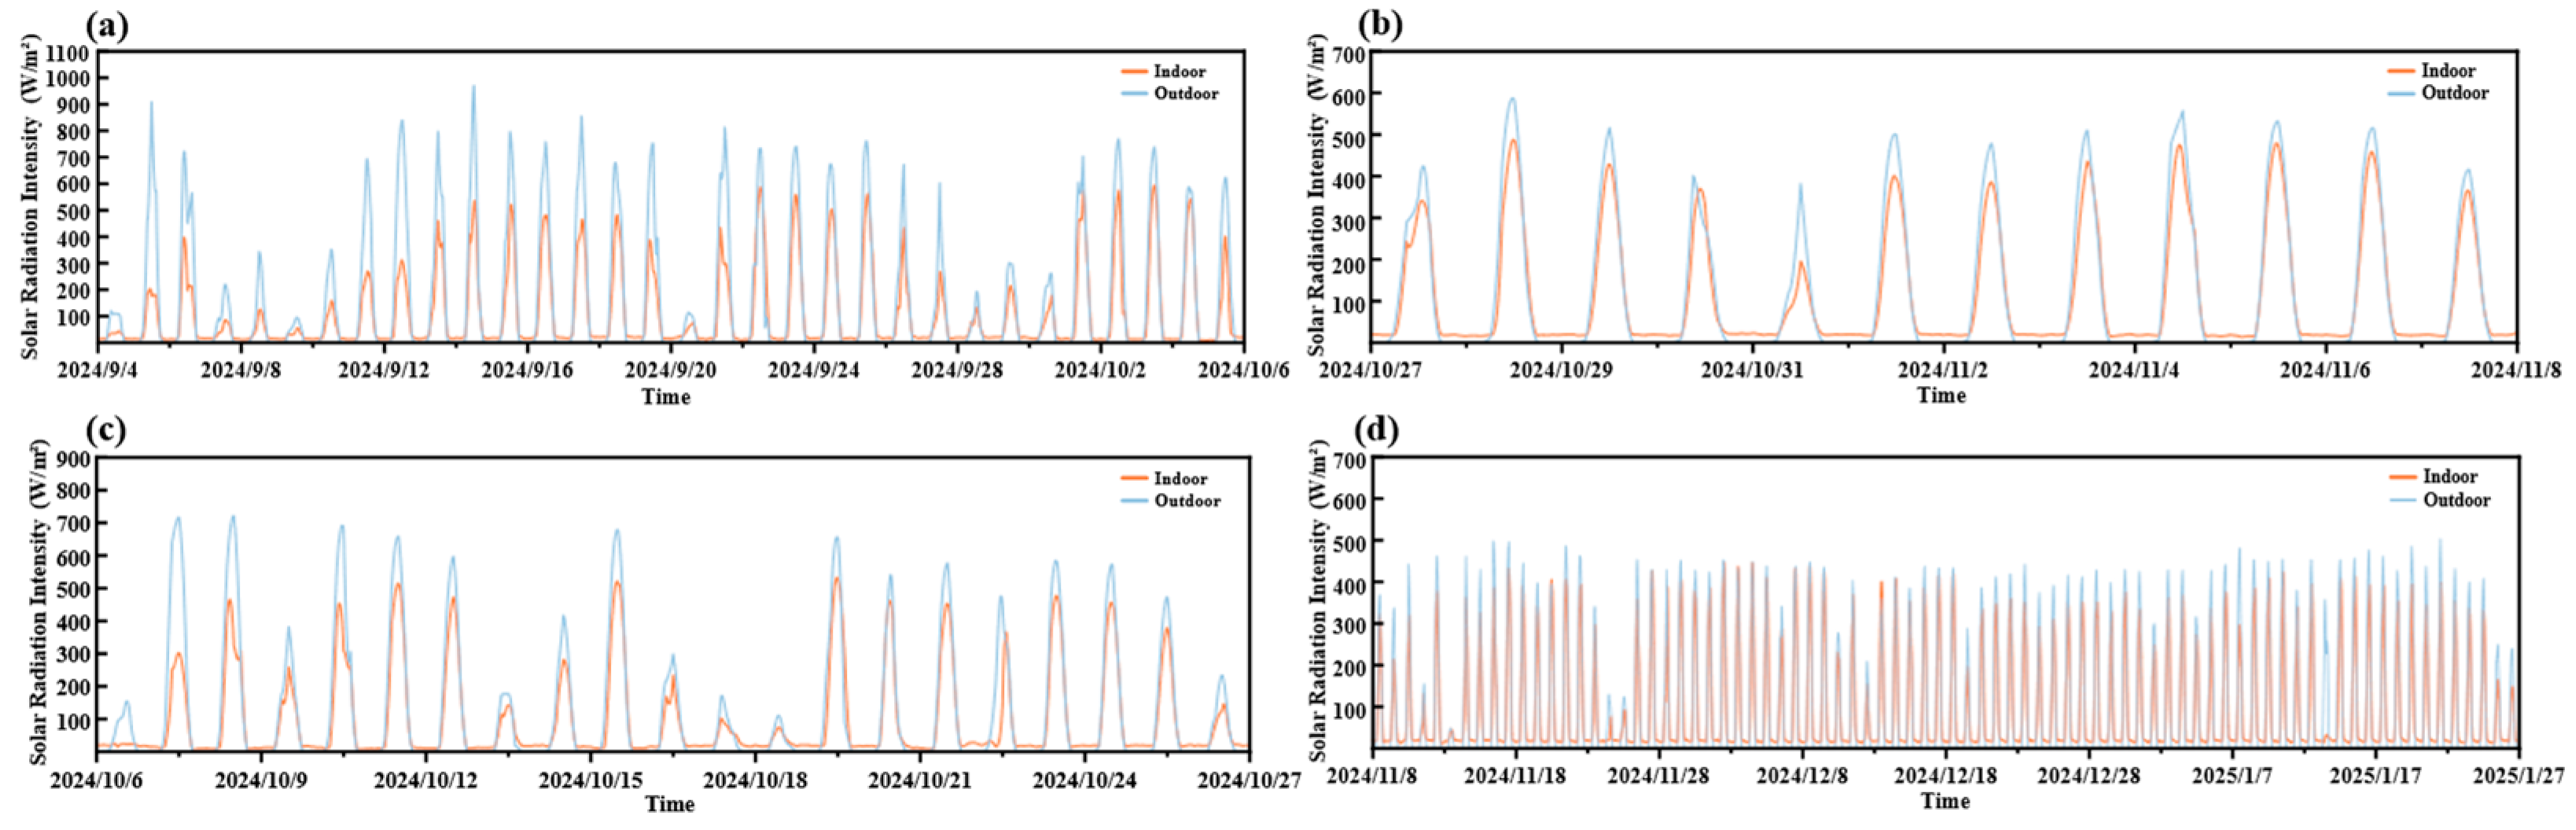
Solar radiation inside and outside the CSG exhibits clear diurnal and seasonal patterns (Figure 5). During the seedling stage (Figure 5a), indoor radiation transmittance is approximately 50~70% of the outdoor level. This decreases to 40~60% during the flowering stage (Figure 5b). After entering the swelling stage (Figure 5c), the fluctuation amplitude of indoor radiation becomes increasingly similar to that outdoors.
Figure 5.
Comparison of indoor and outdoor solar radiation intensity across different growth stages of tomato cultivation in the CSG. (a–d) represent the four growth stages, respectively.
This phenomenon indicates that under weak-light conditions, the greenhouse structure primarily functions as a thermal preservation facility, while its ability to compensate for reduced light availability exhibits a clear threshold. The greenhouse cannot reverse the continuous seasonal decline in natural solar radiation during the autumn–winter period in Northern China.
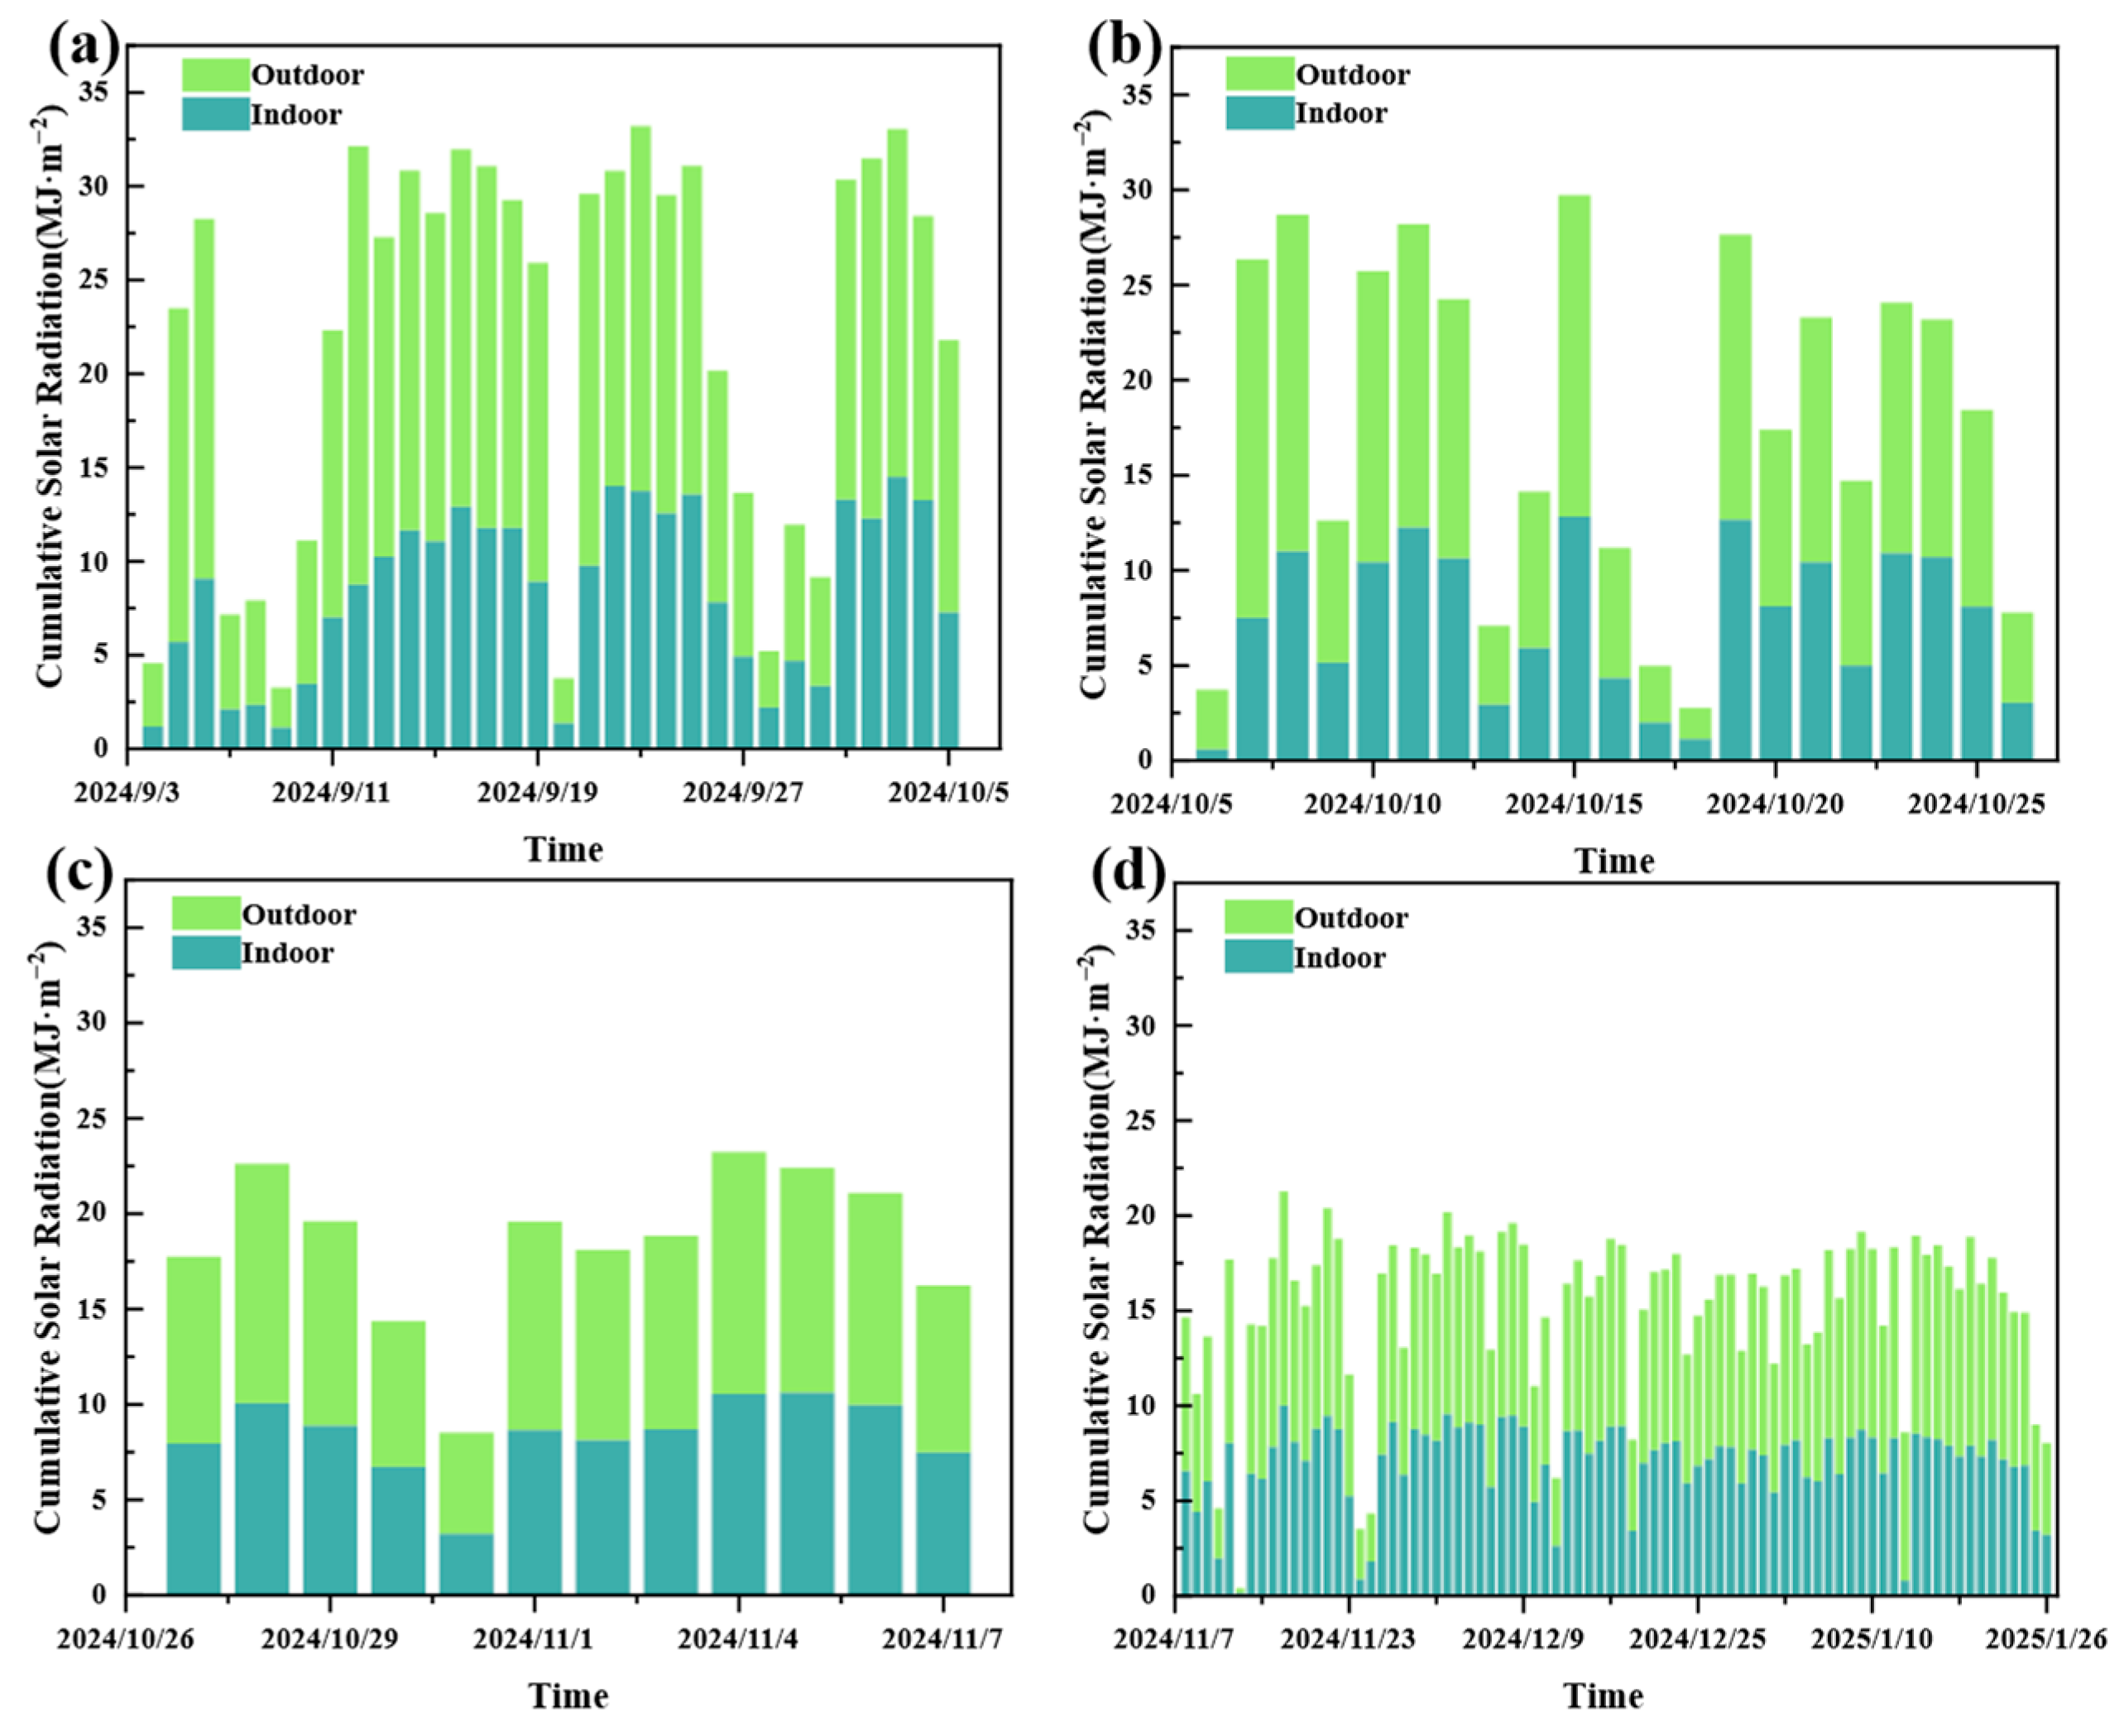
Figure 6 shows significant differences in indoor solar radiation levels across growth stages, exhibiting an overall pattern of sufficient and stable radiation in the early stages, a smooth transition in the middle stages, and pronounced insufficiency with strong fluctuations in the later stages. This pattern reveals both alignment and mismatch between radiation supply and the light requirements of tomato at different phenological stages.
Figure 6.
Dynamic changes in daily cumulative solar radiation inside and outside the CSG across different growth stages of tomato during the autumn–winter season in Northern China. (a–d) correspond to the four growth stages, respectively.
The seedling and flowering stages (Figure 6a,b) are key periods during which tomato is highly sensitive to light supply. Based on previous studies on DLI (Daily Light Integral, mol m−2 day−1) responses, low-light stress, and the effects of daily cumulative radiation on flowering, fruit set, and yield formation in greenhouse tomato, 7~10 MJ·m−2·d−1 (corresponding to a DLI of 15~22 mol·m−2·d−1) was set as the suitable light-evaluation range in this study [7,22,23,24,25]. The results showed that indoor daily accumulated radiation during the seedling stage was generally maintained at 10–18 MJ·m−2, with sunny-day peaks exceeding 15 MJ·m−2, and the mean indoor radiation was 8.12 MJ·m−2·d−1. During the flowering stage, daily accumulated radiation was mainly concentrated within 7–15 MJ·m−2, with an average of 7.08 MJ·m−2·d−1. These values reached or approached the suitable light requirement, providing sufficient and stable light energy for seedling growth, flower bud differentiation, and fruit set.
The fruit swelling stage (Figure 6c) is the core period for dry matter accumulation, with a suitable radiation range of approximately 7–10 MJ·m−2·d−1. The measured indoor daily accumulated radiation was mainly distributed between 5 and 12 MJ·m−2, with an average of 7.77 MJ·m−2·d−1, showing relatively moderate fluctuations and generally remaining within the suitable range. The fruiting stage (Figure 6d) is crucial for yield and quality formation, with a suitable radiation requirement of approximately 7–10 MJ·m−2·d−1. However, measured indoor daily accumulated radiation fluctuated frequently between 2 and 10 MJ·m−2, with the minimum value only about 2 MJ·m−2. The average radiation decreased to 7.05 MJ·m−2·d−1, the lowest level across the whole growth period. Although it barely approached the lower threshold of the light requirement, prolonged low radiation and strong fluctuations were far from sufficient to meet the continuous light demand. Meanwhile, the difference between indoor and outdoor radiation increased markedly, indicating that under winter conditions of low temperature and weak solar radiation, reduced covering-material transmittance, lower solar altitude, and external weather variability jointly constrained indoor radiation supply. This became a key bottleneck limiting late-stage fruit development and quality improvement.
3.2.2. Differentiation of Stage-Wise Cumulative Radiation and Transmittance
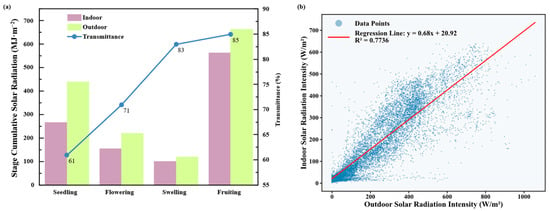
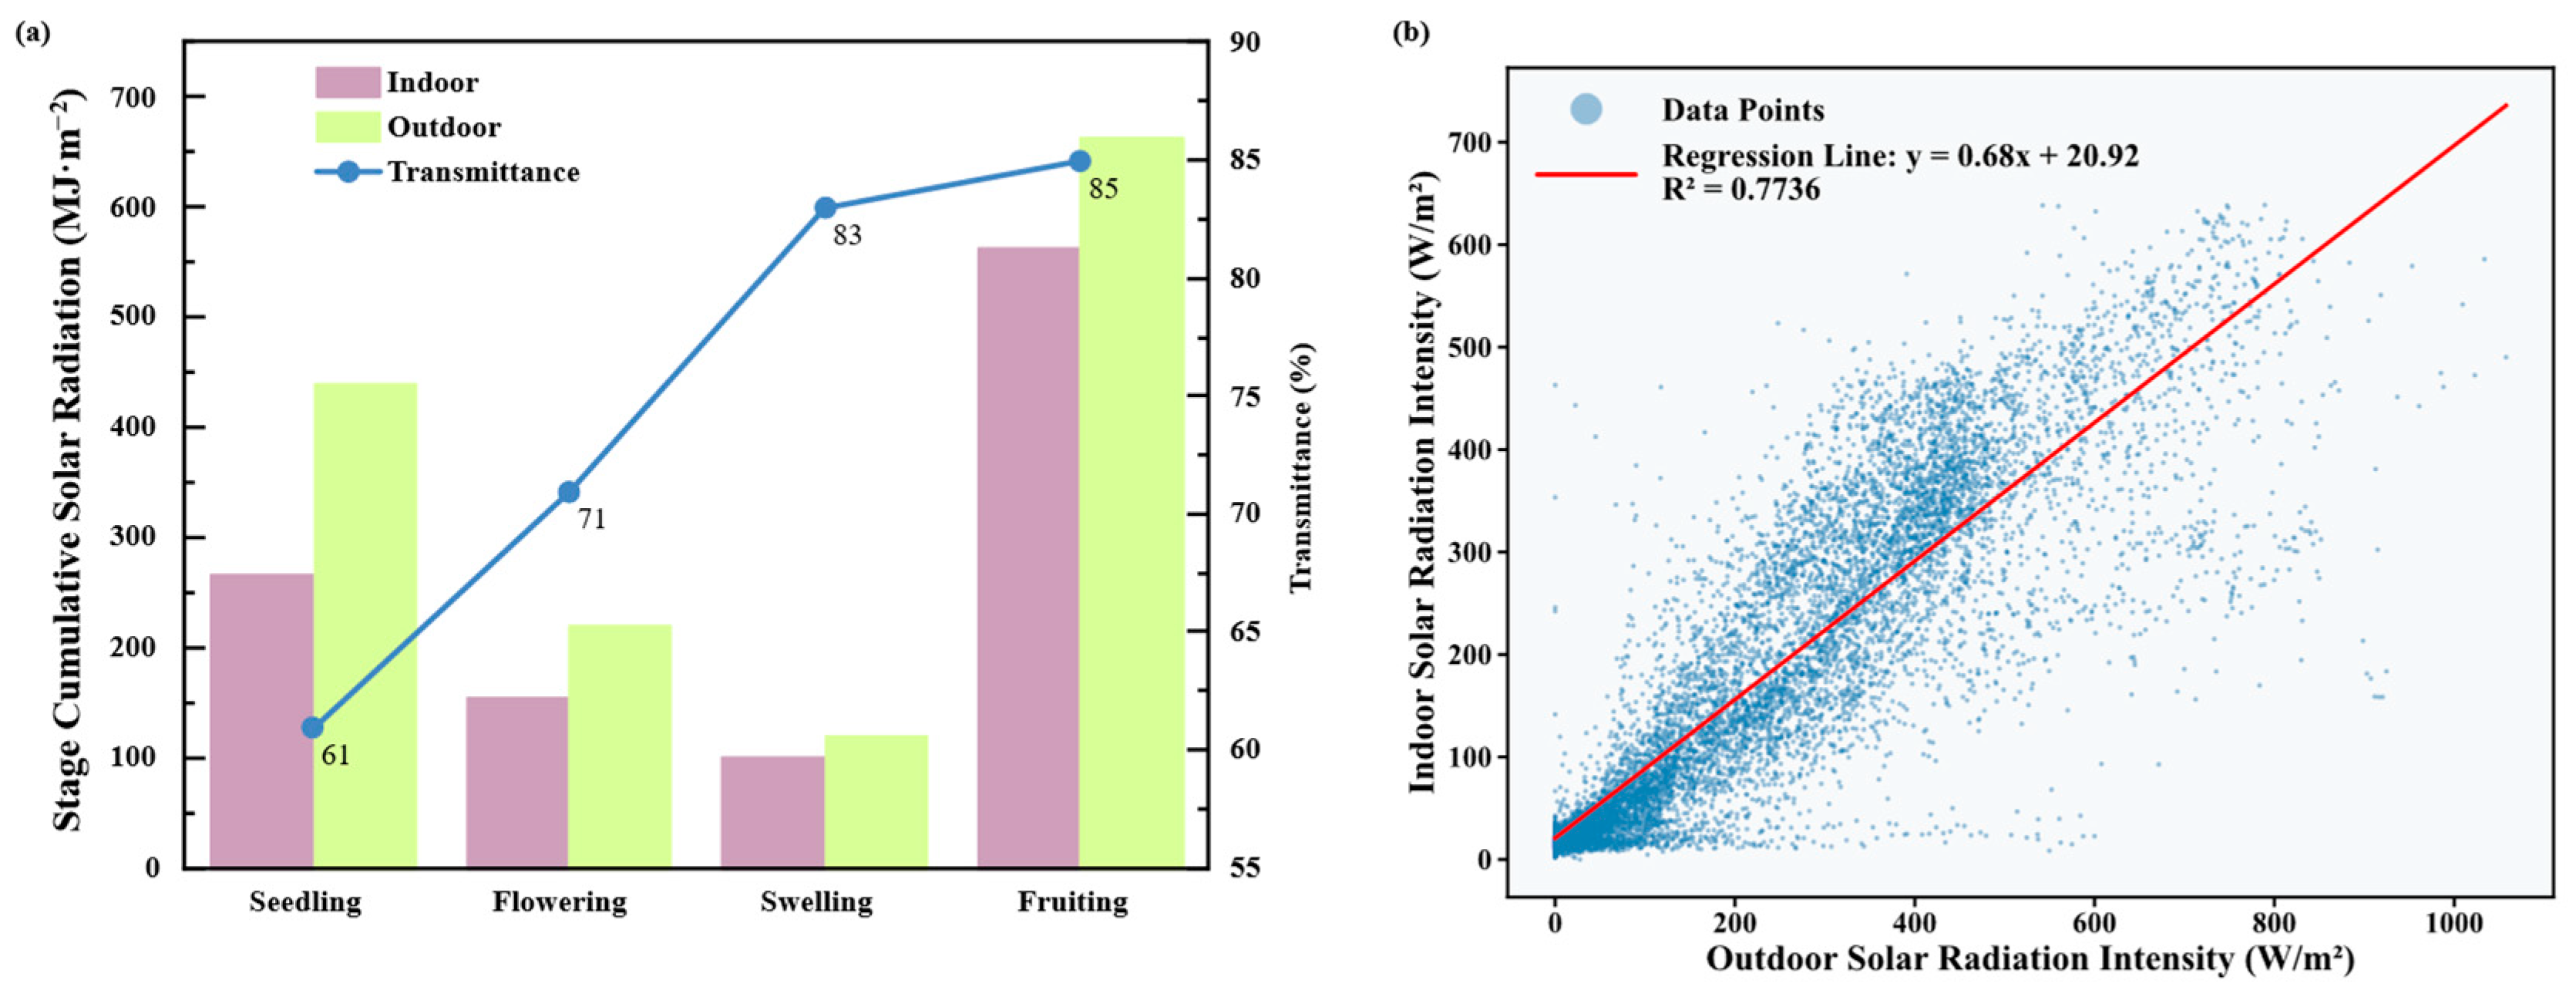
Stage-wise cumulative radiation analysis (Figure 7a) showed that the seedling stage received 267.91 MJ·m−2 of cumulative radiation, with the highest daily mean radiation of 8.19 MJ·m−2·d−1. Although the transmittance was only 61%, the strong outdoor radiation ensured sufficient light supply, matching the high light demand at this stage. During the flowering stage, cumulative radiation decreased to 155.82 MJ·m−2, and daily mean radiation declined to 7.08 MJ·m−2·d−1. Despite an increase in transmittance to 71%, the weakening outdoor radiation led to a 12.8% reduction in radiation compared with the seedling stage, reaching only the lower threshold of the light requirement but generally supporting flower bud differentiation and fruit set.
Figure 7.
Solar radiation characteristics and the correlation between indoor and outdoor radiation in the CSG during the autumn–winter tomato season in Northern China. (a) Cumulative solar radiation and the proportion of indoor solar radiation intensity across different growth stages; (b) correlation analysis between indoor and outdoor solar radiation intensity during the tomato growth period. Blue dots indicate measured data, and the red line indicates the linear regression fit, with the equation y = 0.68x + 20.92 and R2 = 0.77.
During the swelling stage, cumulative radiation was 101.01 MJ·m−2, while daily mean radiation increased to 7.77 MJ·m−2·d−1. The transmittance further increased to 83%, effectively offsetting the decline in outdoor radiation and maintaining radiation supply at a moderate level suitable for rapid fruit enlargement. In the fruiting stage, cumulative radiation was the highest at 563.75 MJ·m−2, but daily mean radiation decreased to the lowest level of the entire season, at 7.05 MJ·m−2·d−1. Although transmittance reached 85%, it was still insufficient to compensate for the low solar altitude, weak radiation, and frequent cloudy conditions in winter; thus, radiation supply only marginally met the lower demand threshold and became a limiting factor for late-stage development and quality improvement. Overall, transmittance increased continuously with crop development, whereas daily mean radiation showed a fluctuating downward trend, indicating that the decline in outdoor radiation had a stronger effect than the improvement in greenhouse transmittance.
The linear regression between indoor and outdoor radiation intensity (Figure 7b, R2 = 0.77, y = 0.68x + 20.92) indicates a strong coupling between the two environments. The greenhouse continuously attenuates incoming solar radiation, and the absolute difference between indoor and outdoor radiation increases as external radiation intensifies. Three core limitations are evident. First, there is an upper limit to transmittance: even under clean plastic film conditions, peak indoor radiation reaches only 50~70% of outdoor levels, and this proportion declines further over the growth cycle due to film aging and dust accumulation. Second, there is no compensatory gain under weak light conditions. When outdoor radiation falls below 200 W·m−2, indoor and outdoor radiation fluctuate almost synchronously, indicating that the greenhouse cannot provide any compensatory light enhancement. Third, seasonal attenuation is irreversible. Natural solar radiation in Northern China decreases continuously from autumn to winter, and greenhouse light interception cannot reverse this trend, resulting in prolonged weak-light stress during the fruit enlargement and harvesting stages.
3.3. Characteristics of the Humidity Environment in the Greenhouse
To clarify the variation characteristics of the greenhouse humidity environment, based on ensuring high data quality (maintaining good integrity with only a small number of outliers removed), comparative plots of indoor and outdoor RH together with hourly boxplots of indoor RH were generated to analyze humidity distribution characteristics across different growth stages and diurnal periods.
3.3.1. Stage-Wise Characteristics of RH
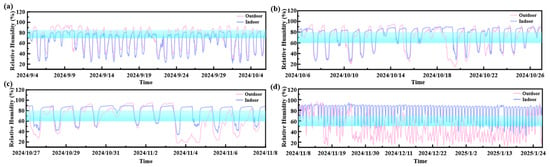
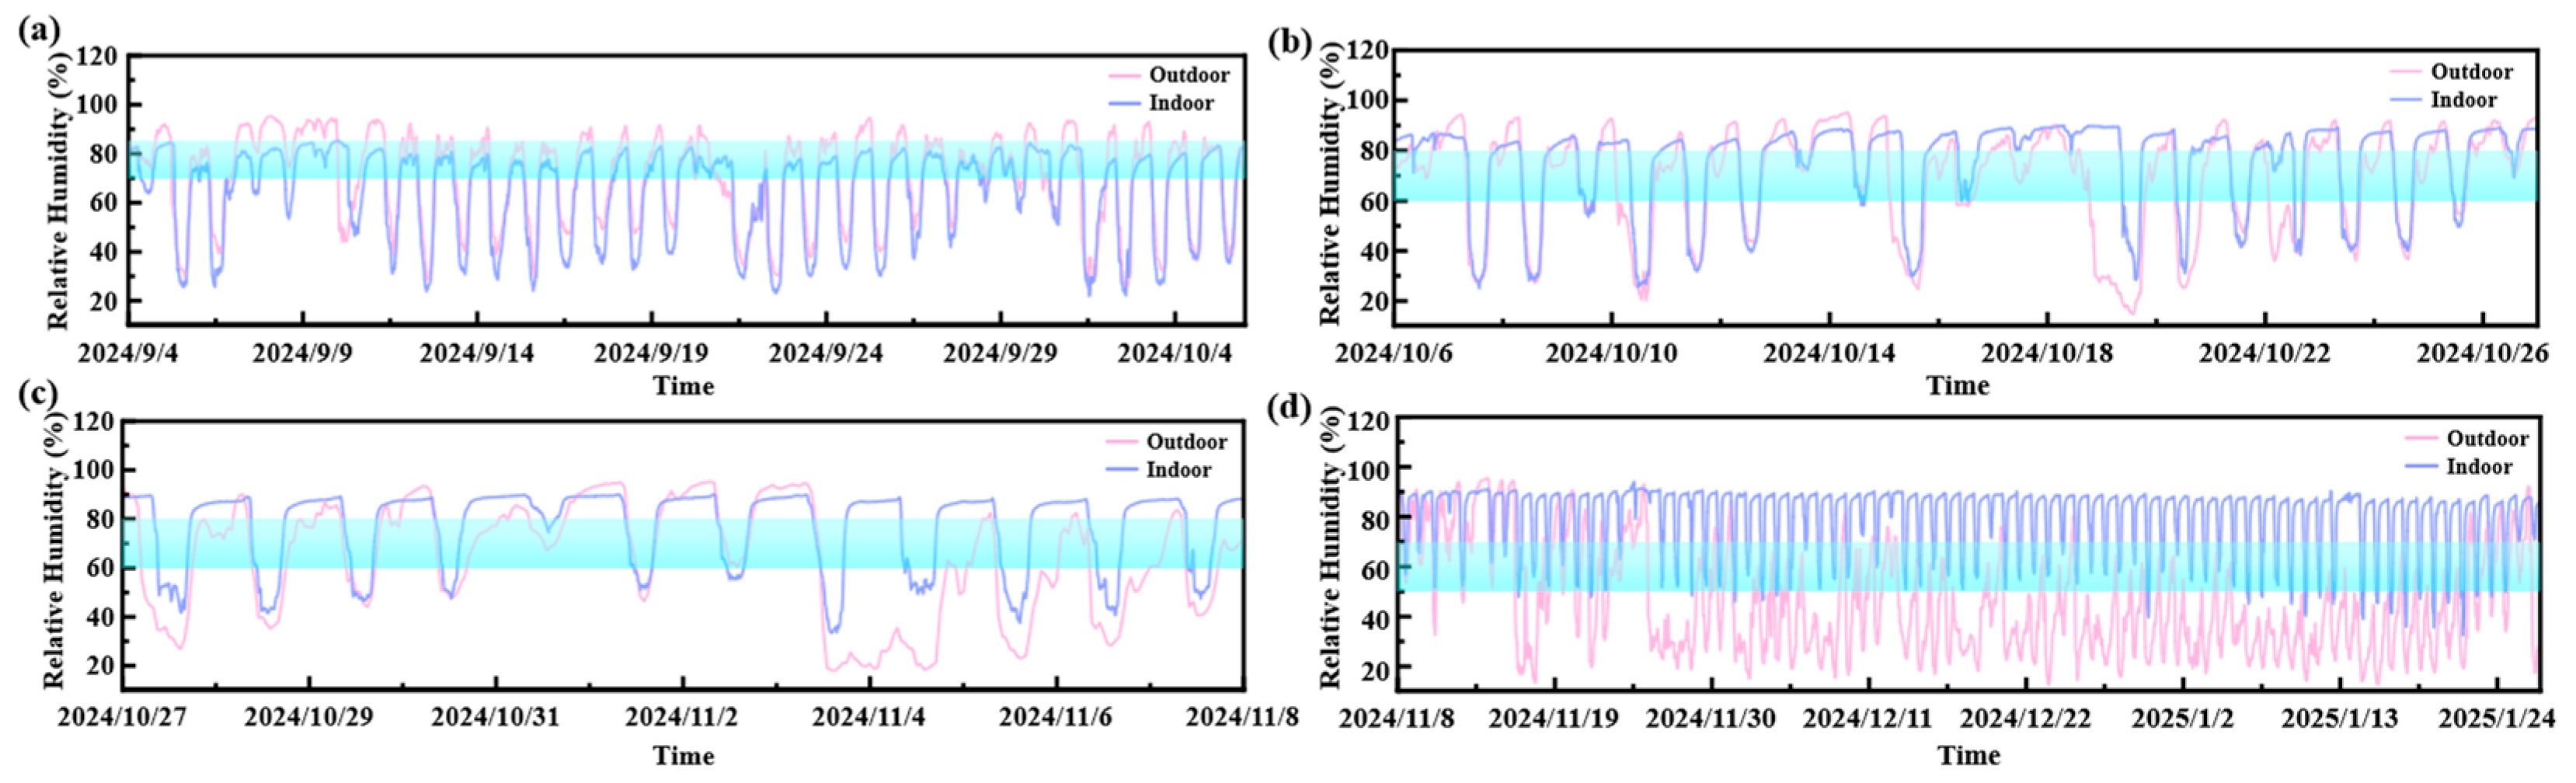
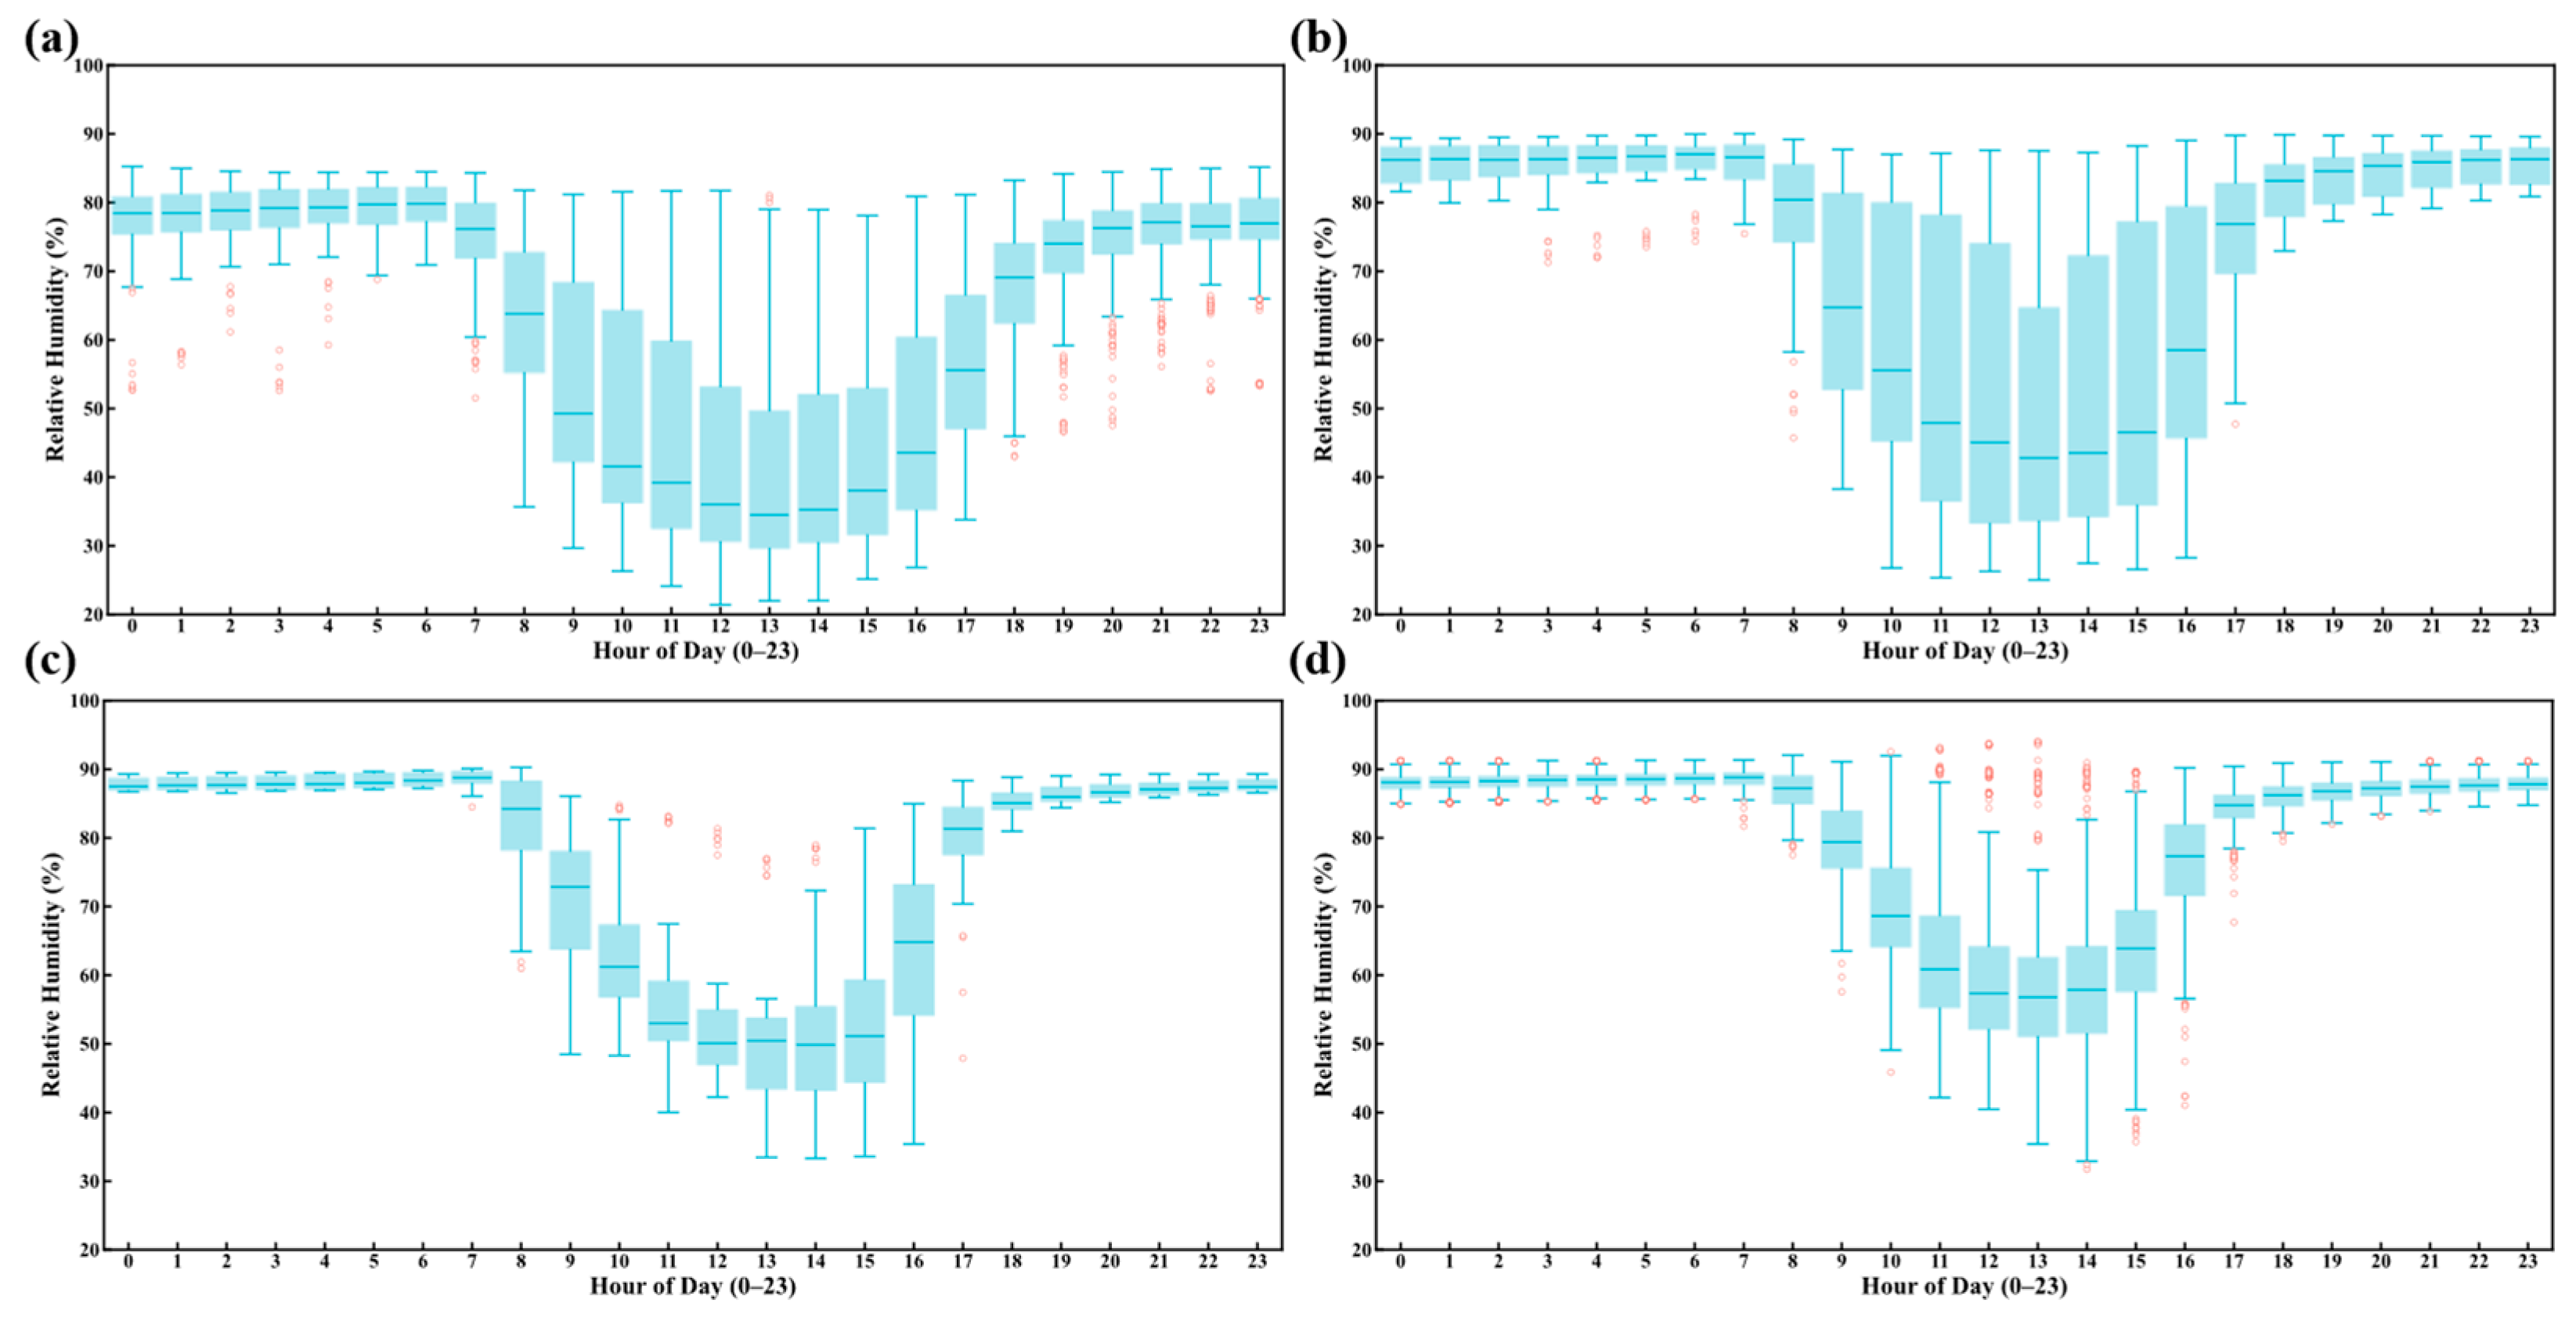
Combined with the dynamic changes in indoor and outdoor RH during the growing season (Figure 8), the hourly distribution of indoor RH (Figure 9), and the calculation of environmental suitability rate (Equation (7)), it can be seen that RH inside the greenhouse exhibited a consistent diurnal pattern across all four developmental stages, characterized by high humidity at night, low humidity at midday, and a gradual recovery toward the evening. However, the type and degree of humidity imbalance differed markedly among stages.
Figure 8.
Dynamic changes in indoor and outdoor RH during the tomato growth period in the CSG in Northern China during the autumn–winter season. (a–d) correspond to the four growth stages, respectively. The light blue shaded areas indicate the optimal RH ranges for tomato growth, which were 70~85%, 60~80%, 50~70%, and 60~80%, respectively [26,27].
Figure 9.
Hourly boxplots of indoor RH during the tomato growth period in the CSG in Northern China during the autumn–winter season. (a–d) correspond to the four growth stages, respectively. The horizontal line within each box indicates the median; the upper and lower edges of each box represent the 75% and 25% quartiles, respectively; the whiskers indicate 1.5 times the interquartile range; and the dots represent outliers.
The humidity environment during the seedling stage was relatively favorable. The SFR in this stage reached 56.56%, which was markedly higher than that in the other stages. The occurrence rate of high humidity was only 0.20%, whereas the proportion of low humidity reached 32.29%, indicating excessive dehumidification during the daytime, particularly in the afternoon (Figure 8a). As shown in Figure 9a, the median RH at midday during the seedling stage decreased to approximately 35%, suggesting that ventilation or warming processes caused RH to fall below the suitable range for seedlings during certain periods.
During the flowering stage, the humidity imbalance became more pronounced, with an SFR of only 16.20% (Figure 8b). In contrast, the proportion of high humidity reached 64.40%, while that of low humidity was 19.41%. In other words, the humidity environment during this stage was mainly characterized by “high humidity at night and low humidity during the daytime”, with less than one-fifth of the time falling within the suitable range. Figure 9b shows that indoor RH frequently remained between 80% and 90% at night, whereas it repeatedly dropped below 60% during the daytime, and even decreased to 30–40% in some periods.
The humidity suitability further declined during the swelling stage, which had the lowest SFR among the four developmental stages. The proportions of high and low humidity were 66.51% and 21.63%, respectively. As shown in Figure 8c and Figure 9c, RH fluctuated most strongly between 10:00 and 16:00 during this stage, with the midday median decreasing to 55~60%, while RH remained above 85% for extended periods at night. This indicates a typical “two-sided deviation” pattern: excessive humidity at night and in the early morning, but insufficient humidity after daytime ventilation.
During the maturation and harvesting stage, the humidity environment was characterized by dominant high humidity and weakened low-humidity stress (Figure 8d and Figure 9d). The SFR in this stage was 17.35%, slightly higher than those during the flowering and swelling stages, but still at a relatively low level. Notably, the proportion of high humidity reached the highest value among all stages, at 72.19%. The time-series curve in Figure 8d indicates that indoor RH remained on a high plateau of 80~90% for longer periods, reflecting that the heat-preservation-oriented regulation strategy in late winter significantly enhanced humidity retention within the greenhouse.
3.3.2. Dynamic Characteristics of VPD and Physiological Adaptation
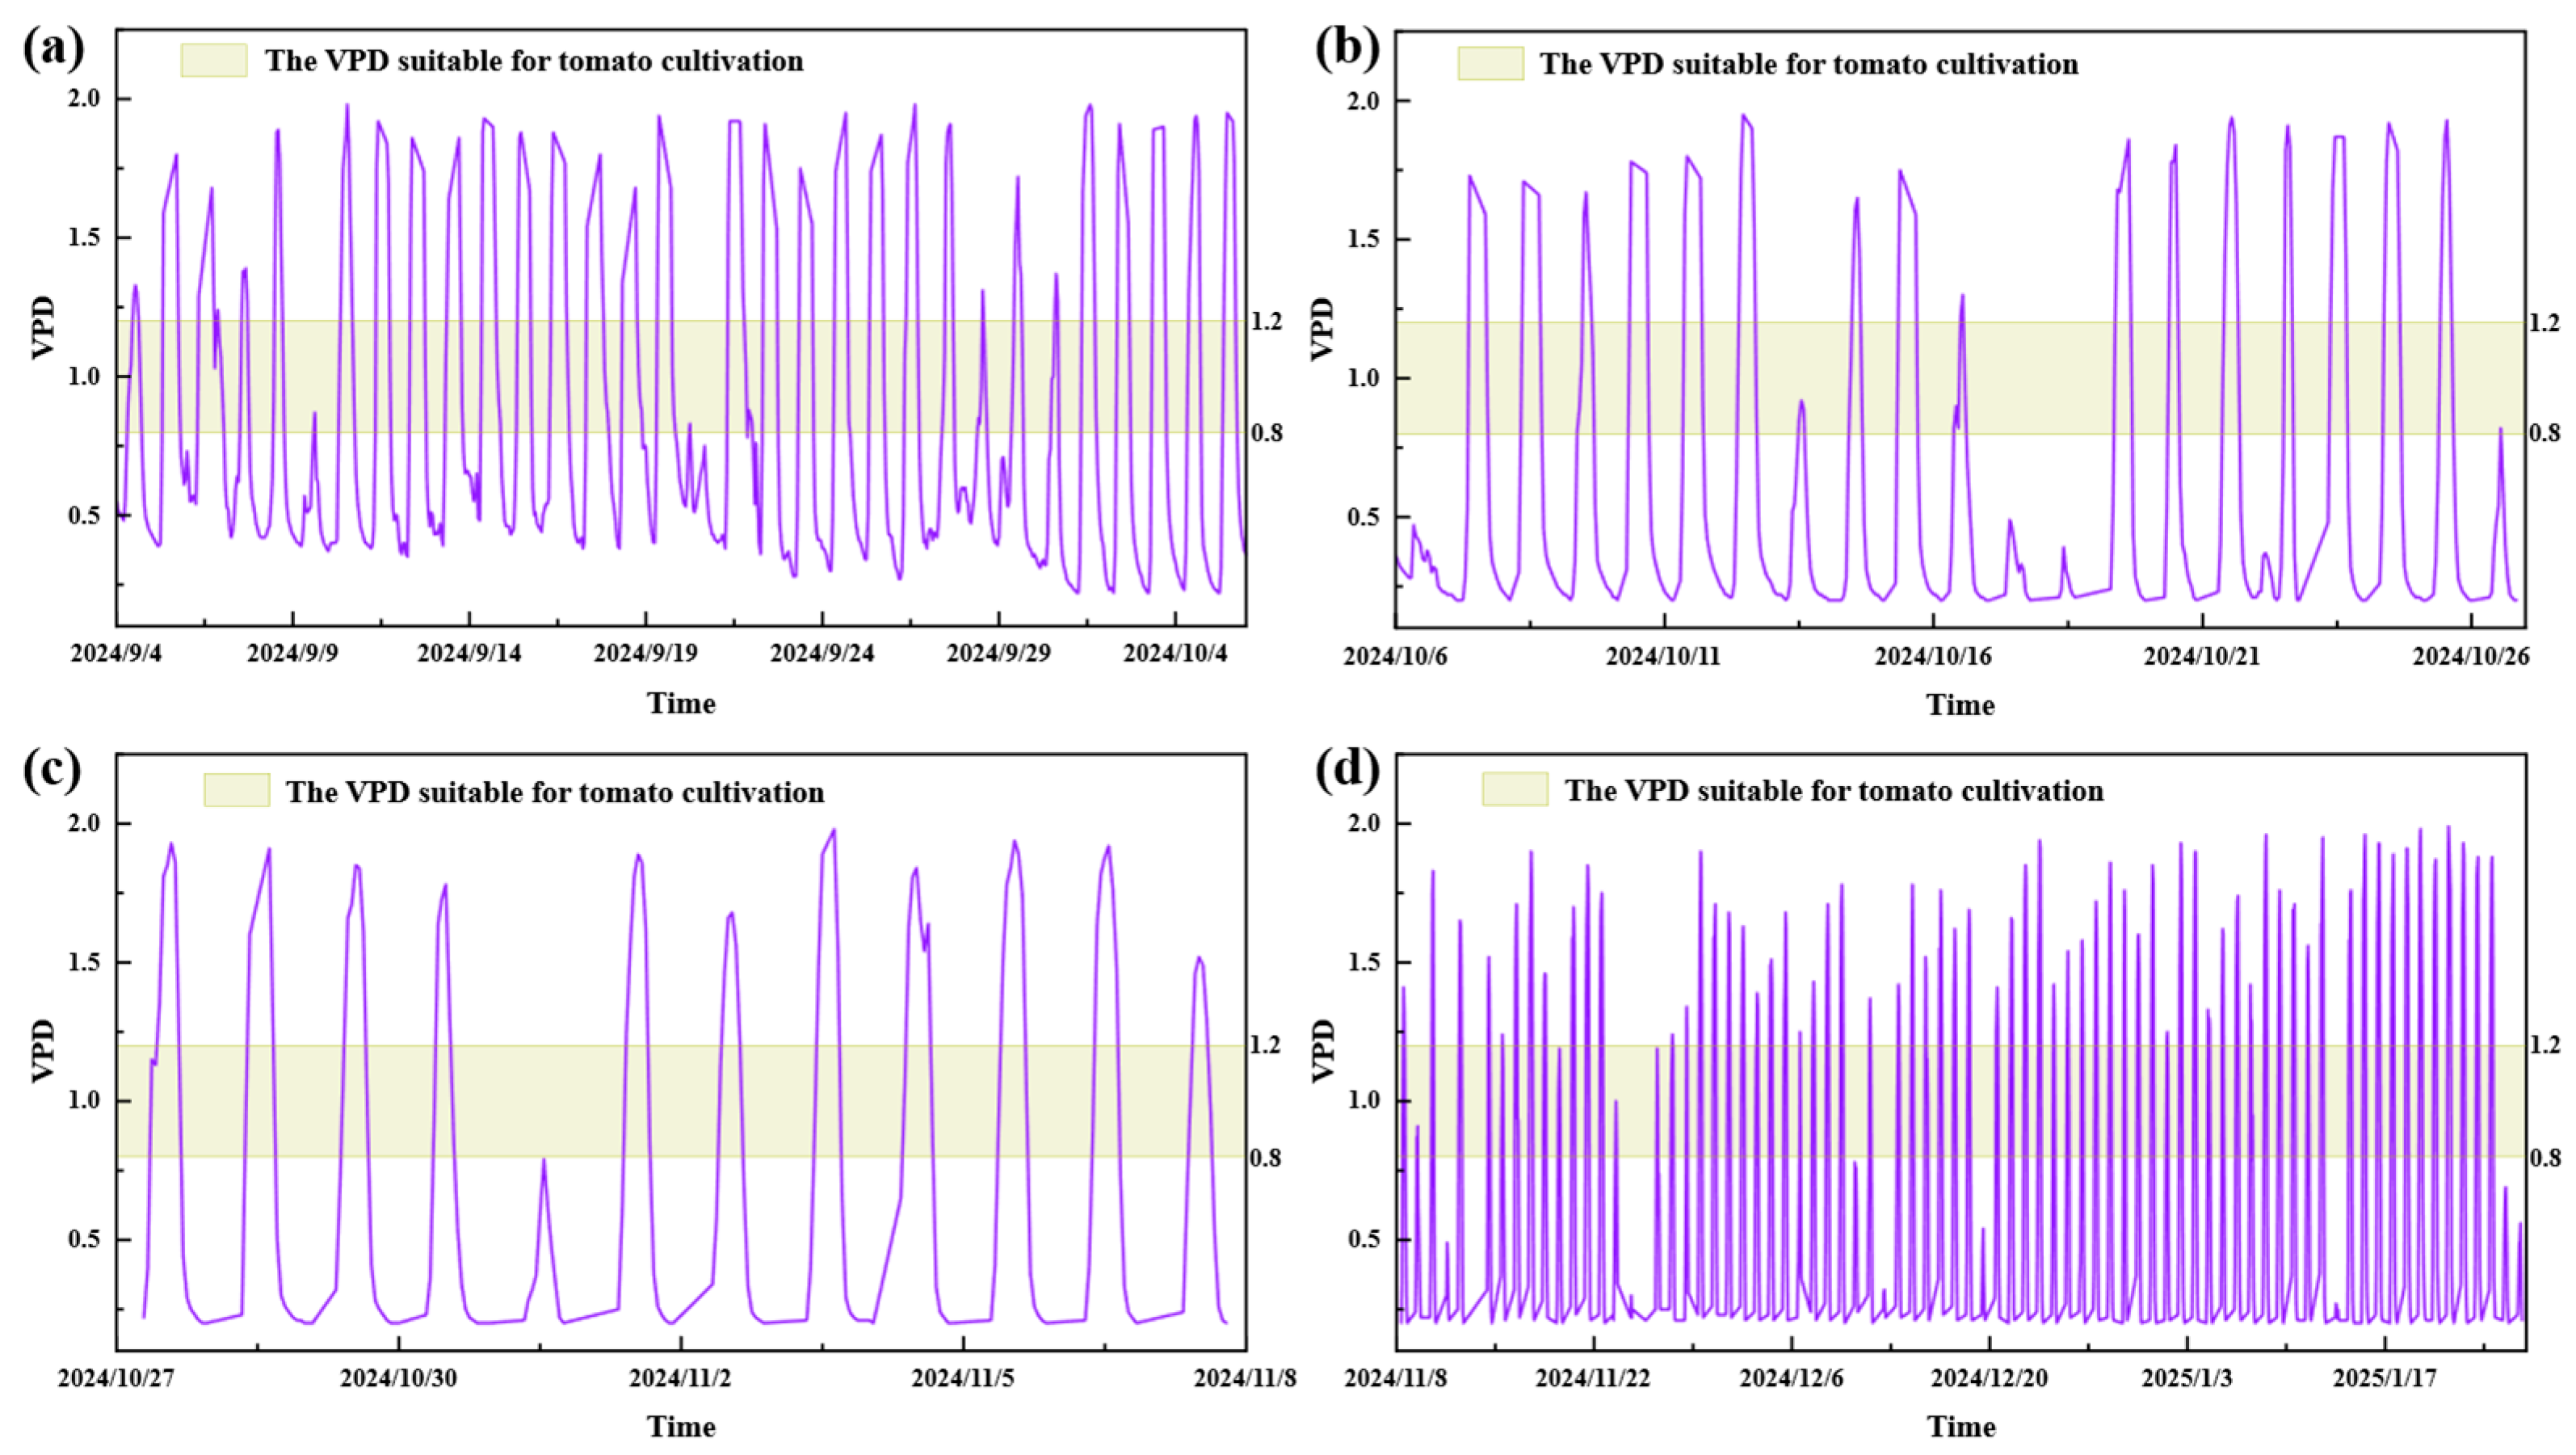
According to the VPD time-series curves and stage-based statistical results (Figure 10), VPD in the CSG during the autumn–winter season exhibited a distinct diurnal pattern across all tomato developmental stages. Specifically, VPD remained low at night and in the early morning, increased rapidly during the daytime, reached its peak around midday, and then declined again after the evening. Across the four stages, VPD frequently passed through the suitable range of 0.8~1.2 kPa [16,28,29]; however, it generally remained within this range only for short periods, indicating that the duration of stable and suitable VPD conditions was relatively limited.
Figure 10.
Dynamic changes in indoor VPD during the tomato growth period in the CSG in Northern China during the autumn–winter season. (a–d) correspond to the four growth stages, respectively.
The SFR of VPD during the seedling stage was 12.44%, representing an intermediate level among the four developmental stages (Figure 10a). The proportion of high VPD (>1.2 kPa) was 18.97%, while low VPD (<0.8 kPa) accounted for 68.59%. As shown in Figure 10a, daytime VPD peaks during the seedling stage repeatedly reached 1.5~2.0 kPa, whereas VPD remained at approximately 0.3~0.6 kPa for extended periods at night and in the early morning. This indicates that, although a certain transpiration driving force could be formed during the daytime, its duration was limited, and the stage as a whole was still dominated by low-VPD conditions.
During the flowering stage, the SFR of VPD decreased to 7.28% (Figure 10b). The proportion of high VPD was 15.90%, which was relatively low among the four stages, whereas the proportion of low VPD increased to 76.82%, the highest value observed. The VPD time-series curve in Figure 10b shows that this stage was characterized by prolonged low-VPD plateaus. Particularly under cloudy or low-radiation conditions, the daytime increase in VPD was limited, and VPD failed to enter the suitable range during some periods.
The swelling stage exhibited the poorest VPD suitability, with an SFR of only 5.09%, the lowest among the four stages, while the proportion of high VPD increased markedly to 30.00% (Figure 10c). As shown in the VPD time-series curve in Figure 10c, daytime VPD peaks rose more sharply and reached higher values during this stage, frequently exceeding 1.8 kPa. The suitable range was only briefly reached during the rising and declining phases of the daily VPD cycle.
During the maturation and harvesting stage, the SFR of VPD increased to 15.10%, the highest among the four stages (Figure 10d). However, the proportion of high VPD also reached 32.30%, likewise the highest value, while the proportion of low VPD decreased to 52.60%. The VPD time-series curve in Figure 10d shows that high-frequency and high-amplitude fluctuations were most evident during this stage, with many daytime peaks concentrated within the range of 1.2~2.0 kPa. This indicates that, under the combined effects of decreasing outdoor temperature and greenhouse ventilation-warming processes, the transpiration driving force was significantly enhanced. Consequently, the greenhouse environment gradually shifted from being predominantly low in VPD during the earlier stages to a condition in which suitable and excessively high VPD coexisted.
4. Discussion
4.1. Stage-Specific Thermal Supply and Physiological Mismatches
The evaluation of greenhouse thermal performance often relies on the total effective accumulated temperature. In this study, the total GDD in the CSG generally matched the overall thermal demand for autumn–winter tomato cultivation. However, relying solely on total accumulation obscures critical temporal imbalances. As established in our methodology, because the duration of tomato growth stages varies significantly, the GCR cannot objectively compare temperature response sensitivity across stages. The introduction of the RGI successfully eliminated the influence of stage duration, revealing a distinct double-peak mismatch in heat supply efficiency that passive CSG structures struggle to mitigate.
Specifically, the RGI peaked excessively during the seedling stage (1.64) due to high outdoor temperatures combined with the CSG’s heat-trapping nature. While a certain heat surplus promotes establishment, extreme or prolonged high temperatures at this stage can trigger gibberellin synthesis, leading to excessive stem elongation (leggy growth) and weakened seedling robustness, as demonstrated by Ohtaka et al. (2020) [9]. Conversely, the markedly low RGI (0.67) and insufficient heat gain during the late-winter fruiting stage represent a critical bottleneck. Tomatoes require stable thermal conditions for optimal fruit enlargement, coloration, and sugar accumulation. Insufficient thermal supply during this period significantly delays maturation and reduces fruit quality [7]. Therefore, temperature control strategies in CSGs must shift from simple overall heat preservation to dynamic, stage-specific regulation that prevents early-stage heat stress while heavily subsidizing late-stage thermal deficits.
4.2. Solar Radiation Constraints and Weak-Light Limitations
Light availability is a primary driver of photosynthesis and yield in controlled environment agriculture. Our findings highlight a structural limitation in CSGs during the autumn–winter transition: although the transmittance of the greenhouse increased as crop development progressed, the actual radiation supply severely declined due to the irreversible seasonal attenuation of natural outdoor light.
The seedling and flowering stages are highly sensitive to light supply for flower bud differentiation and fruit set [25,26]. Our data showed that early-stage indoor radiation successfully met these physiological requirements. However, during the swelling and fruiting stages, radiation levels frequently fell below the optimal thresholds necessary to sustain dry matter accumulation. Because indoor and outdoor radiation were highly correlated (R2 = 0.77), it is evident that the passive CSG structure lacks active radiation compensation capacity. Under weak winter light conditions, transmittance optimization alone (e.g., cleaning films or upgrading covering materials) is insufficient to overcome this limitation [14]. To ensure continuous yield and quality improvement, artificial supplemental lighting must be introduced proactively before the seasonal radiation minimums occur [23].
4.3. Humidity and VPD Imbalances Affecting Transpiration
Humidity and VPD are critical for driving mass transfer, nutrient uptake, and reproductive success in tomatoes [16]. Our analysis revealed that humidity regulation in the CSG exhibited pronounced diurnal and stage-specific imbalances, primarily characterized by insufficient nighttime dehumidification and excessive daytime drying.
During the flowering stage, indoor RH frequently remained between 80% and 90% at night. Such high nighttime humidity is highly unfavorable for reproductive growth, as it can inhibit pollen viability, impair pollen dispersal, and increase the risk of fungal diseases [10,26]. Furthermore, the swelling stage exhibited the poorest VPD suitability (SFR of only 5.09%), with frequent transitions between low-VPD plateaus and sharp daytime spikes (>1.8 kPa). These high-frequency, high-amplitude fluctuations disrupt the transpiration driving force. As Yu et al. (2024) [16] noted, extreme VPD variations can restrict calcium uptake, inducing physiological disorders such as blossom-end rot and causing uneven fruit enlargement. The current CSG regulation paradigm is heavily constrained by the antagonism between heat preservation and ventilation, leading to poor temporal matching between environmental supply and the crop’s water demand.
4.4. Pathways to Intelligent Regulation
In summary, while CSGs possess a strong capacity to buffer extreme outdoor climatic conditions, their reliance on passive, experience-based management results in uncoordinated multi-factor regulation. To optimize autumn–winter tomato production, greenhouse management must shift from simply determining if an environment is “suitable” to evaluating the dynamic efficiency and energy cost of maintaining that suitability [15].
The stage-specific indicators developed in this study—such as RGI, Gain, and SFR—provide a quantifiable foundation for this transition. Recent advancements have demonstrated that intelligent, AI-based control strategies can dynamically adjust ventilation, heating, and lighting based on historical climate trajectories, real-time sensor feedback, and specific crop physiological needs [30,31]. By integrating the quantitative framework proposed in this study into algorithm-based control systems, future CSG operations can achieve lower energy consumption, higher resource-use efficiency, and precise environmental management tailored to the crop’s developmental stages.
5. Conclusions
Through continuous monitoring and analysis of environmental factors throughout the entire autumn–winter tomato growth season, the performance of a CSG was analyzed. Results demonstrate that the CSG effectively buffers extreme climatic fluctuations and provides a relatively stable microenvironment for tomato growth. In terms of total thermal accumulation, effective accumulated temperature exhibited a bimodal matching pattern with tomato physiological requirements. However, the RGI revealed a stage-specific imbalance in heat supply efficiency per unit time, with excessive values during the seedling stage and insufficient values during the maturation and harvesting stage, indicating that the temperature control strategy still requires optimization. The marked increase in stage thermal gain rate further reflected the high dependence on artificial heating during deep winter, making energy consumption an important constraint on efficient production.
Indoor solar radiation showed a distinct seasonal attenuation trend and was mainly driven by outdoor conditions. Insufficient light-energy supply in winter became a key limiting factor affecting yield and quality formation, indicating the necessity of supplemental lighting in autumn–winter production. Humidity regulation exhibited pronounced diurnal imbalance and stage-specific differences, characterized by the coexistence of insufficient nighttime dehumidification and excessive daytime dehumidification. As a result, the moisture environment was poorly matched with the stage-specific physiological requirements of tomato, the stability of the transpiration driving force was insufficient, and the level of multi-factor coordinated regulation still needs to be improved.
Overall, the environmental regulation system for autumn–winter tomato production in Chinese solar greenhouses in Northern China has developed strong climate-buffering and stage-adaptive capacities. However, several challenges remain, including imbalanced regulation efficiency per unit time, structural insufficiency of light energy, and high energy consumption. Future work should focus on constructing an intelligent closed-loop control system that couples temperature, light, and humidity based on stage-specific thermal efficiency and light-structure characteristics. Such a system would enable low-energy, high-efficiency, and precise environmental management, thereby promoting the transformation of CSG production from experience-based management toward data-driven and intelligent decision-making.
Author Contributions
X.Z.: Formal analysis, Experiment, Data Curation, Visualization, Writing—Original Draft, Software. Y.Z.: Conceptualization, Investigation, Funding acquisition, Writing—Review and Editing. Y.C.: Project administration, Resources, Writing—Review and Editing, Supervision. X.W.: Supervision. L.Z.: Validation. All authors have read and agreed to the published version of the manuscript.
Funding
This work was supported by the National Natural Science Foundation (32372016), the Key Research and Development Project of Ningxia Hui Autonomous Region (2024BBF01011), the Shandong Province Key R&D Program Project (2025CXGC010806), and the Agricultural Science and Technology Innovation Program (CAAS-IEDA-T07).
Data Availability Statement
The raw data supporting the conclusions of this article will be made available by the authors upon request.
Acknowledgments
The authors would like to thank all contributors involved in improving the manuscript.
Conflicts of Interest
The authors declare no conflicts of interest.
Nomenclature
| Symbols | Description |
| D | Total days of different tomato growth stage |
| Gain | Thermal gain rate (%) |
| N | Number of days in a tomato growth stage (d) |
| R | Solar radiation intensity (W·m−2) |
| R2 | Coefficient of determination |
| T | Air temperature (°C) |
| Subscripts | |
| b | Base |
| in | In the greenhouse |
| i | Index of tomato growth stage |
| j | Index of day within a growth stage |
| mean | Average |
| out | Outside of the greenhouse |
| suit | Suitable |
| total | Total |
| u | Upper threshold temperature for GDD calculation |
| Greek symbols | |
| σ | Standard deviation |
| τ | Transmittance (%) |
| Abbreviations | |
| CSG | Chinese solar greenhouse |
| F | Flowering and fruit-setting stage of tomato |
| FR | Fruit maturation and harvesting stage of tomato |
| GDD | Growing degree days (°C·d) |
| GCR | Growing degree days contribution rate (%) |
| IQR | Interquartile range |
| RH | Relative humidity (%) |
| RGI | Relative growing degree index |
| S | Seedling establishment stage of tomato |
| SW | Swelling stage of tomato |
| SFR | Suitable fraction rate of an environmental factor (%) |
| VPD | Vapor pressure deficit (kPa) |
References
- Kozai, T.; Niu, G.; Takagaki, M. Plant Factory: An Indoor Vertical Farming System for Efficient Quality Food Production; Academic Press: Cambridge, MA, USA, 2019. [Google Scholar]
- Despommier, D. The Vertical Farm: Feeding the World in the 21st Century; Macmillan: New York, NY, USA, 2010. [Google Scholar]
- Benke, K.; Tomkins, B. Future food-production systems: Vertical farming and controlled-environment agriculture. Sustain. Sci. Pract. Policy 2017, 13, 13–26. [Google Scholar] [CrossRef] [Scilit]
- Wang, T.; Wu, G.; Chen, J.; Cui, P.; Chen, Z.; Yan, Y.; Zhang, Y.; Li, M.; Niu, D.; Li, B.; et al. Integration of solar technology to modern greenhouse in China: Current status, challenges and prospect. Renew. Sustain. Energy Rev. 2017, 70, 1178–1188. [Google Scholar] [CrossRef] [Scilit]
- He, M.; Wan, X.; Liu, H.; Xia, T.; Gong, Z.; Li, Y.; Liu, X.; Li, T. Theory and application of sustainable energy-efficient solar greenhouse in China. Energy Convers. Manag. 2025, 325, 119394. [Google Scholar] [CrossRef] [Scilit]
- Xing, T.; Li, M.; Zhang, Y.; Wang, Y.; Zhou, X.; Zhu, Y.; Li, J. Research on plant photosynthetic characteristics and regulation mechanisms in photovoltaic greenhouses under fluctuating solar radiation. Energy 2026, 344, 140150. [Google Scholar] [CrossRef] [Scilit]
- Shamshiri, R.R.; Jones, J.W.; Thorp, K.R.; Ahmad, D.; Man, H.C.; Taheri, S. Review of optimum temperature, humidity, and vapor pressure deficit for microclimate evaluation and control in greenhouse cultivation of tomato: A review. Int. Agrophysics 2018, 32, 287–302. [Google Scholar] [CrossRef] [Scilit]
- Xiao, R.; Wang, Y.; Liu, Y.; Yin, Y.; Liu, T.; Zhang, N. Prediction of Tomato Yield in Chinese-Style Solar Greenhouses Based on Wavelet Neural Networks and Genetic Algorithms. In Proceedings of the 2021 33rd Chinese Control and Decision Conference (CCDC), Kunming, China, 22–24 May 2021; pp. 42–47. [Google Scholar] [CrossRef] [Scilit]
- Ohtaka, K.; Yoshida, A.; Kakei, Y.; Fukui, K.; Kojima, M.; Takebayashi, Y.; Yano, K.; Imanishi, S.; Sakakibara, H. Difference Between Day and Night Temperatures Affects Stem Elongation in Tomato (Solanum lycopersicum) Seedlings via Regulation of Gibberellin and Auxin Synthesis. Front. Plant Sci. 2020, 11, 577235. [Google Scholar] [CrossRef] [Scilit]
- Picken, A.J.F. A review of pollination and fruit set in the tomato (Lycopersicon esculentum Mill.). J. Hortic. Sci. 1984, 59, 1–13. [Google Scholar] [CrossRef] [Scilit]
- Zhang, D.; Zhang, Z.; Li, J.; Chang, Y.; Du, Q.; Pan, T.; Liang, Y. Regulation of vapor pressure deficit by greenhouse micro-fog systems improved growth and productivity of tomato via enhancing photosynthesis during summer season. PLoS ONE 2015, 10, e0133919. [Google Scholar] [CrossRef] [Scilit]
- He, M.; Sun, D.; Wen, P.; Sun, Y.; Li, T.; Li, Y.; Liu, X. Environmental control for Chinese solar greenhouses: A review. Renew. Sustain. Energy Rev. 2025, 218, 115796. [Google Scholar] [CrossRef] [Scilit]
- Boote, K.J.; Jones, J.W.; White, J.W.; Asseng, S.; Lizaso, J.I. Putting mechanisms into crop production models. Plant Cell Environ. 2013, 36, 1658–1672. [Google Scholar] [CrossRef] [Scilit]
- He, X.; Pattison, P.M.; Cheng, Y. Light-altering cover materials and sustainable greenhouse production of vegetables: A review. J. Plant Growth Regul. 2021, 41, 1125–1139. [Google Scholar] [CrossRef] [Scilit]
- Šalagovič, J.; Vanhees, D.; Verboven, P.; Holsteens, K.; Verlinden, B.; Huysmans, M.; Van de Poel, B.; Nicolaï, B. Microclimate monitoring in commercial tomato (Solanum lycopersicum L.) greenhouse production reveals spatiotemporal variability in temperature and vapor pressure deficit. Front. Hortic. 2024, 3, 1425285. [Google Scholar] [CrossRef] [Scilit]
- Yu, X.; Niu, L.; Zhang, Y.; Xu, Z.; Zhang, J.; Zhang, S.; Li, J. Vapor pressure deficit affects crop water productivity, yield, and quality in tomatoes. Agric. Water Manag. 2024, 299, 108879. [Google Scholar] [CrossRef] [Scilit]
- Wu, S.; Li, R.; Bu, C.; Zhu, C.; Miao, C.; Zhang, Y.; Cui, J.; Jiang, Y.; Ding, X. Photoperiodic effect on growth, photosynthesis, mineral elements, and metabolome of tomato seedlings in a plant factory. Plants 2024, 13, 3119. [Google Scholar] [CrossRef] [Scilit]
- Moon, T.; Lee, J.W.; Son, J.E. Accurate Imputation of Greenhouse Environment Data for Data Integrity Utilizing Two-Dimensional Convolutional Neural Networks. Sensors 2021, 21, 2187. [Google Scholar] [CrossRef] [Scilit]
- Ulyanov, D.S.; Ulyanova, A.A.; Litvinov, D.Y.; Kocheshkova, A.A.; Kroupina, A.Y.; Syedina, N.M.; Voronezhskaya, V.S.; Vasilyev, A.V.; Karlov, G.I.; Divashuk, M.G. StatFaRmer: Cultivating insights with an advanced R shiny dashboard for digital phenotyping data analysis. Front. Plant Sci. 2025, 16, 1475057. [Google Scholar] [CrossRef] [Scilit]
- Jeon, Y.J.; Park, S.J.; Lee, H.; Cui, J.-S.; Jung, D.-H. Emulating expert environmental control strategies in strawberry greenhouses using attention-LSTM. Inf. Process. Agric. 2025. [Google Scholar] [CrossRef] [Scilit]
- Singh, S.; Singh, P.; Singh, G.; Sandhu, A.S. Crop productivity and energy indices of tomato (Solanum lycopersicum) production under naturally-ventilated poly-house structures in Northern-western India. Energy 2025, 314, 134239. [Google Scholar] [CrossRef] [Scilit]
- Xu, D.; Fei, S.; Wang, Z.; Zhu, J.; Ma, Y. Optimum design of Chinese solar greenhouses for maximum energy availability. Energy 2024, 304, 131980. [Google Scholar] [CrossRef] [Scilit]
- Zhang, M.; Cui, J.; Ju, J.; Hu, Y.; Liu, X.; He, R.; Song, J.; Huang, Y.; Liu, H. The impact of daily light integral from artificial lighting on tomato seedling cultivation in plant factory. Agronomy 2025, 15, 70. [Google Scholar] [CrossRef] [Scilit]
- Tan, R.; Jia, T.; Chen, X.L.; Guo, W.Z. Low light during reproductive period of tomato affects the phenotypic characteristics and quality of fruit. Chin. J. Agrometeorol. 2022, 43, 902–911. [Google Scholar] [CrossRef]
- Higashide, T. Prediction of tomato yield on the basis of solar radiation before anthesis under warm greenhouse conditions. HortScience 2009, 44, 1874–1878. [Google Scholar] [CrossRef] [Scilit]
- Harel, D.; Fadida, H.; Slepoy, A.; Gantz, S.; Shilo, K. The effect of mean daily temperature and relative humidity on pollen, fruit set and yield of tomato grown in commercial protected cultivation. Agronomy 2014, 4, 167–177. [Google Scholar] [CrossRef] [Scilit]
- Zheng, Y.; Yang, Z.; Liu, X.; Zhang, X.; Wang, X.; Li, J. The interactive effects of daytime high temperature and humidity on growth and endogenous hormone concentration of tomato seedlings. HortScience 2020, 55, 1575–1583. [Google Scholar] [CrossRef] [Scilit]
- Yu, X.; Zhao, M.; Wang, X.; Jiao, X.; Song, X.; Li, J. Reducing vapor pressure deficit improves calcium absorption by optimizing plant structure, stomatal morphology, and aquaporins in tomatoes. Environ. Exp. Bot. 2022, 195, 104786. [Google Scholar] [CrossRef] [Scilit]
- Ashraf, H.; Sultan, M.; Shamshiri, R.R.; Abbas, F.; Farooq, M.; Sajjad, U.; Md-Tahir, H.; Mahmood, M.H.; Ahmad, F.; Taseer, Y.R.; et al. Dynamic evaluation of desiccant dehumidification evaporative cooling options for greenhouse air-conditioning application in Multan (Pakistan). Energies 2021, 14, 1097. [Google Scholar] [CrossRef] [Scilit]
- Ajagekar, A.; Mattson, N.S.; You, F. Energy-efficient AI-based control of semi-closed greenhouses leveraging robust optimization in deep reinforcement learning. Adv. Appl. Energy 2023, 9, 100119. [Google Scholar] [CrossRef] [Scilit]
- Maree, S.C.; Zhang, P.; van Marrewijk, B.M.; de Zwart, F.; Bijlaard, M.; Hemming, S. Autonomous greenhouse cultivation of dwarf tomato: Performance evaluation of intelligent algorithms for multiple-sensor feedback. Sensors 2025, 25, 4321. [Google Scholar] [CrossRef] [Scilit]

Disclaimer/Publisher’s Note: The statements, opinions and data contained in all publications are solely those of the individual author(s) and contributor(s) and not of MDPI and/or the editor(s). MDPI and/or the editor(s) disclaim responsibility for any injury to people or property resulting from any ideas, methods, instructions or products referred to in the content. |
© 2026 by the authors. Licensee MDPI, Basel, Switzerland. This article is an open access article distributed under the terms and conditions of the Creative Commons Attribution (CC BY) license.