


Abstract
In the era of digital economy, manufacturing industry transcends geographical space to build virtual networks. Revealing the complex network characteristics and driver paths of virtual agglomeration is of great significance for accelerating the digitalization of manufacturing. First, this paper explains the formation mechanism and proposes the model of virtual agglomeration; moreover, the paper identifies complex network characteristics. Finally, this paper constructs a driving path framework based on the “Technology–Organization–Environment” theory, and uses fuzzy set qualitative comparative analysis to identify paths. The results show that the technological platform foundation plays a core role in enhancing the level of virtual agglomeration. Differentiated combinations of organizational and environmental conditions also have a positive impact. This study provides theoretical support and practical reference for cities to accelerate virtual agglomeration according to local conditions.
1. Introduction
Virtual agglomeration refers to a new form in which enterprises share resources and collaborate through Internet platforms [1]. In the era of digital economy, the penetration of new-generation information technologies into the real economy accelerates the evolution of the manufacturing industry from geographic agglomeration to virtual agglomeration [2]. The supply chain structure and collaboration mechanisms of enterprises change. The virtual agglomeration characteristics of enterprises collaborating through industrial Internet platforms remain consistently significant [3]. Virtual agglomeration amplifies the positive externalities of geographic agglomeration, enabling real-time and low-cost information exchange among enterprises. At the same time, manufacturing resources are integrated and shared across cities and industries, reducing information asymmetry. Virtual agglomeration not only accelerates micro-level enterprise cooperation but also promotes urban coordinated development. The virtual cooperation of enterprises speeds up the construction of cross-regional agglomeration networks in different cities. The connections in the manufacturing industry among different cities become increasingly close and flexible. However, how virtual agglomeration in manufacturing forms and how it enhances development advantages has become an important topic in promoting high-quality development of manufacturing in the digital economy era. Existing literature on virtual agglomeration falls into three categories.
Firstly, some authors define the connotations of virtual agglomeration. The formation of virtual agglomeration originated from the concept of cyberspace proposed by Wilson in 1967 [4]. Virtual platforms concentrate supply and demand entities, promote the production of diverse products, and facilitate the formation of the long-tail effect [5,6]. Passiante and Secundo pointed out that virtual agglomeration are processes in which various entities such as suppliers, distributors, and service providers cooperate and compete in cyberspace [7]. Sumita et al. defined a virtual team from the two dimensions of dispersion and technological dependence [8]. Dispersion refers to the various forms of distance among participants in virtual work arrangements, including the spatial and temporal distribution of virtual workers. Technological dependence refers to the extent to which individuals rely on communication tools and their use of those tools in work. Virtual agglomeration entities exhibit informational proximity in cyberspace [9]. However, existing literature has not yet provided a sufficient answer to how virtual agglomeration in the manufacturing industry forms from the perspective of complex networks.
Secondly, some literature focuses on measuring the level of virtual agglomeration. Existing measurement perspectives include cities, industries, and enterprises. At the city level, Zhao, Ban used OECD input-output data and China’s first economic census of industrial enterprises to calculate the penetration of digital services through the share shift method. They then weighted the industry data to the prefecture-level city level to measure the level of virtual agglomeration in the manufacturing sector [10]. Liu, Wang supposed that the agglomeration of information transmission, computer services, and software industries at the city level can be used to measure virtual agglomeration [11]. Zhang, Ru used social network analysis to measure the virtual agglomeration level of 29 sub-sectors of China’s manufacturing industry [12]. Regarding literature on the enterprise dimension, Ren and Liang measured the virtual agglomeration level of enterprises based on industry concentration and the Herfindahl index [13]. Ning proposed that enterprises build virtual networks through cross-spatial collaborative innovation [14]. However, few scholars have focused on the complex network analysis of virtual agglomeration in the manufacturing industry.
Thirdly, some literature focuses on revealing the driving paths of virtual agglomeration. Existing literature mainly researches the innovation effects of virtual agglomeration [15] and green effects [16,17]. Summative suggestions on how to enhance the level of virtual agglomeration are only provided in the policy recommendation sections. Some scholars have also explored the influencing conditions of virtual cluster-based communities from an organizational perspective [18] and an environmental perspective [19]. However, there is still a lack of sufficient practical evidence to support how virtual agglomeration can enhance development.
This paper aims to clarify the formation mechanism of virtual agglomeration in the manufacturing industry and analyze its complex network characteristics. It further constructs a framework of influencing conditions for virtual agglomeration and identifies driving paths. In terms of methodological application, social network analysis can not only measure overall network density and node centrality, but also further analyze network structural characteristics. The Technology–Organization–Environment (TOE) framework can comprehensively interpret the influencing conditions of virtual agglomeration in the manufacturing industry. The fuzzy-set qualitative comparative analysis (fs/QCA) method can identify real scenarios where multiple factors simultaneously produce reinforcing effects. Therefore, this paper conducts research using the aforementioned methods and theories. The potential innovations of this paper include three points. Firstly, this paper analyzes the formation mechanism of virtual agglomeration based on the theory of the digital economy paradigm. Secondly, constructing a virtual agglomeration network from the macro urban dimension, characterizing the overall, individual, and structural features of the network. Thirdly, based on the TOE framework, this paper reviews the influencing conditions of virtual agglomeration and uses the fuzzy-set qualitative comparative analysis method to identify driving paths.
2. Theoretical Analysis
2.1. Formation Mechanism of Virtual Agglomeration
The digital economy paradigm refers to the transformation of dominant technology clusters driven by technological innovation, accelerating the creation of new products, new services, and new industries, thereby changing the original modes of production, organizational management, and economic growth [20]. A dominant technology cluster is a new combination of existing technologies that have evolved. Perez proposes that new economic paradigms mainly occur in three key areas. First, new low-cost elements emerge in the economic domain, making prices cheaper, supply greater, and applications more widespread. Second, general-purpose technologies accelerate innovation in other fields. Finally, new dominant technology clusters change the way enterprises are organized, thereby improving organizational efficiency. The formation of the digital economy paradigm is the result of complex collective dynamic learning.
The theory of spatial economics reveals the phenomenon of geographic agglomeration and its causes. However, compared to geographic agglomeration, virtual agglomeration is highly dependent on digital technologies. The agglomeration carrier has transformed from physical space to cyberspace. Therefore, geographic agglomeration theories struggle to explain the formation of virtual agglomeration. Virtual agglomeration is a new form that emerges as information technology continuously innovates and develops into digital technology clusters, which then integrate deeply with the real economy. It has new advantages in terms of cost, innovation, and organizational principles. As a result, the theory of the digital economy paradigm becomes the theoretical basis for analyzing the formation of virtual agglomeration.
Firstly, the new generation of information technology clusters is the core technology cluster supporting virtual aggregation. The digital technology cluster includes foundational technologies represented by computer and communication technologies, connectivity technologies represented by mobile Internet and the Internet of Things, and big data processing technologies represented by big data. First, computer and communication technologies provide the fundamental support for the Internet of Everything, accelerating the production of data elements and the extraction of data value [21]. Secondly, connection technologies have formed network platforms, providing a new medium for information exchange in virtual clusters [22]. Finally, big data processing technology collects digital information, performs content mining, and predictive analysis. These three types of technology achieve the virtualization of aggregation carriers and the valorization of data through the transmission mechanism of ‘foundation—connection—data’ [23].
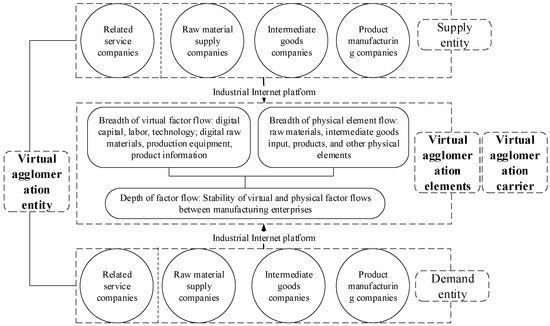
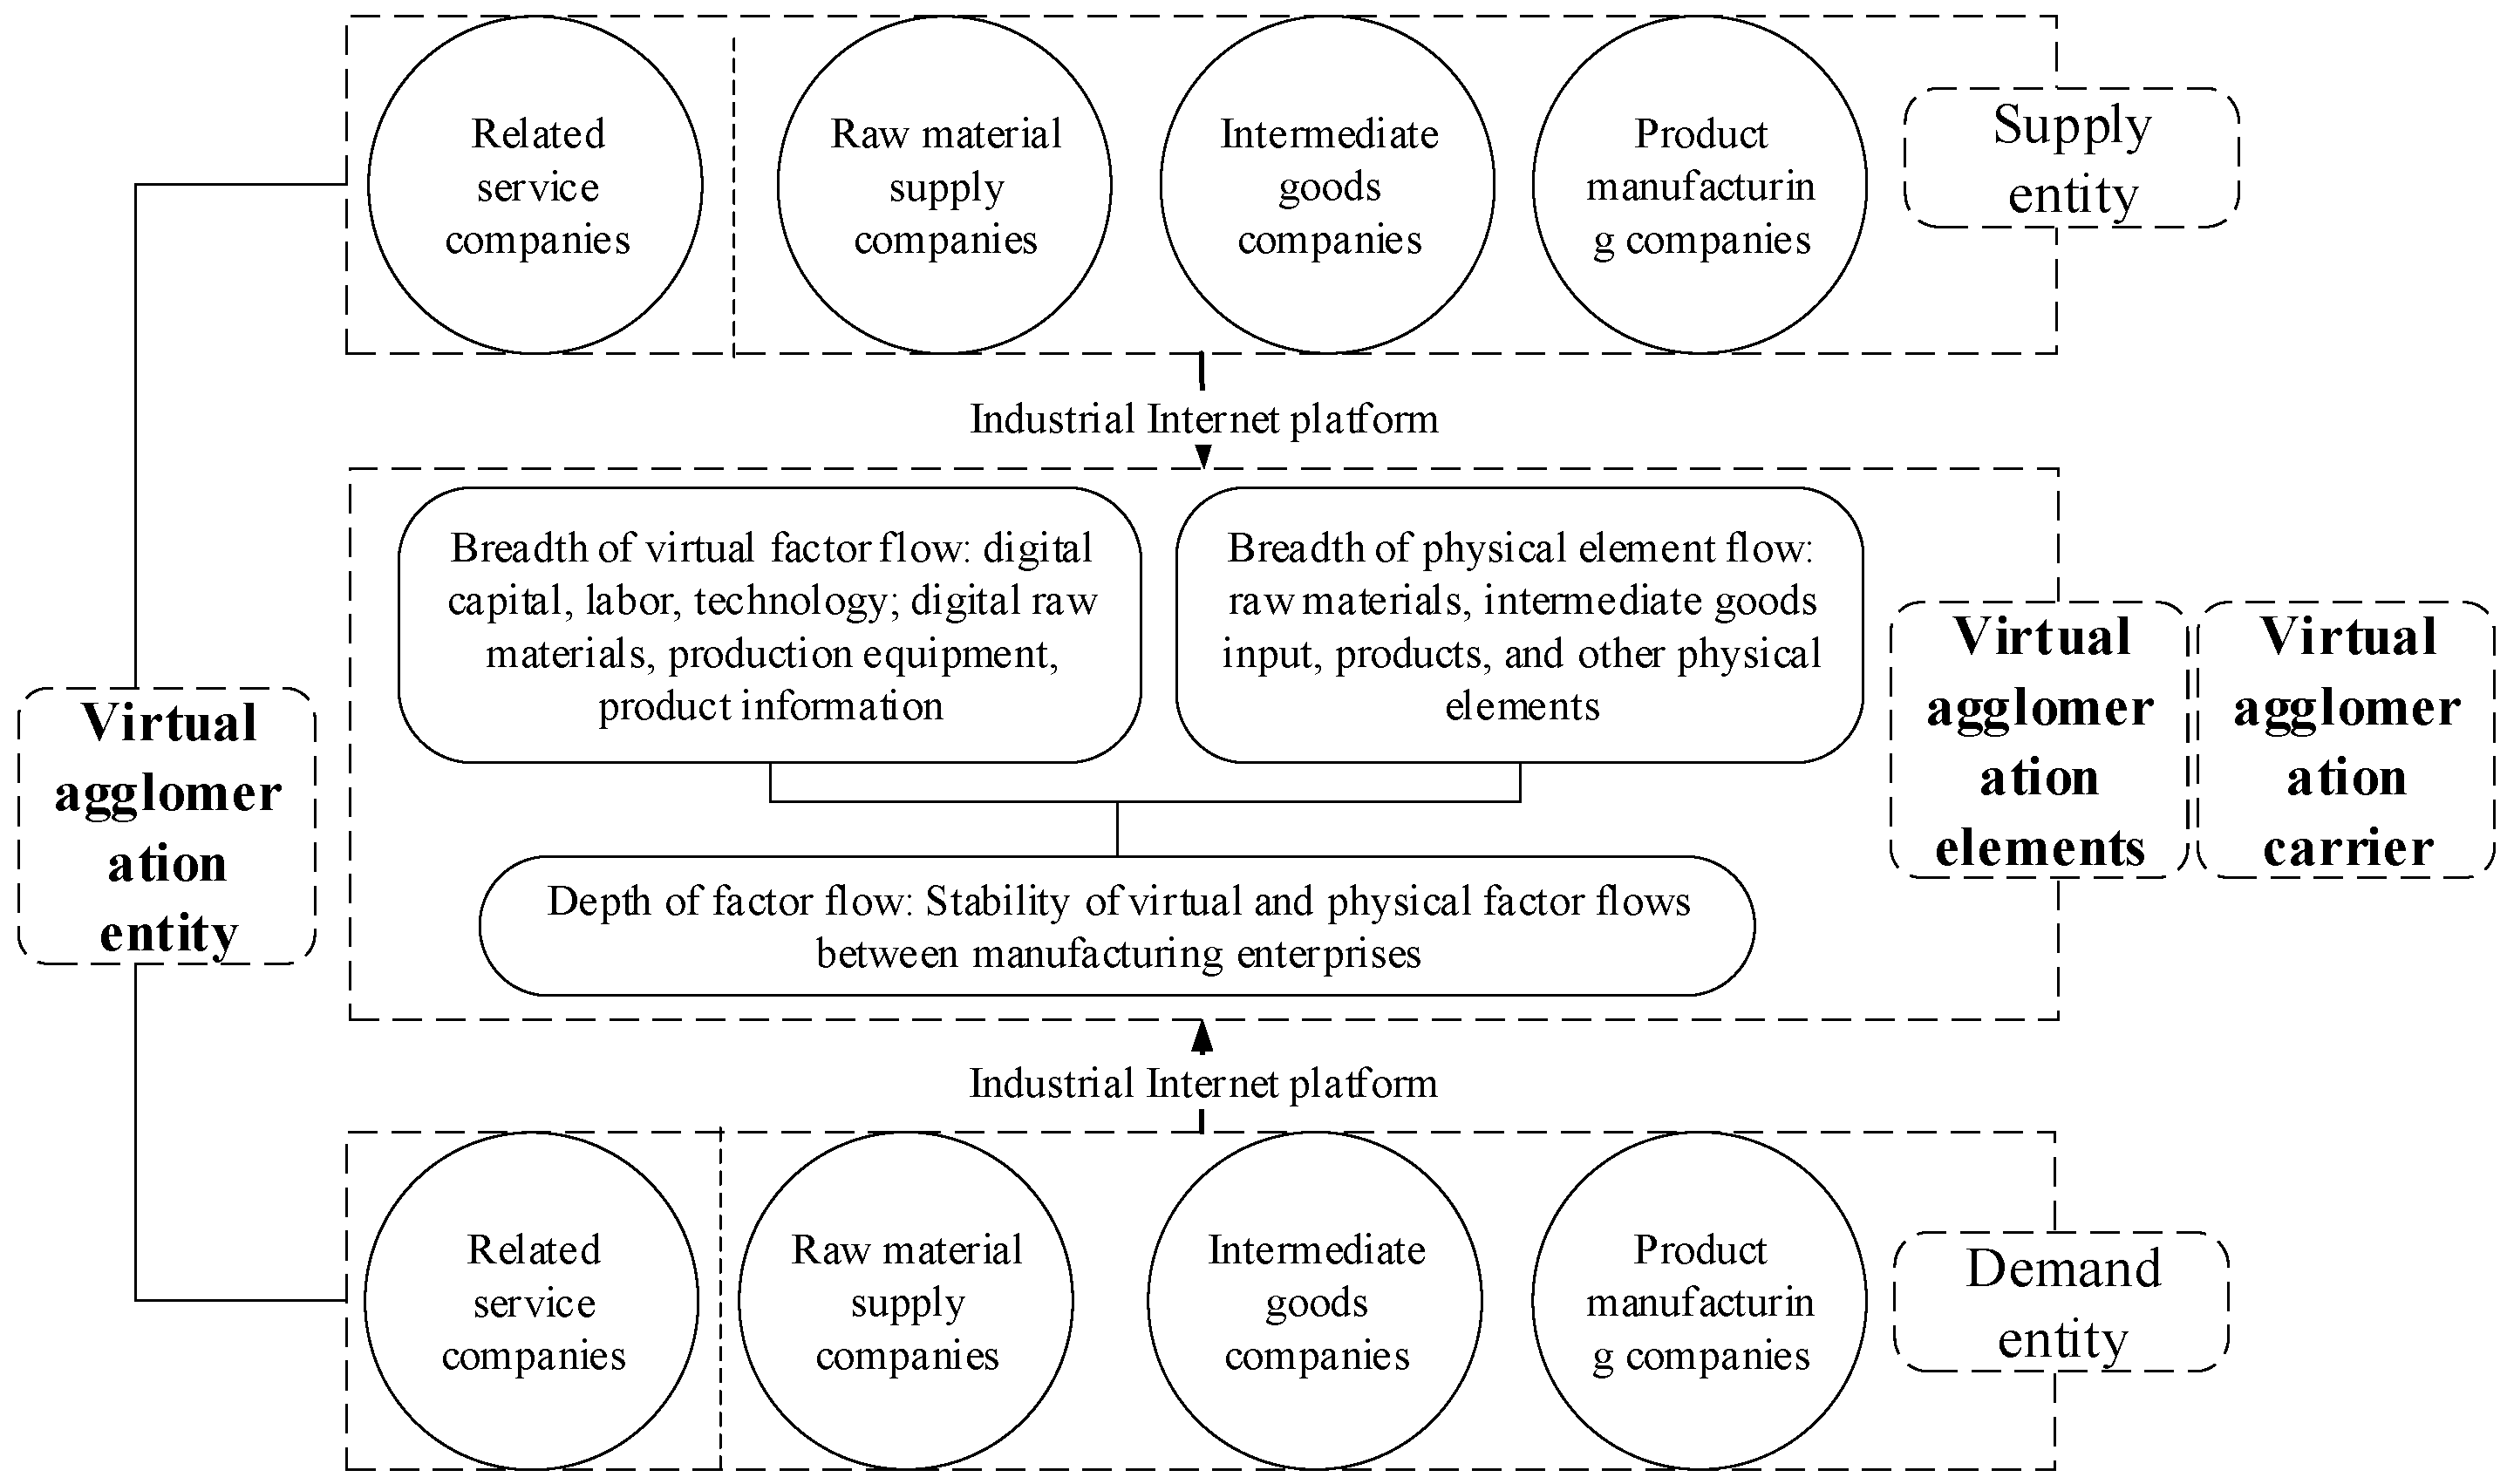
According to the theory of the digital economy paradigm, this paper defines virtual agglomeration as ‘the process in which manufacturing enterprises from the same or different geographic spaces, and from the same or different industries, gather on internet platforms to accelerate the flow and sharing of resources in the form of data, thereby improving the efficiency of resource allocation.’ Figure 1 illustrates the model of virtual agglomeration in the manufacturing industry.
Figure 1.
Virtual agglomeration model of manufacturing industry.
2.2. Driving Paths of Virtual Agglomeration
Every social activity is generated by the combined effect of multiple conditions. A single condition is hardly sufficient to fully explain complex economic behavior. In 1990, Tornatzky and Fleischer proposed the TOE framework to analyze the conditions influencing the adoption of new technology by enterprises or organizations. Technology, organization, and environment are considered the three aspects affecting the application of new technology. Technological conditions tend to analyze the compatibility among technology and organizational structure, application capabilities, and profitability [24]. Organizational conditions involve organizational size, communication mechanisms, different types of institutions, and diversified resource reserves. Environmental conditions include the market competition environment in which the organization operates, external public attention, and other aspects [25].
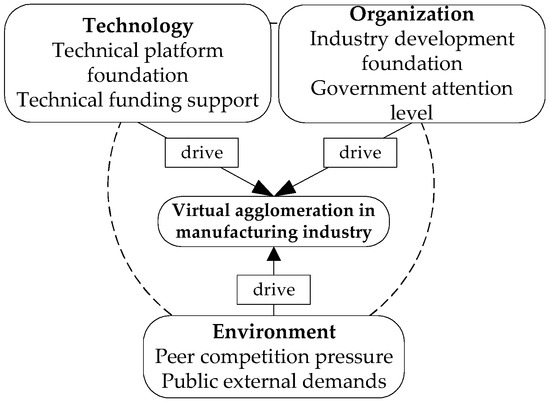
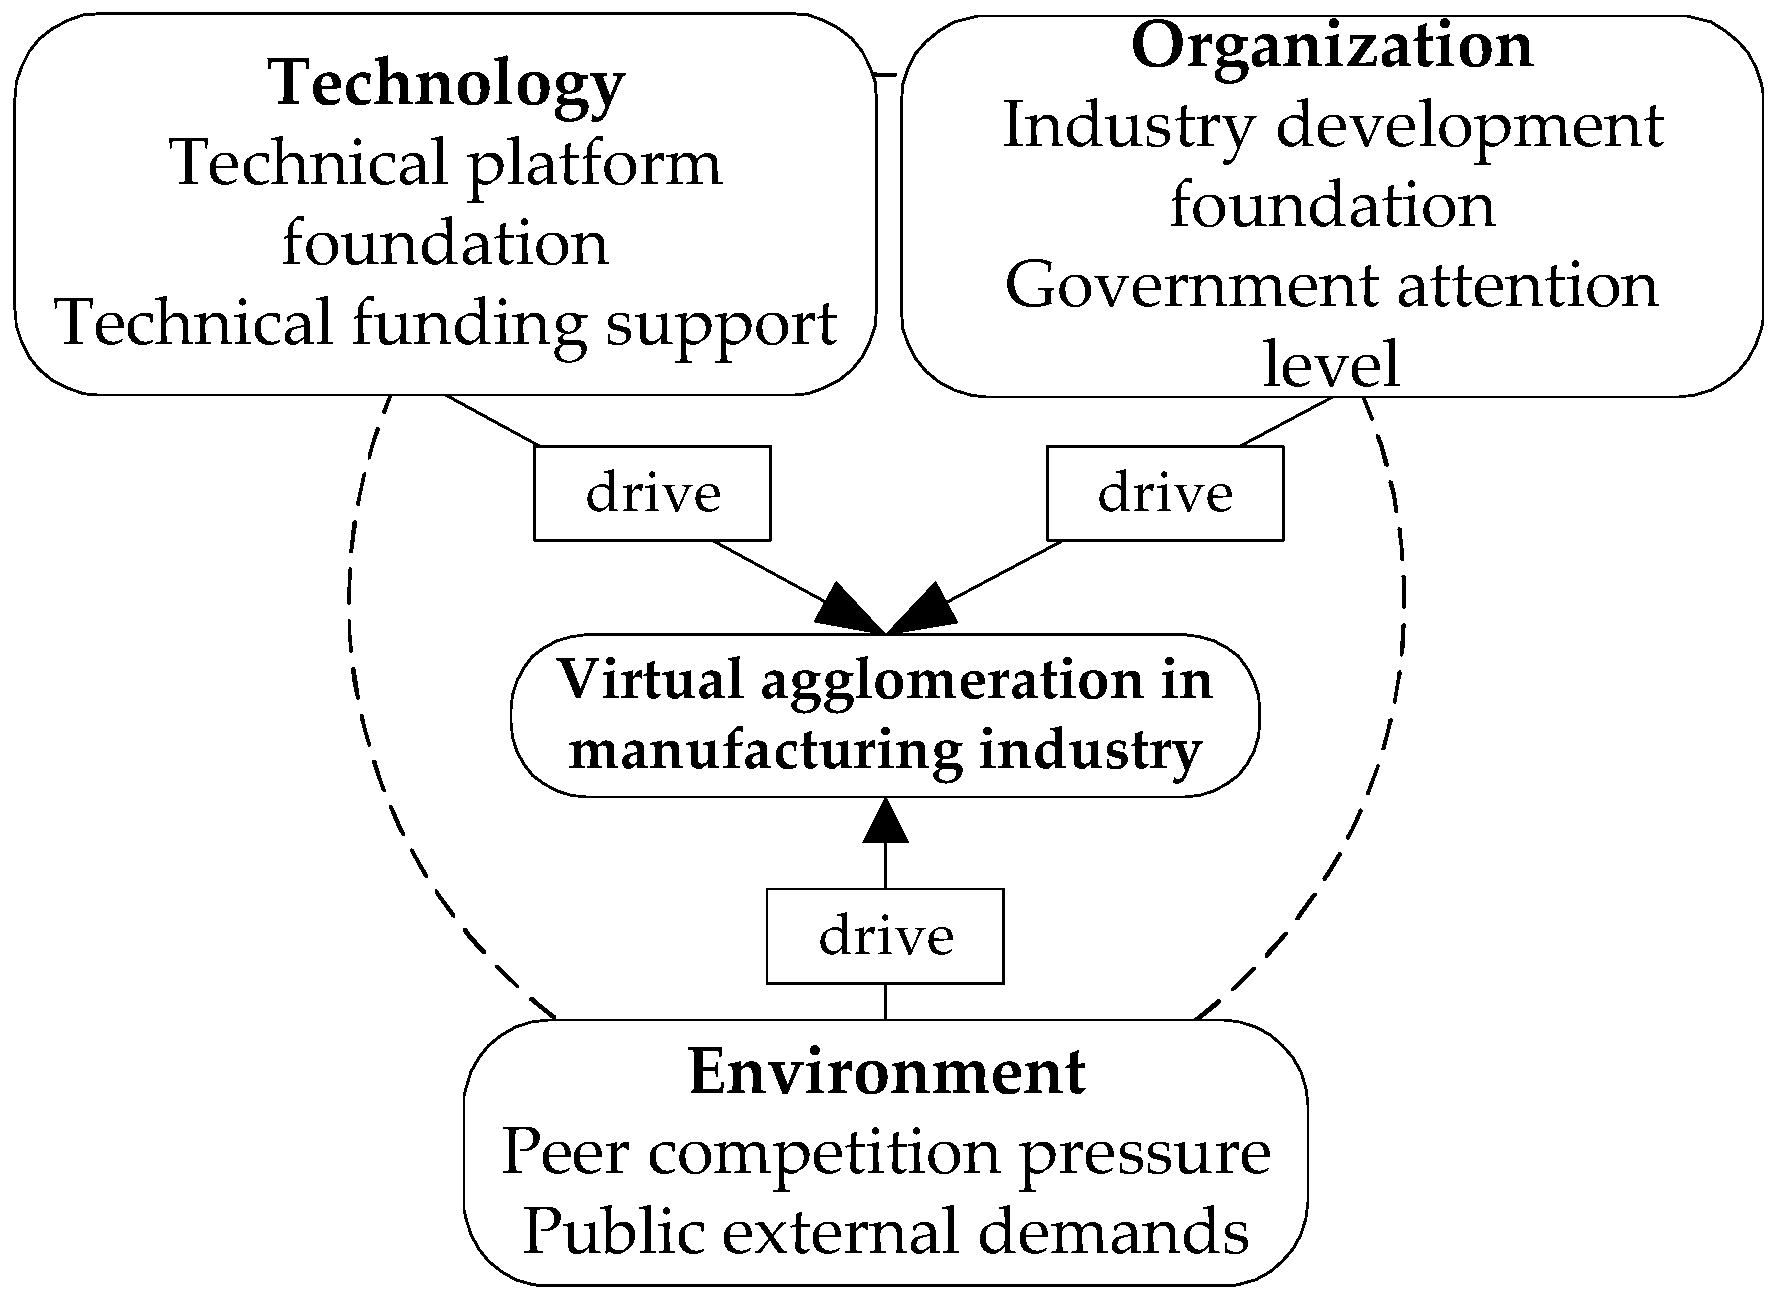
This paper uses the TOE framework to identify the driver paths of virtual agglomeration based on the following three considerations. Firstly, virtual agglomeration is a new form emerging from the application of digital technologies. Secondly, the level of new technology adoption in different cities is influenced by multiple internal and external conditions. The TOE framework is essentially a multi-factor comprehensive analysis framework, characterized by being systematic and having high generality, which helps this study to comprehensively identify influencing conditions. Finally, the impact of different conditions on virtual agglomeration is neither singular nor linear. Technology, organization, and environmental elements also interact with each other. Therefore, this study constructs a TOE framework for the driver paths of virtual agglomeration, as shown in Figure 2.
Figure 2.
Theoretical framework.
2.2.1. Technical Conditions
One of the important ways to achieve virtual agglomeration is through the application of digital technology clusters. At the same time, the impact of technological conditions depends on the extent to which the manufacturing industry applies digital technologies [26]. The industrial internet is an important tool for the integration of digital technology clusters and the manufacturing industry [27]. Internet platforms reduce information asymmetries and coordination costs, reflecting the important theoretical insight from Coase’s theorem that “reducing transaction costs is the core driving force for organizational transformation.” In addition, according to endogenous growth theory and innovation system theory, capital plays an important role in technology application [28]. Expenditure on science and technology enhances the region’s capacity to absorb technology by supporting research and innovation, building digital infrastructure, and fostering talent [29].
2.2.2. Organizational Conditions
Organizational conditions include the foundation of industrial development and government guidance. According to the principle that “productive forces determine production relations” in development economics, the economic level determines the industrial structure and technology application ability [30]. Cities with higher economic levels are better able to provide industrial support for virtual agglomeration. At the same time, according to business growth theory, a solid industrial foundation can form a more complete supporting industrial chain [31]. The support provided by the industrial chain lowers the collaboration costs among enterprises across regions, thereby enhancing the level of virtual agglomeration. In addition, cities with a strong economic foundation possess geographical agglomeration advantages, which can provide dual offline and online agglomeration support. Secondly, in the era of the digital economy, virtual agglomeration requires the coordinated efforts of both the government and the market. Special policies issued by the government break down administrative barriers and institutional constraints. An efficient government can accelerate the digital development of industries. Moreover, government policies on digital technology innovation and digital industrial development enhance collaboration efficiency.
2.2.3. Environmental Conditions
Environmental conditions are an important driving force for enhancing the level of virtual agglomeration, which includes the effects of competition and demand. Peer competition pressure have two types of effect on the level of virtual agglomeration in cities. The first is the negative “crowding-out effect. The higher the level of virtual agglomeration in other cities, the more resources they will attract. Resource advantages can suppress the development of virtual agglomeration in the city itself. The second is the positive “spillover effect.” Peer competition pressure helps form the “competition-chasing” effect and the “demonstration-learning” effect [32]. Competitive pressure drives the development of virtual agglomerations through technology spillover effects [33]. Currently, peer competition pressure among cities stimulates enterprises to shift digitally and accelerate technological innovation, with the “spillover effect” outweighing the “crowding-out effect” [34]. On the other hand, the development of the Internet has brought about new concepts such as user-centricity, the fan economy, and platform thinking. Consumers become an important part of the industry chain and have a significant impact on production and transactions. The strong public demand provides important external motivation for virtual agglomeration.
3. Research Design
3.1. Research Methods
3.1.1. The Social Network Analysis Method
Social network analysis methods are suitable for studying the complex connections among entities. Virtual agglomeration breaks the traditional classification of geographic agglomeration through specialization and diversification, presenting characteristics of mixed agglomeration. The connections among companies are becoming increasingly frequent. Firstly, this paper obtains the supply chain data of companies, using the Tianyancha website to collect information about the cities where the companies are located. Finally, this paper uses the supply chain data to construct the city-level virtual agglomeration network. The nodes of the network represent different cities, and supply chain cooperation represents virtual agglomeration among cities.
The virtual agglomeration network of this paper is an undirected weighted network. The agglomeration carriers are internet platforms. Network scale measures the overall level of the network. Node weighted centrality measures the individual level. Weighted degree distribution characteristics, small-world properties, community detection, robustness, and subnet measure structural features. Changes in network scale across different years measure dynamic characteristics.
① Overall scale. This paper measures the network scale using the sum of the weights of all edges. The calculation of network scale is shown in Equation (1)
In Equation (1), the represents the edges in the network and represents the number of edges in the network. The represents the weight of each edge. The represents the total weight of the edges.
② Individual level. The virtual agglomeration level of each city is measured using node centrality. The calculation of node centrality is shown in Equation (2).
In Equation (2), the represents the city, and represents the city that forms a virtual agglomeration connection with . represents the number of cities, represents the weight of the virtual agglomeration between and , and is the weighted centrality of city .
③ Network structure characteristics.
The first point characterizes the weighted degree distribution features. This paper analyzes the data by combining linear equal-width binned histograms with the complementary cumulative mass function (CCMF). Considering that the node weighted degree is a discrete variable, this paper first presents the data distribution pattern using linear equal-width binned histograms, which avoids the bias caused by logarithmic binning that results in overly dense regions for small values and sparse regions for large values. On this basis, this paper fits the empirical data using the CCMF form of the stretched exponential distribution, rather than its differential form, to ensure the consistency of the model with the cumulative distribution data. The CCMF of the stretched exponential distribution is defined as shown in Equation (3).
In Equation (3), the is the threshold of weighted degree. The is the shape parameter. The is the scale parameter. When , the model degenerates into an exponential distribution. When , the distribution exhibits a heavy-tail characteristic, indicating the presence of hub city nodes in the network.
Secondly, small-world properties are used to depict the global connectivity efficiency of the network. The urban network defined in this article is a weighted network. The weighted clustering coefficient and the weighted average shortest path of the network are given in Equations (4) and (5), respectively.
In Equation (4), the is the global weighted clustering coefficient. The and are the weighted degree and unweighted degree of the node, respectively. The is the set of neighbors of the node . The is the weight between the nodes and .
In Equation (5), the is the weighted shortest path. The is the distance between nodes and , the larger the weight, the shorter the distance. Obtain the average shortest path values of the clustering coefficients for the real network and the random network respectively. When and , it indicates that the network exhibits small-world characteristics.
Thirdly, this paper uses community detection methods to identify the community characteristics of virtual agglomeration networks. Within a community, the connections among cities are frequent, while the connections among cities outside the community are sparse. This paper uses the Louvain algorithm for community analysis, and the calculation of the modularity value in this algorithm is shown in Equation (6).
In Equation (6), the range of is (0, 1). When , it indicates that the network has a community structure. The is the virtual agglomeration weight of cities and . The and are the weighted degrees of cities and , respectively. The is the sum of the weights of all edges in the network. The is an indicator function. If the cities belong to the same community, the value of is 1; otherwise, it is 0.
Fourthly, robustness is used to measure network stability, identifying whether certain nodes in the network, when subjected to random or targeted attacks, still allow the network to maintain connectivity.
Finally, this paper divides the virtual agglomeration network into three sub-networks by region, including the eastern region, the central region, and the western region.
3.1.2. The Qualitative Comparative Analysis Method
The network feature analysis helps clarify the level of virtual agglomeration in cities and the differences among different cities. On this basis, in order to accelerate the improvement of the level of virtual agglomeration in cities, this paper further identifies the paths to enhance the level of virtual agglomeration. Based on the TOE framework, the conditions influencing virtual agglomeration are complex and diverse. Therefore, this paper needs to find a method for multi-condition analysis. The qualitative comparative analysis method happens to have the unique advantage of identifying the complex interplay of multiple conditions [35]. In different combinations, some conditions may exhibit stable characteristics. These conditions thus become the core conditions driving economic activities. Therefore, this paper uses a qualitative comparative analysis method to explore the driving paths of virtual agglomeration in the manufacturing industry. The method of QCA mainly includes crisp-set QCA (cs/QCA), fuzzy-set QCA (fs/QCA), and multi-value QCA (mv/QCA). Among them, the first and second methods are suitable for analyzing cases where samples are independent of each other. The third method can obtain results where samples appear repeatedly in different paths. Moreover, fs/QCA has the dual attributes of qualitative and quantitative analysis. Therefore, this paper selects the fs/QCA method to identify the driver paths.
3.2. Variable Selection and Data Sources
3.2.1. Outcome Variables
This paper aggregates supply chain data to the city level and then constructs a virtual urban agglomeration network. The level of virtual agglomeration is measured by the number of connections each city has within the network.
3.2.2. Conditional Variables
This paper selects six conditional variables from the dimensions of technology, organization, and environment, and their measurement indicators are shown in Table 1.
Table 1.
Condition variables.
The data for the outcome variable comes from the supply chain data of listed manufacturing companies in different cities. The conditional variables are sourced from the “Statistical Yearbook of Prefecture-level Cities,” the “Top 500 Industrial Internet Companies in China 2024,” and policy text data from prefecture-level city governments. Since the data in the Statistical Yearbook of Prefecture-level Cities is only updated through 2023, this study uses 2023 data for prefecture-level cities. Additionally, when aggregating enterprise data to the city level, because the enterprise supply chain data does not cover all prefecture-level cities, this study only discusses the data for the cities involved.
3.2.3. Descriptive Statistics
The descriptive statistics of the variables are shown in Table 2. The standard errors of public external demand in different cities are relatively small, while the standard errors of other condition variables and the level of virtual agglomeration are relatively large. This result indicates that there are currently significant differences in the internal and external development environments faced by virtual agglomeration in different cities.
Table 2.
Descriptive statistics of variables.
4. Complex Network Feature Analysis
4.1. Network Scale
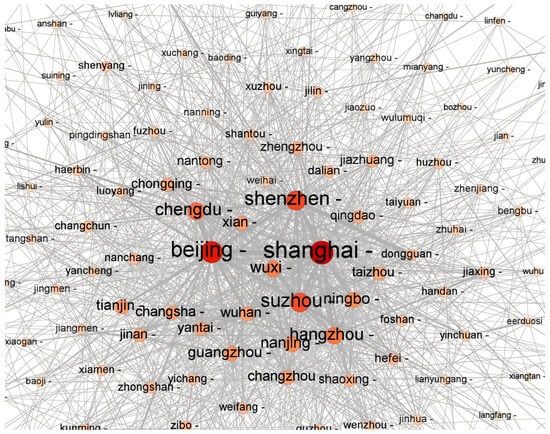
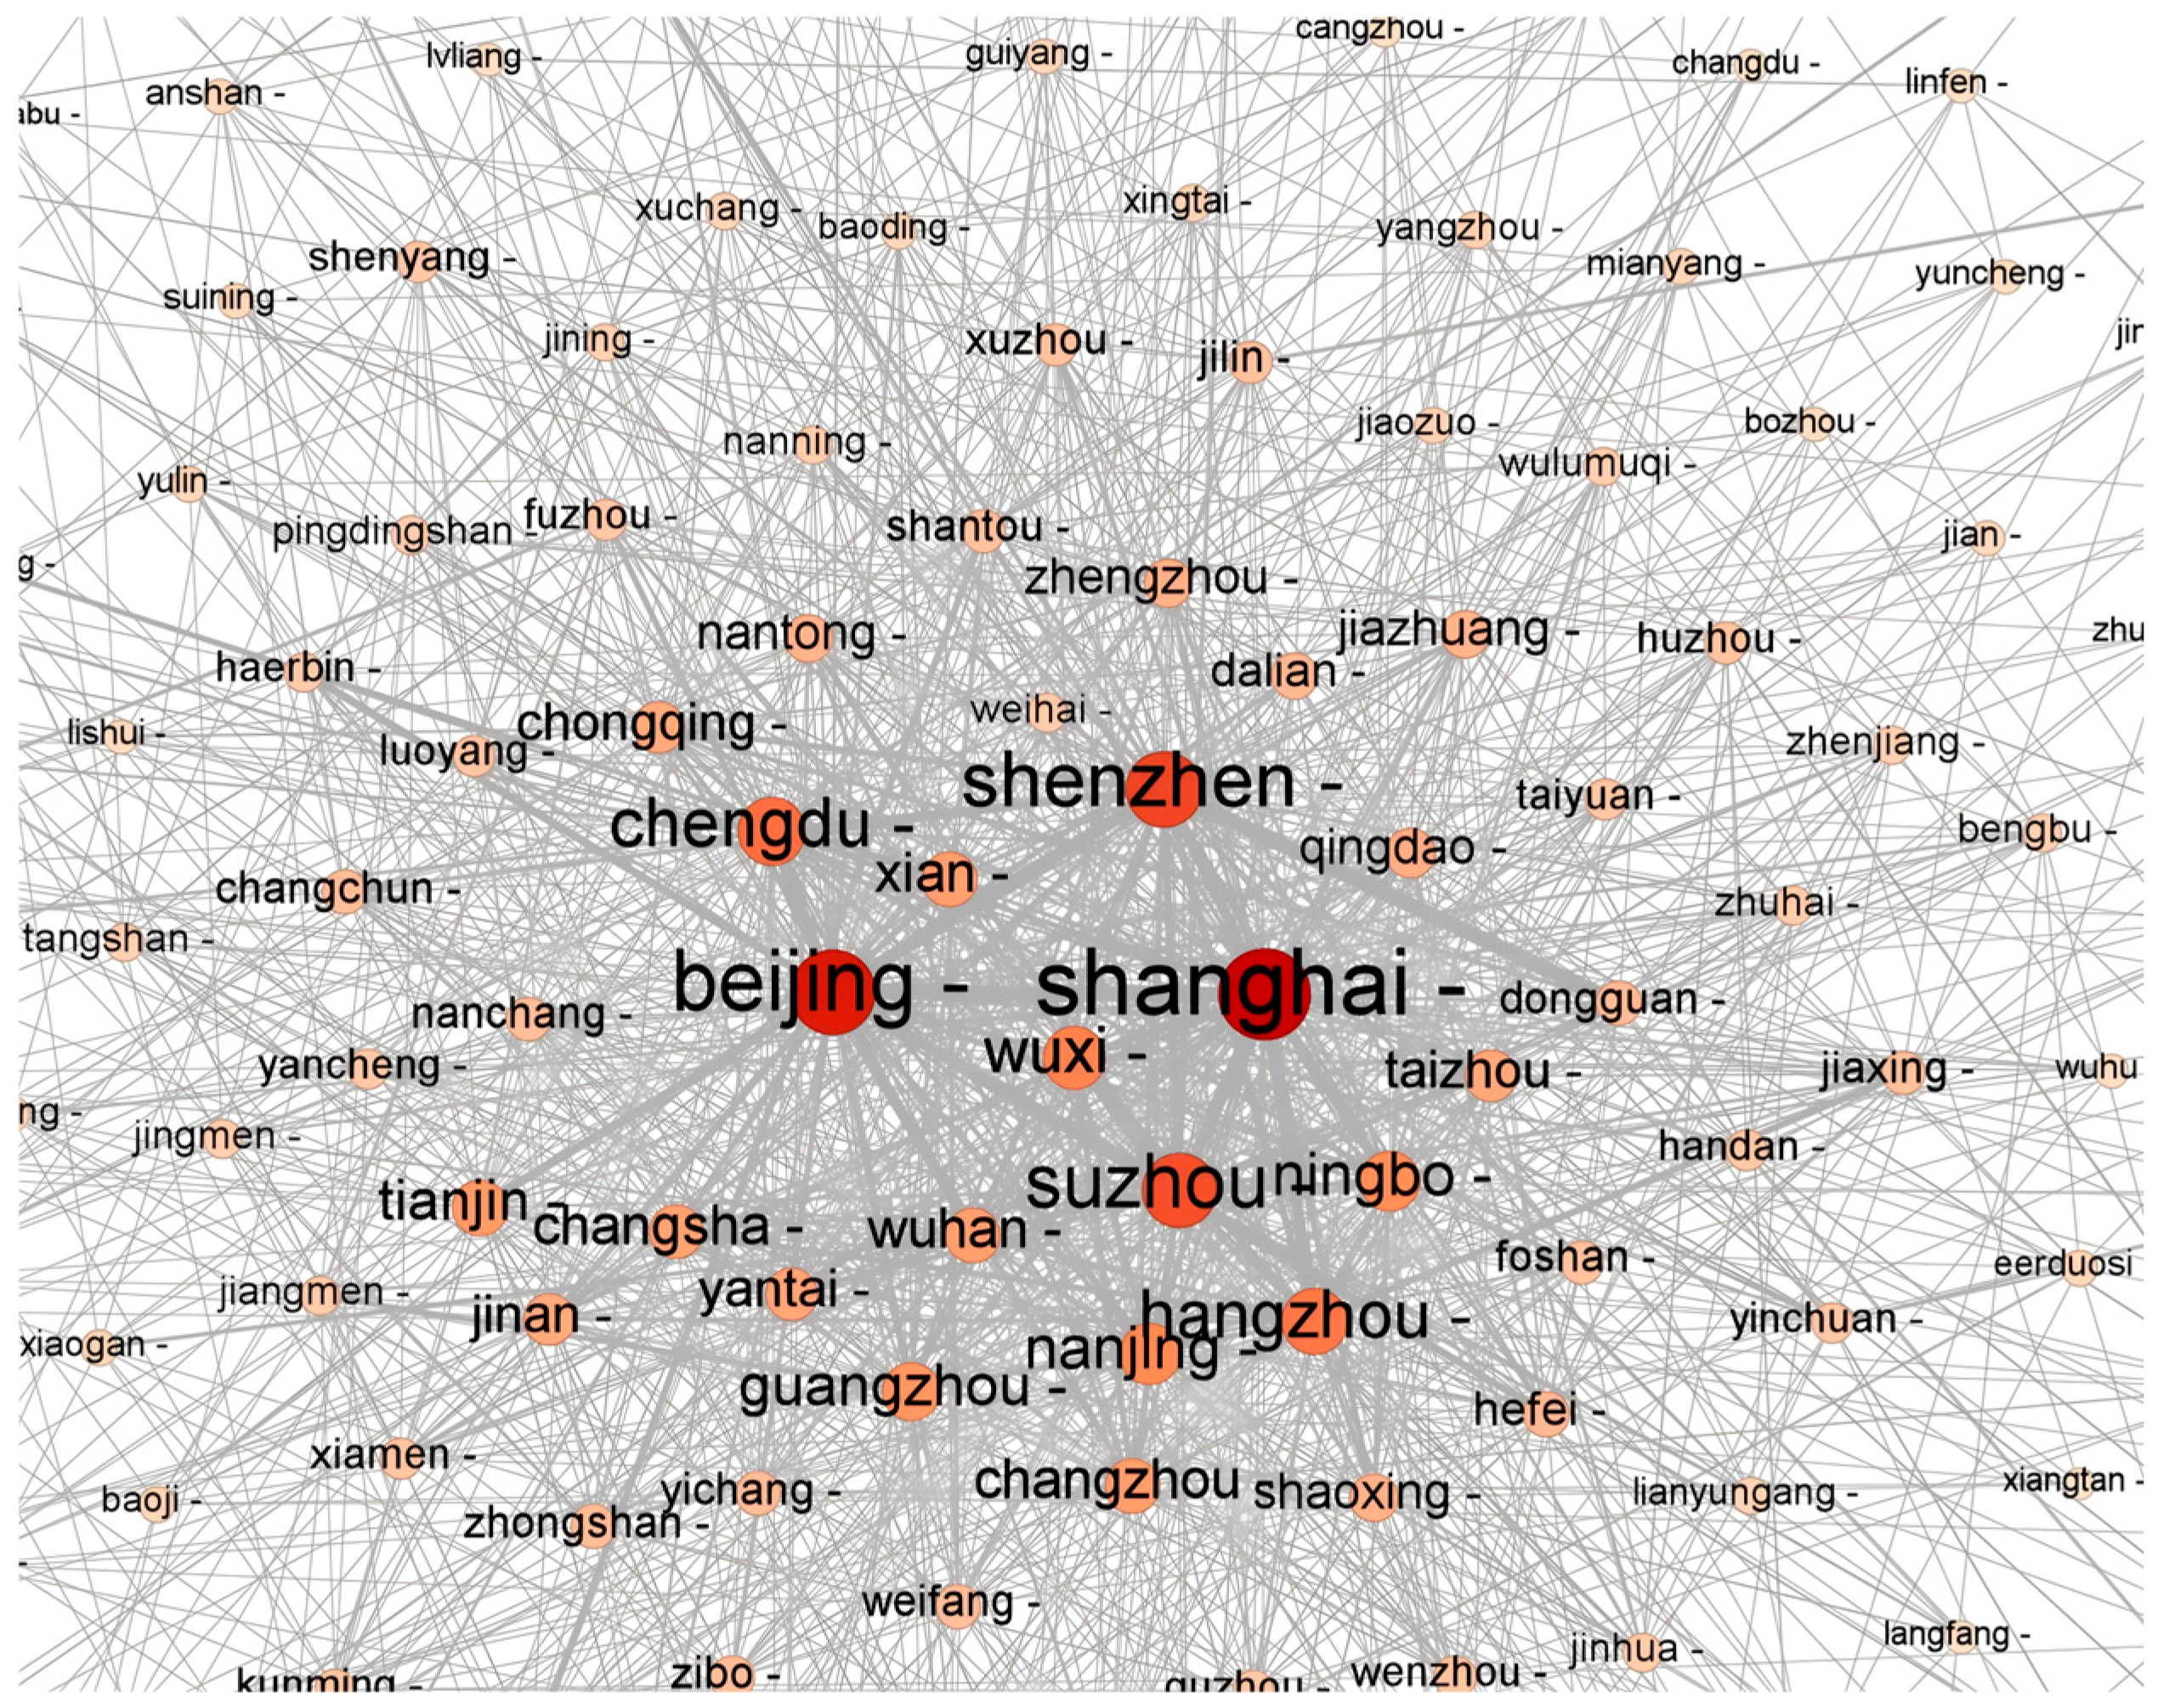
This article uses Gephi 0.10.1, developed by ATRIUM (Advanced Technology Research Institute of the University of Maine) in Le Mans, France, to draw virtual clustering networks. This paper summarizes data from 288 prefecture-level cities and autonomous prefectures in China in 2023. In 2023, the weighted number of edges in the virtual manufacturing agglomeration network is 2645. Figure 3 shows information on cities with the highest virtual agglomeration levels in 2023. Among them, Beijing and Shanghai have the highest virtual agglomeration levels. The virtual agglomeration levels of Shenzhen, Chengdu, and Suzhou are slightly lower than those of the top two cities. Other cities have relatively lower virtual agglomeration levels.
Figure 3.
Virtual agglomeration network in manufacturing.
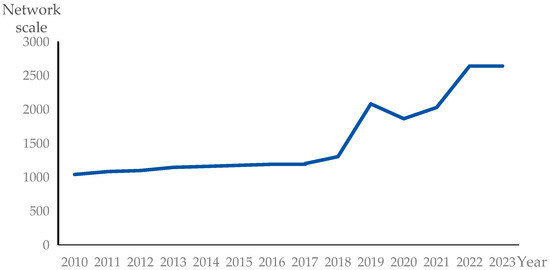
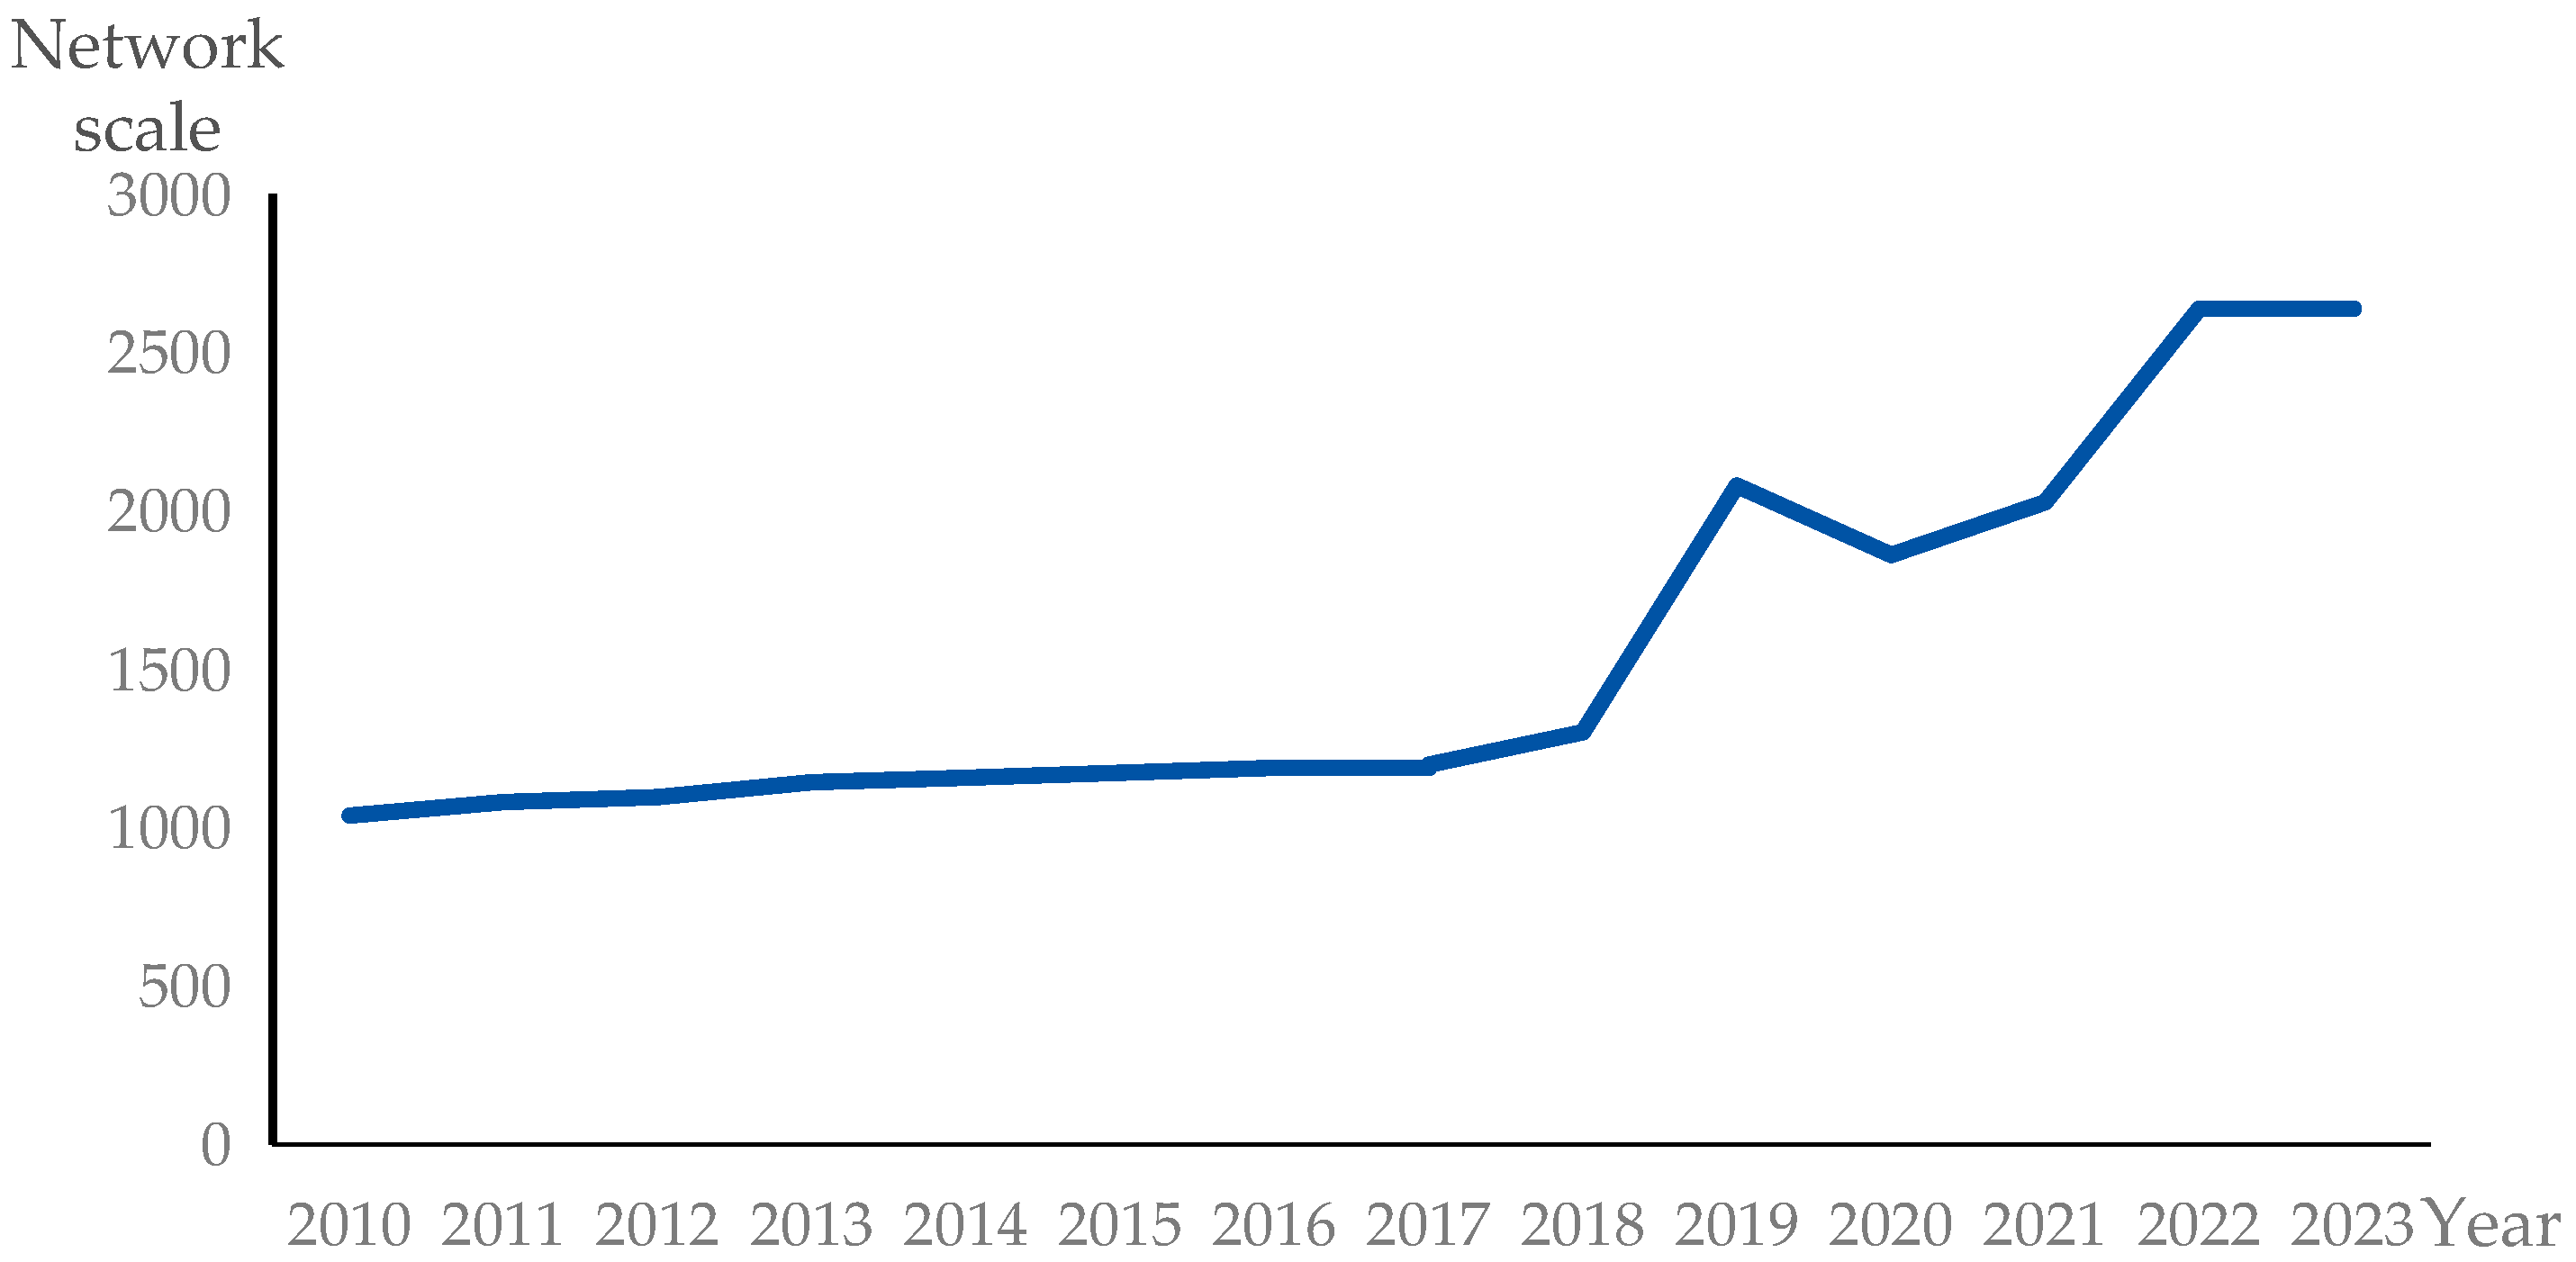
In addition, Figure 4 shows the dynamic characteristics of the virtual agglomeration network. From 2010 to 2023, the overall network size showed an upward trend. Among them, the network size experienced a fluctuating decline from 2019 to 2021. Further analysis revealed that the reduction in network size may have been due to a decreased frequency of cross-city virtual clustering caused by the COVID-19 pandemic.
Figure 4.
Dynamic characteristics of virtual agglomeration networks in manufacturing.
4.2. Individual Level
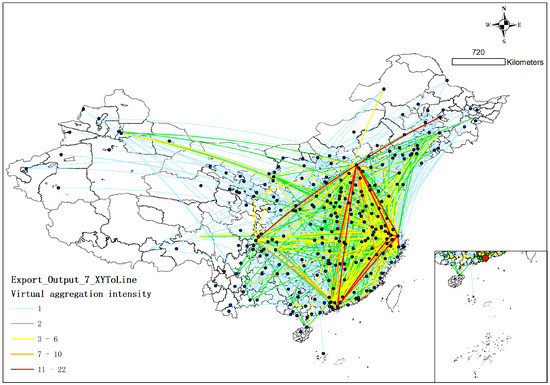
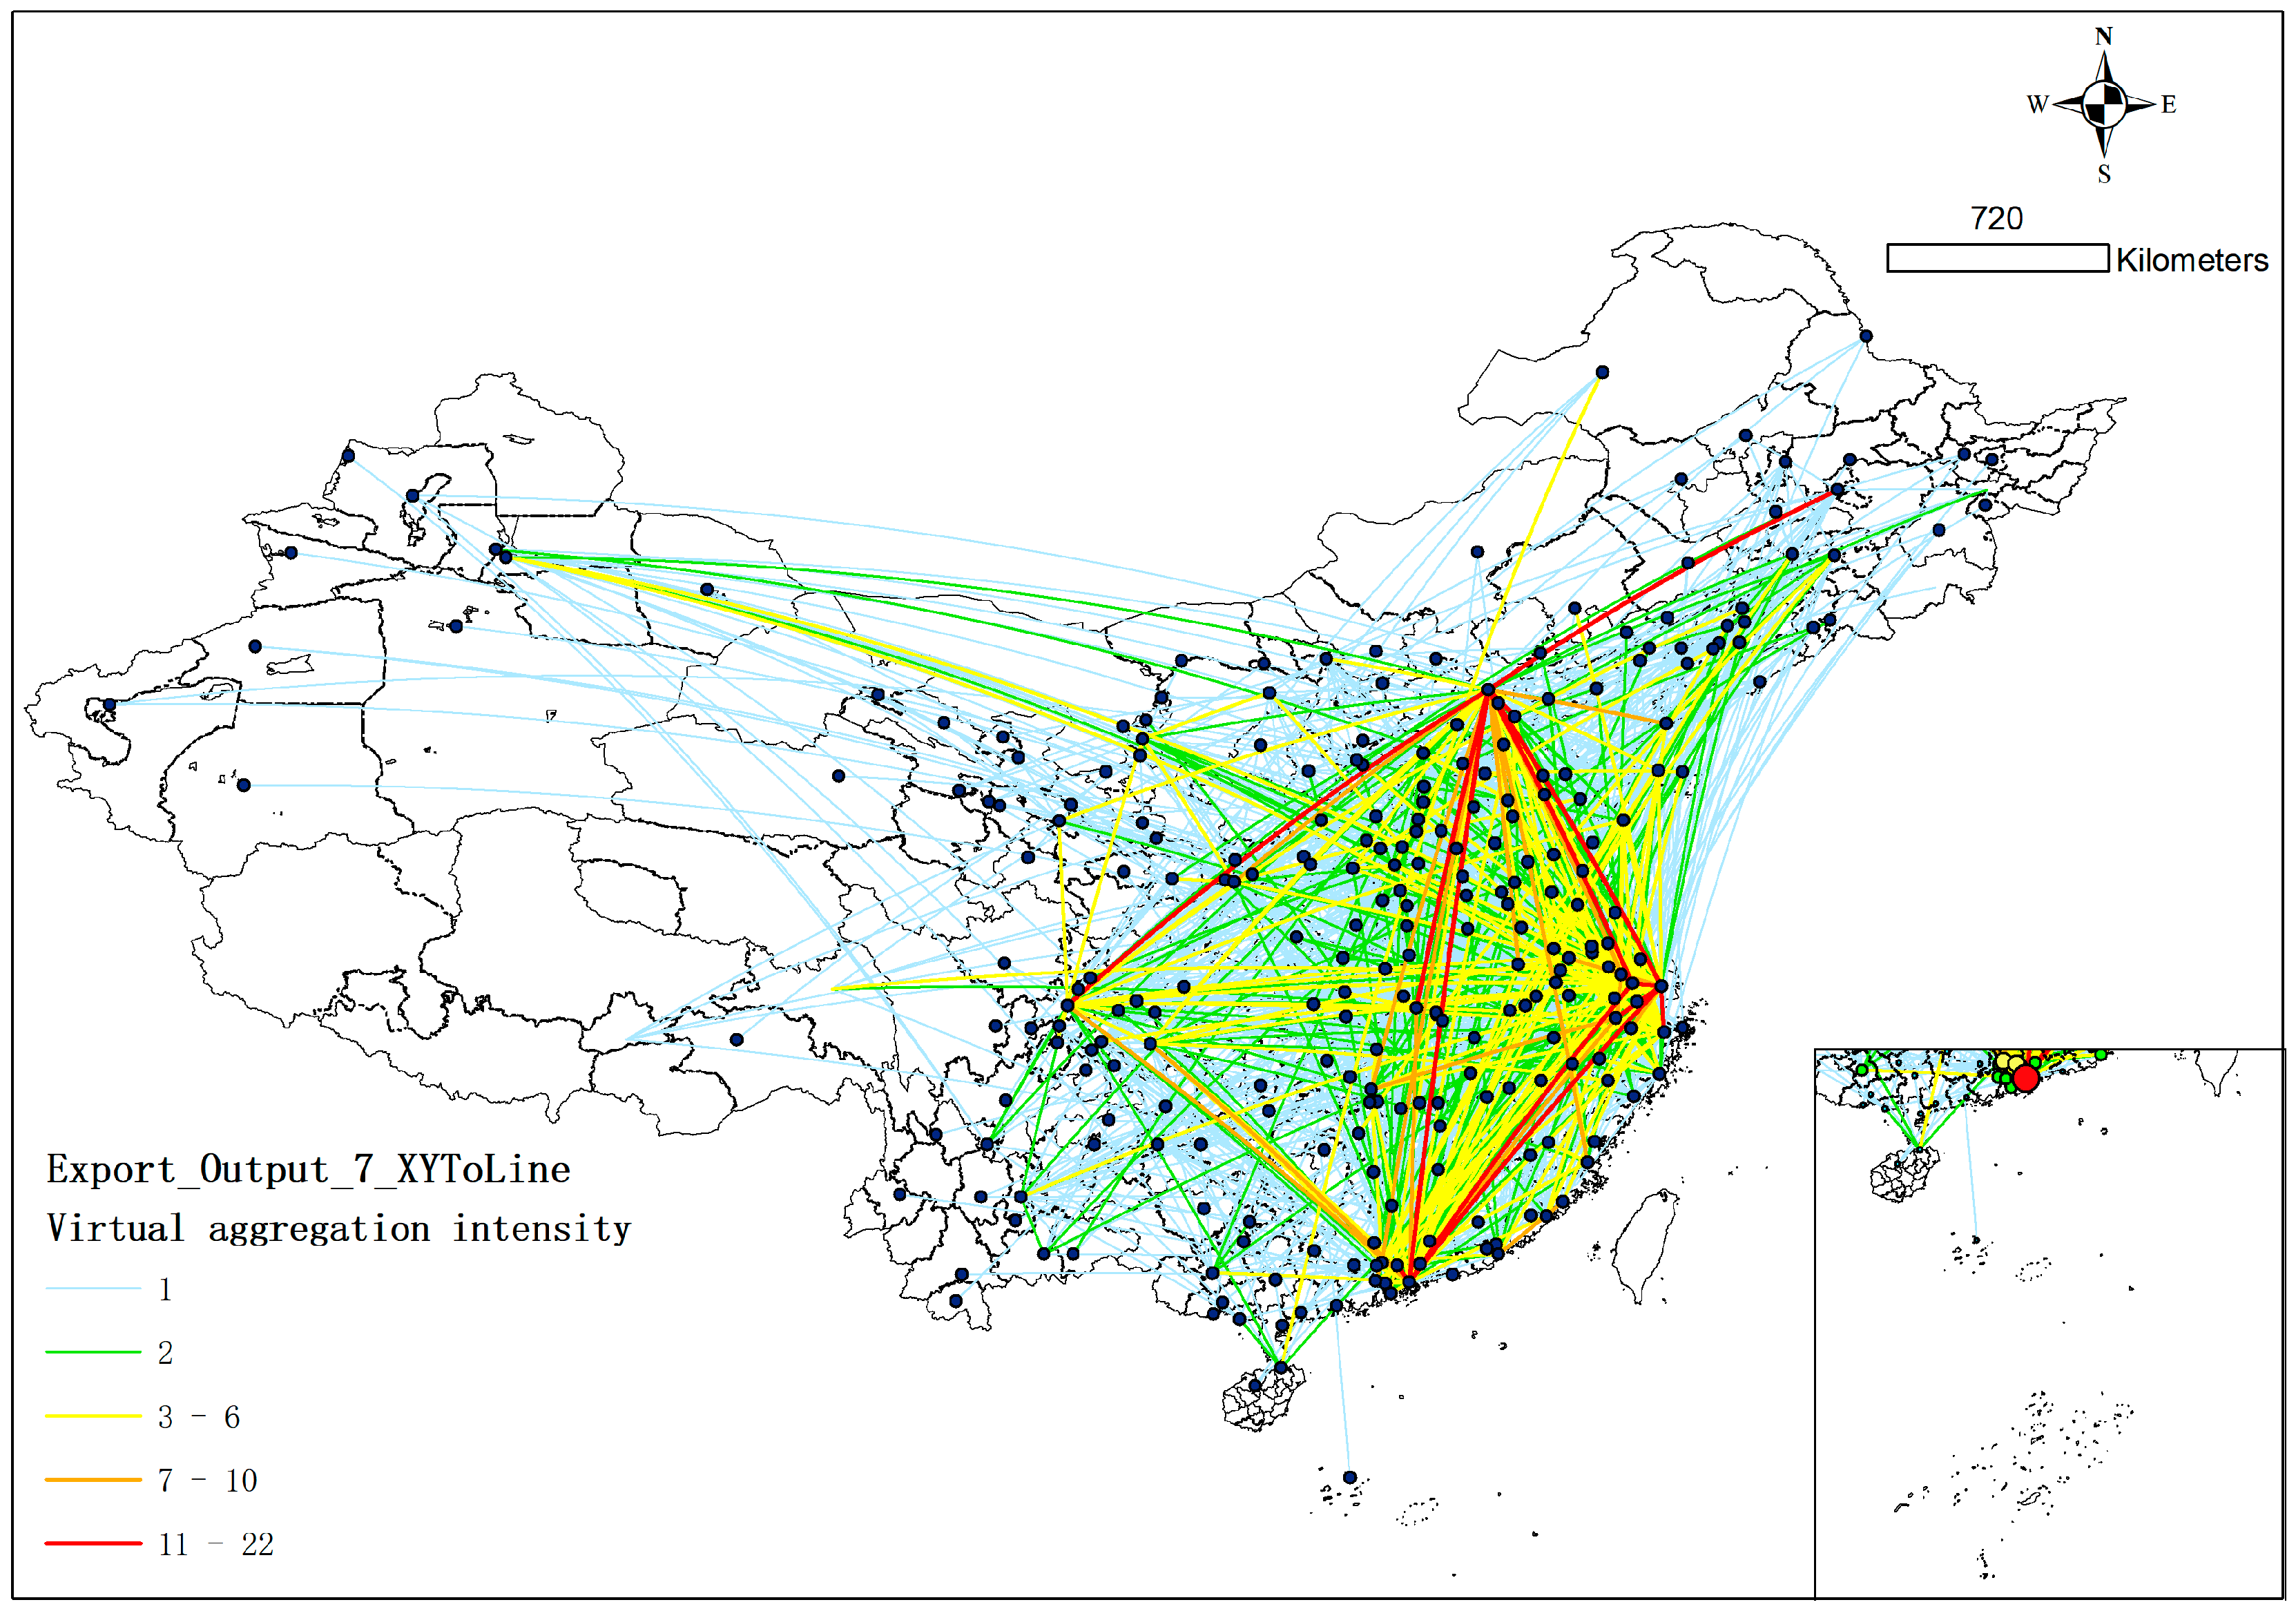
This paper further uses ArcMap 10.8 to visualize the virtual agglomeration activities of different cities. In Figure 5, we divide the virtual agglomeration levels of different cities into five grades, represented by red, orange, yellow, green, and blue, respectively. The virtual agglomeration level gradually decreases from red to blue. As shown in Figure 5, the current virtual agglomeration network in different cities is mostly concentrated in the eastern and central regions. One reason is that the number of publicly listed manufacturing companies in the western region is far lower than that in the eastern and central regions. According to data from the China Association for Listed Companies, by the end of 2023, there were 3608 publicly listed manufacturing companies in the domestic stock market, with Guangdong, Zhejiang, and Jiangsu in the eastern region having 872, 702, and 690 listed companies respectively, accounting for 40% of the total number of listed companies. In addition, the level of digitalization in eastern and central cities is higher than that in the western region [36]. In particular, the eastern cities, leveraging an open digital business environment, accelerates digital technology innovation and digital infrastructure construction, providing an advantage for manufacturing enterprises to build cross-regional virtual agglomeration networks [37].
Figure 5.
Urban distribution of virtual agglomeration in manufacturing.
4.3. Structural Characteristics
4.3.1. Weighted Degree Distribution Characteristics
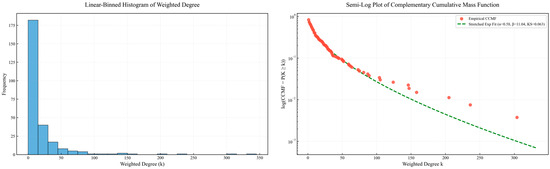
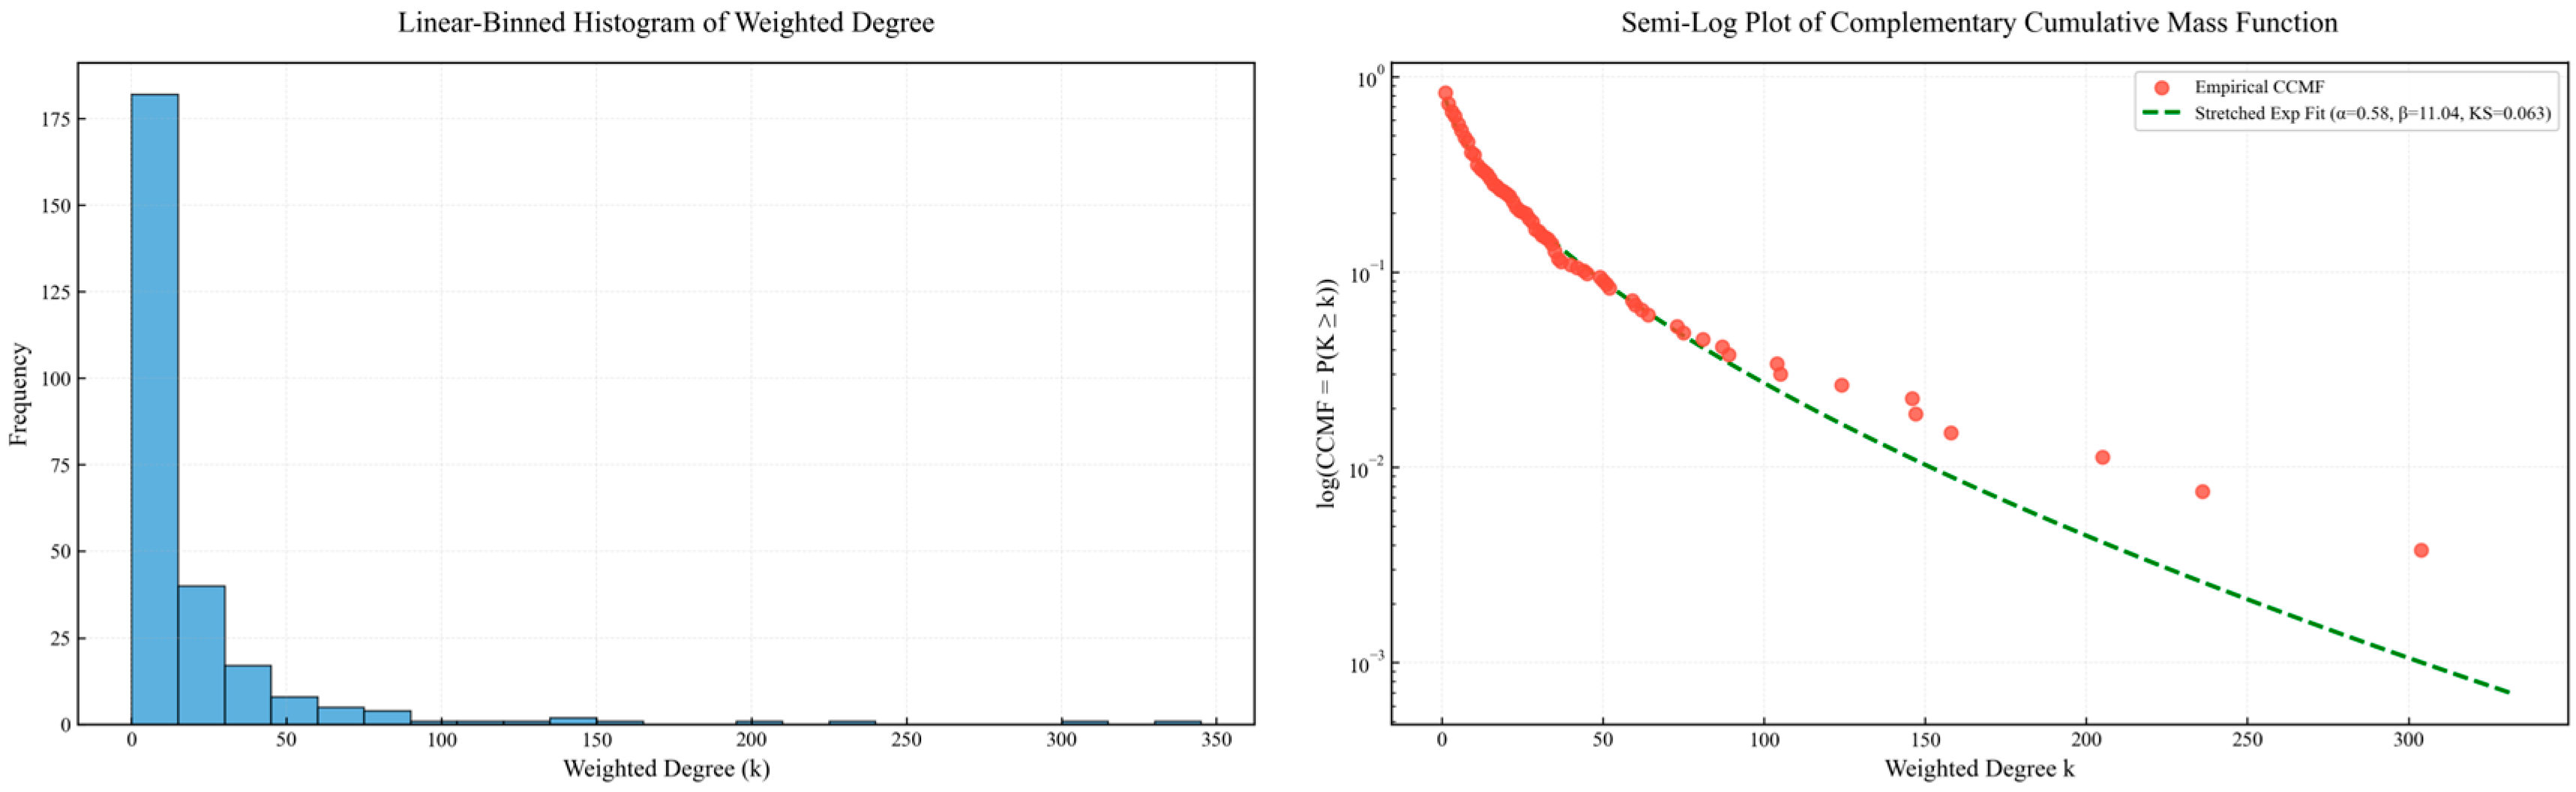
This paper uses the stretched exponential model to analyze the weighted degree distribution characteristics of nodes because the stretched exponential model can better capture the rapid decay of nodes with small to medium degrees and the tail trends of nodes with high weighted degrees. The analysis results of the weighted degree distribution characteristics are shown in Figure 6. The fitting parameter values of the stretched exponential model are = 11.04 and = 0.58. The shape parameter indicates that the virtual agglomeration network exhibits typical heavy-tail characteristics. There are a few urban nodes in the network with extremely high connection strength. Core cities connect a large number of suppliers and distributors in the supply chain [38]. This is because core cities have stronger attractiveness and radiation, exhibiting the ‘Matthew effect.’ At the same time, due to limitations in service capacity and geographic resources, the connections of core cities cannot expand indefinitely. Therefore, the network distribution pattern lies between an exponential distribution and a power-law distribution. In addition, the fitting results in the right figure show that the tail observations do not completely match the fitting curve, and this deviation arises from the scarcity of highly hub nodes in the virtual agglomeration network, leading to statistical fluctuations in the tail estimates, which do not affect the overall conclusion about the distribution characteristics. The KS test results indicate that the model fits well.
Figure 6.
Analysis results of the weighted degree distribution characteristics.
4.3.2. Small-World Properties
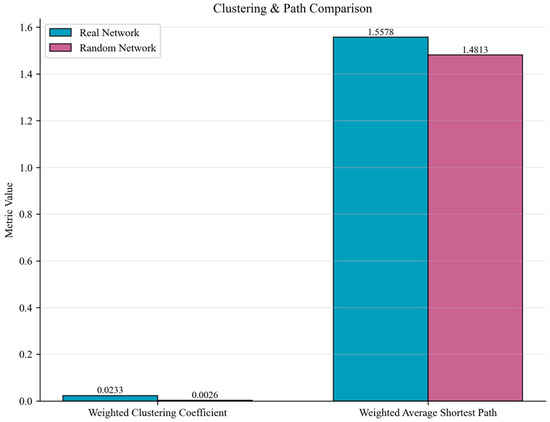
The virtual agglomeration connections among cities are influenced by the industrial characteristics of the cities. Virtual agglomeration only occurs when the industries of two cities are on the same industrial chain. To ensure that the composition of the random network conforms to the reality of urban industrial distribution, this paper only examines the impact of weight distribution on small-world properties. Therefore, this paper generates random networks by preserving the network topology and randomly shuffling the weights. During weight allocation, all weight values are randomly assigned to each edge, and this is done 100 times. The weighted clustering coefficient and weighted average path length of 100 random networks are calculated, and the mean and standard deviation of these indicators are used as benchmarks for comparison to ensure the stability of the results. The results of the small-world properties test are shown in Figure 7. Firstly, the weighted clustering coefficient of the real network is about 8.8 times that of a random network, indicating that the degree of local agglomeration in the network is much higher than that of a random network of the same scale. This conclusion is consistent with the current characteristics of virtual agglomeration networks among cities. The virtual agglomeration connections among cities show the characteristics of local agglomeration and closely matched related elements. Secondly, the average shortest path of the real network is basically the same as that of the random network, indicating that the transmission efficiency of virtual agglomeration resources, information, logistics, and other elements among cities is relatively high. The results of the average shortest path indicate that virtual agglomeration breaks geographic limitations, speeds up the cross-space sharing of elements, and helps China accelerate the promotion of the ‘Unified Big Market’ strategy. Finally, the small-world quotient is far greater than 1, indicating that the virtual agglomeration network is a form of organization distinct from geographic agglomeration and random networks. The virtual agglomeration network of Chinese cities not only has the closeness of local clustering but also the convenience of cross-regional linkages.
Figure 7.
Analysis results of small-world properties.
4.3.3. Community Detection
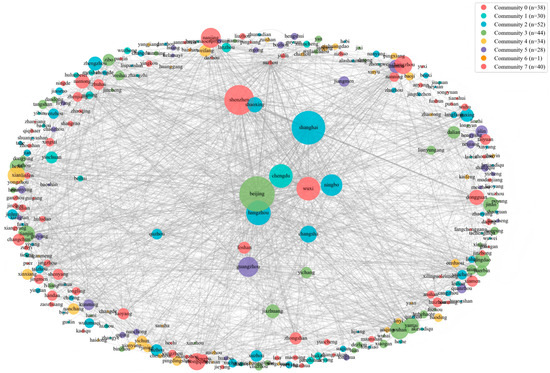
The community detection results are shown in Figure 8. The network is divided into 8 communities, with significant differences in the number of cities in each community. The Q value of the community detection result is 0.216, indicating that the network exhibits a weak community structure, and the effect of traditional geographic proximity has somewhat decreased. The current virtual city agglomeration network has cross-regional, weak-boundary connection characteristics, which align with the real-world feature of virtual agglomeration breaking geographic barriers. Among them, the largest cities are in communities 2, 3, 7, and 0. Community 2 is centered on Shanghai. Community 3 is centered on Beijing. Community 7 is centered on Suzhou and Nanjing. Community 0 is centered on Shenzhen. At the same time, the larger the city node in Figure 8, the more important the city is in the virtual agglomeration network. Beijing, Shanghai, and Shenzhen hold relatively high virtual agglomeration status. In addition, the thicker the line among cities, the closer the virtual agglomeration connection between the two cities.
Figure 8.
Community detection results.
4.3.4. Robustness
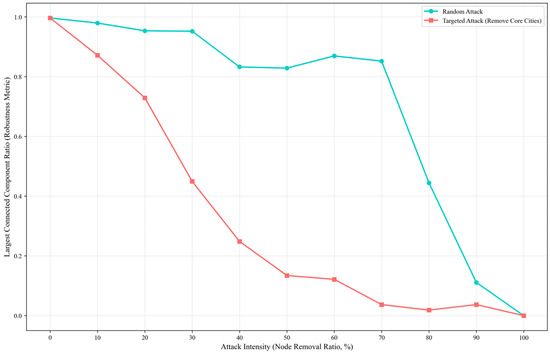
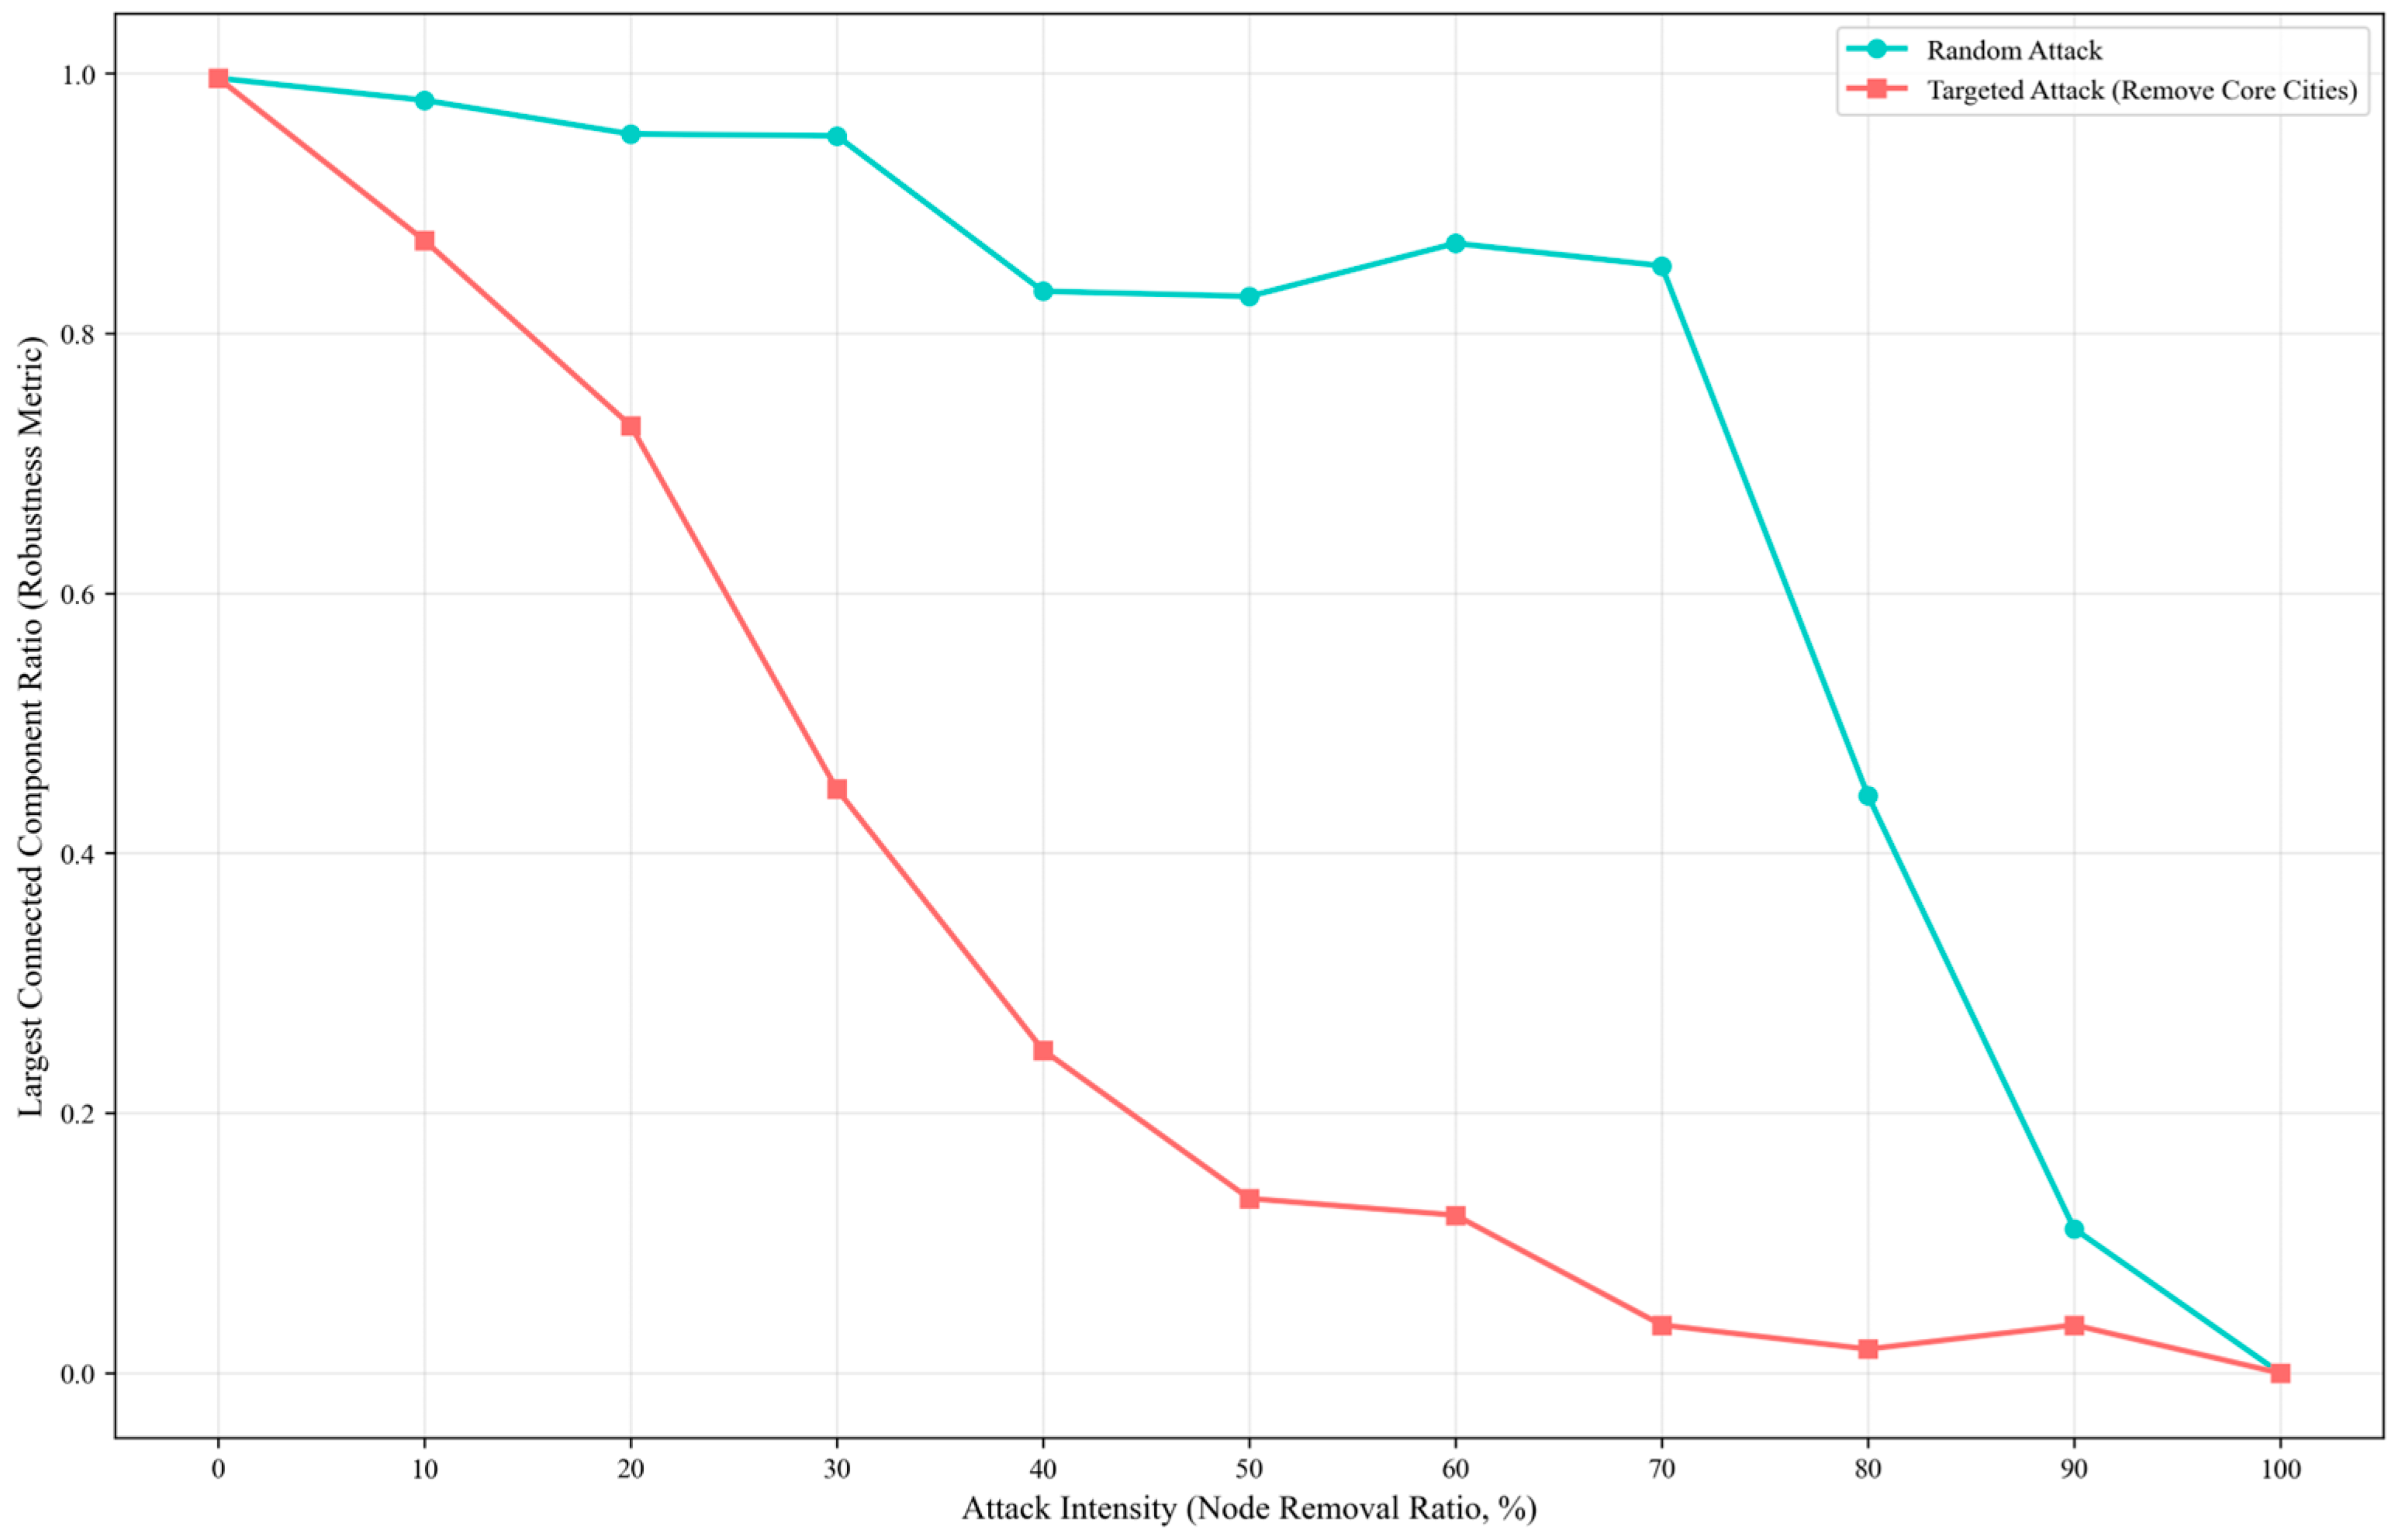
The results of the robustness test are shown in Figure 9. When 50% of the core nodes were removed, the robustness dropped to 0.134. However, when 50% of the nodes were removed randomly, the network robustness remained as high as 0.88. The virtual agglomeration network exhibits both vulnerability to targeted attacks and stability against random attacks. This result is consistent with the scale-free characteristics.
Figure 9.
Robustness analysis results.
4.3.5. Subnet Features
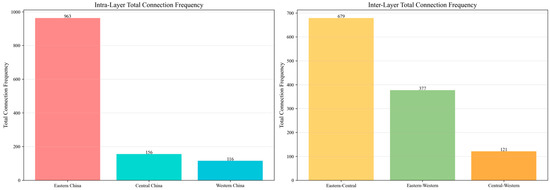
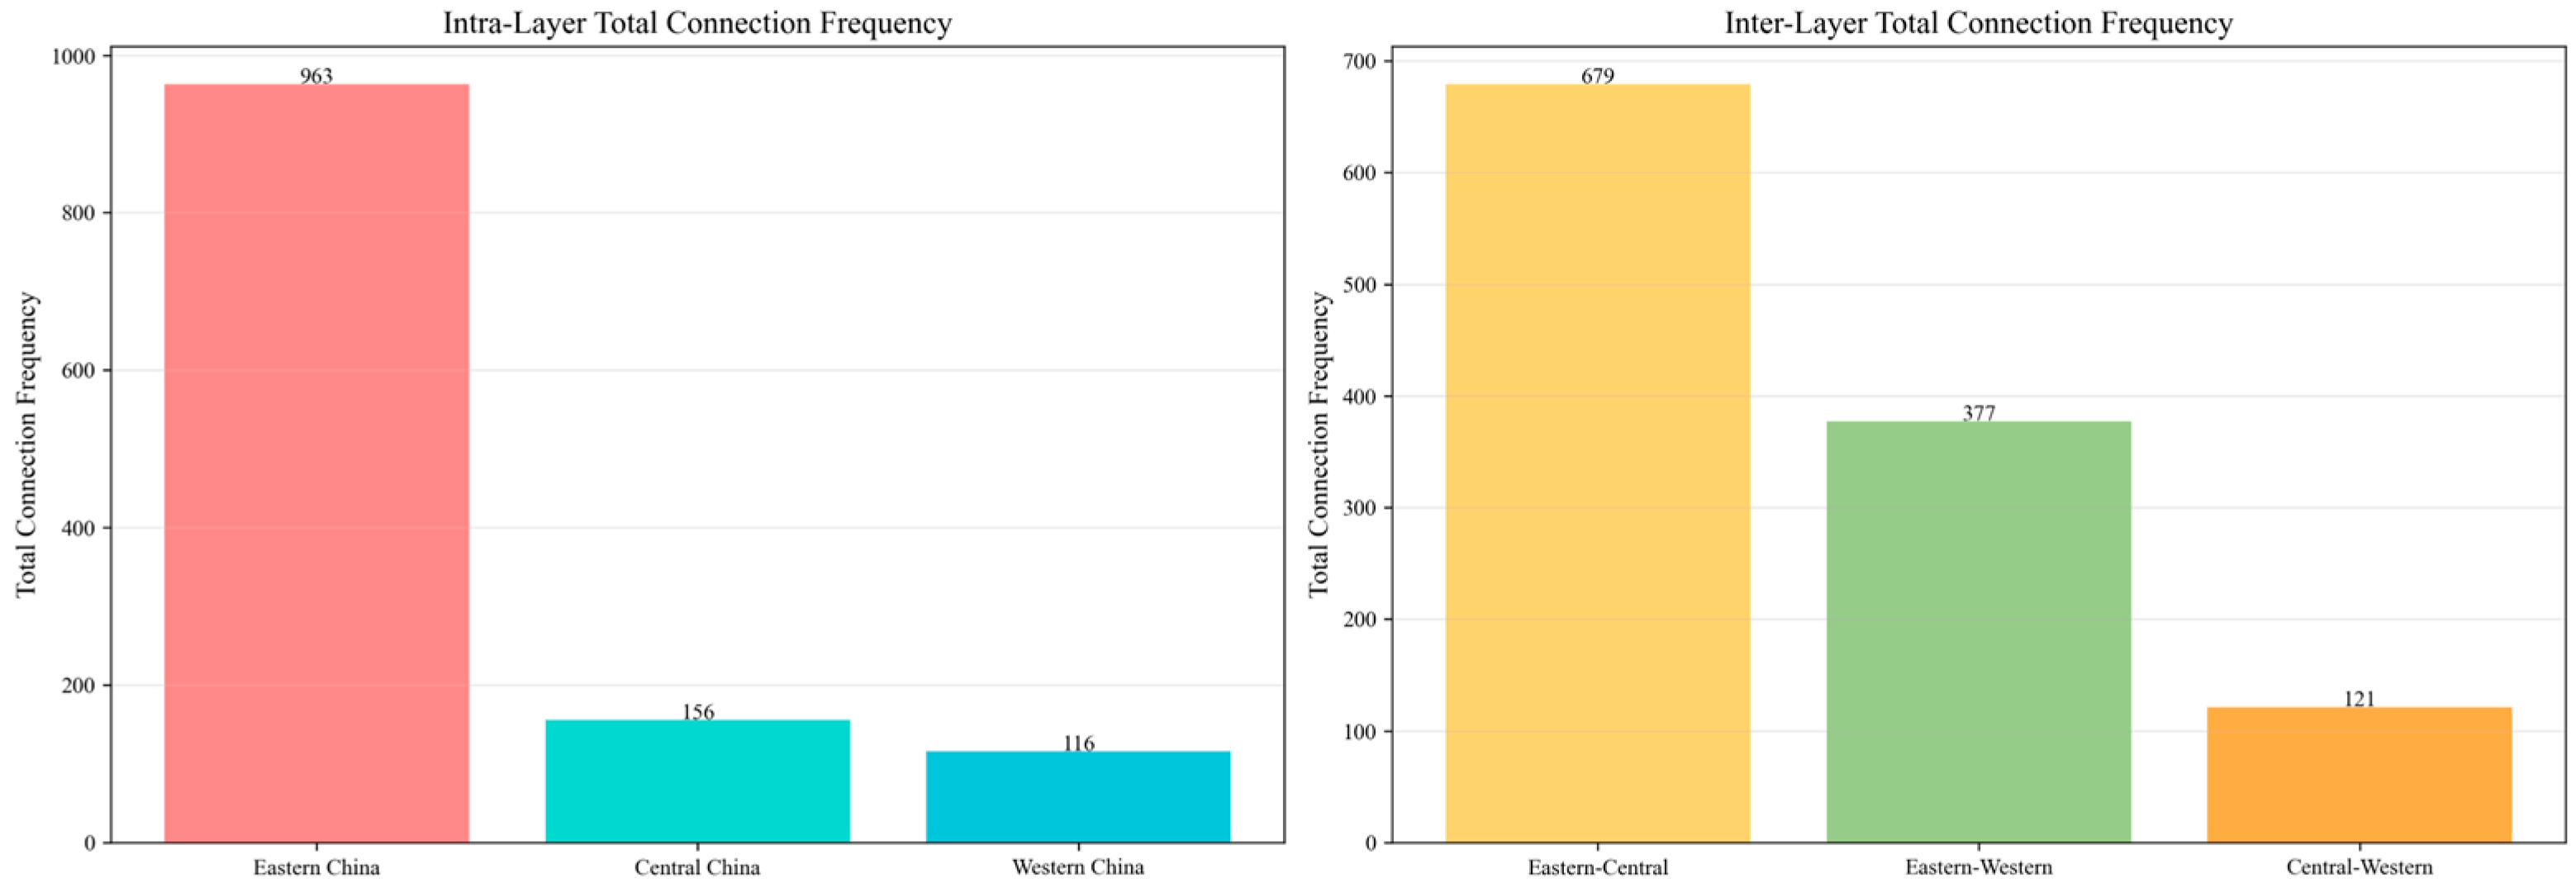
The results of the subnetwork analysis from a regional perspective are shown in Figure 10. The eastern region has the highest level of virtual agglomeration both within and among regions, followed by the central region, and finally the western region. This result reflects the uneven development of virtual agglomeration among regions.
Figure 10.
Results of subnetwork analysis.
5. Path Analysis
5.1. Variable Calibration
After determining the outcome variable and the condition variables, the fs/QCA method requires recalibration of each type of variable, transforming them into set-theoretic concepts. Calibration requires determining three types of values for each condition variable: full membership points, crossover points, and full non-membership points. In this paper, the 10th, 50th, and 90th percentile values of the sample data were selected for calibration. The results of variable calibration are shown in Table 3.
Table 3.
Results of variable calibration.
5.2. Analysis of Sufficient Conditions
Before conducting a driving path analysis, it is necessary to test the “sufficiency” of the conditional variables. If each individual condition variable does not produce the expected result, the fs/QCA method can be used to identify the path. The consistency of the condition variables was lower than 0.85 in Table 4, indicating that a single condition variable could not improve the level of virtual agglomeration. At the same time, the lack of a technology platform foundation will lead to the production of low virtual agglomeration level results. Therefore, this paper will no longer discuss the influencing conditions of low virtual agglomeration.
Table 4.
Sufficient condition analysis.
5.3. Conditional Configuration Analysis
The case study of conditional configuration analysis involves different cities. This article has a relatively large number of cases, constituting a large-sample study. In order to identify the main influencing paths, the article sets the frequency threshold at 2. The original consistency threshold is 0.8 to ensure the sufficient identification of configurations on the results. The PRI consistency threshold is 0.7, so as to avoid false configurations caused by simultaneous subset relationships. The fs/QCA 3.0 software was used to obtain the complex solution, intermediate solution, and simple solution for three types of conditional variables. Referring to the methods proposed by Ragin and Fiss, the condition variables of different combinations were graded according to their importance [39]. This article reports the union of intermediate solutions and simplified solutions. If a certain condition appears in both the intermediate and simplified solutions, it is a core presence; if it appears in neither, it is a core absence; if it appears only in one of the solutions, it is an edge condition. Table 5 shows the results of path identification. The symbol “⏺” in Table 5 indicates that the condition variable exists and is a highly important core condition. And the symbol “•” in Table 5 indicates that the condition variable exists but is of moderate importance. The symbol “ ” in Table 5 indicates that the condition variable is a peripheral absent condition. The blank space means that the presence or absence of the condition variable does not affect the outcome. There are five driving paths for virtual agglomeration. The solution consistency in the table is 0.853, indicating that among all the cities that satisfy these five paths, 85.3% of the cities exhibit a high level of virtual agglomeration. The solution coverage is 0.74, which indicates that the five types of pathways can explain 74% of the high-level virtual agglomeration. Both the solution consistency and solution coverage are above the critical values, indicating that the empirical analysis is valid.
Table 5.
Identification results of the driver paths.
5.3.1. Technology–Organization Path
This result is shown as driver path 1 in Table 5. Driver path 1 indicates that the combination of a technical platform foundation, technology funding support, industrial development foundation, and government attention collectively enhances the level of virtual agglomeration. Among these conditions, technology funding support and the foundation of industrial development play core facilitating roles. There are 20 case cities that can be explained by driver path 1. Among them, Wuhan is the city that most closely fits driver path 1. In terms of the technology dimension, Wuhan has two “dual-cross” platforms selected as national-level industrial internet platforms, ranking first in central China in terms of number. Among China’s first batch of 15 pilot smart factories, Wuhan has two enterprises successfully included. The number of smart factories in Wuhan ties with Shanghai for first place. Additionally, in 2023, Wuhan’s expenditure on science and technology was seven times the national urban average. In terms of the foundation of industrial development, Wuhan’s GDP in 2023 ranked among the top for sub-provincial cities.
5.3.2. Technology–Organization–Competition Path
This result is shown as driver path 2 and 5 in Table 5. Driver path 2 and 5 indicate that the technological platform foundation and financial support, along with the virtual agglomeration pressure from neighboring cities, help enhance the level of virtual agglomeration. In addition, the industrial development foundations in driver path 2 also plays a key facilitating role. In driver path 5, the degree of government attention acts as a facilitator, but its influence is not as significant as the industrial development foundation in driver path 2. Driver path 2 explains 20 case cities. Among them, as a typical example, Shanghai ranks first among all cities in technological and financial support, industrial development foundation, and peer competition pressure. In 2023, the peer competition pressure Shanghai faced in developing virtual agglomeration reached as high as 100.7. This high pressure prompted Shanghai to continuously accelerate the construction of new forms of virtual agglomeration. Driver path 5 explains 12 case cities. Among them, as a typical case in the eastern region, Luoyang is at the forefront in the construction of industrial internet platforms in the central and western regions. In addition, in recent years, Luoyang’s government has increased its focus on the digital and intelligent transformation of manufacturing, promoting the enhancement of the city’s virtual agglomeration level.
5.4. Analysis of Substitution Relationships
Based on five different driver paths, this paper further analyzes the differentiated adaptive relationships of technology, organizational, and environmental conditions in promoting virtual agglomeration.
5.4.1. Substitution Relationships Among Driver Path 1, 2, and 3
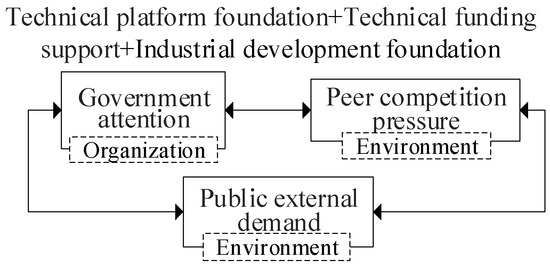
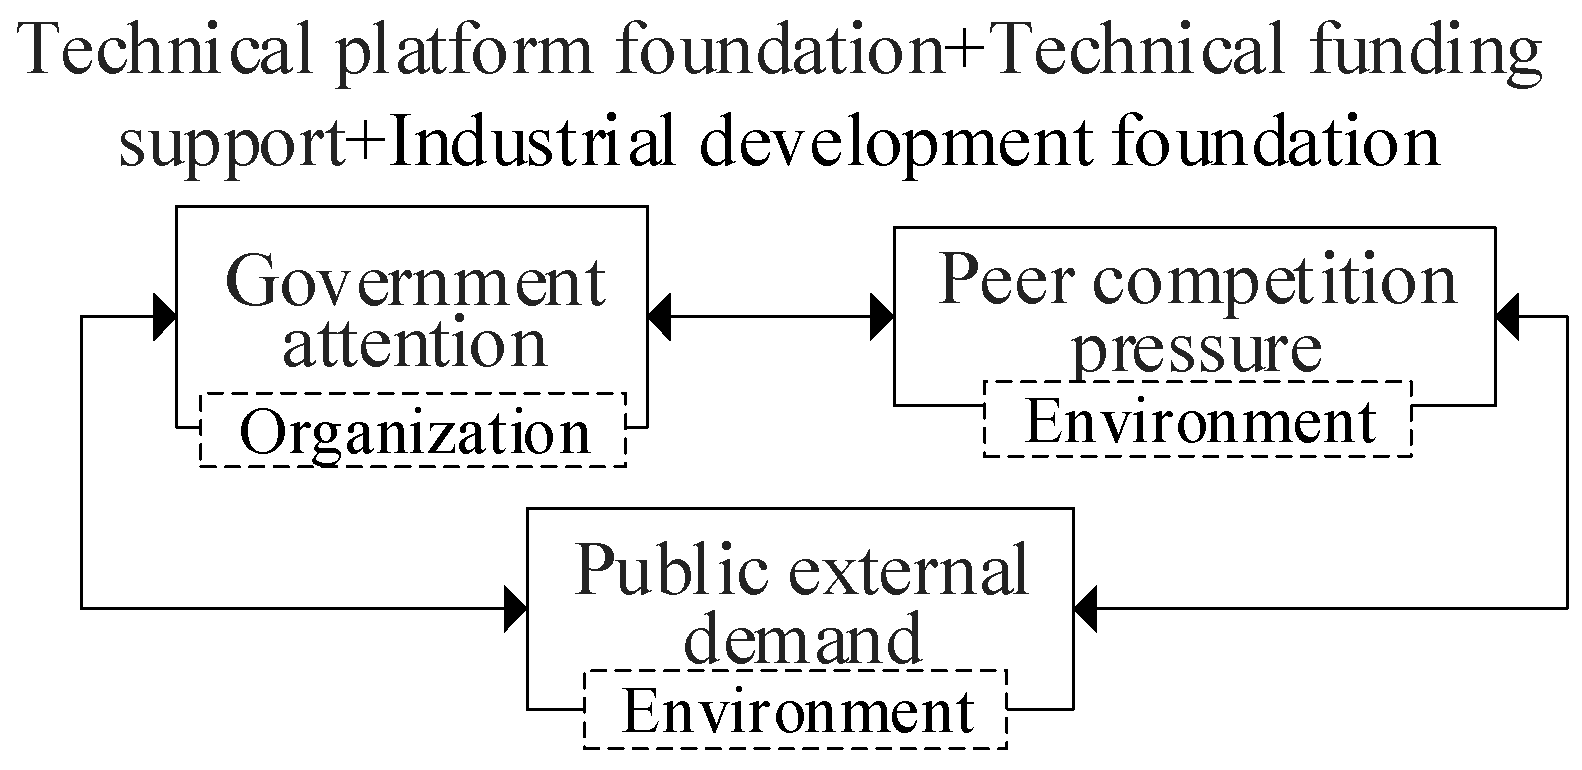
In these three driver paths, technological funding support and the industrial development foundation both play a core role in promoting the level of virtual agglomeration, while the technological platform foundation also exerts a marginal promoting effect. The substitution relationship among the three paths is shown in Figure 11. When government attention is insufficient, cities can substitute it by leveraging peer competitive pressure or external public demand to enhance the level of virtual agglomeration.
Figure 11.
Alternative relationships between organizations and the environment.
5.4.2. Substitutive Relationship Among Driver Path 3 and 4
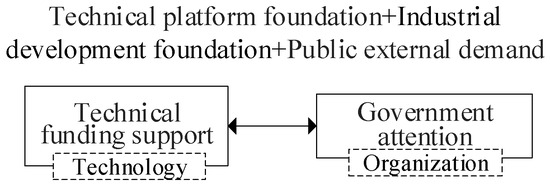
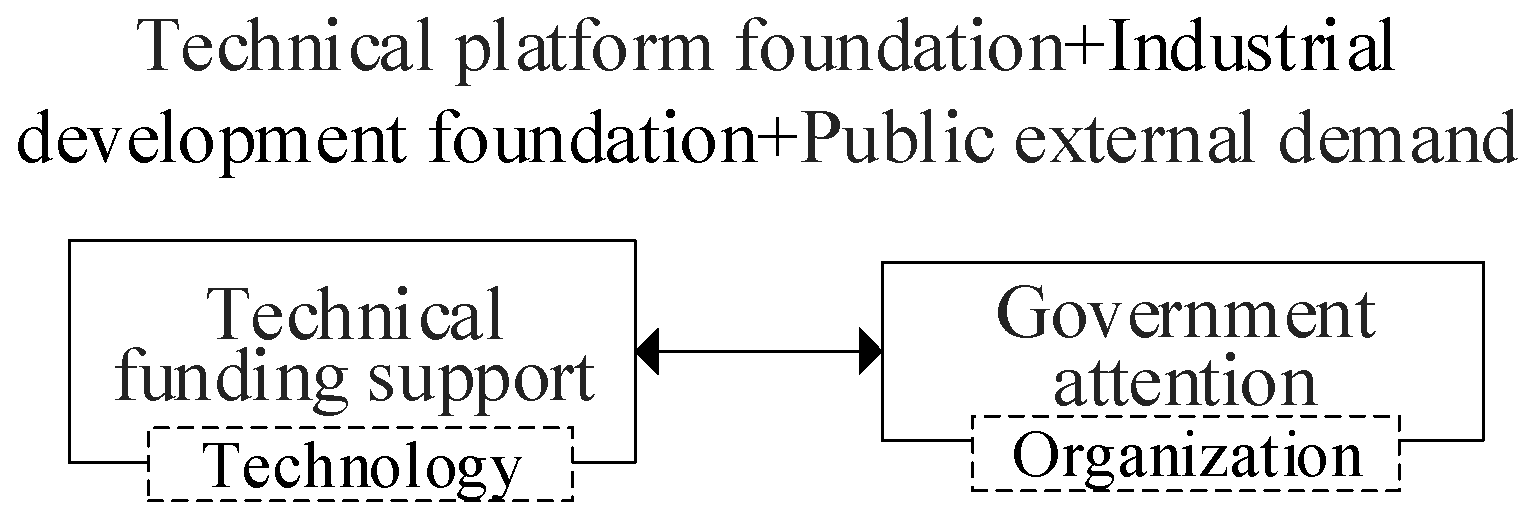
In both driving paths, the industrial development foundation plays a core promotional role. The technology platform foundation and external public demand also provide support. The substitution relationship between the two paths is shown in Figure 12. When the capability for technological and financial support is insufficient, the development of virtual agglomeration can be accelerated by stimulating other sources of capital through government-issued virtual agglomeration policies for the manufacturing industry.
Figure 12.
Substitutive relationship between technology and organization.
5.5. Regional Heterogeneity Analysis
This paper divides the samples into three categories: eastern, central, and western regions, and analyzes the regional heterogeneity of the driver paths for improving the level of virtual agglomeration under different conditions. The results are shown in Table 6. The meanings of the symbols in Figure 6 are consistent with those in Figure 5. In multiple cases of cities in the eastern region, the core dependent variable for the level of virtual agglomeration is technological and financial support. Cities in the central region rely on both Internet platform infrastructure and industrial development foundations. For the western cities, technological, organizational, and environmental conditions all play important promotional roles. Among them, governmental organization has a greater promotional effect on the virtual agglomeration level in the western region than in the eastern and central regions. Although there are significant differences in the improvement of virtual agglomeration levels across regions, alignment with the full sample path remains high. In most cities across different regions, the driver paths involve a complex interaction of technology, organization, and environment. This further confirms that the improvement of the virtual agglomeration level is the result of a complex interplay of multiple conditions.
Table 6.
Results of regional heterogeneity analysis.
6. Conclusions, Recommendations, and Limitations
6.1. Conclusions
This paper clarifies the formation mechanism, complex network characteristics, and driver paths of virtual agglomeration in the manufacturing industry. Firstly, this study proposes the connotations of virtual agglomeration, on this basis, meaning constructing a virtual agglomeration network and analyzing the network’s overall scale, individual-level, and structural characteristics. Finally, this paper develops a TOE framework and analyzes the driver paths using fs/QCA. Further analysis is conducted on the variable substitution relationships of the paths and regional heterogeneity. From the perspective of complex networks, this paper enriches the research on virtual agglomeration. At the same time, the findings provide theoretical support and practical evidence for the development of virtual agglomeration in the manufacturing industry.
6.2. Recommendations
Firstly, it is important to enhance the advantages of virtual agglomeration from a technical dimension. The manufacturing industry should reasonably leverage the pressure from market competition, turning competitive pressure into a driving force for development; making reasonable use of the pressure brought by market competition turns competitive pressure into development momentum. Improving innovation capabilities and resource allocation efficiency at various stages leverages the positive externalities of competition, and manufacturing enterprises can increase investment in new technology innovation and build cross-geographical collaborative innovation alliances.
Secondly, strengthen support for virtual agglomeration from an organizational dimension. The government should introduce more diverse and specific policies for the digital transformation of the manufacturing industry, providing increased policy and financial support for advanced and high-tech manufacturing sectors.
Thirdly, leverage consumer demand from an environmental dimension to drive development. The concentration of more suppliers on industrial internet platforms intensifies competition among different entities. However, the aggregation of demand information across different geographical spaces on the platforms helps create economies of scale. Therefore, companies should fully utilize digital technology tools to obtain market demand information. Additionally, enterprises can conduct quantitative market research. After acquiring massive amounts of consumer data, companies must process the information quickly to maximize the efficiency of data collection and analysis.
6.3. Limitations
This paper uses cross-administrative supply chain data to construct urban virtual agglomeration networks, in order to identify multiple network characteristics and propose paths for enhancing virtual agglomeration. This study helps to enrich the measurement of data sources and path research of urban virtual agglomeration. However, there are still limitations due to the single source of data in network construction. Using only supply chain data makes it difficult to analyze multi-layer network characteristics. In the future, we will collect more statistical and textual data based on the definition of virtual agglomeration, thereby enriching the data sources and measurement analyses of virtual agglomeration.
Author Contributions
Conceptualization, writing—original draft preparation, and revision, Q.Z.; supervision, X.W.; methodology, C.S.; software, J.L. All authors have read and agreed to the published version of the manuscript.
Funding
This work is supported by the Youth Fund Project of the Ministry of Education of China. [grant number 25XJCZH017]. This work also was supported by the Youth Fund Project of the Natural Science Foundation established by the Shaanxi Science and Technology Department of China. (Grant No. 2025JC-YBQN-1025), the Xi’an University of Science and Technology Philosophy and Social Sciences Prosperity Project (Grant No. 2025SY03), and the Youth Fund Project established by the National Natural Science Foundation of China (Grant No. 72404224).
Data Availability Statement
The data can be obtained by contacting the corresponding author.
Conflicts of Interest
The authors declare no competing interests.
References
- Rauniyar, K.; Wu, X.; Gupta, S.; Modgil, S.; Kumar, A. Digitizing global supply chains through blockchain. Prod. Plan. Control 2023, 35, 2327–2348. [Google Scholar] [CrossRef] [Scilit]
- Alfaro-Ureña, A.; Manelici, I.; Vasquez, J.P. The Effects of Joining Multinational Supply Chains: New Evidence from Firm-to-Firm Linkages. Q. J. Econ. 2022, 137, 1495–1552. [Google Scholar] [CrossRef] [Scilit]
- Hong, L.; Zhao, X.B.; Wang, S.Y.; Huo, H.; Zhang, W. Key Scientific Issues in Supply Chain Resilience and Security. Natl. Nat. Sci. Found. China 2023, 37, 418–428. [Google Scholar]
- Wilson, A. A statistical theory of spatial distribution models. Transp. Res. 2025, 1, 253–267. [Google Scholar] [CrossRef] [Scilit]
- Benner, M.J.; Waldfogel, J. Changing the Channel: Digitization and the Rise of “Middle Tail” Strategies. Strateg. Manag. J. 2023, 44, 264–287. [Google Scholar] [CrossRef] [Scilit]
- Zhang, Q.; Ru, S.; Cheng, Y.; Zhao, Z. Research on the impact of virtual agglomeration of the Chinese manufacturing on the efficiency of enterprise technological innovation. Technol. Anal. Strateg. Manag. 2024, 37, 2722–2736. [Google Scholar] [CrossRef] [Scilit]
- Passionate, G.; Secundo, G. From Geographical Innovation Clusters towards Virtual Innovation Clusters: The Innovation Virtual System; European Regional Science Association: Louvain-la-Neuve, Belgium, 2002. [Google Scholar]
- Sumita, R.N.; Sharon, H.; Jennifer, L.G.; Likoebe, M. Virtual work: Bridging research clusters. Annals 2019, 13, 308–341. [Google Scholar]
- Lin, J.; De Kloet, J. Platformization of the unlikely creative class: Kuaishou and Chinese digital cultural production. Soc. Media + Soc. 2019, 5, 1–12. [Google Scholar] [CrossRef] [Scilit]
- Zhao, C.M.; Ban, Y.H.; Li, H.B.; Liu, Y. Can virtual clustering promote the quality upgrade of urban export products? J. Econ. Manag. 2022, 44, 23–41. [Google Scholar]
- Liu, Y.; Wang, Q.; Ban, Y.H. Virtual Clustering, Knowledge Structure, and Urban Innovation in China. Financ. Trade Econ. 2023, 44, 89–105. [Google Scholar]
- Zhang, Q.; Ru, S.F.; Cheng, Y.Y. Research on the measurement and characteristics of virtual agglomeration based on social network analysis: Evidence from 29 manufacturing industries in China. Systems 2023, 11, 571. [Google Scholar] [CrossRef] [Scilit]
- Ren, W.W.; Liang, Q.H. Virtual Agglomeration and Domestic Value-added Rate in Exports of Chinese Firms—A Perspective of Upstream-downstream Linkages. J. Int. Trade 2022, 11, 53–68. [Google Scholar]
- Ning, K.; Xu, G.N.; Mu, X.Z.; Yang, H.R.; Qiao, Y.Y. How virtual clusters affect innovation performance: Evidence from global hydropower industry. J. Clean. Prod. 2022, 352, 131554. [Google Scholar] [CrossRef] [Scilit]
- Liu, S.; He, W.; Chen, X.; Xie, J. Virtual Agglomeration of Producer Services and the Changing Geography of Innovation Systems: Implications for Developing Countries. J. Serv. Sci. Manag. 2020, 13, 408–419. [Google Scholar] [CrossRef]
- Zhi, Y.; Yu, X. Digital industrial clusters, urban energy conservation, and carbon reduction—A quasi-natural experiment from China. Appl. Econ. 2025, 1–15. [Google Scholar] [CrossRef] [Scilit]
- Deng, P.; Wen, L.; Wang, D. Assessing the environmental impact of digital and manufacturing industry co-agglomeration: Dual perspectives of geographical and virtual agglomeration. J. Environ. Manag. 2025, 375, 124369. [Google Scholar] [CrossRef] [Scilit] [PubMed]
- Jabbour Al Maalouf, N.; Sarkis, N. The influence of virtual team-specific factors and communication factors on team performance. Learn. Organ. Int. J. 2025, ahead-of-print. [Google Scholar] [CrossRef] [Scilit]
- Xie, R.Q.; Zhang, W.D. An empirical study on the impact of platform environmental factors on knowledge sharing in virtual communities. Technol. Soc. 2022, 71, 102094. [Google Scholar] [CrossRef] [Scilit]
- Perez, C. Technological Revolutions and Techno-Economic Paradigms. Camb. J. Econ. 2010, 34, 185–202. [Google Scholar] [CrossRef] [Scilit]
- Jia, W.; Xie, Y.; Zhao, Y.; Yao, K.; Shi, H.; Chong, D. Research on Disruptive Technology Recognition of China’s Electronic Information and Communication Industry Based on Patent Influence. J. Glob. Inf. Manag. 2021, 29, 148–165. [Google Scholar] [CrossRef] [Scilit]
- Xu, Y.M.; Tao, Y.T.; Zhang, C.J.; Xie, M.; Li, W.; Tai, J. Review of Digital Economy Research in China: A Framework Analysis Based on Bibliometrics. Comput. Intell. Neurosci. 2022, 2022, 2427034. [Google Scholar] [CrossRef] [Scilit] [PubMed]
- Zhan, Y.R.; Wang, T.F.; Bi, X.C. Creative production in the digital age: A network analysis of the digital game industry in China. Geoforum 2024, 157, 104158. [Google Scholar] [CrossRef] [Scilit]
- Chau, K.; Tam, Y. Factors Affecting the Adoption of Open Systems: An Exploratory Study. MIS Q. 1997, 21, 1–24. [Google Scholar] [CrossRef] [Scilit]
- Olivier, T.; Martins, M.F. Literature Review of Information Technology Adoption Models at Firm Level. Electron. J. Inf. Syst. Eval. 2011, 14, 312–323. [Google Scholar]
- Vial, G. Understanding Digital Transformation: A Review and a Research Agenda. Manag. Digit. Transform. 2021, 13–66. [Google Scholar] [CrossRef] [Scilit]
- Zhang, Q.; Ye, Q.W. R2V platform’s business model reconstruction in the metaverse era: Based on network effects and bundling. Inf. Process. Manag. 2023, 60, 103503. [Google Scholar] [CrossRef] [Scilit]
- Chen, B.; Lin, H.; Shan, B.A.; Xiao, Y.D. Government investment in science and technology, digital transformation, and innovation in manufacturing enterprises. Financ. Res. Lett. 2024, 69, 106299. [Google Scholar] [CrossRef] [Scilit]
- Zhang, W.; Zhang, T.; Li, H.Y.; Zhang, H. Dynamic spillover capacity of R&D and digital investments in China’s manufacturing industry under long-term technological progress based on the industry chain perspective. Technol. Soc. 2022, 71, 102129. [Google Scholar]
- Lin, B.Q.; Teng, Y.Q. Decoupling of economic and carbon emission linkages: Evidence from manufacturing industry chains. J. Environ. Manag. 2022, 322, 116081. [Google Scholar] [CrossRef] [Scilit]
- Ding, Y.; Huang, C.; Feng, X. Exploring Causal Network Complexity in Industrial Linkages: A Comparative Study. Entropy 2025, 27, 209. [Google Scholar] [CrossRef] [Scilit]
- Lu, D.N.; Hui, E.C.M.; Shen, J.F.; Shi, J.Y. Digital industry agglomeration and urban innovation: Evidence from China. Econ. Anal. Policy 2024, 84, 1998–2025. [Google Scholar] [CrossRef] [Scilit]
- Li, Y. Technological Window, Technological Catch-up and Knowledge Spillovers: Evidence from China. Appl. Spat. Anal. 2025, 18, 118. [Google Scholar] [CrossRef] [Scilit]
- Jung, Y.R.; Lee, J.; Hwang, J. Noelia Lombardo Gava, Knowledge spillovers and innovation performance of the originator: The moderating effect of technological alliances. J. Innov. Knowl. 2024, 9, 100540. [Google Scholar] [CrossRef] [Scilit]
- Du, Y.Z.; Liu, Q.C.; Kim, P.H.; Meuer, J. Studying complex causal processes in technological innovation and entrepreneurship with set-theoretic mediation models. Technovation 2024, 134, 103015. [Google Scholar] [CrossRef] [Scilit]
- Li, B. Digital infrastructure and regional economic disparities: Evidence from the broadband China strategy. Econ. Innov. New Technol. 2025, 1–20. [Google Scholar] [CrossRef] [Scilit]
- Fan, J.; Zhou, L.; Liu, Y.; Xing, Z.; Feng, Q. New digital infrastructure, innovation cooperation networks, and entrepreneurship: Evidence from China. Electron. Commer. Res. 2025. [Google Scholar] [CrossRef] [Scilit]
- Xu, Z.; Xin, W.; Chang, S. Decision-making and analysis on digital transformation of battery manufacturing enterprises under heterogeneous subsidies of governments in a complex network environment. Expert Syst. Appl. 2026. [Google Scholar] [CrossRef] [Scilit]
- Ragin, C.C.; Fiss, P.C. Redesigning Social Inquiry: Fuzzy Sets and Beyond; University of Chicago Press: Chicago, IL, USA, 2008. [Google Scholar]

Disclaimer/Publisher’s Note: The statements, opinions and data contained in all publications are solely those of the individual author(s) and contributor(s) and not of MDPI and/or the editor(s). MDPI and/or the editor(s) disclaim responsibility for any injury to people or property resulting from any ideas, methods, instructions or products referred to in the content. |
© 2026 by the authors. Licensee MDPI, Basel, Switzerland. This article is an open access article distributed under the terms and conditions of the Creative Commons Attribution (CC BY) license.