


Abstract
This study analyzes hydrodynamics and mass transfer in a packed-bed reactor (PBR) by comparing two representations of bed geometry. The first is a pseudo-homogeneous approach using effective parameters, such as a radial porosity distribution. The second is a heterogeneous approach with resolved particles in the CAD domain. Both models simulate single-phase flow and mass transfer of urea and NH3 for an enzymatic reaction across a wide Reynolds number range . The pseudo-homogeneous model incorporated a detailed porosity distribution, derived from the heterogeneous model’s solids layout, which aligned well with literature, including classical correlations for radial porosity in packed beds. Additionally, hydrodynamic predictions were benchmarked against established pressure-drop correlations for confined packed beds, supporting the physical consistency of the particle-resolved framework. This non-uniform porosity informed local variations in permeability and dispersion coefficients. Velocity, pressure, and concentration fields from both approaches were compared to quantify predictive quality. Results indicate that a well-configured pseudo-homogeneous model can closely match heterogeneous model predictions, achieving similar accuracy in many flow regimes, with accumulated average relative errors below 8%. However, its performance varies with flow conditions. The optimal pseudo-homogeneous model (showing the highest predictive consistency with the particle-resolved simulations) was then used for transient simulations. These dynamic results support the preliminary sizing and conceptual design of a device for nutrient recovery from human urine for agricultural use, demonstrating the utility of simplified models for complex reactor design while acknowledging that full experimental validation under real urine-matrix conditions remains beyond the scope of the present study.
1. Introduction
The absence or inadequate implementation of water treatment in sanitary wastewater has negative impacts on human health, as well as the environment through the contamination of bodies of water, soils and food sources [1,2]. Furthermore, the consequent discharge of nutrients constitutes a risk of eutrophication in water bodies. The average person uses the toilet for urine four times per day; this means that 80% of our flush water or over 15,000 L of clean water each year per person is used just to get rid of urine. This amount of clean water is used only to transport urine to the sewer, where it becomes pollution.
On the other hand, urine and feces have attracted much attention in the treatability sector with a large range of literature exploring the agricultural fertilizer potential [3,4,5]. It has also been widely pointed out that the proper use of nutrients from sanitary waste as an alternative fertilizer source would have the advantage of mitigating environmental problems associated with its disposal and treatment. Physiological measurements show that an adult annually excretes between 2.5 and 4.3 kg of N, 0.7 to 1.0 kg of P, and 0.9 to 1.0 kg of K through urine [6,7,8], which can be recovered. According to reference [7], the amount of urine is 500 L per person per year, and it contains 4.1 kg of nitrogen, 0.4 kg of phosphorus and 0.89 kg of potassium per person annually. This means that to provide 1 kg of nitrogen, we only need about 2 kg of urea, and almost 150 L of urine.
There is strong evidence that urine has good characteristics as a fertilizer [9]. There are several studies where dehydrated urine has been successfully used as a fertilizer, such as for spinach crops [10], showing that the macronutrient content of the simulated fertilizer blends was comparable to that of blended inorganic fertilizers and that the urine could be applied without significant adverse changes in the soil’s bacterial structure. Similarly, reference [4] obtained similar results as mineral fertilizers using nitrified urine in hydroponic lettuce cultivation.
Catalyzed hydrolysis of urea to ammonia and carbon dioxide occurs at a rate approximately 1014 times the rate of uncatalyzed reaction [11]. Free urease and immobilized urease have been widely used in enzyme reactors for the conversion of urea present in fertilizer wastewater effluents or in the food industry for removal of urea from beverages and foods [12,13]. Regarding packed-bed reactors (PBR), reference [14] is highly relevant because they developed an isothermal, heterogeneous plug-flow reactor model for the urea hydrolysis by urease immobilized onto ion exchange resins used to estimate kinetic parameters. Recently, reference [15] conducted an optimization study of the Enzymatic biocatalysis of Urease. The optimized reactor processed 3.24 L of 4.00 M urea at an average volumetric productivity of 13 g/ L·h over 18 h and achieved an estimated productivity number of >17.4 kg urea processed per gram of immobilized urease.
Clearly, reactors for the hydrolysis of urea from human urine are of scientific interest. However, the models in these works are simple, with significant assumptions such as plug flow or perfect mixing, where hydrodynamics and their effect on mass transport are not considered. Nor are the geometric characteristics of the bed, the radial distribution of the void fraction, and its effect on momentum and matter transport explicitly considered. Such simplifications often represent conditions very different from the real working conditions of reaction systems, which are important in predicting the behavior of PBRs.
In this sense, ref. [16] recently demonstrated through CFD that incorporating hydrodynamics and packing geometry when investigating their effects on dispersion, conversion, and selectivity yields behavior significantly different from that of plug-flow models.
Reference [17] highlights predictive differences between simple effective media models and those that include explicit geometric characteristics of the packed bed. This work compares particle-resolved simulations and full-field measurements to determine the axial dispersion coefficient. The authors observed that determining this coefficient from the Residence Time Distribution (RTD) at the exit of a packed bed is complex. Obtaining good values is sensitive to boundary conditions in the interpretation model, and there seems to be some inaccuracy in determining the mean residence time. Also, the measured interstitial velocity is not fully consistent with the measured porosity. Clearly, much remains to be studied regarding the predictive capacity of PBR models, and research in this area is desirable.
In general, there are two types of approaches for modeling PBRs. The first group of models is the “effective media approach” (EMM). This type of model is useful for design tasks as it requires relatively little computational effort. However, details of the local transport phenomena are lost in this approach due to the simplifications in the representation [18]. In EMM, geometric characteristics and their effect on hydrodynamics and mass/energy transport in the bed are accounted for through transport coefficient corrections (permeabilities, effective diffusivity, dispersion, etc.), which are usually evaluated experimentally and through the inclusion of correlations representing the radial variation in porosity in the packed bed. This aims to improve the predictive capacity of the models, especially in systems where the ratio of reactor diameter to catalyst diameter is small. This has been identified as particularly important in the literature and has been the subject of extensive research [19,20]. EMM consists of averaged equations or mean field equations, such as the Darcy–Forchheimer equation or the extended Darcy–Forchheimer equation to model hydrodynamics [21,22] and averaged equations for the transport of mass and energy, which are very similar to local equations [23,24] but include effective transport coefficients to account for the presence of the catalyst and the geometric characteristics of the packed bed.
For tubular fixed-bed reactors with small reactor-to-catalyst diameter ratios , there are regions where porosity and therefore velocity vary radially and where the coupled effects of the reactor wall/free flow/bed are significant [25,26]. In these cases, it is more common to use the extended Darcy–Forchheimer equation, which allows for the incorporation of inertial effects, spatial velocity gradients, and coupled wall effects [21]. Although additional terms in Darcy extended equation can account for the increase in resistance to flow owing to the presence, geometry and distribution of particles, they cannot reproduce the radial variation in axial flow that is important in reactor modeling with a small ratio of [27]. To overcome this difficulty, the packed-bed structure is usually incorporated using a porosity distribution . In this context, several works in the literature show 2D models where the incorporation of functions for the radial variation in porosity and velocity improves the predictive quality of hydrodynamic models [20,25,28].
Effective properties such as permeability, effective diffusivity, and dispersion are typically calculated through experimentation and often do not explicitly reflect the specific particle arrangement of a fixed-bed reactor (FBR). However, studies have addressed the importance of radial variation in mass and energy transfer [29], and work has demonstrated that EMM simulations were found to be sensitive to dispersion and radial porosity distributions [26]. Therefore, a suitable approach to calculating reliable effective properties is desirable [29].
Recently, it has been reported that numerical homogenization provides an alternative to empirical correlations for calculating the effective properties of the porous medium based on unit cell simulations [30]. The numerical data generated from particle-resolved CFD simulations (PRCFD) of a unit cell (also known as the representative element volume, REV) is utilized to compute the effective properties [31]. The effective properties at different radial positions can be calculated by volume averaging the PRCFD data [29].
The data obtained from PRCFD of such a small unit cell can provide the effective properties that are valid in the regions of the bed that are away from the wall, where the global properties of the porous medium are adequately represented by a periodic cell. However, properties in the near-wall region are different from those exhibited in the core of the packed bed. Therefore, other approaches are required to estimate the effective properties in the near-wall region. The effective properties in the near-wall region are modeled using an exponential or oscillatory functions [27] that incorporate the radial porosity distribution of the bed and the known dependence of effective properties on porosity.
It should be noted that the property incorporating the effect of radial variation in bed properties is porosity, while other properties like permeability and dispersion have an average value for the porous medium, regardless of whether their evaluation is experimental or through the numerical homogenization techniques.
The second group of models is the particle-resolved model (PRM) or geometry-resolved approach [25]. PRM considers the actual geometric structure within beds composed of individual particles, thereby enabling detailed modeling of particle–particle and particle–gas interactions within an FBR. For FBR, the model considers the Navier–Stokes equation in the fluid phase and mass and energy equations for both the solid and fluid phases; the model usually requires exchange terms for the transport of matter and energy between phases. This type of model is useful because it can capture flow separation, allows for local inertial effects and laminar–inertial transitions, evaluates effective coefficients from the bed microstructure, helps improve correlations, reduces uncertainty in reactor models, and increases predictive capacity. This approach allows much more detailed study of fixed-bed phenomena at different lengths and timescales than effective or continuous medium approaches.
PRCFD simulations do not replace EMMs of reactors but enable analyses that make them possible and reliable. However, PRCFDs are very demanding in terms of time and computing capacity (∼3000 times the computational cost of PMM); therefore, the packed beds considered in the literature usually involve a small number of catalytic particles (∼103) [32,33]. Evidently, both PRM and EMM for FBR are useful and used for different tasks; however, it is necessary to verify the validity of [26].
Regarding the exploration of validity and reliability in FBR model predictions, we can find reference [27], which compares pseudo-homogeneous CFD models and PRCFD to describe single-phase liquid hydrodynamics in PBR. They quantified differences in local and macroscopic velocity predictions and assessed the limitations of pseudo-homogeneous approaches. A set of Navier–Stokes equations was solved in the interstitial void space of two representations of packed beds: one random and one ordered. They implemented two pseudo-homogeneous models, the Darcy’s Law (DL), and Navier–Stokes–Darcy–Forchheimer (NSDF), testing both constant average porosity and radial porosity distribution . They found that the pseudo-homogeneous models accurately predict average axial velocity trends, and including does not significantly improve local velocity predictions and, consequently, local differences in other fields, such as concentration and temperature, are to be expected.
Recently, ref. [28] employed the Volume Averaging Method (VAM) to develop a generalized pseudo-continuous model for single-phase hydrodynamics in packed-bed reactors with low tube-to-particle diameter ratios , where classical models typically fail. The model includes effective descriptors (void fraction, apparent permeability, and total inertial dispersion) originating from mathematical averaging. The model reproduces well the average velocity profiles obtained by PRCFD and experimental pressure drop data. The model depends on obtaining effective descriptors and, therefore, on detailed CFD results and the respective post-processing of local fields. It is important to highlight that this was performed with non-reactive flow (non-multicomponent flow) and with regular geometry for the packed bed.
Resolved particle models are still computationally expensive and their applicability for real reactor scales is unpractical; thus, EMM remains an alternative for design tasks. Therefore, the proper selection of the hydrodynamic model is of great importance, but it is necessary to extend the study of proper pseudo-homogeneous model selection to systems representing reactive conditions. This is to develop a highly predictive model for PBR under reactive conditions that considers the effect of the radial variation in porosity in the bed on both hydrodynamics and mass transport.
Unlike previous studies that treat urea hydrolysis as a purely kinetic phenomenon, this work integrates a rigorous hydrodynamic assessment by comparing two distinct modeling frameworks. The particle-resolved (heterogeneous) model functions as a high-fidelity numerical approach that captures intricate flow patterns and local gradients around individual catalyst particles. In contrast, the pseudo-homogeneous approach is strengthened here by incorporating non-uniform radial porosity distribution—based on De Klerk correlation—which aims to bridge the gap between model simplicity and physical reality [34,35]. Furthermore, this work investigates the influence of radial porosity variations on additional effective transport coefficients and assesses their combined impact on the predictive accuracy of pseudo-homogeneous models. From a practical engineering perspective, this comparison is vital for computational optimization. Since robust reactor design requires extensive iterations and transient simulations, delineating the accuracy limits of simplified models ensures that large-scale optimizations can be performed with confidence. This approach could significantly reduce computational cost time while maintaining the integrity of the hydrodynamic and mass transfer predictions, providing a reliable foundation for scaling and design of urea hydrolysis systems.
This work proposes the treatment and use of urine as fertilizer. To this end, the design of a PBR is explored to allow the reuse of urea contained in urine from public urinals and its conversion into usable fertilizer. The PBR must have appropriate dimensions to be compatible with the drainage system. For the reactor design, a reliable EMM will be used, which appropriately predicts velocity and concentration profiles across the packed bed at different velocity ranges . The EMM under reactive conditions can be obtained based on the analysis developed in reference [27]. Hence, an analysis of hydrodynamic behavior and mass transport is carried out in a packed-bed reactor with spherical catalysts packed in ordered and random arrangements. Two different models were implemented: (i) a pseudo-homogeneous model incorporating the effect of radial porosity variation and (ii) a heterogeneous model, seeking equivalence in the predictive capacity of both models regarding velocity, pressure, and concentration fields.
2. Materials and Methods
2.1. Geometrical Bed Model
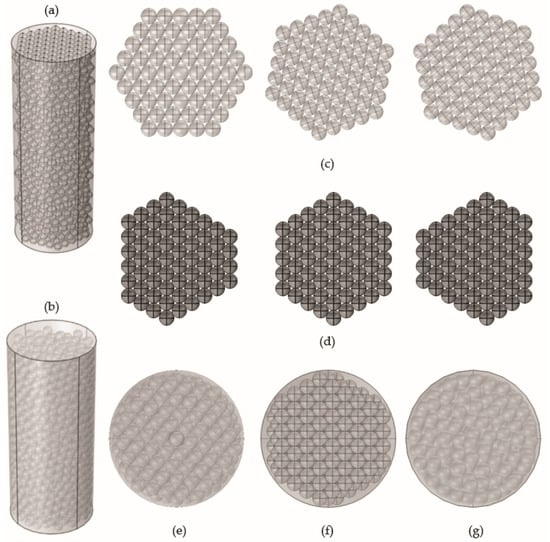
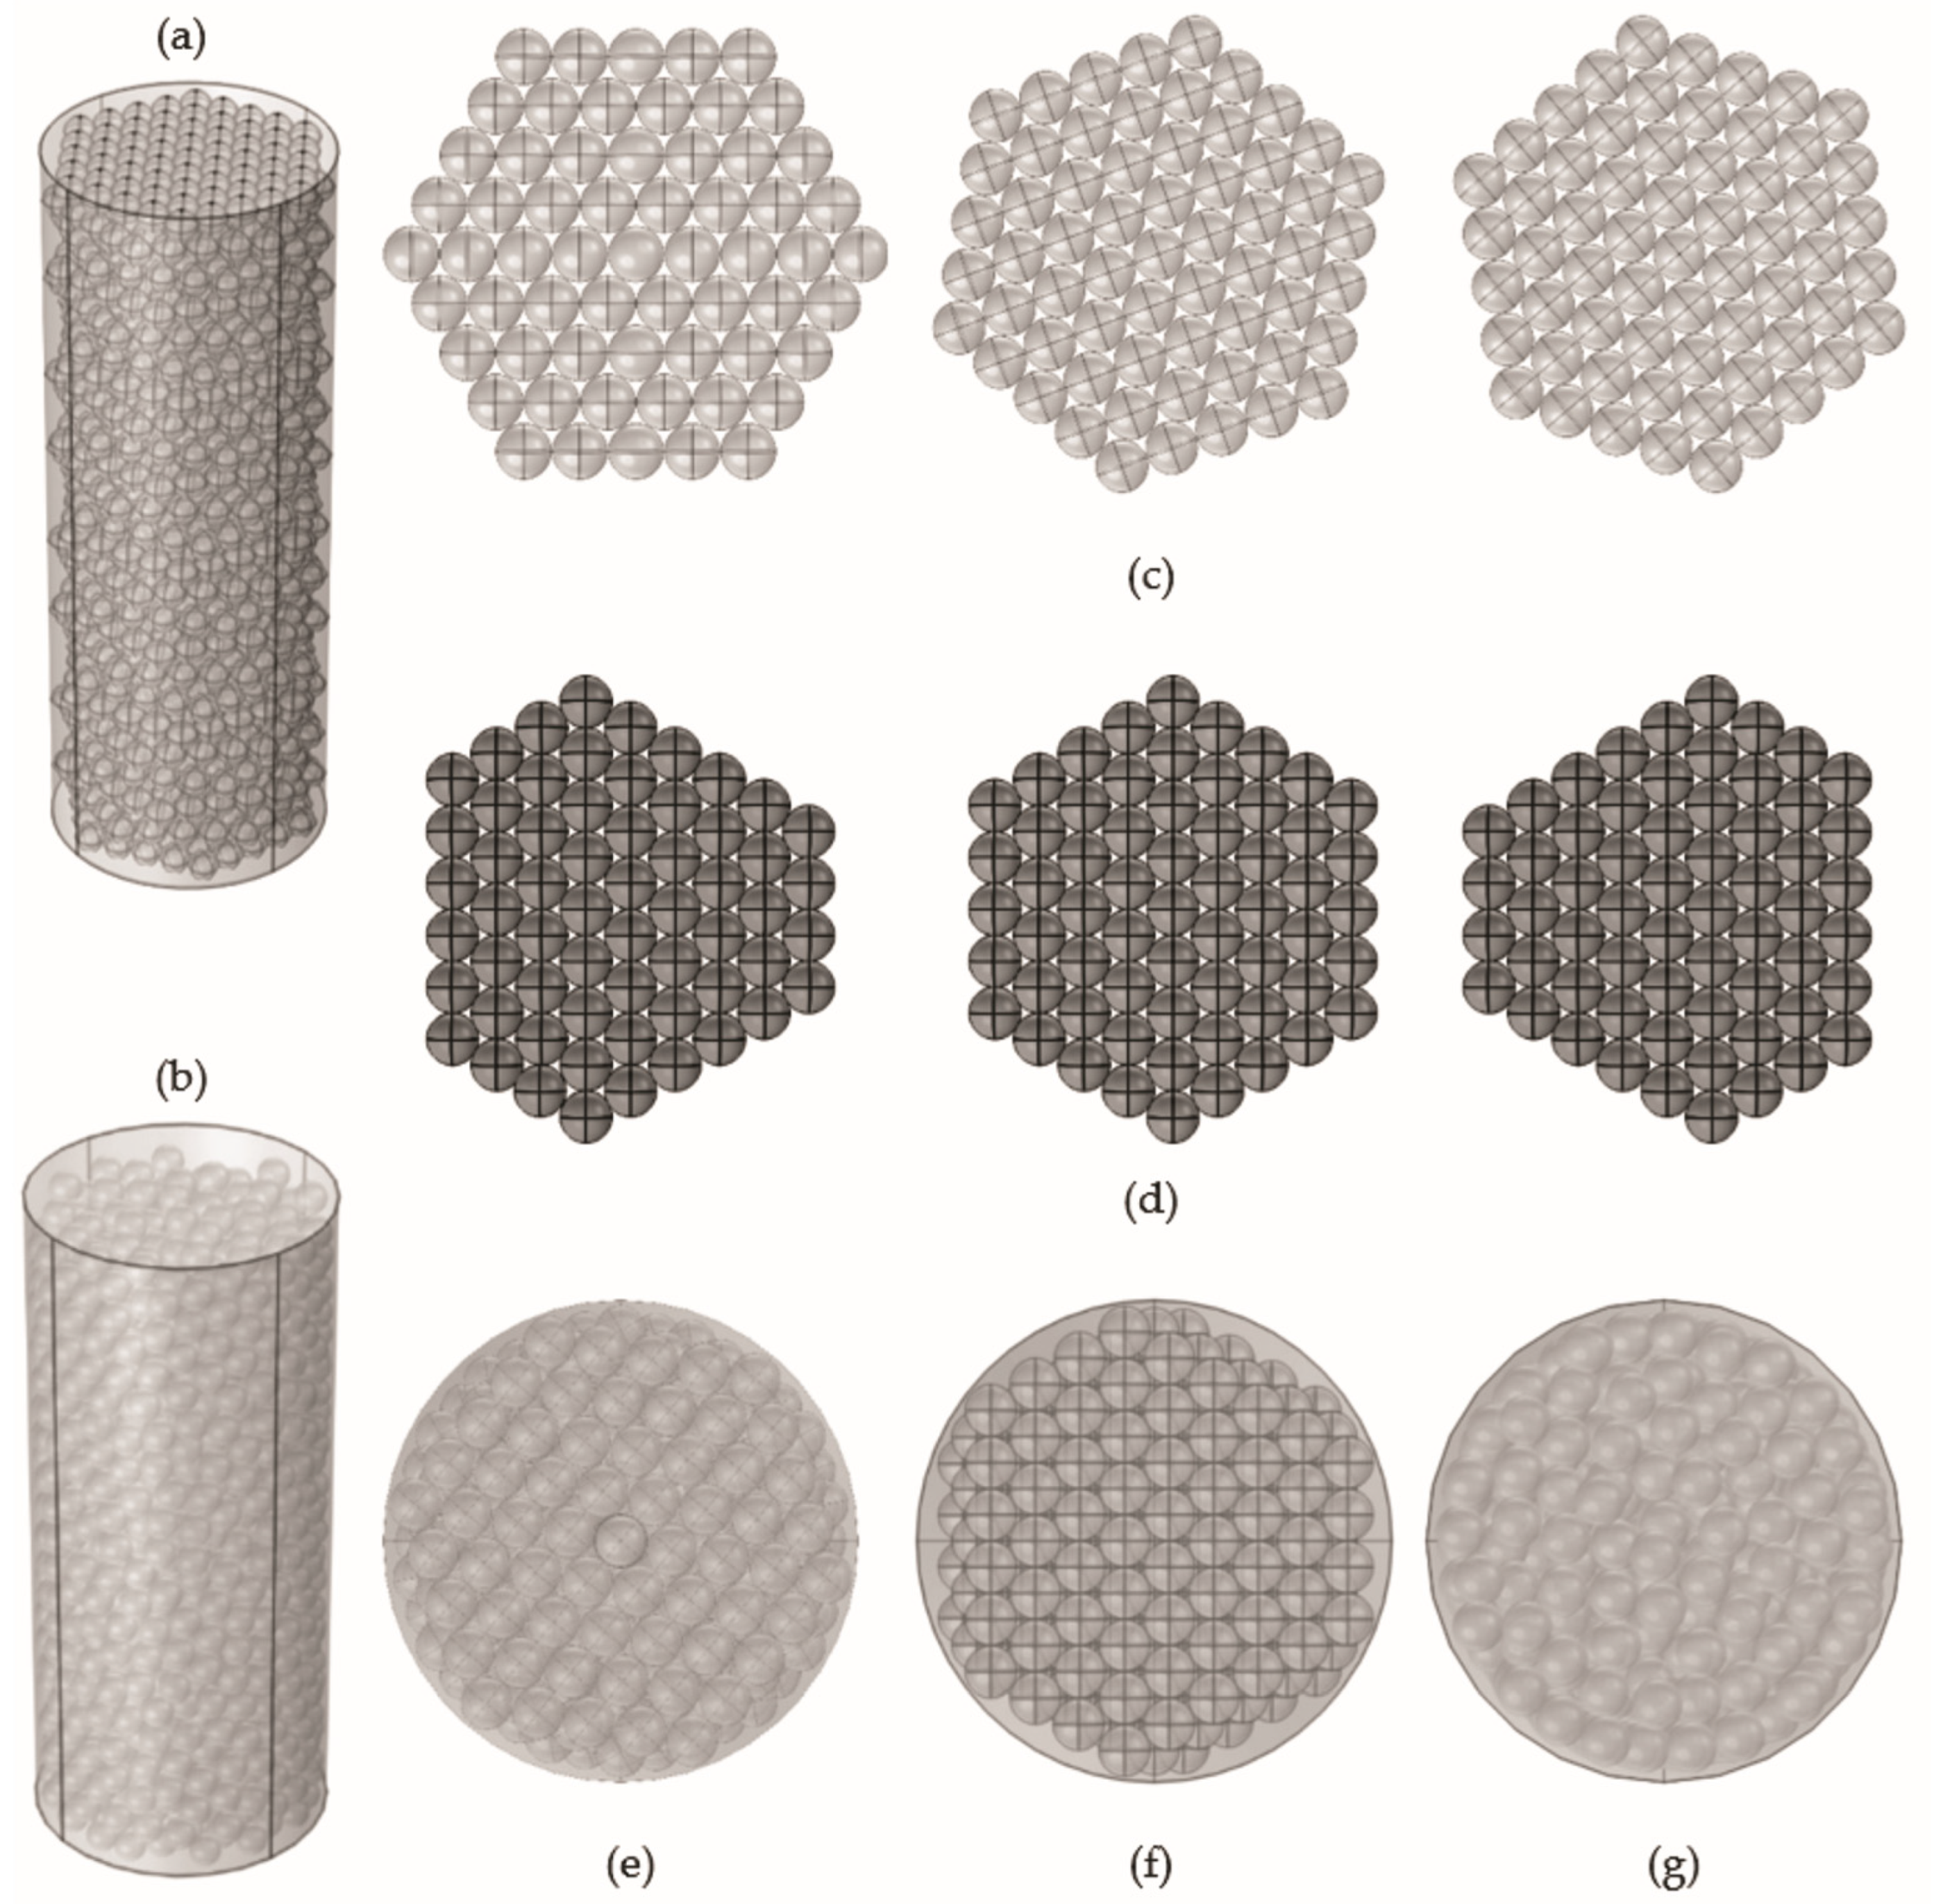
Two heterogeneous reactor geometries were developed for which the interstitial fluid domains were built (Figure 1), one corresponding to an ordered PB and the other to a random one. Both geometrical models of the heterogenous PB had an 11.4 cm length, 5.08 cm (2 inch) of diameter, a void fraction of 0.486, and contained 1432 non-porous catalyst spherical particles of 0.54 cm of diameter.
Figure 1.
Geometric details of the constructed heterogeneous models. (a) Ordered heterogeneous bed; (b) random heterogeneous bed; (c) variant with the first three layers in a hexagonal arrangement; (d) variant with the first three layers arranged per [27]; (e) top view of (a); (f) ordered tetrahedron arrangement; (g) random tetrahedron arrangement.
In Figure 1a and Figure 1b a full view of the reactor with ordered packed bed in hexagonal arrangement and the random heterogeneous bed can be appreciated, respectively. Figure 1c shows the details of the first three layers used for the construction of the ordered heterogeneous model with hexagonal arrangement, while Figure 1d shows the first three layers in tetrahedron arrangement, used in the authors’ previous work [27]. Figure 1e, Figure 1f and Figure 1g show the top view of the reactor for the case of ordered heterogeneous model in hexagonal arrangement, the ordered heterogeneous model in tetrahedral arrangement, and the random heterogeneous model, respectively.
For the ordered packed bed, the spheres were arranged in a hexagonal close-packed (HCP) lattice, with a uniform surface-to-surface separation distance of between neighboring particles. The particles were distributed in a hexagonal pattern between neighboring particles. The particles were distributed in a hexagonal arrangement with 24 layers, generated by repeating a three-layer pattern of 60, 61, and 60 particles, respectively, which were arranged to minimize channeling regions (Figure 1a,b,e). This geometry is based on a tetrahedral arrangement [27], as shown in Figure 1d.
The randomly packed bed was built using a non-rigorous Discrete Element Method (DEM) implemented in the open-source software Blender 3.2. In this simulation, particle trajectories are determined by solving the Newton–Euler equations of motion for each particle, where normal and tangential forces due to particle–particle and particle–wall interactions are considered. The particles were treated as idealized rigid bodies that suffer no deformation due to these interactions. Further software and implementation details have been discussed in previous studies [27,36].
For both the randomly packed bed and the ordered packed bed, a shrink factor of 0.002% was applied. This shrink factor facilitates mesh generation in the vicinity of particle contact points. Shrinking the particles removes the narrow gaps at the contact points between spheres, improving mesh quality. The literature on this practice shows that shrink factors below 1% do not significantly affect the final porosity and pressure drop in packed beds [25].
Given that this study focuses on (a) the analysis and comparison of hydrodynamic predictability through the packed bed using a pseudo-homogeneous and a heterogeneous model, and (b) the predictability of heterogeneous and pseudo-homogeneous mass transport models for an enzymatic surface reaction coupled with hydrodynamics, the solid domain itself is not required. Therefore, the geometry considered is the interstitial void space generated by both the ordered and random packing models. In this sense, the fluid domain was constructed by subtracting the volume of the solid phase from the total reactor volume.
2.2. Description of the Implemented Cases Studies
This work analyzes the ability to predict the hydrodynamic behavior of a packed bed with a small ratio using the Navier–Stokes–Darcy–Brinkman–Forchheimer (NS-DBF) equation, coupled with mass transport, and considering a surface enzymatic reaction on particles. The predictive quality of hydrodynamics and mass transport behaviors was analyzed at different Reynolds numbers , as well as the effect of incorporating or not incorporating a radial distribution of porosity of the packed bed. Additionally, given that the effective transport coefficients that appear in the pseudo-homogeneous hydrodynamic and mass transport models for the reactor (permeability and dispersion) exhibit an important dependence on the porosity of the bed, it was considered to explore the effect of the porosity radial distribution on these effective transport coefficients, and consequently, on the predictions of both the hydrodynamic and the mass transport behaviors. Table 1 shows details of implemented case studies in the first part of this work.
Table 1.
Studies implemented to investigate the applicability of PHM, coupling hydrodynamics with mass transport considering the enzymatic and surface reaction in a non-porous catalyst.
Finally, given that variations in the Reynolds number were made, it was also decided to explore whether it was possible to identify at what values of the Reynolds number the Darcy, Brickman and Forchheimer terms of the NS-DBF equation were significant in the predictive capacity of the model, both in the prediction of hydrodynamic fields (velocity, pressure), as well as in concentration fields for the study of urea hydrolysis. All cases, both heterogeneous (ordered and random) and pseudo-homogeneous models (from case A to B), were implemented for the Reynolds numbers (Re): 5, 10, 20, 30, 50, 100, 200, 300, 350, 400, 500, 600, 700, and 750. To evaluate the predictive capacity of the PHM, comparisons were made with the respective PRS for both random and ordered packed beds.
2.3. Device Design (Considerations/Conditions)
In the second part of this investigation, an analysis and respective selection of the best cases in the predictive capacity of the PHM was carried out. Then, the cases with best prediction were used to size a PBR capable of efficiently converting urea from human urine. As the device is planned to be installed in public buildings, it must be incorporated without major modifications to the drainage system, then PBR has the typical diameter of sanitary piping (2 in), and the length will be restricted to be a few meters. The simulation considers conditions close to those of a urinal flush in a public building.
2.4. Input Conditions of Feed to Be Treated
The concentration of urea in human urine varies according to the diet of the individuals, but it has been found to vary between the limits of 149.1 and 454.2 mol/m3 [37]. The average urine volume for Mexican adults is 0.313 L and occurs in the morning [38]. In this work, 1 L of water used to flush the urinal was considered, therefore it has been estimated that the maximum concentration of urea diluted in 1 L of water that will enter the system is 191.66 mol/m3.
2.5. Porosity Model
In packed reactors where the ratio is small, there are significant differences in the porosity near the reactor walls with respect to the porosity in regions far from the wall (bulk). Therefore, the incorporation of radial porosity distributions has been proposed to improve the predictability of the models. In general, there are oscillatory correlations and exponential correlations to predict and define the packing structure through the radial distribution of the average porosity of packed bed. Vortmeyer’s correlation [35] has also been shown, which considers an exponential decay of the radial variation in porosity fitted better to the porosity distribution of the ordered packed bed, while the oscillatory de Klerk’s correlation [34] of the radial variation in porosity best fits the porosity distribution of the randomly packed bed [27]. In the present work, the de Klerk’s correlation was selected, Equation (1), since the oscillatory representation of porosity is appropriate for the case of beds with a small N values, where the area close to the wall that presents a large radial variation in porosity and the region that presents greater flow channeling are large with respect to the entire radius of the column.
Correlations with exponential decay are appropriate in beds. Where Re is the Reynolds number, is the dimensionless distance to the column wall, is the average porosity or void fraction, is the column radius, r is the radial coordinate, N is large and, where the region close to the wall that presents the greatest variations in porosity, is small in relation to the radius of the column.
2.6. Hydrodynamics Models
The selection of the EMMs with the best hydrodynamics and mass transport prediction was carried out by comparison with two PRMs (random and ordered bed). Therefore, two different models, PHM and PRM, were implemented where the hydrodynamics and mass transport prediction were tested.
2.6.1. Pseudo-Homogeneous Model (PHM)
To predict hydrodynamics using EMM or PHM, the Navier–Stokes–Darcy–Brickman–Forchheimer equation (NS-DBF) was used [39], such as is expressed in Equations (2) and (3),
where the terms from (1) to (6) in Equation (3) correspond to accumulation, convective transport, the pressure gradient, molecular transport and the force of gravity, while terms (7) to (9) correspond to the terms of Darcy, Forchheimer and Brickman, and are the intrinsic average velocity and pressure, respectively. In addition, , and are the Forchheimer coefficient, the permeability of the porous medium, and the Brickman effective viscosity [40], respectively. and can be estimated by Equation (4) [41].
2.6.2. Particle-Resolved Model (PRM)
To predict hydrodynamics considering the details of the fluid flow through the interstices of the packed bed, the detailed geometry of the packed bed, and the Navier–Stokes equation were used (see Equations (5) and (6)).
Equation (6) consider the accumulation, convective and viscous momentum transport, the pressure gradient, and the force of gravity. Where and are the punctual and local velocity and pressure of the fluid phase, respectively.
2.7. Mass Transport Model and Consideration
To select the effective medium model with the best hydrodynamics and mass transport predictions, an EMM and PRM were implemented and compared for the urea hydrolysis in a PBR.
2.7.1. Pseudo-Homogeneous Mass Transport Model
For the case of pseudo-homogeneous model, the NS-DBF Equation (3) is solved in conjunction with Equation (7), which corresponds to an effective medium for the mass transport with enzymatic and surface reactions.
Equation (7) includes the terms of accumulation and the convective, dispersive and the enzymatic volumetric reactions. Here and are the intrinsic average of concentration and reaction rate, respectively; in addition, is the dispersion coefficient which considers the effective diffusion through the bed and hydrodynamic dispersion (refers to Equation (8)).
It is worth mentioning that Equation (7) is coupled to the NS-DBF equation, Equation (3), through the average intrinsic velocity field .
2.7.2. Resolved-Particle Model for Mass Transfer
For the case of heterogeneous mass transport model, the model includes mass accumulation, and convective and diffusive mass transport, as is represented by Equation (9). Here, the reaction is considered as a boundary condition, given that the enzymatic reaction takes place at the solid–fluid interphase.
where is the local concentration and is diffusivity of species A in the reaction mixture. Equation (9) is coupled to the Navier–Stokes equation, Equation (6), through the local velocity field of the fluid phase .
2.8. Reaction Rate for Pseudo-Homogeneous Model (PHM)
For the PHM, it is considered that the enzymatic reaction is carried out in the entire pseudo-phase constituted by both the fluid and the packaging. For this reason, reaction rate is the volumetric term in Equation (7), and specifically this model considers the intrinsic averaging reaction rate, ; also, urea concentrations are the intrinsic average urea concentration . Enzyme velocity as a function of substrate concentration often follows the Michaelis–Menten equation (Equation (10)):
where is a constant for a given enzyme and is the substrate concentration at 1/2 νmax. is a measure of substrate required for effective catalysis to occur and is an estimate of the equilibrium constant for substrate binding to enzyme. Small KM means tight binding and high means weak binding. is the theoretical maximum rate constatation, and it is a constant for a given enzyme. To reach would require that all enzyme molecules have tightly bound substrate [42]. The kinetic parameters selected in this work, and , have the values of 0.52 mM and 1.03 mM/min, respectively [11].
2.9. Reaction Rate for Heterogeneous Model (HM)
In the heterogeneous model, where the geometry of the packed bed is explicitly considered, the enzymatic reaction takes place on the surface of the particles that form the packed bed; therefore, the reaction term is not a volumetric term as would appear in the transport equation for case of the pseudo-homogeneous mode; rather, the reaction term is superficial and is incorporated into the model through a boundary condition. The superficial reaction term is given by Equation (11).
where and are the surface reaction rate and the local substrate concentration in the fluid phase. The volumetric and surface terms of the reaction rate are related by Equation (12).
represents the superficial area per unit volume which is given explicitly by Equation (13).
where is the so-called averaging volume used in the VAM [11,43] and represents the area of the -interface contained within .
2.10. Boundary and Initial Conditions (Steady State Simulations)
For steady state simulations, where the predictive capacity of the NS-DBF equation is evaluated, the boundary conditions for the PHM (Equations (2), (3), (7) and (10)) and PRM (Equations (5), (6), (9) and (11)) are shown Table 2.
Table 2.
Boundary conditions for PRM and PHM in steady state.
2.11. Transient Simulations
In the second part of this study, we seek to find the design of a PBR with spheres of = 0.5501 cm, on which the urease enzyme is supported superficially. The reactor must allow the removal of urea from human urine, considering size restrictions according to common sanitary facilities ( in and a few meters in length). The bioreactor feeding takes place once the urinal drain discharge is activated. In this sense, velocity and concentration of the reactor inlet are modeled through a rectangle pulse that allows going from zero value of velocity and substrate concentration to the maximum values of in a couple of seconds. The feeding pulse is represented by Equations (30) and (32), where s1, s2 are the pulse functions for which w = 2 s is the width of the rectangle and is a parameter that controls the transition between the zero value and the maximum value of the rectangle. Table 3 displays the boundary and initial conditions for PRM and PHM in transient state.
Table 3.
Boundary and initial conditions for PRM and PHM in transient state.
Finally, Equations (35)–(42) show the initial conditions used for the non-steady state simulations implemented to determine the length required by the bioreactor.
3. Results and Discussion
3.1. Porosity Model
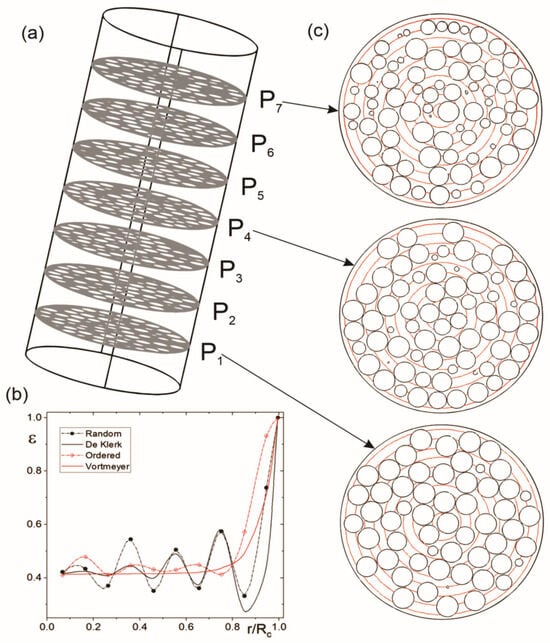
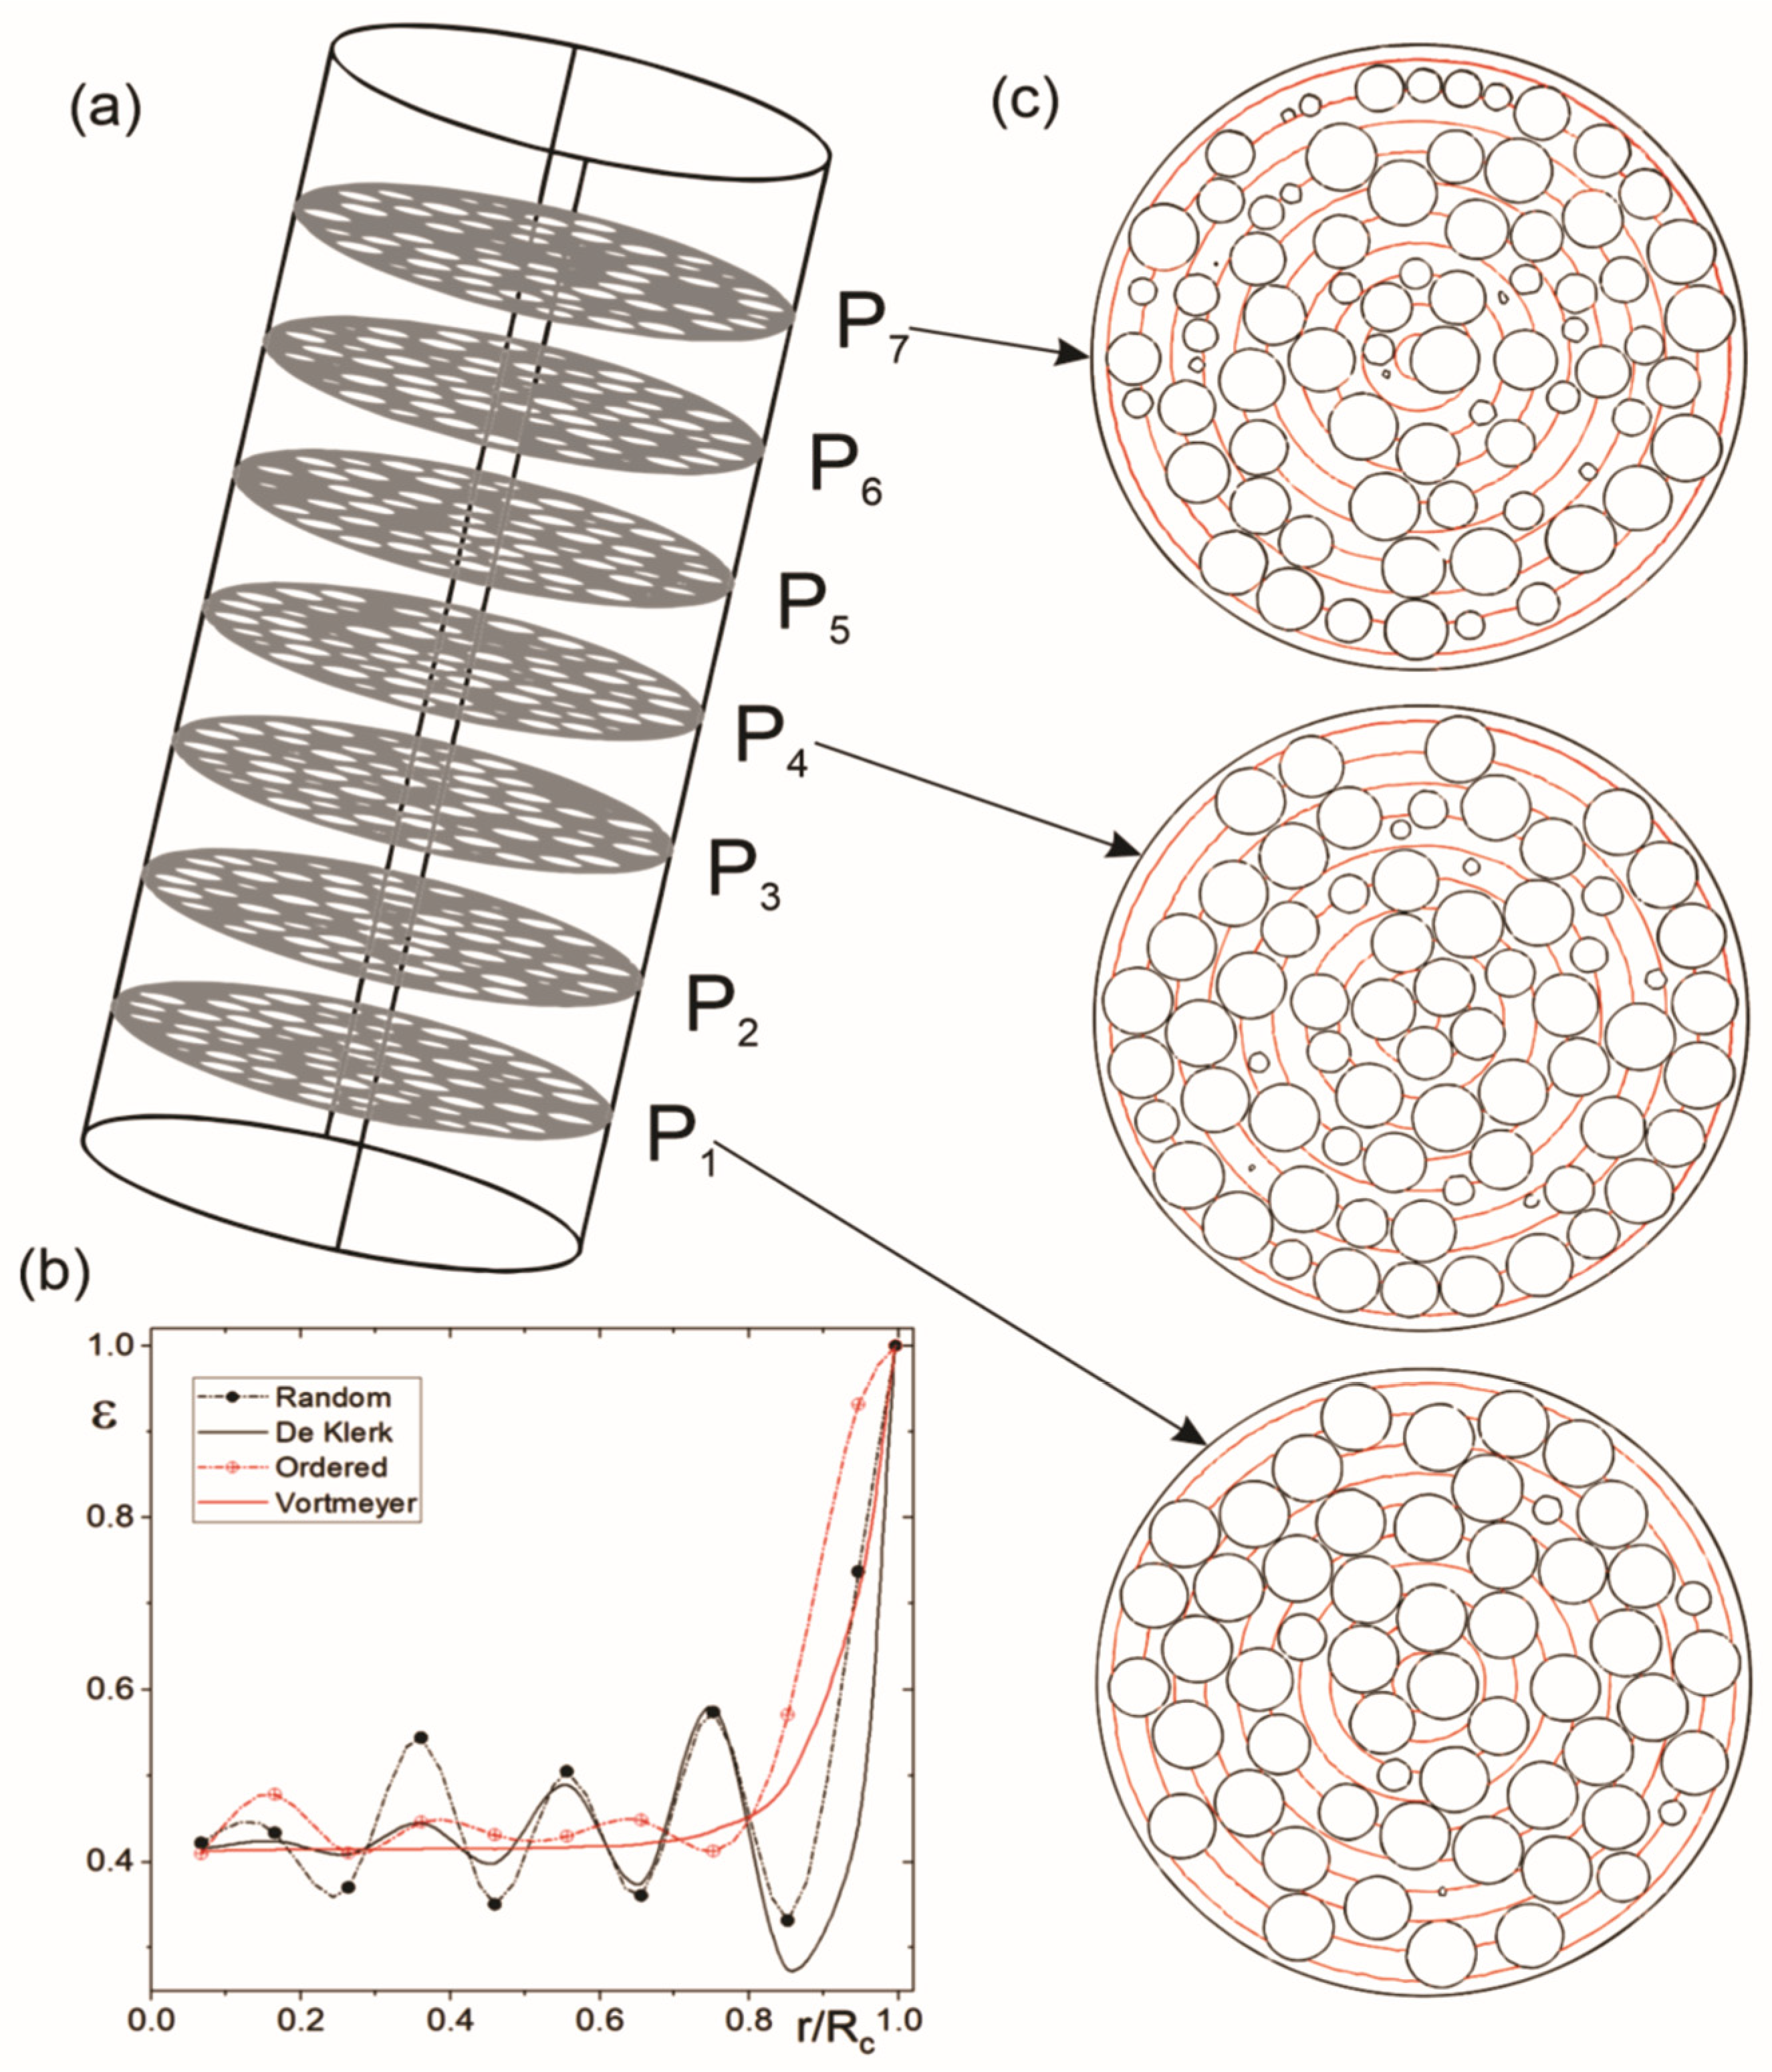
The average porosity distribution was determined as a function of the radial position of the column for both implemented geometries of PRM, random and ordered geometry. To determine the average variations in the radial position, seven different measurement planes were established (Figure 2a), in which 10 porosity radial measurement regions were delimited (Figure 2b). The porosity values obtained are related to the intermediate radius of the mentioned region.
Figure 2.
Evaluation details of the radial variation in porosity. (a) Cut planes (7) used for porosity evaluation in the random PB; (b) details of the 10 regions used for the evaluation of the radial variation in porosity in the 7th cutting plane located at a dimensionless height from the entrance to the PB; and (c) comparison of the porosity distributions, both of the ordered and random beds, against the de Klerk and Vortmeyer correlations.
Given that for a set radius value there is a porosity value for each cut plane, the average porosity value of all cutting planes was evaluated and assigned to the average porosity value of this radius value. Figure 2c shows the distribution of the radial porosity variation in both PRMs implemented in this work (ordered and random), as well as the comparison with the de Klerk [34] and Vortmeyer [35] correlations.
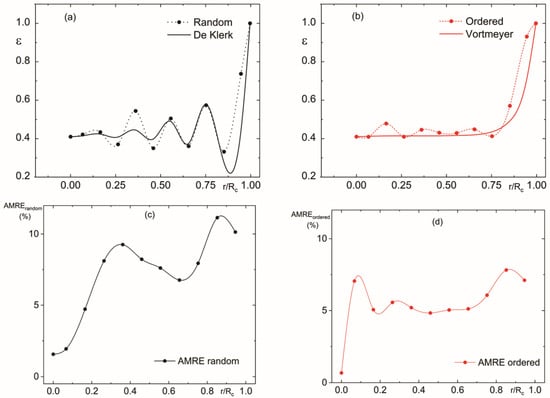
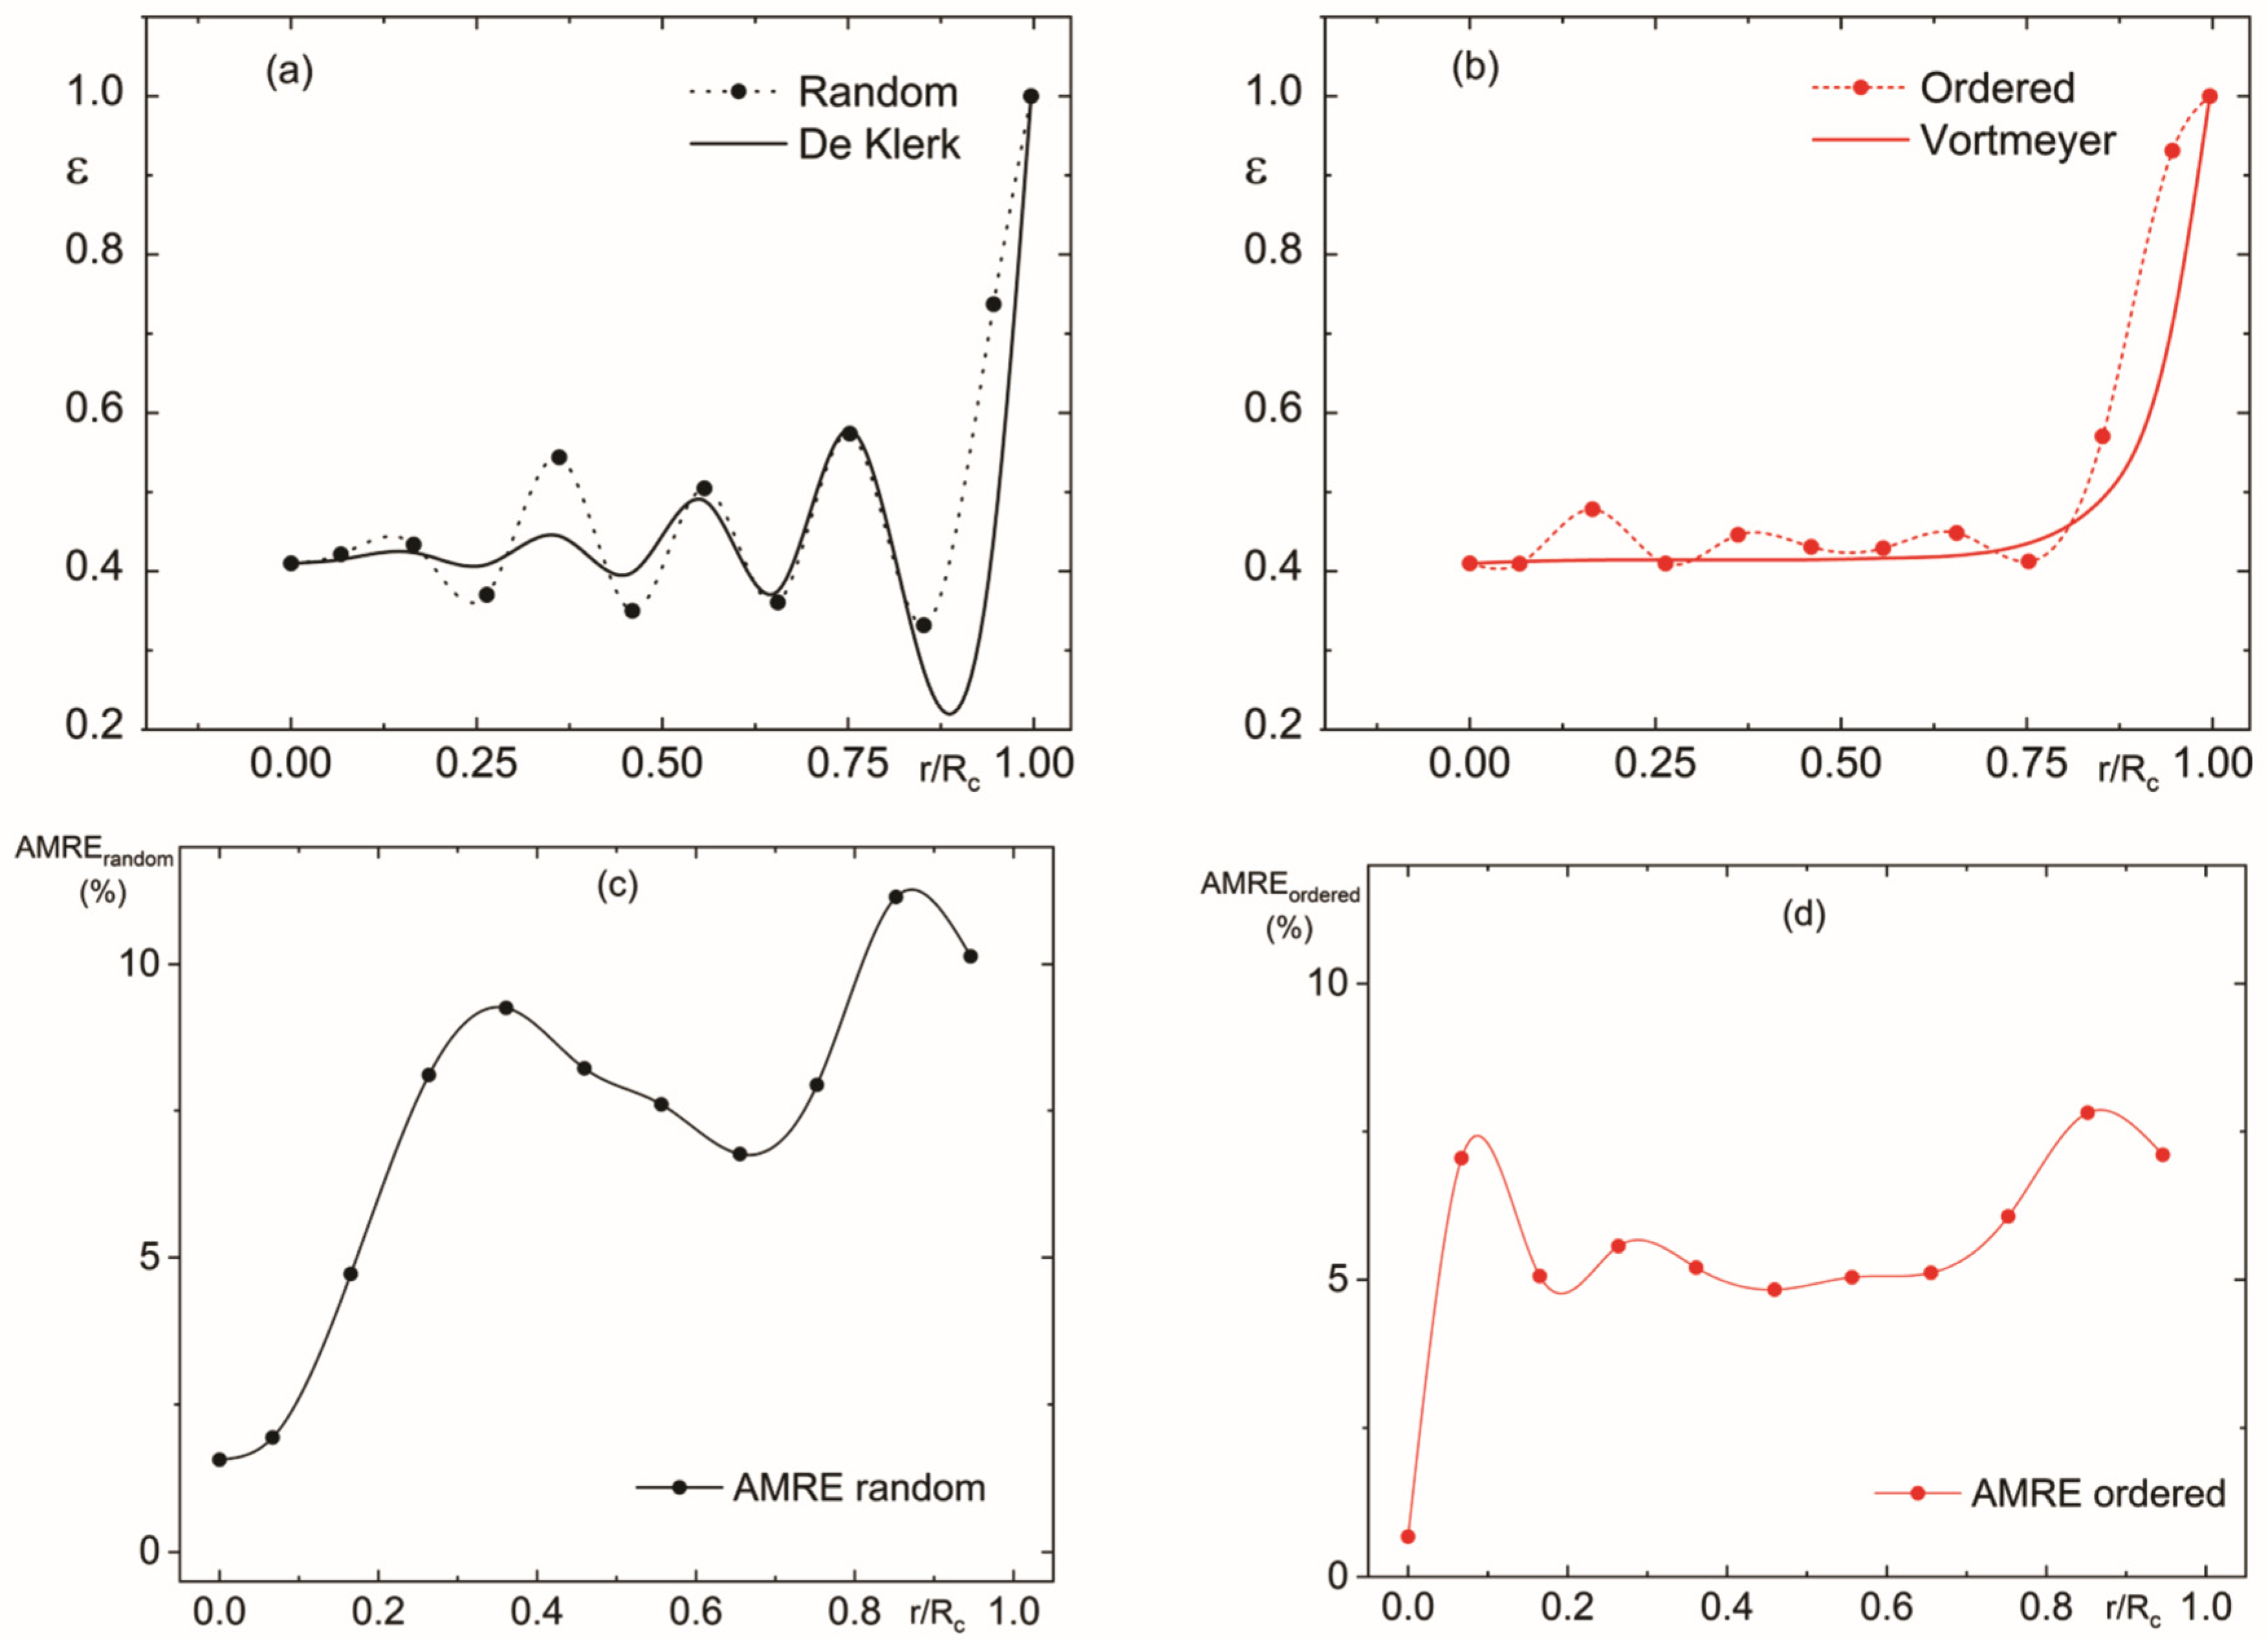
Figure 3a shows the porosity distribution of the random PB, which has a similar trend to that predicted by oscillatory correlations such as de Klerk [34]. Both exhibit important variations with respect to the average porosity radial variations. Figure 3b shows the radial distribution of porosity for the ordered layer, where the variations along the radius are slighter than those presented by the random bed, with a strong increase in the porosity when approaching the column wall, which is the expected wall effect. The porosity distribution of the ordered bed best fits the Vortmeyer exponential correlation. Figure 3c show the accumulated mean relative error (AMRE) between random PB and de Klerk correlation, calculated up to a given dimensionless radial position, measured from the center of the PB. As can be seen, for 85% of the bed radius the mean relative differences between the result obtained by the correlation and our random PB model is less than 8%, while for the remaining 15%, corresponding to the region closest to the reactor wall, the difference rises to average values of 11%. This indicates that the method used to develop the geometrical model of the random bed was adequate. In Figure 3d, a similar analysis is presented for the ordered packed-bed model, which is compared with the correlation of exponential decay of Vortmeyer. In this case, for 85% of the PB radius, the AMRE between the result obtained by the correlation and our model is around 6%, while for the remaining 15%, corresponding to the region closest to the reactor wall, the difference rises to average values of 7.4%.
Figure 3.
Comparison of porosity distribution against literature correlation: (a) Comparison of porosity distribution of the random PB against de Klerk correlation; (b) the porosity distribution of the ordered PB against Vortmeyer correlation; (c) accumulated mean relative error (AMRE) for comparison of random PB against de Klerk correlation; and (d) AMRE for comparison of ordered PB against Vortmeyer correlation.
3.2. Heterogeneous Model (Particle-Resolved Model)
3.2.1. Hydrodynamics
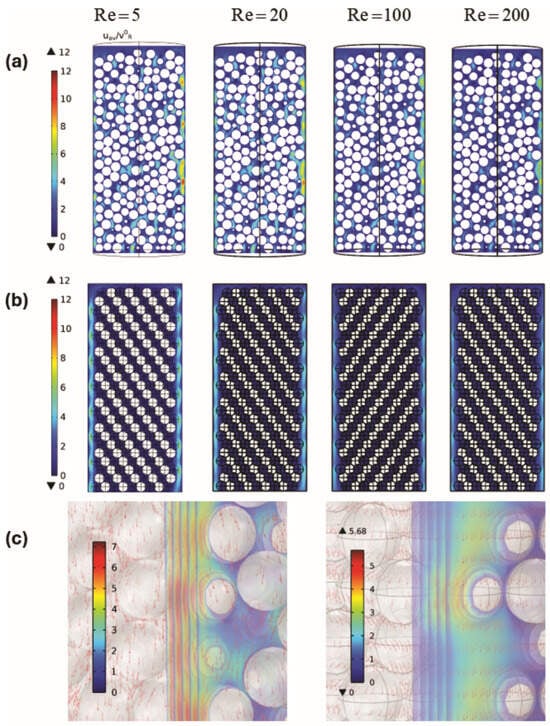
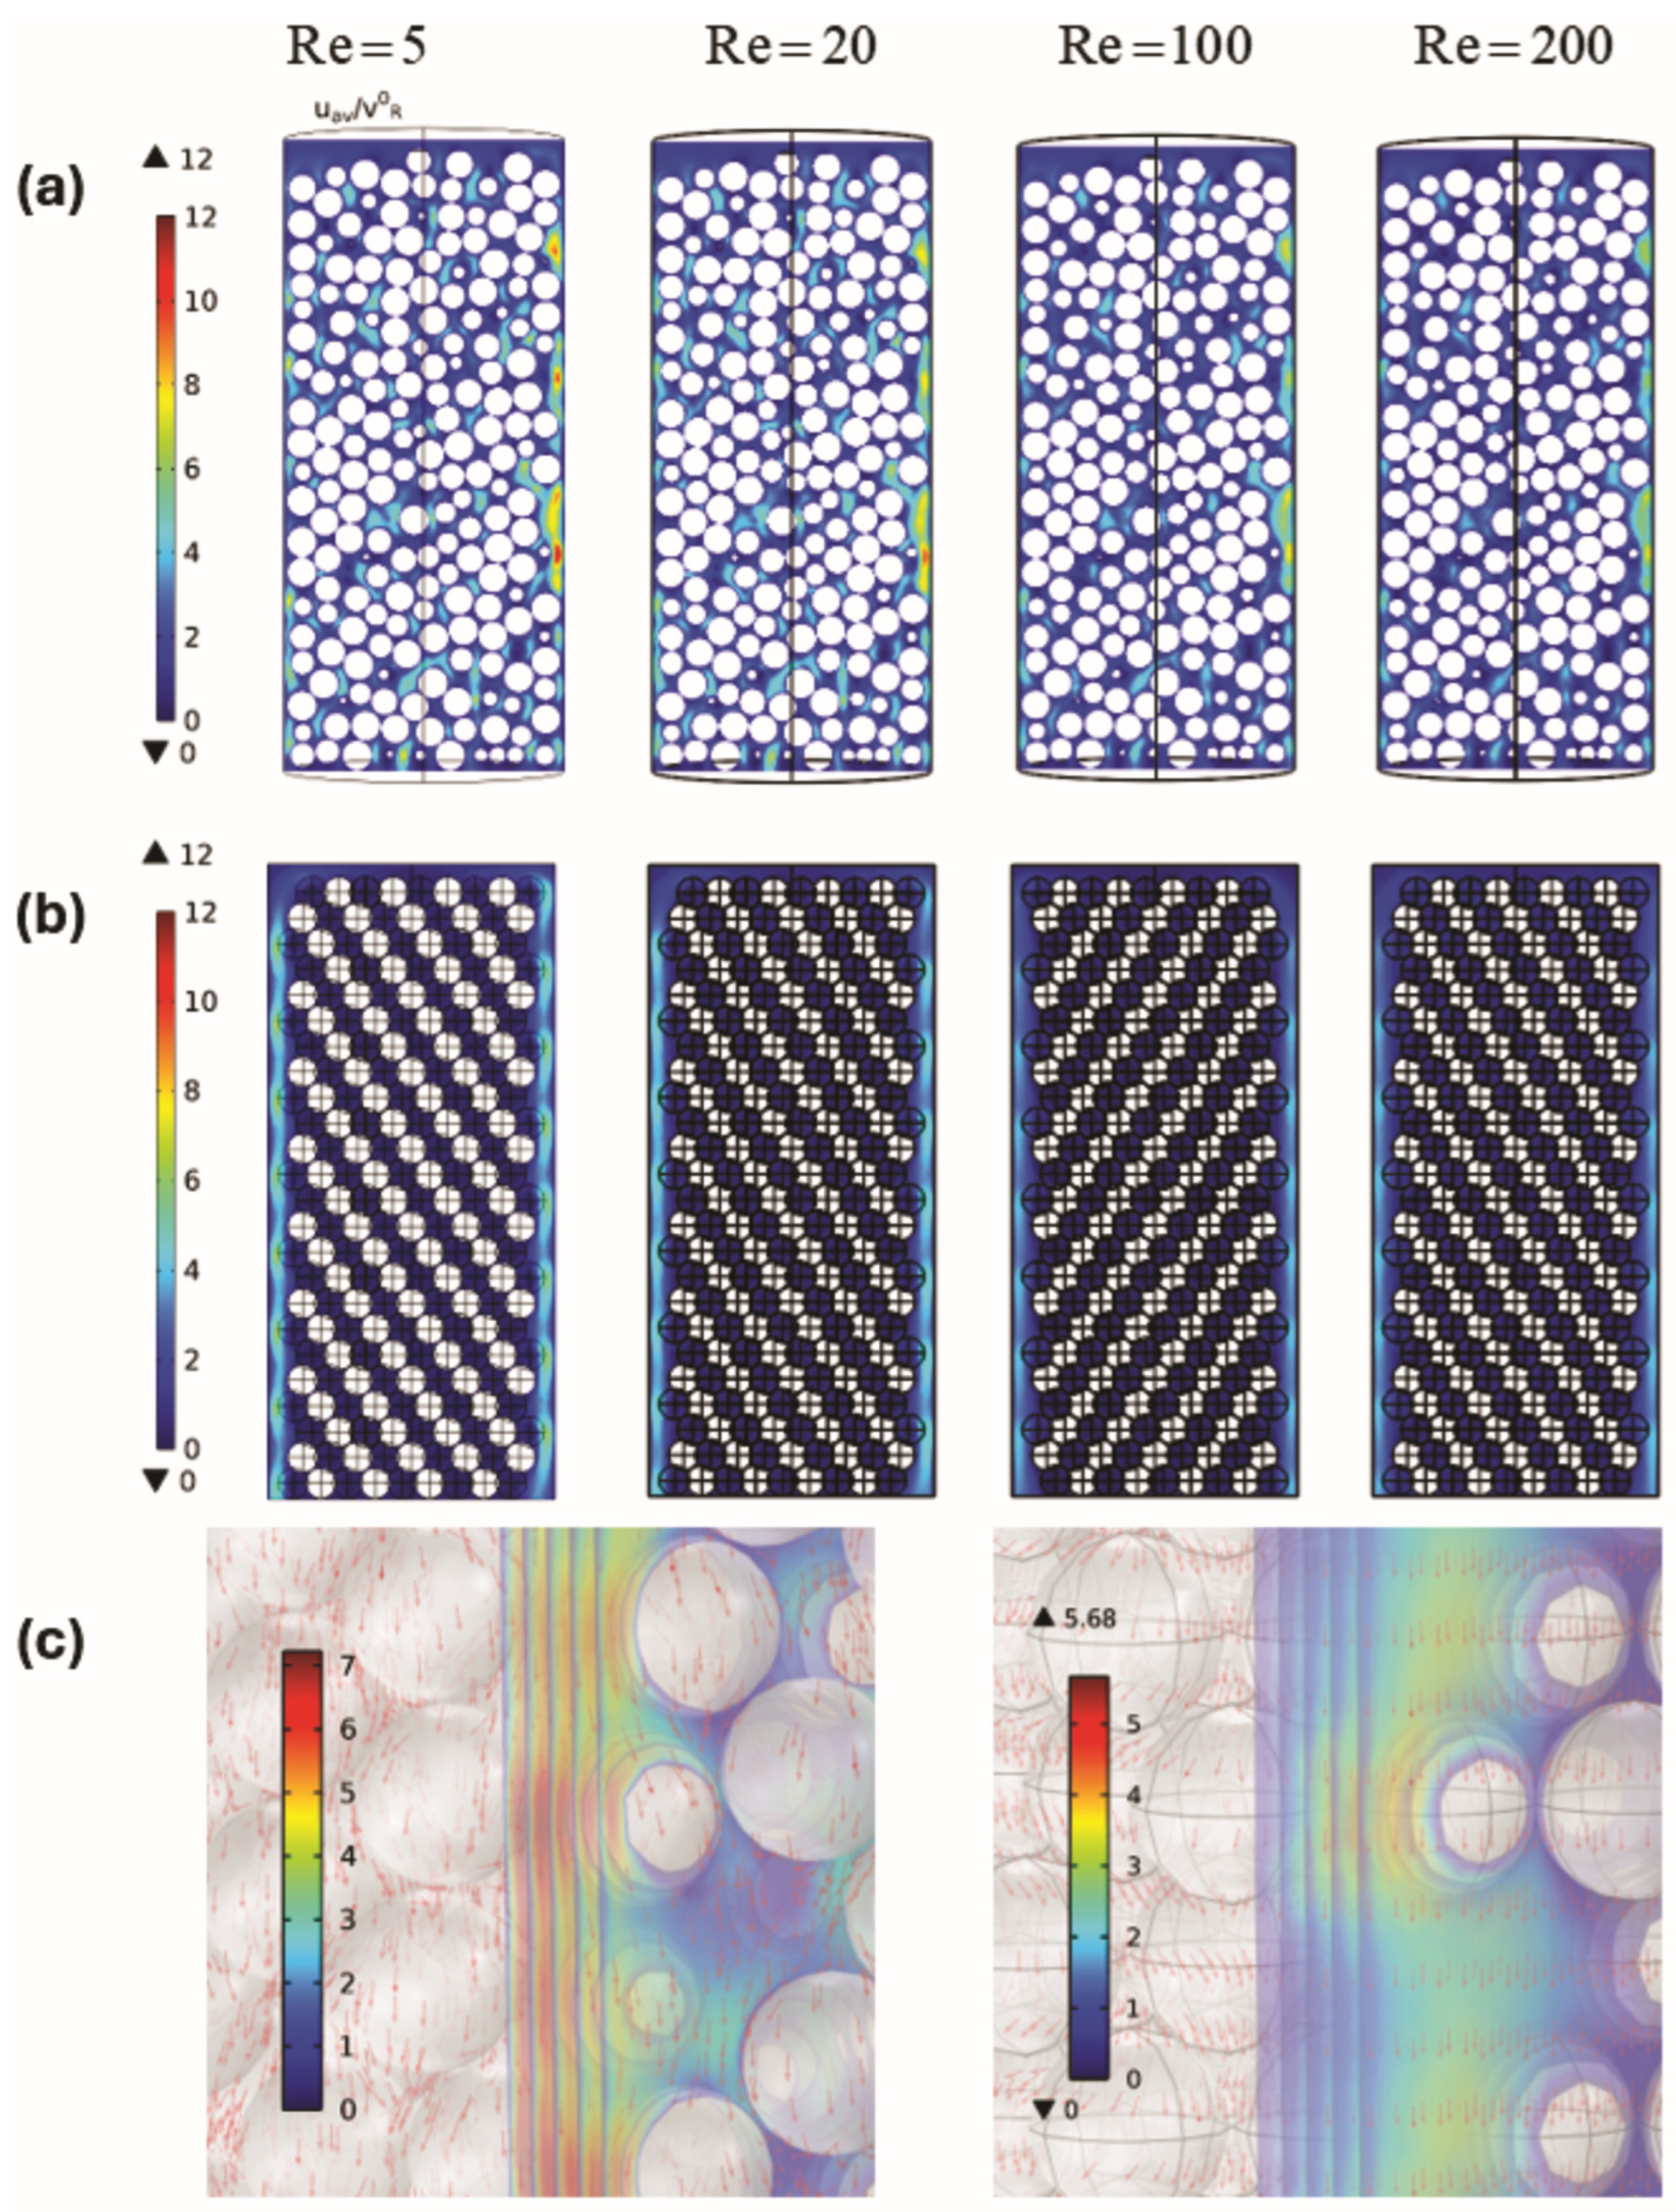
Hydrodynamic steady state simulations were carried out with the ordered and random beds implemented, at different particle Reynolds numbers . Figure 4 shows an xz-cut plane located at y = 0 with the details of the dimensionless velocity field for both beds, random and ordered, at Reynold numbers of Re = 5, 20, 100 and 200. On the other hand, the case of the ordered PB presents larger areas with high velocities near the wall, indicative of a region of greater channeling, which is in relation to the distribution of porosity shown in Figure 2. There are also very large regions within the PB, where the velocity is very close to zero, while in the random PB, the values distribution of velocity is greater along all beds.
Figure 4.
Comparison of the velocity fields (streamlines and magnitude) at Reynolds numbers (Re) of 5, 20, 100, and 200. (a) Random particle beds; (b) ordered particle beds; (c) details of the hydrodynamic behavior (dimensionless velocity and streamlines) for the random and ordered beds respectively.
The ordered bed exhibits symmetrical, predictable flow channels, whereas the random bed shows increased flow heterogeneity and localized vortices with increasing Re.
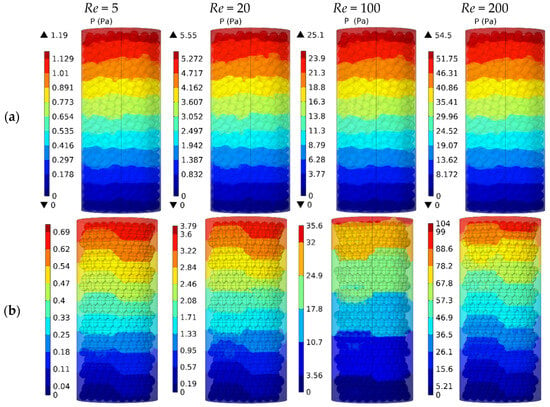
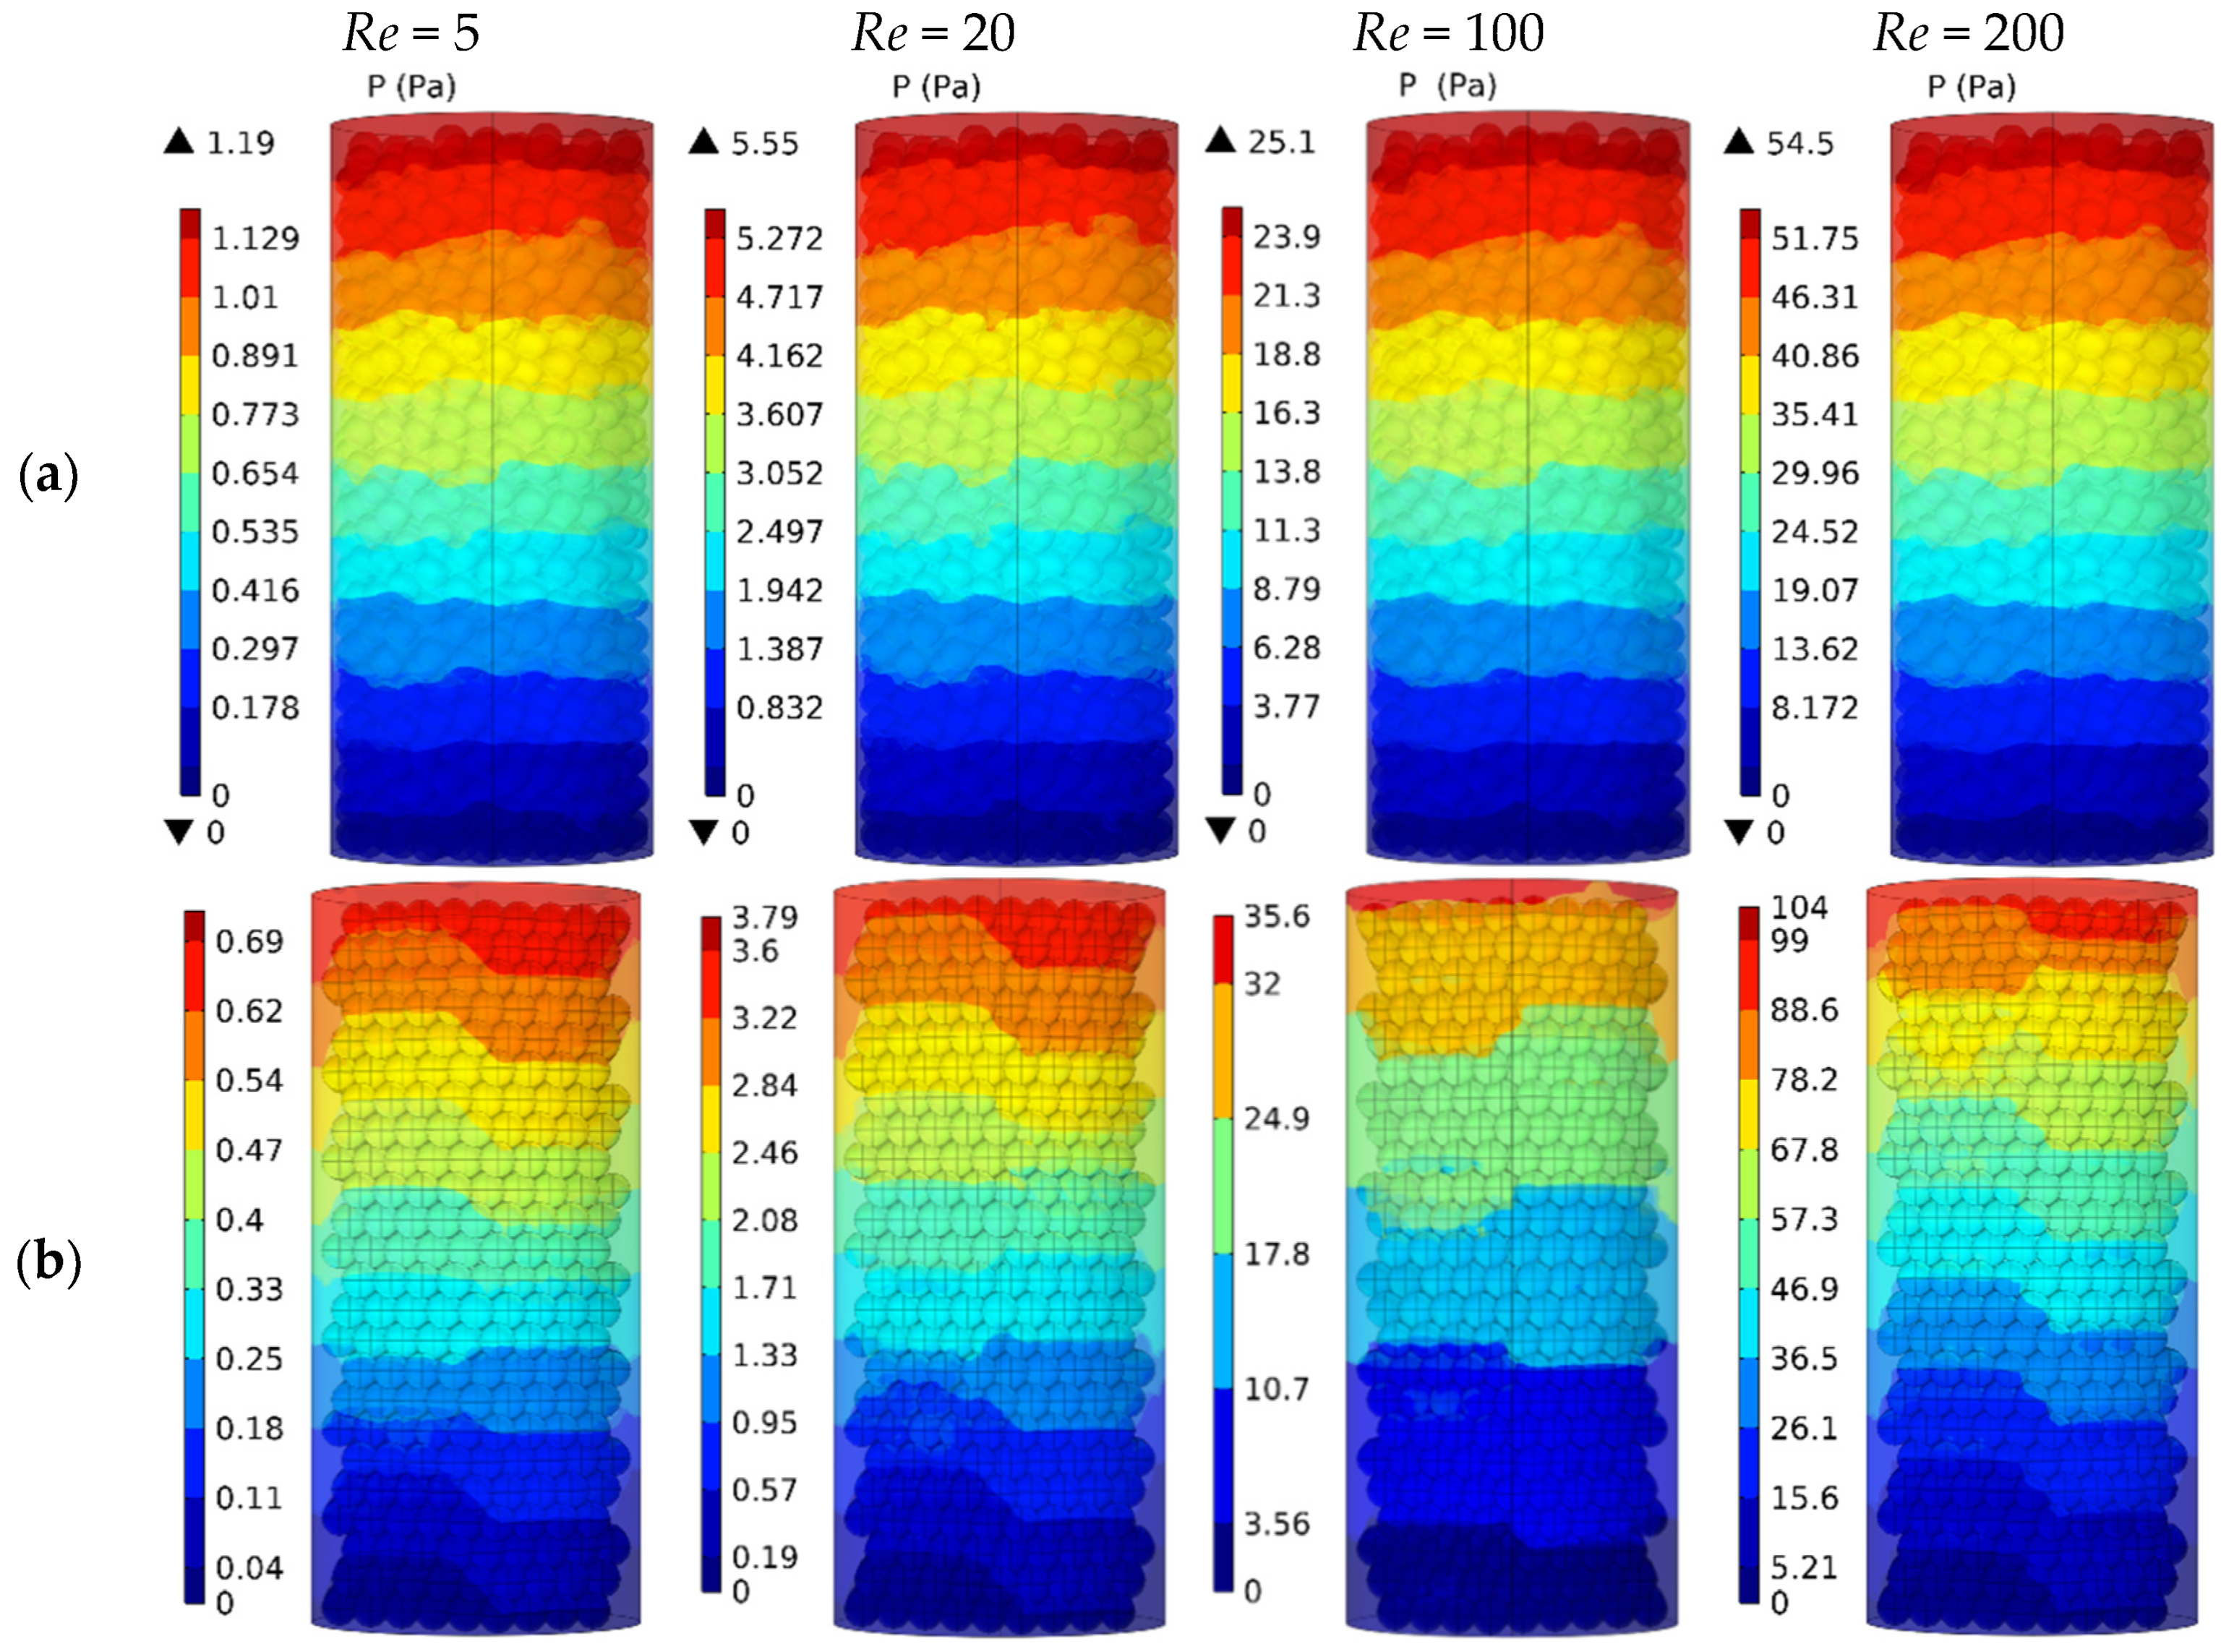
Figure 5 shows the details of the pressure field for both PBs, random and ordered, for the same Reynold values. As can be seen, the random model presents lower pressure drops than the ordered case.
Figure 5.
Comparison of the pressure fields at Reynolds numbers (Re) of 5, 20, 100, and 200. (a) Random particles beds; (b) ordered particles beds.
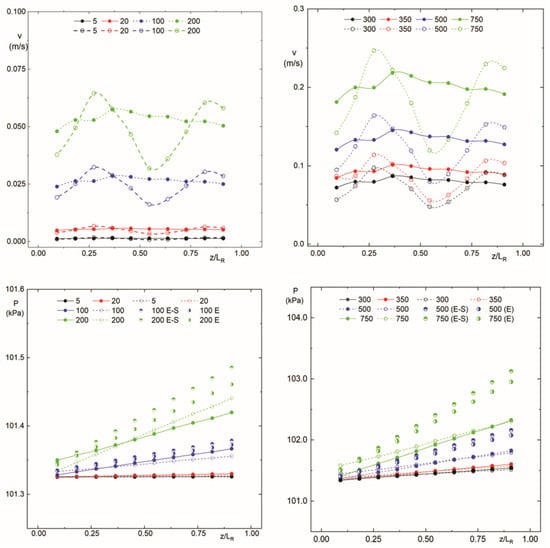
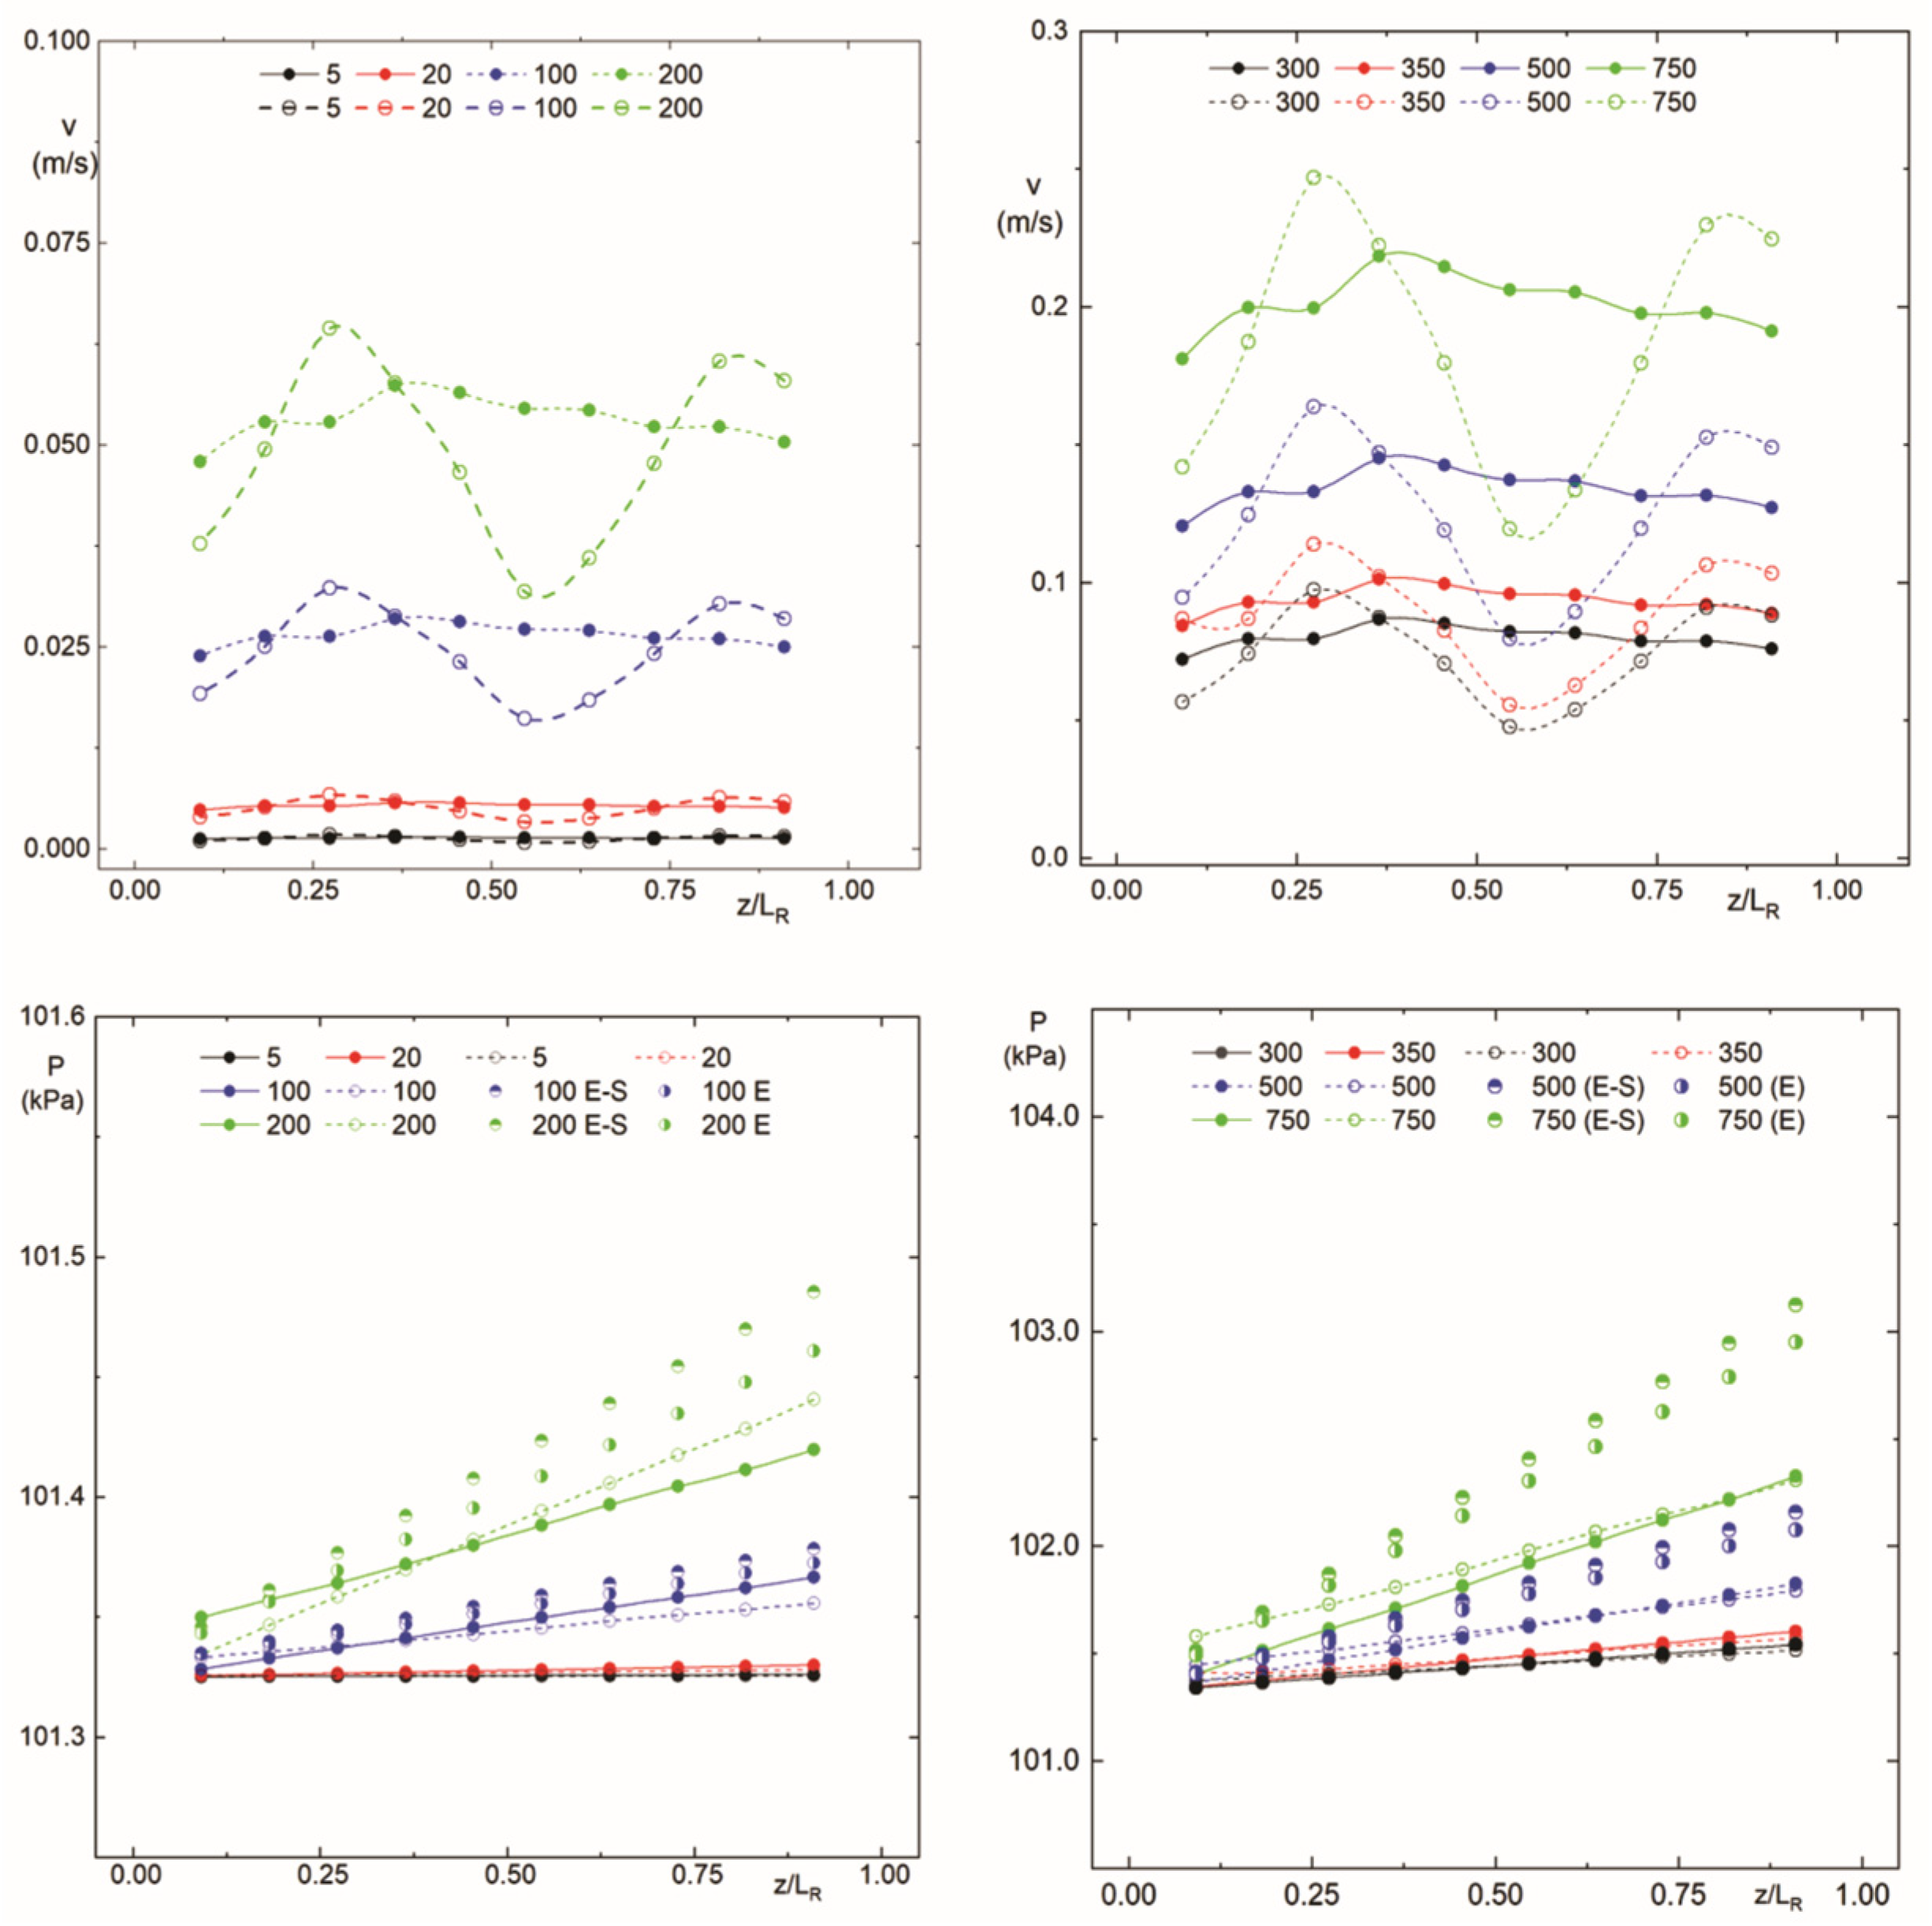
To more adequately determine the hydrodynamic characteristics, averages of the velocity and pressure fields were carried out in 11 cutting planes located at different axial lengths of both random and ordered beds built for this work, as illustrated in Figure 6.
Figure 6.
Velocity and pressure fields at different Reynolds numbers, for both the random ( ) and the ordered PB (
 ), Ergun correlation (E) and Eisfeld-Schnitzlein correlation (E-S).
) and the ordered PB (), Ergun correlation (E) and Eisfeld-Schnitzlein correlation (E-S).
The details of the velocity and pressure fields at different axial length in the PB at several Reynolds numbers for both random and ordered beds are shown in Figure 6.
3.2.2. Mass Transport with Superficial Enzymatic Reaction
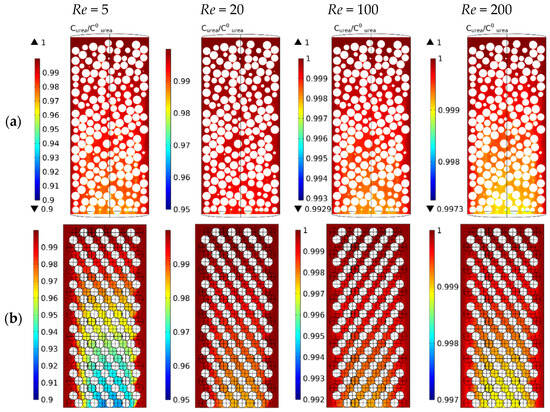
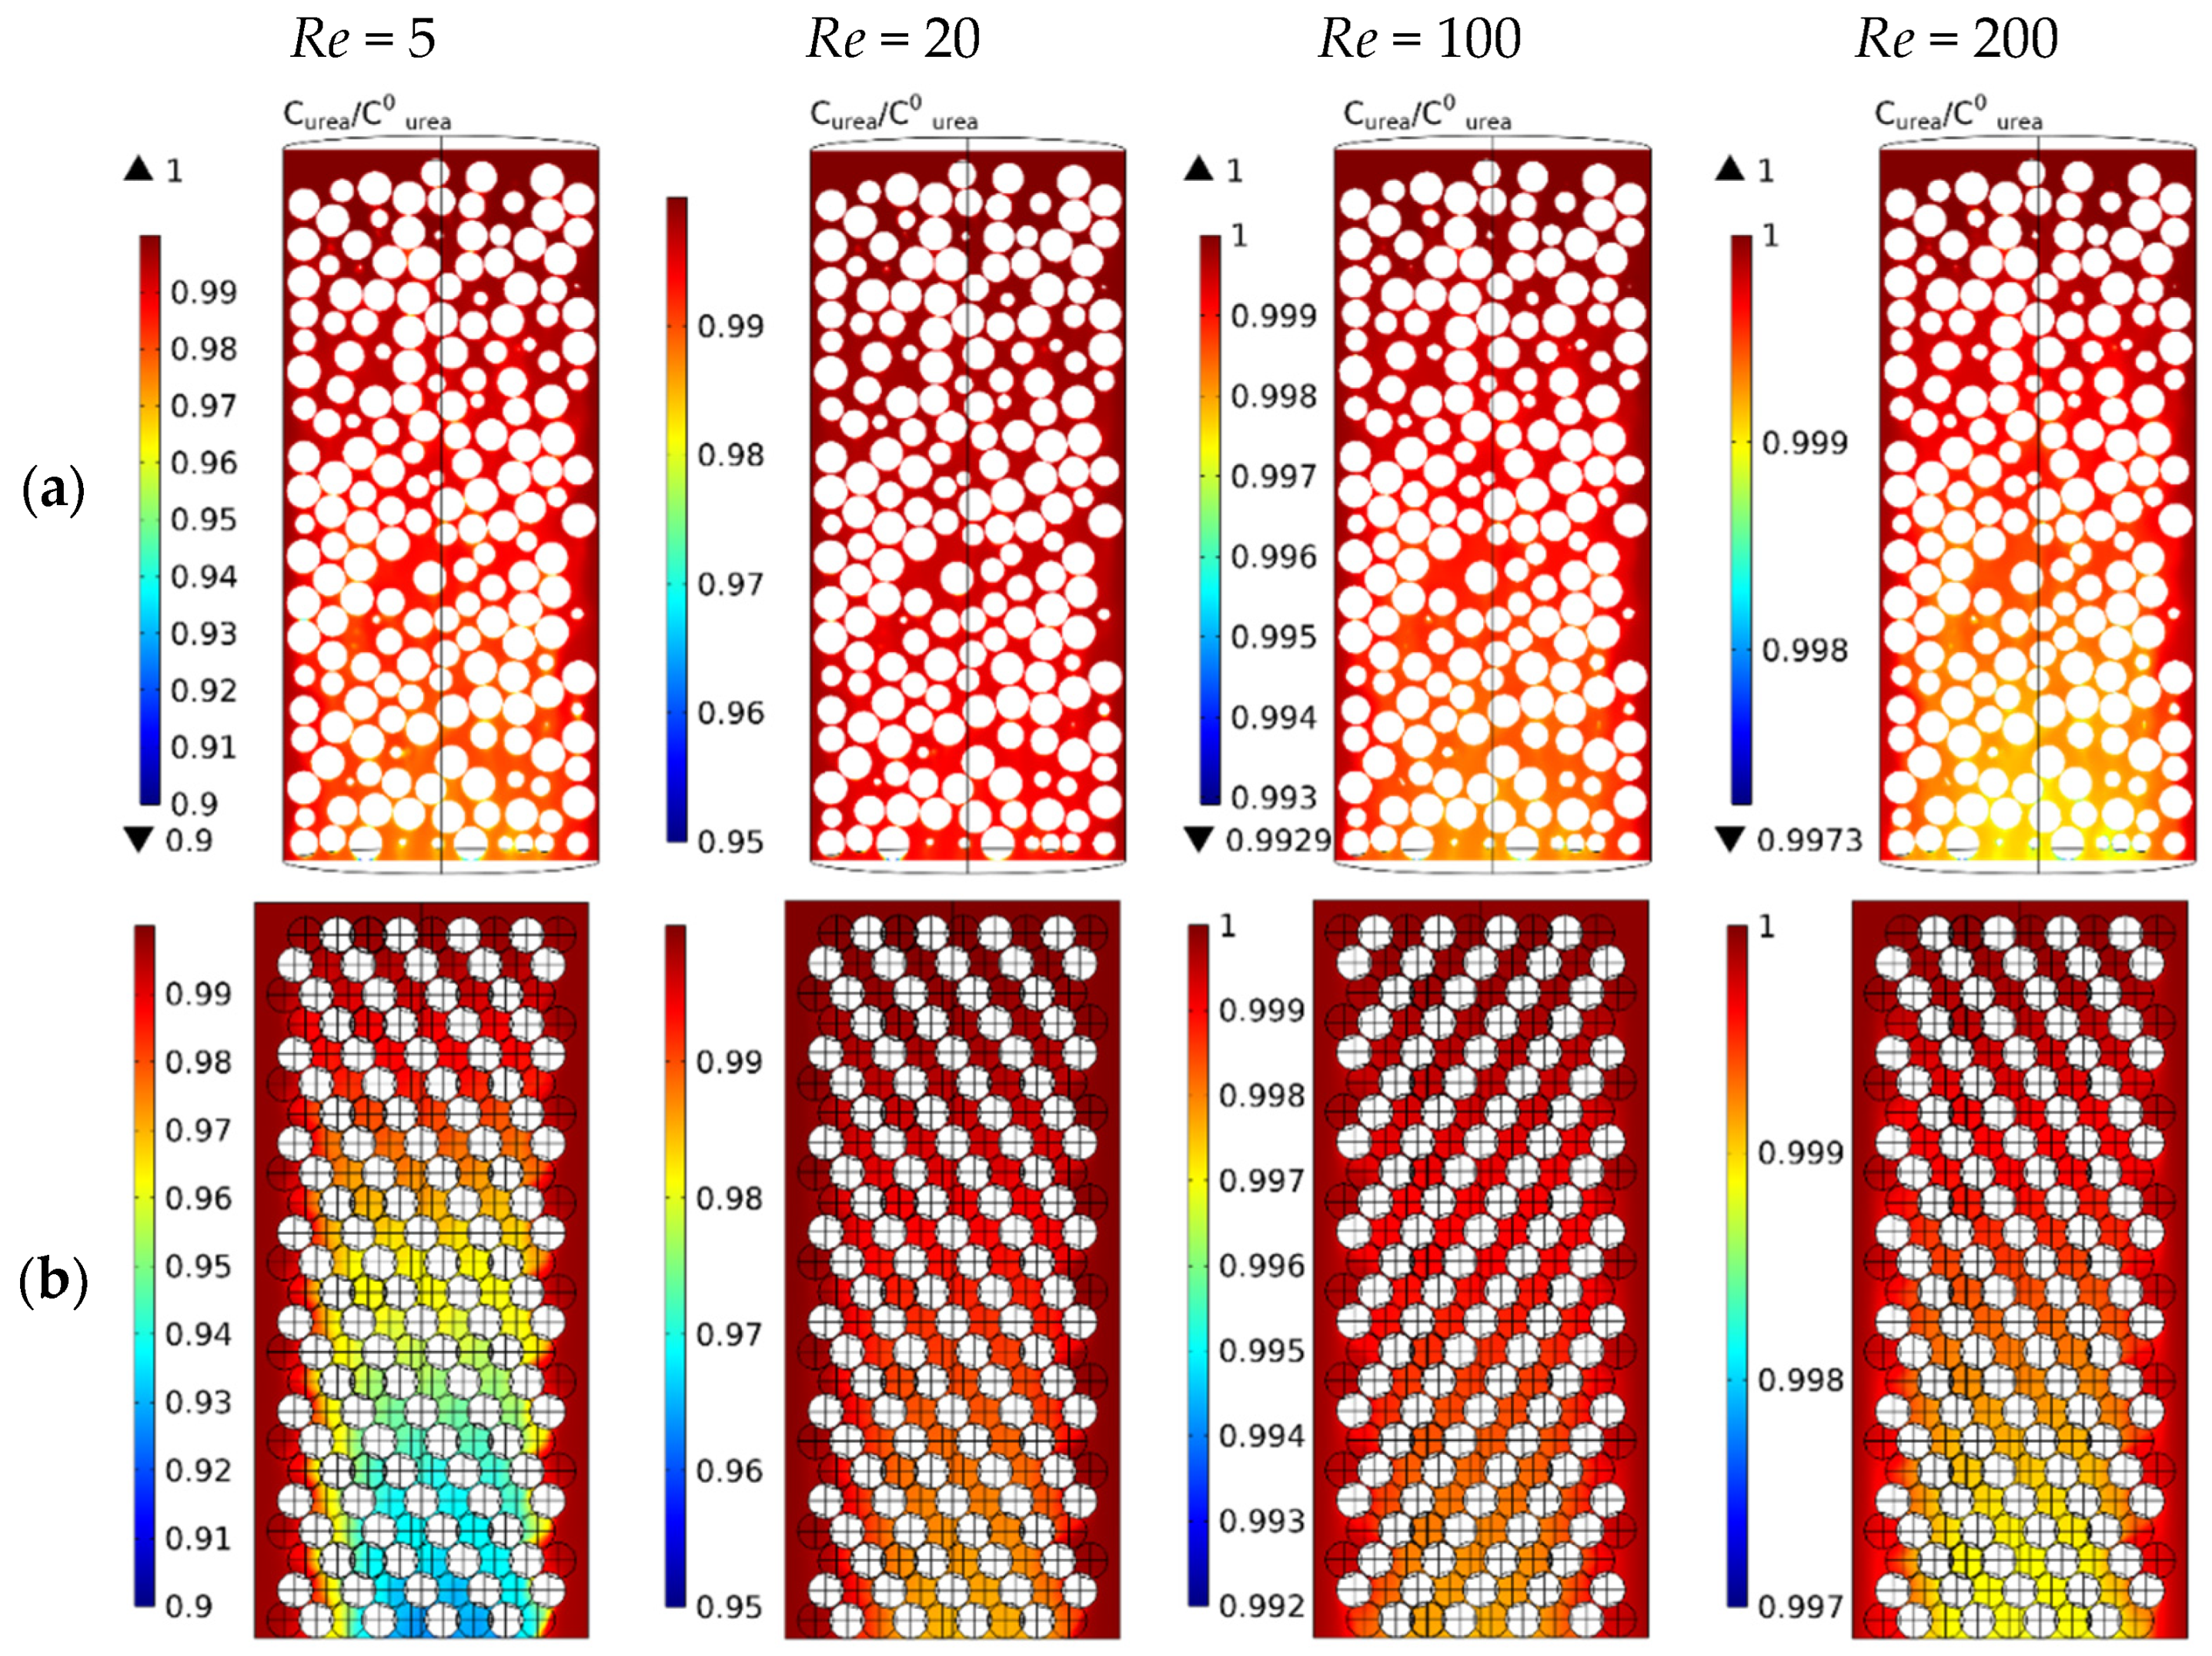
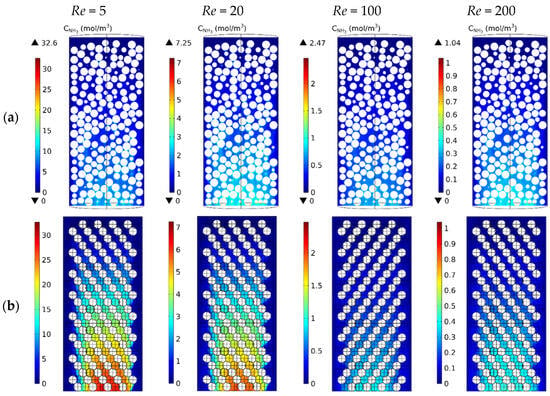
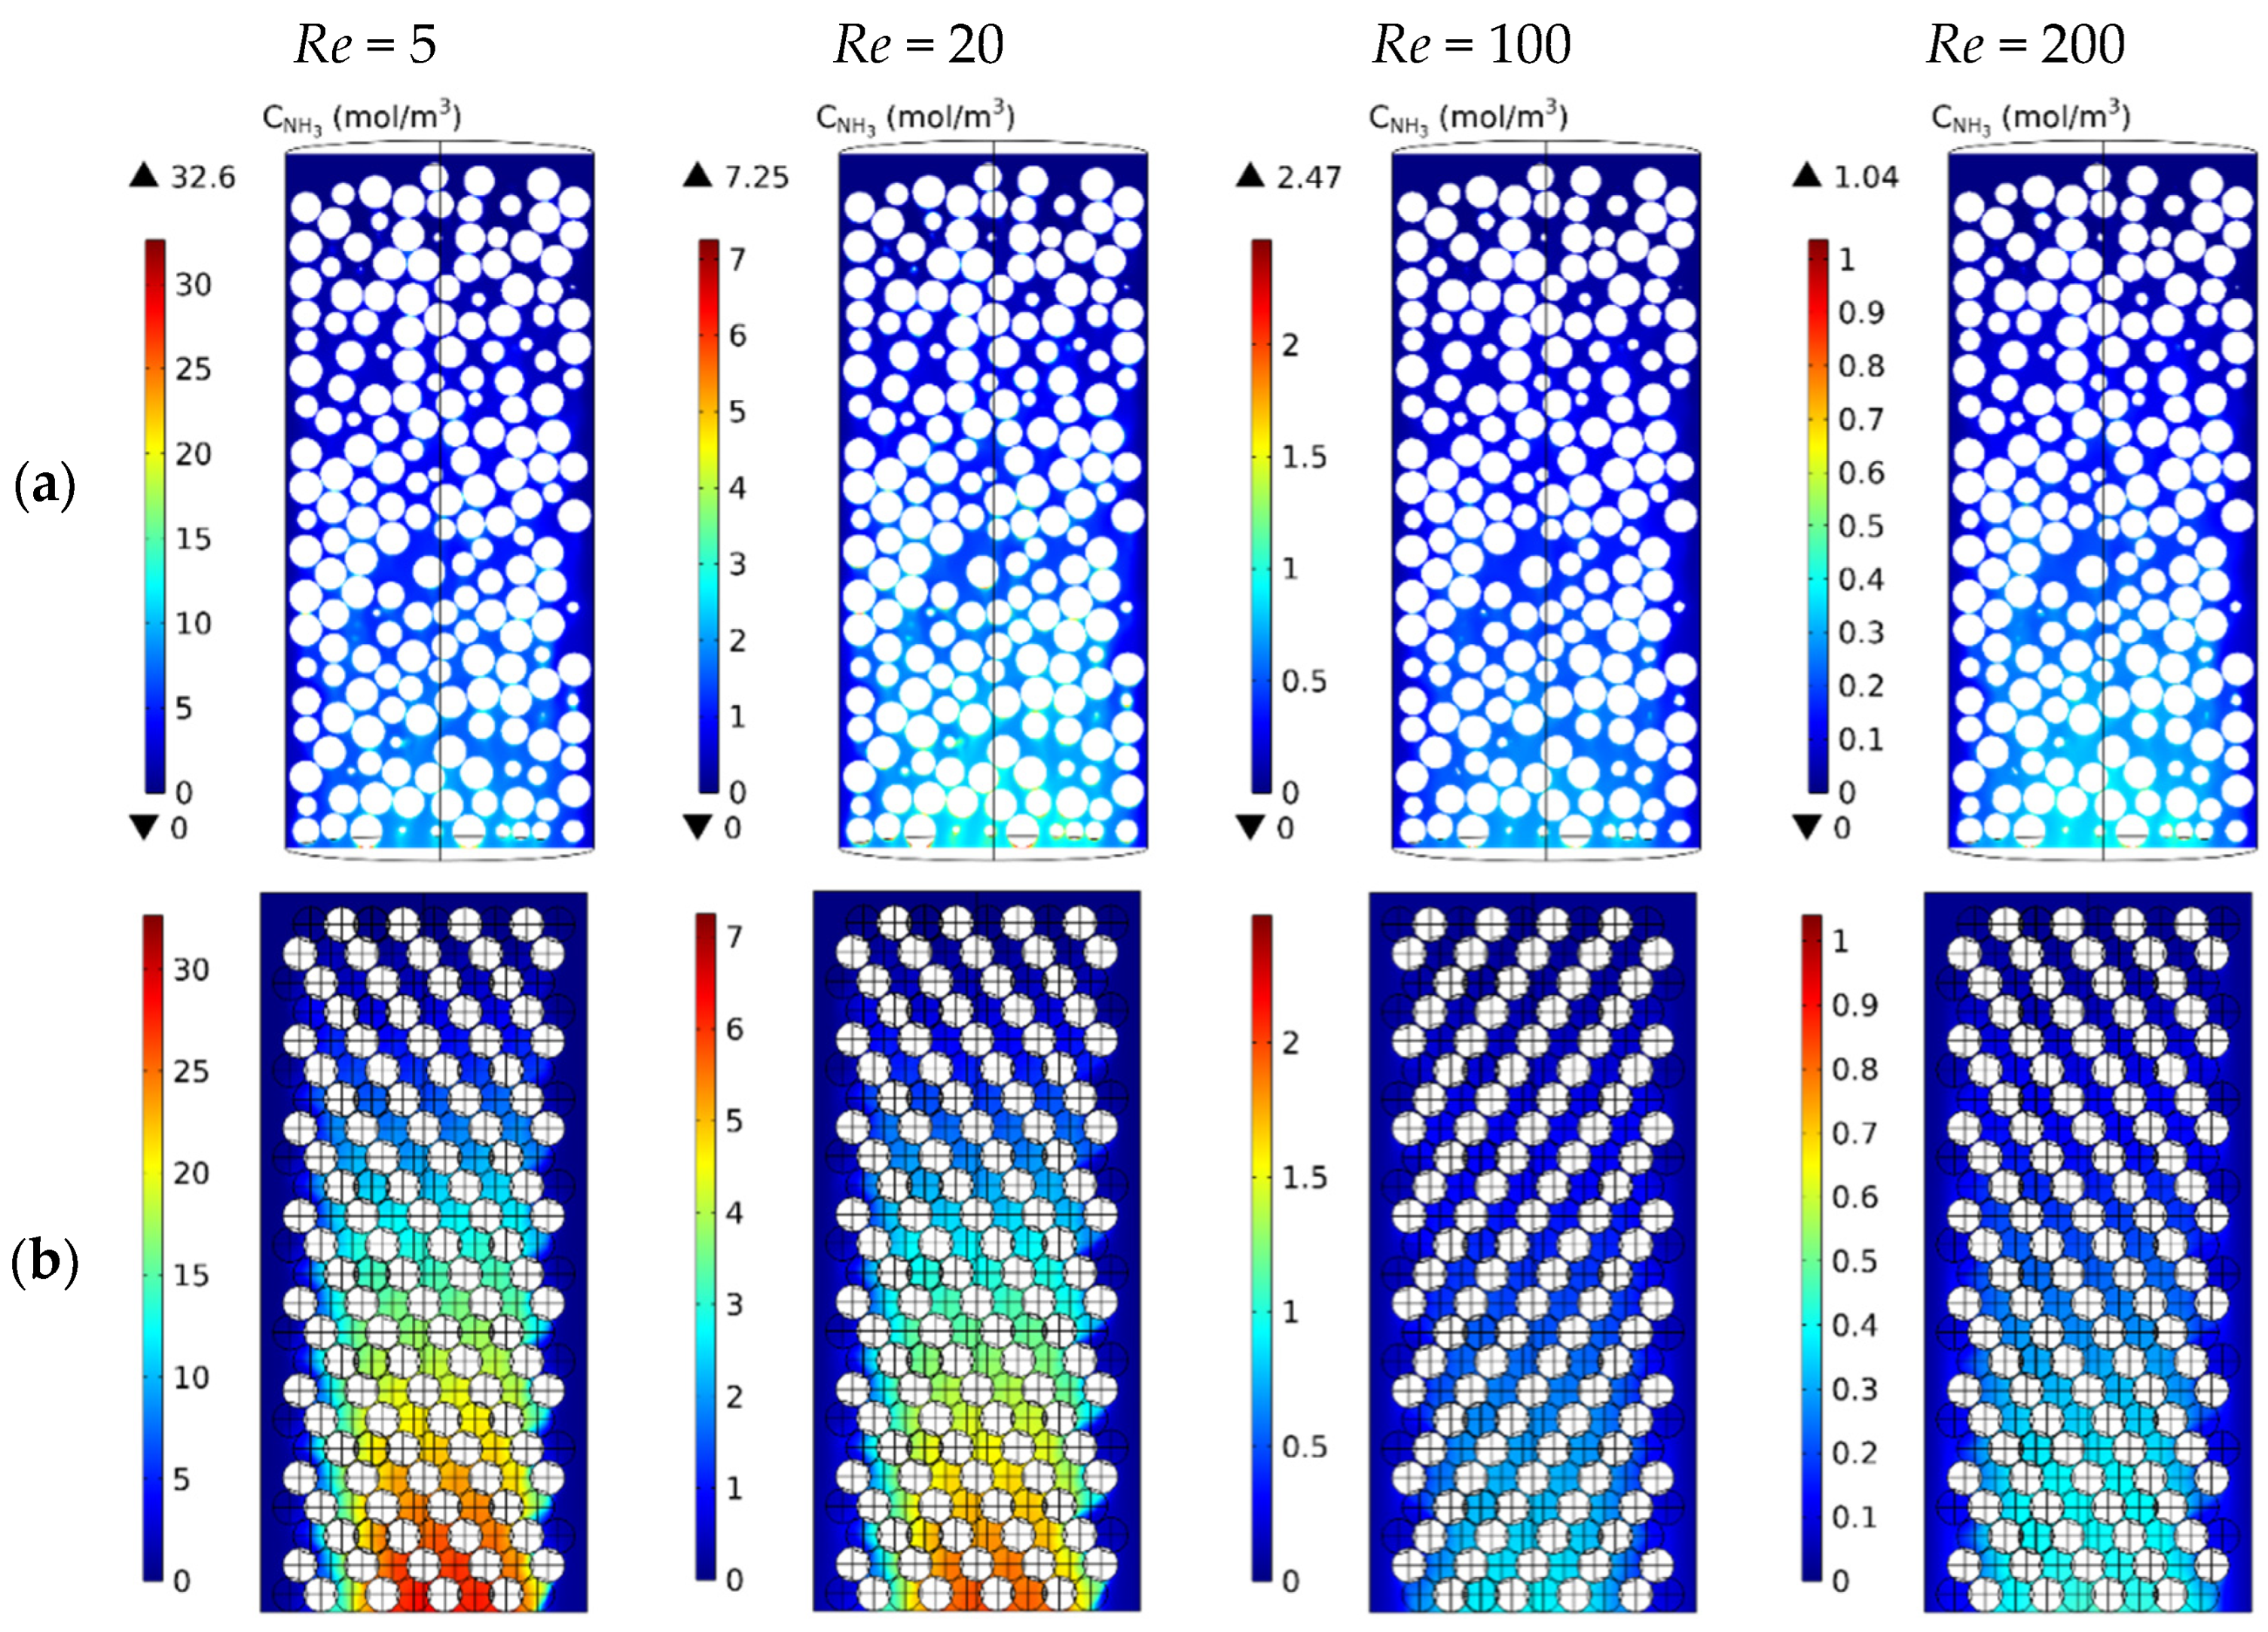
Figure 7 and Figure 8 show the dimensionless substrate concentration and product concentration respectively, at different Reynolds numbers, for both random and ordered bed respectively.
Figure 7.
Dimensionless substrate concentration. (a) random particle beds; (b) ordered particle beds.
Figure 8.
Product concentration. (a) random particle beds; (b) ordered particle beds.
As residence time increases, reactant concentration decreases and product concentration increases along the bed. Axial and radial variations in both substrate and product concentrations are also observed.
For the CFD simulations, a mesh independence analysis was performed. The selected mesh ensures variations in less than 3% in pressure drop and average velocities. The total number of elements and mesh details is reported in Table S1. Additionally, solver settings, including the coupling strategy and convergence tolerances, are provided in Table S2. Post-processing operations (volume averages, surface integrals, and radial profiles) were performed directly within the COMSOL 6.3 environment, without the use of external numerical scripts.
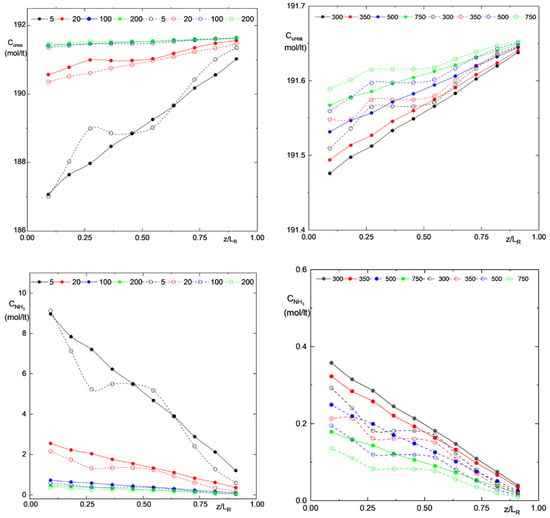
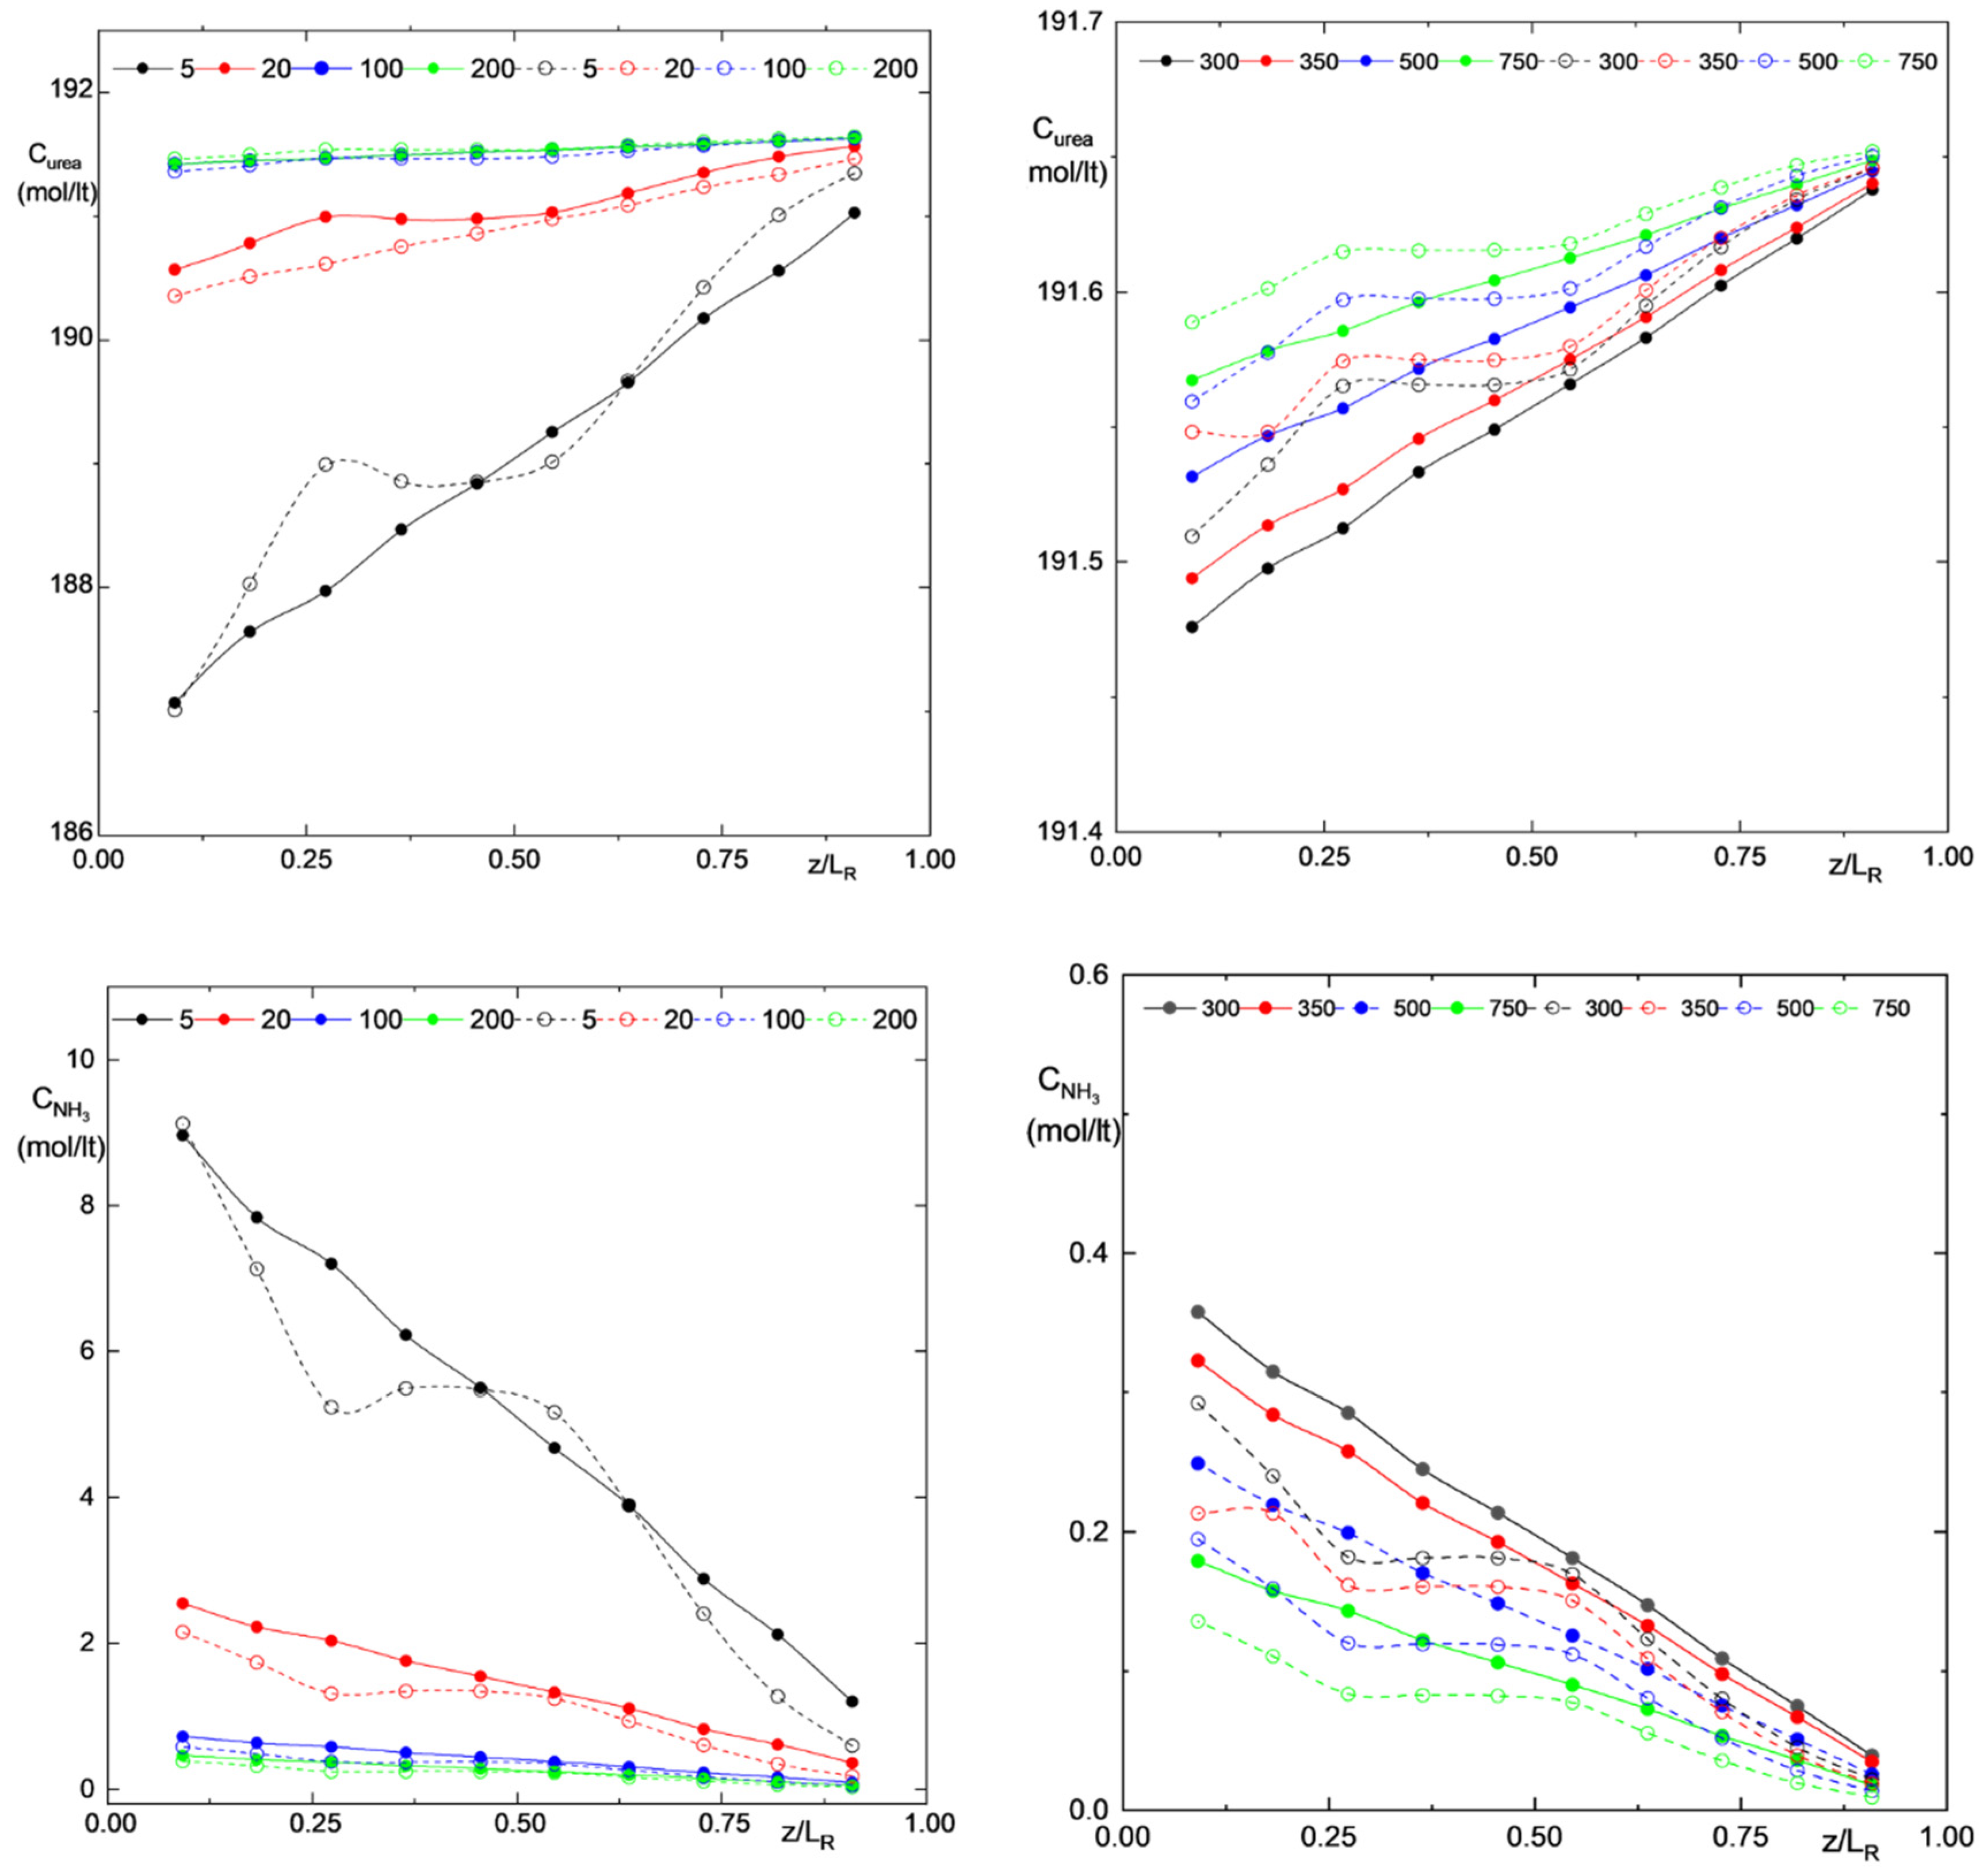
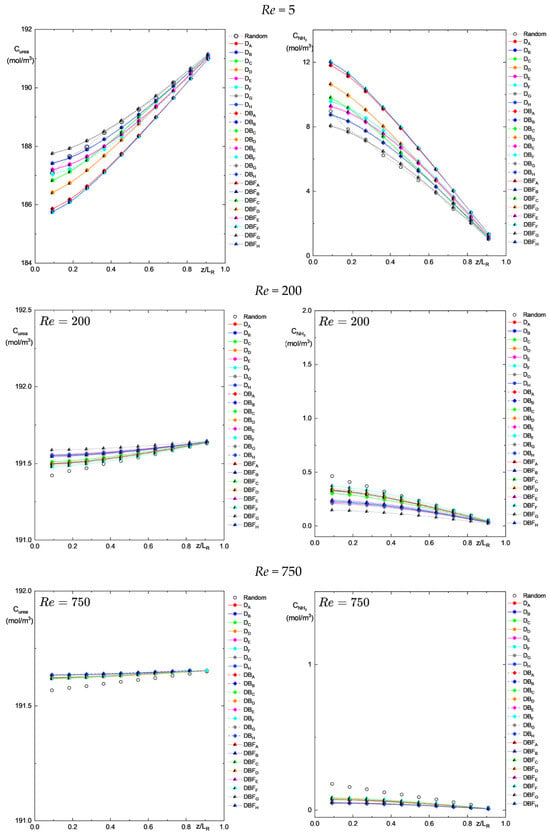
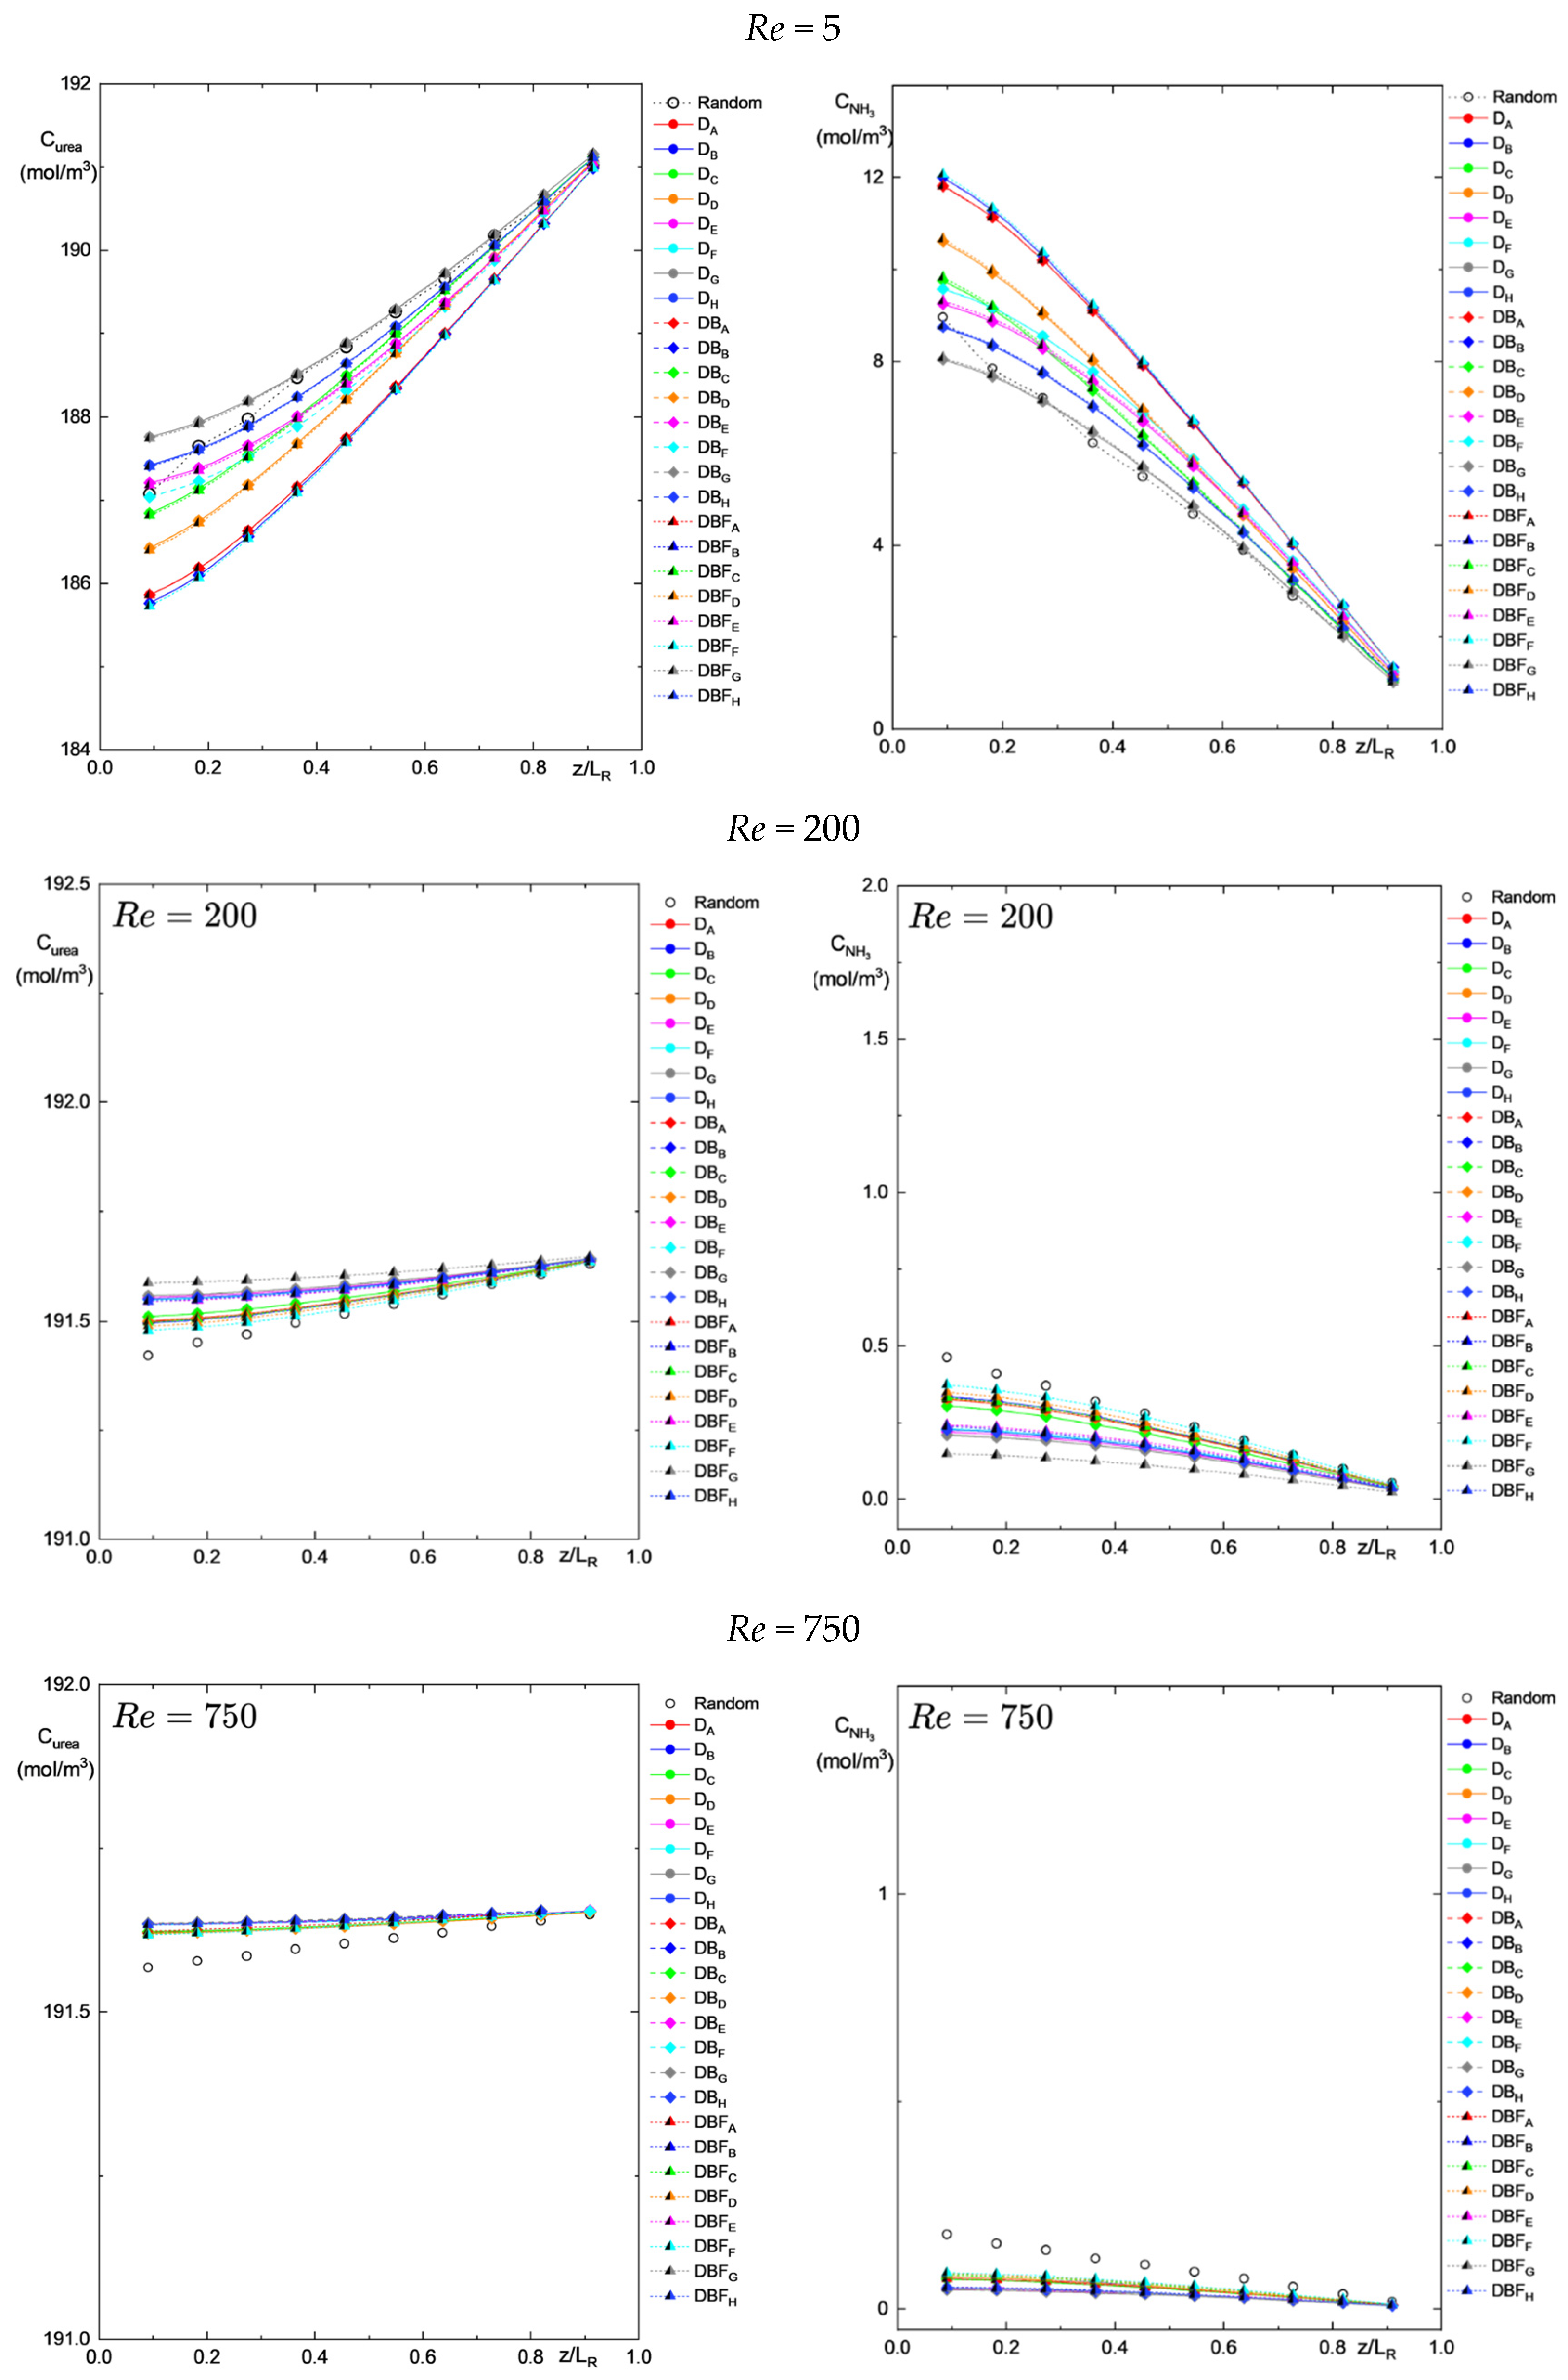
To determine adequately the characteristics of prediction of mass transport coupled with hydrodynamics, averages of substrate and product concentrations were carried out in 11 cut-planes located at different axial lengths of both random and ordered PBs, as illustrated in Figure 9.
Figure 9.
Urea and NH3 concentration at different Reynolds numbers, for both the random () and the ordered () PB.
) and the ordered () PB.
3.3. Pseudo-Homogeneous Model
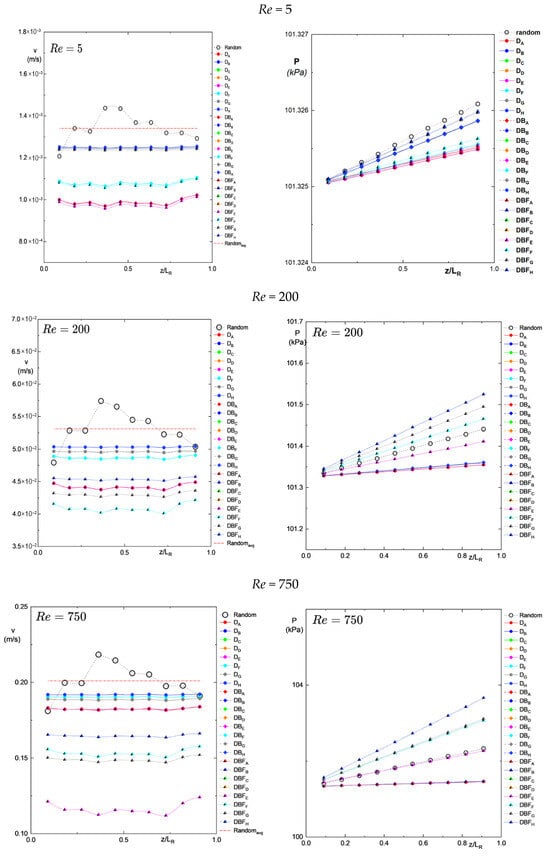
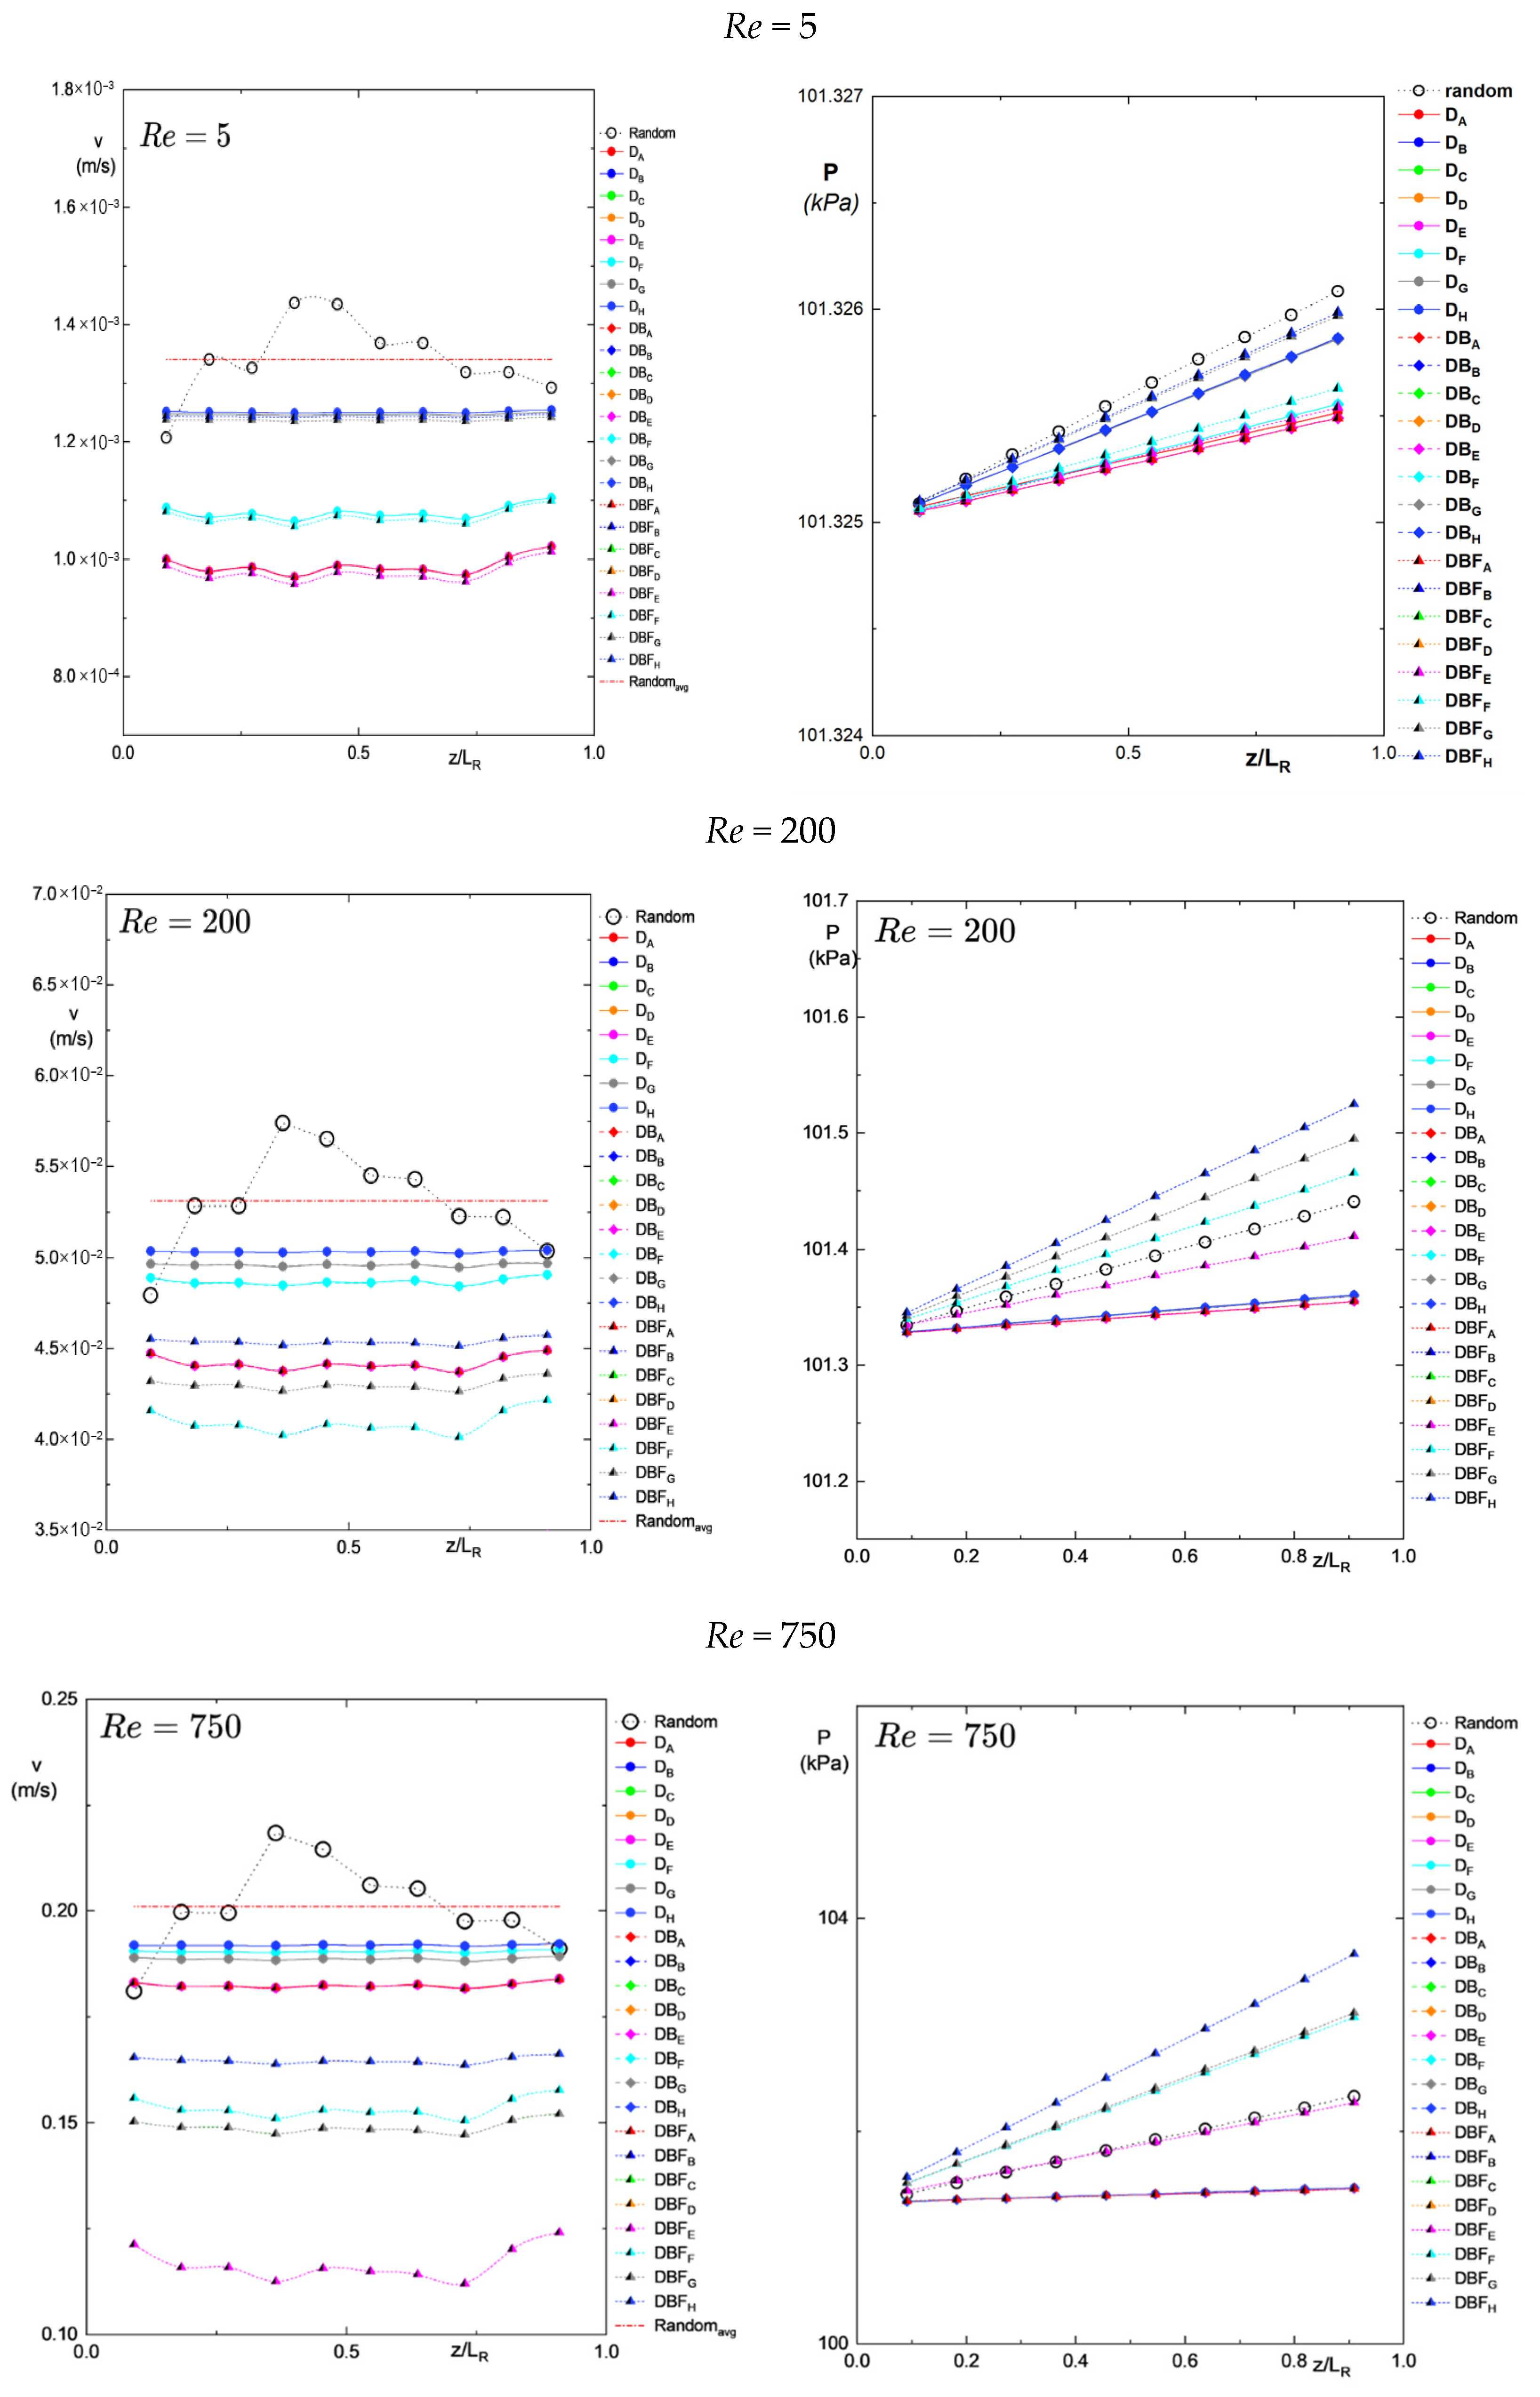
Figure 10 shows the velocity and pressure fields at different Reynolds numbers for all cases of the PHM implemented and whose details are specified in Table 1, while Figure 11 shows the substrate and product concentration fields for the same cases.
Figure 10.
Velocity and pressure fields at different Reynolds numbers for PHM of Table 1.
Figure 11.
Urea and NH3 concentration at different Reynolds numbers for PHM of Table 1.
3.4. Evaluation of Predictability of Pseudo-Homogeneous Model
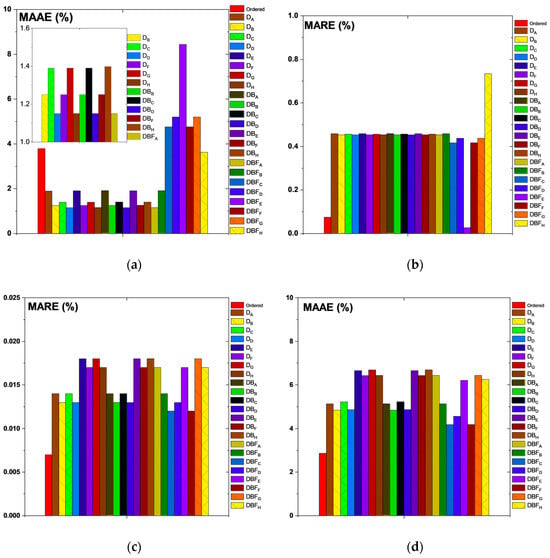
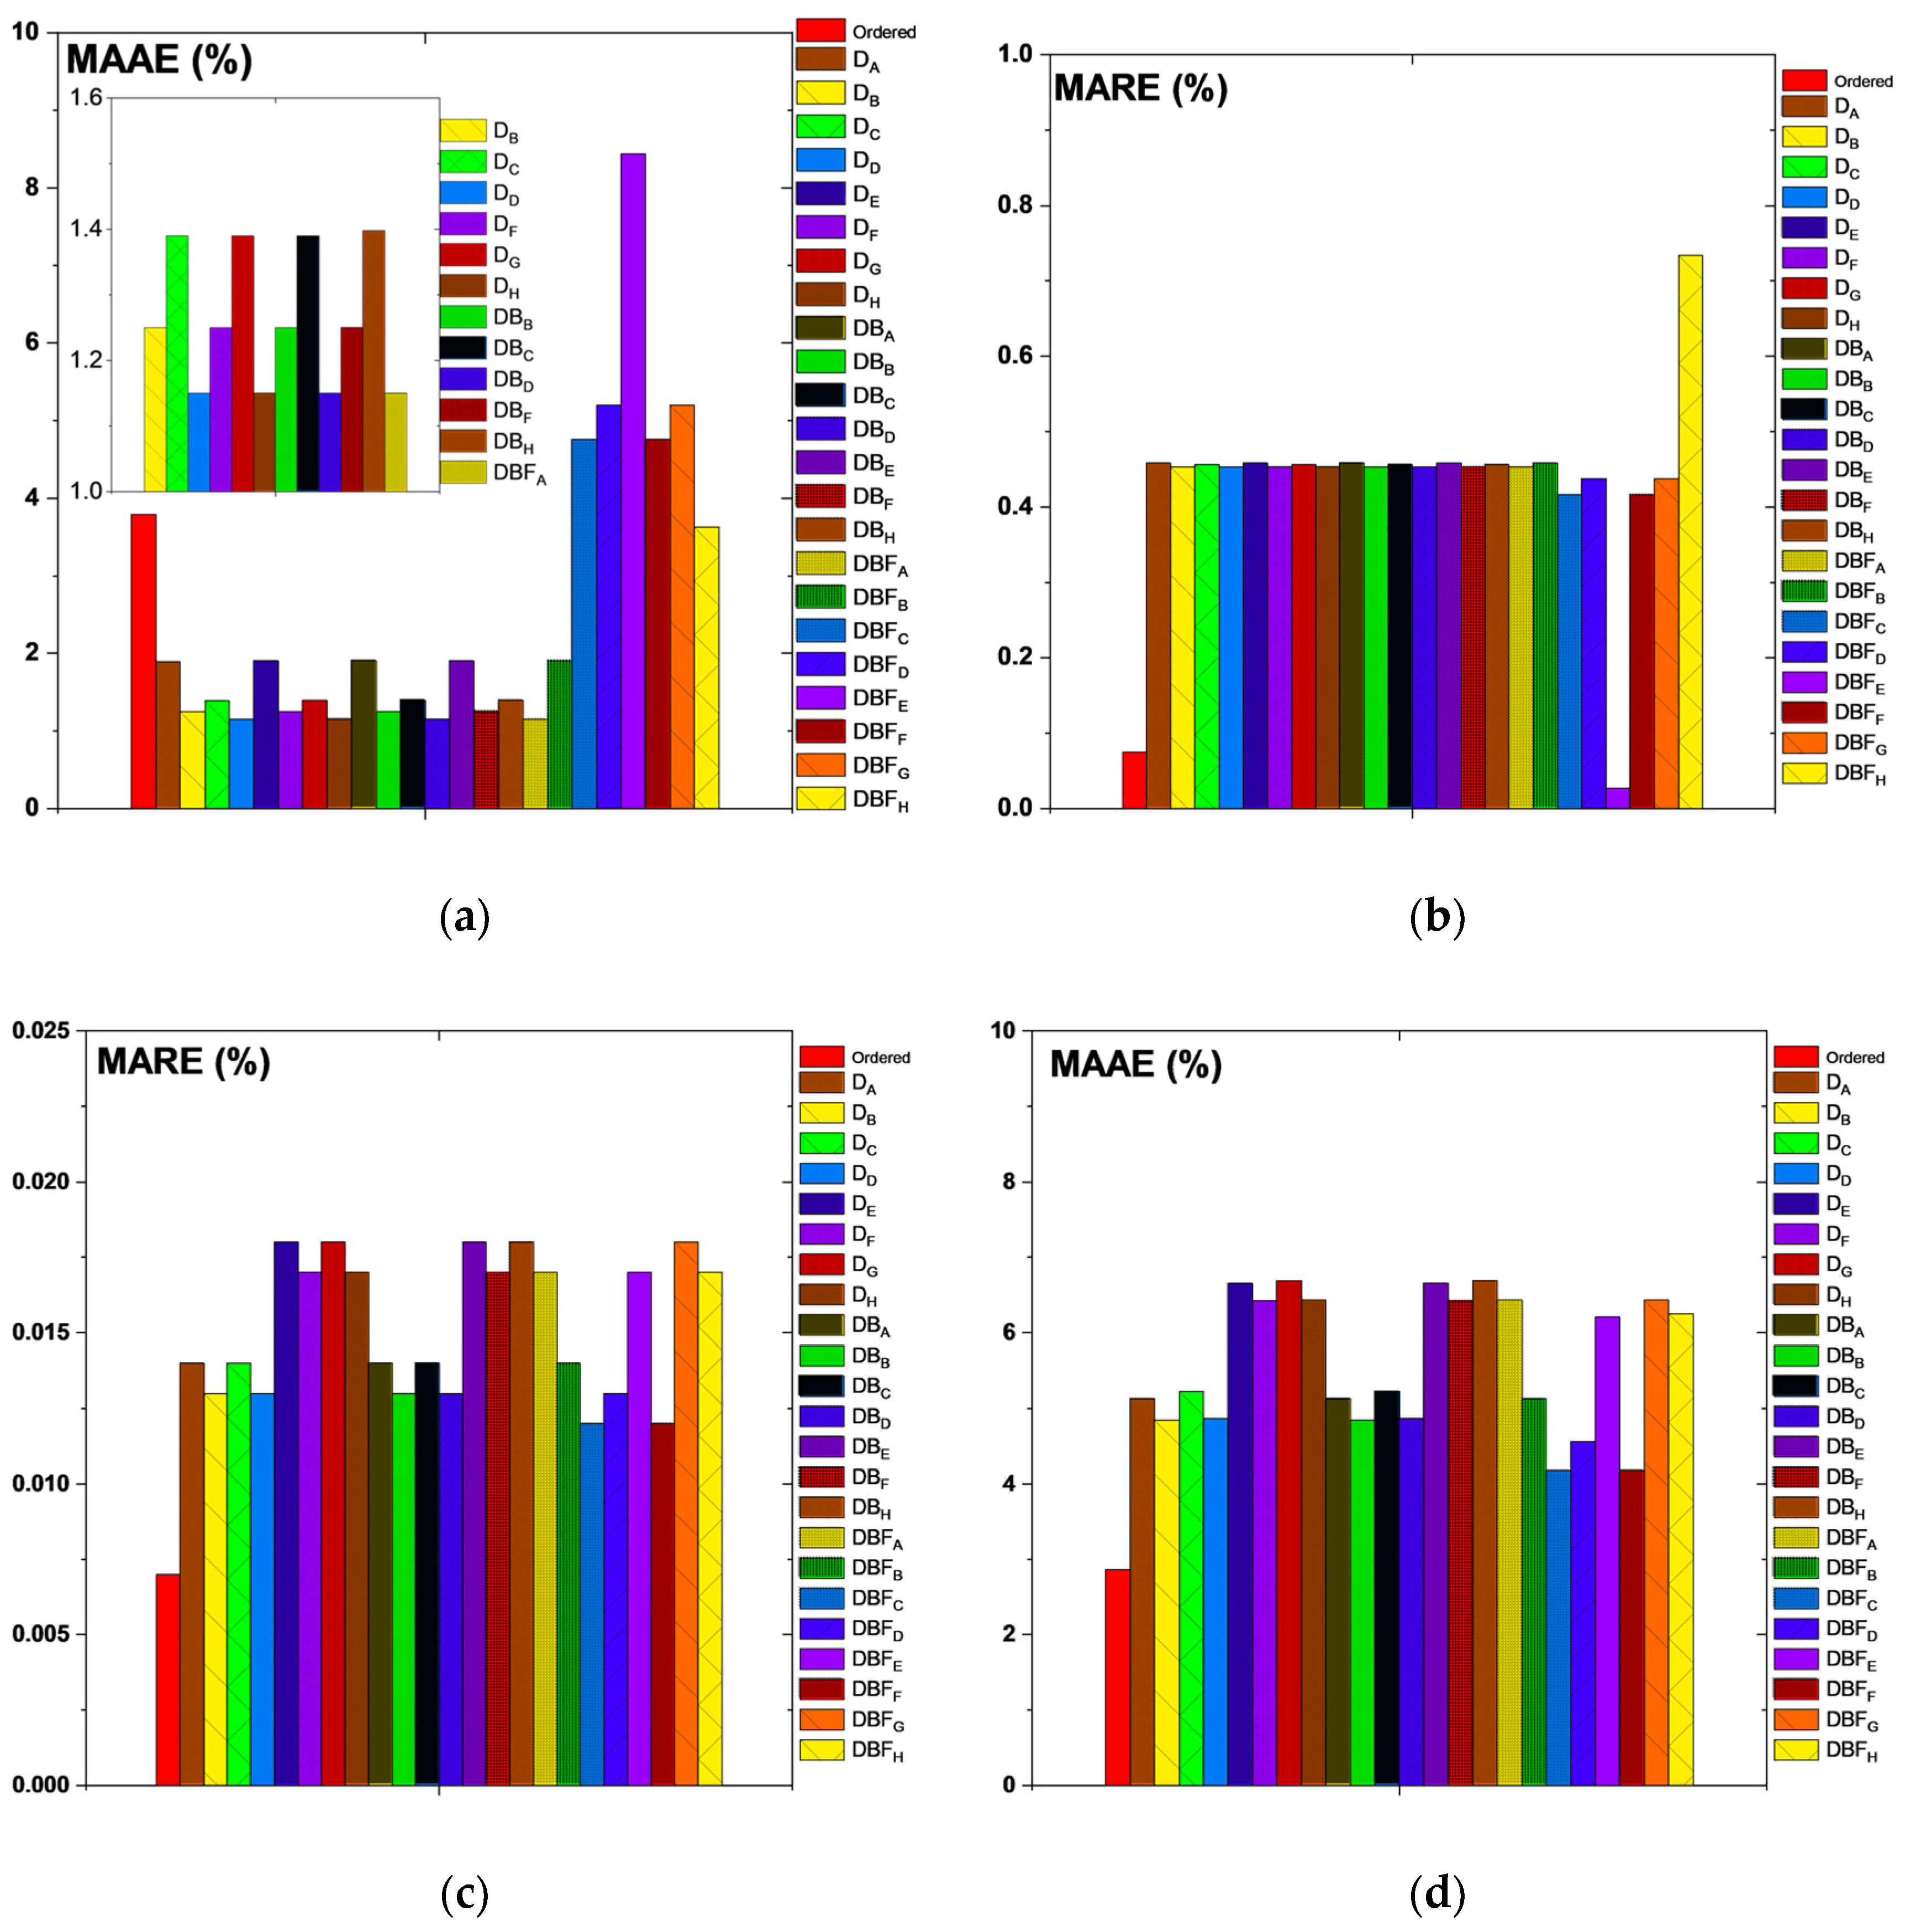
To compare the predictive capacity of the different cases of the implemented PHMs (Table 1) with respect to what the PRM predicts for the random PB (used as a reference), the corresponding absolute errors (AE) and the relative errors (RE) of the velocity, pressure and of urea and NH3 concentrations were evaluated; these errors at different axial positions are shown in Figure 12 for Re = 750.
Figure 12.
(a) Mean Absolute Average Error (MAAE) for velocity; (b) Mean Absolute Relative Error (MARE) for Curea at Re = 750; (c) Mean Absolute Relative Error (MARE) for pressure; and (d) Mean Absolute Average Error (MAAE) for CNH3 for Re = 750.
The direct assessment of the predictive capacity of the pseudo-homogeneous models implemented from the results equivalent to those shown in Figure 12 is complicated because there is a different predictive capacity for the different fields of interest: velocity, pressure, and concentration. In addition, it is required that the selected models adequately reproduce both the bed hydrodynamics and mass transport in the range of Reynolds number values evaluated in this study.
A weighting function (Equations (43) and (44)) was used to select the best-performing models based on their predictive capacity.
In Equation (43), i is the number of intervals into which the range of values of the errors (MAAE and MARE) is divided, and the term implies that the variation in errors in the i-intervals is quadratic. Equation (44) is a weighting function “”, which converts the normalized value of between 0 and 1 and assigns a decreasing weight as e approaches .
The predictive capacity of the models with the best prediction was carried out through the selection of the models with the smallest normalized and weighted MAAE’s and MARE’s for the four variables evaluated in this study, in the range of Reynolds numbers evaluated in this study.
To evaluate the robustness of the selected optimal PHM configuration, a comprehensive sensitivity analysis was performed by varying both the weighting factors and the aggregation exponent used in the global performance index (see the sensitivity analysis section of the Supplementary Materials for more details). All performance indicators (velocity, pressure, NH3 concentration, and urea concentration MAREs) were first normalized with respect to their maximum values to ensure comparability across criteria.
In addition to the equal-weight scenario (0.25 assigned to each criterion), two alternative weighting schemes were considered: (i) mass–pressure emphasis and (ii) chemically oriented emphasis. Furthermore, the aggregation exponent was varied (n = 1 and n = 2) to evaluate the influence of nonlinear penalization on the global index. The results indicate that configuration DD (See Table S3) achieves the highest global performance under the balanced weighting scheme and remains the top-ranked alternative when mass and pressure receive greater emphasis. However, when chemical criteria are given relatively higher importance, configuration DBFC (See Table S3) becomes the best-performing option. Importantly, across all weighting scenarios and for both exponent values, configurations DD, DBD, and DBFC consistently remain within the top-ranking positions.
Although minor shifts occur in the intermediate rankings depending on the weighting scheme and exponent value, the leading group of configurations remains stable. This demonstrates that the identified optimal solutions correspond to structurally balanced designs rather than configurations that maximize a single performance criterion. Overall, the sensitivity analysis confirms that the global performance assessment is robust with respect to reasonable variations in weighting assumptions and aggregation exponent and that configurations DD, DBD, and DBFC represent the most competitive and stable PHM designs under multi-objective evaluation.
3.4.1. Hydrodynamics Model Selection
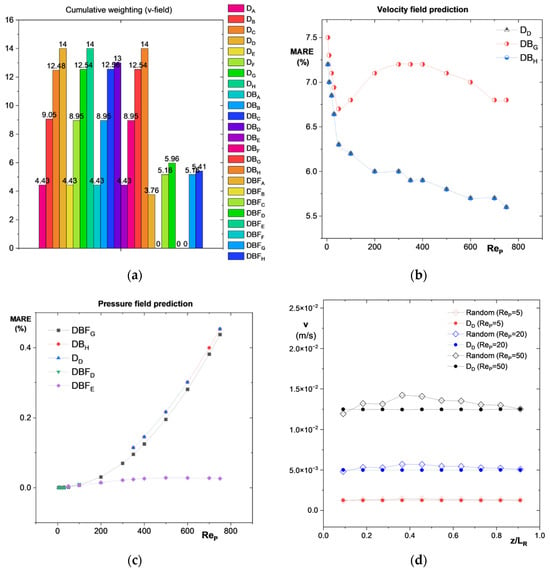
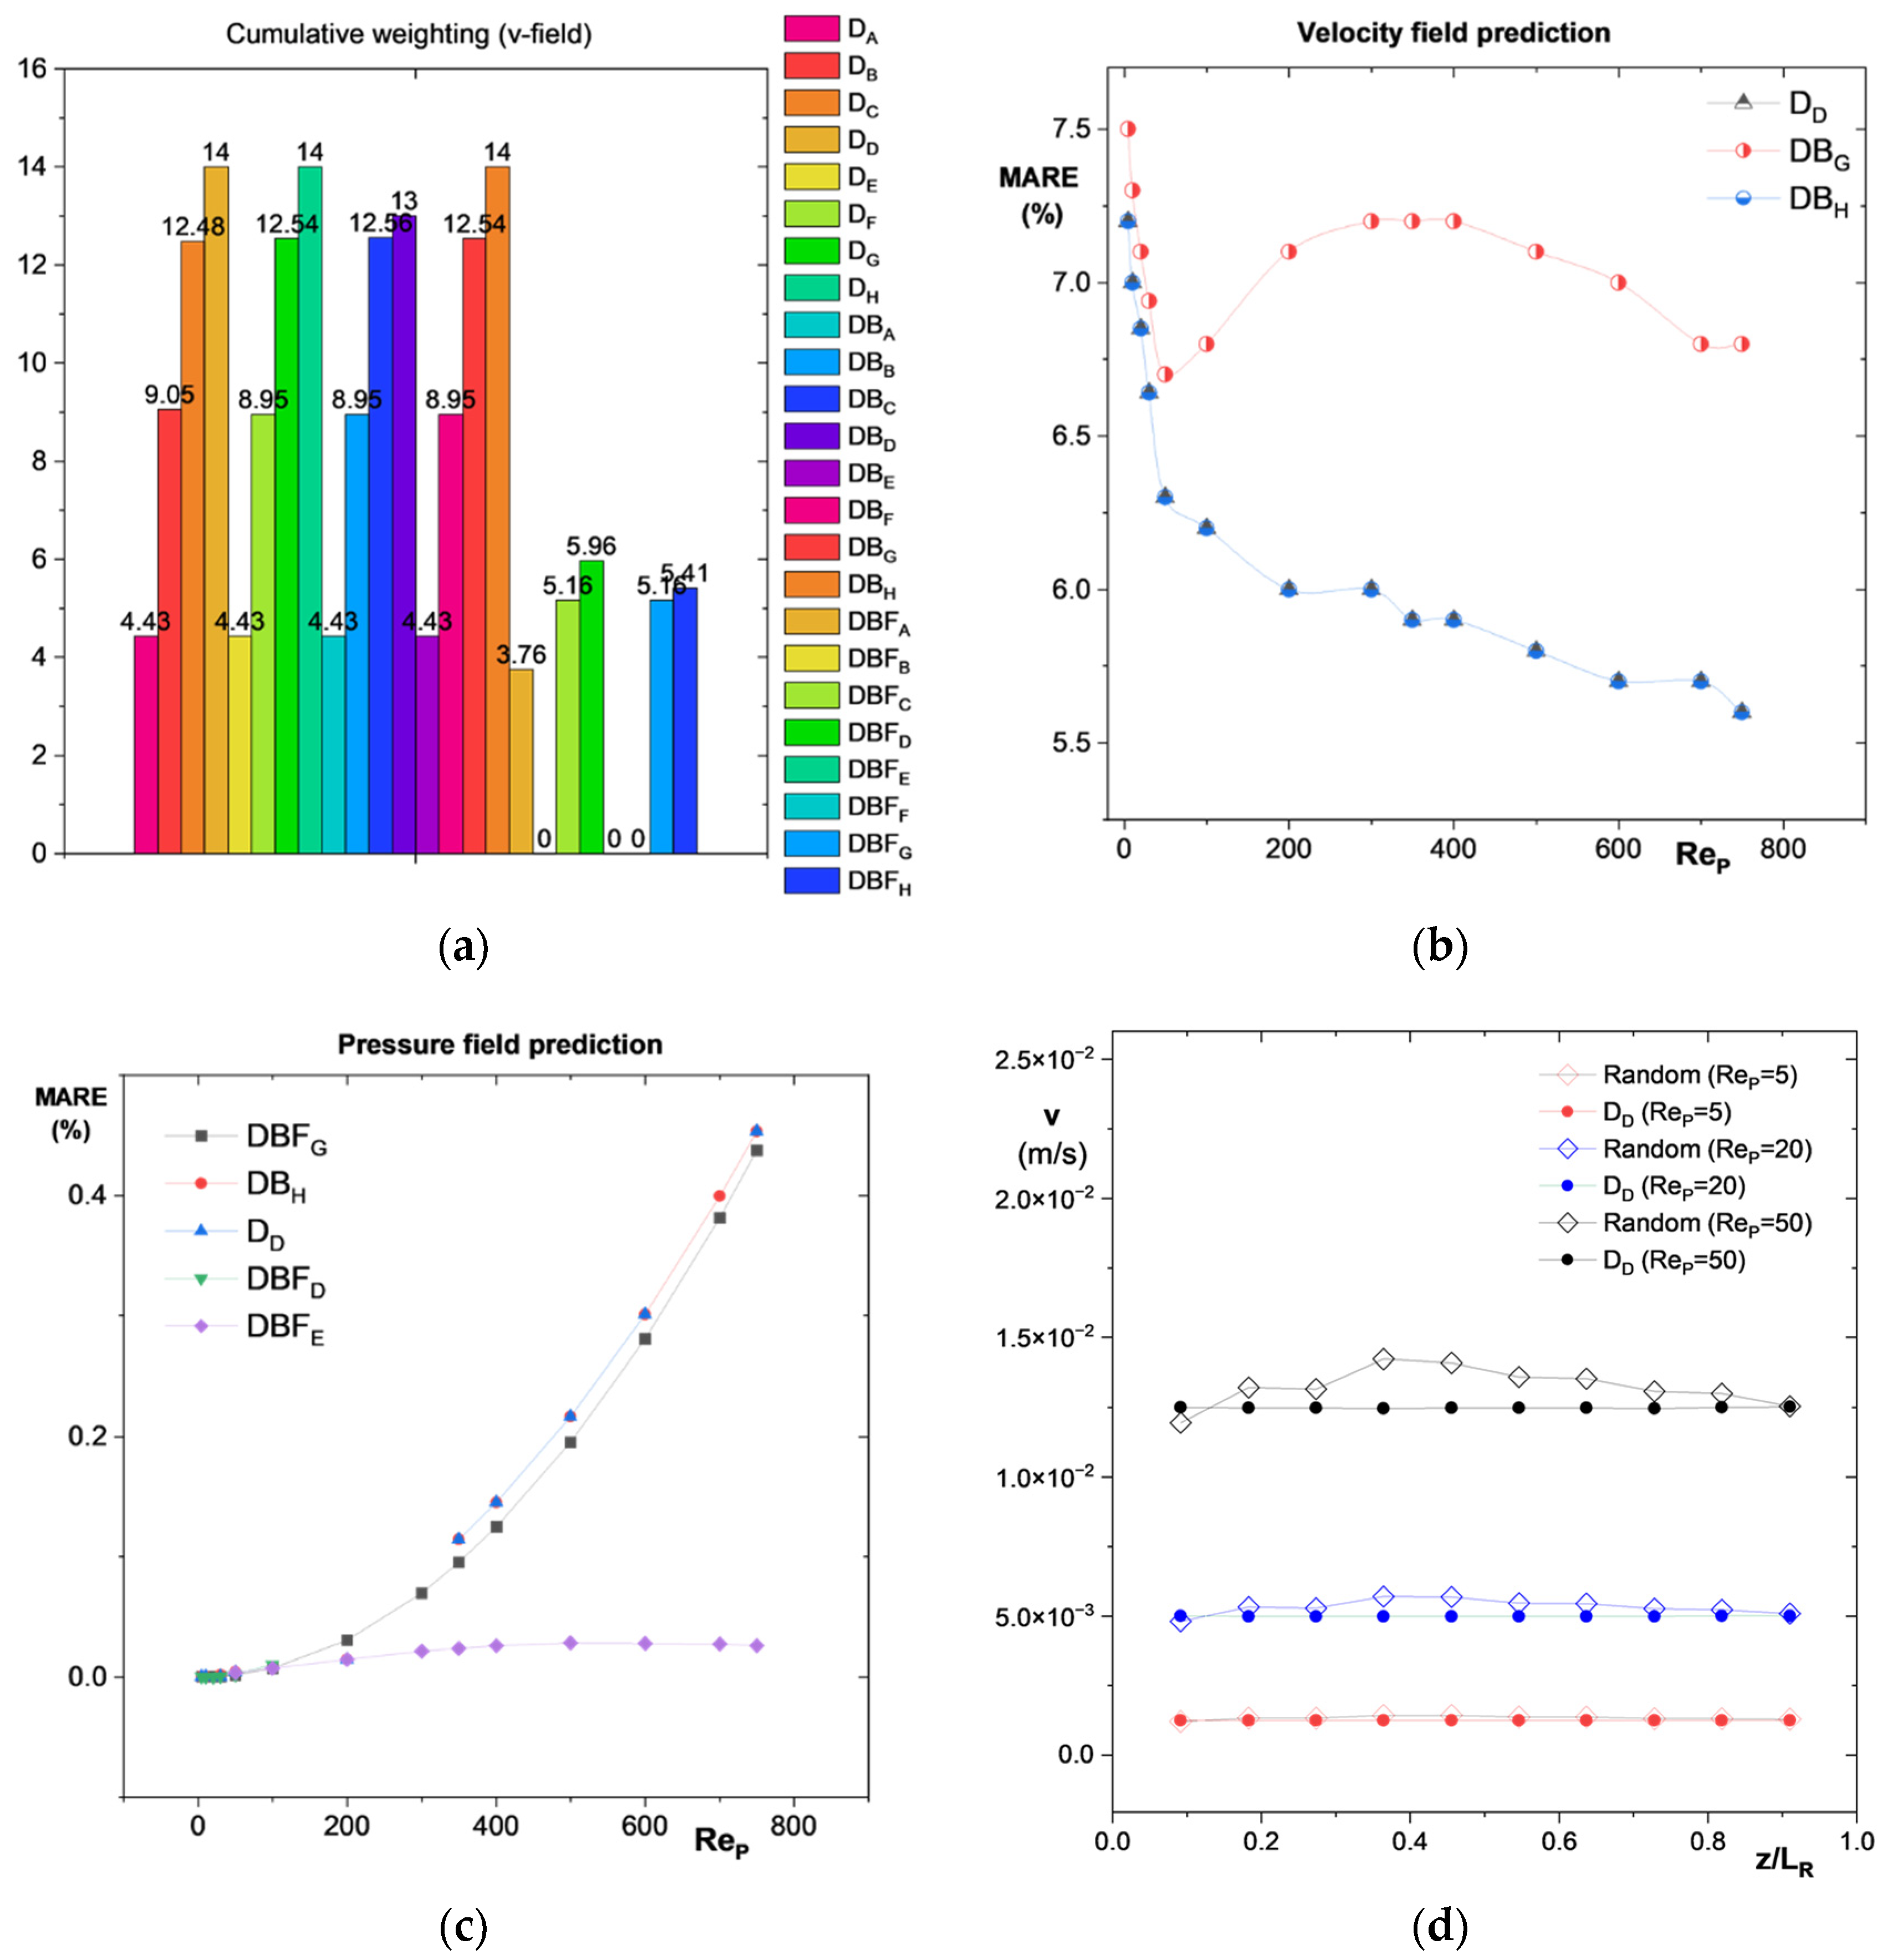
The selection of the best cases for hydrodynamic prediction was made taking into account the cases with the highest weighting values, evaluated according to Equation (44), and the cases with the smallest normalized and weighted MAAE and MARE, for both the velocity and pressure fields in the Reynolds number range .
The details of this analysis can be seen in Figure 13. Figure 13a shows the results of the weighting analysis of the cases in Table 1 for evaluating the velocity field prediction. Figure 13b and Figure 13c show the variation in the MARE at different Reynolds numbers for the best-case predictions of both velocity and pressure, respectively. Finally, Figure 13d shows a comparison of the velocity field predictions for the DBFD case.
Figure 13.
Analysis and selection of the hydrodynamic model. (a) Cumulative weighting of velocity fields; (b) MARE for velocity field; (c) MARE for pressure fields; (d) comparison of the velocity fields predicted by the random PRM and the PHM DBFD case at different Reynolds numbers (ReP).
Figure 13a shows the cumulative weighting for the cases analyzed in the Reynolds range studied, and Figure 13b and Figure 13c show the percentage of MARE for the cases with the best predictive capacity for both the velocity and pressure fields, respectively. Figure 13d shows the predictive capacity of the case with the best capacity in evaluating the velocity field at different Reynolds numbers ().
The best predictions for velocity fields are provided by the DD, DBD, DH and DBH for which the average MARE (in the range of ) is between 6.19 and 6.29%. The DG, DBG, DC and cases also show adequate, though slightly lower, prediction, with an average MARE (in the range of ) around 7.05%.
It is important to mention that the DD, DBD, DH and DBH cases do not include the radial porosity function, unlike the DG, DBG, DC and DBC cases, which do; however, for the system under study (small N, and ), the inclusion of the radial porosity function does not imply an improvement in the predictive quality of the velocity and pressure field in the PBR. This is consistent with what has been previously observed in reference [27].
For pressure prediction, the cases with the best predictive quality are the DBFD case in the range of with an average MARE in the range of 0.0023%, while the DBFE case has an average MARE of 0.020% in the range of . On the other hand, the DD and DBFG cases also have adequate pressure field prediction quality, but practically across the entire range , showing MARE of 0.12% and 0.11% respectively, which, although higher than the DBFD and DBFE cases, the differences with respect to the heterogeneous model are acceptable, as shown in Figure 13c. Furthermore, it is important to highlight that while the DD does not include the porosity function, the DBFG case does, and yet the predictive quality of both models is practically the same (Figure 13c) for pressure field prediction. Finally, it is important to emphasize that both the DD and DBD cases have good predictions for both velocity and pressure fields.
3.4.2. Mass Transport Model Selection
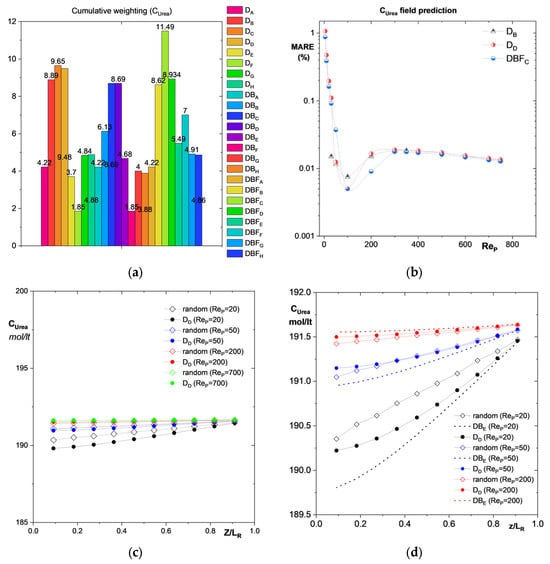
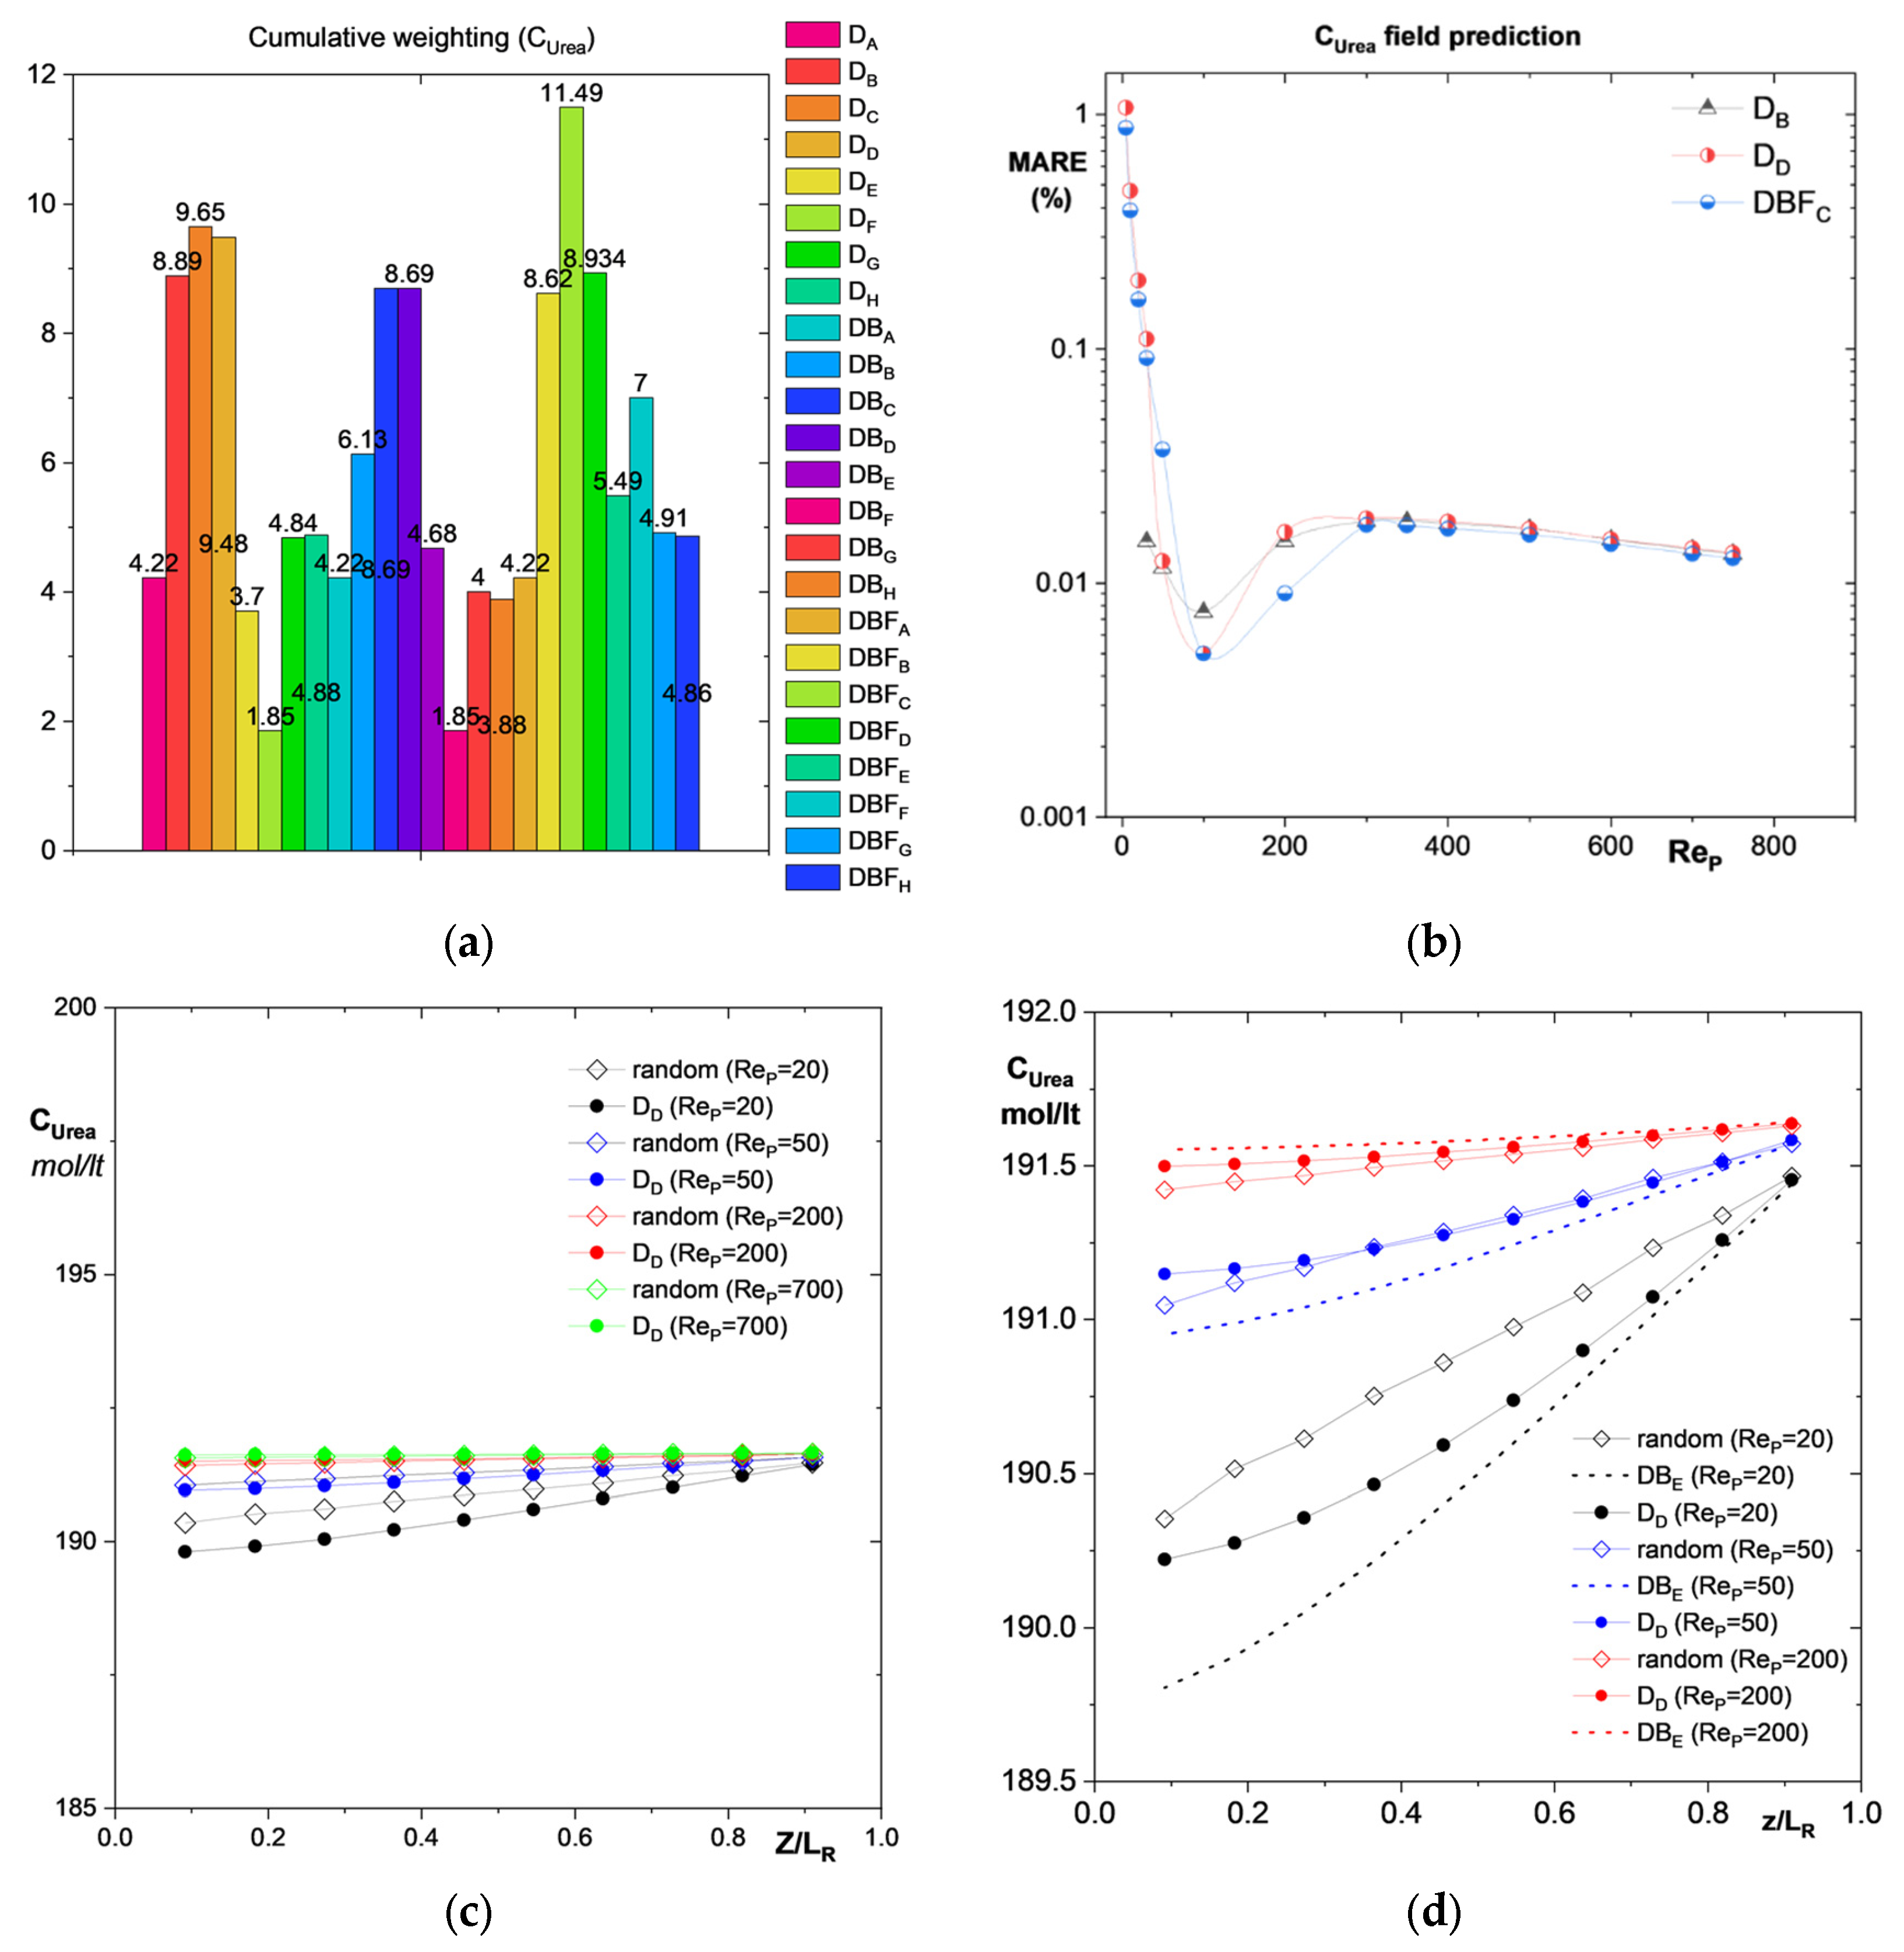
To select the models with the best predictive quality for the concentration fields, a similar procedure was followed to the selection for the velocity and pressure fields, that is, using the cases with the highest weighting values (Figure 14a) and the cases with the smallest normalized and weighted MAAE’s and MARE’s (Figure 14b). The best cases for predicting concentration fields correspond to cases DB, DD and DBFC, for which the MARE (in the range of ) are 0.014%, 0.15%, and 0.11%, respectively. Of these cases, DB and DD do not include the radial porosity function and only the DBFC case includes this effect.
Figure 14.
Analysis and selection of the mass transport model. (a) Cumulative weighting of substrate concentration fields; (b) MARE for the predictive substrate concentration fields; (c) predictive substrate concentration fields from the selected model; (d) quality assessment of the predictive substrate concentration fields, comparison of best predictive capacity (DD) and the DBE case at different Reynolds numbers (ReP).
On the other hand, the effect of porosity variation on permeability and on the dispersion coefficient does not have a significant effect on the predictive quality of velocity, pressure, and concentration fields.
The above can be seen in Figure 14a, where for cases DB, DBB and DBFB (which consider the effect of ), the cumulative weighting values are 4.2, 6.13, and 8.62, respectively, while the cases with the highest cumulative weighting values are DBFC, DC and DD with values of 11.49, 9.65 and 9.48, respectively.
Something similar can be seen in Figure 14a, regarding the effect of ; in this case, the cases that consider said effect are the DH, DBH and DBFH with values of 4.8, 3.8 and 4.86, respectively, which are very far from those of the cases with higher cumulative weighting values (11.49, 9.65 and 9.48).
Figure 14a shows the cumulative weighting for the cases analyzed in the studied Reynolds range, Figure 14b shows the percentage of MARE for the cases with the best predictive capacity of the substrate concentration fields, Figure 14c shows the predictive capacity of the best case for evaluating the substrate concentration field at different Reynolds numbers, Figure 14d shows the comparison of the quality of the predictive capacity of the case with the best predictive capacity (DD) and the DBE case, which exhibits a lower predictive quality at different Reynolds numbers ().
Finally, Figure 14c shows the predictive capacity of the model to reproduce the results of the random heterogeneous model in the studied range of Reynolds numbers, while Figure 14d shows the comparison between the predictive capacity of the velocity fields of the best case (DD and DBD) with respect to another case with lower predictive capacity (DBE).
3.5. Bioreactor Sizing
Once the model providing the best predictive quality (DD and DBD) was selected, it was implemented in a CFD simulation to size the PBR, which would allow the degradation of urea from human urine through bio-catalyzed hydrolysis by the urease enzyme. Since the PBR is intended to have dimensions compatible with the sanitary installations of public buildings, where the pipes are 2 inches in diameter, the variable to be determined is the length of the PBR. Also, Table 4 displays the best operating conditions of PBR during the sizing reactor test.
Table 4.
PBR operating conditions and properties for enzymatic hydrolysis of urea.
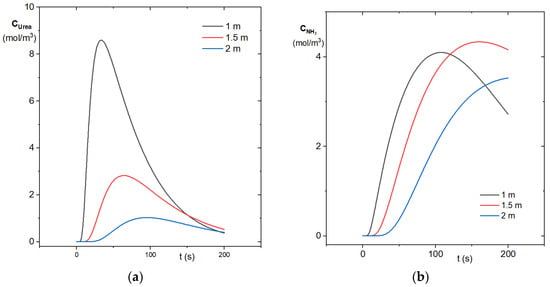
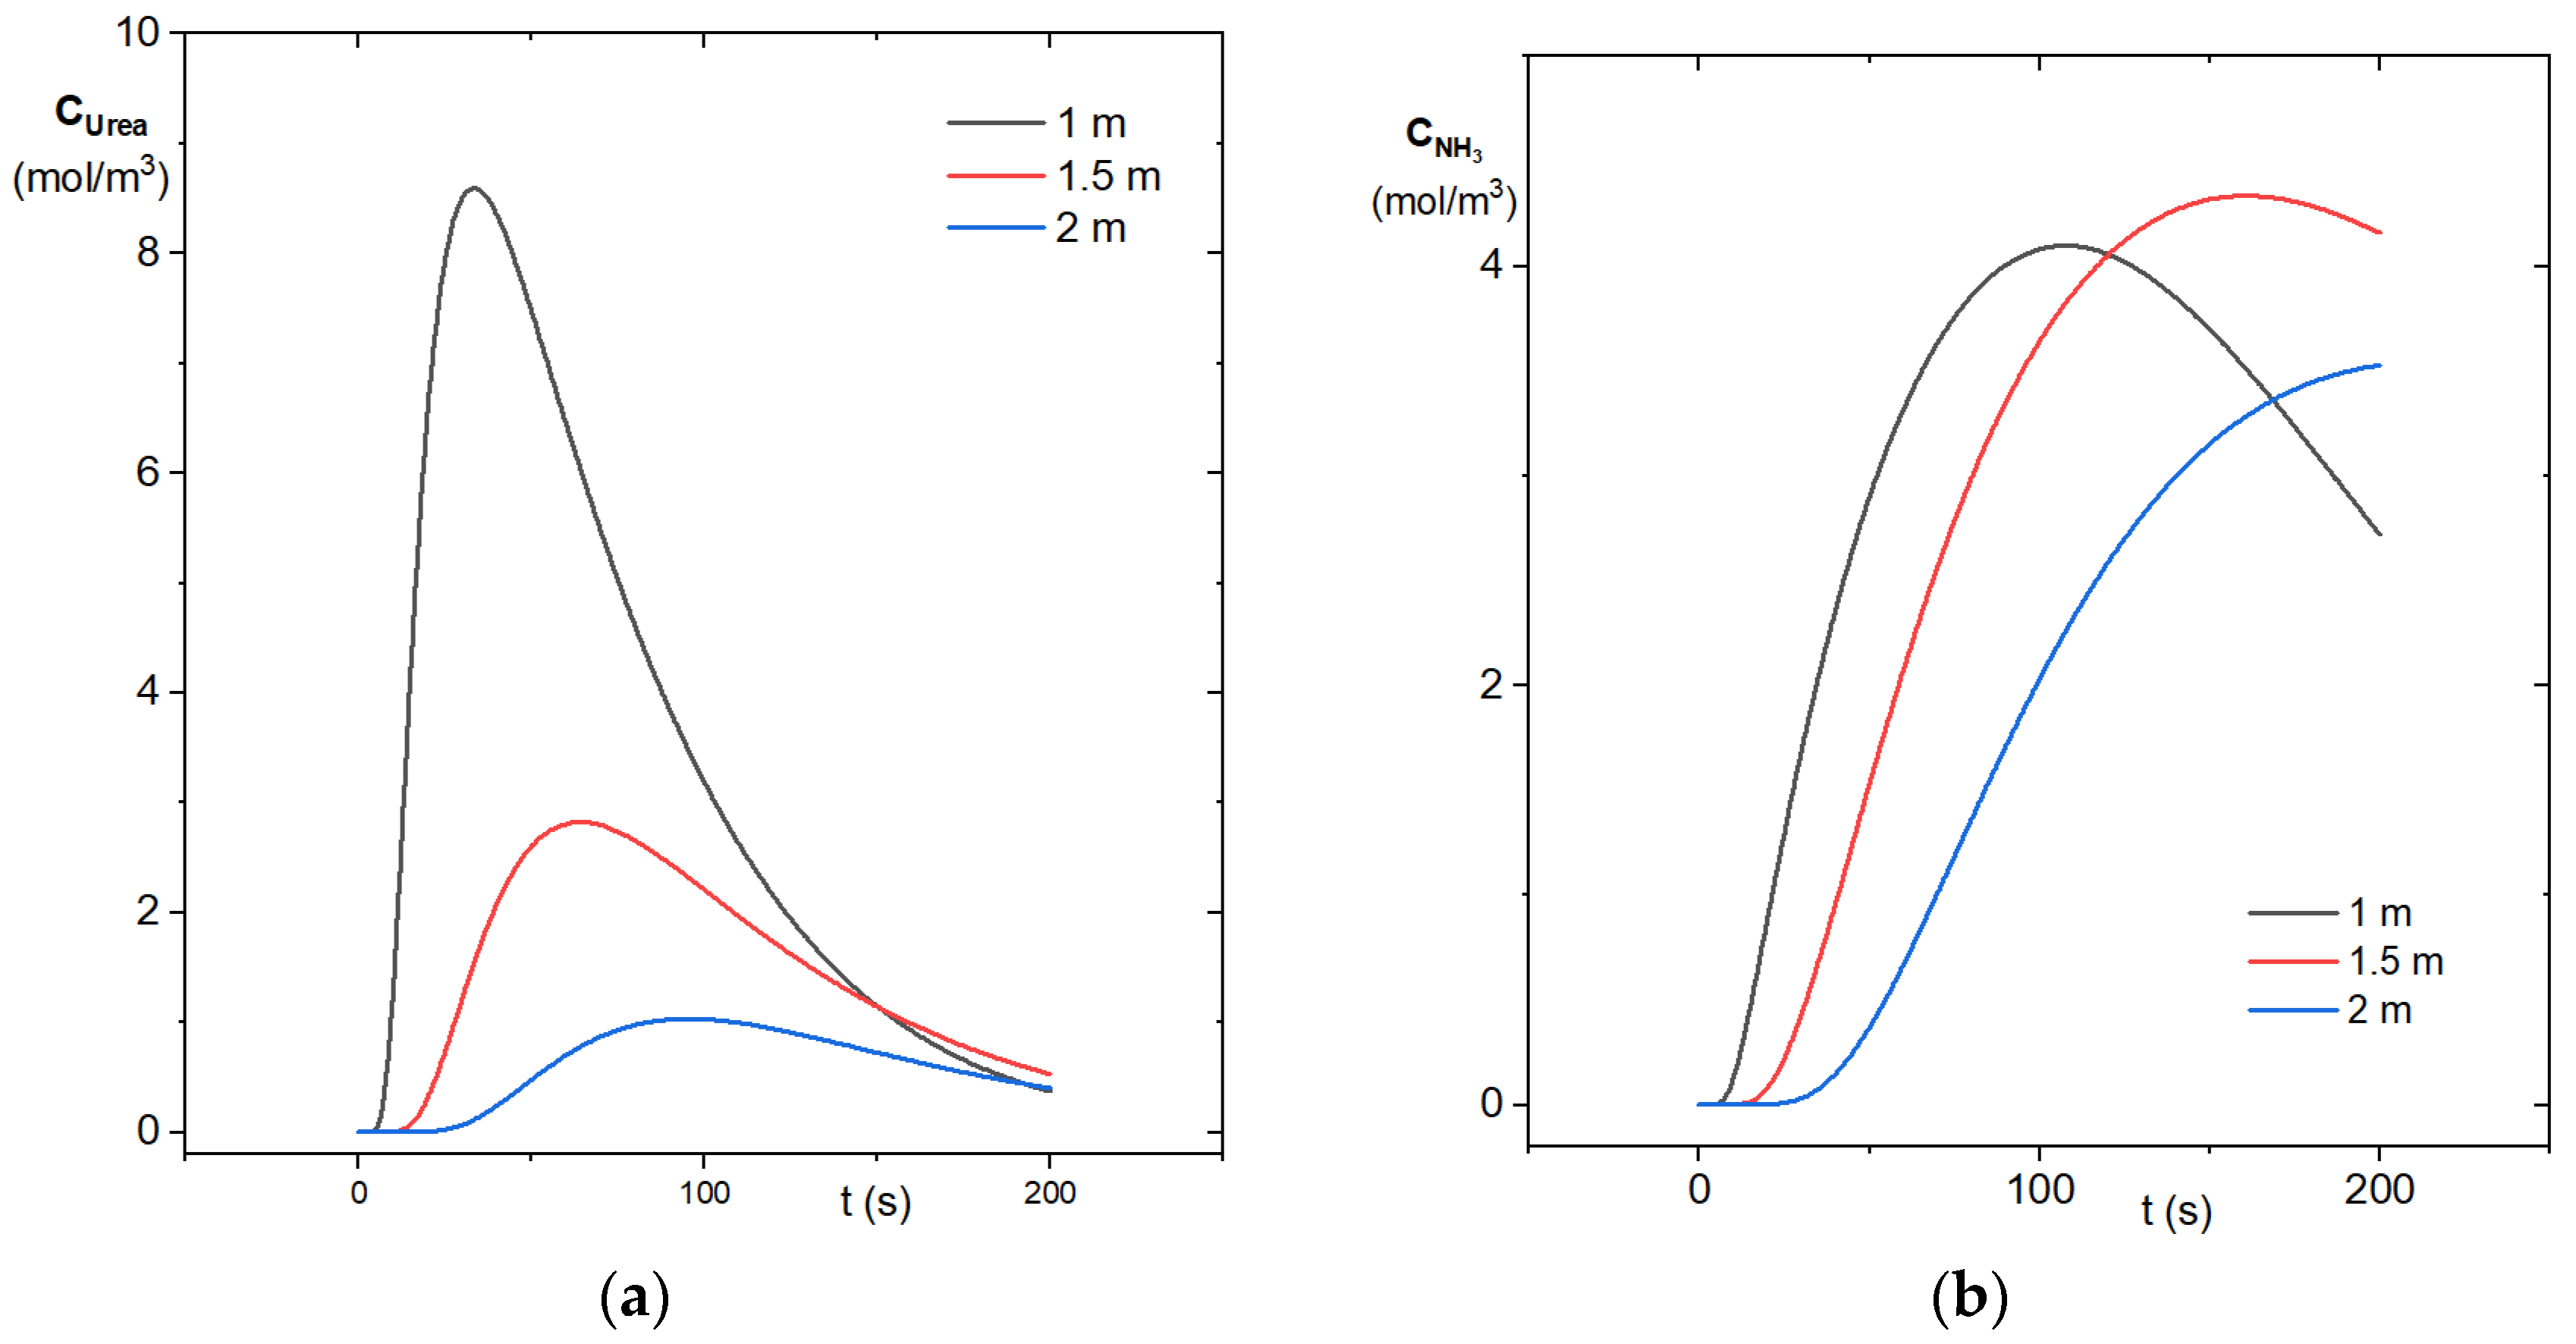
Figure 15 shows the average concentrations at the reactor outlet with different packed bed lengths, both for the substrate (Figure 15a) and for the product (Figure 15b). The figures show that with a packed bed length of 1 m, the average urea concentration drops from to a maximum average concentration of , representing a conversion of . For 1.5 m of packed bed, the average concentration of urea drops from to a maximum average concentration of , representing a conversion of . Given the above, a packed reactor of 2 m in length is considered sufficient to treat the fed urea stream, and the proposed system is feasible.
Figure 15.
Evolution of the average outlet concentration for (a) substrate and (b) product under transient pulsed feeding conditions (sanitary flushing event), simulated for various packed bed lengths (i.e., different reactor volumes).
The profiles shown in Figure 15 correspond to transient pulse operation, where both inlet velocity and substrate concentration vary in time to simulate a sanitary flushing event. The initial increase in outlet concentration corresponds to the arrival of the inlet pulse at the reactor exit. The peak value reflects the interplay between convection and reaction during pulse propagation. The subsequent decay occurs once the inlet pulse ends and the reactor gradually approaches its initial state.
It is important to highlight that the reactor does not increase total nitrogen release, as ammonia formation is stoichiometrically determined by the initial urea concentration. Instead, it redistributes the nitrogen temporally and spatially under controlled conditions.
The pressure drop was estimated using the wall-corrected correlation, in agreement with reference [43,44], appropriate for low tube-to-particle diameter ratios (N ≈ 9). Under the simulated condition corresponding to Rep = 750 (interstitial velocity, v ≈ 0.205 m/s; superficial velocity, u ≈ 0.10 m/s), the predicted pressure drop is approximately 3.3 kPa per meter of packed bed. This value remains compatible with gravity-driven sanitary operation, even for packed sections up to 2 m in length. For more conservative or realistic flush scenarios involving higher instantaneous velocities, the pressure drop could increase. However, the particle diameter represents a practical design parameter to maintain hydraulic compatibility. Increasing pellet size reduces inertial losses proportionally to 1/dp, providing a straightforward strategy to ensure ΔP remains within acceptable limits without compromising reactor integration into existing sanitary piping. In addition to pressure drop analysis, hydraulic stability was assessed under the criterion of no persistent liquid holdup after the flush event. Given the moderate Reynolds number (Rep = 750), the absence of excessive pressure buildup, and the gravity-driven configuration, no flooding or liquid accumulation is expected within the packed section.
4. Conclusions
This work provides a comprehensive assessment of pseudo-homogeneous and particle-resolved modeling approaches for packed-bed reactors operating under reactive conditions, with direct application to urea hydrolysis from human urine.
The incorporation of radial porosity distributions and their influence on effective transport properties was tested to determine its relationship with the improvement of predictive quality in reactors with low reactor-to-particle diameter ratios. The radial porosity distributions obtained from detailed geometric constructions carried out in this work showed that randomly packed beds exhibit oscillatory porosity variations closely consistent with the de Klerk correlation, while ordered strata closely follow the Vortmeyer exponential correlation. This agreement supports the structural representativeness of the generated packing geometries and reinforces the physical credibility of the particle-resolved simulations.
By systematically comparing hydrodynamic and mass transfer predictions over a wide range of Reynolds numbers, the study demonstrates that carefully formulated pseudo-homogeneous models can closely reproduce the behavior of fully resolved heterogeneous simulations (with accumulated average relative errors below 8%) while requiring significantly lower computational effort.
The results indicate that, for the reactor configuration and operating conditions analyzed in this study, the explicit inclusion of a radial porosity distribution does not significantly improve the predictive quality of the pseudo-homogeneous models (DD, DBD vs. DBH, and DBH). Specifically, incorporating the porosity function resulted in only marginal changes in the predicted velocity, pressure, and concentration fields compared to particle-resolution simulations. Furthermore, the propagation of the radial porosity variation effect on permeability and dispersion coefficients led to slightly less accurate predictions. This suggests that, within the investigated Reynolds number range and for the relatively small ratio between reactor diameter and particle size, the dominant hydrodynamic and mass transfer behavior is adequately captured by models using averaged effective properties. Consequently, the added complexity associated with considering spatial variations in porosity and porosity-dependent transport coefficients does not translate into a proportional gain in accuracy, supporting the use of simpler pseudo-homogeneous formulations for practical design and simulation purposes under similar conditions.
Finally, the pseudo-homogeneous models demonstrating the highest predictive consistency with the particle-resolved simulations (DD and DBD) were successfully applied to the sizing and design of a compact packed-bed bioreactor compatible with standard sanitary infrastructure, demonstrating the technical feasibility of recovering nitrogen from human urine through enzymatic urea hydrolysis .
It is important to emphasize that the present work constitutes a model-structure and predictive-consistency assessment rather than a full experimental validation of urease-driven hydrolysis in real urine matrices. While hydrodynamic behavior was benchmarked against established correlations and radial porosity distributions were consistent with the literature, the incorporation of urine-matrix biochemical effects and dedicated experimental verification remain necessary steps for future studies.
Supplementary Materials
The following supporting information can be downloaded at: https://www.mdpi.com/article/10.3390/pr14050817/s1.
Author Contributions
Conceptualization, H.P.-P., E.P.-R. and A.R.-M.; methodology, M.E.C., L.G.Z. and S.U.; software, M.E.C. and L.G.Z.; validation, M.E.C. and S.U.; formal analysis, M.E.C., L.G.Z. and A.R.-M.; investigation, M.E.C. and S.U.; resources, M.E.C. and L.G.Z.; data curation, A.R.-M., E.P.-R. and H.P.-P.; writing—original draft preparation, M.E.C. and A.R.-M.; writing—review and editing, M.E.C., S.U., E.P.-R., L.G.Z. and H.P.-P.; visualization, A.R.-M. and S.U.; supervision, M.E.C. and L.G.Z.; project administration, M.E.C. All authors have read and agreed to the published version of the manuscript.
Funding
This research received no external funding.
Data Availability Statement
The original contributions presented in this study are included in the article. For further inquiries, please get in touch with the corresponding authors.
Acknowledgments
The authors (M.E.C., L.G.Z., A.R.-M., H.P.-P., and E.P.-R.) are grateful to the Secretary of Science, Humanities, Technology, and Innovation (SECIHTI) for the stimulus provided through the Investigators National System Program (SNII). Also, we are grateful to Derek Joe, an English professor at Universidad del Mar, for his thorough proofreading of the text.
Conflicts of Interest
The authors declare no conflicts of interest.
Abbreviations
| AMRE | Accumulated Average Relative Error (AMRE) |
| CFD | Computer Fluid Dynamics |
| DEM | Discrete Element Method |
| DL | Darcy’s Law |
| EMM | Effective Media Model |
| FBR | Fixed Bed Reactor |
| GRA | Geometry-Resolved Approach |
| HM | Heterogeneous model |
| HCP | Hexagonal close-packed |
| MAE | Mean Absolute Error |
| MRE | Mean Relative Error |
| NS-D | Navier–Stokes–Darcy |
| NSDF | Navier–Stokes–Darcy–Forchheimer |
| NS-DBF | Navier–Stokes–Darcy–Brinkman-Forchheimer |
| PB | Packed Bed |
| PBR | Packed-Bed Reactor |
| PBRs | Packed-Bed Reactors |
| PRCFD | Particle-Resolved CFD Simulations |
| PRM | Particle-resolved model |
| PH | Pseudo-homogeneous |
| PHM | Pseudo-homogeneous model |
| REV | Representative Element Volume |
| RTD | Residence Time Distribution |
| VAM | Volume Averaging Method |
| 2D | Two Dimension |
| Greek symbols | |
| Density of the reacting mixture in k-phase, [kg/m3] | |
| Dynamic viscosity of the reacting mixture in k-phase, [Pa s] | |
| Dynamic viscosity effective (due to viscous diffusion) of the reacting mixture in k-phase, [Pa s] | |
| Porosity or void fraction, [dimensionless] | |
| Radial porosity distribution, [dimensionless] | |
| Average porosity or void fraction, [dimensionless] | |
| Dimensionless distance to the column wall, [dimensionless] | |
| Permeability of the porous media, [m2] | |
| Theoretical maximal rate of the reaction in Michaelis-Menten equation, [1/s] | |
| Nomenclature | |
| Molar concentration of i-species in k-phase, [mol/m3] | |
| Particle or catalyst diameter, [m] | |
| Reactor diameter, [m] | |
| Dispersion coefficient, [m/s2] | |
| Effective diffusivity, [m/s2] | |
| Tensor of hydrodynamic dispersion, [m/s2] | |
| Forchheimer coefficient, [dimensionless] | |
| Michaelis constant (enzyme apparent affinity for its substrate), [mol/m3] | |
| Reactor diameter to catalyst diameter ratio, [dimensionless] | |
| Pressure, [Pa] | |
| Column radius, [m] | |
| Radial coordinate, [m] | |
| Superficial reaction velocity for A-species, [mol/(s m2)] | |
| Volumetric reaction velocity for A-specie, [mol/(s m3)] | |
| Time, [s] | |
| Particle Reynolds number, [dimensionless] | |
| Local velocity of k-phase, [m/s] | |
| Superficial average of property, [Pa s] | |
| Intrinsic average of property, [Pa s] | |
| Subscripts | |
| i-specie | |
| k | k-phase |
| -phase | |
| m | Reference temperature |
References
- Aziz, F.; Wang, X.; Mahmood, M.Q.; Juliette, O.K. Assessing Human Health Risks Associated with Wastewater Flooding. Environ. Impact Assess. Rev. 2025, 115, 108031. [Google Scholar] [CrossRef] [Scilit]
- UN-Habitat Global Report on Sanitation and Wastewater Management in Cities and Human Settlements. Available online: https://unhabitat.org/sites/default/files/2023/06/water_report_web.pdf?utm_source=chatgpt.com (accessed on 21 January 2026).
- Kumar, M.; Shekhar, S.; Kumar, R.; Kumar, P.; Govarthanan, M.; Chaminda, T. Drinking Water Treatment and Associated Toxic Byproducts: Concurrence and Urgence. Environ. Pollut. 2023, 320, 121009. [Google Scholar] [CrossRef] [Scilit] [PubMed]
- Mauerer, M.; Rocksch, T.; Dannehl, D.; Schuch, I.; Mewis, I.; Förster, N.; Ulrichs, C.; Schmidt, U. Replacing Mineral Fertilizer with Nitrified Human Urine in Hydroponic Lettuce (Lactuca sativa L.) Production. Sustainability 2023, 15, 10684. [Google Scholar] [CrossRef] [Scilit]
- Dash, H.; Mozafari, B.; Dereli, R.K.; Cotterill, S. Urine Treatment Technologies Yielding Fertilisers as an End-Product: A Review. J. Environ. Chem. Eng. 2025, 13, 117962. [Google Scholar] [CrossRef] [Scilit]
- AdeOluwa, O.O.; Cofie, O. Urine as an Alternative Fertilizer in Agriculture: Effects in Amaranths (Amaranthus Caudatus) Production. Renew. Agric. Food Syst. 2012, 27, 287–294. [Google Scholar] [CrossRef] [Scilit]
- Nagy, J.; Zseni, A. Human Urine as an Efficient Fertilizer Product in Agriculture. Agron. Res. 2017, 15, 490–500. [Google Scholar]
- Beaune, D. The Use of Urine as Free Fertilizer Increasing Plant Growth. Int. J. For. Hortic. 2018, 4, 24–28. [Google Scholar] [CrossRef] [Scilit]
- Saliu, T.D.; Oladoja, N.A.; Sauvé, S. Eco-Friendly and Sustainability Assessment of Technologies for Nutrient Recovery from Human Urine—A Review. Front. Sustain. 2024, 4, 01–20. [Google Scholar] [CrossRef] [Scilit]
- Rumeau, M.; Pistocchi, C.; Ait-Mouheb, N.; Marsden, C.; Brunel, B. Unveiling the Impact of Human Urine Fertilization on Soil Bacterial Communities: A Path toward Sustainable Fertilization. Appl. Soil Ecol. 2024, 201, 105471. [Google Scholar] [CrossRef] [Scilit]
- Kaji, S.S.; Shareghi, B.; Salavati, M. Urease Activity Protection with EDTA Against Nanoparticles (Fe2O3 and Fe3O4) Inactivation. J. Nanostruct. 2014, 4, 217–226. [Google Scholar] [CrossRef]
- Hearn, E.; Neufeld, R.J. Poly(Methylene Co-Guanidine) Coated Alginate as an Encapsulation Matrix for Urease. Process Biochem. 2000, 35, 1253–1260. [Google Scholar] [CrossRef] [Scilit]
- Diasi, M.; Singh, R.; Mahapatra, A.D.; L, R.; Patel, H.; Ganatra, H.; Datta, B. Ammonium Release in Synthetic and Human Urine by a Urease Immobilized Nanoconstruct. RSC Adv. 2024, 14, 6972–6984. [Google Scholar] [CrossRef] [Scilit]
- Moynihan, H.J.; Lee, C.K.; Clark, W.; Wang, N.H. Urea Hydrolysis by Immobilized Urease in a Fixed-bed Reactor: Analysis and Kinetic Parameter Estimation. Biotechnol. Bioeng. 1989, 34, 951–963. [Google Scholar] [CrossRef] [Scilit] [PubMed]
- Spano, M.B.; Pamidi, A.S.; Liu, M.H.; Evans, A.C.; Weiss, G.A. Optimizing Continuous-Flow Biocatalysis with 3D-Printing and Inline IR Monitoring. ChemCatChem 2024, 16, e202400498. [Google Scholar] [CrossRef] [Scilit]
- Peng, J.; Yu, B.; Yan, S.; Xie, L. CFD Modeling and Simulation of the Axial Dispersion Characteristics of a Fixed-Bed Reactor. ACS Omega 2022, 7, 26455–26464. [Google Scholar] [CrossRef] [Scilit]
- Lovreglio, P.; Buist, K.A.; Kuipers, J.A.M.; Peters, E.A.J.F. Analysis of Particle-Resolved CFD Results for Dispersion in Packed Beds. Fluids 2022, 7, 199. [Google Scholar] [CrossRef] [Scilit]
- Hosseini, S.S.; Sari, A.; Rahimi, A. A Modeling Analysis on Industrial Radial-Flow Packed-Bed Reactors for the Catalytic Dehydrogenation of Long-Chain Normal Paraffins: Appraisal of the Modeling Approach. Chem. Eng. Res. Des. 2024, 212, 121–133. [Google Scholar] [CrossRef] [Scilit]
- Almusafir, R.S.; Jasim, A.A.; Al-Dahhan, M.H. Review of the Fluid Dynamics and Heat Transport Phenomena in Packed Pebble Bed Nuclear Reactors. Nucl. Sci. Eng. 2023, 197, 1001–1037. [Google Scholar] [CrossRef] [Scilit]
- Liu, H.B.; Zhao, C.Y. Effect of Radial Porosity Oscillation on the Thermal Performance of Packed Bed Latent Heat Storage. Engineering 2021, 7, 515–525. [Google Scholar] [CrossRef] [Scilit]
- Calmidi, V.V.; Mahajan, R.L. Forced Convection in High Porosity Metal Foams. J. Heat Transf. 2000, 122, 557–565. [Google Scholar] [CrossRef] [Scilit]
- Dyck, N.J.; Straatman, A.G. A New Approach to Digital Generation of Spherical Void Phase Porous Media Microstructures. Int. J. Heat Mass Transf. 2015, 81, 470–477. [Google Scholar] [CrossRef] [Scilit]
- Vu, J.; Straatman, A.G. Comparison of Pore-Level and Volume-Averaged Computations in Highly Conductive Spherical-Void-Phase Porous Materials. Transp. Porous Media 2018, 124, 509–531. [Google Scholar] [CrossRef] [Scilit]
- DeGroot, C.T. Numerical Modelling of Thermal Dispersion and Viscous Effects in High-Conductivity Porous Materials. Master’s Thesis, The University of Western Ontario, London, ON, Canada, 2009. [Google Scholar]
- Dixon, A.G.; Partopour, B. Computational Fluid Dynamics for Fixed Bed Reactor Design. Annu. Rev. Chem. Biomol. Eng. 2020, 11, 109–130. [Google Scholar] [CrossRef] [Scilit] [PubMed]
- Kern, C.; Jess, A. Modeling of Radial Heat Transfer in Cooled Fixed-Bed Reactors by One- and Two-Dimensional Models: Fischer-Tropsch Synthesis as a Case Study. Chem. Eng. Sci. 2025, 314, 121817. [Google Scholar] [CrossRef] [Scilit]
- Uribe, S.; Qi, B.; Cordero, M.E.; Al-Dahhan, M. Comparison between Pseudohomogeneous and Resolved-Particle Models for Liquid Hydrodynamics in Packed-Bed Reactors. Chem. Eng. Res. Des. 2021, 166, 158–171. [Google Scholar] [CrossRef] [Scilit]
- Hernandez-Aguirre, A.; Hernandez-Rodriguez, R.; Ochoa-Tapia, J.A.; Castillo-Araiza, C.O. Development of a Generalized Pseudo-Continuous Model for Fluid Dynamics in Packed Bed Reactors with a Low Dt/Dp. Chem. Eng. J. 2025, 510, 161298. [Google Scholar] [CrossRef] [Scilit]
- Xavier, K.; Kusum Kumar, B.; Khan, M.S.; Tiwari, S.S.; Goyal, H. Modeling Fixed Bed Reactors as Porous Media Using Unit Cell Simulations. Chem. Eng. Sci. 2026, 320, 122592. [Google Scholar] [CrossRef] [Scilit]
- George, G.R.; Yonge, A.; Crowley, M.F.; To, A.T.; Ciesielski, P.N.; Karakaya, C. Multiscale Characterization, Modeling and Simulation of Packed Bed Reactor for Direct Conversion of Syngas to Dimethyl Ether. RSC Sustain. 2025, 3, 856–874. [Google Scholar] [CrossRef] [Scilit]
- Tak, G.V.; Goyal, H. Modeling Fixed Bed Reactors of Open-Cell Foam Pellets as Porous Media. ACS Eng. Au 2025, 5, 154–167. [Google Scholar] [CrossRef] [Scilit]
- Papkov, V.; Shadymov, N.; Pashchenko, D. Gas Flow through a Packed Bed with Low Tube-to-Particle Diameter Ratio: Effect of Pellet Roughness. Phys. Fluids 2024, 36, 027127. [Google Scholar] [CrossRef] [Scilit]
- Liu, S.; Ahmadi-Senichault, A.; Ben-Abdelwahed, A.; Yao, H.; Lachaud, J. Experimental Investigation and DEM-CFD Analysis of Darcy–Forchheimer Flows in Randomly Packed Bed Systems of Wood Particles. Int. J. Heat Mass Transf. 2024, 235, 126229. [Google Scholar] [CrossRef] [Scilit]
- De Klerk, A. Voidage Variation in Packed Beds at Small Column to Particle Diameter Ratio. AIChE J. 2003, 49, 2022–2029. [Google Scholar] [CrossRef] [Scilit]
- Vortmeyer, D.; Schuster, J. Evaluation of Steady Flow Profiles in Rectangular and Circular Packed Beds by a Variational Method. Chem. Eng. Sci. 1983, 38, 1691–1699. [Google Scholar] [CrossRef] [Scilit]
- Qi, B.; Uribe, S.; Farid, O.; Al-Dahhan, M. Random Trilobe Packing Using Rigid Body Approach and Local Gas-Liquid Hydrodynamics Simulation through CFD with Experimental Validation. Chem. Eng. J. 2022, 435, 134481. [Google Scholar] [CrossRef] [Scilit]
- Deng, S.; Xie, B.; Liu, H. The Recycle of Water and Nitrogen from Urine in Bioregenerative Life Support System. Acta Astronaut. 2016, 123, 86–90. [Google Scholar] [CrossRef] [Scilit]
- Preciado-Estrella, D.A.; Gómez-Sánchez, J.; Herrera-Muñoz, J.; López-Maguey, R.; Sánchez-Aquino, U.; Viana-Álvarez, G. Determinación de Parámetros Uroflujométricos y Su Relación Con Parámetros Antropométricos En Hombres Mexicanos Sin Síntomas Urinarios. Rev. Mex. Urol. 2018, 78, 135–143. [Google Scholar] [CrossRef] [Scilit]
- Das, M.K.; Mukherjee, P.P.; Muralidhar, K. Equations Governing Flow and Transport in Porous Media. In Modeling Transport Phenomena in Porous Media with Applications; Das, M.K., Mukherjee, P.P., Muralidhar, K., Eds.; Springer: Cham, Switzerland, 2018; pp. 15–63. ISBN 978-3-319-69866-3. [Google Scholar]
- Bruneau, C.H.; Mortazavi, I. Numerical Modelling and Passive Flow Control Using Porous Media. Comput. Fluids 2008, 37, 488–498. [Google Scholar] [CrossRef] [Scilit]
- Kozeny, J. Ueber Kapillare Leitung des Wassers im Boden. Sitzungsber. Akad. Wiss. Wien 1927, 136, 271–306. Available online: https://www.zobodat.at/pdf/SBAWW_136_2a_0271-0306.pdf (accessed on 1 December 2025).
- Tseng, S.; Hsu, J.P. A Comparison of the Parameter Estimating Procedures for the Michaelis-Menten Model. J. Theor. Biol. 1990, 145, 457–464. [Google Scholar] [CrossRef] [Scilit]
- Whitaker, S. The Method of Volume Averaging; Springer: Dordrecht, The Netherlands, 1999; Volume 13. [Google Scholar] [CrossRef] [Scilit]
- Eisfeld, B.; Schnitzlein, K. The Influence of Confining Walls on the Pressure Drop in Packed Beds. Chem. Eng. Sci. 2001, 56, 4321–4329. [Google Scholar] [CrossRef] [Scilit]

Disclaimer/Publisher’s Note: The statements, opinions and data contained in all publications are solely those of the individual author(s) and contributor(s) and not of MDPI and/or the editor(s). MDPI and/or the editor(s) disclaim responsibility for any injury to people or property resulting from any ideas, methods, instructions or products referred to in the content. |
© 2026 by the authors. Licensee MDPI, Basel, Switzerland. This article is an open access article distributed under the terms and conditions of the Creative Commons Attribution (CC BY) license.