


Abstract
Higher education institutions commonly employ student evaluation of teaching (SET) instruments (e.g., course evaluation surveys) to enhance course quality and inform instructional strategies. However, conceptualizing and measuring SET as a unidimensional construct may compromise validity, particularly when represented by a single aggregated score. This study uses a network psychometrics approach to explore the validity of a new instrument that acknowledges the multidimensional nature of SET as an educational construct. The central research question is, “How is the robustness of a multidimensional students’ evaluation of the teaching survey?”. The study sample consists of 649 undergraduate students from a western Canadian university who completed a multidimensional SET instrument. The instrument consists of six subscales corresponding to six aspects of SET (i.e., design, utility of course resources, graded work, course delivery, instructional approach, and class climate). The findings revealed a robust line of evidence that supports the validity of the instrument’s interpretation and usage. This was demonstrated through a high coefficient alpha, good network model fit, and stable survey structure. The study provides evidence supporting the use of a multidimensional SET instrument and offers novel validity support via the structural evidence provided by network analysis.
1. Introduction
Student evaluation of teaching (SET) instruments (e.g., course evaluation surveys) have been widely used by higher education institutions as students’ insights are expected to help improve the quality of courses and inform instructors’ teaching strategies [1,2,3]. In addition to being used for formative purposes (e.g., informing instructors about the strengths and weaknesses of their instruction), the results from SET instruments are also used to determine merit, promotion, and tenure decisions as a form of quality control in academic institutions for accountability and auditing purposes [4]. Despite its importance to higher education, the validity of SET instruments has faced widespread criticism. For example, the results of these instruments are likely to be impacted by unintended aspects, such as instructors’ gender, physical attractiveness, and research productivity, which are not necessarily relevant to teaching quality [5,6].
Another limitation of SET instruments lies in their assumption of unidimensionality, which treats SET as a singular construct. This is typically reflected in the common practice of deriving a single overall score from SET instruments to encapsulate teaching quality [4]. However, this approach overlooks the multifaceted nature of effective teaching, which encompasses various elements such as instructor expertise, course components, and teaching methodologies. For a SET instrument to yield meaningful and valid results, it must accurately capture all aspects of effective teaching [7]. This not only holds practical implications but also contributes to theoretical advancements [8]. In the context of SET, it is imperative to develop instruments that accurately reflect teaching quality to maintain accountability in education [9]. Furthermore, SET instruments must prioritize components that significantly contribute to student learning rather than focusing solely on overarching factors like overall satisfaction or course interest [10].
Despite the growing reliance on SET in high-stakes decisions within higher education, research on the validity of SET instruments remains limited [4]. Traditionally, researchers have employed factor analytic methods to explore the validity of SET instruments, aiming to identify the latent variables underlying these instruments. This approach allows for testing hypothesized factor structures, such as a unidimensional factor model implying a single construct of teaching effectiveness. However, an emerging method known as network psychometrics offers a novel perspective to the analysis of SET instruments. Unlike factor analysis, which assumes the existence of latent variables, network psychometrics focuses on the patterns, relationships, and structural consistencies among observed variables within a connected system [11,12]. In this framework, constructs (e.g., different aspects of teaching effectiveness) are assumed to emerge from the interactions among observed variables (e.g., questions in a SET instrument) in a network where observed variables are depicted as nodes, and their partial correlations are shown as edges [13,14].
Unlike factor analysis, the network psychometrics approach imposes no restrictions on the presence and number of latent variables, allowing for a more open-ended exploration of the data [11]. Forgoing the assumption of latent variables enables researchers to investigate the structure and dynamics of the target constructs [11,12,15,16]. Thus, network analysis can be used as an exploratory tool, especially in studies without a strong theoretical structure hypothesized for the relationships among variables. This capability can be especially advantageous in analyzing potentially multidimensional instruments where groupings (i.e., communities) of observed variables may exist in the data [11]. The groupings derived from network analysis can refer to distinct domains within a broader construct.
In this study, we investigate the validity of the Student Perception of Teaching (SPOT) instrument, which is administered to undergraduate and graduate students at the end of each semester to evaluate teaching effectiveness based on multiple aspects of SET. The central research question is, “How is the robustness of a multidimensional students’ evaluation of the teaching survey?”. We aim to generate validity evidence to support the use and interpretation of SPOT results, potentially offering more profound insights into students’ perceptions of teaching quality [7,17]. The innovative aspect of our study lies in the application of network psychometrics, which is a cutting-edge approach that has not yet been explored in the context of SET research [2,18]. Using the network psychometrics framework, we demonstrate how to analyze the results of a multidimensional SET instrument without relying on strong theoretical assumptions (e.g., a unidimensional SET construct).
2. Literature Review
2.1. A Shift from Unidimensionality to Multidimensionality in SET
Dimensionality refers to the number of latent traits (i.e., factors) captured by the items in an instrument. When the instrument is unidimensional, its items measure a single latent trait, while multidimensional measurement occurs when the items assess two or more latent traits [19]. Most instruments designed to measure psychological constructs are inherently multidimensional to some extent, often capturing more than one domain [19,20]. For instance, a survey assessing perceived support might evaluate the support received from family, friends, and significant others [21]. Imposing a unidimensionality assumption on such an instrument can reduce the discriminant validity of its scores by conflating the distinctiveness of responses related to different sources of support, thereby undermining the clarity and utility of the test results [7,19].
From a technical standpoint, applying a unidimensional measurement model to inherently multidimensional data can create a mismatch between the model and the data, leading to construct misrepresentation. This misalignment results in misleading outcomes, making the model unsuitable for practical use [20]. SET instruments are not exempt from the challenges of dimensionality. Higher education institutions often use SET instruments to derive a single total score by summing item scores to quantify teaching effectiveness. However, teaching effectiveness is typically a multidimensional construct and, thus, would be more accurately interpreted within a multidimensional measurement structure [4,22]. In this structure, effective teaching can be viewed as a blend of knowledge and strategies that enhance teaching success and positively impact student learning [23]. For instance, an effective teaching approach may be characterized by a clear course structure, ample course resources, high-quality instruments, and constructive feedback from the instructor [23,24,25]. These components span multiple aspects of teaching and are better captured by a multidimensional instrument rather than oversimplified through a unidimensional approach [26].
Multidimensional SET instruments can offer more valuable insights than their unidimensional counterparts by assessing various aspects of effective teaching, thereby better informing stakeholders’ decisions [27]. Furthermore, teaching effectiveness encompasses multiple dimensions that can be measured separately, such as teaching skills (e.g., communication), subject knowledge (e.g., the ability to answer student questions), and course organization (e.g., lesson planning) [25,28]. By adopting a multidimensional approach to evaluating SET, institutions can obtain more nuanced and accurate results, capturing a broader perspective of teaching effectiveness. This approach also allows for multiple subscores that reflect different facets of teaching, alongside a global score that represents the overall quality [29]. To further clarify the practical and theoretical advantages of a multidimensional approach, Table 1 summarizes key distinctions between unidimensional and multidimensional interpretations of SET instruments.
Table 1.
Comparison of Unidimensional and Multidimensional Approaches to SET Instruments.
2.2. Network Psychometrics for Evaluating Dimensionality
In recent years, network psychometrics has garnered significant attention, particularly in the domain of psychological assessment. Unlike traditional factor analytic approaches, which explain relationships among observed variables through latent constructs, network psychometrics conceptualizes psychological phenomena as systems of directly interacting components. This perspective facilitates a more nuanced understanding of the complex interrelations among test items, offering insights into the structure and dynamics of psychological constructs that conventional methods may overlook.
In this approach, each survey item is treated as a node in a network, and connections between nodes represent how strongly items relate to each other after accounting for all other items. This is similar to creating a map of item-to-item relationships. A key advantage of the network approach lies in its inherent flexibility, enabling researchers to see how groups of items naturally cluster together and which items are most influential within the system. In contrast, factor analysis constrains associations to the level of latent variables, limiting item-level relationships to their respective factors [30]. While factor analytic models can accommodate correlations among item residuals, doing so increases the number of parameters and may impede model convergence [30]. Notably, when the theoretical structure is not well-supported by the data, resulting in multiple plausible model solutions (degrees of freedom equals or greater than 0), network psychometrics tend to be advantageous. It can effectively identify structural patterns and assess their stability through bootstrap resampling, a capacity that traditional factor analytic methods often struggle to match [31,32]. It is important to note that network models identify statistical associations among items rather than causal relationships, and thus the edges in the network graphs should not be interpreted as evidence of causal influence.
The noted distinctions between traditional and network models imply that, when juxtaposed, evidence derived from traditional latent variable models can offer a discrete hierarchical solution to the studied psychological construct (i.e., a simple structure). In contrast, evidence from network psychometrics models can provide a continuous hierarchical solution (i.e., a complex structure), which facilitates the dimensional analysis of a psychological instrument from multiple perspectives [30]. Also, the network approach enables researchers to investigate node centrality, thereby identifying items that wield significant influence through their connections to other nodes to a high degree [14,16,30]. The mentioned distinctions suggest that the network psychometrics approach is a viable alternative to studying the structure of a psychological construct, thereby adding novel lines of evidence to the literature.
Within the framework of network psychometrics, exploratory graph analysis (EGA) has emerged as a particularly effective method for determining dimensional structures, particularly in surveys where constructs exhibit high intercorrelations [33]. EGA identifies the number of dimensions—referred to as communities—by iteratively evaluating the survey structure through bootstrap resampling, a procedure that enhances the robustness of the findings by examining the consistency of the dimensional structure across resampled datasets [34]. This application of bootstrap resampling within EGA enables the flexible examination of a construct’s structure under the network approach, accommodating the inherent variability in data. Moreover, EGA contributes to construct validity by providing robust evidence for the stability of the test’s dimensional structure across diverse resampling conditions. In this study, network psychometrics, specifically the EGA method, was employed to evaluate the dimensional structure of a theoretically multidimensional SET instrument.
Note that while advanced approaches such as bi-factor model partition variance into a general factor and specific subfactors under the assumption of latent causes, network models do not rely on such assumptions [30,33]. Instead, they conceptualize psychological constructs as systems of mutually interacting components, allowing for a more direct exploration of item interdependencies. This makes network models especially useful when theoretical guidance is limited or when the goal is to identify emergent structures empirically. Moreover, network analysis enables visualization of relationships among items, estimation of node centrality to identify influential indicators, and examination of model stability through resampling methods such as bootstrapping. These capabilities extend beyond what other approaches typically provide, thereby offering researchers and practitioners a transparent and data-driven approach for understanding multidimensional constructs like teaching effectiveness.
3. Methods
3.1. Instrument
The concept of effective teaching is inherently multidimensional, necessitating the development of a comprehensive SET instrument capable of gathering nuanced feedback from students to inform instructors and universities in making instructional improvements [35]. Grounded in several established teaching evaluation frameworks such as those from Hoessler and Turner [25], Benton and Cashin [36], Daumiller et al. [37], Medina et al. [38], Penn State University [39], The Purdue Instructor Course Evaluation Service [40], University of Alberta [41], and UC Berkley Center for Teaching & Learning [42], the SPOT survey was developed as a multidimensional SET instrument. The SPOT survey is structured around two primary categories: course design and instructional practices, each further divided into three subdimensions. These six dimensions collectively capture the perspectives of both students and instructors on course quality, providing a holistic view of teaching effectiveness.
The course design section includes three key dimensions: course organization, usefulness of course resources, and graded work. Course organization refers to how different course components (e.g., lectures, tutorials, and assignments) are structured to form a coherent learning experience. The usefulness of course resources captures students’ perceptions of the value of materials provided by the instructor, such as textbooks, multimedia, or supplementary resources, in supporting their learning. Graded work encompasses assignments, activities, and exams that contribute to students’ final grades.
The instructional practices section is similarly divided into three dimensions: course delivery, instructional approach, and class climate. Course delivery pertains to the pacing of course elements, including time allocation, workload distribution, and the frequency of assessments throughout the semester. The instructional approach refers to the strategies and methods the instructor employs to facilitate learning, both during class and through out-of-class activities. Class climate reflects the overall atmosphere of the course, emphasizing aspects like respect, collegiality, and inclusivity in fostering a supportive learning environment.
The division of the six dimensions into course design and instructional practices is grounded in their theoretical interconnection. Within the course design category, course resources and graded work are fundamental components [41]. A key factor influencing students’ perceptions of course difficulty is their workload, directly impacting their overall learning experience. This perception is shaped not only by workload but also by the availability and quality of course resources, such as lectures, tutorials, and assigned readings [25]. Relevant and well-designed course resources can further enhance students’ learning by fostering their self-regulated learning abilities [36,43]. Also, graded work often plays a crucial role in course design. Appropriately weighted assessments and assignments help signal the significance of different course components, guiding students to focus their efforts more effectively and ultimately improving their learning outcomes [25,38].
In the instructional practices category, effective course pacing and instructional approach are interconnected elements that significantly influence teaching quality. A well-paced class that allocates sufficient time for lectures, exams, and assignment preparation and meaningful interactions between instructors and students fosters the use of instructional methods that enhance learning [36,37]. These methods include the use of course-related tools, class discussions, and timely feedback, all of which create an environment conducive to both teaching and learning [38,44]. Additionally, although less tangible than other dimensions, class climate plays a critical role in teaching effectiveness. A positive and respectful classroom atmosphere encourages student participation and engagement, which can enhance interactions with instructors and boost learning motivation [36]. Given the theoretical connections among these dimensions, it is likely that they are also empirically related. This warrants further investigation in the context of this study. By applying network psychometrics to the data from the SPOT survey, this study can provide valuable insights into the strength and robustness of the survey in accurately measuring these interconnected dimensions.
3.2. Data Source
This study used students’ responses to the SPOT survey from the Fall 2022 term. The survey was given to undergraduate students at the end of the semester as an effort to pilot the survey questions. The participants were diverse as there was no restriction for race, gender, and educational background (e.g., year, overall cumulative grade point average) in survey participation. Data collection was completed electronically through the online administration of the SPOT survey. The responses of each participant were completely anonymous. There was no inducement incentive for completing the survey. Convenient sampling was used to gather responses from 695 students in various academic programs and faculties. Data on the mode of teaching and the size of the class were also gathered as class-related variables for recording purposes. For the mode of teaching, 522 responses are from in-person classes, 21 responses from online classes, and 106 responses from in-person and online hybrid classes. For class size, 471 responses are from large classes (>80 students), 82 from medium classes (30–80 students), and 96 from small classes (<30 students). Each dimension in the survey was measured with three five-point Likert scale items (i.e., strongly disagree, disagree, neither agree nor disagree, agree, and strongly agree), asking students to indicate their level of agreement with the presented statements. See the Appendix A for the complete list of questions presented in the SPOT survey and their pertaining dimensions.
3.3. Data Analysis
Students’ responses are ordinally re-coded into numeric variables to make them interpretable by the statistical analysis software used for this study. For data screening, missing data analysis, descriptive statistics, and reliability analysis were performed to examine the characteristics of the data set and address missingness that may hinder further analysis. Correlational analysis with polychoric correlation was performed to examine relationships among items of the SPOT survey while accounting for their ordinal nature. Psychometric network analysis was performed with the bootnet [14] and psychonetrics [45] packages in R version 4.4.2 [46] to examine the dimensional structure of the SPOT survey by visually inspecting the network plot, as well as consulting centrality indices (i.e., betweenness, closeness, and strength) to examine the magnitude, connection, and relative importance of the items [14,16]. Relationships between nodes (i.e., items) of the network were optimized by pruning for non-significant edges with the step-down method (using the Benjamini and Hochberg method for p-value correction) and adding edges with the step-up method (using the Bayesian information criterion as an indicator for improvement). Both methods are set to remove and add edges using p = 0.05 as the cut point.
The research question was addressed with two network analysis methods. First, we examined the overall model fit with confirmatory network modeling through the psychonetrics package [45] via the ggm function. The function estimates the structure of the survey with a Gaussian graphical model similar to the structural equation modeling approach [45]. Absolute fit indices of root mean square error of approximation (RMSEA), comparative fit index (CFI), and Tucker-Lewis index (TLI) were used to determine the model fit. The values of 0.95 for CFI and TLI and 0.06 for RMSEA indicate a sufficient model fit [47].
Second, the dimensional stability of the SPOT survey was examined using the Hierarchical EGA method available in the EGAnet package [34]. The Hierarchical EGA method examines the number of underlying dimensions or factors under multivariate data, as well as the association among dimensions at both the primary and secondary levels [33,48,49]. This method is similar to a second-order confirmatory factor analysis which examines the structure of first-level dimensions under common higher-level dimensions [19]. The graphical least absolute shrinkage and selection operator (GLASSO) estimator was used for the network estimation, and the walktrap algorithm was used to estimate the number of clusters and their nodes. Clusters were determined using the consensus of the highest modularity across all iterations. The stability of the dimension-level structure was assessed by examining the median number of dimensions obtained after conducting 600 iterations of bootstrap resampling using the parametric method [48]. The replicated proportion of each item across bootstrap iterations will be consulted for item-level stability [48].
4. Results
4.1. Data Screening and Overall Network Estimation
Missing data analysis revealed a negligible proportion of missingness in the data set. Out of 695 data points, 17 cases included variables with missing data, which makes up 0.2% of the entire data set. Item 3 in the instructional approach section (I3) indicated the highest missingness proportion (0.58%—missing count 4), followed by item C3 (0.43%—missing count 3), items U1, U2, G3, DL2, DL3, and I1 with 0.29% missingness—missing count 2, and item U3, G2, DL1, I2, and class size with 0.14% missingness—missing count 1. There was no substantial pattern in the missing data, suggesting that the data was missing completely at random (MCAR). Listwise deletion was performed to remove 16 cases with missing data to reduce the risk of computational error. To control for the students’ educational level, we also removed 30 responses from graduate students. This ensured that all observations were from undergraduate students, thereby avoiding a mix of educational levels in our dataset. The finalized data set has N = 649 responses.
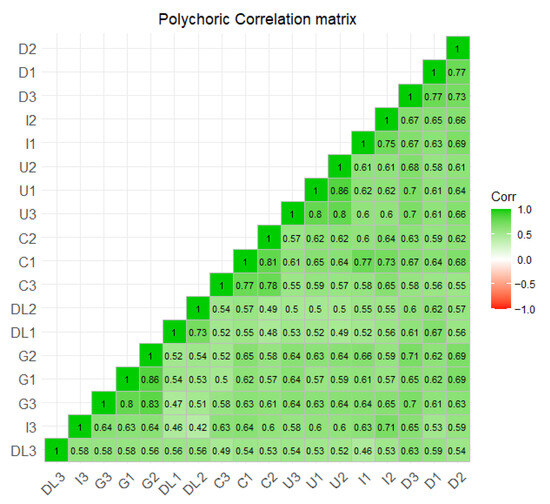
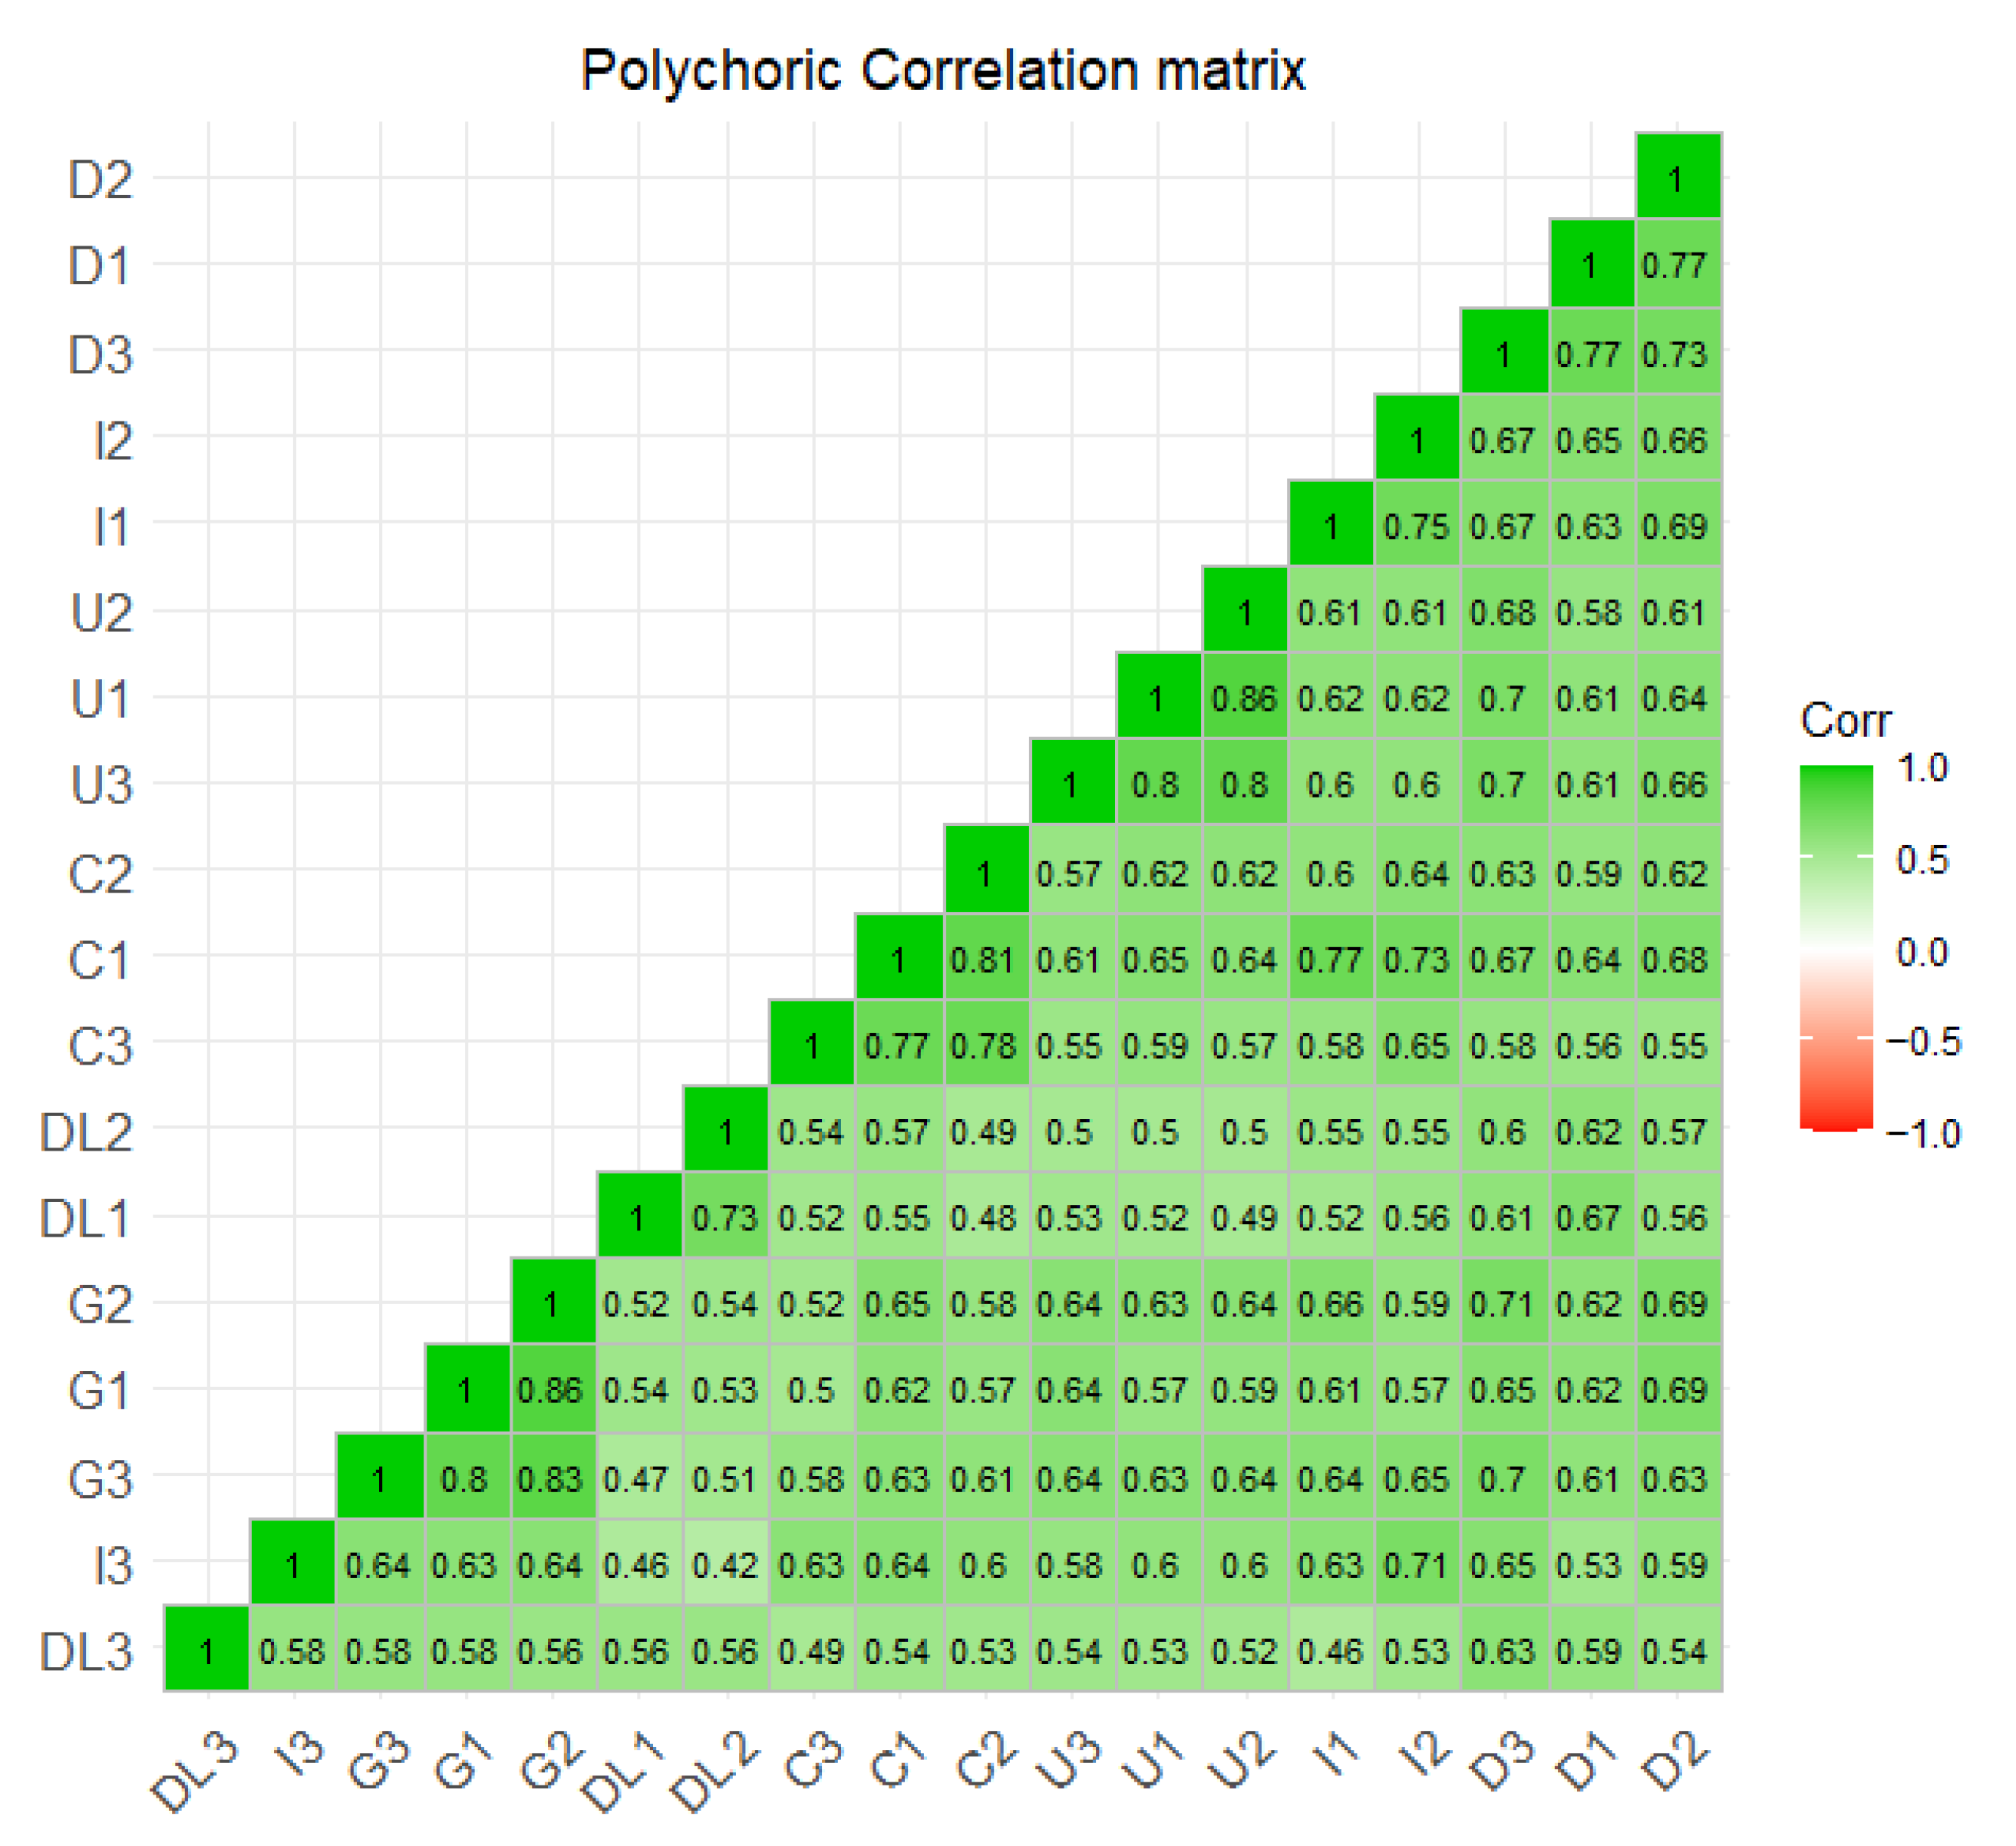
Figure 1 displays the polychoric correlation matrix of all items in the SPOT survey. Each item exhibits positive correlations with the other items in the survey. Lastly, reliability analysis revealed the following results: overall reliability of the SPOT survey ( = 0.95), design subscale ( = 0.86), utility of the course subscale ( = 0.90), graded work subscale ( = 0.90), course delivery ( = 0.75), instructional approach ( = 0.82), and class climate ( = 0.86). These results indicate that the survey has high internal consistency, with most dimensions achieving a high value of reliability (>0.8) and one dimension achieving an acceptable value of reliability (>0.7). These results imply that items within the same dimensions measure their target construct consistently [50].
Figure 1.
Polychoric Correlation Matrix of the SPOT Survey Items Responses. Note. See Appendix A for the question statement of each item. D stands for design; U stands for utility of course resources; G stands for graded work; DL stands for course delivery; I stands for instructional approach; C stands for class climate.
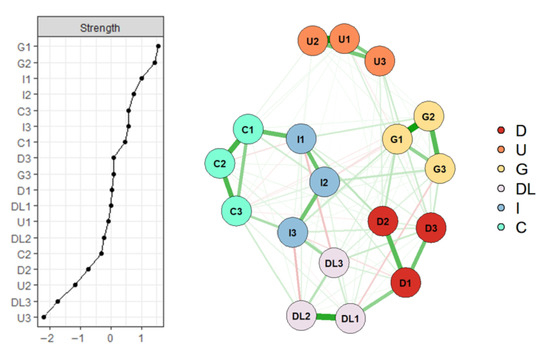
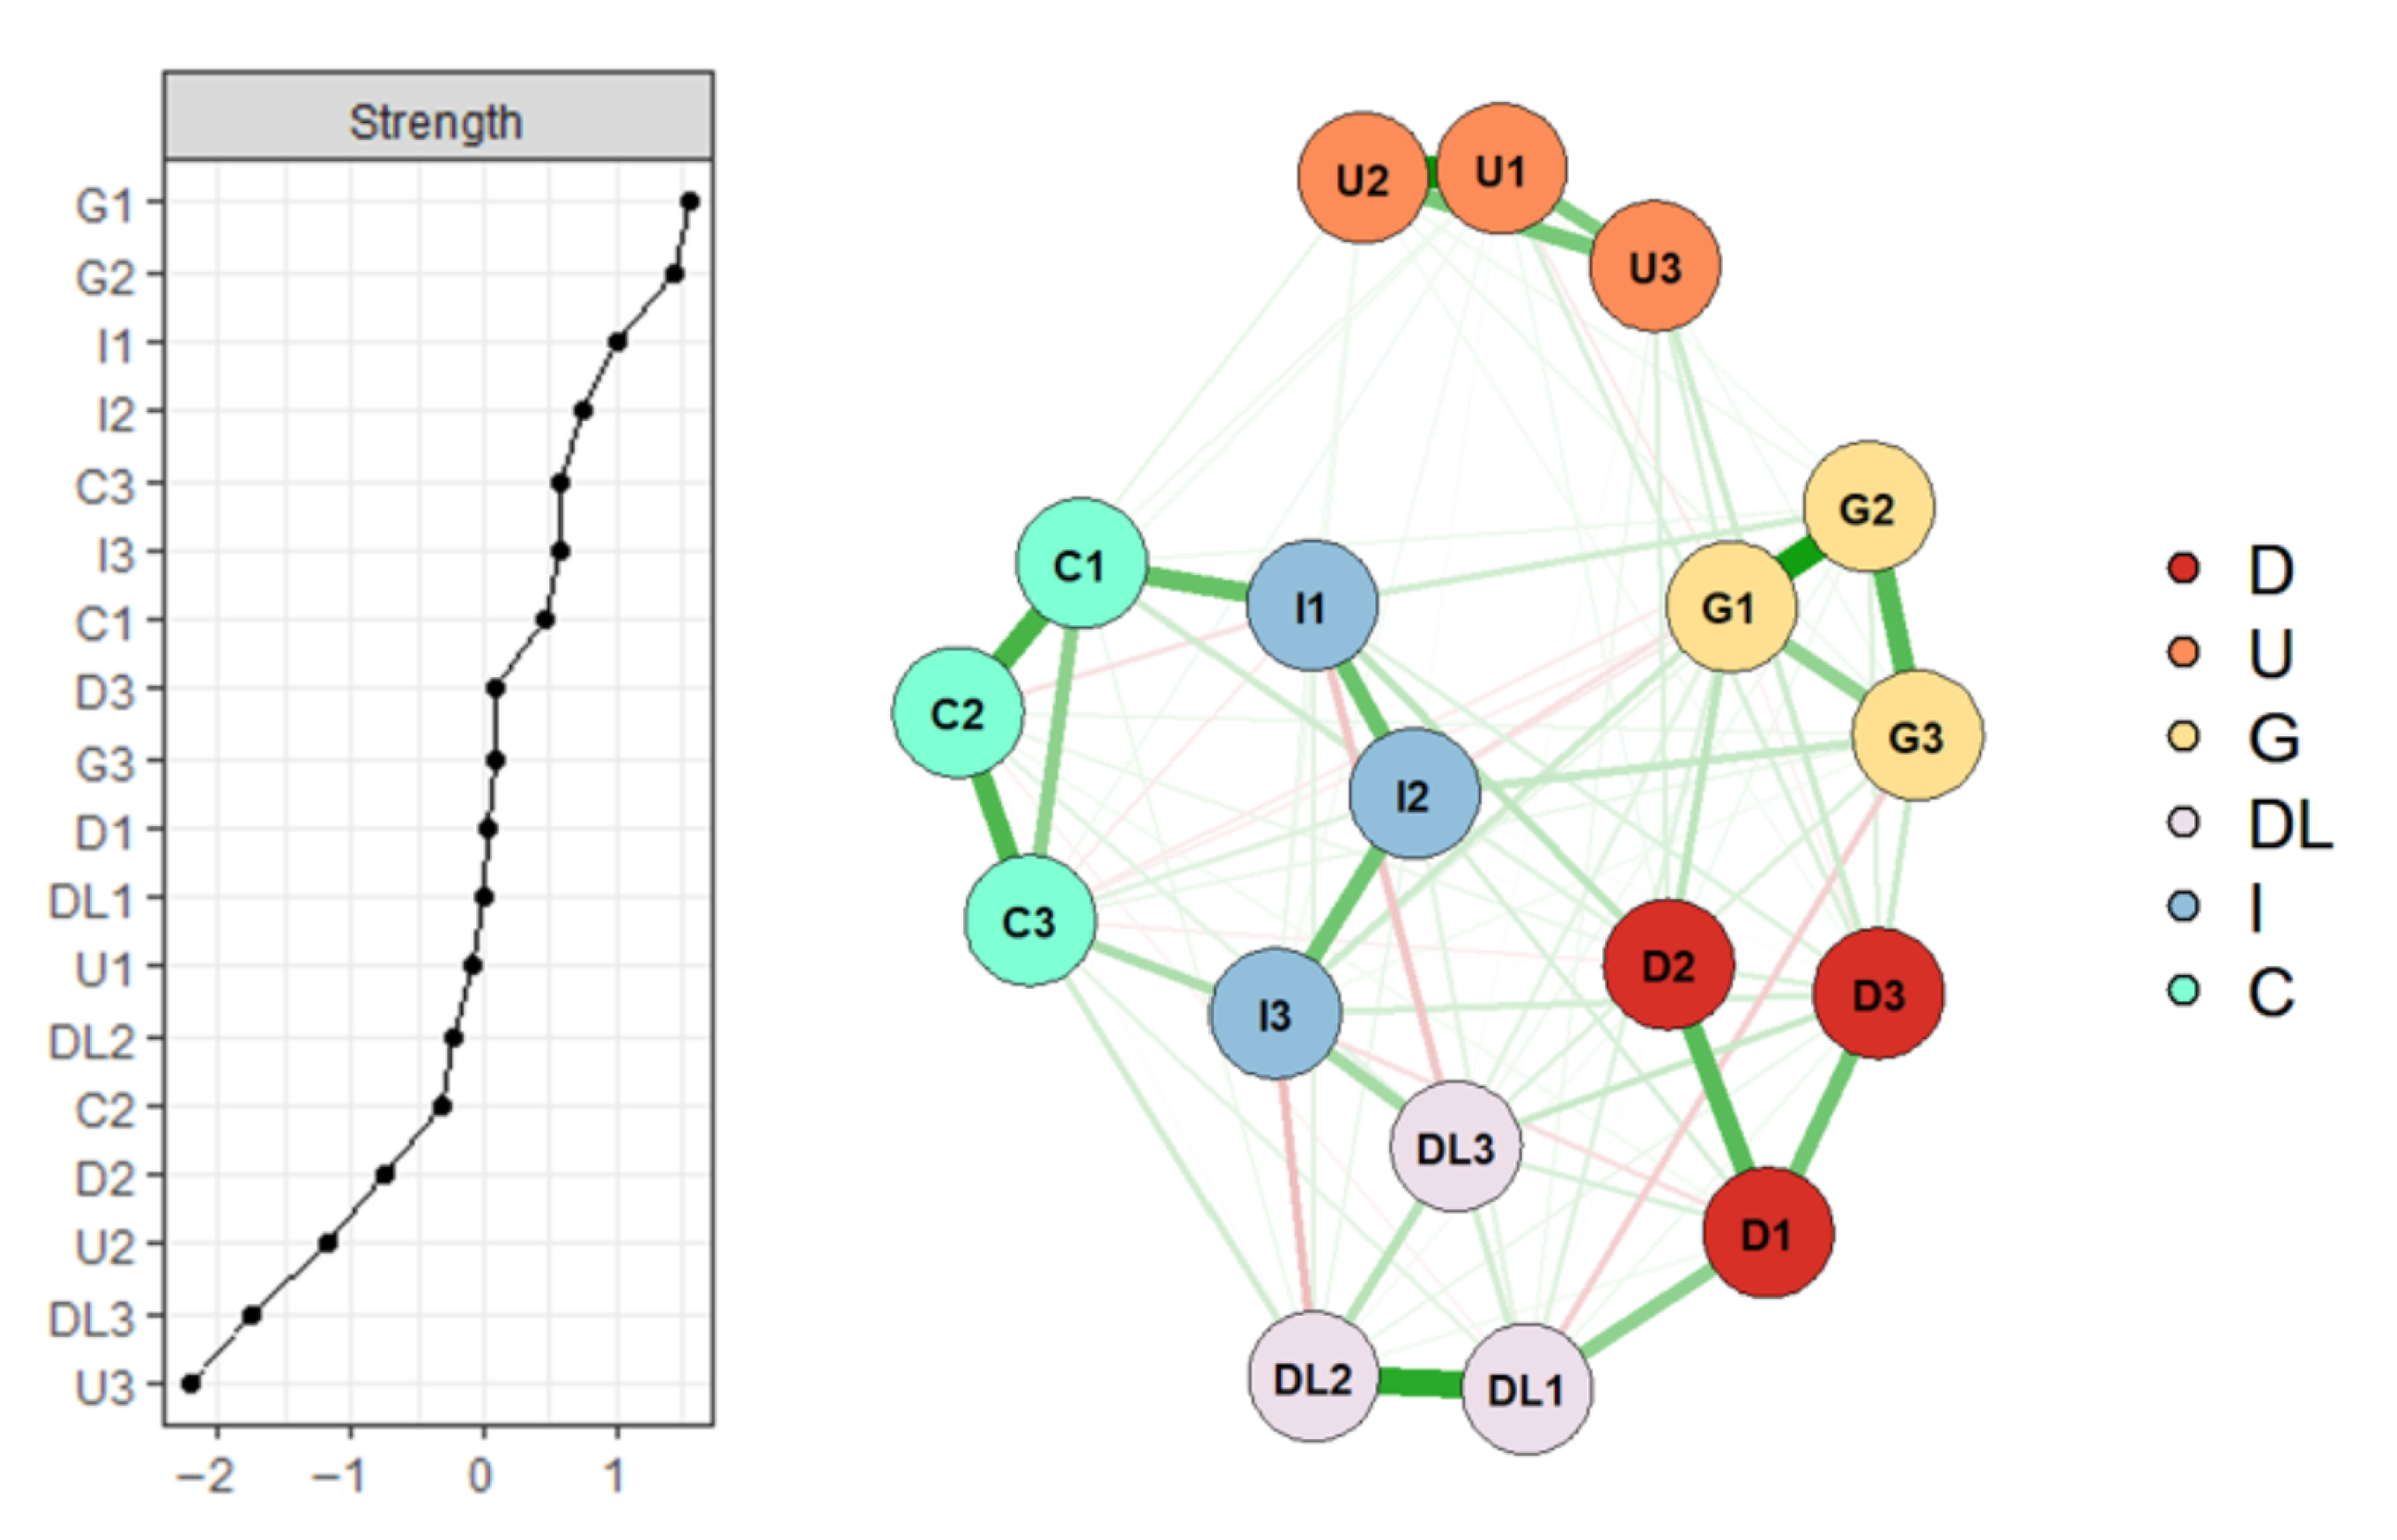
The following results describe how items in the SPOT survey cluster together and how stable these clusters are. The figures can be viewed as visual summaries of item relationships, highlighting which areas of teaching tend to move together in students’ perceptions. Figure 2 shows the network plot of the SPOT survey (left) and the centrality index of strength (right) as estimated from the bootnet and psychonetrics packages. In the network, there were 18 nodes (items) and 107 non-zero edges (i.e., significant relationships). The network had fit indices of RMSEA = 0.021, CFI = 1, and TLI = 1, suggesting a good model fit [16,47]. When visually inspecting the network, clusters of the observed variables appeared to align with groupings of their subscales as they were mapped in close proximity to each other. This finding suggests that items under each dimension measured the same construct and thus could be interpreted together [14]. The strength centrality index indicated that G1 and U3 could influence students’ responses to the connected items based on their high absolute value. DL1 exhibited the weakest influence on other items as its position in the strength indices was close to zero.
Figure 2.
Network Structure (Right) and Centrality Indices (Left) of the SPOT Survey. Note. Centrality indices are shown as standardized z-scores. Green edges indicate positive relationships, while red edges indicate negative relationships. D stands for design; U stands for utility of course resources; G stands for graded work; DL stands for course delivery; I stands for instructional approach; C stands for class climate.
4.2. Dimensional Stability
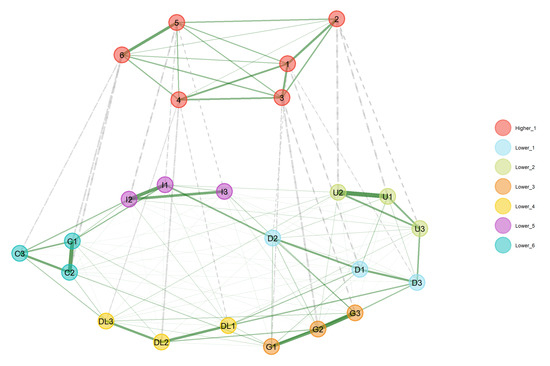
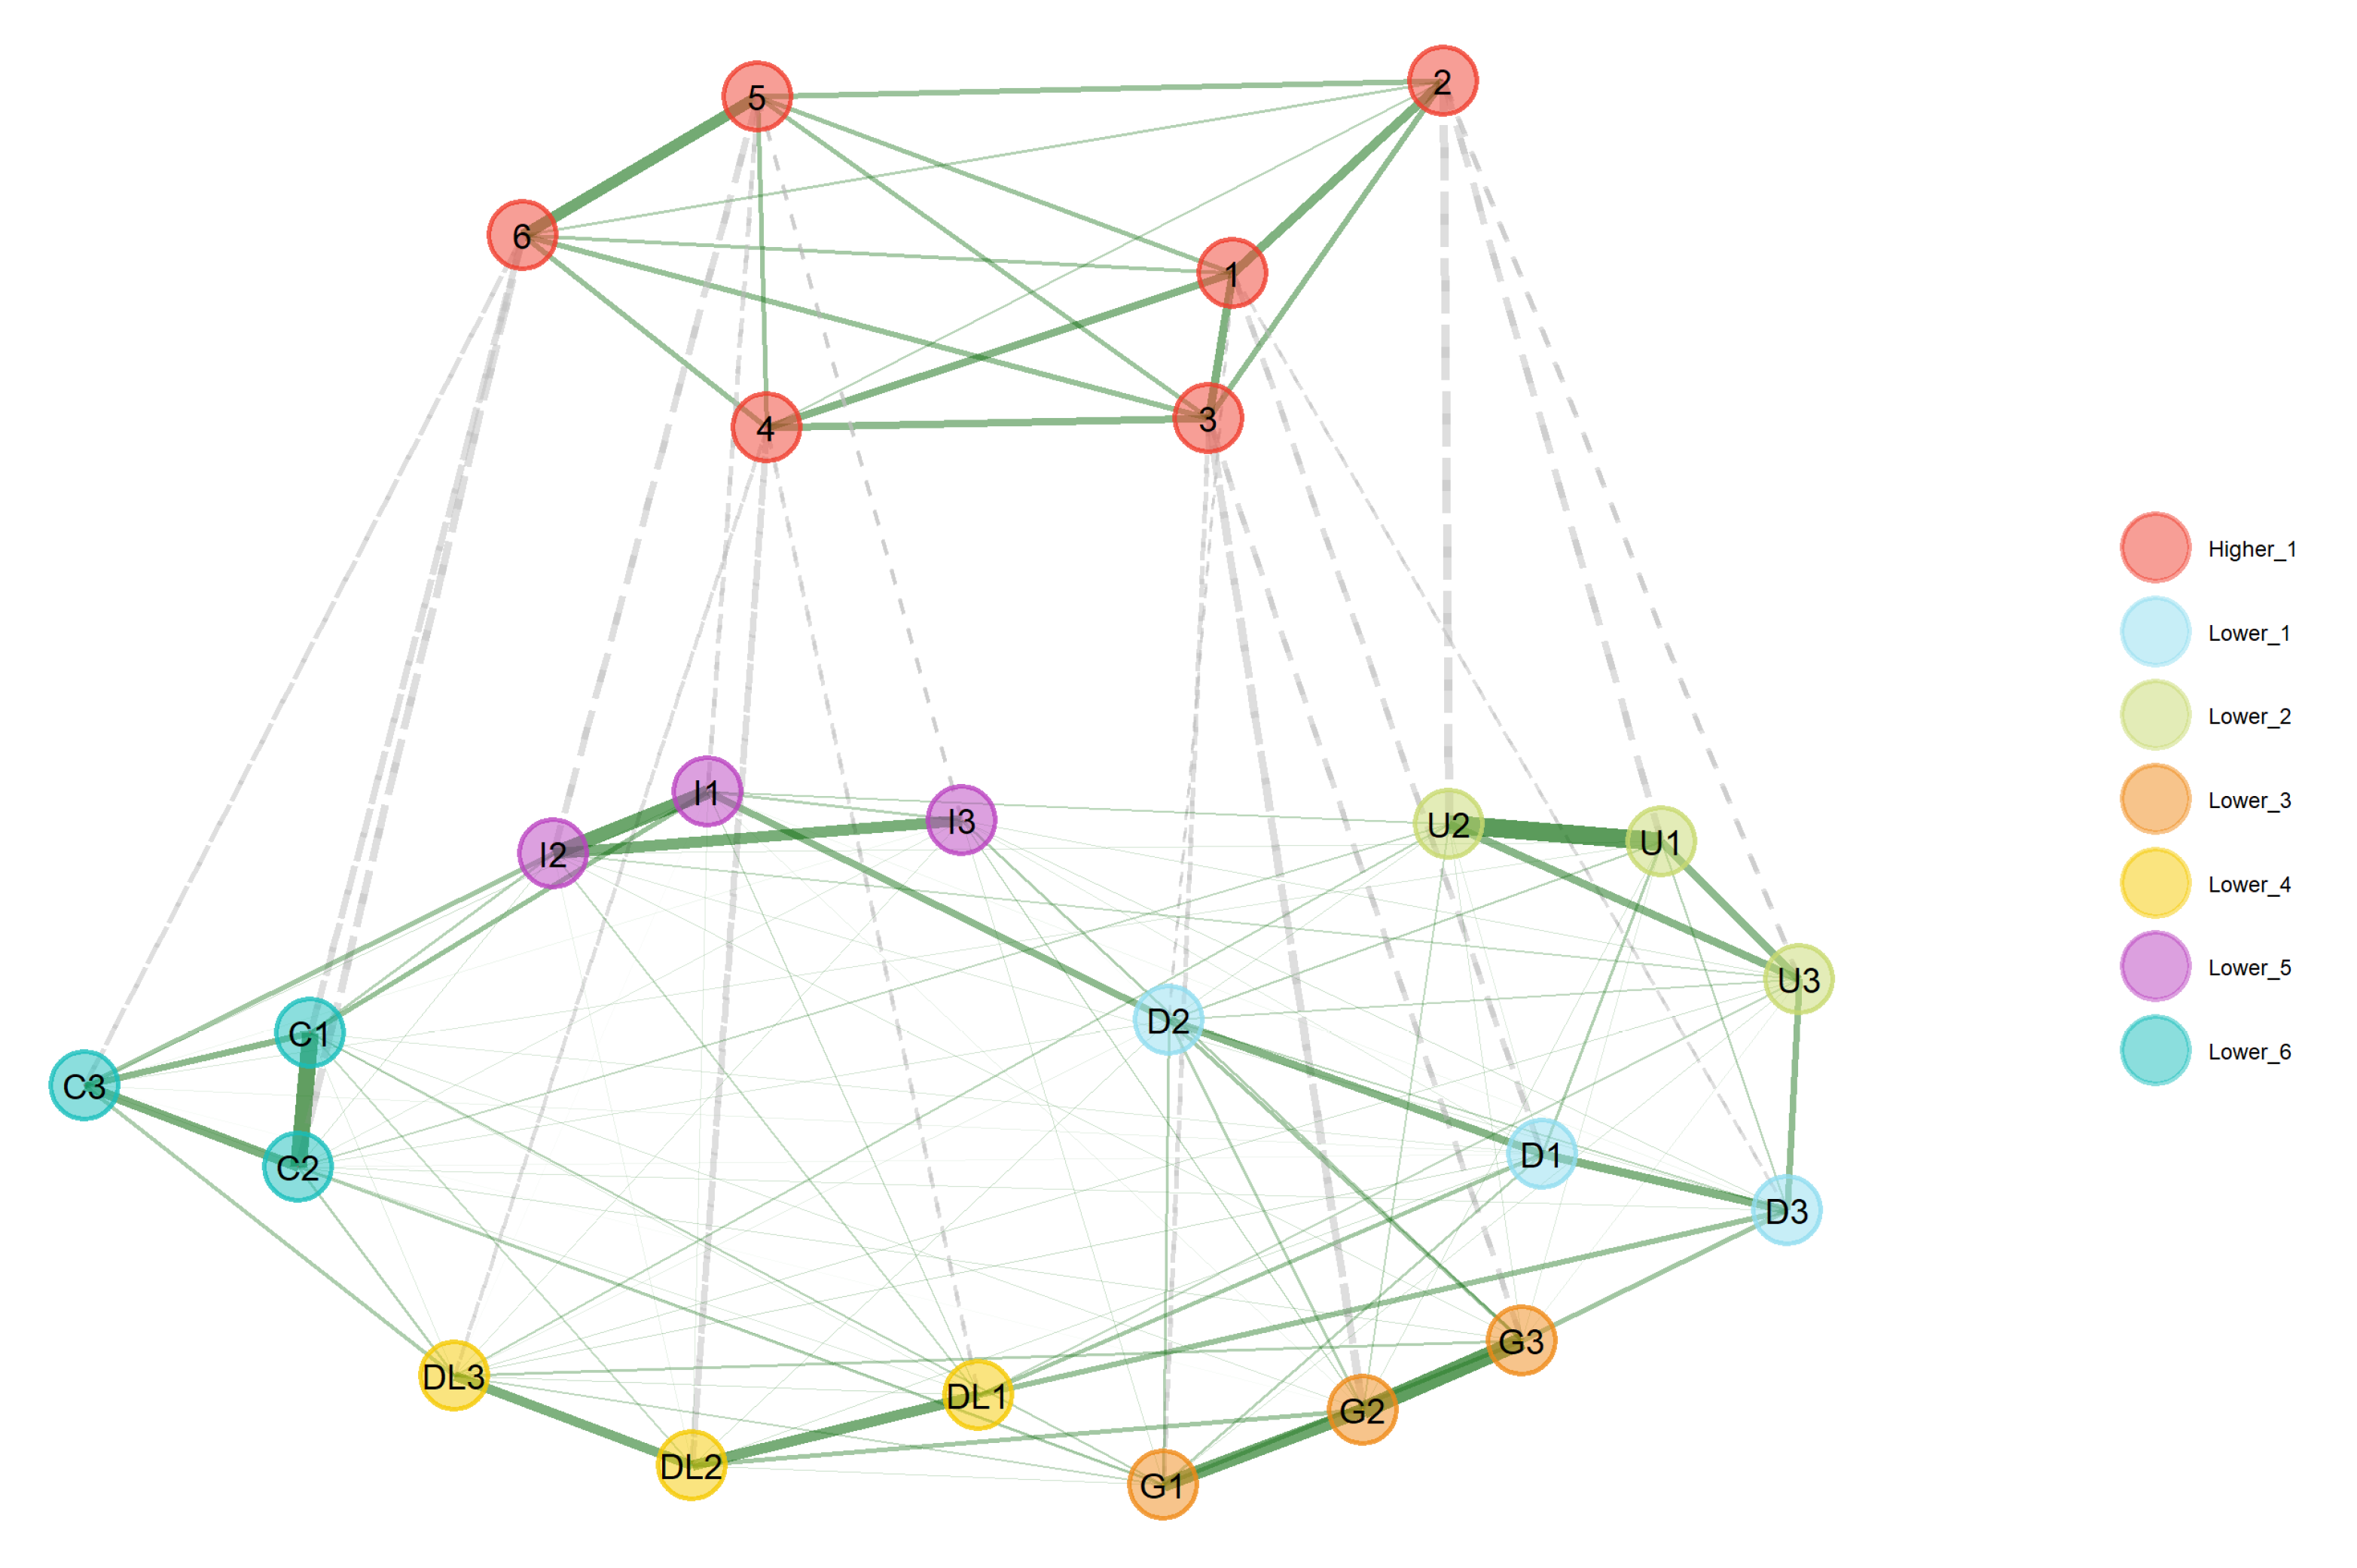
Figure 3 indicates the hierarchical network structure of the SPOT survey, with the left figure indicating the structure of the survey at the lower level (i.e., first-order) and the figure on the right indicating the structure of the survey at the higher level (i.e., second-order). Figure 3 serves as an extension of Figure 2. While Figure 2 represents a single computation, Figure 3 is the outcome of 600 parametric resampling iterations, providing information about the robustness of the survey structure. On the lower level, six clusters were shown as the number of dimensions in the network structure. Cluster 1 contains items D1, D2, and D3 in the design dimension. Cluster 2 contains items DL1, DL2, and DL3 in the course delivery dimension. Cluster 3 contains items I1, I2, and I3 in the instructional approach dimension. Cluster 4 contains items C1, C2, and C3 in the class climate dimension. Cluster 5 contains items U1, U2, and U3 in the utility of course resources dimension. Cluster 6 contains items G1, G2, and G3 in the graded work dimension. The statistical dimensions of the survey align with its theoretical dimensions; that is, items of the same subscale are loaded together in a cluster. On the higher level, one cluster was shown as the number of dimensions. This means that all six lower-level dimensions are loaded onto the same general factor, meaning that they measure the same umbrella construct of students’ perception of teaching. These results were achieved after 600 iterations of bootstrap resampling.
Figure 3.
Network Structure of the SPOT Survey from Hierarchical EGA. Note. Green edges indicate positive relationships, while red edges indicate negative relationships. D stands for design; U stands for utility of course resources; G stands for graded work; DL stands for course delivery; I stands for instructional approach; C stands for class climate.
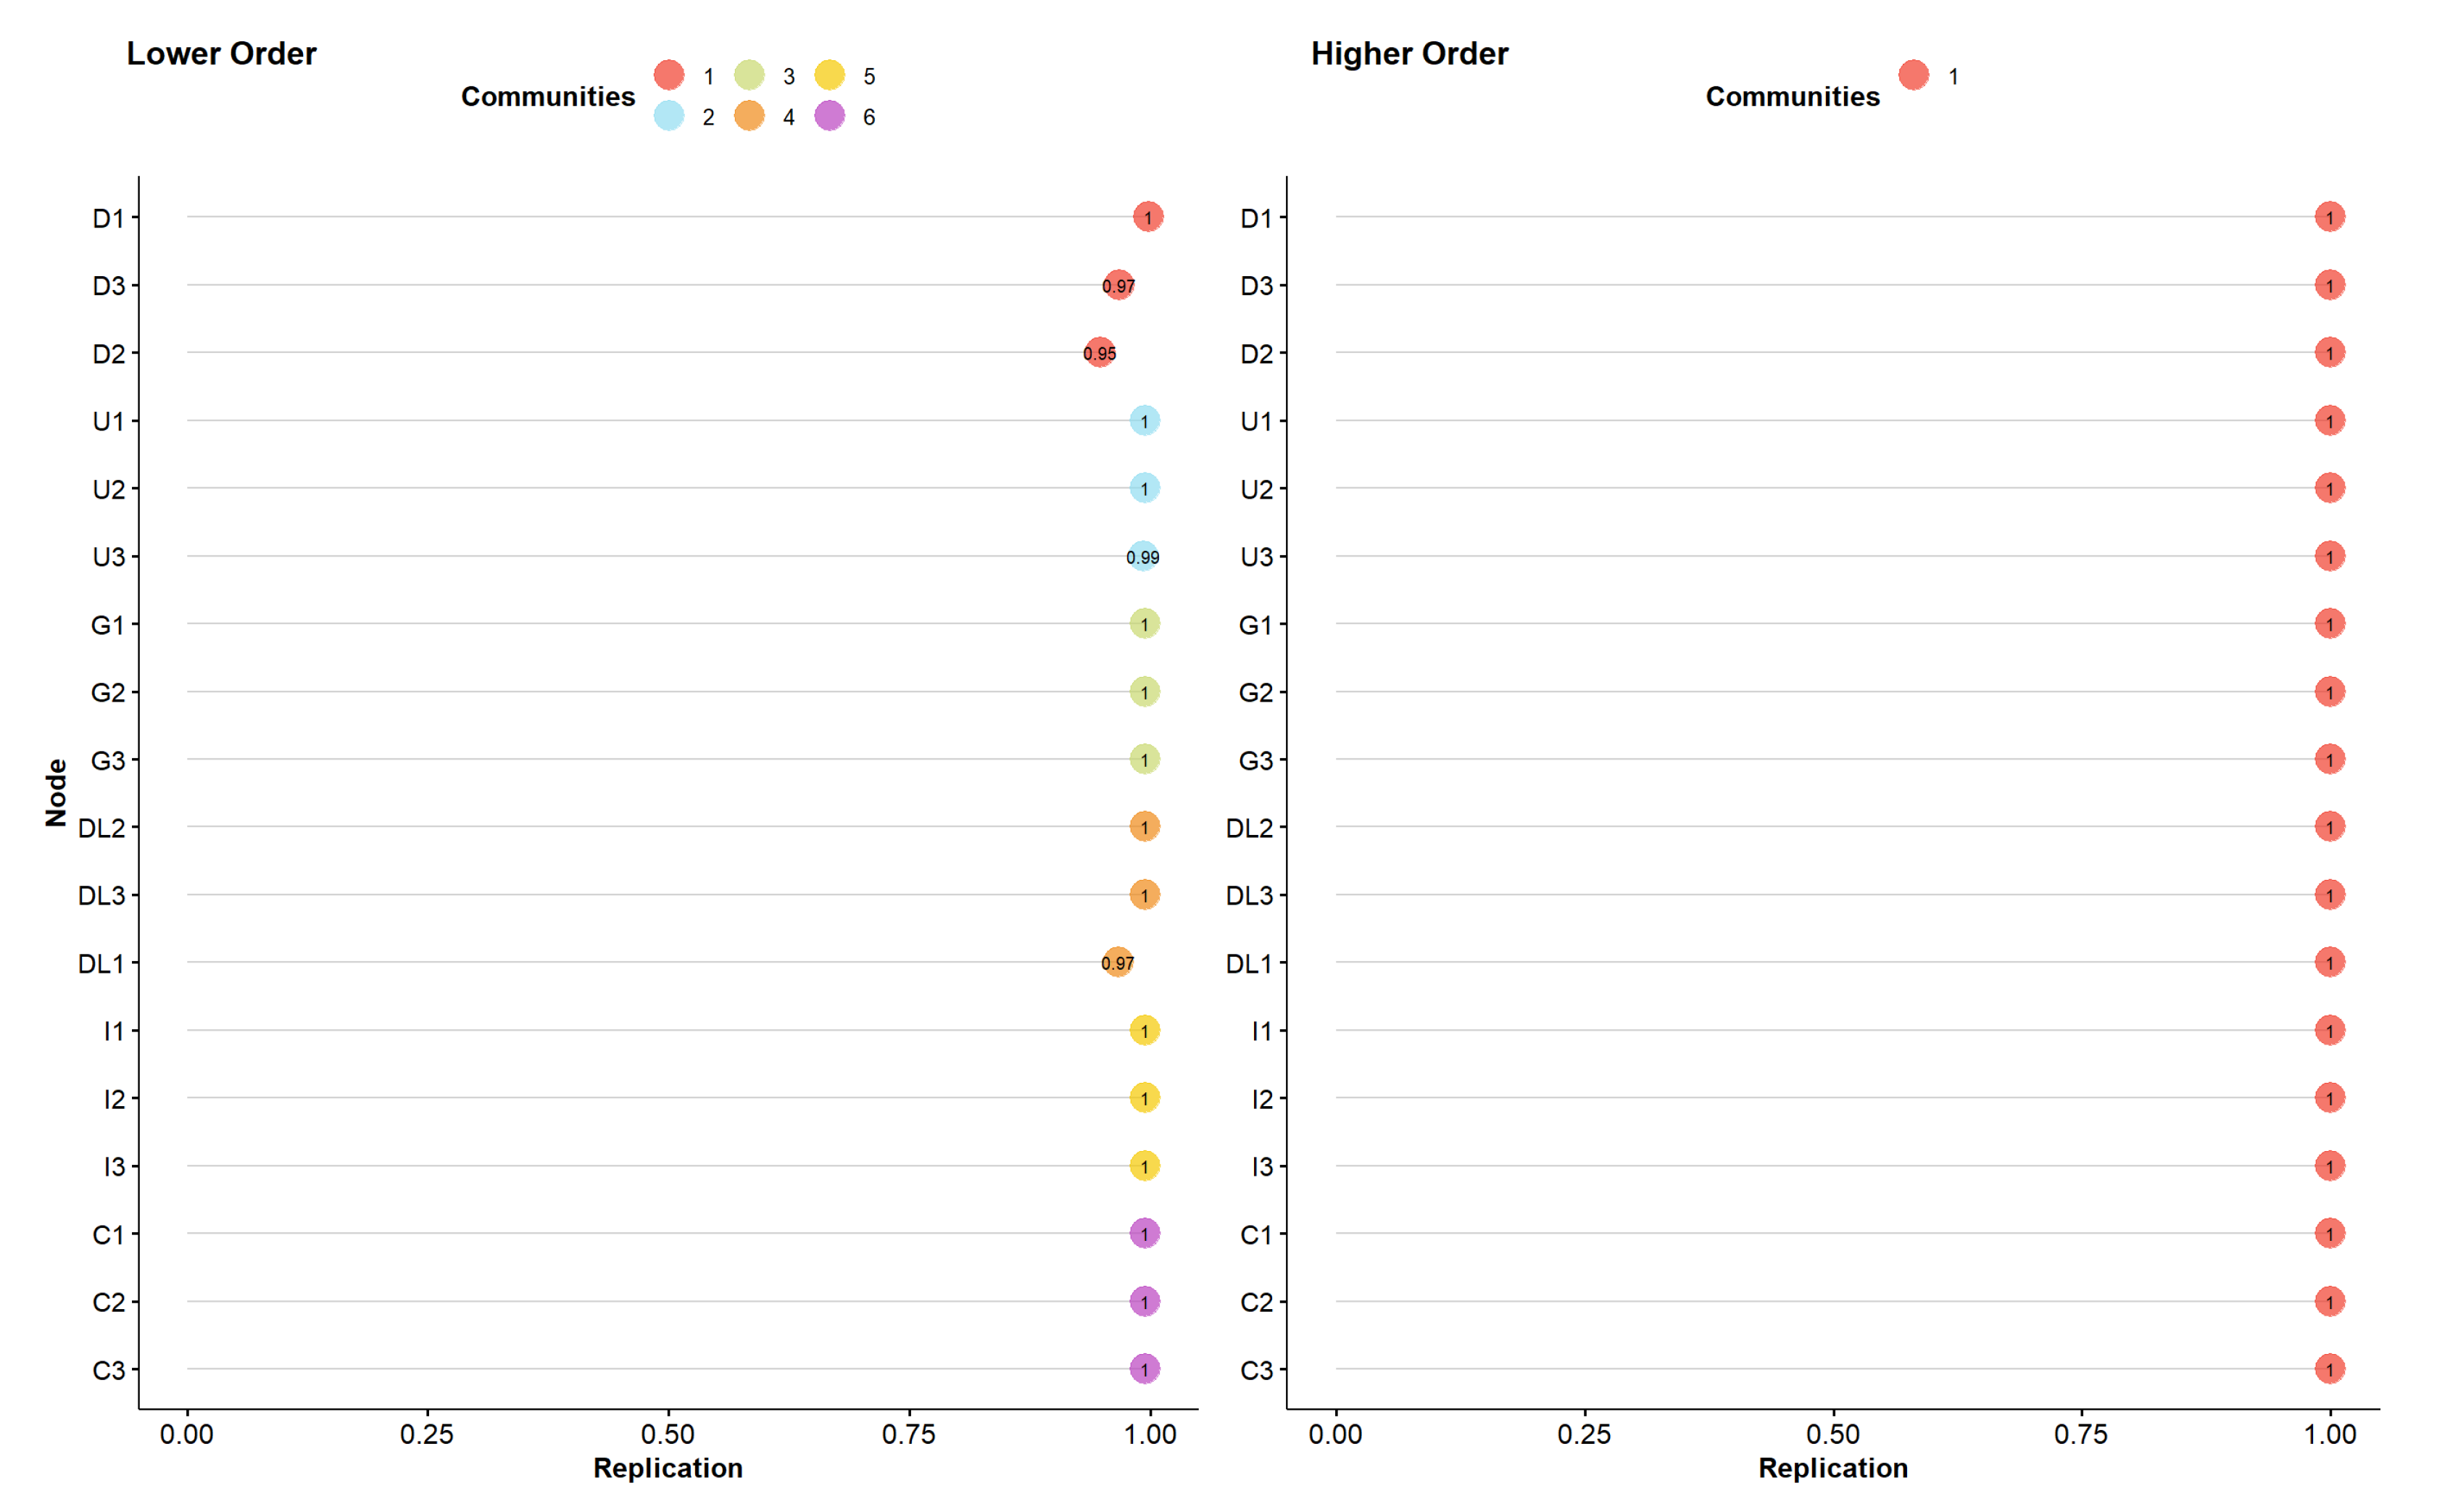
In terms of dimension stability, the EGA method demonstrated highly robust results. At the lower level, the six-dimensional structure was replicated by the EGA method in 99% of all bootstrap iterations. The one-dimension, five-dimension, and seven-dimension structures were replicated in less than 1% of iterations. The median dimension across all bootstrap iterations was six, with a 95% confidence interval between 5.3 and 6.7. At the higher level, the EGA method consistently replicated a one-dimensional structure in 100% of the bootstrap iterations, with a median dimension of one. These findings suggest that the six-dimensional lower-level structure and the one-dimensional higher-level structure of the SPOT survey demonstrate sufficient robustness, maintaining their integrity across 600 resampled datasets.
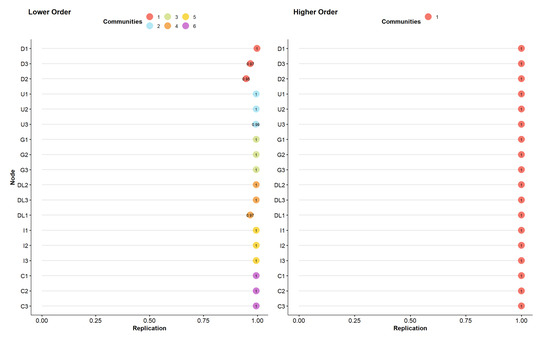
Figure 4 presents the stability results for all 18 items in the SPOT survey. Each item exhibits a high replication value, as visually depicted in the plot. This suggests a robust performance of the items in measuring their intended constructs, as estimated by EGA [48]. When considering the proportion of replications in each dimension across all bootstrap iterations, most items at the lower level are replicated within their respective dimensions 100% of the time. However, items D2, D3, U3, and DL1 show slightly less stability, with replication proportions of 95%, 97%, 99%, and 97%, respectively, meaning that these items may be loaded onto other dimensions in some of the bootstrapped dataset. At the higher level, all items demonstrate perfect stability, with a replication proportion of 100%. This indicates a robust one-dimensional higher-level structure across all resampled datasets.
Figure 4.
Item Stability Results of the SPOT Survey. Note. D stands for design; U stands for utility of course resources; G stands for graded work; DL stands for course delivery; I stands for instructional approach; C stands for class climate.
5. Discussion
This study demonstrates how network modeling, unlike traditional latent approaches such as bifactor analysis, can capture the complex interrelations among teaching dimensions without assuming a single dominant underlying factor. SET surveys are widely used in higher education as a quality control measure. These instruments aim to potentially improve teaching methods and students’ learning experiences in subsequent semesters [2]. Although SET is often conceptualized as a unidimensional construct, represented by a single overall score, this approach yields less realistic interpretations and thus limits the applicability of results obtained from SET instruments [4,10]. Multidimensional SET surveys could offer more meaningful interpretations as there are several elements, such as graded work and class climates, that contribute to effective teaching quality [51,52,53]. This notion led us to this study, which examines the effectiveness of a six-dimensional SET survey by examining its validity evidence using the network psychometrics approach.
The overarching research question is “How is the robustness of a multidimensional students’ evaluation of the teaching survey?”. To answer the question, we performed a series of network analyses using real data from the SPOT survey, a multidimensional instrument designed for measuring various aspects of SET. The results showed robust lines of evidence for the validity of the six-dimensional SPOT survey. The preliminary analysis indicated the high quality of the SPOT data due to the small missing data proportion with the MCAR pattern. These results reduce the risk of computational error and increase the quality of subsequent analyses [54]. Responses of all items are adequately correlated, as suggested by the polychoric correlation matrix. Even when controlling for covariate effects, some items within the same dimension are still positively correlated, indicating that these items measure the same construct in the same way. This result is further supported by the high coefficient alpha of both the overall survey and all six subscales, which suggests that the survey has a robust internal consistency [50]. The confirmatory network modeling of the survey also shows a good model fit even after being pruned for insignificant relationships. Items of the same dimension are grouped together in a close proximity, meaning that they can be interpreted together when measuring the construct. Lastly, hierarchical EGA results suggest that the dimensionality of the survey and its items is stable across all resampling iterations. The reported empirical dimension resembles the theoretical dimension. This conclusion is supported by the fact that all items are loaded onto their respective dimensions and that all lower-level dimensions are loaded onto the same higher-level dimensions.
Although the SPOT survey demonstrated a stable six-dimension structure in this study, the data were collected from a single Canadian university. Cultural expectations about teaching, institutional norms, and communication styles may influence how students interpret and respond to SET items. Therefore, the dimensional structure observed here should be replicated in different educational contexts before being assumed to generalize broadly. In addition, the Hierarchical EGA results indicated that the six lower-level dimensions combine into a single higher-order factor. This suggests that students perceive teaching effectiveness as both a multidimensional construct (i.e., composed of elements such as class climate, graded work, and instructional approach) and a unified experience. From a practical standpoint, this dual structure supports reporting both subscale scores (for diagnostic feedback) and a general score (for broader summaries), provided institutions interpret these scores within the framework of teaching as a complex but coherent whole.
This paper offers both empirical and methodological contributions. This study supports the use of a multidimensional SET survey, which was argued to offer a more thorough measurement of students’ perceived quality of teaching over a unidimensional SET instrument [27]. By investigating the effectiveness of a multidimensional SET survey, we generated novel validity evidence to support the interpretation and use of a multidimensional set instrument in general for improving course evaluation practice [7]. Given how the factor analytic approach is usually utilized as the traditional method to investigate the structure of a survey, evidence generated from the network approach could offer a new perspective on the existing body of validity to the subject matter [55]. Methodologically, this study supports that psychometric network analysis is a viable approach to survey validation in addition to the traditional factor analytic approach. In fact, the network approach was equivalent to the factor analytic approach at the loading-, intercept-, and residual levels [13,56].
The findings of this study carry several practical implications for higher education institutions and instructors. First, the validated multidimensional structure of the SPOT instrument provides a more detailed and actionable framework for interpreting student feedback. Rather than relying on a single aggregate score, institutions can now identify strengths and weaknesses across specific teaching dimensions such as course design, graded work, or instructional approach. This allows administrators and instructors to make targeted improvements in areas that directly influence student learning. Second, the network psychometrics approach used here demonstrates a replicable analytic strategy that can be applied to other evaluation instruments to verify their dimensional integrity before being used for high-stakes decisions. Finally, the results highlight the importance of using multidimensional SET instruments as diagnostic tools that support evidence-based teaching enhancement rather than as simplistic measures of “teaching satisfaction”.
Specifically, for higher education institutions, the six subscales of the SPOT instrument offer universities a more nuanced framework for interpreting teaching evaluations. Rather than relying on a single overall score, which can obscure important differences across teaching practices, administrators can use subscale profiles to identify specific strengths and areas for improvement. For instance, an instructor may score highly in class climate but lower in graded work, suggesting that targeted support in assessment design may be more beneficial than broad recommendations. Institutions may still choose to report a general score for summary purposes, but such a score should be interpreted alongside the subscale pattern to avoid oversimplification. This multidimensional approach can support more equitable and constructive decision-making in processes such as performance reviews, professional development planning, and instructional improvement initiatives.
Although applications of network psychometrics in higher education are only beginning to emerge, the method has seen substantial growth in other fields over the past five years. Recent work has used network models to study personality structures, clinical symptom interactions, and cognitive processes [11,12,48,57]. These developments demonstrate the flexibility and ability to model complex psychological systems of the network approach, as well as reinforce the relevance of applying network models to educational constructs such as teaching evaluations, where multidimensionality and interdependence among components are expected. Incorporating evidence from these more recent studies highlights that the approach used in the present paper aligns with contemporary methodological developments in psychometrics.
6. Conclusions
This study provides robust validity evidence for the use of a multidimensional SET instrument and establishes the SPOT survey as a practical and psychometrically sound tool for teaching evaluation. By leveraging network psychometrics, the study bridges methodological innovation with practical application, showing how institutions can use multidimensional SET results to guide instructional improvement and policy decisions. Our findings challenge the conventional unidimensional interpretation of SET results and demonstrate that teaching effectiveness is better conceptualized as a multidimensional construct encompassing various interconnected components [4,23,27]. The six-dimensional SPOT survey exhibited strong internal consistency, structural stability, and theoretical alignment, reinforcing the utility of multidimensional frameworks in educational assessment [7,34].
Methodologically, this research highlights the value of network psychometrics as a complementary approach to traditional factor analysis in survey validation. By focusing on the relationships among observed variables, network models offer an alternative lens through which the complexity of teaching evaluations can be better understood and interpreted [11,13]. These findings not only inform institutional practices regarding course evaluations but also contribute to the growing body of literature advocating for more nuanced and evidence-based approaches in educational measurement [30,56].
As higher education institutions continue to rely on SET data for high-stakes decisions, future research should explore the generalizability of network-based approaches across different academic contexts and student populations. Incorporating student learning outcomes and longitudinal data may further enrich our understanding of the relationship between SET dimensions and instructional effectiveness [9,10]. Ultimately, adopting multidimensional and methodologically rigorous approaches to SET can lead to more equitable, accurate, and constructive feedback for instructors and institutions alike.
7. Limitation and Future Research
This study has several limitations that are worth noting. First, the network analysis results shown in this study are exploratory based on statistical associations. The link between network psychometrics and causality is still being critiqued and debated [57]. Therefore, the results of this study support the multidimensional design of the SPOT survey rather than confirming the presence of a multidimensional structure. Second, the data used in this study was collected from students at a particular university in western Canada. This may limit the generalizability of the findings, as the dimensional structure of SET instruments can vary across cultural and institutional environments. Future studies should examine whether the SPOT structure replicates across universities, program types, and cultural contexts to determine the breadth of its applicability. Third, due to the lack of graduate students in the sample, this study could not check the stability of the results between undergraduate and graduate students. Future research utilizing network psychometrics for analyzing SET instruments should also investigate the stability of the network structure for different student groups. Furthermore, researchers can examine survey properties with specific subgroups (e.g., online classes only or small graduate-level classes) for population-specific insights.
Author Contributions
Conceptualization, T.W.; Methodology, T.W.; Software, T.W.; Validation, T.W. and O.B.; Formal analysis, T.W.; Data curation, O.B. and L.D.; Writing—original draft, T.W.; Writing—review & editing, T.W., O.B., G.G. and L.D.; Visualization, T.W.; Supervision, O.B. All authors have read and agreed to the published version of the manuscript.
Funding
This research received no funding.
Institutional Review Board Statement
The study design and protocol adhered to the guidelines of the Declaration of Helsinki and were approved by the University of Alberta Ethics Committee (approval number Pro00136452, date of approval 11 January 2024).
Informed Consent Statement
Not applicable.
Data Availability Statement
Data of this study may be available upon requests to the corresponding author.
Conflicts of Interest
This study has no conflict of interest to the best knowledge of the authors.
Abbreviations
The following abbreviations are used in this manuscript:
| SET | Student Evaluation of Teaching |
| SPOT | Student Perception of Teaching |
| EGA | Exploratory Graph Analysis |
| RMSEA | Root Mean Square Error of Approximation |
| CFI | Comparative Fit Index |
| TLI | Tucker–Lewis Index |
| GLASSO | Graphical Least Absolute Shrinkage and Selection Operator |
| MCAR | Missing Completely at Random |
Appendix A. Student Perception of Teaching Survey (SPOT)
The following items were rated on a five-point Likert scale where:
1 = Strongly Disagree, 2 = Disagree, 3 = Neither Agree nor Disagree, 4 = Agree, 5 = Strongly Agree
D (Design)
- D1. I found the course easy to follow.
- D2. I found the course requirements clear.
- D3. I found the course designed in a way that supported my learning.
U (Utility of course resources)
- U1. The course resources supported my learning.
- U2. The course resources increased my knowledge of the subject.
- U3. The course resources helped me prepare for my assignments and exams.
G (Graded work)
- G1. The graded work was reflective of the course content.
- G2. The graded work allowed me to apply my knowledge from the course.
- G3. The graded work yielded helpful information about my learning.
DL (Course delivery)
- DL1. I was able to keep up with the instructor’s pacing of course delivery.
- DL2. I had enough time to complete my course work.
- DL3. Found there were enough assessments to monitor my learning.
I (Instructional approach)
- I1. My instructor provided examples and illustrations to support my learning.
- I2. My instructor offered alternative explanations to support my learning.
- I3. My instructor provided feedback to support my learning.
C (Class climate)
- C1. My instructor created and maintained a climate of mutual respect.
- C2. I felt a sense of collegiality in this course.
- C3. I felt comfortable to ask questions and share my ideas in this course.
Three course-related variables were also entered.
- Level (Undergraduate, Graduate)
- Mode (In person, Online, Hybrid)
- Size (Small < 30 students, Medium 30–80 students, Large > 80 students)
References
- Aragón, O.R.; Pietri, E.S.; Powell, B.A. Gender bias in teaching evaluations: The causal role of department gender composition. Psychol. Cogn. Sci. 2023, 120, e2118466120. [Google Scholar] [CrossRef] [Scilit]
- Laupper, E.; Balzer, L.; Berger, J.L. Online vs. offline course evaluation revisited: Testing the invariance of a course evaluation questionnaire using a multigroup confirmatory factor analysis framework. Educ. Assess. Eval. Account. 2020, 32, 481–498. [Google Scholar] [CrossRef] [Scilit]
- Office of Assessment for Curricular Effectiveness. Course Evaluations. Available online: https://accreditation.wsu.edu/accreditation-faq/online-course-assessment-and-evaluation/ (accessed on 10 November 2025).
- Spooren, P.; Brockx, B.; Mortelmans, D. On the validity of student evaluation of teaching: The state of the art. Rev. Educ. Res. 2013, 83, 598–642. [Google Scholar] [CrossRef] [Scilit]
- Kreitzer, R.J.; Sweet-Cushman, J. Evaluating student evaluations of teaching: A review of measurement and equity bias in sets and recommendations for ethical reform. J. Acad. Ethics 2022, 20, 73–84. [Google Scholar] [CrossRef] [Scilit]
- Spooren, P.; Vandermoere, F.; Vanderstraeten, R.; Pepermans, K. Exploring high impact scholarship in research on student’s evaluation of teaching (SET). Educ. Res. Rev. 2017, 22, 129–141. [Google Scholar] [CrossRef] [Scilit]
- Kane, M.T. Validating the interpretations and uses of test scores. J. Educ. Meas. 2013, 50, 1–73. [Google Scholar] [CrossRef] [Scilit]
- Coovert, M.D.; Bennett, W. The importance of identifying the dimensionality of constructs employed in simulation and training for AI. J. Def. Model. Simul. Appl. Methodol. Technol. 2022, 19, 229–236. [Google Scholar] [CrossRef] [Scilit]
- Skedsmo, G. Assessment and evaluation with clarifying purposes for policy and practice. Educ. Assess. Eval. Account. 2020, 32, 103–106. [Google Scholar] [CrossRef] [Scilit]
- Borch, I.; Sandvoll, R.; Risør, T. Discrepancies in purposes of student course evaluations: What does it mean to be “satisfied”? Educ. Assess. Eval. Account. 2020, 32, 83–102. [Google Scholar] [CrossRef] [Scilit]
- Borsboom, D.; Deserno, M.K.; Rhemtulla, M.; Epskamp, S.; Fried, E.I.; McNally, R.J.; Robinaugh, D.J.; Perugini, M.; Dalege, J.; Costantini, G.; et al. Network analysis of multivariate data in psychological science. Nat. Rev. Methods Prim. 2021, 1, 58. [Google Scholar] [CrossRef] [Scilit]
- Trahair, C.; Baran, L.; Flakus, M.; Kowalski, C.M.; Rogoza, R. The structure of the Dark Triad traits: A network analysis. Personal. Individ. Differ. 2020, 167, 110265. [Google Scholar] [CrossRef] [Scilit]
- Christensen, A.P.; Golino, H. On the equivalency of factor and network loadings. Behav. Res. Methods 2021, 53, 1563–1580. [Google Scholar] [CrossRef] [Scilit]
- Epskamp, S.; Borsboom, D.; Fried, E.I. Estimating psychological networks and their accuracy: A tutorial paper. Behav. Res. Methods 2018, 50, 195–212. [Google Scholar] [CrossRef] [Scilit]
- Guyon, H.; Falissard, B.; Kop, J.L. Modeling psychological attributes in psychology—An epistemological discussion: Network analysis vs. Latent variables. Front. Psychol. 2017, 8, 798. [Google Scholar] [CrossRef] [Scilit] [PubMed]
- Isvoranu, A.M.; Epskamp, S.; Waldorp, L.J.; Borsboom, D. (Eds.) Network Psychometrics with R: A Guide for Behavioral and Social Scientists; Research Methods and Statistics; Routledge: New York, NY, USA, 2022. [Google Scholar] [CrossRef] [Scilit]
- AERA; APA; NCME. Chapter 1: Validity. In Standards for Educational and Psychological Testing; American Educational Research Association: Washington, DC, USA, 2014; pp. 11–31. [Google Scholar]
- Kember, D.; Leung, D.Y. Establishing the validity and reliability of course evaluation questionnaires. Assess. Eval. High. Educ. 2008, 33, 341–353. [Google Scholar] [CrossRef] [Scilit]
- Kline, R.B. Chapter 9: Specification and identification of confirmatory factor analysis models. In Principles and Practice of Structural Equation Modeling, 4th ed.; Methodology in the Social Sciences; The Guilford Place: London, UK, 2016; pp. 188–211. [Google Scholar]
- Bonifay, W.E.; Reise, S.P.; Scheines, R.; Meijer, R.R. When are multidimensional data unidimensional enough for structural equation modeling? An evaluation of the detect multidimensionality index. Struct. Equ. Model. Multidiscip. J. 2015, 22, 504–516. [Google Scholar] [CrossRef] [Scilit]
- Bruwer, B.; Emsley, R.; Kidd, M.; Lochner, C.; Seedat, S. Psychometric properties of the multidimensional scale of perceived social support in youth. Compr. Psychiatry 2008, 49, 195–201. [Google Scholar] [CrossRef] [Scilit]
- Gurney, P. Five factors for effective teaching. N. Z. J. Teach. Work 2007, 4, 89–98. [Google Scholar] [CrossRef] [Scilit]
- Brown, G.; Edmunds, S. Effective teaching? In Handbook of Quality Assurance for University Teaching; Routledge: New York, NY, USA, 2018; pp. 247–272. [Google Scholar]
- Clayson, D.E. Student evaluations of teaching: Are they related to what students learn? A meta-analysis and review of the literature. J. Mark. Educ. 2009, 31, 16–30. [Google Scholar] [CrossRef] [Scilit]
- Hoessler, C.; Turner, N. Brief on Student Evaluations of Teaching. 2016. Available online: https://teaching.usask.ca/documents/gmctl/brief-on-student-evaluations-of-teaching.pdf (accessed on 10 November 2025).
- Walker, C.M.; Beretvas, S.N. Comparing multidimensional and unidimensional proficiency classifications: Multidimensional IRT as a diagnostic aid. J. Educ. Meas. 2003, 40, 255–275. [Google Scholar] [CrossRef] [Scilit]
- Zipser, N.; Mincieli, L. Administrative and structural changes in student evaluations of teaching and their effects on overall instructor scores. Assess. Eval. High. Educ. 2018, 43, 995–1008. [Google Scholar] [CrossRef] [Scilit]
- Richmond, A.S.; Boysen, G.A.; Gurung, R.A.R.; Tazeau, Y.N.; Meyers, S.A.; Sciutto, M.J. Aspirational model teaching criteria for psychology. Teach. Psychol. 2014, 41, 281–295. [Google Scholar] [CrossRef] [Scilit]
- Whitehead, L. The measurement of fatigue in chronic illness: A systematic review of unidimensional and multidimensional fatigue measures. J. Pain Symptom Manag. 2009, 37, 107–128. [Google Scholar] [CrossRef] [Scilit] [PubMed]
- Christensen, A.P.; Golino, H.; Silvia, P. A psychometric network perspective on the measurement and assessment of personality traits. Preprint 2019. [Google Scholar] [CrossRef] [Scilit]
- Kan, K.J.; De Jonge, H.; Van Der Maas, H.L.J.; Levine, S.Z.; Epskamp, S. How to compare psychometric factor and network models. J. Intell. 2020, 8, 35. [Google Scholar] [CrossRef] [Scilit] [PubMed]
- Ramlall, I. Applied Structural Equation Modelling for Researchers and Practitioners: Using R and Stata for Behavioural Research; Emerald Group Publishing Limited: Leeds, UK, 2016. [Google Scholar] [CrossRef] [Scilit]
- Golino, H.F.; Epskamp, S. Exploratory graph analysis: A new approach for estimating the number of dimensions in psychological research. PLoS ONE 2017, 12, e0174035. [Google Scholar] [CrossRef] [Scilit]
- Golino, H.; Christensen, A.; Moulder, R.; Garrido, L.E.; Jamison, L.; Shi, D. EGAnet: Exploratory Graph Analysis—A Framework for Estimating the Number of Dimensions in Multivariate Data Using Network Psychometrics. 2022. Available online: https://r-ega.net/ (accessed on 10 November 2025).
- University of Alberta. Student Perspectives of Teaching (SPOT). Available online: https://www.ualberta.ca/en/information-services-and-technology/services/test-scoring-questionnaire-services/student-perspectives-of-teaching.html (accessed on 10 November 2025).
- Benton, S.L.; Cashin, W.E. Student Ratings of Teaching: A Summary of Research and Literature. IDEA Paper 50. 2011; pp. 1–21. Available online: https://www.ideaedu.org/idea_papers/student-ratings-of-teaching-a-summary-of-research-and-literature/ (accessed on 10 November 2025).
- Daumiller, M.; Janke, S.; Hein, J.; Rinas, R.; Dickhäuser, O.; Dresel, M. Teaching quality in higher education: Agreement between teacher self-reports and student evaluations. PsyArXiv 2021. [Google Scholar] [CrossRef] [Scilit]
- Medina, M.S.; Smith, W.T.; Kolluru, S.; Sheaffer, E.A.; DiVall, M. A review of strategies for designing, administering, and using student ratings of instruction. Am. J. Pharm. Educ. 2019, 83, 753–764. [Google Scholar] [CrossRef] [Scilit]
- Penn State University. Student Rating of Teaching Effectiveness. 2023. Available online: http://www.srte.psu.edu/SRTE_Items/ (accessed on 10 November 2025).
- The Purdue Instructor Course Evaluation Service. PICES Item Catalog. 2020. Available online: https://www.purdue.edu/idp/Documents/PICES_catalog.pdf/ (accessed on 10 November 2025).
- University of Alberta. Framework for Effective Teaching. Available online: https://www.ualberta.ca/en/centre-for-teaching-and-learning/resources/multifaceted-evaluation-of-teaching/framework-for-effective-teaching.html (accessed on 10 November 2025).
- UC Berkley Center for Teaching & Learning. Course Evaluations Question Bank. 2023. Available online: https://teaching.berkeley.edu/resources/course-evaluations-question-bank (accessed on 10 November 2025).
- Panadero, E. A review of self-regulated learning: Six models and four directions for research. Front. Psychol. 2017, 8, 1–28. [Google Scholar] [CrossRef] [Scilit]
- Rucker, M.H.; Haise, C.L. Effects of variations in stem and response options on teaching evaluations. Soc. Psychol. Educ. 2012, 15, 387–394. [Google Scholar] [CrossRef] [Scilit]
- Epskamp, S. Psychonetrics: Structural Equation Modeling and Confirmatory Network Analysis. 2021. Available online: https://cran.r-project.org/web/packages/psychonetrics/index.html (accessed on 10 November 2025).
- R Core Team. R: A Language and Environment for Statistical Computing; R Foundation for Statistical Computing: Vienna, Austria, 2022. [Google Scholar]
- Hu, L.; Bentler, P.M. Cutoff criteria for fit indexes in covariance structure analysis: Conventional criteria versus new alternatives. Struct. Equ. Model. Multidiscip. J. 1999, 6, 1–55. [Google Scholar] [CrossRef] [Scilit]
- Christensen, A.P.; Golino, H.F. Estimating the stability of psychological dimensions via bootstrap exploratory graph analysis: A monte carlo simulation and tutorial. Psych 2021, 3, 479–500. [Google Scholar] [CrossRef] [Scilit]
- Golino, H.F.; Shi, D.; Christensen, A.P.; Garrido, L.E.; Nieto, M.D.; Sadana, R.; Thiyagarajan, J.A.; Martinez-Molina, A. Investigating the performance of exploratory graph analysis and traditional techniques to identify the number of latent factors: A simulation and tutorial. Psychol. Methods 2020, 25, 292–320. [Google Scholar] [CrossRef] [Scilit] [PubMed]
- Ponterotto, J.G.; Ruckdeschel, D.E. An overview of coefficient alpha and a reliability matrix for estimating adequacy of internal consistency coefficients with psychological research measures. Perceptualand Mot. Ski. 2007, 105, 997–1014. [Google Scholar] [CrossRef] [Scilit]
- Fluckiger, J.; Vigil, Y.T.y.; Pasco, R.; Danielson, K. Formative feedback: Involving students as partners in assessment to enhance learning. Coll. Teach. 2010, 58, 136–140. [Google Scholar] [CrossRef] [Scilit]
- Koenig, R.J. Faculty satisfaction with distance education: A comparative analysis on effectiveness of undergraduate course delivery modes. J. Coll. Teach. Learn. 2010, 3, 13–26. [Google Scholar] [CrossRef] [Scilit]
- Peter, F.; Dalbert, C. Do my teachers treat me justly? Implications of students’ justice experience for class climate experience. Contemp. Educ. Psychol. 2010, 35, 297–305. [Google Scholar] [CrossRef] [Scilit]
- Van Buuren, S. Flexible Imputation of Missing Data, 2nd ed.; Chapman and Hall/CRC Interdisciplinary Statistics Series; CRC Press, Taylor and Francis Group: Boca Raton, FL, USA, 2018. [Google Scholar]
- Cramer, A.O.J.; Van Der Sluis, S.; Noordhof, A.; Wichers, M.; Geschwind, N.; Aggen, S.H.; Kendler, K.S.; Borsboom, D. Dimensions of normal personality as networks in search of equilibrium: You can’t like parties if you don’t like people. Eur. J. Personal. 2012, 26, 414–431. [Google Scholar] [CrossRef] [Scilit]
- Finch, W.H.; French, B.F.; Hazelwood, A. A comparison of confirmatory factor analysis and network models for measurement invariance assessment when indicator residuals are correlated. Appl. Psychol. Meas. 2023, 47, 106–122. [Google Scholar] [CrossRef] [Scilit] [PubMed]
- Marsman, M.; Rhemtulla, M. Guest editors’ introduction to the special issue “network psychometrics in action”: Methodological innovations inspired by empirical problems. Psychometrika 2022, 87, 1–11. [Google Scholar] [CrossRef] [Scilit]

Disclaimer/Publisher’s Note: The statements, opinions and data contained in all publications are solely those of the individual author(s) and contributor(s) and not of MDPI and/or the editor(s). MDPI and/or the editor(s) disclaim responsibility for any injury to people or property resulting from any ideas, methods, instructions or products referred to in the content. |
© 2025 by the authors. Licensee MDPI, Basel, Switzerland. This article is an open access article distributed under the terms and conditions of the Creative Commons Attribution (CC BY) license (https://creativecommons.org/licenses/by/4.0/).