


Abstract
Short food supply chains (SFSCs) are often assumed to reduce greenhouse gas emissions because food travels fewer kilometers. That inference is incomplete when vehicle size, payload, chain stages and empty returns differ between short and conventional distribution. This study develops a transparent, logistics-adjusted scenario model for one tonne of fresh, unprocessed, non-frozen horticultural produce delivered to a point of sale in Ferrolterra, Galicia. Four configurations are compared: a direct producer-to-market SFSC, coordinated regional SFSC, optimized conventional long chain and fragmented conventional long chain. Representative road corridors connect As Pontes with Ferrol (43.1 km) and Almería with Ferrol (1144.3 km), but the analysis is explicitly prospective rather than an observation of actual trade flows. Well-to-wheel emissions are calculated from 2025 official vehicle-kilometer factors, differentiated by vehicle class and load, and propagated through 100,000 Monte Carlo iterations. Median emissions were 63.4 kg CO2e t−1 for a direct SFSC, 22.0 for a coordinated SFSC, 113.5 for the optimized long chain and 184.0 for the fragmented long chain. Direct SFSC emissions were lower than the optimized benchmark in 95.8% of simulations, but its 95% interval for relative reduction included a small disadvantage (−7.7% to 67.9%). Load factor was the dominant driver of direct-SFSC uncertainty (Spearman ρ = −0.866). At the representative local distance, the van required a payload above approximately 0.263 t to outperform the median optimized long-chain scenario. The results show that proximity is neither necessary nor sufficient for lower transport emissions: coordination and consolidation determine whether distance advantages are realized. SFSCs may support rural transition strategies, but claims about whole-food-system carbon neutrality or rural-development outcomes require empirical logistics data and full life-cycle assessment.
1. Introduction
Climate neutrality requires mitigation across energy, industry, mobility, land use and food systems. Agrifood systems contribute approximately one-third of anthropogenic greenhouse gas (GHG) emissions when production, land-use change, processing, packaging, transport, retail, consumption and waste are considered [1,2,3]. This broad accounting boundary is essential: the climate relevance of any single intervention depends on where it acts within the life cycle and on the emissions that remain outside the analysis.
Transport is a visible but contested part of the food-system footprint. Product-level meta-analysis has often found that farm production and land-use change dominate, with transport representing a comparatively small share for many foods [4]. Conversely, a global environmentally extended input–output analysis estimated food-mile emissions to be close to one-fifth of total food-system emissions once upstream and downstream freight movements were included [5]. These estimates are not directly contradictory; they arise from different products, allocation rules and system boundaries. They demonstrate why a transport-only result cannot be generalized to the full food system.
Within European rural policy, an SFSC is not defined solely by kilometers. Regulation (EU) No 1305/2013 characterizes it through a limited number of economic operators, cooperation, local economic development and close geographical and social relations among producers, processors and consumers [6]. Foundational work likewise distinguishes face-to-face, spatially proximate and spatially extended chains and emphasizes their relational and territorial embeddedness [7,8]. Subsequent reviews show that direct sales, farmers’ markets, community-supported agriculture, online channels, food hubs and local retail partnerships are organizationally different SFSC models with different logistical requirements [9,10,11,12,13].
The environmental literature therefore provides no basis for treating ‘short’ as automatically ‘low carbon’. Food-miles studies warned early that distance is only one determinant of freight impact [14,15]. Dedicated farm-shop or market trips can perform poorly when small quantities are moved in light vehicles or when consumer travel is induced [16]. Product-specific LCA has shown that distribution configuration, storage, packaging, transport mode and load utilization can overturn a simple local-versus-global ranking [17,18,19]. Recent comparative work continues to find heterogeneous results across alternative food networks [20], while optimization research shows that vehicle selection, routing, consolidation and electrification can materially improve SFSC performance [21,22].
The 2023–2025 LCA literature further underlines the importance of methodological boundaries. Recent tools seek to represent multiple food-chain stages rather than a single freight leg [23]; reviews of food-processing carbon footprints identify energy, processing and product characteristics as relevant determinants [24]; and a 2025 meta-analysis of 118 LCA studies found that method choice, regional context, system boundary and waste inclusion strongly influence reported GHG values [25].
A transport scenario should therefore be presented as a partial carbon assessment, not as a full LCA under ISO 14040 [26].
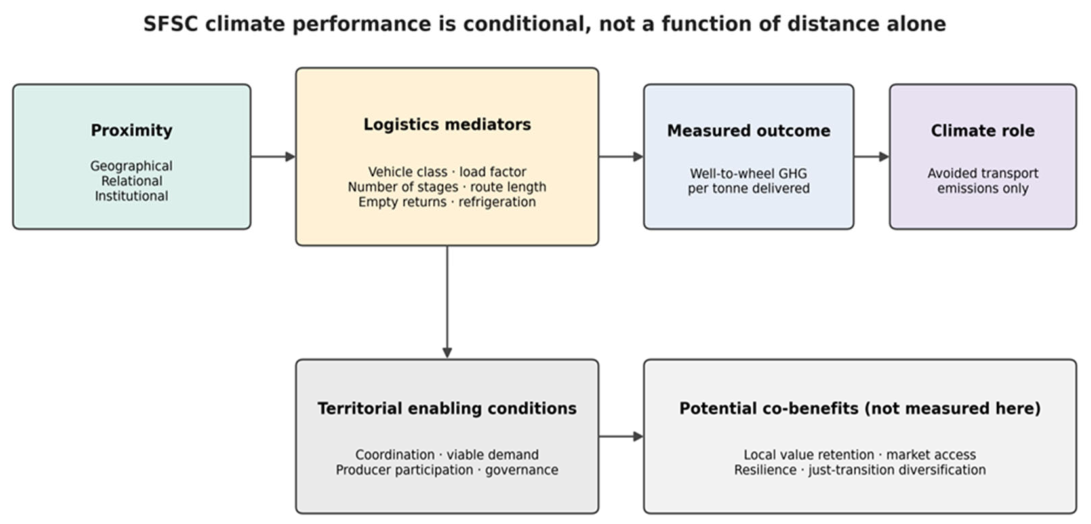
This debate also has a theoretical dimension. Geographical proximity can reduce distance, but its climate effect is mediated by logistics: vehicle class, payload, number of stages, route design, empty returns and temperature control. Relational and institutional proximity can influence those mediators by enabling producers to coordinate deliveries, share hubs, aggregate volume and align supply with demand [10,11,12,13].
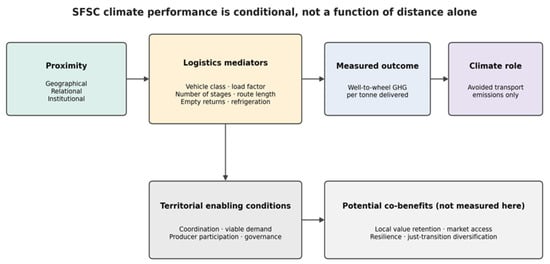
Rural-development effects arise through a separate pathway—value retention, market access, producer participation and governance—and cannot be inferred from transport calculations alone. At the policy level, the European Green Deal and the Farm to Fork Strategy connect food-system decarbonization with broader sustainability and rural objectives [27,28]. Figure 1 separates the measured environmental mechanism from potential but unmeasured territorial co-benefits.
Figure 1.
Conditional framework linking proximity, logistics, transport emissions and potential territorial co-benefits. Source: Authors’ conceptualization based on the SFSC and logistics literature [7,8,9,10,11,12,13,18,20,22].
Galicia is a useful scenario context because it combines dispersed settlements, fragmented farm structures, a strong primary sector and a peripheral Atlantic location [29,30]. Ferrolterra links urban demand in Ferrol and Narón with surrounding rural municipalities. As Pontes de García Rodríguez adds a specific just-transition dimension: the municipality and its surrounding area are included in Spain’s territorial response to the closure of coal-based generation, where agrifood and other locally embedded projects form part of the diversification debate [31]. These characteristics resemble challenges faced by other peripheral European regions, but they do not make the present model empirically representative of all Galician food flows.
Previous work in Galicia reports interest in Km 0 products and identifies governance, producer participation and market coordination as relevant to implementation [32,33]. However, the literature still lacks a transparent explanation of the combinations of distance and logistics efficiency under which a Galician SFSC would outperform an efficient long chain.
The research gap is therefore not another demonstration that 80 km is arithmetically lower than 800 km. It is the identification of conditional break-even points when short and long chains use different vehicles, payloads, stages and return patterns.
This study addresses three research questions: (RQ1) How do well-to-wheel transport emissions per tonne delivered vary among direct SFSCs, coordinated SFSCs, optimized conventional and fragmented conventional scenarios? (RQ2) Under what payload and distance combinations does a direct SFSC outperform an optimized long chain? (RQ3) Which operational parameters drive model uncertainty, and what policy actions follow from those drivers?
The study contributes in four ways. First, it replaces a distance-only comparison with a leg-specific vehicle-kilometer model. Second, it formally distinguishes organizational variants within both short and long chains. Third, it quantifies uncertainty with Monte Carlo simulation and identifies break-even payloads rather than asserting a universal percentage reduction. Fourth, it connects logistics performance to a bounded territorial interpretation, distinguishing measured transport mitigation from unmeasured rural-development outcomes.
2. Materials and Methods
2.1. Study Area
The scenario design uses a nested territorial framework: Galicia as the macro-regional scale, Ferrolterra as a functional food region, and As Pontes as a local transition node. This multiscalar framework links regional policy, logistics organization and local implementation without implying that the scenarios represent observed food flows.
Galicia is relevant within the European context because it combines diversified agrifood production—including dairy, livestock, horticulture, fisheries, wine and forestry—with fragmented farm structures and an aging rural population [29,30].
Similar conditions occur in other Atlantic and peripheral European regions; transfer therefore depends on replacing the model inputs with local logistics data.
Within Galicia, Ferrolterra is treated as a functional food region because it connects urban demand centers such as Ferrol and Narón with surrounding rural production areas. This spatial configuration provides plausible regional corridors for testing SFSC logistics; it is not presented as evidence of current commercial flows.
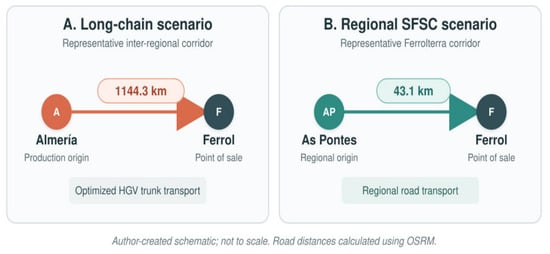
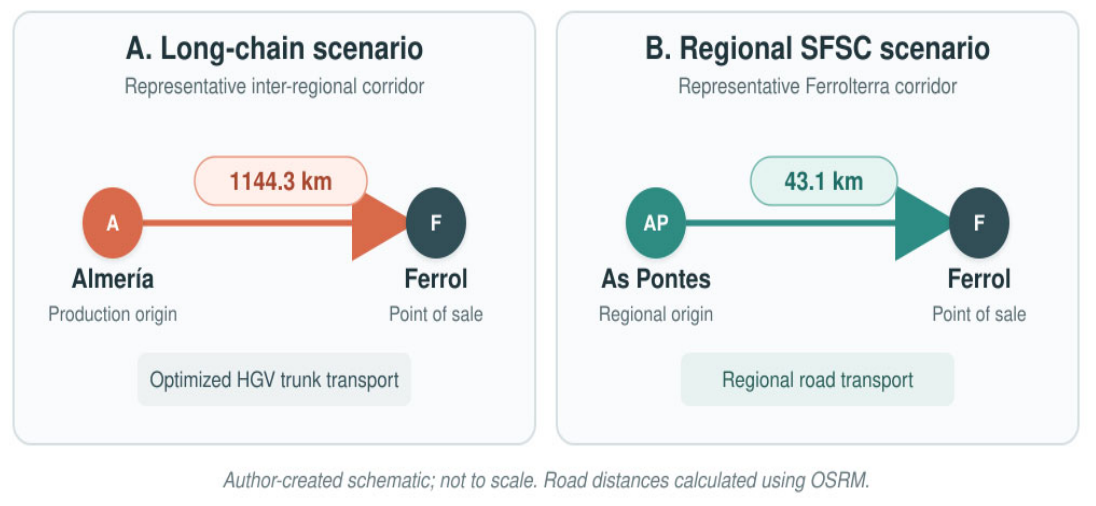
As Pontes adds a post-carbon transition context because coal-fired power generation formerly dominated its local economy and current diversification policy includes locally embedded activities [31]. The three territorial scales therefore connect policy context, logistics feasibility and local application (Figure 2). The scenario locations were verified using Eurostat GISCO NUTS 2024 and GeoRef Spain [34,35]; Figure 2 reproduces no third-party cartographic material.
Figure 2.
Representative transport corridors used to parameterize the scenarios. The diagram is an original schematic, not a cartographic reproduction, and is not to scale; numerical values are OSRM-routed road distances [36]. Source: Authors’ own elaboration.
2.2. Research Design and Inferential Status
The research is a prospective scenario analysis. It does not use observed consignments, producer surveys, distributor records, GPS traces or interviews, and it is not presented as an empirical assessment of current SFSC operation. The scenarios are transparent analytical constructs that test how logistics assumptions alter transport-related GHG emissions in a Galician territorial setting.
The study follows life-cycle thinking but is not a full LCA. Its boundary begins when the product is dispatched from the origin farm or collection point and ends when it is delivered to the market or retail point in Ferrol. Agricultural production, land-use change, processing, packaging manufacture, storage, retail energy, food loss, household preparation, waste treatment and consumer travel are excluded. The results are therefore reported as transport-stage well-to-wheel emissions and cannot establish the carbon footprint of the food product or food system as a whole.
2.3. Product, Functional Unit and Territorial Application
The model is restricted to fresh, unprocessed, non-frozen horticultural produce that can be transported under ambient conditions in crates or equivalent bulk packaging. This choice makes the compared product function more homogeneous and avoids attributing processing or cold-chain emissions to a distance effect. The findings should not be transferred directly to meat, dairy, fish, frozen foods, heavily processed products or products requiring continuous temperature control.
The functional unit is one tonne of saleable product delivered to the point of sale. This unit normalizes vehicle emissions by the actual product payload allocated to the trip, rather than assuming that one tonne is always moved regardless of the vehicle’s utilization. Product loss is assumed equal across scenarios and is excluded; future empirical LCA should measure loss and quality differences explicitly.
Two representative road corridors anchor the distance modes. The regional corridor connects As Pontes and Ferrol (43.1 km one way). The long corridor connects Almería, a major horticultural production area in southeastern Spain, and Ferrol (1144.3 km one way). Distances were obtained with the Open Source Routing Machine (OSRM) Route Service (Project OSRM, open-source software) [36]. They are illustrative route anchors, not evidence that a specific consignment followed either route. Triangular distance distributions broaden both corridors to avoid treating a single map distance as certain.
2.4. Formal Definition of the Four Chain Configurations
The scenarios distinguish both organizational proximity and logistics. A direct SFSC represents face-to-face sale with no intermediary. A coordinated SFSC retains regional proximity but aggregates the product before delivery. The two conventional scenarios include collection, line haul and final distribution, while differing in consolidation and empty-distance allocation. Table 1 provides the operational definitions.
Table 1.
Operational definitions and boundaries of the food-chain scenarios. Source: Authors’ definitions informed by European SFSC policy and supply-chain typologies [6,7,8,9,10,11,12,13].
2.5. Logistics-Adjusted Emission Model
The official 2025 UK Government GHG conversion factors were used because they report compatible direct (tank-to-wheel) and upstream fuel (well-to-tank) factors by vehicle class, vehicle-kilometer, load state and tonne-kilometer [37,38]. The factors are based on road-freight statistics and ARTEMIS load adjustments. They provide a transparent European proxy but are not a substitute for Spanish fleet measurements. The EMEP/EEA guidebook was used as a methodological cross-check for road-transport inventory practice [39].
Table 2 summarizes the vehicle parameters used in the model. For each vehicle class, the well-to-wheel vehicle factor equals the sum of direct and well-to-tank CO2e. HGV factors at intermediate load fractions were linearly interpolated between the published 0%, 50% and 100% laden values, consistent with the official methodology [38]. Van factors do not vary by load in the source table, so load affects van emissions only through the product mass over which vehicle emissions are allocated.
Table 2.
Vehicle parameters used in the transport model (well-to-wheel factors).
For scenario s and logistics leg i, emissions per tonne delivered were calculated as:
where Es is kg CO2e per tonne delivered; dsi is the one-way loaded distance (km); EFv(LFsi) is the well-to-wheel vehicle factor at the specified load (kg CO2e vehicle-km−1); rsi is the allocated empty-distance ratio relative to loaded distance; EFv(0) is the empty-vehicle factor; msi is a multiplicative operating-condition factor; Cv is payload capacity (t); and LFsi is the load fraction. Thus, both fuel-related vehicle emissions and the quantity transported determine emissions per functional unit.
Es = Σi {dsi × [EFv(LFsi) + rsi × EFv(0)] × msi}/[Cv × LFsi]
2.6. Distance, Utilization and Return Assumptions
Table 3 summarizes the assigned probability distributions. Triangular distributions were selected because empirical distributions were unavailable, while lower, modal and upper values could be specified transparently. They represent plausible scenario ranges, not confidence intervals from field observations. Dedicated regional trips allocate a full return distance to the delivery. Long-haul carriers can obtain backhauls across a wider network; L1 therefore allocates only 0–10% empty repositioning to the focal load, while L2 allocates 10–35%.
Table 3.
Probability distributions used in Monte Carlo analysis.
This asymmetry is intentional and tests the reviewer-relevant possibility that a longer chain can be operationally more efficient.
2.7. Uncertainty, Sensitivity, Break-Even Analysis and Validation
The model was evaluated with 100,000 Monte Carlo iterations using independent triangular draws and a fixed seed (20260807). Results are reported as medians and 2.5th–97.5th percentile uncertainty intervals (UIs). Pairwise probabilities indicate the proportion of iterations in which an SFSC emitted less than a long-chain benchmark. These probabilities describe the specified scenario distributions; they are not frequentist estimates from sampled firms.
Global sensitivity was assessed with Spearman rank correlations between uncertain inputs and scenario emissions. The sign indicates direction and the absolute coefficient indicates influence within the specified ranges. No p-values are reported because simulated inputs were assigned rather than sampled from a population.
A break-even analysis varied direct-SFSC payload and long-haul trunk distance while holding other parameters at modal values. For a representative local round trip, the direct-SFSC break-even payload relative to a benchmark emission B is P* = 2 dEF/B. This identifies the minimum payload needed for direct delivery to outperform the comparison chain.
Three checks were performed. First, unit consistency was verified for every leg. Second, calculated tonne-kilometer intensities reproduced the official 2025 factors within approximately 1%, with differences attributable to rounded published payloads.
Third, routed distances were recalculated independently for the two named origin–destination pairs. This is an internal and external-factor validation, not validation against observed Galician consignments. The calculations, Monte Carlo simulation, sensitivity analysis and figure generation were performed in Python 3.12 (Python Software Foundation, Wilmington, DE, USA).
3. Results
3.1. Scenario Emissions
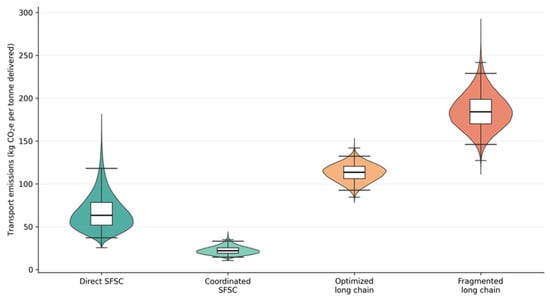
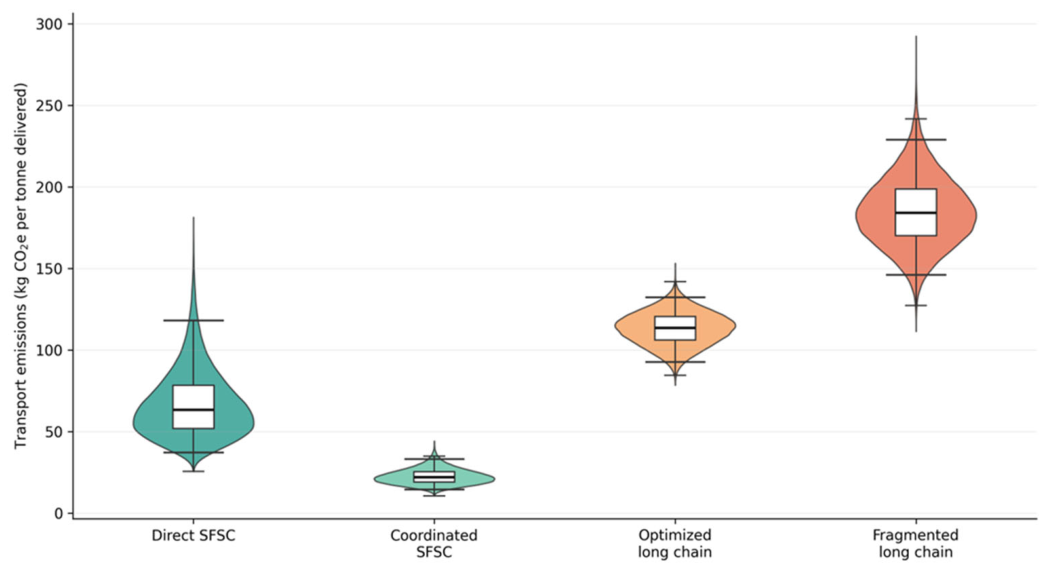
The four logistics configurations produced substantially different distributions (Table 4; Figure 3). Median emissions were lowest for a coordinated SFSC (22.0 kg CO2e t−1), followed by a direct SFSC (63.4), optimized long chain (113.5) and fragmented long chain (184.0). The ranking reflects both distance and operational efficiency. The direct SFSC had the widest relative uncertainty because emissions were allocated across a small and variable van payload.
Table 4.
Modeled transport emissions by chain configuration.
Figure 3.
Uncertainty distributions of transport-related well-to-wheel GHG emissions. White boxes show interquartile ranges, black lines show medians and horizontal whiskers indicate the 2.5th and 97.5th percentiles. Source: Authors’ Monte Carlo calculations from official 2025 vehicle factors [37,38] and scenario inputs in Table 3.
3.2. Comparative Reductions Are Configuration-Dependent
The original distance-only claim of a universal 90% reduction is not supported by the revised model. The direct SFSC showed a median reduction of 43.8% relative to L1, but the 95% UI ranged from a 7.7% disadvantage to a 67.9% reduction. The direct SFSC emitted less than L1 in 95.8% of simulations, meaning that unfavorable combinations of low payload and high operating intensity can erase the proximity advantage. Relative to fragmented L2, the direct scenario performed better in 99.96% of iterations, with a median reduction of 65.5%.
Coordination produced a larger and more stable difference. S2 reduced median emissions by 80.5% relative to L1 and by 88.0% relative to L2; its emissions were lower in every simulated pairing (Table 5). These percentages apply only to the specified transport boundary and fresh-produce scenarios; they are not estimates of whole-food-system mitigation.
Table 5.
Pairwise SFSC performance relative to long-chain benchmarks.
3.3. Drivers of Uncertainty and Break-Even Conditions
For the direct SFSC, payload utilization was the dominant driver (ρ = −0.866), almost twice the absolute influence of distance (ρ = 0.454). This confirms that moving a small quantity in a small vehicle can be more consequential than route length alone. In the coordinated SFSC, both distance (ρ = 0.655) and load factor (ρ = −0.705) were influential.
Optimized long-chain emissions were driven primarily by trunk distance (ρ = 0.816), while fragmented-chain results were influenced by both final-distribution distance (ρ = 0.534) and trunk distance (ρ = 0.496) (Table 6).
Table 6.
Spearman rank sensitivity coefficients for principal uncertain inputs.
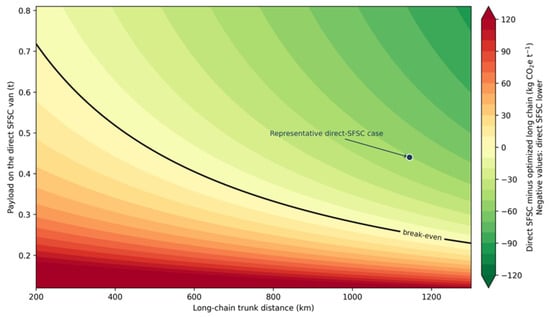
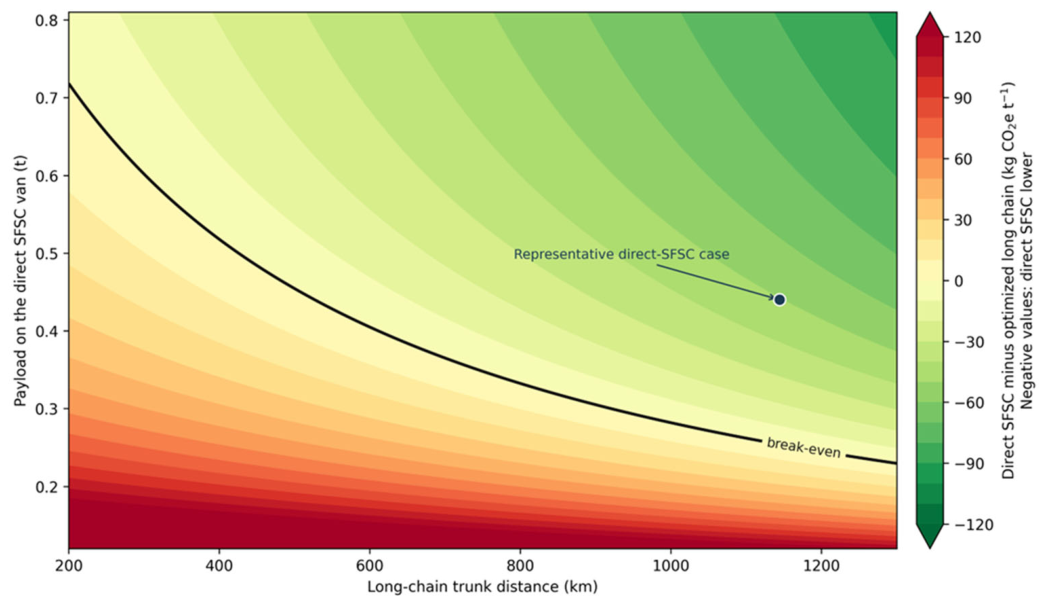
At the 43.1 km representative local distance, a direct-SFSC van required approximately 0.263 t of payload (24.3% of its 1.08 t capacity) to match the median optimized long-chain benchmark. The threshold relative to the fragmented benchmark was 0.162 t. Figure 4 extends the calculation across long-haul distances. Below the break-even curve, a poorly utilized direct van emits more per tonne than the optimized chain; above it, the regional distance advantage dominates.
Figure 4.
Break-even relationship between direct-SFSC van payload and optimized long-chain trunk distance. Negative values indicate lower direct-SFSC emissions; positive values indicate higher direct-SFSC emissions. Source: Authors’ calculations using modal regional distance and logistics parameters from Table 3 and official vehicle factors [37,38].
4. Discussion
4.1. Comparison with Previous Studies
The revised results reject a proportional interpretation of food miles. A tenfold distance difference does not produce a tenfold emissions difference when the long chain uses a high-capacity vehicle and the short chain uses a lightly loaded van. In this model, logistics efficiency reduces—but does not necessarily eliminate—the distance advantage. This is consistent with freight theory, in which emissions per tonne depend on vehicle-kilometer emissions and payload [38,40].
The findings align with empirical European evidence rather than with an unconditional local-food claim. Majewski et al. [18] evaluated 428 chains across six countries and found that long chains can, on average, outperform short chains for some eco-efficiency indicators because of scale and utilization. Loiseau et al. [17] similarly showed that the environmental performance of apple distribution depended on channel configuration, not proximity alone. Falasco et al. [20] reinforced this conditional interpretation for alternative food networks. The present contribution is not another LCA; it translates the same heterogeneity into explicit load-distance break-even conditions.
Dedicated-trip vulnerability also corresponds with Coley et al. [16], who showed that travel behavior can offset local distribution benefits. Consumer travel is excluded here, so direct-market emissions may still be underestimated where customers make separate car journeys. Conversely, coordinated pickup points or integration with existing journeys could reduce that burden. This boundary issue should be measured rather than assumed.
Recent logistics research provides a constructive interpretation. Galati et al. [21] show that vehicle technology and the electricity mix affect the case for electric SFSC fleets, while De et al. [22] demonstrate that routing and coordination can lower costs and emissions for small rural producers. Our S2 results support that mechanism: aggregation converts relational and institutional coordination into higher payload, which then produces a measurable transport benefit.
The apparently divergent estimates of transport’s share in food-system emissions [2,4,5,41] further caution against total-system claims. A transport-stage saving can be meaningful for low-production-emission foods such as some horticultural products, while remaining small relative to enteric methane or land-use change for ruminant products. Full LCA studies from 2023 to 2025 emphasize that product, waste, processing and boundary selection materially change carbon estimates [23,24,25]. Table 7 summarizes how the present analysis relates to the selected literature.
Table 7.
Critical positioning of the present study within the selected literature.
4.2. Theoretical Implications: Proximity as a Conditional Mechanism
The main theoretical implication is that geographical proximity acts through, and can be constrained by, logistics organization. Distance is an exposure variable; vehicle-kilometer intensity, payload allocation and chain architecture translate that exposure into emissions. A direct SFSC can therefore be geographically short but carbon-intensive per tonne, while a coordinated SFSC can combine proximity with scale economies.
Relational and institutional proximity matter because they can change those mediators. Trust, repeated exchange, cooperative rules, shared infrastructure and stable procurement demand can enable consolidation and reduce unsuccessful or partially loaded journeys [10,11,12,13]. The model therefore links SFSC theory with freight efficiency: coordination is not merely a social co-benefit but a potential operational mechanism for emission reduction.
This distinction also sharpens the link with rural development. Local value retention, producer bargaining power and resilience may follow from governance and market structure [7,8,42,43,44,45,46,47], not from a calculated kilogram of CO2e. The current study does not measure income, employment, resilience or social inclusion. It identifies a transport condition that may complement those aims without treating carbon savings as proof of them.
4.3. Applicability to Galicia and Other Peripheral Regions
The Galician application is most relevant to dispersed rural production serving nearby urban demand. Ferrolterra offers sufficient proximity for regional marketing but also faces fragmented supply and limited producer scale. Those conditions make consolidation, shared vehicles and predictable orders particularly important.
The As Pontes just-transition context adds policy relevance because diversification instruments can support agrifood infrastructure, but employment and territorial-resilience effects must be evaluated separately [31,48,49].
Transferability is analytical rather than statistical. Other Atlantic, mountainous or peripheral regions may use the same equations and scenario taxonomy [50], but should replace all distances, fleet factors, load distributions, refrigeration requirements and return patterns with local data. Large metropolitan food systems will continue to depend on long-distance supply for volume, seasonality and product diversity. The policy objective is therefore not to replace all long chains, but to identify products and corridors where regional supply is feasible and logistically efficient.
4.4. Actionable Policy Recommendations
Policy should target measured logistics bottlenecks rather than subsidize proximity as a label. Table 8 links each recommendation to an operational trigger and acknowledges its boundary.
Table 8.
Conditional policy recommendations for lower-carbon regional food logistics.
4.5. Limitations and Research Priorities
First, the model is scenario-based and lacks observed Galician transport records. Its uncertainty intervals reflect assigned parameter ranges rather than sampling error. Producers, cooperatives, distributors and retailers should be recruited to collect delivery notes, GPS routes, fuel or electricity use, payload, empty returns and product losses. Those data are necessary to validate distributions and estimate real adoption potential.
Second, the product boundary is deliberately narrow. Fresh ambient horticultural produce cannot represent refrigerated meat, dairy, seafood, frozen foods or processed products. Refrigerated HGV factors carry an approximately 16–19% uplift in the official methodology [38], while processing, packaging and storage may dominate other products. Product-specific ISO-compliant LCAs are required before making consumer or procurement claims.
Third, the representative corridors are not observed flows. Almería–Ferrol illustrates a plausible national horticultural route and As Pontes–Ferrol a regional route, but actual origins, destinations, intermediate platforms and seasonal supply patterns may differ. GIS network analysis should be combined with commercial flow data rather than used alone.
Fourth, UK 2025 fleet factors are used as a transparent European proxy. Spanish vehicle age, road gradient, congestion, fuel blend and driving conditions may differ. Direct fuel-metering would improve accuracy. Electric vehicles were not modeled because their advantage depends on the duty cycle, charging and electricity mix [21].
Fifth, the model excludes consumer travel, food loss, production, storage and retail energy. It also assumes that the compared product provides an equivalent function and quality at the point of sale. These exclusions prevent conclusions about total food-system emissions or dietary substitution.
Finally, rural-development and just-transition outcomes are conceptual, not measured. Future mixed-method research should combine transport telemetry and product LCA with producer accounts, employment data, institutional analysis, gender-sensitive participation indicators and stakeholder interviews. Comparative application in several European regions would then test external validity.
5. Conclusions
A distance-only comparison cannot establish the carbon advantage of an SFSC. Once vehicle class, payload, chain stages and empty returns are represented, the original claim of a universal 90% reduction disappears. The relevant question is not simply how far food travels, but how much product is delivered per vehicle-kilometer across the complete distribution configuration.
For the specified fresh-produce scenarios, coordinated regional delivery had the lowest median transport emissions (22.0 kg CO2e t−1), followed by the direct SFSC (63.4), optimized long chain (113.5) and fragmented long chain (184.0). The direct SFSC was usually—but not invariably—better than the optimized benchmark; its 95% reduction interval extended from a small disadvantage to a 67.9% benefit. At the representative 43.1 km local distance, a van payload above approximately 0.263 t was required to beat the median optimized long chain.
The theoretical contribution is conditional: geographical proximity can lower transport exposure, but coordination determines whether that advantage is realized. Food hubs, pooled deliveries, predictable procurement and route planning are therefore more defensible policy levers than an undifferentiated ‘local equals low carbon’ label.
These findings concern transport-stage scenarios, not empirical Galician food flows, full product LCAs or measured rural-development outcomes. SFSCs can form one complementary element of a carbon-neutral rural transition, especially in territories such as Ferrolterra and As Pontes, but their climate and territorial claims should be tested with observed logistics, product-specific life-cycle data and independent socioeconomic indicators.
Author Contributions
Conceptualization, A.M.-V. and C.L.B.; Methodology, A.M.-V. and C.L.B.; Formal analysis, A.M.-V. and C.L.B.; Investigation, A.M.-V. and C.L.B.; Data curation, A.M.-V. and C.L.B.; Writing—original draft preparation, A.M.-V. and C.L.B.; Writing—review and editing, A.M.-V. and C.L.B.; Supervision, A.M.-V. and C.L.B.; Project administration, A.M.-V. and C.L.B. All authors have read and agreed to the published version of the manuscript.
Funding
This research received no external funding.
Data Availability Statement
The data used to parameterize the scenario analysis are publicly available from the sources cited in the article. All scenario assumptions and aggregate model outputs are reported in the manuscript. No new empirical dataset was generated.
Conflicts of Interest
The authors declare no conflicts of interest.
Abbreviations
The following abbreviations and acronyms are used throughout this article to ensure clarity and consistency in terminology related to rural development, agricultural policy, and local food systems.
| Abbreviation | Definition |
| CO2e | Carbon dioxide equivalent |
| GHG | Greenhouse gas |
| GIS | Geographic Information System |
| HGV | Heavy Goods Vehicle |
| KPI | Key Performance Indicator |
| LCA | Life-Cycle Assessment |
| NUTS | Nomenclature of Territorial Units for Statistics |
| OSRM | Open Source Routing Machine |
| SFSC | Short Food Supply Chain |
| UI | Uncertainty Interval |
| WTW | Well-to-Wheel |
References
- European Union. Regulation (EU) 2021/1119 of the European Parliament and of the Council of 30 June 2021 establishing the framework for achieving climate neutrality. Off. J. Eur. Union 2021, L 243, 1–17. [Google Scholar]
- Crippa, M.; Solazzo, E.; Guizzardi, D.; Monforti-Ferrario, F.; Tubiello, F.N.; Leip, A. Food systems are responsible for a third of global anthropogenic greenhouse gas emissions. Nat. Food 2021, 2, 198–209. [Google Scholar] [CrossRef] [Scilit]
- IPCC. Climate Change 2023: Synthesis Report; Intergovernmental Panel on Climate Change: Geneva, Switzerland, 2023. [Google Scholar] [CrossRef] [Scilit]
- Poore, J.; Nemecek, T. Reducing food’s environmental impacts through producers and consumers. Science 2018, 360, 987–992, Erratum in Science 2019, 363, eaaw9908. https://doi.org/10.1126/science.aaw9908. [Google Scholar] [CrossRef] [Scilit]
- Li, M.; Jia, N.; Lenzen, M.; Malik, A.; Wei, L.; Jin, Y.; Raubenheimer, D. Global food-miles account for nearly 20% of total food-systems emissions. Nat. Food 2022, 3, 445–453. [Google Scholar] [CrossRef] [Scilit]
- European Union. Regulation (EU) No 1305/2013 on support for rural development by the European Agricultural Fund for Rural Development. Off. J. Eur. Union 2013, L 347, 487–548. [Google Scholar]
- Marsden, T.; Banks, J.; Bristow, G. Food supply chain approaches: Exploring their role in rural development. Sociol. Rural. 2000, 40, 424–438. [Google Scholar] [CrossRef] [Scilit]
- Renting, H.; Marsden, T.K.; Banks, J. Understanding alternative food networks: Exploring the role of short food supply chains in rural development. Environ. Plan. A 2003, 35, 393–411. [Google Scholar] [CrossRef] [Scilit]
- Kneafsey, M.; Venn, L.; Schmutz, U.; Balázs, B.; Trenchard, L.; Eyden-Wood, T.; Bos, E.; Sutton, G.; Blackett, M. Short Food Supply Chains and Local Food Systems in the EU: A State of Play of Their Socio-Economic Characteristics; European Commission: Luxembourg, 2013. [Google Scholar]
- Paciarotti, C.; Torregiani, F. The logistics of the short food supply chain: A literature review. Sustain. Prod. Consum. 2021, 26, 428–442. [Google Scholar] [CrossRef] [Scilit]
- Jia, F.; Shahzadi, G.; Bourlakis, M.; John, A. Promoting resilient and sustainable food systems: A systematic literature review on short food supply chains. J. Clean. Prod. 2024, 435, 140364. [Google Scholar] [CrossRef] [Scilit]
- Gori, F.; Castellini, A. Alternative food networks and short food supply chains: A systematic literature review based on a case study approach. Sustainability 2023, 15, 8140. [Google Scholar] [CrossRef] [Scilit]
- León-Bravo, V.; Borrello, B.; Ciccullo, F.; Caniato, F. Unpacking proximity for sustainability in short food supply chains. Bus. Strategy Environ. 2025, 34, 1792–1809. [Google Scholar] [CrossRef] [Scilit]
- Weber, C.L.; Matthews, H.S. Food-miles and the relative climate impacts of food choices in the United States. Environ. Sci. Technol. 2008, 42, 3508–3513. [Google Scholar] [CrossRef] [Scilit]
- Edwards-Jones, G.; Mila i Canals, L.; Hounsome, N.; Truninger, M.; Koerber, G.; Hounsome, B.; Cross, P.; York, E.H.; Hospido, A.; Plassmann, K.; et al. Testing the assertion that ‘local food is best’: The challenges of an evidence-based approach. Trends Food Sci. Technol. 2008, 19, 265–274. [Google Scholar] [CrossRef] [Scilit]
- Coley, D.; Howard, M.; Winter, M. Local food, food miles and carbon emissions: A comparison of farm shop and mass distribution approaches. Food Policy 2009, 34, 150–155. [Google Scholar] [CrossRef] [Scilit]
- Loiseau, E.; Colin, M.; Alaphilippe, A.; Coste, G.; Roux, P. To what extent are short food supply chains environmentally friendly? Application to French apple distribution using Life Cycle Assessment. J. Clean. Prod. 2020, 276, 124166. [Google Scholar] [CrossRef] [Scilit]
- Majewski, E.; Komerska, A.; Kwiatkowski, J.; Malak-Rawlikowska, A.; Wąs, A.; Sulewski, P.; Gołaś, M.; Pogodzińska, K.; Lecoeur, J.-L.; Tocco, B.; et al. Are short food supply chains more environmentally sustainable than long chains? Energies 2020, 13, 4853. [Google Scholar] [CrossRef] [Scilit]
- Schmitt, E.; Galli, F.; Menozzi, D.; Maye, D.; Touzard, J.-M.; Marescotti, A.; Six, J.; Brunori, G. Comparing the sustainability of local and global food products in Europe. J. Clean. Prod. 2017, 165, 346–359. [Google Scholar] [CrossRef] [Scilit]
- Falasco, S.; Ferla, G.; Caputo, P.; Mura, B.; Borrello, B.; Marson, M.; León Bravo, V.; Caniato, F. The impacts of food chains: Are alternative food networks sustainable? Clean Technol. Environ. Policy 2025, 27, 8315–8330. [Google Scholar] [CrossRef] [Scilit]
- Galati, A.; Adamashvili, N.; Crescimanno, M. A feasibility analysis on adopting electric vehicles in the short food supply chain based on GHG emissions and economic costs estimations. Sustain. Prod. Consum. 2023, 36, 49–61. [Google Scholar] [CrossRef] [Scilit]
- De, A.; Tocco, B.; Gorton, M. Optimizing short food supply chain logistics to lower carbon emissions and enhance operational efficiency for small-scale rural producers. Transp. Res. Part D 2025, 146, 104855. [Google Scholar] [CrossRef] [Scilit]
- Pacheco da Costa, T.; Gillespie, J.; Pelc, K.; Adefisan, A.; Adefisan, M.; Ramanathan, R.; Murphy, F. Life cycle assessment tool for food supply chain environmental evaluation. Sustainability 2023, 15, 718. [Google Scholar] [CrossRef] [Scilit]
- Shabir, I.; Dash, K.K.; Dar, A.H.; Pandey, V.K.; Fayaz, U.; Srivastava, S.; Nisha, R. Carbon footprints evaluation for sustainable food processing system development: A comprehensive review. Future Foods 2023, 7, 100215. [Google Scholar] [CrossRef] [Scilit]
- Mandouri, J.; Onat, N.C.; Kucukvar, M.; Jabbar, R.; Al-Quradaghi, S.; Al-Thani, S.; Kazançoğlu, Y. Carbon footprint of food production: A systematic review and meta-analysis. Sci. Rep. 2025, 15, 35630. [Google Scholar] [CrossRef] [Scilit]
- ISO 14040:2006; Environmental Management—Life Cycle Assessment—Principles and Framework. ISO: Geneva, Switzerland, 2006.
- European Commission. The European Green Deal; COM(2019) 640 Final; European Commission: Brussels, Belgium, 2019. [Google Scholar]
- European Commission. A Farm to Fork Strategy for a Fair, Healthy and Environmentally-Friendly Food System; COM(2020) 381 Final; European Commission: Brussels, Belgium, 2020. [Google Scholar]
- Instituto Galego de Estatística. Anuario Estatístico de Galicia 2024; IGE: Santiago de Compostela, Spain, 2024. [Google Scholar]
- Xunta de Galicia. Estratexia Galega de Cambio Climático e Enerxía 2050; Xunta de Galicia: Santiago de Compostela, Spain, 2023. [Google Scholar]
- Ministerio para la Transición Ecológica y el Reto Demográfico. Convenio de Transición Justa de as Pontes and Maciñeira 400 kV Transition Node Documentation; MITECO: Madrid, Spain, 2024. [Google Scholar]
- Martínez-Vérez, A.; Lucini Baquero, C. Promoting the sale of locally sourced products: Km 0 as a sustainable model for local agriculture and CO2 reduction. Agriculture 2025, 15, 1568. [Google Scholar] [CrossRef] [Scilit]
- Martínez-Vérez, A.; Lucini-Baquero, C.; Montero-Seoane, A. Rural motivations and Km 0 food systems: Comparative perspectives from farmers, restaurants, and policymakers in Spain. Sustainability 2026, 18, 5694. [Google Scholar] [CrossRef] [Scilit]
- Eurostat GISCO. NUTS 2024 Geodata, 1:1 Million, EPSG:4326; European Commission: Luxembourg, 2024; Available online: https://gisco-services.ec.europa.eu/ (accessed on 7 August 2026).
- OpenDataSoft. GeoRef Spain—Municipality Boundaries, 2022. Available online: https://public.opendatasoft.com/ (accessed on 7 August 2026).
- Open Source Routing Machine Project. OSRM Route Service. Available online: https://project-osrm.org/ (accessed on 7 August 2026).
- Department for Energy Security and Net Zero. UK Government GHG Conversion Factors for Company Reporting: Full Set 2025; UK Government: London, UK, 2025. Available online: https://www.gov.uk/government/collections/government-conversion-factors-for-company-reporting (accessed on 7 August 2026).
- Department for Energy Security and Net Zero. 2025 Government Greenhouse Gas Conversion Factors for Company Reporting: Methodology Paper; UK Government: London, UK, 2025. [Google Scholar]
- European Environment Agency. EMEP/EEA Air Pollutant Emission Inventory Guidebook 2023; EEA Report 06/2023; EEA: Copenhagen, Denmark, 2023. [Google Scholar]
- McKinnon, A. Decarbonizing Logistics: Distributing Goods in a Low Carbon World; Kogan Page: London, UK, 2018. [Google Scholar]
- Deconinck, K.; Toyama, L. Environmental Impacts Along Food Supply Chains: Methods, Findings, and Evidence Gaps; OECD Food, Agriculture and Fisheries Papers No. 185; OECD Publishing: Paris, France, 2022. [Google Scholar] [CrossRef]
- OECD. Rural Well-Being: Geography of Opportunities; OECD Publishing: Paris, France, 2020. [Google Scholar] [CrossRef] [Scilit]
- Wilson, G.A. Multifunctional ‘quality’ and rural community resilience. Trans. Inst. Br. Geogr. 2010, 35, 364–381. [Google Scholar] [CrossRef] [Scilit]
- Darnhofer, I. Resilience and why it matters for farm management. Eur. Rev. Agric. Econ. 2014, 41, 461–484. [Google Scholar] [CrossRef] [Scilit]
- Moragues-Faus, A.; Marsden, T. The political ecology of food: Carving ‘spaces of possibility’ in a new research agenda. J. Rural Stud. 2017, 55, 275–288. [Google Scholar] [CrossRef] [Scilit]
- Malak-Rawlikowska, A.; Majewski, E.; Wąs, A.; Borgen, S.O.; Csillag, P.; Donati, M.; Freeman, R.; Hoàng, V.; Lecoeur, J.-L.; Mancini, M.C.; et al. Measuring the economic, environmental, and social sustainability of short food supply chains. Sustainability 2019, 11, 4004. [Google Scholar] [CrossRef] [Scilit]
- Vittersø, G.; Torjusen, H.; Laitala, K.; Tocco, B.; Biasini, B.; Csillag, P.; de Labarre, M.D.; Lecoeur, J.-L.; Maj, A.; Majewski, E.; et al. Short food supply chains and their contributions to sustainability: Participants’ views and perceptions from 12 European cases. Sustainability 2019, 11, 4800. [Google Scholar] [CrossRef] [Scilit]
- European Commission. The Just Transition Mechanism: Making Sure No One Is Left Behind; European Commission: Brussels, Belgium, 2020. [Google Scholar]
- Newell, P.; Mulvaney, D. The political economy of the ‘just transition’. Geogr. J. 2013, 179, 132–140. [Google Scholar] [CrossRef] [Scilit]
- European Commission. A Long-Term Vision for the EU’s Rural Areas—Towards Stronger, Connected, Resilient and Prosperous Rural Areas by 2040; COM(2021) 345 Final; European Commission: Brussels, Belgium, 2021. [Google Scholar]

Disclaimer/Publisher’s Note: The statements, opinions and data contained in all publications are solely those of the individual author(s) and contributor(s) and not of MDPI and/or the editor(s). MDPI and/or the editor(s) disclaim responsibility for any injury to people or property resulting from any ideas, methods, instructions or products referred to in the content. |
© 2026 by the authors. Licensee MDPI, Basel, Switzerland. This article is an open access article distributed under the terms and conditions of the Creative Commons Attribution (CC BY) license.