


Abstract
The increasing exposure of food supply chains to environmental pressures, market volatility, and operational disruptions has intensified the need to integrate sustainability with supply chain agility. This study develops an integrated multi-criteria decision-making framework to identify and prioritize sustainability and agility indicators for the Baltic dairy industry. An initial set of 39 indicators across seven dimensions was identified from the literature. The Fuzzy Delphi Method (FDM), involving 15 experts, was used to validate and screen the indicators, followed by the hierarchical Fuzzy Best–Worst Method (FBWM) to determine their relative weights. FDM retained 35 indicators. FBWM identified responsiveness and speed and information and visibility as the most influential dimensions. Key priorities included resource efficiency, product quality, transparency and traceability, supply disruption response, supply chain adaptability, real-time information sharing, and supplier collaboration. Globally, real-time information sharing and supply disruption response emerged among the highest-ranked indicators. The findings demonstrate that sustainability and agility are complementary supply chain objectives, emphasizing the importance of visibility, responsiveness, adaptability, and collaboration. The proposed FDM–FBWM framework provides a structured decision-support tool for dairy processors and policymakers seeking more sustainable, responsive, and adaptive Baltic dairy supply chains.
1. Introduction
Supply chains in the food-processing sector operate under increasing pressure to simultaneously improve environmental and social performance while maintaining the flexibility required to respond to market volatility, supply disruptions, technological change, and evolving consumer expectations [1]. These pressures are particularly pronounced in the dairy industry, where supply chains involve biologically sensitive raw materials, strict quality and safety requirements, temperature-controlled logistics, short production and delivery cycles, and considerable dependence on agricultural suppliers [2]. Consequently, conventional approaches focused primarily on cost efficiency and operational stability are increasingly insufficient. Dairy supply chains require management systems capable of integrating sustainability objectives with agility to maintain competitiveness and resilience under changing operating conditions [3].
Sustainable supply chain management (SSCM) extends traditional supply chain objectives by incorporating environmental, economic, and social considerations into sourcing, production, logistics, distribution, and stakeholder relationships [4]. Within dairy processing, sustainability concerns encompass energy and water consumption, greenhouse gas emissions, waste and by-product management, sustainable sourcing, resource efficiency, employee welfare, and long-term economic viability. However, sustainability-oriented practices may require investments, organizational changes, and coordination across supply chain actors, while firms must simultaneously maintain responsiveness to demand fluctuations and operational disruptions. Sustainability therefore cannot be considered independently from the ability of supply chains to adapt rapidly to changing conditions [5].
Supply chain agility represents the capability to sense changes and respond effectively through flexibility, speed, coordination, information sharing, and rapid decision-making [6]. In dairy supply chains, agility is particularly relevant because variations in raw milk availability, seasonal production patterns, changing customer demand, transportation disruptions, and limited product shelf life can quickly affect operational performance. Agile capabilities enable firms to adjust procurement, production schedules, inventory, logistics, and market responses while minimizing operational losses. The integration of sustainability and agility therefore provides a broader strategic perspective in which firms seek not only to reduce adverse environmental and social impacts but also to develop supply chains capable of responding effectively to uncertainty [7].
Despite their strategic importance, sustainability and agility are multidimensional concepts represented by numerous potentially interrelated indicators. Managers consequently face a fundamental decision problem: determining which indicators should receive priority when resources for supply chain improvement are limited. Treating all indicators as equally important may produce inefficient resource allocation and obscure those factors that have the greatest strategic relevance. Furthermore, indicators identified in general manufacturing or supply chain studies may not adequately reflect the operational characteristics of dairy processing. Context-specific identification and prioritization are therefore necessary to translate broad sustainability and agility concepts into actionable managerial priorities [8,9,10].
This issue is particularly relevant to the Baltic dairy industry. Lithuania, Latvia, and Estonia have established dairy sectors that contribute to agricultural production, food processing, regional trade, and export activities. At the same time, dairy processors in these relatively small and internationally connected economies are exposed to fluctuations in agricultural inputs, energy and logistics costs, export-market conditions, environmental requirements, and competitive pressures. Strengthening sustainable and agile supply chain management can consequently contribute to the long-term competitiveness and adaptability of Baltic dairy processors. Nevertheless, systematic evidence regarding the relative importance of sustainability and agility indicators within this specific regional and industrial setting remains limited. In this context, strengthening supply chain resilience through improved responsiveness, adaptability, and information visibility is particularly important for managing disruptions while maintaining sustainable operations.
Assessing these indicators also involves methodological challenges. Expert judgments concerning sustainability and agility frequently contain uncertainty, ambiguity, and linguistic subjectivity, making conventional crisp evaluation techniques less suitable. Fuzzy multi-criteria decision-making (MCDM) approaches provide an appropriate analytical foundation because they allow qualitative expert assessments to be represented under conditions of uncertainty. In this study, the Fuzzy Delphi Method (FDM) and Fuzzy Best–Worst Method (FBWM) are integrated sequentially. FDM is employed to screen and validate an initial set of sustainability and agility indicators through expert consensus, thereby ensuring that the retained indicators are relevant to the Baltic dairy-processing context. FBWM is subsequently applied to determine their relative weights and establish a structured prioritization. The integration of the two methods combines systematic indicator validation with preference-based weighting while accounting for uncertainty in expert evaluations.
Accordingly, this study aims to identify, validate, and prioritize the key sustainability and agility indicators for supply chain management in the Baltic dairy industry using an integrated FDM–FBWM framework. The study makes three principal contributions. First, it integrates sustainability and agility within a unified indicator-based framework rather than examining these supply chain capabilities separately. Second, it provides context-specific empirical evidence from dairy-processing firms in Lithuania, Latvia, and Estonia, extending the geographical and sectoral coverage of sustainable and agile supply chain research. Third, it develops a structured fuzzy MCDM framework that combines expert consensus with indicator prioritization, providing managers with a practical basis for identifying areas in which improvement efforts and resources should be concentrated. The resulting priorities can support dairy processors and relevant stakeholders in designing supply chains that achieve sustainability objectives while maintaining the responsiveness required in increasingly uncertain industrial environments.
The remainder of this paper is organized as follows. Section 2 reviews the literature on sustainability and agility in dairy supply chains. Section 3 presents the research methodology, including FDM and FBWM. Section 4 reports the empirical results and indicator rankings. Section 5 discusses the findings and their implications. Finally, Section 6 presents the conclusions, limitations, and directions for future research.
2. Literature Review and Development of the Indicator Framework
2.1. Sustainable and Agile Supply Chain Management
The increasing complexity of contemporary supply chains has encouraged organizations to move beyond conventional performance objectives centered primarily on cost, quality, and delivery [11]. Sustainability and agility have consequently emerged as two important strategic orientations for managing supply chains exposed to environmental pressures, stakeholder expectations, demand uncertainty, technological change, and operational disruptions. Sustainable supply chain management (SSCM) incorporates environmental, economic, and social considerations into supply chain decisions, whereas supply chain agility emphasizes the ability to sense changes and respond rapidly and effectively to them. Although these concepts have developed through largely separate research streams, their integration is increasingly important because sustainability without adaptability may limit organizational responsiveness, while agility without sustainability may generate short-term operational benefits at the expense of longer-term environmental, economic, and social performance [12].
SSCM extends sustainability principles beyond the boundaries of an individual organization by considering upstream suppliers, internal operations, logistics, customers, and other stakeholders [13]. In the food industry, this perspective is particularly relevant because sustainability performance depends on interconnected activities ranging from agricultural production and sourcing to processing, transportation, distribution, and waste management. Previous research has therefore increasingly evaluated food supply chains according to environmental, economic, and social dimensions rather than relying exclusively on conventional operational indicators. Reviews of food supply chain sustainability confirm the predominance of this three-dimensional structure and identify indicators relating to energy, water, emissions, waste, economic performance, product quality, employment, health and safety, and stakeholder relationships [14].
These considerations are especially important in dairy supply chains. Dairy production and processing require substantial energy and water resources and generate environmental impacts across agricultural production, processing, refrigeration, packaging, transportation, and waste-management activities [15]. At the same time, dairy processors must maintain product quality, food safety, economic viability, stable supplier relationships, and acceptable working conditions. Research conducted specifically on dairy sustainability has consequently emphasized indicators such as greenhouse gas emissions, energy consumption, water use, waste management, renewable energy, economic efficiency, labor conditions, health and safety, and supply chain transparency. A recent study of Lithuanian dairy SMEs similarly demonstrated the relevance of evaluating sustainability through environmental, economic, and social dimensions, indicating the importance of developing sector- and region-specific sustainability priorities [16,17].
Sustainability alone, however, does not fully address the operational uncertainty characterizing food and dairy supply chains [18]. Perishable products, variations in agricultural output, demand fluctuations, disruptions in transportation and energy markets, changing customer preferences, and competitive pressures require firms to respond rapidly to changes. Supply chain agility addresses this requirement by emphasizing the capacity to identify changes, access relevant information, make timely decisions, modify operations, and implement responses rapidly. Desalegn et al. (2024) conceptualized agility around four major capabilities—responsiveness, competency, flexibility/adaptability, and quickness—while subsequent research has expanded the concept to include information sharing, collaboration, market sensitivity, integration, visibility, and innovation [19]. Patel and Sambasivan (2024), for example, conceptualized supply chain agility through alertness, accessibility, decisiveness, swiftness, and flexibility [20].
The relationship between agility and sustainability is therefore complementary rather than contradictory [21]. Agile capabilities can facilitate sustainability implementation by allowing organizations to modify sourcing arrangements, production processes, logistics systems, technologies, and supplier relationships when environmental, economic, or social conditions change [22]. Empirical research has also suggested that agile capabilities can represent necessary conditions for maximizing sustainable supply chain performance. This integration is particularly relevant for dairy processors, where sustainability objectives must be pursued while simultaneously preserving responsiveness, product availability, quality, and continuity of operations [3,23]. Previous research has even examined sustainable supply chain agility specifically within dairy manufacturing, reinforcing the relevance of combining the two perspectives within a unified assessment framework [9,24].
Despite this growing literature, there is no universally applicable set of sustainability and agility indicators. The relevance of individual indicators depends on industrial characteristics, supply chain configuration, regulatory conditions, market structure, and regional circumstances. Therefore, directly transferring a generic indicator framework to Baltic dairy processing could overlook context-specific priorities. The present study addresses this issue by deriving an initial indicator pool from previous research and subsequently subjecting these indicators to expert screening through the Fuzzy Delphi Method (FDM). The indicators retained through expert consensus are then prioritized using the Fuzzy Best–Worst Method (FBWM).
2.2. Sustainability Dimensions
The sustainability component of the proposed framework follows the triple-bottom-line perspective and is organized into environmental, economic, and social dimensions. This structure is widely applied in sustainable supply chain and food-system research because it recognizes that long-term supply chain performance cannot be evaluated exclusively through environmental outcomes [25].
Environmental sustainability concerns the reduction in negative ecological impacts associated with sourcing, production, processing, transportation, and distribution. Within dairy supply chains, environmental pressures arise particularly from greenhouse gas emissions, energy-intensive processing and refrigeration, water consumption, waste and by-products, agricultural land use, and dependence on conventional energy. Accordingly, indicators such as GHG emissions, energy consumption, water usage, waste management, renewable energy use, resource efficiency, and circular economy practices provide important measures of environmental performance. Existing reviews of food supply chains identify water and energy consumption, emissions, waste, recycled materials, and environmental management among commonly adopted environmental measures [26].
Economic sustainability refers to the ability of the supply chain to remain financially viable and competitive while supporting long-term sustainable operations. Cost efficiency remains fundamental, but sustainable economic performance also involves profitability, return on investment, productivity, quality, market performance, risk management, and sourcing stability. Within Baltic dairy processing, where firms operate in relatively small domestic markets while participating in wider European and international markets, maintaining economic viability is essential for sustaining investments in environmental technologies, workforce development, digitalization, and supply chain improvements. Previous dairy research in Lithuania has similarly highlighted cost efficiency, return on investment, supply chain flexibility, risk reduction, and local sourcing as relevant economic considerations [27,28].
Social sustainability concerns the effects of supply chain activities on employees, suppliers, communities, consumers, and other stakeholders. Compared with environmental sustainability, the social dimension has historically received less systematic attention in food supply chain research, although its importance has increased substantially. Relevant issues include labor rights, occupational health and safety, fair working conditions, transparency, traceability, stakeholder participation, community engagement, and employee development. These considerations are particularly relevant in agri-food supply chains because production and processing are closely connected with rural employment, farmer relationships, consumer safety, and regional socioeconomic development [14,29].
2.3. Supply Chain Agility Dimensions
Supply chain agility is multidimensional and cannot be adequately represented by a single measure. Drawing on established agility frameworks and the supply chain performance literature, the present study organizes agility into four dimensions particularly applicable to dairy-processing supply chains: responsiveness and speed, flexibility and adaptability, information and visibility, and collaboration and customer orientation. These dimensions synthesize the capabilities most consistently emphasized across previous agility studies [30].
Responsiveness and speed represent the ability of the supply chain to recognize changes and implement appropriate responses rapidly. Responsiveness concerns the ability to identify and react to changes in demand, supply, disruptions, or market conditions, whereas speed relates to how quickly decisions and operational activities can be completed. In dairy processing, product perishability and time-sensitive distribution increase the consequences of delays; rapid response, short lead times, fast decision-making, and disturbance detection are particularly important [31].
Flexibility and adaptability refer to the ability to reconfigure supply chain activities when operating conditions change. Flexibility can include adjustments in production volume, product mix, delivery arrangements, sourcing, and logistics, while adaptability represents the broader ability to modify supply chain structures and practices in response to longer-term environmental or market changes. Previous research consistently identifies flexibility/adaptability as one of the dominant characteristics of agile supply chains [32,33].
Information and visibility concerns availability, accessibility, accuracy, and timely exchange of information throughout the supply chain. Agile decision-making requires firms to access information regarding demand, inventory, suppliers, logistics, production conditions, and potential disruptions. Real-time information exchange, data accessibility, supply chain visibility, information integration, and digital technologies therefore contribute directly to agility by reducing information delays and improving coordination [34,35].
Finally, collaboration and customer orientation capture the relational dimension of agility. Agile supply chains depend on coordination among suppliers, processors, logistics providers, distributors, and customers. Collaborative relationships facilitate joint problem-solving and rapid responses, while customer and market sensitivity enable organizations to identify changing requirements and adjust products and services accordingly. Cooperation, information exchange, market sensitivity, customer satisfaction, and integration have consequently been widely identified as characteristics of agile supply chains [36].
2.4. Identification of Sustainability and Agility Indicators
Based on the preceding literature, an initial set of candidate indicators was developed for the Baltic dairy-processing context. The purpose of this stage was not to predetermine the final framework but to construct a sufficiently comprehensive, theoretically supported pool of indicators for subsequent expert evaluation. Indicators were selected based on their recurrence in the sustainable and agile supply chain literature, applicability to food and dairy supply chains, and potential relevance to the operating characteristics of Baltic dairy processors. Table 1 presents the initial dimensions and indicators together with their operational interpretation and principal literature foundations.
Table 1.
Initial sustainability and agility indicators derived from previous studies.
As shown in Table 1, the preliminary framework contains 39 candidate indicators, comprising 19 sustainability indicators across environmental, economic, and social dimensions and 20 agility indicators across responsiveness and speed, flexibility and adaptability, information and visibility, and collaboration and customer orientation. The table represents the literature-derived input to the Fuzzy Delphi stage rather than the final indicator framework. Consequently, the subsequent expert evaluation determines whether each candidate indicator is sufficiently relevant to the Baltic dairy industry and whether indicators should be retained, modified, consolidated, or excluded before the weighting and prioritization stage using FBWM.
3. Methodology
3.1. Research Framework
This study applies an integrated fuzzy multi-criteria decision-making (MCDM) framework to identify, validate, and prioritize sustainability and agility indicators for supply chain management in the Baltic dairy industry. The empirical context covers Lithuania, Latvia, and Estonia.
The methodological framework combines the Fuzzy Delphi Method (FDM) and the Fuzzy Best–Worst Method (FBWM) in a sequential process. First, an initial pool of sustainability and agility indicators is identified from previous studies. Second, FDM is used to evaluate the relevance of these indicators and establish expert consensus regarding their inclusion in the final framework. Third, the indicators retained through the FDM stage are evaluated using FBWM to determine their relative importance and overall priority.
This sequence distinguishes three analytical stages: indicator identification, indicator validation, and indicator prioritization. The literature review provides the theoretical basis for the initial indicator framework, FDM ensures contextual relevance to the Baltic dairy industry, and FBWM provides the final weighting and ranking.
The overall research framework is illustrated in Figure 1, presenting the sequential stages of indicator identification, expert-based validation through the Fuzzy Delphi Method (FDM), and hierarchical weighting and prioritization using the Fuzzy Best–Worst Method (FBWM).
Figure 1.
Integrated FDM–FBWM research framework.
3.2. Identification of Indicators
The initial indicators were identified through a review of previous studies addressing sustainable supply chain management, supply chain agility, food and agri-food supply chains, dairy supply chains, and related MCDM applications.
As presented in Table 1, sustainability is represented through three dimensions: environmental, economic, and social sustainability. Agility is represented through four dimensions: responsiveness and speed, flexibility and adaptability, information and visibility, and collaboration and customer orientation.
The literature review generated an initial pool of 39 candidate indicators, comprising 19 sustainability indicators and 20 agility indicators. The initial framework was intentionally developed as a broad indicator pool because the subsequent FDM analysis was designed to determine which indicators were sufficiently relevant to the Baltic dairy industry. Indicators failing to achieve the required level of expert consensus were excluded before the weighting stage.
3.3. Expert Selection and Data Collection
Expert judgment constituted the primary source of empirical information for the FDM and FBWM analyses. Therefore, purposive sampling was employed to select participants with relevant professional or academic expertise in dairy processing, supply chain management, sustainability, logistics, procurement, operations management, and related fields. The objective was not statistical representativeness but the acquisition of informed judgments from individuals with sufficient knowledge of sustainable and agile supply chain practices.
A panel of 15 experts participated in the study. To ensure balanced geographical representation of the Baltic dairy industry, five experts were selected from each of the three Baltic countries: Lithuania, Latvia, and Estonia. Participants represented both industry and academia and possessed relevant experience in dairy and food supply chains, sustainability, logistics, procurement, operations, and supply chain management.
Experts were selected based on their professional relevance to the research problem, practical or academic experience, and familiarity with supply chain decision-making. The overall characteristics of the expert panel are summarized in Table 2.
Table 2.
Summary characteristics of the expert panel (N = 15).
Data collection was conducted in two sequential stages. In the first stage, the experts evaluated the relevance of the literature-derived sustainability and agility indicators using the linguistic scale adopted for the FDM. These evaluations were used to establish consensus and identify the indicators retained for further analysis. In the second stage, the validated indicators were evaluated using FBWM to determine their relative importance and final priorities.
The same expert panel participated in both stages to maintain consistency between indicator validation and prioritization. Before completing the questionnaires, participants received definitions of the dimensions and indicators together with instructions regarding the linguistic evaluation scales to minimize differences in interpretation.
3.4. Fuzzy Delphi Method
The Fuzzy Delphi Method was applied to evaluate and validate the initial sustainability and agility indicators identified from the literature. FDM combines the expert-consensus principles of the conventional Delphi method with fuzzy set theory, allowing linguistic judgments and uncertainty in expert evaluations to be represented quantitatively [42].
Experts evaluated the relevance of each candidate indicator using a predefined linguistic scale. Their linguistic assessments were converted into triangular fuzzy numbers and subsequently aggregated. Consensus among experts was then assessed using the selected FDM procedure, after which the fuzzy evaluations were defuzzified to obtain crisp relevance scores.
Indicators satisfying the predetermined consensus and acceptance conditions were retained, whereas indicators failing to meet these requirements were excluded from further analysis. The indicators retained through the FDM stage constituted the final set used in the FBWM weighting process.
The Delphi methodology is an established prediction approach that does not need massive samples. It is often used to come up with knowledgeable agreement for complicated topics [43]. The Delphi methodology can be used for low-convergence professional opinions and has a lot of execution value. Murray et al. [44] integrate the Delphi methodology and fuzzy theory. Membership degree is applied to determine the membership of every participant. Ishikawa et al. introduced fuzzy theory into the Delphi methodology [45]. Max-min and a fuzzy integration rule were developed. Hsu and Yang applied a triangular fuzzy variety to include professional opinions and establish a Fuzzy Delphi Methodology [46]. There are two key points in FDM, which are the triangular fuzzy number and the fuzzy decomposition process. A triangular fuzzy number consists of three values, m1 (smallest value), m2 (most reasonable) and m3 (largest value). A triangular fuzzy number is used to generate a linguistic scale (the same as the Likert scale) in which the linguistic scale is used to translate linguistic variables into fuzzy numbers. The number of language agreement levels of the scale should be an odd number (1, 3, 5, 7, 9) for more accurate data. In this study, we use five-point language scales, as shown in Table 3.
Table 3.
The 5-point linguistic scale.
When using the FDM in a study, there is a sequence of steps that must be followed:
Step 1: Share the questionnaire with experts to determine the importance of evaluation criteria for variables that are measured using language variables.
Step 2: Convert all language variables (triangular fuzzy numbers).
Step 3: Use the vertex method to calculate the mean.
Step 4: Defuzzify the weights.
Step 5: Retain indicators if their defuzzified scores are at least 0.70 and expert consensus exceeds 70%. The defuzzified score serves as the primary screening criterion, while expert consensus provides an additional validation condition [47].
3.5. Fuzzy Best–Worst Method
Following FDM screening, the Fuzzy Best–Worst Method was applied to determine the relative importance of the validated sustainability and agility dimensions and indicators. FBWM extends the conventional Best–Worst Method by incorporating fuzzy numbers into pairwise preference comparisons, thereby allowing uncertainty in expert judgments to be represented more appropriately [48].
For each decision set, experts first identified the most important criterion, referred to as the best criterion, and the least important criterion, referred to as the worst criterion. The best criterion was then compared with the remaining criteria to construct the fuzzy Best-to-Others vector, while all criteria were compared with the worst criterion to construct the fuzzy Others-to-Worst vector.
The resulting fuzzy comparisons were used to determine the optimal fuzzy weights. These fuzzy weights were subsequently transformed into crisp and normalized values to establish the relative priorities of the evaluated dimensions and indicators.
The FBWM pairwise comparisons were conducted using five linguistic preference levels: equally important (EI), weakly important (WI), fairly important (FI), very important (VI), and absolutely important (AI). Each linguistic assessment was represented by a triangular fuzzy number (TFN), as presented in Table 4. This approach allows uncertainty in expert preferences to be incorporated into the weighting process [49].
where represents the relative fuzzy preference of standard i for model j, which is a triangular fuzzy number; = (1, 1, 1). When i = j, from the basic standard of the BWM, we can discover that it is anything but essential to execute n fuzzy pairwise examinations to acquire a finished matrix .
Table 4.
Triangular fuzzy number (TFN).
A pairwise comparison is characterized as a fuzzy reference examination if i is the best component and j is the worst component. For , there are 2n−3 n −2 Best-to-Others fuzzy comparisons, +n − 2 Others-to-Worst fuzzy comparisons, and +1 Best to Worst fuzzy reference examinations, which should be executed for the fuzzy BWM.
Stage 1: Construct the choice measures framework. The choice standards framework comprises many choice measures, which are vital for sensibly playing out the assessment of other options. The upsides of choice standards can mirror the results of various other options. Assume there are n choice standards (c1, c2, …, cn).
Stage 2: Decide the best (generally significant) measure and the worst (least significant) rule.
Considering the constructed choice model framework, the best measure and the most noticeably terrible rule should be recognized as leaders in this progression. The best model is addressed as CB, and the worst measure is named CW.
Stage 3: Execute the fuzzy reference correlations for the best measure.
The fuzzy reference correlation is vital for the fuzzy BWM. The fluffy reference correlation incorporates two sections: one section is the insightful pair examination in the case that i is the best component, and here ci is the best measure CB; the other one is the shrewd pair examination for the situation that j is the most noticeably worst component, and here cj is the worst criterion CW. The fuzzy inclinations of the best rule over every other rule can be resolved. In this progression, the initial segment is performed by utilizing the phonetic terms of experts recorded in Table 4. Then, at that point, the obtained fuzzy inclinations are changed to TFNs as indicated by the change rules. The obtained fuzzy Best-to-Others vector is
where addresses the fuzzy Best-to-Others vector; addresses the fuzzy inclination of the best measure CB overrule j, with j = 1, 2, …, n. It very well may be realized that = (1, 1, 1).
Stage 4: Execute the fuzzy reference examinations for the most noticeably worst criterion.
In this stage, each criterion is compared with the worst criterion using the linguistic preference scale presented in Table 4. The experts’ linguistic judgments are converted into triangular fuzzy numbers (TFNs) to construct the fuzzy Others-to-Worst (OW) vector, representing the preference for each criterion over the worst criterion. The vector is expressed as follows:
where represents the triangular fuzzy preference for criterion (j) over the worst criterion (W), (n) denotes the total number of criteria, and (T) indicates the transpose of the vector.
Stage 5: Determine the optimal fuzzy weights
The optimal fuzzy weight for each criterion is the one where, for each fuzzy pair / and /, we should have / and /. To satisfy these conditions for all j, a solution should be determined where the maximum absolute gaps of for all j are minimized. It should be noted that , and in the fuzzy BWM are triangular fuzzy numbers, which are very different from those in the BWM. In some cases, we prefer to use = , for optimal alternative selection. However, in some cases, we need a crisp value after obtaining the fuzzy weight of a criterion based on the linguistic variables of decision-makers. That is to say, the fuzzy weight of the criterion represented by the TFN = needs to be transformed to a crisp value. In this study, we also need the transformed crisp value of the fuzzy weight of the criterion because we need to build the constraint conditions for solving. Therefore, we can obtain the constrained optimization problem for determining the optimal fuzzy weights as follows.
By solving Equation, the optimal fuzzy weights can be obtained.
Consistency Ratio for Fuzzy BWM
The consistency of the Fuzzy Best–Worst Method (FBWM) pairwise comparisons was evaluated using the Consistency Ratio (CR), which measures the coherence of expert judgments. The CR was calculated using Equation (5):
where ξ* represents the optimal deviation obtained from the FBWM optimization model, and (CI) denotes the corresponding consistency index. The consistency index was determined according to the maximum preference intensity between the best and worst criteria, using the fuzzy linguistic comparison scale presented in Table 4. Lower CR values indicate greater consistency, with values approaching zero representing more coherent expert judgments. The consistency assessment was conducted for the seven main dimensions and the indicators within each dimension to evaluate the reliability of the resulting weights.
3.6. Hierarchical Weighting and Final Ranking
Because the proposed framework has a hierarchical structure, weighting was conducted at both the dimension and indicator levels. The relative weights of the principal dimensions were first determined, followed by the local weights of the retained indicators within their respective dimensions.
The global importance of each indicator was subsequently determined by combining its local weight with the weight of its parent dimension. These global weights provided a common basis for comparing indicators across the entire framework.
The final indicators were ranked in descending order according to their global weights. Indicators with higher global weights were interpreted as having greater strategic importance for strengthening sustainable and agile supply chain management in the Baltic dairy industry.
4. Results
4.1. Fuzzy Delphi Results
The Fuzzy Delphi Method (FDM) was applied first to validate the 39 sustainability and agility indicators identified from the literature. Fifteen experts evaluated each indicator using the five-point linguistic scale described in the methodology. The linguistic judgments were transformed into triangular fuzzy numbers (TFNs), aggregated across the expert panel, and defuzzified to obtain a single relevance score for each indicator. For the screening stage, an indicator was retained when its defuzzified score was at least 0.70 and expert consensus exceeded 70%, based on evaluations of “Important” or “Very Important”.
Of the 39 candidate indicators, 35 satisfied both acceptance conditions and were retained for the FBWM stage, whereas 4 indicators were excluded. The complete FDM results are reported in Table 5. The table presents the aggregated TFN, defuzzified score, expert-consensus percentage, and final screening decision for every candidate indicator.
Table 5.
Complete FDM screening results.
The screening stage removed the indicators that did not satisfy the predetermined relevance and consensus requirements. Specifically, these were ECO2 (return on investment; score = 0.683, consensus = 73.3%), ECO6 (local sourcing; score = 0.617, consensus = 46.7%), SOC4 (community engagement; score = 0.600, consensus = 40.0%), and SOC5 (stakeholder inclusion; score = 0.683, consensus = 73.3%). Their exclusion reduced the indicator set before the weighting stage and ensured that FBWM was applied only to indicators supported by the expert panel.
The strongest FDM evaluations were concentrated around indicators related to resource efficiency, product quality, transparency and traceability, disruption response, adaptability, real-time information exchange, and supplier collaboration. These findings indicate that the expert panel viewed operational efficiency, visibility, resilience, and coordination as central elements of a sustainable–agile dairy supply chain.
4.2. Best and Worst Reference Indicators for FBWM
Following the FDM screening process, the 35 retained indicators were evaluated using the FBWM. The best and worst criteria were identified based on their FDM relevance scores. Subsequently, the 15 experts provided separate linguistic pairwise comparisons for the Best-to-Others (BO) and Others-to-Worst (OW) vectors using the five-point fuzzy linguistic scale presented in Table 6. These judgments were converted into triangular fuzzy numbers and used to calculate the fuzzy weights of the seven dimensions and their respective indicators. The resulting weights were defuzzified and normalized to determine the final priorities.
Table 6.
Best and worst FBWM reference indicators derived after FDM screening.
4.3. Dimension-Level Fuzzy BWM Results
The seven main dimensions were also compared at the higher hierarchical level using the FBWM. The fuzzy dimension weights were defuzzified and normalized to establish the relative contribution of each dimension to the overall sustainable–agile supply chain framework. The resulting weights are presented in Table 7.
Table 7.
Fuzzy weights and ranking of the seven main dimensions.
Figure 2 illustrates the relative weights of the seven main dimensions, highlighting the joint leading position of responsiveness and speed and information and visibility, as well as the relatively small differences among the dimension weights.
Figure 2.
Dimension-level weights.
As presented in Table 7, responsiveness and speed and information and visibility share the highest defuzzified weight (0.148) and are therefore jointly ranked first. These are followed by collaboration and customer orientation (0.146), flexibility and adaptability (0.144), and environmental sustainability (0.143). Economic sustainability (0.136) and social sustainability (0.135) received slightly lower weights. However, the relatively narrow range of dimension weights (0.135–0.148) indicates that all seven dimensions have broadly comparable levels of importance. These small differences should be interpreted cautiously, as they do not necessarily represent substantial differences in strategic priority. The findings suggest that sustainability and agility capabilities are closely interconnected and should be considered complementary components of sustainable and agile dairy supply chain management.
4.4. Indicator-Level Fuzzy BWM Results
The FBWM was next applied separately within each of the seven dimensions. The fuzzy local weights were defuzzified and normalized within their respective groups. Because indicators rejected during the FDM stage were not included in this step, the local weights reported below refer only to the validated indicator set. Table 8 presents the fuzzy local weights, crisp local weights, and within-dimension ranks.
Table 8.
Fuzzy local weights and within-dimension ranking of retained indicators.
Within environmental, resource efficiency (ENV6) obtained the highest local weight (0.151), whereas renewable energy use (ENV5) received the lowest local weight (0.122). The result indicates a clear internal priority structure within this dimension while preserving the conceptual separation between the seven FBWM comparison groups.
Within economic, product quality (ECO4) obtained the highest local weight (0.260), whereas risk reduction (ECO5) received the lowest local weight (0.244). The result indicates a clear internal priority structure within this dimension while preserving the conceptual separation between the seven FBWM comparison groups.
Within social, transparency and traceability (SOC3) obtained the highest local weight (0.261), whereas employee training and development (SOC6) received the lowest local weight (0.236). The result indicates a clear internal priority structure within this dimension while preserving the conceptual separation between the seven FBWM comparison groups.
Within responsiveness and speed, supply disruption response (RS2) obtained the highest local weight (0.205), whereas lead-time reduction (RS4) received the lowest local weight (0.194). The result indicates a clear internal priority structure within this dimension while preserving the conceptual separation between the seven FBWM comparison groups.
Within flexibility & adaptability, supply chain adaptability (FA5) obtained the highest local weight (0.207), whereas product-mix flexibility (FA2) received the lowest local weight (0.192). The result indicates a clear internal priority structure within this dimension while preserving the conceptual separation between the seven FBWM comparison groups.
Within information and visibility, real-time information sharing (IV1) obtained the highest local weight (0.208), whereas information accessibility (IV3) received the lowest local weight (0.191). The result indicates a clear internal priority structure within this dimension while preserving the conceptual separation between the seven FBWM comparison groups.
Within collaboration & customer orientation, supplier collaboration (CC1) obtained the highest local weight (0.204), whereas customer sensitivity (CC3) received the lowest local weight (0.193). The result indicates a clear internal priority structure within this dimension while preserving the conceptual separation between the seven FBWM comparison groups.
4.5. Global Weights and Overall Priority Ranking
To compare indicators across dimensions, the normalized local weight of each retained indicator was multiplied by the weight of its parent dimension. The resulting global weights provide a common scale for ranking the validated sustainability and agility indicators across the complete framework. Table 9 presents the final global ranking.
Table 9.
Final global weights and overall ranking of retained indicators.
The global results show that the highest priorities are concentrated in information visibility, responsiveness, adaptability, and collaboration. Product quality (ECO4) ranks first with a global weight of 0.0353, followed by transparency and traceability (SOC3; 0.0352). The remaining leading indicators reinforce the importance of rapid information exchange, disruption management, market responsiveness, supply chain visibility, adaptability, and inter-organizational coordination in the Baltic dairy context.
4.6. Synthesis of the Integrated FDM–FBWM Results
The integrated analysis provides a sequential and internally consistent prioritization process. The FDM first screened the literature-derived indicators according to expert relevance and consensus. The FBWM then compared the validated indicators only within their corresponding dimensions, while a separate higher-level FBWM comparison established the weights of the seven dimensions. Finally, the dimension and local indicator weights were combined to produce global priorities. This structure ensures that the final ranking reflects both the relative importance of each dimension and the relative importance of each indicator within that dimension.
The results collectively indicate that sustainable–agile performance in the Baltic dairy industry depends on the interaction between sustainability practices and agility capabilities rather than on either perspective in isolation. Resource efficiency, product quality, transparency and traceability, disruption response, supply chain adaptability, real-time information sharing, and supplier collaboration emerge as particularly important local priorities. At the global level, information and responsiveness indicators occupy several of the leading positions, highlighting the strategic importance of visibility, rapid decision-making, and adaptive coordination in dairy supply chains.
5. Discussion
The integrated FDM–FBWM findings indicate that sustainability and agility should not be treated as independent supply chain objectives in the Baltic dairy industry. Instead, the results reveal a mutually reinforcing structure in which environmental, economic, and social sustainability priorities coexist with responsiveness, flexibility, information visibility, and collaboration capabilities. The predominance of agility-related dimensions in the higher-level weighting does not diminish the importance of sustainability; rather, it suggests that the capacity to sense changes, exchange information, respond to disruptions, and adapt supply chain configurations provides an enabling foundation for maintaining sustainable performance under volatile operating conditions. This interpretation is consistent with the sustainable–agile supply chain literature, which increasingly emphasizes the need to integrate sustainability objectives with operational responsiveness and adaptive capacity.
5.1. Interpretation of the FDM Findings
The FDM stage confirmed that the proposed framework is broadly relevant to the Baltic dairy context. Of the 39 indicators initially identified from previous studies, 35 satisfied the combined fuzzy relevance and expert-consensus requirements and were retained for the subsequent FBWM analysis. This high retention rate demonstrates the multidimensional nature of sustainable and agile supply chain management in dairy processing. Environmental performance, economic outcomes, social responsibility, responsiveness, flexibility, information capability, and collaboration were all represented in the validated framework, indicating that no single performance perspective is sufficient to characterize sustainable–agile supply chain capability.
Four indicators, return on investment (ECO2), local sourcing (ECO6), community engagement (SOC4), and stakeholder inclusion (SOC5), did not satisfy the established FDM screening conditions. Their exclusion should not be interpreted as evidence that these practices are unimportant in general. Rather, the expert panel assigned them comparatively lower relevance in the specific decision context examined in this study. Dairy supply chains are characterized by perishability, strict quality and food-safety requirements, continuous material flows, refrigeration dependence, and time-sensitive logistics. Consequently, experts appear to have prioritized indicators with more immediate implications for operational continuity, product integrity, resource utilization, traceability, and disruption management.
Methodologically, this screening stage strengthens the contextual validity of the final framework. Instead of transferring a literature-derived indicator set directly into the weighting procedure, the FDM allows the indicator system to be refined through expert knowledge before prioritization. The resulting FBWM analysis therefore reflects indicators that are both theoretically grounded and considered sufficiently relevant by practitioners and specialists familiar with the Baltic dairy environment.
5.2. Sustainability Priorities in Baltic Dairy Supply Chains
Within environmental sustainability, resource efficiency (ENV6) emerged as the leading local priority. This result is particularly relevant to dairy processing because production requires substantial quantities of energy, water, refrigeration, packaging materials, and other operational resources. Resource efficiency therefore has the potential to generate simultaneous environmental and economic benefits by reducing resource intensity, production losses, and operating costs. The result also suggests that environmental sustainability in dairy supply chains is perceived less as an isolated compliance issue and more as an operational capability embedded in production and supply chain processes.
Product quality (ECO4) received the highest local weight within the economic dimension. This finding reflects the distinctive characteristics of dairy products, including short shelf life, temperature sensitivity, food-safety risks, and strict quality requirements. Quality failures can create direct financial losses through spoilage, rejected batches, recalls, waste, and reputational damage. Product quality consequently represents both an economic outcome and a mechanism through which other sustainability objectives can be protected. Maintaining consistent quality reduces avoidable losses and supports customer confidence, market access, and supply chain continuity.
Within social sustainability, transparency and traceability (SOC3) emerged as the strongest indicator. This result extends the interpretation of social sustainability beyond conventional labor-related considerations. In food supply chains, transparency and traceability support accountability, consumer confidence, food safety, ethical sourcing, and the ability to identify the origin and movement of products. For dairy processors, traceability is particularly important because product-quality or safety problems must be identified rapidly and isolated before they propagate through the distribution network. The high priority assigned to this indicator therefore reflects both stakeholder expectations and the operational realities of managing perishable food products.
5.3. Agility Priorities in Baltic Dairy Supply Chains
The agility-related results represent one of the most important findings of the study. Responsiveness and speed and information and visibility received the largest weights at the dimension level. This indicates that experts view the ability to recognize changes and respond rapidly as fundamental to sustainable–agile dairy supply chain management. The finding is particularly relevant in an environment characterized by fluctuating demand, input uncertainty, transportation disruptions, regulatory change, and the operational constraints associated with perishable products.
Supply disruption response (RS2) was the highest-priority indicator within responsiveness and speed. This result is consistent with the time-sensitive nature of dairy supply chains. Interruptions in milk collection, processing, cold-chain operations, transportation, or distribution may rapidly generate product deterioration and economic loss. The ability to respond to disruptions is therefore not simply a resilience characteristic; it also contributes to sustainability by limiting waste, protecting resource utilization, and reducing the wider economic and social consequences of supply interruptions.
Within flexibility and adaptability, supply chain adaptability (FA5) obtained the highest local priority. Adaptability represents a broader capability than short-term responsiveness because it concerns the ability to modify supply chain configurations, sourcing arrangements, operating practices, technologies, and relationships as conditions evolve. The result suggests that Baltic dairy supply chains require not only rapid reactions to individual disturbances but also the capacity to reconfigure their structures when facing persistent market, technological, environmental, or regulatory changes.
5.4. Information Visibility and Collaboration as Enabling Capabilities
Real-time information sharing (IV1) emerged as the leading indicator within information and visibility and achieved the highest position in the global ranking. This is a particularly important finding because information availability influences several other dimensions simultaneously. Timely information supports demand forecasting, inventory management, quality control, transportation planning, traceability, disruption detection, and coordination with suppliers and customers. It can therefore strengthen both agility and sustainability rather than contributing to only one performance objective.
The prominence of real-time information sharing also highlights the importance of digitalization. Technologies such as Internet of Things sensors, integrated enterprise systems, artificial intelligence, RFID, cloud platforms, and digital traceability systems can improve the speed and quality of information flows across dairy supply chains. However, the results suggest that technology should be interpreted as an enabling infrastructure rather than an objective in itself. The managerial value of digital technologies depends on whether the information they generate is timely, reliable, accessible, and integrated into operational decision-making.
Supplier collaboration (CC1) was the leading indicator within collaboration and customer orientation. This finding reinforces the network character of supply chain agility. A dairy processor may possess advanced internal systems, but its ability to respond remains constrained when farms, logistics providers, packaging suppliers, distributors, or retailers cannot exchange information or coordinate decisions effectively. Supplier collaboration can improve early problem identification, production planning, quality assurance, sourcing flexibility, and joint responses to disruptions. Consequently, collaboration complements information visibility by transforming shared information into coordinated action.
5.5. Integration of Sustainability and Agility
A central contribution of the study is the demonstration that sustainability and agility are complementary rather than competing supply chain priorities. The final ranking shows that several agility-related indicators occupy leading global positions, while sustainability-related indicators remain essential within their respective dimensions. This pattern suggests that agility can operate as an enabling mechanism through which sustainable performance is protected under changing conditions.
For example, real-time information sharing can improve responsiveness while simultaneously reducing waste through better forecasting and inventory control. Traceability strengthens transparency but also enables faster identification of quality and safety problems. Resource efficiency reduces environmental burdens while improving cost performance. Supplier collaboration can facilitate rapid disruption responses while supporting coordinated environmental and social initiatives. These interactions demonstrate that sustainable agility should not be understood as the simple addition of sustainability criteria to an agility framework. Rather, it represents the capability to respond and adapt while maintaining environmental, economic, and social performance.
This integrated interpretation is especially relevant to the dairy sector because sustainability failures and agility failures can reinforce one another. Transportation disruption may cause spoilage and waste; poor information visibility may increase inventories and energy consumption; inadequate traceability may delay corrective action; and weak supplier coordination may reduce the ability to respond to raw-material shortages. Strengthening agility capabilities can therefore contribute indirectly to sustainability outcomes by reducing the consequences of uncertainty and operational disruption.
The importance assigned to responsiveness, information visibility, and adaptability also has implications for supply chain resilience, as these capabilities can enhance the ability of dairy supply chains to anticipate, respond to, and recover from operational disruptions. In the Baltic countries, integrating these capabilities with sustainability considerations may strengthen supply chain resilience while supporting more adaptive and sustainable supply chain management.
5.6. Theoretical Implications
The study provides several theoretical implications. First, it contributes to the integration of sustainable supply chain management and supply chain agility by operationalizing both perspectives within a single hierarchical framework. Rather than examining environmental, economic, and social sustainability separately from responsiveness, flexibility, visibility, and collaboration, the framework demonstrates how these dimensions can be jointly evaluated and prioritized.
Second, the findings support a capability-based interpretation of sustainable–agile supply chain management. Information sharing, responsiveness, adaptability, and collaboration are not merely performance indicators; they can be interpreted as organizational and inter-organizational capabilities that enable firms to maintain desired sustainability outcomes under changing conditions. The results therefore provide a basis for linking sustainable supply chain management with dynamic-capability and information-processing perspectives.
Third, the study contributes sector-specific evidence from the Baltic dairy industry. Much of the sustainable and agile supply chain literature has been developed in broader manufacturing or large-economy contexts. By focusing on Lithuania, Latvia, and Estonia, the study demonstrates the applicability of an integrated sustainability–agility framework in smaller, interconnected European economies and within a food-processing sector characterized by perishability and strong upstream agricultural dependence.
Finally, the integrated FDM–FBWM design provides a methodological contribution. The FDM first validates and screens literature-derived indicators using expert consensus, while the FBWM subsequently establishes their relative importance through fuzzy reference comparisons. The hierarchical weighting structure also distinguishes between dimension-level priorities and local indicator priorities, allowing the calculation of global weights without requiring all indicators to be compared directly in one large decision matrix.
5.7. Managerial Implications
The findings provide a practical prioritization framework for dairy supply chain managers. Rather than attempting to improve all sustainability and agility practices simultaneously, managers can direct resources toward the capabilities with the greatest strategic importance. The results particularly support investments in real-time information integration, disruption monitoring, traceability, adaptive planning, resource efficiency, and supplier coordination.
Managers should also avoid interpreting agility solely as speed. The importance of disruption response, adaptability, information sharing, and supplier collaboration indicates that effective agility depends on the combined ability to sense, coordinate, decide, and reconfigure. Reducing lead times may be valuable, but it is insufficient when firms lack visibility or cannot coordinate with supply chain partners during disruptions.
From a sustainability perspective, managers should prioritize initiatives capable of producing multiple benefits. Resource-efficiency programs can simultaneously reduce environmental impacts and operating costs. Traceability systems can strengthen transparency, food safety, quality management, and responsiveness. Improved information sharing can support forecasting while reducing excess inventory and product losses. Such multi-benefit initiatives are particularly attractive for dairy processors operating under financial and resource constraints.
5.8. Policy Implications
The results also provide implications for policymakers in Lithuania, Latvia, and Estonia. Policies designed to improve food-sector sustainability should recognize the close relationship between environmental performance, digitalization, and supply chain resilience. Support programs for dairy processors, particularly small and medium-sized firms, could encourage investment in interoperable traceability systems, real-time monitoring technologies, resource-efficiency solutions, digital information-sharing platforms, and the workforce capabilities required to use these technologies effectively.
Regional cooperation is also relevant because many of the highest-priority capabilities extend beyond individual firms. Common data standards, digital infrastructure, collaborative innovation programs, and mechanisms that improve coordination among farms, processors, logistics providers, and retailers can strengthen supply chain visibility and responsiveness across the Baltic dairy ecosystem. Accordingly, green-transition policies and supply chain digitalization initiatives should be designed as complementary rather than separate policy agendas.
6. Conclusions
6.1. Main Conclusions
This study developed and applied an integrated Fuzzy Delphi–Fuzzy Best–Worst Method framework to prioritize sustainability and agility indicators for supply chain management in the Baltic dairy industry. The analysis began with 39 indicators derived from the previous literature and organized into seven dimensions: environmental sustainability, economic sustainability, social sustainability, responsiveness and speed, flexibility and adaptability, information and visibility, and collaboration and customer orientation. FDM was used to validate the indicator set, after which FBWM was applied hierarchically to determine dimension-level and indicator-level priorities.
The findings demonstrate that sustainable–agile supply chain performance is multidimensional and depends on the interaction between sustainability objectives and agility capabilities. At the dimension level, responsiveness and speed and information and visibility received the greatest relative importance. Within the individual dimensions, the principal priorities were resource efficiency, product quality, transparency and traceability, supply disruption response, supply chain adaptability, real-time information sharing, and supplier collaboration. The global ranking further emphasized the importance of information visibility and disruption-response capabilities.
Overall, the results indicate that the ability to exchange information rapidly, respond to disruptions, adapt supply chain configurations, and coordinate with partners is fundamental to maintaining sustainable performance in dairy supply chains. Sustainability and agility should therefore be managed as complementary components of a unified supply chain strategy rather than as independent managerial objectives.
6.2. Theoretical and Methodological Contributions
The study contributes theoretically by integrating sustainable supply chain management and supply chain agility within a single assessment framework. It demonstrates that agility-related capabilities can function as enabling mechanisms for environmental, economic, and social sustainability. The framework also extends sustainable–agile supply chain research to the Baltic dairy sector, providing evidence from a geographically and sectorally specific context that remains comparatively underrepresented in the literature.
Methodologically, the sequential FDM–FBWM approach provides a structured mechanism for moving from literature-based indicator identification to expert validation and final prioritization. FDM reduces the risk of retaining contextually weak indicators, while FBWM provides fuzzy local and global priorities with substantially fewer comparisons than conventional full pairwise-comparison approaches. The hierarchical comparison of indicators within their respective dimensions further preserves conceptual coherence and enables a transparent final ranking.
6.3. Practical Contribution
For practitioners, the final framework provides a decision-support structure for allocating managerial attention and investment. Dairy processors can use the priorities to identify areas where improvements are likely to have broad supply chain effects. Strengthening real-time information sharing, disruption-response mechanisms, supply chain adaptability, supplier collaboration, traceability, product quality, and resource efficiency can support both sustainability and agility objectives. The framework can also be used as a benchmarking instrument for evaluating current supply chain capabilities and identifying improvement priorities.
6.4. Limitations and Future Research
Several limitations should be acknowledged. First, the study relies on expert judgments, and the resulting priorities therefore reflect the knowledge and perceptions of the selected panel. Although fuzzy methods reduce the influence of linguistic ambiguity, expert-based evaluations remain inherently subjective. Future studies could enlarge the expert panel and compare judgments across stakeholder groups, including dairy farmers, processors, logistics providers, retailers, policymakers, and technology specialists.
Second, the empirical context is limited to the Baltic dairy industry. The importance of sustainability and agility indicators may differ across countries, food industries, or supply chain structures. Future research could replicate the framework in other agricultural and food-processing sectors and compare results across regions.
Third, the present framework provides relative priorities rather than direct causal relationships among the indicators. Future research could combine the identified indicators with methods such as DEMATEL, structural equation modeling, system dynamics, or network-based MCDM approaches to examine interdependencies and causal mechanisms. Longitudinal studies could also assess whether the importance of individual indicators changes following major disruptions, technological investments, or regulatory developments.
Finally, future studies could integrate objective operational data with expert-based MCDM results. Indicators such as energy consumption, water intensity, lead time, product loss, forecast accuracy, traceability coverage, and disruption-recovery time could be measured quantitatively and combined with fuzzy expert assessments. Such an extension would strengthen the empirical validation of the framework and facilitate its use as a practical performance-management system for sustainable and agile dairy supply chains.
Funding
This research received no external funding.
Institutional Review Board Statement
Not applicable.
Informed Consent Statement
Not applicable.
Data Availability Statement
The data supporting the findings of this study are available from the corresponding author upon reasonable request.
Conflicts of Interest
The author declares no conflicts of interest.
References
- Tao, J.; Aamir, M.; Shoaib, M.; Yasir, N.; Babar, M. Bridging the gap between supply chain risk and organizational performance conditioning to demand uncertainty. Sustainability 2025, 17, 2462. [Google Scholar] [CrossRef] [Scilit]
- Tamasiga, P.; Onyeaka, H. Global Food Value Chains Demand and Supply Dynamics and Policy Implications, in Global Food Value Chains: An In-Depth Exploration of International Trade Dynamics; Springer: Berlin/Heidelberg, Germany, 2026; pp. 63–128. [Google Scholar]
- Shamsuddoha, M.; Nasir, T.; Hossain, N.U.I. A sustainable supply chain framework for dairy farming operations: A system dynamics approach. Sustainability 2023, 15, 8417. [Google Scholar] [CrossRef] [Scilit]
- Siems, E.; Seuring, S.; Schilling, L. Stakeholder roles in sustainable supply chain management: A literature review. J. Bus. Econ. 2023, 93, 747–775. [Google Scholar] [CrossRef] [Scilit]
- Sirisomboonsuk, P.; Burns, J. Sustainability in supply chains through rapid capacity increases and minimized disruptions. Sustainability 2023, 15, 5629. [Google Scholar] [CrossRef] [Scilit]
- Štreimikienė, D.; Bathaei, A.; Streimikis, J. MCDM approaches for supplier selection in sustainable supply chain management. Sustainability 2024, 16, 10446. [Google Scholar] [CrossRef] [Scilit]
- Kareem, S.; Fehrer, J.A.; Shalpegin, T.; Stringer, C. Navigating tensions of sustainable supply chains in times of multiple crises: A systematic literature review. Bus. Strategy Environ. 2025, 34, 316–337. [Google Scholar] [CrossRef] [Scilit]
- Alzate Rendón, I.C.; Álvarez Gallo, S.M.; Boada, A. Supply chain resilience through collaborative networks and dynamic capabilities: Evidence from an agri-food productive chain in Colombia. Discov. Sustain. 2025, 6, 1312. [Google Scholar] [CrossRef] [Scilit]
- Jum’a, L.; Hazaimeh, I.; Ikram, M.; Saqib, Z.A. Integrated Industry 4.0, Circular Economy, and Low-Carbon Management Framework: Implications for Sustainability Performance in the Manufacturing Sector. Bus. Strategy Dev. 2026, 1, e70291. [Google Scholar] [CrossRef] [Scilit]
- Obayi, R.; Choudhary, S.; Nayak, R.; Ramanjaneyulu, G.V. Pragmatic Interoperability for Human–Machine Value Creation in Agri-Food Supply Chains. Inf. Syst. Front. 2025. [Google Scholar] [CrossRef] [Scilit]
- Damtew, A.W.; Goshu, Y.Y. The impacts of AWS from digital visions to action for supply chain resilience, performances, and inclusiveness. Int. J. Adv. Manuf. Technol. 2024, 130, 4821–4834. [Google Scholar] [CrossRef] [Scilit]
- Lu, W.M.; Ting, I.W.K.; Lim, K.K.; Chiang, T.S. The Role of Organizational Agility in ESG–Efficiency Relationships: Evidence from Taiwan’s Network Communication Industry. Bus. Strategy Environ. 2026, 1–18. [Google Scholar] [CrossRef] [Scilit]
- Morais, D.O.C.; Barbieri, J.C. Supply chain social sustainability: Unveiling focal firm’s archetypes under the lens of stakeholder and contingency theory. Sustainability 2022, 14, 1185. [Google Scholar] [CrossRef] [Scilit]
- Nie, Y.; Hicks, B.; Nassehi, A.; Valero, M.R. Aligning sustainable development goals and stakeholders’ needs in food supply chains: A comprehensive review and mapping. Int. J. Prod. Res. 2026, 64, 5402–5444. [Google Scholar] [CrossRef] [Scilit]
- Shamsuddoha, M.; Nasir, T. Utilizing dairy waste processing for organic agricultural production: A sustainable approach to producing organic goods. Processes 2024, 12, 2521. [Google Scholar] [CrossRef] [Scilit]
- Hajdukiewicz, A.; Pera, B. Eco-innovation in the European Union: Challenges for catching-up economies. Entrep. Bus. Econ. Rev. 2023, 11, 145–164. [Google Scholar] [CrossRef] [Scilit]
- Krisciukaitiene, I.; Bathaei, A. Developing a tailored sustainable supply chain framework for dairy SMEs in Lithuania using Best-Worst Method. Transform. Sustain. 2025, 1, 43–62. [Google Scholar] [CrossRef] [Scilit]
- Zarei-Kordshouli, F.; Paydar, M.M.; Nayeri, S. Designing a dairy supply chain network considering sustainability and resilience: A multistage decision-making framework. Clean Technol. Environ. Policy 2023, 25, 2903–2927. [Google Scholar] [CrossRef] [Scilit] [PubMed]
- Desalegn, E.G.; Guedes, M.J.C.; Gomes, J.F.D.S.; Tebeka, S.M. Disentangling organizational agility from flexibility, adaptability, and versatility: A systematic review. Future Bus. J. 2024, 10, 117. [Google Scholar] [CrossRef] [Scilit]
- Patel, B.S.; Sambasivan, M. A systematic review of the literature on supply chain agility. Manag. Res. Rev. 2022, 45, 236–260. [Google Scholar] [CrossRef] [Scilit]
- Bouguerra, A.; Hughes, M.; Rodgers, P.; Stokes, P.; Tatoglu, E. Confronting the grand challenge of environmental sustainability within supply chains: How can organizational strategic agility drive environmental innovation? J. Product. Innov. Manag. 2024, 41, 323–346. [Google Scholar] [CrossRef] [Scilit]
- Bathaei, A.; Awang, S.R.; Štreimikienė, D.; Ahmad, T. Agility sustainable supply chain in automobile industry. Technol. Econ. Dev. Econ. 2025, 31, 619–638. [Google Scholar] [CrossRef] [Scilit]
- Priyashantha, H. World dairy system sustainability: A milk quality perspective. Front. Sustain. Resour. Manag. 2025, 4, 1572962. [Google Scholar] [CrossRef] [Scilit]
- Padovano, A.; Ivanov, D. Towards resilient and viable supply chains: A multidimensional model and empirical analysis. Int. J. Prod. Res. 2025, 63, 6252–6290. [Google Scholar] [CrossRef] [Scilit]
- Yip, W.S.; Zhou, H.; To, S. A critical analysis on the triple bottom line of sustainable manufacturing: Key findings and implications. Environ. Sci. Pollut. Res. 2023, 30, 41388–41404. [Google Scholar] [CrossRef] [Scilit] [PubMed]
- Dolcini, M.; Ferrè, F.; Brambilla, A.; Capolongo, S. Integrating environmental sustainability into hospitals performance management systems: A scoping review. BMC Health Serv. Res. 2025, 25, 764. [Google Scholar] [CrossRef] [Scilit] [PubMed]
- Bindeeba, D.S.; Atuhaire, S.; Bakashaba, R.; Tukamushaba, E.K. Digital business process integration and sustainability among smes: The mediating role of operational efficiency and the moderating role of credit access. J. Sustain. Bus. 2025, 10, 11. [Google Scholar]
- Navickienė, O.; Meidutė-Kavaliauskienė, I.; Činčikaitė, R.; Morkūnas, M.; Valackienė, A. The expression of the country’s modernisation in the context of economic environmental sustainability: The case of Lithuania. Sustainability 2023, 15, 10649. [Google Scholar] [CrossRef] [Scilit]
- Zhang, M.; Chen, Z. Assessing the social sustainability impact on suppliers: The role of global value chains governance strategies. Environ. Sci. Pollut. Res. 2023, 30, 83587–83599. [Google Scholar] [CrossRef] [Scilit] [PubMed]
- Hailu, A.A.; Kero, C.A.; Dagne, Z.L. The effect of strategic orientation on performance of agribusiness firms in Ethiopia: The mediating role of innovation capability. Cogent Bus. Manag. 2025, 12, 2511284, Correction in Cogent Bus. Manag. 2025, 12, 2520062. [Google Scholar] [CrossRef] [Scilit]
- Zarreh, M.; Khandan, M.; Goli, A.; Aazami, A.; Kummer, S. Integrating perishables into closed-loop supply chains: A comprehensive review. Sustainability 2024, 16, 6705. [Google Scholar] [CrossRef] [Scilit]
- Richey, R.G.; Roath, A.S.; Adams, F.G.; Wieland, A. A responsiveness view of logistics and supply chain management. J. Bus. Logist. 2022, 43, 62–91. [Google Scholar] [CrossRef] [Scilit]
- Mishra, N.K.; Sharma, P.P.; Chaudhary, S.K. Redefining agile supply chain practices in the disruptive era: A case study identifying vital dimensions and factors. J. Glob. Oper. Strateg. Sourc. 2025, 18, 64–90. [Google Scholar] [CrossRef] [Scilit]
- Roy, V.; Schoenherr, T.; Jayaram, J. Digital enabled agility: Industry 4.0 unlocking real-time information processing, traceability, and visibility to unleash the next extent of agility. Int. J. Prod. Res. 2024, 62, 5127–5148. [Google Scholar] [CrossRef] [Scilit]
- Khojasteh, Y.; Abadi, S.M.J.; Ng, C. Leveraging Digital Transformation in Supply Chains: Strategies for Agility, Performance, and Resilience, in Digital Transformation of Supply Chains: Business Objectives and Applications; Springer: Berlin/Heidelberg, Germany, 2026; pp. 3–39. [Google Scholar]
- Nikneshan, P.; Shahin, A.; Davazdahemami, H. Proposing a framework for analyzing the effect of lean and agile innovation on lean and agile supply chain. Int. J. Qual. Reliab. Manag. 2024, 41, 291–323. [Google Scholar] [CrossRef] [Scilit]
- Bathaei, A.; Štreimikienė, D. A systematic review of agricultural sustainability indicators. Agriculture 2023, 13, 241. [Google Scholar] [CrossRef] [Scilit]
- Bathaei, A.; Mardani, A.; Baležentis, T.; Awang, S.R.; Streimikiene, D.; Fei, G.C.; Zakuan, N. Application of fuzzy analytical network process (ANP) and VIKOR for the assessment of green agility critical success factors in dairy companies. Symmetry 2019, 11, 250. [Google Scholar] [CrossRef] [Scilit]
- Abadi, S.K.G.; Bathaei, A.; Awang, S.R.; Ahmad, T. Suppliers Selection in Resilient Supply Chain by Using Fuzzy DEMATEL Approach (Case Study in SAPCO Supply Chain). J. Soc. Manag. Tour. Lett. 2021, 2021, JSMTL-2107112112368. [Google Scholar]
- Streimikis, J.; Bathaei, A.; Štreimikienė, D. Sustainability assessment of the agriculture sector using best worst method: Case study of Baltic states. Sustain. Dev. 2024, 32, 5611–5626. [Google Scholar] [CrossRef] [Scilit]
- Bathaei, A.; Agnusdei, L.; Ardakani, Z.; Streimikiene, D.; Baležentis, T. Decision support for sustainable circular food supply chain in Iran: A fuzzy multi-criteria approach. Comput. Ind. Eng. 2025, 209, 111403. [Google Scholar] [CrossRef] [Scilit]
- Zhu, M.; Zhou, W.; Hu, M.; Du, J.; Yuan, T. Evaluating the renewal degree for expressway regeneration projects based on a model integrating the fuzzy Delphi method, the fuzzy AHP method, and the TOPSIS method. Sustainability 2023, 15, 3769. [Google Scholar] [CrossRef] [Scilit]
- Hartman, A. Reaching consensus using the Delphi technique. Educ. Leadersh. 1981, 38, 495–497. [Google Scholar]
- Murray, T.J.; Pipino, L.L.; van Gigch, J.P. A pilot study of fuzzy set modification of Delphi. Hum. Syst. Manag. 1985, 5, 76–80. [Google Scholar] [CrossRef] [Scilit]
- Ishikawa, A.; Amagasa, M.; Shiga, T.; Tomizawa, G.; Tatsuta, R.; Mieno, H. The max-min Delphi method and fuzzy Delphi method via fuzzy integration. Fuzzy Sets Syst. 1993, 55, 241–253. [Google Scholar] [CrossRef] [Scilit]
- Hsu, T.; Yang, T. Application of fuzzy analytic hierarchy process in the selection of advertising media. J. Manag. Syst. 2000, 7, 19–39. [Google Scholar]
- Cheng, C.-H.; Lin, Y. Evaluating the best main battle tank using fuzzy decision theory with linguistic criteria evaluation. Eur. J. Oper. Res. 2002, 142, 174–186. [Google Scholar] [CrossRef] [Scilit]
- Wan, S.-P.; Dong, J.-Y.; Chen, S.-M. A novel intuitionistic fuzzy best-worst method for group decision making with intuitionistic fuzzy preference relations. Inf. Sci. 2024, 666, 120404. [Google Scholar] [CrossRef] [Scilit]
- Mou, Q.; Xu, Z.; Liao, H. An intuitionistic fuzzy multiplicative best-worst method for multi-criteria group decision making. Inf. Sci. 2016, 374, 224–239. [Google Scholar] [CrossRef] [Scilit]
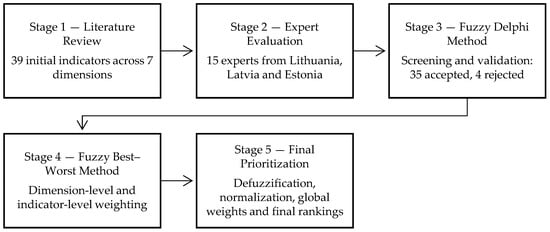
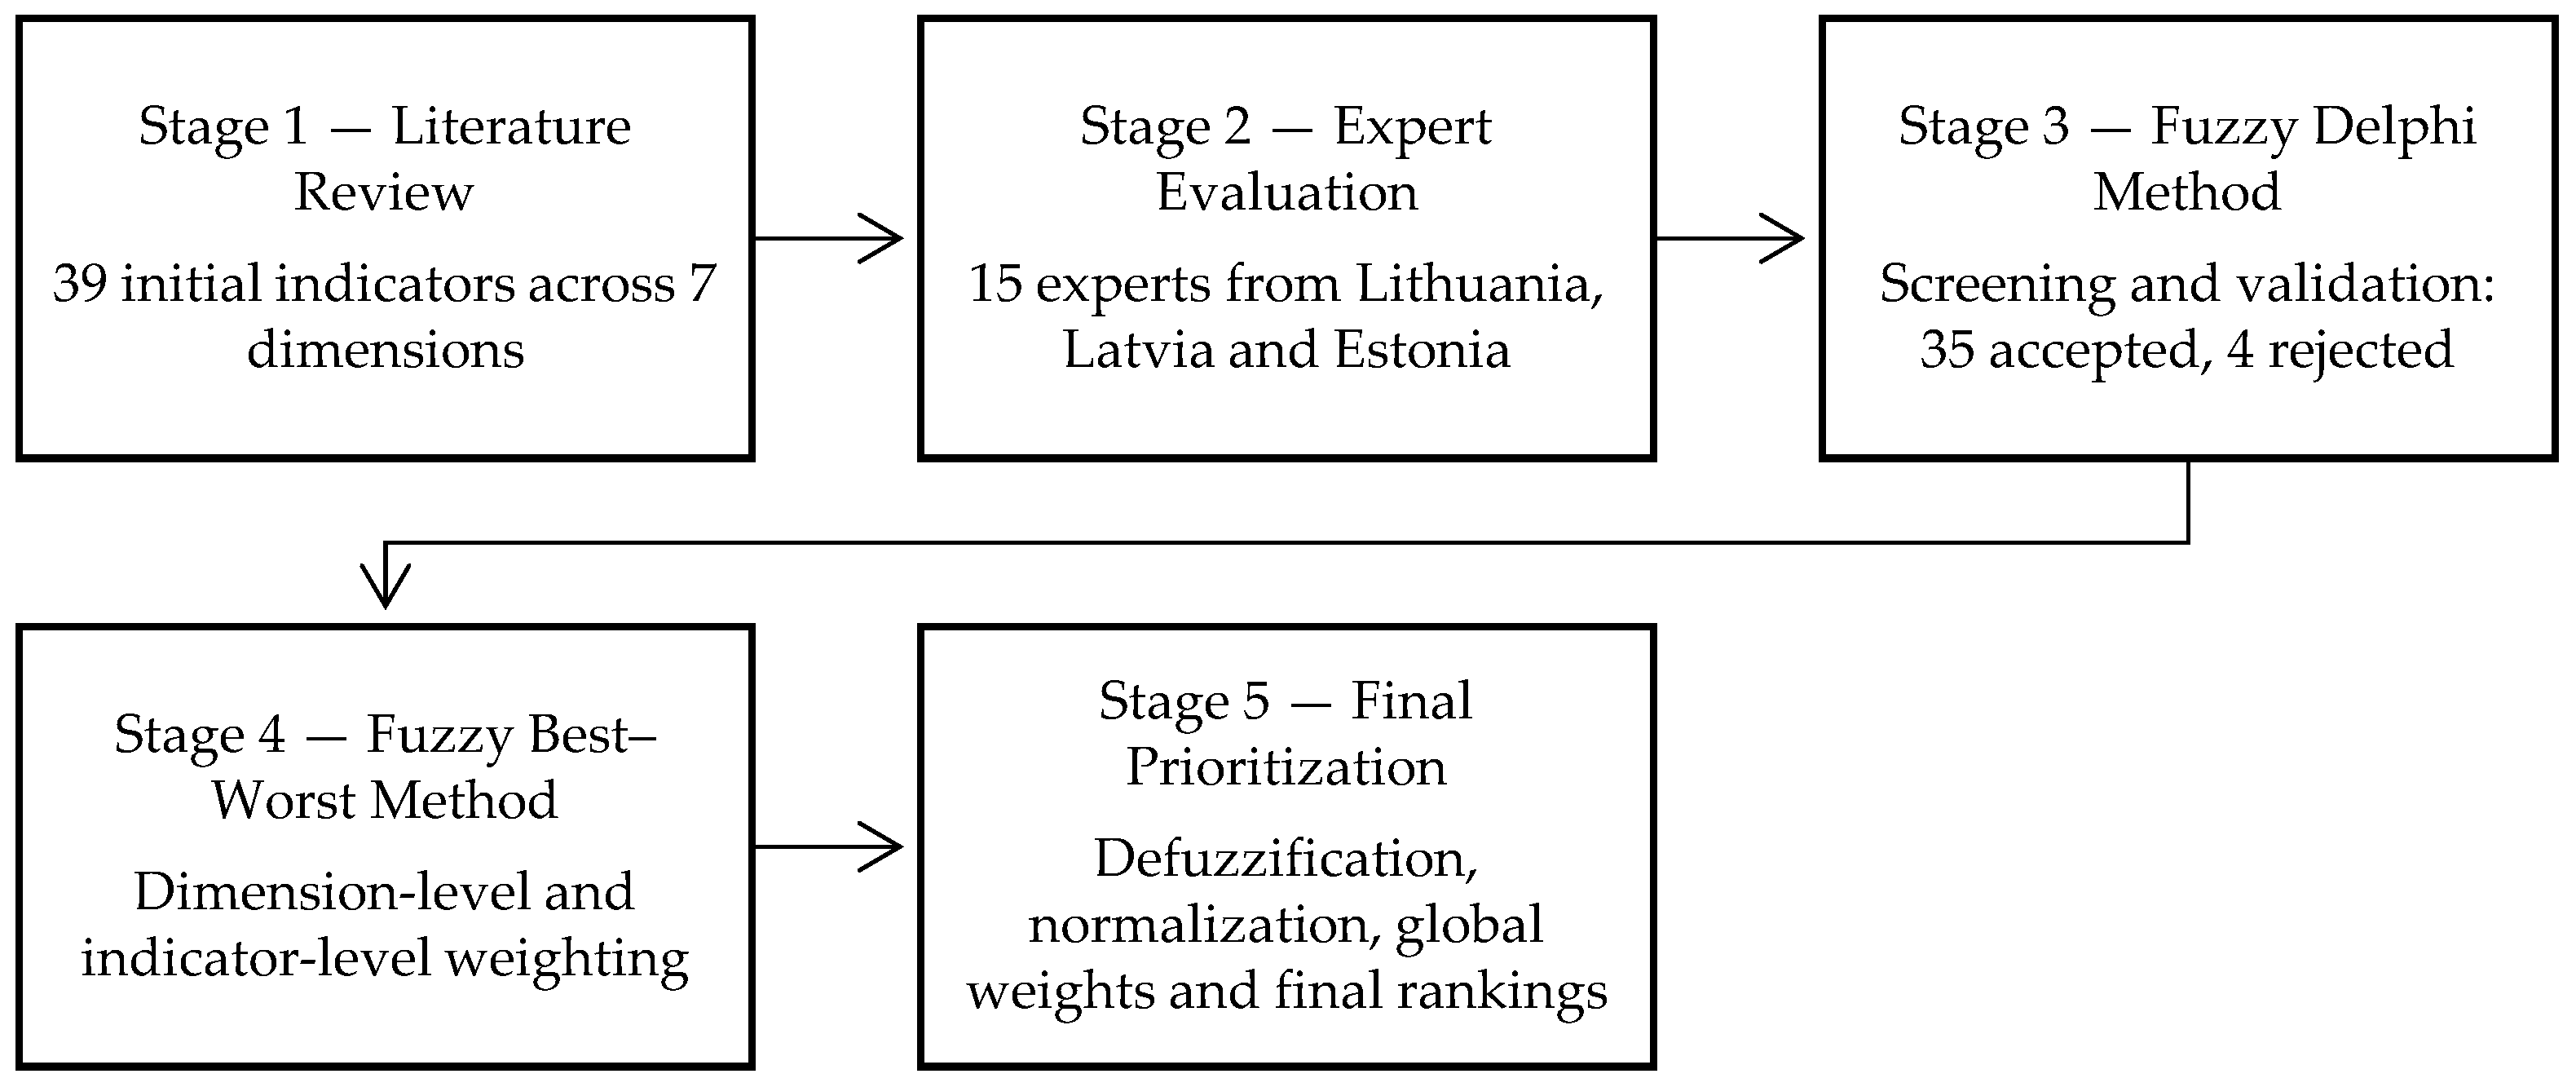
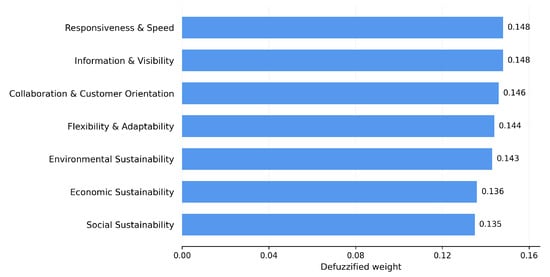
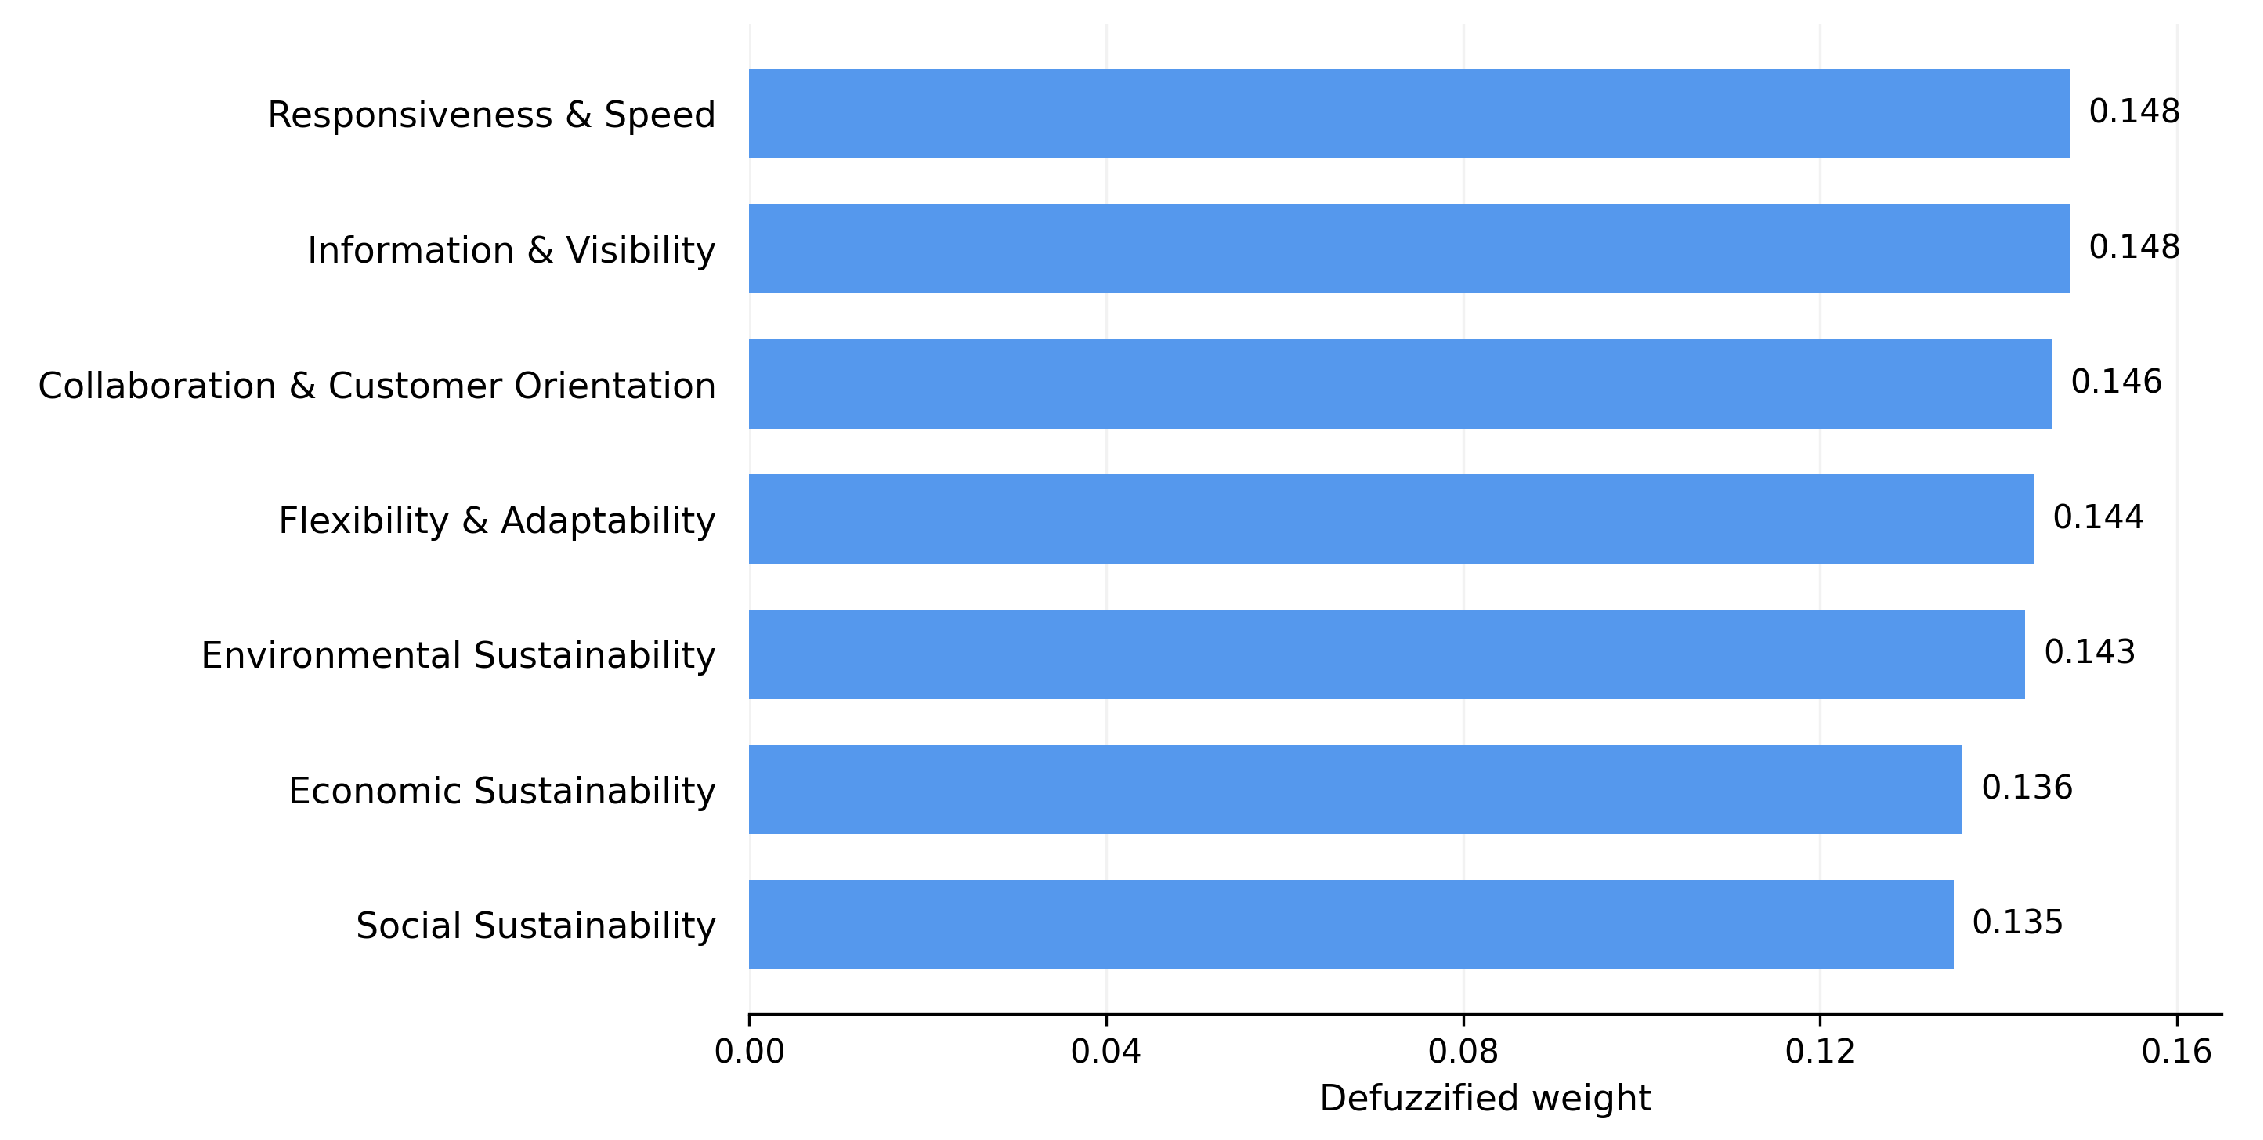

Disclaimer/Publisher’s Note: The statements, opinions and data contained in all publications are solely those of the individual author(s) and contributor(s) and not of MDPI and/or the editor(s). MDPI and/or the editor(s) disclaim responsibility for any injury to people or property resulting from any ideas, methods, instructions or products referred to in the content. |
© 2026 by the author. Licensee MDPI, Basel, Switzerland. This article is an open access article distributed under the terms and conditions of the Creative Commons Attribution (CC BY) license.