


Abstract
Automated visual inspection has become a critical component of Industry 4.0 manufacturing systems, enabling improved product quality, reduced operational costs, and increased production efficiency. In the carpet manufacturing industry, quality inspection remains particularly challenging due to the high variability of textures, colors, patterns, and defect appearances, which often limits the effectiveness of conventional inspection systems. Furthermore, the scarcity of publicly available industrial carpet defect datasets limits the realistic assessment of automated inspection methods. Existing approaches are therefore frequently evaluated on benchmark datasets that do not fully capture the variability of real manufacturing environments or rely on computationally demanding end-to-end deep learning architectures, which may reduce their suitability for practical industrial deployment. To address these challenges, this paper introduces a new industrial carpet defect dataset acquired under controlled imaging conditions and containing defect-free samples together with four representative defect categories: Backing Seam, Bad Mend, Dirty Face, and End Out. In addition, we present an engineering study that systematically evaluates a practical two-stage inspection framework combining pretrained deep feature extraction, one-class anomaly detection, and supervised defect classification for industrial carpet quality control. A distinguishing aspect of this study is the systematic evaluation of the framework on both the public MVTec AD Carpet benchmark and the newly introduced industrial dataset, enabling its performance to be assessed under both benchmark and realistic industrial conditions. The first stage performs anomaly detection using one-class learning models trained exclusively on defect-free samples, while the second stage classifies detected defects into predefined categories. To investigate the impact of visual representations on inspection performance, multiple deep feature extraction backbones, including ConvNeXt, VGG-19, and Wide ResNet-50-2, are evaluated in combination with lightweight machine learning models. Experimental results demonstrate strong inspection performance, achieving an AUROC of 99.92% on the MVTec AD Carpet benchmark and 93.92% on the proposed industrial carpet dataset. The obtained results demonstrate that this integration of established techniques provides an effective and computationally lightweight solution for industrial deployment, while confirming the practical value of the proposed dataset as a realistic benchmark for future research.
1. Introduction
Automated visual inspection has become a cornerstone of modern manufacturing systems, playing a critical role in ensuring product quality, reducing operational costs, and improving production efficiency within Industry 4.0 environments [1,2]. As production lines become increasingly automated and quality requirements more stringent, manufacturers require reliable inspection systems capable of operating continuously while maintaining consistent decision-making performance.
Among industrial inspection applications, the textile sector remains particularly challenging due to the large variability of textures, colors, patterns, and defect appearances encountered during production [3]. Textile defects may originate from yarn irregularities, machine malfunctions, contamination, or finishing processes, resulting in a wide range of visual anomalies that can significantly affect both product appearance and structural integrity. Such defects may lead to substantial economic losses, as defective textile products can lose between 45% and 65% of their market value [4].
Within this domain, carpet inspection represents one of the most complex quality control tasks. Unlike conventional fabrics, carpets exhibit highly heterogeneous textures, multicolored patterns, and three-dimensional surface structures. Consequently, defect visibility is strongly influenced by illumination conditions, viewing angles, and pile orientation, making the distinction between normal texture variations and actual defects particularly difficult [5]. In addition, several defect categories, such as yarn discontinuities, seam irregularities, and surface contamination, often appear with low contrast and occupy only a small portion of the inspected surface.
For decades, quality inspection in carpet manufacturing has relied primarily on human operators due to their ability to adapt to complex visual scenarios and variable defect appearances [6,7]. However, manual inspection remains inherently subjective and is affected by fatigue, distraction, and operator-dependent variability, which can result in inconsistent inspection outcomes and missed defects in high-speed production environments [8,9]. These limitations have motivated the development of automated vision-based inspection systems capable of providing objective, repeatable, and scalable quality assessment.
Recent advances in computer vision and machine learning have significantly improved automated surface inspection. Existing approaches generally fall into two complementary categories: anomaly detection and defect classification. Anomaly detection methods aim to identify deviations from normal appearance patterns using either unsupervised or one-class learning paradigms [10,11]. These approaches are particularly attractive in industrial environments because they can be trained using only defect-free samples. However, while they effectively determine whether a product is defective, they do not provide information regarding the nature of the detected defect. Conversely, defect classification methods assign detected anomalies to predefined categories, enabling a more detailed diagnosis of quality issues [12]. Nevertheless, their effectiveness depends heavily on the availability of large, balanced, and accurately annotated datasets, which are often difficult and expensive to acquire in real manufacturing environments.
Another important limitation concerns the scarcity of publicly available datasets specifically designed for industrial carpet inspection. Although benchmark datasets such as MVTec AD have played a major role in advancing industrial anomaly detection research, they do not fully capture the diversity of carpet manufacturing environments, where variations in texture, color, motif, pile orientation, and defect appearance can significantly impact inspection performance [13]. Consequently, the development and evaluation of robust carpet inspection systems remain constrained by the limited availability of representative industrial datasets.
To address these challenges, this paper introduces a new industrial carpet defect dataset together with a hybrid two-stage inspection framework for automated quality control. The proposed dataset was acquired under controlled industrial imaging conditions and contains defect-free samples together with four representative carpet defect categories: Backing Seam, Bad Mend, Dirty Face, and End Out. A primary distinguishing contribution of this work is the systematic evaluation of the proposed framework on both the public MVTec AD Carpet benchmark and the newly introduced industrial dataset. This dual evaluation provides a more realistic assessment of the framework and highlights the performance differences between benchmark and industrial data. The proposed two-stage pipeline combines one-class anomaly detection with supervised defect classification within a unified quality-control workflow. The first stage identifies defective carpet surfaces using only defect-free training samples, while the second stage classifies the detected defects into their corresponding categories. Finally, several deep feature extraction backbones and lightweight machine learning models are systematically compared to assess their suitability for industrial carpet inspection.
The main contributions of this work are summarized as follows:
- →
- A new industrial carpet defect dataset was constructed using a dedicated image acquisition system integrating an industrial camera, controlled optical configuration, and a structured acquisition and annotation workflow. Combined with systematic evaluation on the public MVTec AD Carpet benchmark, this dataset enables the proposed framework to be assessed under both benchmark and realistic industrial conditions and highlights the performance differences between these two settings.
- →
- An engineering integration of established components, namely pretrained deep feature extraction, one-class anomaly detection, and supervised defect classification, into a practical two-stage inspection pipeline tailored to the operational constraints of carpet manufacturing.
- →
- A systematic empirical evaluation of multiple deep feature extraction backbones, PCA configurations, and lightweight machine learning models for both anomaly detection and defect classification, conducted on both the MVTec AD Carpet benchmark and the proposed industrial carpet dataset.
The remainder of this paper is organized as follows. Section 2 presents the fundamental concepts related to industrial carpet inspection and image acquisition. Section 3 reviews existing defect detection and defect classification approaches. Section 4 discusses the limitations and challenges of current automated carpet inspection systems and identifies the research gap addressed in this work. Section 5 describes the proposed industrial carpet dataset and acquisition workflow. Section 6 details the proposed hybrid inspection framework. Section 7 presents the experimental protocol and evaluation methodology. Section 8 discusses the obtained results. Finally, Section 9 concludes the paper and outlines future research directions.
2. Industrial Carpet Inspection Fundamentals
Industrial carpet inspection relies on a combination of manufacturing knowledge, image acquisition principles, and computer vision techniques. Understanding the origin of carpet defects and the factors influencing image quality is essential for designing reliable automated inspection systems. This section introduces the main defect categories encountered in tufted carpet manufacturing and reviews the fundamental image acquisition components that directly affect defect visibility and detection performance in industrial environments.
2.1. Tufted Carpet Defects
Tufted carpets are among the most widely manufactured textile floor coverings due to their high production efficiency, design flexibility, and cost-effectiveness. The manufacturing process consists of inserting pile yarns into a primary backing material using multiple high-speed needles, followed by secondary backing and finishing operations. Although this process enables large-scale production, it may introduce various structural and visual defects that negatively affect both the aesthetic appearance and commercial value of the final product.
2.1.1. Manufacturing Sources of Defects
Defects in tufted carpets mainly originate from three sources: yarn irregularities, machine malfunctions, and dyeing inconsistencies. At the yarn level, defects may include contamination, debris, count variations producing thin or thick areas, twist inconsistencies, streaky yarn caused by color or texture non-uniformity, and neps resulting from tangled fibers [5]. At the manufacturing stage, damaged, worn, or misaligned needles may produce missing tufts, cuts, holes, or metallic contamination on the carpet surface. In addition, variations occurring during dyeing and finishing processes may generate localized color inconsistencies and shade deviations across the pile structure.
2.1.2. Defect Categories
A wide range of defect categories can occur during tufted carpet production, including color variations, cuts, holes, thread defects, contamination artifacts, and pile irregularities. These defects vary considerably in size, shape, contrast, and visual appearance, making their automatic detection particularly challenging. Similar defect categories are commonly considered in industrial inspection benchmarks such as the MVTec AD dataset [13]. Representative examples of carpet defects are presented in Figure 1.
Figure 1.
Representative examples of carpet surface conditions from the MVTec AD dataset, including defect categories and a defect-free sample.
2.1.3. Challenges of Automated Visual Inspection
Automated inspection of tufted carpets presents unique challenges compared with conventional fabric inspection. As highlighted by Forsberg et al. [5], the three-dimensional pile structure causes defect visibility to vary significantly with illumination direction, viewing angle, and pile orientation. Consequently, inspection systems must distinguish genuine defects from natural texture variations and normal appearance changes inherent to carpet surfaces.
Particularly challenging defect categories include subtle shade variations caused by off-shade dyed fibers and narrow linear anomalies resulting from yarn defects. These defects often exhibit low contrast and occupy only a small portion of the inspected surface, making them difficult to identify reliably. Furthermore, repetitive textures and complex motifs can generate visual patterns that resemble defects, increasing the risk of false detections.
Although benchmark datasets such as MVTec AD provide valuable evaluation frameworks for industrial anomaly detection, they do not fully represent the variability encountered in real carpet manufacturing environments. Variations in texture, color, pile orientation, and defect appearance remain significantly more complex in industrial settings. These challenges motivate the development of a dedicated carpet inspection dataset.
These characteristics also influence the design of automated inspection systems. Many carpet defects have low contrast and occupy only a small area of the surface, while collecting large numbers of defective samples is often difficult in industrial environments. Therefore, inspection methods that can be trained using only defect-free samples are particularly suitable. At the same time, carpet defects arise from various manufacturing sources, including yarn irregularities, machine malfunctions, and dyeing inconsistencies. As a result, simply determining whether a carpet is defective is insufficient for quality control, since different defect types require different corrective actions. These industrial requirements motivated the proposed two-stage inspection framework.
2.2. Image Acquisition Setup
Defect visibility in tufted carpets is highly sensitive to acquisition conditions. Image acquisition therefore constitutes a critical stage in automated industrial inspection systems, as image quality directly influences defect visibility, feature extraction, and overall inspection performance. In textile and carpet inspection applications, acquisition conditions must be carefully controlled to ensure reliable detection of subtle defects and complex texture variations. As illustrated in Figure 2, an industrial image acquisition system primarily consists of three interconnected components: the camera, the optical system, and the illumination configuration.
Figure 2.
Main components influencing the image acquisition process.
2.2.1. Camera Selection
Camera selection plays a fundamental role in industrial carpet inspection because it directly affects image quality, defect visibility, and the reliability of extracted visual features [14,15]. The inspection of tufted carpets requires stable image acquisition with sufficient spatial resolution to capture subtle defects embedded within repetitive and highly textured surface patterns.
Industrial cameras are widely employed in automated inspection systems due to their high resolution, acquisition stability, and compatibility with continuous industrial processes [14]. These characteristics make them particularly suitable for detecting fine texture irregularities and low-contrast anomalies in carpet surfaces. Depending on the inspection scenario, both area-scan and line-scan cameras may be used. Area-scan cameras are generally adopted for static image acquisition, whereas line-scan cameras are preferred in continuous production environments because they enable the acquisition of high-resolution images from moving textile surfaces [7,15].
Advanced imaging modalities, including multispectral and thermal imaging systems, have also demonstrated promising capabilities for detecting complex or low-visibility defects [14]. However, these technologies often introduce additional acquisition complexity, higher computational requirements, and increased deployment costs, which may limit their adoption in practical industrial environments.
2.2.2. Lens Selection
The lens directly determines the imaging geometry, spatial resolution, and field of view of the inspection system. Its selection depends on several factors, including the working distance, sensor dimensions, object size, and focal length, which collectively define the observable inspection area and image magnification [7].
In industrial carpet inspection, lens configuration is particularly important because small defects and subtle texture irregularities must remain clearly visible within the acquired images. An inappropriate lens configuration may introduce geometric distortions, reduce defect visibility, or provide insufficient surface coverage, thereby negatively affecting feature extraction and inspection performance.
Furthermore, the magnification factor must be carefully balanced against the field of view. Higher magnification improves the visibility of localized defects and fine texture details, whereas lower magnification enables larger surface coverage at the expense of spatial detail. Consequently, proper lens selection is essential for achieving reliable and high-quality image acquisition under industrial operating conditions.
2.2.3. Lighting Configuration
Illumination conditions strongly influence defect contrast and texture visibility in industrial inspection systems [15]. Various lighting configurations can be employed depending on the material properties and target defect characteristics, including front lighting, backlighting, multi-angle lighting, and structured lighting.
Front lighting provides relatively uniform illumination and is generally suitable for regular textile surfaces. Backlighting enhances contrast and facilitates the visualization of structural features in semi-transparent materials. Multi-angle illumination improves the visibility of surface irregularities and three-dimensional structures, making it particularly effective for textured materials. In addition, structured lighting techniques, sometimes combined with infrared illumination, can improve the separation between defective and non-defective regions by emphasizing surface geometry and texture variations [7].
Among available lighting technologies, LED illumination has become the preferred solution in industrial inspection systems due to its stability, energy efficiency, long lifespan, and spectral consistency. Consequently, the positioning, orientation, intensity, and distribution of the light source must be carefully optimized to maximize defect visibility while minimizing shadows, reflections, and acquisition variability [15].
Overall, the effectiveness of an industrial image acquisition system depends on the joint optimization of the camera, lens, and illumination configuration. These components directly influence image quality, spatial resolution, defect visibility, and acquisition consistency. In carpet inspection applications, where defects may exhibit low contrast and interact with complex texture patterns, carefully controlled acquisition conditions are essential to ensure reliable defect detection and classification. These principles guided the design of the acquisition system used to construct the proposed industrial carpet dataset, as described in Section 5.
3. Related Works
Following the discussion of carpet manufacturing characteristics and image acquisition principles presented in the previous section, this section reviews the principal approaches developed for automated surface inspection. Although research specifically dedicated to carpet inspection remains relatively limited, significant advances have been achieved in the broader domains of textile inspection, fabric defect detection, and industrial anomaly detection. Due to the similarities between carpets and other textured industrial surfaces in terms of repetitive patterns, texture variability, and defect appearance, these studies provide valuable insights for the development of automated carpet inspection systems.
Existing approaches can generally be categorized into two complementary research directions. The first focuses on defect detection and the second addresses defect classification.
3.1. Defect Detection Approaches
Defect detection constitutes a fundamental component of industrial quality control systems, as it enables the identification of abnormal regions that may compromise product quality. Early approaches relied primarily on handcrafted feature extraction techniques derived from frequency-domain analysis. Chan and Pang [16] proposed an FFT-based framework in which spectral features extracted from the central frequency spectrum were used to characterize yarn periodicity and detect structural defects. Building upon this concept, Malek [17] combined FFT and cross-correlation analysis to improve online inspection capabilities and increase sensitivity to local structural irregularities.
Although these methods demonstrated promising performance on regular textile patterns, they primarily capture global texture characteristics and often struggle to represent localized defect structures. Consequently, their effectiveness may decrease when dealing with complex carpet textures, diverse visual patterns, and highly variable industrial defect appearances.
To address these limitations, texture-based filtering methods were introduced. Among them, Gabor filters gained considerable attention due to their ability to simultaneously capture spatial and frequency information. Bodnarova et al. [18] employed optimized Gabor filters for texture-based defect segmentation, while Zhu et al. [19] further enhanced this approach by combining GA-optimized Gabor feature extraction with adaptive cuckoo search thresholding. Nevertheless, despite their effectiveness on regular textures, handcrafted feature extraction methods generally exhibit limited generalization capabilities when confronted with diverse texture patterns and complex industrial environments.
The limitations of handcrafted descriptors have motivated the adoption of deep learning-based anomaly detection approaches. Recent research has explored several categories of anomaly detection methods, including teacher–student learning frameworks [20,21], reconstruction-based models [22,23], feature embedding approaches [11,24], distribution modeling techniques [10], and self-supervised learning strategies [25].
Teacher–student and knowledge distillation frameworks have emerged as effective solutions for industrial anomaly detection. Deng and Li [20] proposed a reverse distillation framework consisting of a teacher encoder and a student decoder, introducing a One-Class Bottleneck Embedding (OCBE) module to improve the representation of normal patterns. Similarly, Bergmann et al. [21] introduced a student–teacher framework in which anomalies are identified through discrepancies between teacher and student feature representations. These methods have demonstrated strong performance on industrial anomaly detection benchmarks and have shown particular suitability for texture inspection tasks.
Another important research direction is reconstruction-based anomaly detection. In these methods, models are trained to reconstruct normal samples, while anomalies are identified through reconstruction errors. Hou et al. [22] proposed a framework incorporating a multi-scale block-wise memory module to enhance the separation between normal and anomalous patterns. Akcay et al. [23] introduced GANomaly, a GAN-based architecture that reconstructs normal images and detects anomalies through latent-space discrepancies.
Feature embedding methods have also gained popularity due to their ability to leverage representations extracted from pretrained deep neural networks. Patch SVDD [24] and PatchCore [11] characterize normal patterns using feature embeddings and identify anomalies through distance-based comparisons with reference samples. Closely related approaches include distribution modeling techniques such as PaDiM [10], which models normal patch embeddings using multivariate Gaussian distributions and performs anomaly detection through Mahalanobis distance estimation.
More recently, self-supervised learning has emerged as an attractive alternative for anomaly detection. Li et al. [25] proposed CutPaste, a self-supervised framework that creates synthetic anomalies through image patch manipulation. By learning to distinguish between original and modified images, the network acquires discriminative representations capable of separating normal and abnormal patterns without requiring defect annotations.
The defect detection approaches reviewed above exhibit different trade-offs in terms of representation capability, computational requirements, dependence on defect samples, and suitability for heterogeneous textured surfaces. To provide a more systematic comparison and clarify their relevance to industrial carpet inspection, Table 1 summarizes the main strengths and limitations of each methodological family, together with their relative computational requirements and relevance to the specific challenges of carpet inspection.
Table 1.
Comparative summary of defect detection approaches.
The comparison highlights the trade-off between computational requirements and the ability to handle the variability of industrial carpet surfaces. Recent deep learning-based approaches offer more expressive representations, whereas their increased computational or memory requirements may affect practical deployment. The computational requirements reported in Table 1 are qualitative assessments based on the relative training, inference, and memory demands of each methodological family. This comparison motivates the investigation of feature-based approaches that combine deep representations with lightweight learning models for industrial carpet inspection.
3.2. Defect Classification Approaches
Defect classification aims to identify the specific defect category. Such information is particularly valuable in industrial environments because it facilitates quality assessment, process monitoring, and root-cause analysis.
Early defect classification systems relied primarily on handcrafted feature extraction techniques combined with conventional machine learning classifiers. Hanbay et al. [26] proposed a hybrid framework integrating shearlet-based feature extraction, PCA dimensionality reduction, and ANN classification for knitted fabric inspection. Similarly, Li et al. [12] combined visual saliency analysis with histogram-based feature extraction and SVM classification. Anandan et al. [27] employed Discrete Curvelet Transform (DCT), Gray-Level Co-occurrence Matrix (GLCM), and k-NN classifiers for textile defect categorization. Additional studies investigated combinations of handcrafted descriptors with machine learning algorithms such as SVM, k-NN, Random Forest, and decision trees [28,29].
Recent advances in deep learning have significantly improved defect classification performance. Yaşar Çıklaçandır et al. [28] conducted a systematic comparison between handcrafted descriptors and deep convolutional features extracted from pretrained ResNet18 and GoogLeNet architectures, demonstrating the superiority of CNN-based representations. Similarly, Mewada et al. [30] proposed a transfer learning framework based on a fine-tuned ResNet50 model, further confirming the effectiveness of deep representations for capturing complex defect characteristics. The success of transfer learning has also encouraged the adoption of deeper architectures. For example, Singh and Desai [31] developed an automated inspection framework based on a pretrained ResNet101 model for surface defect classification.
Hybrid architectures combining segmentation, feature extraction, and classification have also attracted increasing attention. Mohammed et al. [32] introduced a framework integrating a customized U-Net segmentation model, VGG16-based feature extraction, and a Random Forest classifier, achieving promising results on the AITEX textile defect dataset.
Despite their effectiveness, supervised classification methods require large quantities of accurately annotated defect samples for each defect category. In industrial carpet inspection, collecting and annotating such datasets is often labor-intensive and expensive due to the large variability in textures, colors, patterns, and defect appearances. Furthermore, multiple defect types may coexist within the same surface region, increasing the complexity of defect categorization and reducing class separability. As a result, classification models may experience limited generalization capability when deployed in highly heterogeneous industrial environments.
Table 2 provides a comparative overview of the reviewed defect classification approaches, with particular emphasis on their computational requirements and relevance to industrial carpet inspection.
Table 2.
Comparative summary of defect classification approaches.
The comparison highlights the trade-off between representation capability, annotation requirements, and computational complexity in defect classification. While deep and hybrid approaches provide more expressive representations, their dependence on labelled data and additional computational requirements may present challenges in industrial environments where defective samples are limited.
4. Limitations and Challenges
Although recent advances in anomaly detection and defect classification have significantly improved automated visual inspection, several challenges still limit their practical deployment in industrial carpet manufacturing. These challenges include the scarcity of representative carpet datasets, the computational requirements of state-of-the-art methods, the limited evaluation of integrated detection–classification pipelines, and the scarcity of annotated defect samples. The following subsections discuss these challenges in detail.
4.1. Limited Carpet-Specific Research and Datasets
The majority of the methods reviewed above were developed and validated on general textile or fabric datasets rather than on carpet imagery specifically, despite the distinct imaging challenges posed by carpet surfaces (Section 2.1). As a result, methods that perform well on flat, regularly patterned textiles do not necessarily transfer directly to carpet inspection. To the best of our knowledge, only Forsberg et al. [5] and Erkinov [33] explicitly address carpet inspection, and neither provides a publicly accessible carpet defect dataset: the custom dataset used in [5] remains private, and [33] presents a design proposal without an accompanying dataset release. Consequently, the only carpet-specific data currently available to the research community remains the carpet category of the MVTec AD benchmark, which does not capture the diversity of textures, colors, motifs, and defect appearances encountered in real carpet manufacturing environments. This scarcity of carpet-specific research and publicly available datasets motivates the construction of the industrial carpet dataset introduced in this work.
4.2. Computational Complexity and Efficiency Challenges
Another important challenge concerns the computational complexity of recent anomaly detection and defect classification methods. Although these approaches have demonstrated excellent performance on benchmark datasets [10,11,20,21,23], they often require substantial computational resources. Teacher–student and knowledge distillation methods [20,21] involve training multiple deep neural networks, while reconstruction-based approaches such as GANomaly [23] rely on adversarial training, leading to high training and inference costs. Feature embedding methods, including PatchCore [11] and PaDiM [10], require storing high-dimensional feature representations or statistical models, which increases memory consumption.
In industrial environments, inspection systems must operate continuously, provide real-time decisions, and use computational resources efficiently. As reported by Erkinov [33], real-time carpet inspection may require a dedicated GPU or edge-computing hardware to sustain production-line throughput. These practical constraints motivated the proposed framework, which combines pretrained deep feature extraction with lightweight machine learning models to achieve an effective balance between inspection performance, computational efficiency, and industrial deployment.
4.3. Absence of Unified Detection–Classification Pipelines
A further limitation of the reviewed literature is that anomaly detection and defect classification have generally been studied as two separate problems rather than as complementary stages of a single inspection pipeline. Detection methods [10,11,20,21,22,23,24,25] determine whether a surface is defective but provide no information regarding the nature of the detected anomaly, which limits their usefulness for root-cause analysis and quality-control decision-making.
Conversely, classification methods [12,26,27,28,29,30,31,32] assume that defective samples have already been isolated and accurately labelled, and therefore do not address the initial screening problem faced in real production environments, where the majority of inspected samples are defect-free. To the best of our knowledge, few existing studies combine both stages into a single, end-to-end industrial inspection pipeline, and none do so specifically for carpet imagery. This gap motivates the two-stage hybrid framework proposed, in which one-class anomaly detection is used to screen carpet tiles before supervised classification is applied to categorize the defects detected among them.
4.4. Scarcity of Annotated Defect Data
Another limitation of existing methods is their reliance on annotated defect data. Although supervised classification approaches have achieved excellent performance [26,28,30,31,32], they generally require large, balanced, and accurately labelled datasets for each defect category. In industrial carpet manufacturing, however, defective samples are naturally scarce, and their annotation requires expert knowledge, making the construction of representative datasets both costly and time-consuming, particularly for rare defect types.
The first stage employs one-class anomaly detection trained exclusively on defect-free samples, which are readily available in industrial production and require no defect annotation. The second stage performs supervised classification only on the subset of samples identified as anomalous. Although labelled defect samples are still required for this stage, the proposed framework significantly reduces the overall annotation effort by limiting the need for manual labelling to defective samples rather than the entire production.
5. Industrial Carpet Dataset Acquisition
The proposed dataset was collected from modular carpet tiles measuring 50 × 50 cm, one of the two standard formats manufactured by the industrial partner (the other being 25 × 100 cm). This format was not selected specifically for this study but was adopted directly from the existing production line. It was prioritized because it represents the highest production volume, ensuring that the acquired images accurately reflect real industrial inspection conditions.
The dataset includes both defect-free samples and four representative defect categories. Particular attention was given to the design of the acquisition system to ensure consistent imaging conditions, adequate spatial resolution, and reliable defect visibility. Because carpet defects vary considerably in size, shape, contrast, and texture, the acquisition setup was configured to detect anomalies ranging from 0.5 cm to 10 cm while maintaining complete surface coverage for both carpet formats.
The acquisition and annotation platform consists of an Angular-based web interface connected to a Flask backend, providing centralized control of the industrial camera and dataset management.
Figure 3 illustrates the acquisition and annotation workflow adopted for the proposed industrial carpet dataset. The process begins with the initialization of a new acquisition session through the web-based platform. The carpet tile is positioned within the inspection area, and an image is captured using the industrial camera. During acquisition, the operator assigns a preliminary image-level label, identifying the sample as either defect-free or belonging to one of the predefined defect categories. Each image is immediately checked to ensure adequate quality before entering the annotation stage.
Figure 3.
Dataset acquisition and annotation workflow used for carpet defect inspection.
To improve annotation reliability, a two-level labelling procedure is adopted. The preliminary label assigned during acquisition is independently reviewed by an experienced quality-control operator, who confirms or corrects it according to the manufacturer’s quality standards before validating the final annotation. When multiple visible defects are present on the same carpet tile, a single label corresponding to the dominant or most severe defect is assigned. Only validated samples are stored in the centralized repository for dataset management and subsequent experimental evaluation.
The four defect categories End Out, Bad Mend, Backing Seam, and Dirty Face correspond to the industrial partner’s existing quality-control terminology rather than categories specifically introduced for this study, ensuring that the dataset reflects real production practices. All annotations consist of image-level labels; no bounding boxes, segmentation masks, or other localization information were collected. Because each sample receives a single validated label rather than independent annotations from multiple experts, no inter-annotator agreement statistic was computed. Nevertheless, the systematic review performed by an experienced quality-control operator helps minimize annotation errors. The inclusion of localization annotations and a formal inter-annotator agreement study are identified as directions for future extensions of the dataset.
5.1. Proposed Image Acquisition Setup
The image acquisition system was designed by jointly optimizing the camera, optical configuration, working distance, and imaging geometry to achieve an appropriate balance between spatial resolution and field-of-view coverage. The objective was to ensure complete carpet coverage while preserving sufficient image detail for the detection of subtle defects and texture irregularities.
A Basler a2A5060-15ucBAS industrial camera (Basler AG, Ahrensburg, Germany) was selected due to its high spatial resolution, acquisition stability, and suitability for industrial inspection applications. The camera integrates a high-resolution global-shutter CMOS sensor capable of capturing detailed carpet surface textures and subtle defect patterns under controlled acquisition conditions. The principal camera specifications are summarized in Table 3.
Table 3.
Specifications of the Basler a2A5060-15ucBAS industrial camera.
Figure 4 presents the industrial camera and optical lens integrated into the proposed acquisition setup.
Figure 4.
Industrial camera and optical lens used in the proposed image acquisition setup.
Illumination was provided by a Neewer RB18B 18-inch LED ring light (Shenzhen Neewer Technology Co., Ltd., Shenzhen, China), mounted coaxially above the inspection area to produce uniform, shadow-free lighting across the carpet surface. The ring light consists of 288 LEDs with a maximum power of 45 W and provides up to 3800 lux at a working distance of 0.5 m. It offers an adjustable color temperature ranging from 2900 K to 7000 K, together with a color rendering index (CRI) above 95 and a television lighting consistency index (TLCI) above 97.
For all image acquisitions, the illumination settings were kept constant, using a color temperature of approximately 4400 K (standard mode) and a fixed light intensity. Maintaining identical acquisition conditions reduces illumination variability and improves the consistency of the captured images.
Figure 5 illustrates the complete image acquisition station developed for carpet inspection. The setup integrates the industrial camera, optical lens, illumination system, and carpet positioning structure used to ensure stable and reproducible image acquisition conditions.
Figure 5.
Complete industrial image acquisition station.
5.2. Spatial Resolution and Imaging Constraints
The spatial resolution and acquisition geometry of the imaging system directly influence the visibility and detectability of small carpet defects. In industrial inspection applications, the acquisition setup must ensure complete coverage of the carpet tile while preserving sufficient image detail for reliable anomaly detection and defect characterization.
The acquisition system was designed to accommodate the two carpet tile formats produced by the industrial partner: 50 × 50 cm and 25 × 100 cm. Consequently, the field of view (FOV) of the imaging system was dimensioned to cover the largest relevant tile dimension across both formats, mm, as expressed in Equation (1):
This constraint is automatically satisfied for the 50 × 50 cm tiles used in the present study, which require only mm.
The spatial sampling capability of the system must also ensure that small defects are represented by a sufficient number of pixels in the image plane. Let denote the minimum detectable defect size and p the minimum number of pixels required to reliably represent a defect. The acquisition system must satisfy the spatial sampling constraint expressed in Equation (2):
where N represents the number of pixels along the sensor width.
Since the field of view depends on the camera-to-object distance g, the working distance must be carefully selected to balance spatial coverage and image resolution. Increasing the acquisition distance enlarges the field of view but reduces spatial resolution, whereas shorter distances improve defect visibility at the expense of surface coverage. The relationship between sensor dimensions, working distance, and object-space coverage is governed by the thin-lens approximation expressed in Equation (3):
where B denotes the sensor dimension.
A working distance of mm was selected together with a Basler C11-1220-12M-P fixed-focal-length lens ( mm), given the sensor dimension mm (Table 3). Using Equation (3), the resulting field of view is
which exceeds the target coverage mm with a comfortable margin, accommodating both tile formats as well as minor positioning tolerances.
For the 50 × 50 cm tiles used in this study, this configuration yields an effective spatial resolution of
so that the smallest target defect size, mm (0.5 cm), is represented by approximately pixels, well above the minimum requirement of pixels (Equation (2)) established for reliable defect visibility.
5.3. Dataset Description
The proposed industrial carpet dataset was designed to reflect the diversity and complexity encountered in real manufacturing environments. All images were acquired using the previously described acquisition system under controlled illumination and positioning conditions to ensure consistent image quality and reproducible inspection scenarios.
Unlike benchmark datasets that typically focus on a limited number of textures or defect categories, the proposed dataset incorporates multiple carpet designs characterized by different colors, motifs, pile structures, and texture patterns. This variability introduces substantial visual complexity and provides a realistic evaluation framework for anomaly detection and defect classification systems operating in industrial environments.
The dataset contains four representative defect categories: End Out, Bad Mend, Backing Seam, and Dirty Face. These defects correspond to distinct manufacturing issues, including yarn-related anomalies, structural discontinuities, and surface contamination. Their visual appearance varies considerably in terms of size, shape, texture alteration, contrast, and spatial distribution, making automated inspection particularly challenging.
A detailed description of each defect category is provided in Table 4.
Table 4.
Main defect categories included in the proposed industrial carpet dataset.
Figure 6 presents representative examples of the defect categories included in the proposed dataset.
Figure 6.
Representative examples of the four defect categories included in the proposed industrial carpet dataset.
Table 5 summarizes the dataset composition and the distribution of samples across the different defect categories.
Table 5.
Distribution of samples in the proposed industrial carpet dataset.
The resulting dataset provides a realistic benchmark for evaluating automated carpet inspection systems under practical industrial conditions. Its diversity in terms of textures, colors, motifs, and defect appearances makes it particularly suitable for assessing the robustness and generalization capabilities of anomaly detection and defect classification methods.
5.4. Image Preprocessing
Prior to feature extraction and model training, a series of preprocessing operations were applied to standardize the acquired images, reduce acquisition-related variability, and improve the visibility of subtle carpet defects. These operations aim to enhance the robustness of the proposed inspection framework by ensuring consistent visual representations across all samples.
- Region of Interest Extraction and Geometric Alignment: Carpet tiles exhibit substantial intra-class variability in color, texture, and motif, which makes simple intensity- or texture-based thresholding unreliable for isolating the tile from the background. Region of interest extraction was therefore performed using MobileSAM [34], a lightweight variant of the Segment Anything Model (SAM), which segments the tile based on learned visual representations.For each image, MobileSAM was prompted with a single foreground point at the image center to generate a binary mask isolating the carpet tile. The mask was refined using standard morphological operations, and the tile corners were estimated using the Ramer–Douglas–Peucker algorithm. A perspective transformation was then applied to rectify the tile to a fronto-parallel view, correcting for positioning and orientation variations introduced during acquisition. Residual background borders were cropped, and each resulting tile was validated based on its aspect ratio, contrast, and surface coverage to exclude blank or malformed samples.
- Image Resizing: All images were resized to a fixed resolution to provide uniform input dimensions for the deep feature extraction networks. This standardization facilitates batch processing and ensures compatibility across the different convolutional neural network backbones investigated in this study.
- Illumination Normalization and Contrast Enhancement: Illumination normalization and contrast enhancement techniques were applied to improve the visibility of low-contrast defects. These operations enhance subtle texture variations and facilitate the extraction of discriminative visual features.
6. Proposed Framework
This section presents the proposed hybrid inspection framework for industrial carpet defect analysis. The framework is designed to address two complementary objectives encountered in industrial quality control: the reliable detection of defective carpet tiles and the accurate categorization of detected defects. To achieve these objectives, a two-stage architecture combining deep feature extraction and machine learning techniques is proposed.
A two-stage design was adopted because anomaly detection and defect classification address different industrial requirements. The first stage focuses on identifying abnormal carpet tiles using only defect-free samples, thereby reducing the dependence on large annotated defect datasets. The second stage provides detailed defect categorization for the samples identified as defective, facilitating root-cause analysis and quality-control decision making.
As illustrated in Figure 7, the framework consists of four main components: deep feature extraction, feature standardization and dimensionality reduction, anomaly detection, and defect classification. First, preprocessed carpet images are forwarded to pretrained convolutional neural networks to extract discriminative visual representations. The resulting feature embeddings are subsequently standardized and optionally projected into a lower-dimensional feature space using Principal Component Analysis (PCA).
Figure 7.
Proposed two-stage hybrid anomaly detection and defect classification framework for industrial carpet inspection.
In the first stage, anomaly detection is performed using one-class learning techniques trained exclusively on defect-free samples. This design reflects practical industrial conditions, where defective examples are often scarce, heterogeneous, and costly to collect. Samples identified as defective are subsequently forwarded to a second stage dedicated to defect categorization.
The second stage employs supervised machine learning classifiers to assign each detected anomaly to its corresponding defect category. By combining one-class learning and supervised classification within a unified framework, the proposed approach leverages the advantages of both paradigms while remaining suitable for deployment in real industrial carpet manufacturing environments.
6.1. Deep Feature Extraction
Deep feature extraction constitutes a key component of the proposed framework. Instead of relying on handcrafted texture descriptors, pretrained Convolutional Neural Networks (CNNs) are employed to generate high-level visual representations capable of capturing complex texture patterns, structural variations, and subtle surface irregularities commonly encountered in industrial inspection tasks.
To evaluate the influence of feature representations on inspection performance, three pretrained CNN backbones were investigated: VGG-19 [35], ConvNeXt [36], and Wide ResNet-50-2 [37]. These architectures were selected due to their complementary design characteristics and their demonstrated effectiveness in large-scale visual recognition tasks. Collectively, they represent classical, modern, and residual convolutional architectures, respectively, enabling a comprehensive evaluation of deep feature representations for carpet inspection.
To ensure a fair comparison and maintain consistency throughout the framework, the same feature extraction strategy was employed in both the anomaly detection and defect classification stages.
For each backbone architecture, multiple intermediate feature representations were investigated in order to analyze the influence of different semantic levels on anomaly detection and defect classification performance. The extracted feature maps were subsequently aggregated using global average pooling to generate compact feature embeddings used as inputs to the machine learning models.
The extracted feature embeddings constitute the common representation space used throughout the framework. By employing the same feature extraction pipeline for both anomaly detection and defect classification, the proposed approach enables a consistent evaluation of feature quality across the two inspection stages while reducing the influence of feature-engineering decisions on the experimental results.
6.2. Feature Standardization and Dimensionality Reduction
The deep feature vectors extracted from the pretrained CNNs generally exhibit high dimensionality and heterogeneous feature distributions. Such representations may increase computational complexity, memory requirements, and sensitivity to noise while negatively affecting the performance of conventional machine learning algorithms. Consequently, a feature preprocessing stage was introduced to standardize and optionally reduce the dimensionality of the extracted feature embeddings.
Feature standardization was first performed using the StandardScaler technique, which transforms each feature to have zero mean and unit variance. This operation ensures that all extracted features contribute equally during the learning process.
Let denote the extracted feature vector. The standardized representation is computed as:
where and denote the mean and standard deviation of the i-th feature, respectively.
After standardization, PCA was applied to reduce feature dimensionality while preserving the most informative variance components. PCA projects the standardized feature vectors into a lower-dimensional subspace defined by orthogonal principal components, thereby reducing feature redundancy and improving computational efficiency.
Different PCA configurations were investigated experimentally in order to evaluate the trade-off between dimensionality reduction and inspection performance.
The PCA projection is defined as:
where represents the projection matrix composed of the selected principal components and corresponds to the reduced feature embedding.
Consequently, the proposed feature extraction and preprocessing pipeline transforms raw carpet images into compact and discriminative feature embeddings that can be efficiently processed by both anomaly detection and defect classification models. This unified representation strategy facilitates a fair comparison of learning algorithms while reducing computational complexity.
6.3. Machine Learning Models
This subsection presents the machine learning models employed in the proposed two-stage inspection framework. The first stage focuses on anomaly detection using one-class learning techniques, whereas the second stage performs multiclass defect classification on samples identified as defective.
6.3.1. One-Class Defect Detection Models
After feature extraction, standardization, and optional dimensionality reduction, anomaly detection is performed using one-class learning techniques. Since only defect-free samples are available during training, the objective of this stage is to model the normal appearance of carpet surfaces and identify deviations from this learned representation.
To achieve this objective, four one-class anomaly detection models were investigated: Isolation Forest (IF), One-Class Support Vector Machine (OCSVM), Local Outlier Factor (LOF), and One-Class PCA (OC-PCA). These models were selected because they represent complementary anomaly detection paradigms, including isolation-based, boundary-based, density-based, and reconstruction-based approaches.
Furthermore, these methods exhibit relatively low computational complexity compared with end-to-end deep anomaly detection architectures, making them attractive candidates for deployment in industrial environments where computational efficiency and ease of maintenance are important considerations.
Isolation Forest (IF)
Isolation Forest [38] is an anomaly detection algorithm based on the principle that anomalous samples are easier to isolate than normal observations. The method constructs multiple random trees and identifies anomalies according to their isolation depth.
One-Class Support Vector Machine (OCSVM)
One-Class Support Vector Machine [39] learns a decision boundary that encloses the normal training samples in the feature space. Samples located outside this boundary are considered anomalous.
Local Outlier Factor (LOF)
Local Outlier Factor [40] is a density-based anomaly detection algorithm that identifies anomalous samples by comparing the local density of a sample with that of its neighboring observations.
One-Class PCA (OC-PCA)
One-Class PCA is a reconstruction-based anomaly detection approach derived from Principal Component Analysis. The method assumes that normal samples can be accurately reconstructed from a reduced PCA subspace, whereas anomalous samples generate larger reconstruction errors.
Decision Strategy
Each anomaly detection model produces an anomaly score that quantifies the likelihood of a sample being defective. A decision threshold is subsequently applied to distinguish normal from anomalous carpet tiles.
The threshold is calibrated using a percentile-based strategy: for a given percentile, the threshold value is computed exclusively from the anomaly scores of a held-out subset of defect-free samples, so that no defective examples are required for threshold computation. Several percentile values were evaluated, and the percentile was selected on a validation subset containing a limited number of defective samples. This strategy is particularly suitable for industrial deployment, where only a limited number of labelled defective samples are typically available during system commissioning.
Samples with anomaly scores above the selected threshold are classified as defective, while the remaining samples are considered defect-free.
6.3.2. Multi-Class Defect Classification Models
Samples identified as defective during the anomaly detection stage are forwarded to the second stage of the framework for defect categorization. The objective of this stage is to assign each detected defect to its corresponding defect category.
To evaluate the effectiveness of deep feature representations for defect classification, four supervised machine learning classifiers were investigated: Support Vector Machine (SVM), Random Forest (RF), k-Nearest Neighbors (k-NN), and Linear Discriminant Analysis (LDA). These classifiers were selected due to their widespread use in industrial inspection applications and their complementary decision mechanisms.
Support Vector Machine (SVM)
Support Vector Machine [41] constructs a discriminative decision boundary that maximizes the margin between classes in the feature space, thereby improving generalization capability.
Random Forest (RF)
Random Forest [42] is an ensemble learning method that combines multiple decision trees through a majority voting strategy, providing robust classification performance and resistance to overfitting.
k-Nearest Neighbors (k-NN)
k-Nearest Neighbors [43] classifies samples according to the labels of their nearest neighbors in the feature space. Euclidean, Cosine, and Mahalanobis distance metrics were investigated to evaluate their influence on classification performance.
Linear Discriminant Analysis (LDA)
Linear Discriminant Analysis [44] seeks a discriminative projection that maximizes inter-class separability while minimizing intra-class variability, thereby facilitating class discrimination.
The combination of deep feature extraction, feature standardization, dimensionality reduction, anomaly detection, and defect classification forms a unified inspection framework capable of addressing both defect identification and defect categorization. By integrating one-class learning and supervised classification within the same architecture, the proposed framework provides a practical solution for industrial carpet inspection under conditions characterized by limited defect samples and high visual variability.
7. Experimentation and Evaluation
All experiments were conducted using Python 3.12, PyTorch 2.5.1, Torchvision 0.20.1, Scikit-learn 1.6.1, NumPy 2.2.2, and OpenCV 4.11. Deep feature extraction was performed on a GPU-equipped server (16 GB VRAM), while all classical machine learning models were trained and evaluated on CPU, reflecting the lightweight computational footprint of the proposed framework beyond the feature extraction stage. The proposed framework was evaluated on both the MVTec AD Carpet dataset and the industrial carpet dataset introduced in this work. The following subsections describe the datasets, feature layer and hyperparameter selection procedure, validation protocols, and evaluation metrics employed throughout the experimental study.
7.1. Datasets
The proposed framework was evaluated on two complementary datasets: the publicly available MVTec AD benchmark dataset and the industrial carpet dataset constructed in this work. All images were resized to 224 × 224 pixels before feature extraction to match the input resolution required by the pretrained CNN backbones.
The MVTec Anomaly Detection (MVTec AD) dataset [13] is one of the most widely used benchmarks for industrial anomaly detection. It contains multiple categories of industrial objects and textures acquired under controlled imaging conditions. In this study, the carpet category was selected due to its close similarity to industrial carpet inspection applications. This category comprises a total of 397 images, including 308 defect-free samples (280 for training and 28 for testing) and 89 defective samples distributed across five defect types: color defects (19 samples), cuts (17 samples), holes (17 samples), metal contamination (17 samples), and thread anomalies (19 samples).
To assess the applicability of the proposed framework in real industrial environments, experiments were also conducted on the industrial carpet dataset described in Section 5. Unlike MVTec AD, this dataset contains carpet surfaces exhibiting substantial variations in texture, color, motif, and defect appearance, thereby providing a more challenging and realistic evaluation scenario.
To improve the robustness of the anomaly detection models, data augmentation was applied exclusively to the defect-free training samples. The augmentation strategy included brightness and contrast variations designed to simulate realistic illumination fluctuations and acquisition variability commonly encountered in industrial environments. No augmentation was applied to the test data to preserve an unbiased evaluation protocol.
7.2. Feature Layer Selection and Hyperparameter Optimization
For each backbone, the optimal feature extraction layer was determined independently for Stage 1 and Stage 2 through a systematic ablation across four candidate layers spanning shallow to deep representations.
On the selected layer, the effect of PCA-based dimensionality reduction was evaluated across four configurations (no PCA, and 90%, 95%, and 99% retained variance), independently for each anomaly detection model (Stage 1) and defect classifier (Stage 2).
Finally, for each anomaly detection model (Isolation Forest, OCSVM, LOF, OC-PCA) and defect classifier (SVM, Random Forest, k-NN, LDA), a grid search over model-specific hyperparameters was performed to identify the best-performing configuration within the training data. For Stage 2, given the class imbalance present in the industrial dataset defect categories, the class_weight parameter (available for SVM and Random Forest) was included as an explicit hyperparameter within the grid search, rather than being fixed a priori, allowing the balanced weighting scheme to be adopted only where empirically beneficial.
7.3. Validation Strategy
Different validation protocols were adopted for the anomaly detection and defect classification stages of the proposed framework. The same methodology was applied to both datasets to ensure a fair comparison of results. All reported metrics represent mean values across runs, while standard deviations are reported for the main anomaly detection performance comparisons to quantify the variability of the results across folds.
For Stage 1, anomaly detection models were evaluated using three-fold stratified cross-validation repeated five times with different random partitions (15 runs per configuration). The cross-validation folds were constructed at the image level using both defect-free and defective samples. The partitions were not grouped by carpet design; consequently, different images corresponding to the same carpet design may therefore appear in both the training and test folds. The resulting evaluation measures generalization to unseen images rather than to entirely unseen carpet designs. Within each training partition, the anomaly detector was fitted exclusively on defect-free samples, following the one-class learning paradigm. For each candidate percentile, the corresponding operating threshold was computed solely from a separate subset of defect-free calibration samples. The percentile value was then selected using a validation subset drawn exclusively from the training partition, with the F1-score used as the selection criterion to balance precision and recall. Defective samples were used only in this validation step for percentile selection and were not involved in model fitting or threshold computation. The held-out test fold remained completely separate from model fitting, threshold calibration, and percentile selection and was used only for final performance evaluation.
For Stage 2, a nested cross-validation strategy was adopted to jointly perform hyperparameter optimization and performance estimation, applied to defective samples only. The inner loop consisted of a three-fold stratified cross-validation combined with grid search to determine the optimal hyperparameter configuration for each classifier. The outer loop consisted of an independent three-fold stratified cross-validation, repeated five times, used exclusively for performance estimation.
Finally, the complete two-stage framework was evaluated end-to-end by propagating the predictions generated by the anomaly detection stage to the defect classification stage: Stage 2 was trained exclusively on defective samples from the same cross-validation training fold as Stage 1, and only samples flagged as anomalous by Stage 1 were forwarded to Stage 2 for categorization, reproducing the behavior of the pipeline under realistic deployment conditions.
7.4. Evaluation Metrics
The performance of the proposed framework was evaluated using Accuracy, Precision, Recall, F1-score, macro-averaged F1-score, weighted-averaged F1-score, and the Area Under the Receiver Operating Characteristic Curve (AUROC). Normalized confusion matrices were also used to provide a detailed class-wise analysis of the model predictions.
Accuracy represents the proportion of correctly classified samples among all evaluated samples. Precision measures the proportion of correct positive predictions among all samples assigned to a given class, whereas Recall measures the proportion of samples belonging to a given class that are correctly identified. In the binary anomaly detection stage, high Precision indicates that most samples flagged as defective are truly defective, while high Recall reflects the ability of the model to detect defective samples.
The F1-score is defined as the harmonic mean of Precision and Recall and provides a balanced evaluation when the class distribution is uneven. For the multiclass defect classification stage, macro-averaged Precision, Recall, and F1-score are used to assign equal importance to each defect category, regardless of its number of samples. The weighted-averaged F1-score is also reported by weighting the class-specific F1-scores according to their respective support. These complementary metrics are particularly relevant for the industrial dataset, which exhibits an imbalanced distribution among defect categories. For the end-to-end evaluation of the complete two-stage pipeline, macro- and weighted-averaged metrics are computed over all classes, including the defect-free class.
AUROC evaluates the ability of the anomaly detection model to distinguish between normal and defective samples across all possible decision thresholds. Because it is independent of a single operating threshold, AUROC provides a global measure of class separability, with higher values indicating better discrimination.
Finally, normalized confusion matrices are reported to examine the distribution of predictions for each ground-truth class. They facilitate the identification of class-specific strengths, systematic misclassifications, and confusion between visually similar defect categories.
8. Results and Discussion
To provide a comprehensive evaluation of the proposed framework, the two stages of the pipeline are first assessed independently before evaluating the complete end-to-end system.
8.1. Stage 1—Anomaly Detection Results
This subsection presents the performance of the investigated feature extractors and one-class anomaly detection models on both the MVTec AD Carpet dataset and the proposed industrial carpet dataset.
8.1.1. Results on MVTec AD Carpet
The performance of the proposed Stage 1 anomaly detection pipeline is evaluated on the MVTec AD Carpet benchmark through a systematic comparison of feature extraction backbones, PCA preprocessing configurations, and one-class anomaly detection models. The best-performing configuration is then analyzed in detail and compared with representative state-of-the-art anomaly detection approaches.
Effect of Feature Extraction Layer
Figure 8 presents the image-level AUROC obtained from different feature extraction layers for each CNN backbone and one-class anomaly detection model.
Figure 8.
Image-level AUROC (%) of the anomaly detection models across candidate feature layers, per backbone on the MVTec AD Carpet dataset. Bold labels indicate the feature layer selected for each backbone.
For ConvNeXt and Wide ResNet-50-2, AUROC increases consistently with network depth, with the deepest layer providing the best performance for most evaluated models. In contrast, VGG-19 reaches its peak performance at Block 3, then slightly decreases at Block 5, indicating that deeper representations provide limited additional discriminative information for this task.
Overall, the evaluated anomaly detection models exhibit a consistent preference for the same feature-extraction depth across backbones. For VGG-19, Isolation Forest achieves its highest AUROC at Block 4, Block 3 is preferred by the remaining three models and yields the best average rank across all evaluated detectors. Accordingly, Stage 4, Block 3, and Layer 4 were retained for ConvNeXt, VGG-19, and Wide ResNet-50-2, respectively, for all subsequent experiments.
Effect of PCA Preprocessing
Table 6 evaluates the effect of PCA preprocessing on the selected feature representation of each backbone.
Table 6.
Effect of PCA preprocessing on image-level AUROC for the selected feature layer of each CNN backbone and one-class anomaly detection model on the MVTec AD Carpet dataset.
For ConvNeXt, the original features provide the best or near-best AUROC for most detectors, while retaining only 90% of the variance consistently reduces performance. Wide ResNet-50-2 remains comparatively stable across all configurations, with no PCA level providing a systematic advantage over the original representation. VGG-19 exhibits a different behavior: PCA markedly improves Isolation Forest, increasing AUROC, while only slightly affecting the other detectors. Overall, OCSVM, LOF, and OC-PCA generally favor the original features, whereas Isolation Forest benefits more from dimensionality reduction. Accordingly, No PCA was retained for ConvNeXt and Wide ResNet-50-2, while 99% retained variance was selected for VGG-19.
Performance of Backbone–Detector Combinations
Table 7 compares the three CNN backbones under the selected feature layer, PCA configuration, and threshold calibration strategy.
Table 7.
Performance comparison of the evaluated CNN backbones under the selected experimental configuration (mean ± standard deviation, %) on the MVTec AD Carpet dataset.
Across all evaluated one-class anomaly detection models, ConvNeXt consistently achieves the highest performance. These results indicate that the features extracted by ConvNeXt provide the strongest separation between normal and defective samples.
Wide ResNet-50-2 also demonstrates stable performance across the evaluated detectors, with only minor variations between models. However, its accuracy and F1-score remain consistently lower than those of ConvNeXt, indicating that its feature representations are slightly less discriminative.
VGG-19 exhibits the lowest overall performance and the largest variability across anomaly detection models, highlighting the limited robustness of the VGG-19 feature representation.
Overall, these results demonstrate that the choice of feature extractor has a greater influence on the final detection performance than the choice of the one-class anomaly detection model.
Analysis of the Best Configuration
The normalized confusion matrix presented in Table 8 provides further insight into the behavior of the best-performing anomaly detection configuration.
Table 8.
Normalized confusion matrix (%) obtained for the best-performing configuration on the MVTec AD Carpet dataset.
To further position the proposed Stage 1 with respect to recent anomaly detection approaches, a comparative analysis was conducted on the MVTec AD Carpet dataset. To ensure a meaningful comparison, the evaluation was performed using the official train/test split provided by the MVTec AD benchmark, following the same evaluation protocol adopted in the studies listed in Table 9.
Table 9.
Comparison of AUROC performance obtained by the proposed framework and recent state-of-the-art anomaly detection methods on the MVTec AD Carpet dataset.
The AUROC values reported for the competing methods were taken from their respective publications, which followed the official MVTec AD evaluation protocol.
As shown in Table 9, the proposed framework demonstrates excellent anomaly detection performance on the MVTec AD Carpet benchmark. Its performance is comparable to the best-performing methods reported in the literature.
Although the comparison is based on results reported in the original publications rather than on a unified reimplementation, it provides a useful benchmark to position the proposed framework with respect to existing state-of-the-art methods evaluated under the same official dataset protocol.
8.1.2. Results on the Proposed Industrial Carpet Dataset
The performance of the proposed Stage 1 anomaly detection pipeline is evaluated on the proposed industrial carpet dataset through a systematic comparison of feature extraction backbones, PCA preprocessing configurations, and one-class anomaly detection models. The best-performing configuration is then analyzed in detail and compared with representative state-of-the-art anomaly detection approaches.
Effect of Feature Extraction Layer
Figure 9 presents the image-level AUROC obtained from different feature extraction layers for each CNN backbone and one-class anomaly detection model on the proposed industrial carpet dataset.
Figure 9.
Image-level AUROC (%) of the four anomaly detection models across candidate feature layers, per backbone. Bold labels indicate the feature layer selected for each backbone.
Figure 9 shows a different trend from that observed on the MVTec AD dataset. While ConvNeXt and Wide ResNet-50-2 benefit from the deepest feature representations on MVTec AD, VGG-19 performs best at an intermediate level (Block 3). In contrast, the industrial dataset favors earlier feature layers for both Wide ResNet-50-2 and VGG-19. This difference is likely explained by the greater visual diversity of the industrial dataset, which contains carpet tiles with varying designs, colors, and textures. Deep features tend to capture high-level pattern information, making normal design variations more likely to be interpreted as anomalies. In contrast, lower-level features focus on local texture characteristics and are therefore more robust to the natural variability among defect-free carpet tiles.
OC-PCA is consistently the most robust model to layer depth across all three backbones, occasionally favoring deeper layers than the other three detectors. This follows from its reconstruction-based formulation, which models the principal directions of variance in the normal distribution as a whole, making it less sensitive to local distortions than Isolation Forest, OCSVM, and LOF, which rely more directly on local distances or density.
Accordingly, Stage 4, Block 2, and Layer 1 were retained for ConvNeXt, VGG-19, and Wide ResNet-50-2, respectively, for the remaining experiments.
Effect of PCA Preprocessing
Table 10 reports the AUROC obtained under different PCA preprocessing configurations using the selected feature layer for each backbone on the proposed industrial carpet dataset.
Table 10.
Effect of PCA preprocessing on image-level AUROC for the selected feature layer of each CNN backbone and one-class anomaly detection model on the proposed industrial carpet dataset.
Overall, a behavior similar to that observed on the MVTec AD dataset is obtained. OCSVM and LOF consistently achieve their highest AUROC without PCA preprocessing across all three backbones, with performance generally degrading as dimensionality reduction becomes more aggressive. Likewise, OC-PCA achieves its best performance using the original feature representation, indicating that additional dimensionality reduction provides no benefit for this model. In contrast, Isolation Forest exhibits a different behavior, consistently benefiting from PCA with 99% retained variance.
Performance of Backbone–Detector Combinations
Table 11 compares the anomaly detection performance obtained by the evaluated backbone–detector combinations.
Table 11.
Performance comparison of the evaluated CNN backbones under the selected experimental configuration on the proposed industrial carpet dataset (mean ± standard deviation, %).
Overall, the results demonstrate that both the feature extraction backbone and the anomaly detection model significantly influence the final detection performance. ConvNeXt consistently provides the most discriminative feature representation, while OC-PCA achieves the best overall performance across the evaluated backbones, highlighting its robustness for modeling the distribution of normal industrial samples. In contrast, the remaining anomaly detection models exhibit greater sensitivity to the selected feature representation, leading to larger performance variations across backbones.
Analysis of the Best Configuration
To further assess the discrimination capability of the selected Stage 1 anomaly detector on the industrial carpet dataset, both receiver operating characteristic and precision–recall analyses are presented in Figure 10.
Figure 10.
Threshold-independent evaluation of the selected Stage 1 anomaly detection configuration on the industrial carpet dataset.
The AUROC indicates that the anomaly scores preserve a strong global ranking between defect-free and defective samples, suggesting that the learned feature representation captures discriminative characteristics of carpet defects despite the considerable variability of the industrial dataset.
The precision–recall curve further highlights the practical behavior of the detector under different decision thresholds. High precision is maintained over most of the recall range, indicating that the detector can substantially increase defect detection while introducing only a limited number of false alarms. As the threshold is progressively relaxed to maximize recall, precision decreases, reflecting the inevitable trade-off between minimizing missed defects and increasing operator inspections.
Table 12 presents the normalized confusion matrix obtained using the best-performing anomaly detection configuration.
Table 12.
Normalized confusion matrix (%) obtained for the best-performing anomaly detection configuration on the proposed industrial carpet dataset.
The results indicate that the proposed framework successfully separates normal and defective samples while maintaining a balanced trade-off between sensitivity and specificity. The remaining misclassifications mainly reflect the intrinsic visual similarity between subtle defects and defect-free carpet regions.
Table 13 compares the proposed framework against several state-of-the-art anomaly detection methods on the industrial carpet dataset. For the proposed framework, latency and throughput are measured for Stage 1 only, which includes feature extraction, standardization, and anomaly detection.
Table 13.
Comparison with state-of-the-art anomaly detection methods on the proposed industrial carpet dataset: detection performance (AUROC) and computational cost.
The proposed anomaly detection approach achieves competitive detection performance on the proposed industrial carpet dataset while maintaining a reasonable computational cost. Although it does not attain the highest AUROC among the evaluated methods, it provides a balanced compromise between detection accuracy and inference efficiency.
8.2. Stage 2—Defect Classification Results
To evaluate the discriminative capability of the extracted deep features, multiclass defect classification models were assessed independently using defective samples only.
8.2.1. Results on MVTec AD Carpet
In this setting, the defect categories provided by the benchmark dataset were used as target classes, allowing the evaluation of the discriminative capability of the extracted feature representations and the investigated classifiers.
Effect of Feature Extraction Layer
Figure 11 illustrates the effect of the feature extraction layer on the Macro-F1 score for the evaluated classifiers on the MVTec AD Carpet dataset.
Figure 11.
Macro-F1 (%) of the four defect classifiers across candidate feature layers, per backbone. Bold labels indicate the feature layer selected for each backbone.
All four classifiers exhibit a broadly similar trend within each backbone, indicating that the influence of the feature extraction depth is largely independent of the classifier.
For ConvNeXt, the Macro-F1 score increases markedly from Stages 1–2 to the deeper representations, with the best performance consistently obtained at Stage 3 for SVM and LDA.
For Wide ResNet-50-2, performance generally improves with network depth, with Layer 4 consistently providing the highest Macro-F1 regardless of the classifier. In contrast, VGG-19 reaches its best performance at Block 4 for Random Forest, the best-performing classifier on this backbone before decreasing at Block 5, indicating that the deepest representation does not further improve class separability. Accordingly, Layer 4 and Block 4 were selected for Wide ResNet-50-2 and VGG-19, respectively.
Effect of PCA Preprocessing
Table 14 summarizes the effect of PCA preprocessing on the Macro-F1 score using the selected feature layer for each backbone. Unlike the anomaly detection task, the influence of PCA varies considerably across both the backbone architecture and the classifier.
Table 14.
Mean Macro-F1 (%) obtained for each defect classifier across PCA preprocessing configurations on the MVTec AD Carpet dataset.
For ConvNeXt, the original feature representation provides the best overall performance for SVM, Random Forest, and k-NN, while LDA benefits from dimensionality reduction with 90% retained variance. Wide ResNet-50-2 exhibits mixed behavior, with SVM slightly benefiting from PCA, whereas Random Forest and k-NN consistently achieve their highest Macro-F1 without dimensionality reduction. Similarly, VGG-19 shows classifier-dependent behavior: PCA improves SVM, but degrades the performance of Random Forest and LDA, while having only a marginal effect on k-NN.
Overall, PCA does not provide a consistent improvement across the evaluated classifiers and backbones. Since the observed gains are model-dependent and are generally accompanied by performance degradation for other classifiers, the original feature representations (No PCA) were retained for all subsequent multiclass classification experiments.
Performance of Backbone–Classifier Combinations
Table 15 compares the multiclass defect classification performance of the evaluated CNN backbones using the selected feature layer and PCA configuration.
Table 15.
Multiclass defect classification performance of the evaluated CNN backbones using the selected feature layer and PCA configuration on the MVTec AD Carpet dataset.
ConvNeXt consistently provides the most discriminative feature representation, achieving the highest performance for SVM, LDA, and k-NN across all evaluation metrics.
Wide ResNet-50-2 exhibits comparatively stable performance across the evaluated classifiers but remains consistently below ConvNeXt. In contrast, VGG-19 shows larger performance variations depending on the classifier, although Random Forest achieves competitive results on this backbone.
Overall, ConvNeXt demonstrates the best generalization capability across different classifiers. Wide ResNet-50-2 provides relatively stable performance across classifiers, whereas VGG-19 exhibits larger variations.
Confusion Matrix Analysis
Table 16 presents the normalized confusion matrix obtained using the best-performing classification configuration, namely ConvNeXt combined with SVM.
Table 16.
Normalized confusion matrix obtained using ConvNeXt and SVM on the MVTec AD Carpet dataset (%).
The confusion matrix confirms that most defect categories are correctly identified, with only limited confusion observed between visually similar anomaly types.
8.2.2. Results on the Proposed Industrial Carpet Dataset
The second stage was evaluated on the industrial carpet defect dataset containing four defect categories (Backing Seam, Bad Mend, Dirty Face, and End Out). Unlike the MVTec AD benchmark, this dataset exhibits substantial class imbalance and visually similar defect categories, making multiclass discrimination considerably more challenging. The evaluation therefore focuses on identifying the most discriminative feature representations, assessing the influence of PCA preprocessing, comparing classifier performance, and analyzing the remaining inter-class confusions.
Effect of Feature Extraction Layer
Figure 12 illustrates the influence of the feature extraction layer on the Macro-F1 score obtained by the evaluated classifiers on the industrial carpet defect dataset.
Figure 12.
Macro-F1 (%) of the four defect classifiers across candidate feature layers on the industrial carpet defect dataset. Bold labels indicate the feature layer selected for each backbone.
ConvNeXt exhibits the most pronounced improvement as the network depth increases. Stage 4 consistently offers the most discriminative feature representation and was therefore retained for the subsequent experiments.
Wide ResNet-50-2 also benefits from progressively deeper representations. Performance improves steadily from Layer 1 to Layer 4 for all classifiers, indicating that high-level semantic features are more suitable for distinguishing the visually similar industrial defect categories. Consequently, Layer 4 was selected for the remaining experiments.
In contrast, VGG-19 shows a different behavior. The performance increases up to Block 4 but slightly decreases at Block 5 for most classifiers, suggesting that the deepest convolutional features become less discriminative for this task. Therefore, Block 4 provides the best trade-off between representation quality and class separability.
Across the three evaluated backbones, ConvNeXt consistently achieves the highest overall performance, demonstrating its superior ability to extract discriminative representations for complex industrial carpet defects. Wide ResNet-50-2 exhibits stable behavior with progressively improving performance as the network depth increases, whereas VGG-19 remains more sensitive to the selected feature layer.
Effect of PCA Preprocessing
Table 17 summarizes the effect of PCA preprocessing on the Macro-F1 score using the selected feature layer for each backbone. In contrast to the layer selection analysis, the influence of PCA is strongly dependent on both the backbone architecture and the classifier, indicating that dimensionality reduction affects the extracted feature representations differently across learning algorithms.
Table 17.
Mean Macro-F1 (%) obtained for each defect classifier across PCA preprocessing configurations using the selected feature layer for each backbone on the industrial carpet defect dataset.
For ConvNeXt, PCA generally improves the performance of most classifiers. The largest improvement is observed for LDA, which substantially benefits from dimensionality reduction, while Random Forest and k-NN also achieve higher Macro-F1 scores after PCA. In contrast, SVM exhibits only a marginal variation across the evaluated PCA configurations, with the highest performance obtained using the largest retained variance.
Wide ResNet-50-2 exhibits a more heterogeneous behavior. SVM and LDA consistently benefit from PCA, suggesting that reducing feature redundancy facilitates the construction of more discriminative decision boundaries. Conversely, Random Forest achieves its best performance without dimensionality reduction, whereas k-NN shows only moderate improvements.
A similar classifier-dependent behavior is observed for VGG-19. PCA clearly improves the performance of LDA and slightly enhances both SVM and Random Forest. The influence on k-NN remains relatively limited, indicating that the original feature space already preserves most of the neighborhood structure required by the classifier.
Overall, no single PCA configuration consistently provides the highest performance across all backbone–classifier combinations. Since the optimal retained variance varies depending on both the extracted feature representation and the classification algorithm, the best-performing PCA configuration was selected individually for each classifier in the subsequent experiments.
Performance of Backbone–Classifier Combinations
Table 18 compares the multiclass defect classification performance of the evaluated CNN backbones using the selected feature layer and PCA configuration for each classifier.
Table 18.
Multiclass defect classification performance of the evaluated CNN backbones using the selected feature layer and PCA configuration on the industrial carpet defect dataset.
ConvNeXt provides the most discriminative feature representation overall. When combined with SVM, it achieves the best performance across all reported metrics. The remaining classifiers also produce relatively strong and consistent results with ConvNeXt, indicating that the extracted representation preserves class-discriminative information independently of the selected classification algorithm. Among these alternatives, LDA provides the closest performance to SVM, whereas Random Forest and k-NN exhibit slightly lower but comparable results.
Wide ResNet-50-2 shows stable performance across the four classifiers, with relatively limited differences between the evaluated combinations. LDA provides the strongest overall results for this backbone, achieving the best accuracy, precision, and recall. Random Forest and k-NN also remain competitive, suggesting that the deeper Wide ResNet-50-2 representation provides a relatively robust feature space for different classification strategies.
VGG-19 obtains lower overall performance than ConvNeXt and Wide ResNet-50-2. Random Forest provides the best accuracy and recall for this backbone, whereas LDA achieves the highest precision but exhibits a lower recall. This imbalance indicates that LDA produces more conservative predictions, correctly identifying a relatively high proportion of its positive predictions while failing to recover a larger number of samples from some defect categories.
Consequently, ConvNeXt combined with SVM was retained as the best-performing Stage II configuration for the subsequent per-class and confusion-matrix analyses.
Confusion Matrix Analysis
Table 19 presents the normalized confusion matrix obtained using the best-performing Stage 2 configuration, namely ConvNeXt combined with SVM.
Table 19.
Normalized confusion matrix obtained using the best-performing Stage 2 configuration (ConvNeXt + SVM) on the industrial carpet defect dataset (%).
The confusion matrix confirms that the proposed framework successfully distinguishes most defect categories despite the significant visual similarity between several industrial defects. Backing Seam is recognized with the highest accuracy, indicating that this defect exhibits distinctive visual characteristics that are consistently captured by the extracted feature representation. Bad Mend and Dirty Face are also identified with high reliability, although a limited number of samples are confused with other defect categories.
The largest remaining confusion occurs between the Bad Mend and End Out classes. While most Bad Mend samples are correctly classified, a noticeable proportion of End Out samples are predicted as Bad Mend. This asymmetric confusion suggests that a subset of End Out defects shares visual characteristics with Bad Mend, making these two categories particularly difficult to separate using appearance-based features alone.
8.3. End-to-End Pipeline Evaluation
The complete two-stage framework was subsequently evaluated by combining the anomaly detection and defect classification stages. In this setting, samples identified as defective during Stage 1 are forwarded to Stage 2 for defect categorization.
8.3.1. End-to-End Evaluation on MVTec AD
Table 20 summarizes the performance of the complete two-stage inspection pipeline on the MVTec AD Carpet dataset.
Table 20.
End-to-end performance of the proposed two-stage inspection framework on the MVTec AD Carpet dataset.
The complete pipeline achieves an end-to-end accuracy of 92.49%. The difference between the standalone Stage 2 performance and the end-to-end results is primarily explained by error propagation between the two stages. While the anomaly detector introduces only a negligible number of false negatives, the majority of end-to-end errors originate from defect categorization, with 17.30% of defective samples assigned to an incorrect defect class after being correctly detected.
From an industrial perspective, these results indicate that the proposed architecture effectively prioritizes defect detection over defect categorization. Since undetected defects represent the most critical failure mode in automated quality inspection, the near-perfect recall achieved by Stage 1 ensures that almost no defective carpet bypasses the inspection process.
The error distribution of the complete pipeline is further analyzed through the normalized confusion matrix presented in Table 21.
Table 21.
Normalized end-to-end confusion matrix (%) combining Stage 1 anomaly detection and Stage 2 defect classification on the MVTec AD Carpet dataset.
8.3.2. End-to-End Evaluation on the Proposed Industrial Carpet Dataset
Table 22 summarizes the end-to-end performance obtained on the proposed industrial carpet dataset.
Table 22.
End-to-end performance of the proposed two-stage inspection framework on the industrial carpet defect dataset.
Table 23 presents the corresponding normalized confusion matrix.
Table 23.
Normalized end-to-end confusion matrix combining Stage 1 anomaly detection and Stage 2 defect classification on the proposed industrial carpet dataset (%).
The end-to-end confusion matrix indicates that a substantial proportion of the residual errors corresponds to defective samples that are ultimately assigned to the Good class. Since the final prediction combines the outputs of both the anomaly detection and defect classification stages, these samples are not successfully propagated through the complete inspection pipeline and therefore cannot be correctly categorized. This effect is particularly evident for the End Out category, which exhibits the lowest end-to-end recognition performance among the four defect categories, highlighting the greater difficulty of detecting and recognizing this defect type under realistic industrial conditions.
Conversely, Backing Seam achieves the highest recognition performance, suggesting that its visual characteristics are more distinctive and therefore easier to separate from both defect-free carpet tiles and the remaining defect categories. Beyond the errors associated with missed detections, most residual classification errors occur between Bad Mend and End Out, which are confused with each other more frequently than with any other category pair. This observation suggests that these two defect types share similar visual characteristics that remain challenging to discriminate, even after successful anomaly detection. Dirty Face occupies an intermediate position, achieving relatively reliable classification once identified as anomalous, while still exhibiting a noticeable number of samples that are either missed by the overall pipeline or confused with visually similar defect categories.
Figure 13 presents representative failure cases corresponding to the most frequent misclassifications observed on the proposed industrial carpet dataset. The first example shows a Bad Mend defect misclassified as End Out, while the remaining examples illustrate Dirty Face defects misclassified as Bad Mend and End Out, respectively.
Figure 13.
Representative failure cases of the proposed framework on the industrial carpet dataset.
These failure cases suggest that the classification errors mainly occur between defect categories sharing similar visual characteristics. In particular, the Bad Mend sample exhibits a localized texture disruption that closely resembles the appearance of an End Out defect. Likewise, the diffuse texture variations observed in Dirty Face defects can visually resemble both yarn irregularities and missing yarn patterns, leading to confusion with Bad Mend and End Out. These observations are consistent with the confusion matrix analysis and highlight the challenge of discriminating visually similar defect types.
To evaluate the computational efficiency of the proposed framework, Table 24 reports the inference time per image and memory footprint of each processing stage. Runtime profiling was performed on an NVIDIA Tesla P100 GPU (NVIDIA Corporation, Santa Clara, CA, USA) using a batch size of 1 for feature extraction, while all subsequent processing stages were executed on the CPU.
Table 24.
Inference time per image and memory footprint for each stage of the proposed framework, measured on an NVIDIA Tesla P100 GPU for feature extraction and CPU for all downstream stages.
Table 24 shows that feature extraction is the dominant computational stage, accounting for the vast majority of both inference time and memory consumption. This is expected since the pretrained ConvNeXt backbone performs high-dimensional feature extraction from the input image. In contrast, the downstream processing stages, including feature standardization, anomaly detection using OC-PCA, and defect classification using SVM, introduce only a negligible computational overhead, each requiring less than 0.5 ms per image and minimal additional memory.
9. Conclusions and Future Work
This paper introduced a new industrial carpet defect dataset comprising defect-free samples and four representative defect categories acquired under real manufacturing conditions. By incorporating diverse carpet textures, colors, motifs, and defect characteristics, the dataset provides a realistic benchmark for evaluating automated carpet inspection systems and helps address the limited availability of publicly accessible datasets dedicated to industrial carpet inspection. Building upon this dataset, the paper also presented an engineering study of a practical two-stage inspection framework that integrates established components into a unified pipeline tailored to the operational constraints of carpet manufacturing. The proposed framework demonstrates how these complementary techniques can be effectively combined to support reliable industrial carpet quality inspection.
Extensive experiments were conducted on both the MVTec AD Carpet dataset and the proposed industrial carpet dataset using multiple deep feature extraction backbones and lightweight machine learning models. The results demonstrated the strong impact of feature representation quality on inspection performance. Among the evaluated architectures, ConvNeXt consistently achieved the highest defect classification performance. The experimental findings further confirmed the effectiveness of combining one-class anomaly detection and supervised defect classification within a single framework, enabling reliable defect screening while providing detailed defect categorization for quality-control decision making.
The comparative evaluation conducted on both datasets also highlighted the substantial gap between benchmark datasets and real manufacturing environments. While publicly available datasets provide valuable evaluation platforms, they often fail to capture the variability and complexity encountered in industrial production settings. The results obtained on the proposed industrial dataset emphasize the importance of validating inspection systems on representative industrial data in order to obtain realistic estimates of deployment performance.
Although the proposed framework achieved encouraging results on both the MVTec AD benchmark and the proposed industrial dataset, the lower performance observed on the industrial dataset compared with the MVTec AD benchmark suggests that real manufacturing environments remain considerably more challenging for automated inspection. Consequently, additional validation under diverse industrial conditions is required before broad industrial generalization can be established.
Another limitation concerns the threshold calibration strategy adopted for anomaly detection. The percentile-based threshold used in this study offers a practical solution, but it does not explicitly optimize the trade-off between false positives and false negatives according to their respective operational costs. In industrial carpet inspection, these costs are application-dependent, as missing a defective product and unnecessarily rejecting a defect-free product can have different economic consequences. Future work will therefore investigate cost-aware threshold calibration strategies capable of selecting operating points that better reflect production and quality-control objectives.
An additional limitation concerns the image-level cross-validation protocol adopted in this study. Because the partitions were not grouped by carpet design, images corresponding to the same design may occur in both training and test folds. Consequently, the reported results characterize generalization to unseen images under the represented design distribution rather than generalization to entirely unseen carpet designs. Future work will investigate grouped design-level validation to assess cross-design robustness more explicitly.
Future work will focus on extending the proposed dataset with additional carpet structures, colors, patterns, and defect categories to further increase its representativeness. It will also investigate extending the current single-label annotation protocol to a multi-label annotation framework capable of representing carpet tiles containing multiple co-occurring defect types. Future research will also investigate adaptive and cost-sensitive threshold calibration strategies that explicitly account for the operational costs associated with false positives and false negatives under different manufacturing scenarios. Finally, the proposed framework will be evaluated in real time on industrial production lines and further assessed using recent self-supervised and foundation model-based feature representation techniques to improve robustness across diverse manufacturing environments.
Author Contributions
Conceptualization, Y.Y.; methodology, O.N. and Y.Y.; software, O.N.; validation, O.N. and Y.Y.; formal analysis, Y.Y.; investigation, O.N.; resources, Y.Y.; data curation, O.N.; writing—original draft preparation, O.N.; writing—review and editing, O.N. and Y.Y.; visualization, O.N. and Y.Y.; supervision, Y.Y.; project administration, Y.Y.; funding acquisition, Y.Y. All authors have read and agreed to the published version of the manuscript.
Funding
This research was funded by Mitacs Accelerate under Grant No. IT48325, in collaboration with Université du Québec à Rimouski (UQAR) and Venture Carpets Inc. The APC was fully waived by the publisher.
Institutional Review Board Statement
Not applicable.
Informed Consent Statement
Not applicable.
Data Availability Statement
The MVTec AD dataset used in this study is publicly available at https://www.mvtec.com/company/research/datasets/mvtec-ad (accessed on 14 July 2025). The industrial carpet defect dataset introduced in this study will be deposited in a public research data repository in conjunction with the publication of this article. The dataset record and associated metadata will be publicly accessible, while access to the data files will be managed through a controlled-access procedure. Interested researchers will be required to submit an access request and sign a data-use agreement specifying the conditions governing the use, storage, confidentiality, and redistribution of the data. Access will be granted for legitimate academic and non-commercial research purposes, subject to compliance with these conditions.
Acknowledgments
The authors would like to thank Venture Carpets Inc. for its collaboration and technical support during the image acquisition and dataset construction phases of this work. The authors also acknowledge the creators of the MVTec AD dataset for making this valuable benchmark publicly available to the research community. During the preparation of this manuscript, the authors used ChatGPT (OpenAI, GPT-5.5) for language editing, grammar correction, and readability improvement. The authors have reviewed and edited the output and take full responsibility for the content of this publication.
Conflicts of Interest
The authors declare no conflicts of interest.
Abbreviations
The following abbreviations are used in this manuscript:
| ANN | Artificial Neural Network |
| AUROC | Area Under the Receiver Operating Characteristic Curve |
| CNN | Convolutional Neural Network |
| DCT | Discrete Curvelet Transform |
| FFT | Fast Fourier Transform |
| GLCM | Gray-Level Co-occurrence Matrix |
| IF | Isolation Forest |
| k-NN | k-Nearest Neighbors |
| LDA | Linear Discriminant Analysis |
| LOF | Local Outlier Factor |
| ML | Machine Learning |
| MVTec AD | MVTec Anomaly Detection Dataset |
| OCBE | One-Class Bottleneck Embedding |
| OC-PCA | One-Class Principal Component Analysis |
| OCSVM | One-Class Support Vector Machine |
| PCA | Principal Component Analysis |
| RF | Random Forest |
| SVM | Support Vector Machine |
References
- Hamrol, A.; Grabowska, M. Quality in the Era of Industry 4.0—Quality Management Principles in the Context of the Fourth Industrial Revolution. Appl. Sci. 2026, 16, 1919. [Google Scholar] [CrossRef] [Scilit]
- Markatos, N.G.; Mousavi, A. Manufacturing quality assessment in the industry 4.0 era: A review. Total Qual. Manag. Bus. Excell. 2023, 34, 1655–1681. [Google Scholar] [CrossRef] [Scilit]
- Ngan, H.Y.; Pang, G.K.; Yung, N.H. Automated fabric defect detection—A review. Image Vis. Comput. 2011, 29, 442–458. [Google Scholar] [CrossRef] [Scilit]
- Kumar, A. Computer-vision-based fabric defect detection: A survey. IEEE Trans. Ind. Electron. 2008, 55, 348–363. [Google Scholar] [CrossRef] [Scilit]
- Forsberg, B.; Williams, D.H.; MacDonald, P.B.; Chen, T.; Hulse, D.K. Textile Anomaly Detection: Evaluation of the State-of-the-Art for Automated Quality Inspection of Carpet. arXiv 2024, arXiv:2407.18450. [Google Scholar] [CrossRef] [Scilit]
- Ozek, A.; Seckin, M.; Demircioglu, P.; Bogrekci, I. Artificial intelligence driving innovation in textile defect detection. Textiles 2025, 5, 12. [Google Scholar] [CrossRef] [Scilit]
- Hanbay, K.; Talu, M.F.; Özgüven, Ö.F. Fabric defect detection systems and methods—A systematic literature review. Optik 2016, 127, 11960–11973. [Google Scholar] [CrossRef] [Scilit]
- Mahmud, T.; Sikder, J.; Chakma, R.J.; Fardoush, J. Fabric defect detection system. In Proceedings of the International Conference on Intelligent Computing & Optimization; Springer: Cham, Switzerland, 2020; pp. 788–800. [Google Scholar] [CrossRef] [Scilit]
- Ramzan, M.B.; Qureshi, S.M.; Habib, M.S.; Naveed, T.; Awais, M.; Jamshaid, H. Evaluation of human factors on visual inspection skills in textiles and clothing: A statistical approach. J. Eng. Fibers Fabr. 2022, 17, 15589250221128115. [Google Scholar] [CrossRef] [Scilit]
- Defard, T.; Setkov, A.; Loesch, A.; Audigier, R. Padim: A patch distribution modeling framework for anomaly detection and localization. In Proceedings of the International Conference on Pattern Recognition; Springer: Cham, Switzerland, 2021; pp. 475–489. [Google Scholar] [CrossRef] [Scilit]
- Roth, K.; Pemula, L.; Zepeda, J.; Schölkopf, B.; Brox, T.; Gehler, P. Towards total recall in industrial anomaly detection. In Proceedings of the IEEE/CVF Conference on Computer Vision and Pattern Recognition; IEEE: New York, NY, USA, 2022; pp. 14318–14328. [Google Scholar] [CrossRef] [Scilit]
- Li, M.; Wan, S.; Deng, Z.; Wang, Y. Fabric defect detection based on saliency histogram features. Comput. Intell. 2019, 35, 517–534. [Google Scholar] [CrossRef] [Scilit]
- Bergmann, P.; Fauser, M.; Sattlegger, D.; Steger, C. MVTec AD–A comprehensive real-world dataset for unsupervised anomaly detection. In Proceedings of the IEEE/CVF Conference on Computer Vision and Pattern Recognition; IEEE: New York, NY, USA, 2019; pp. 9592–9600. [Google Scholar] [CrossRef] [Scilit]
- Machado, R.; Barros, L.A.; Vieira, V.; Silva, F.D.d.; Costa, H.; Carvalho, V. Textile defect detection using artificial intelligence and computer vision—A preliminary deep learning approach. Electronics 2025, 14, 3692. [Google Scholar] [CrossRef] [Scilit]
- He, F.; Xin, B.; Zhan, Z.; Yang, W.; Liu, J. A review of fabric defect detection in textile manufacturing. J. Text. Inst. 2026, 117, 327–345. [Google Scholar] [CrossRef] [Scilit]
- Chan, C.H.; Pang, G.K. Fabric defect detection by Fourier analysis. IEEE Trans. Ind. Appl. 2000, 36, 1267–1276. [Google Scholar] [CrossRef] [Scilit]
- Malek, A.S. Online Fabric Inspection by Image Processing Technology. Ph.D. Thesis, Université de Haute Alsace-Mulhouse, Mulhouse, France, 2012. [Google Scholar]
- Bodnarova, A.; Bennamoun, M.; Latham, S. Optimal Gabor filters for textile flaw detection. Pattern Recognit. 2002, 35, 2973–2991. [Google Scholar] [CrossRef] [Scilit]
- Zhu, R.; Xin, B.; Deng, N.; Fan, M. Fabric defect detection using ACS-based thresholding and GA-based optimal Gabor filter. J. Text. Inst. 2024, 115, 1432–1446. [Google Scholar] [CrossRef] [Scilit]
- Deng, H.; Li, X. Anomaly detection via reverse distillation from one-class embedding. In Proceedings of the IEEE/CVF Conference on Computer Vision and Pattern Recognition; IEEE: New York, NY, USA, 2022; pp. 9737–9746. [Google Scholar] [CrossRef] [Scilit]
- Bergmann, P.; Fauser, M.; Sattlegger, D.; Steger, C. Uninformed students: Student-teacher anomaly detection with discriminative latent embeddings. In Proceedings of the IEEE/CVF Conference on Computer Vision and Pattern Recognition; IEEE: New York, NY, USA, 2020; pp. 4183–4192. [Google Scholar] [CrossRef] [Scilit]
- Hou, J.; Zhang, Y.; Zhong, Q.; Xie, D.; Pu, S.; Zhou, H. Divide-and-assemble: Learning block-wise memory for unsupervised anomaly detection. In Proceedings of the IEEE/CVF International Conference on Computer Vision; IEEE: New York, NY, USA, 2021; pp. 8791–8800. [Google Scholar] [CrossRef] [Scilit]
- Akcay, S.; Atapour-Abarghouei, A.; Breckon, T.P. Ganomaly: Semi-supervised anomaly detection via adversarial training. In Proceedings of the Asian Conference on Computer Vision; Springer: Cham, Switzerland, 2018; pp. 622–637. [Google Scholar] [CrossRef] [Scilit]
- Yi, J.; Yoon, S. Patch svdd: Patch-level svdd for anomaly detection and segmentation. In Proceedings of the Asian Conference on Computer Vision; Springer: Cham, Switzerland, 2020; pp. 375–390. [Google Scholar] [CrossRef] [Scilit]
- Li, C.L.; Sohn, K.; Yoon, J.; Pfister, T. Cutpaste: Self-supervised learning for anomaly detection and localization. In Proceedings of the IEEE/CVF Conference on Computer Vision and Pattern Recognition; IEEE: New York, NY, USA, 2021; pp. 9664–9674. [Google Scholar] [CrossRef] [Scilit]
- Hanbay, K.; Talu, M.F.; Özgüven, Ö.F.; Öztürk, D. Real-time detection of knitting fabric defects using shearlet transform. Text. Appar. 2019, 29, 1–10. [Google Scholar] [CrossRef] [Scilit]
- Anandan, P.; Sabeenian, R. Fabric defect detection using discrete curvelet transform. Procedia Comput. Sci. 2018, 133, 1056–1065. [Google Scholar] [CrossRef] [Scilit]
- Yaşar Çıklaçandır, F.G.; Utku, S.; Özdemir, H. Determination of various fabric defects using different machine learning techniques. J. Text. Inst. 2024, 115, 733–743. [Google Scholar] [CrossRef] [Scilit]
- Barzizza, E.; Biasetton, N.; Ceccato, R.; Molena, A. Machine learning-based decision-making approach for predicting defects detection: A case study. IAES Int. J. Artif. Intell. 2024, 13, 3052–3060. [Google Scholar] [CrossRef] [Scilit]
- Mewada, H.; Pires, I.M.; Engineer, P.; Patel, A.V. Fabric surface defect classification and systematic analysis using a cuckoo search optimized deep residual network. Eng. Sci. Technol. Int. J. 2024, 53, 101681. [Google Scholar] [CrossRef] [Scilit]
- Singh, S.A.; Desai, K.A. Automated surface defect detection framework using machine vision and convolutional neural networks. J. Intell. Manuf. 2023, 34, 1995–2011. [Google Scholar] [CrossRef] [Scilit]
- Mohammed, S.S.; Clarke, H.G. A hybrid machine learning approach to fabric defect detection and classification. In Proceedings of the International Congress of Electrical and Computer Engineering; Springer: Cham, Switzerland, 2022; pp. 135–147. [Google Scholar] [CrossRef] [Scilit] [PubMed]
- Erkinov, A. Data Collection for Training Quality-Control AI in Carpet Manufacturing. arXiv 2026, arXiv:2606.01023. [Google Scholar] [CrossRef] [Scilit]
- Zhang, C.; Han, D.; Qiao, Y.; Kim, J.U.; Bae, S.H.; Lee, S.; Hong, C.S. Faster segment anything: Towards lightweight sam for mobile applications. arXiv 2023, arXiv:2306.14289. [Google Scholar] [CrossRef] [Scilit]
- Simonyan, K.; Zisserman, A. Very deep convolutional networks for large-scale image recognition. arXiv 2014, arXiv:1409.1556. [Google Scholar] [CrossRef] [Scilit]
- Liu, Z.; Mao, H.; Wu, C.Y.; Feichtenhofer, C.; Darrell, T.; Xie, S. A convnet for the 2020s. In Proceedings of the IEEE/CVF Conference on Computer Vision and Pattern Recognition; IEEE: New York, NY, USA, 2022; pp. 11976–11986. [Google Scholar] [CrossRef] [Scilit]
- Zagoruyko, S.; Komodakis, N. Wide residual networks. arXiv 2016, arXiv:1605.07146. [Google Scholar] [CrossRef] [Scilit]
- Liu, F.T.; Ting, K.M.; Zhou, Z.H. Isolation forest. In Proceedings of the 2008 Eighth IEEE International Conference on Data Mining; IEEE: New York, NY, USA, 2008; pp. 413–422. [Google Scholar] [CrossRef] [Scilit]
- Schölkopf, B.; Platt, J.C.; Shawe-Taylor, J.; Smola, A.J.; Williamson, R.C. Estimating the support of a high-dimensional distribution. Neural Comput. 2001, 13, 1443–1471. [Google Scholar] [CrossRef] [Scilit] [PubMed]
- Breunig, M.M.; Kriegel, H.P.; Ng, R.T.; Sander, J. LOF: Identifying density-based local outliers. In Proceedings of the 2000 ACM SIGMOD International Conference on Management of Data; ACM: New York, NY, USA, 2000; pp. 93–104. [Google Scholar] [CrossRef] [Scilit]
- Cortes, C.; Vapnik, V. Support-vector networks. Mach. Learn. 1995, 20, 273–297. [Google Scholar] [CrossRef] [Scilit]
- Breiman, L. Random forests. Mach. Learn. 2001, 45, 5–32. [Google Scholar] [CrossRef] [Scilit]
- Cover, T.; Hart, P. Nearest neighbor pattern classification. IEEE Trans. Inf. Theory 1967, 13, 21–27. [Google Scholar] [CrossRef] [Scilit]
- Fisher, R.A. The use of multiple measurements in taxonomic problems. Ann. Eugen. 1936, 7, 179–188. [Google Scholar] [CrossRef] [Scilit]
- Golan, I.; El-Yaniv, R. Deep anomaly detection using geometric transformations. Adv. Neural Inf. Process. Syst. 2018, 31. [Google Scholar] [CrossRef] [Scilit]
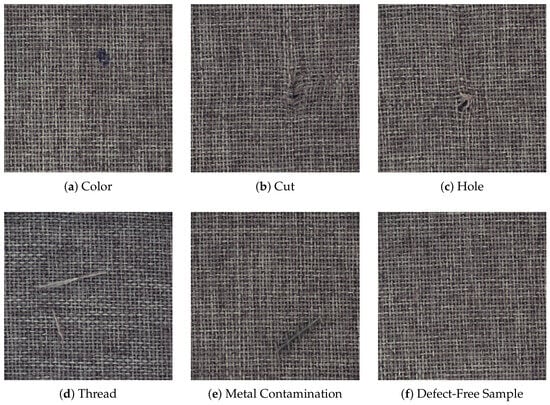
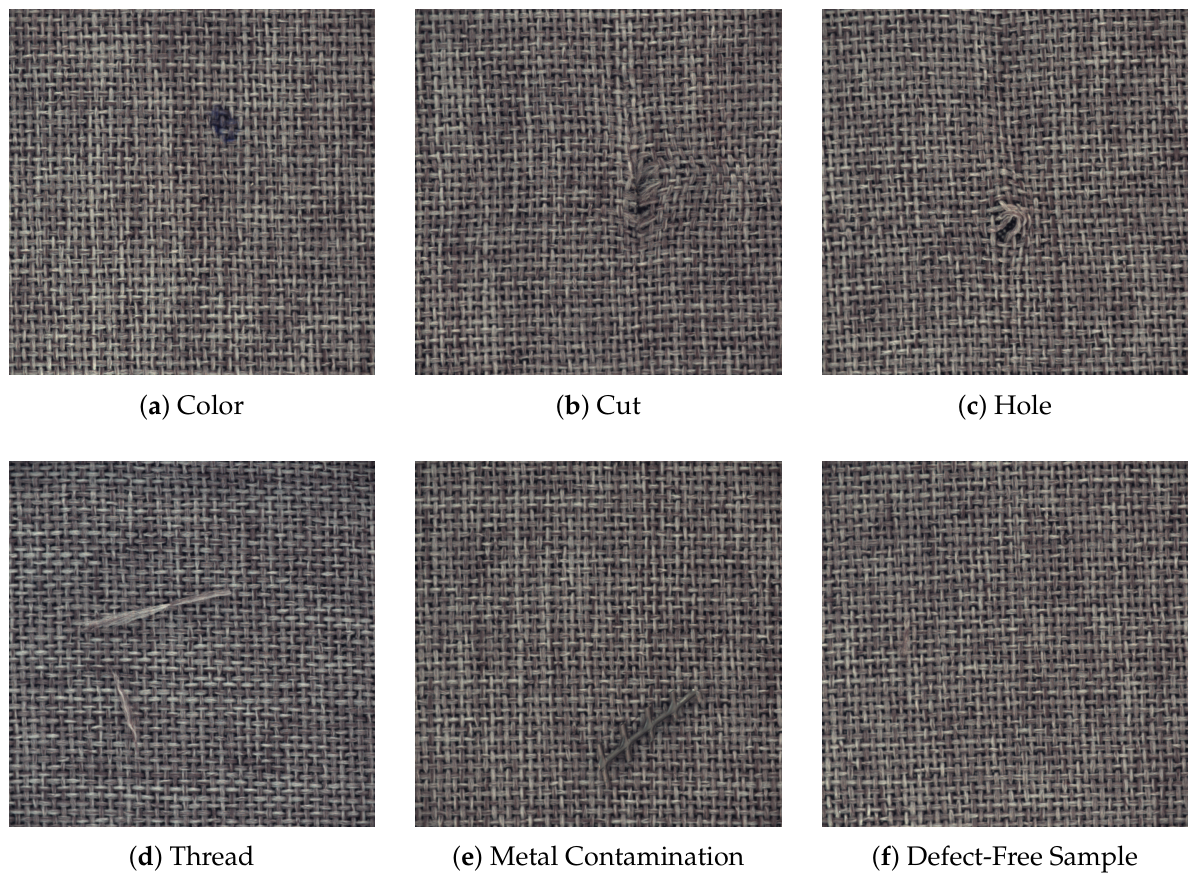
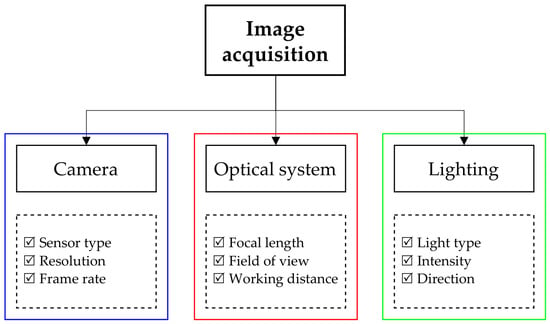
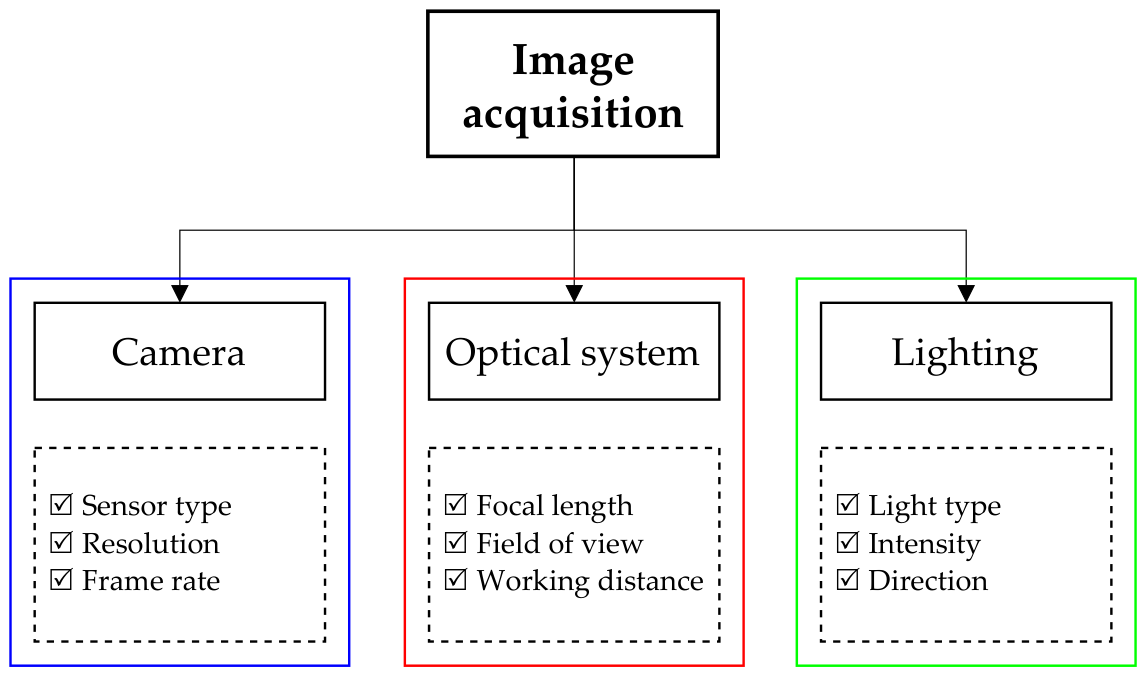
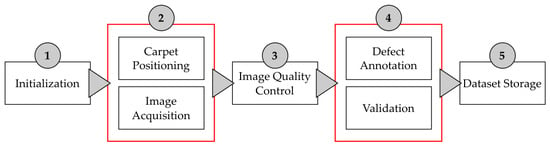
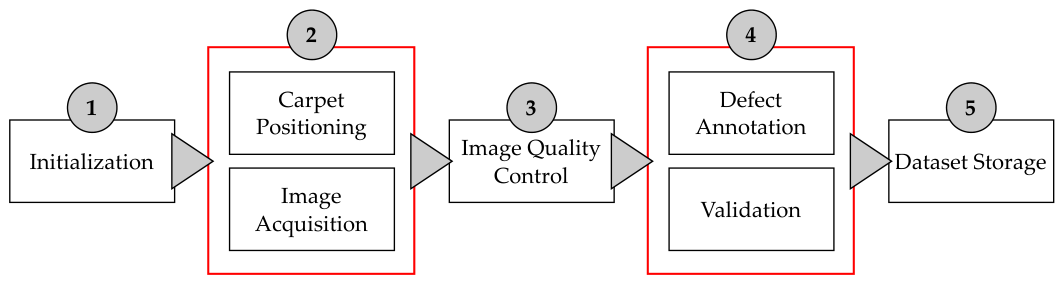
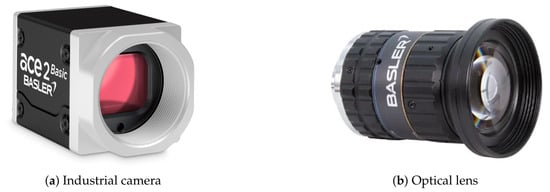
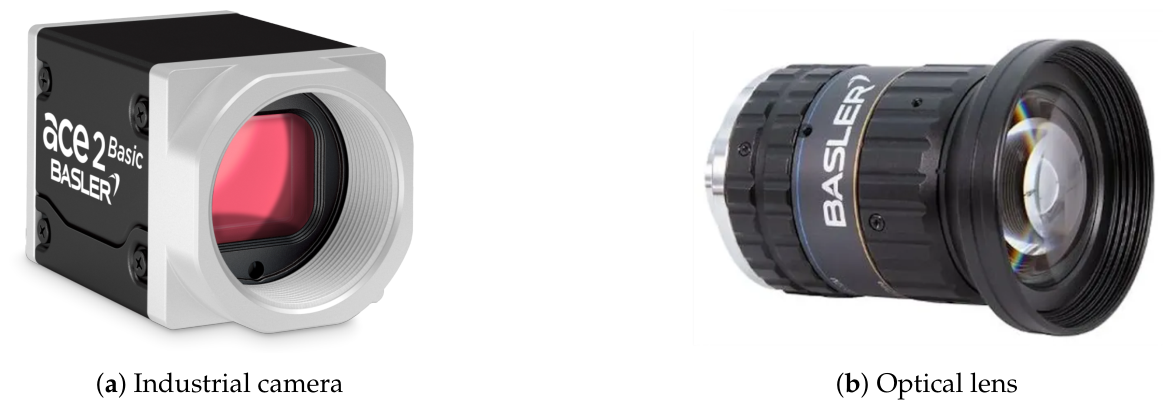
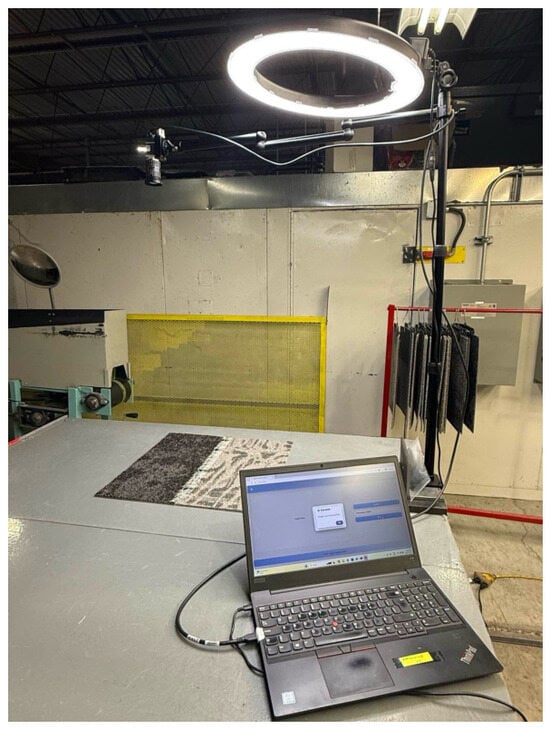
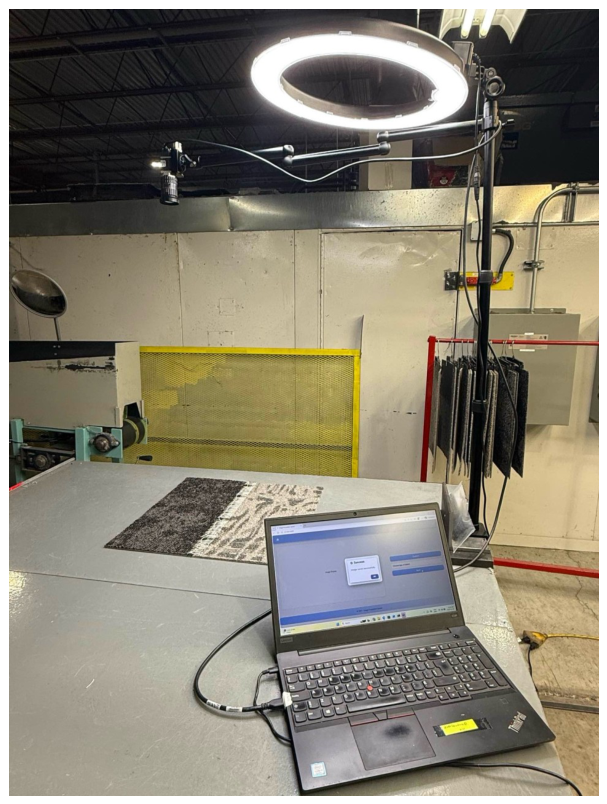
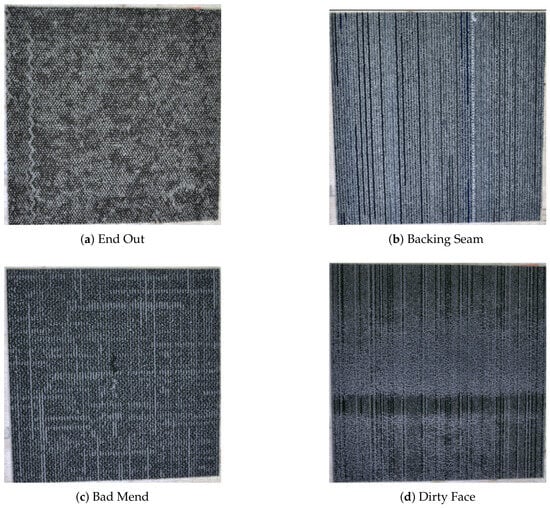
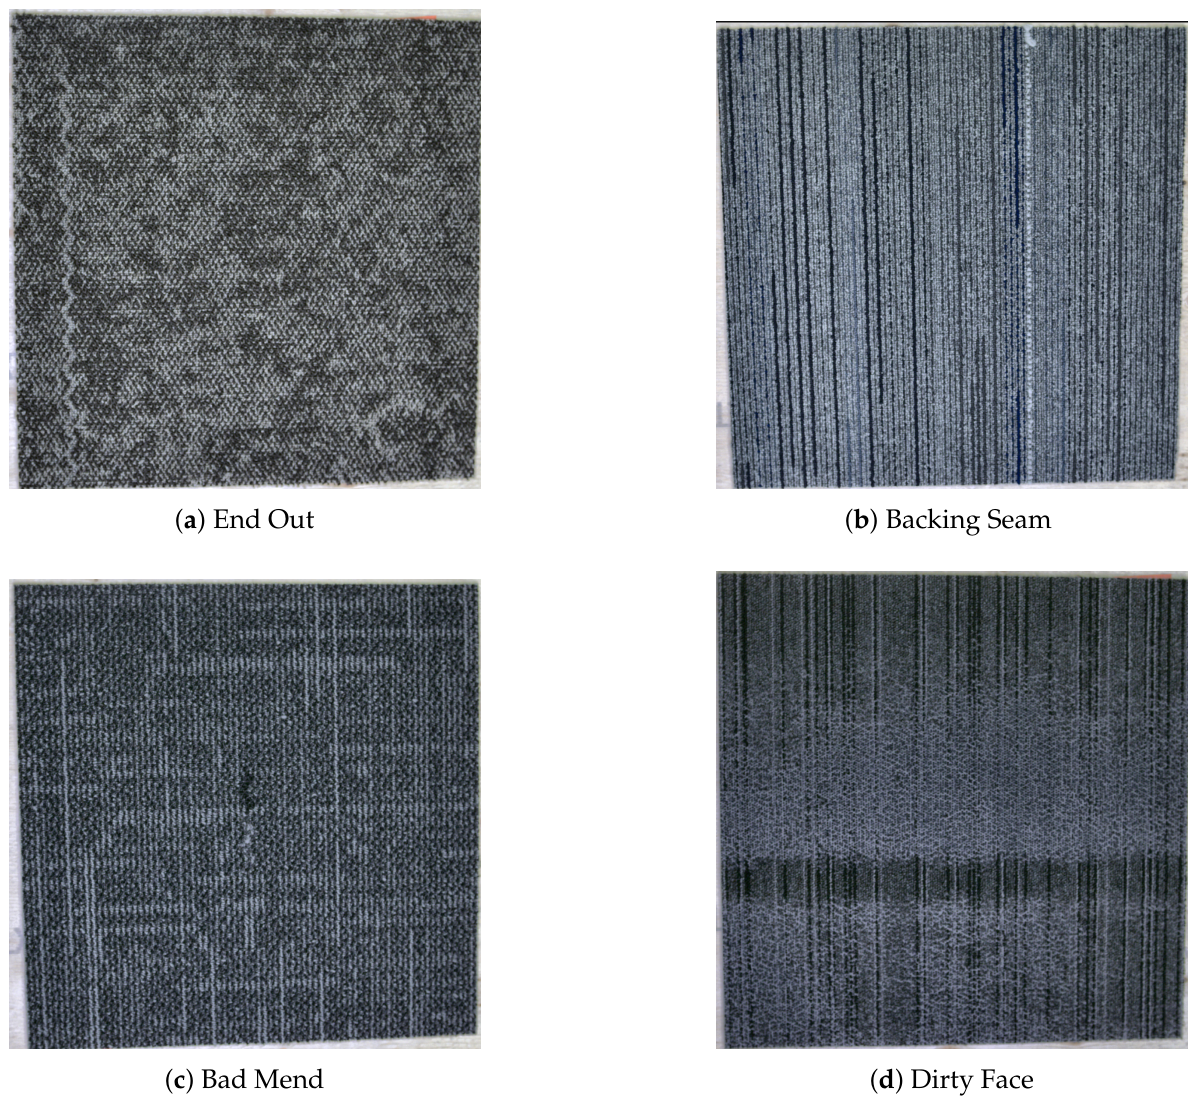
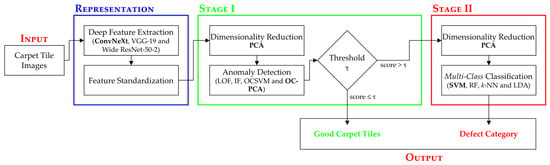
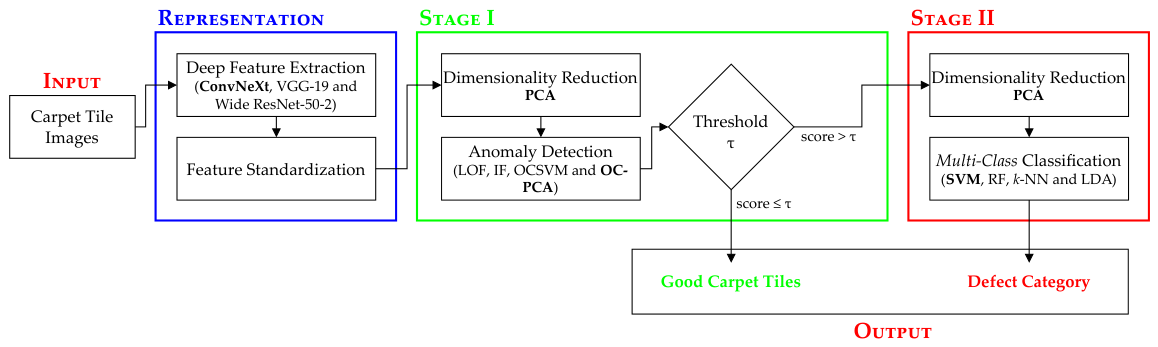
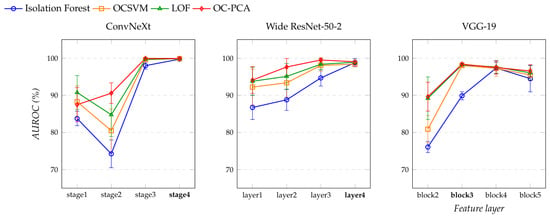
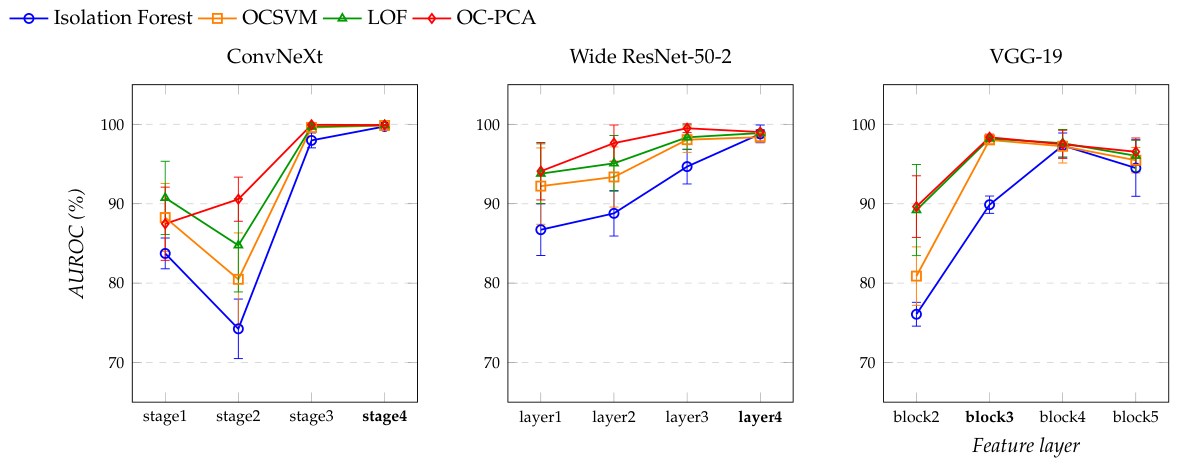
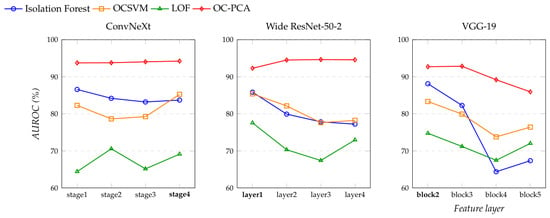
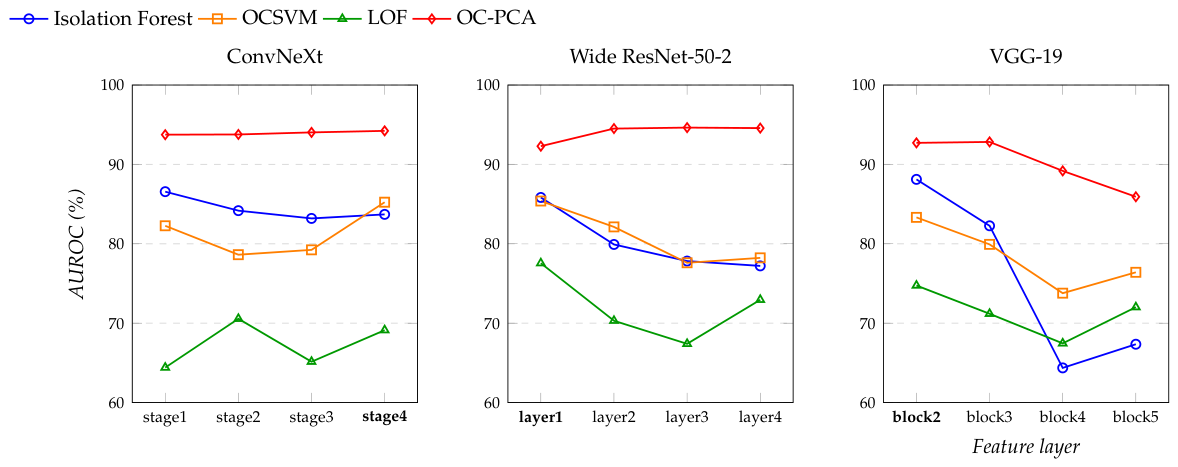
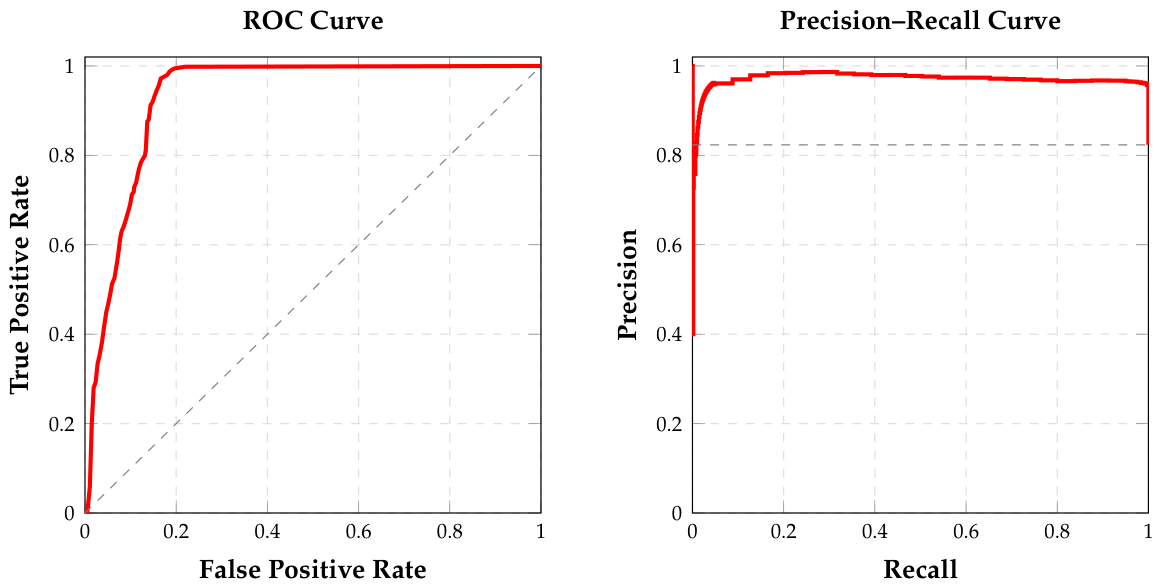
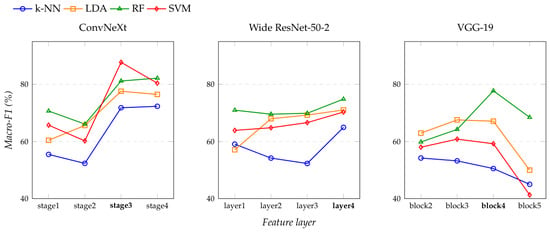
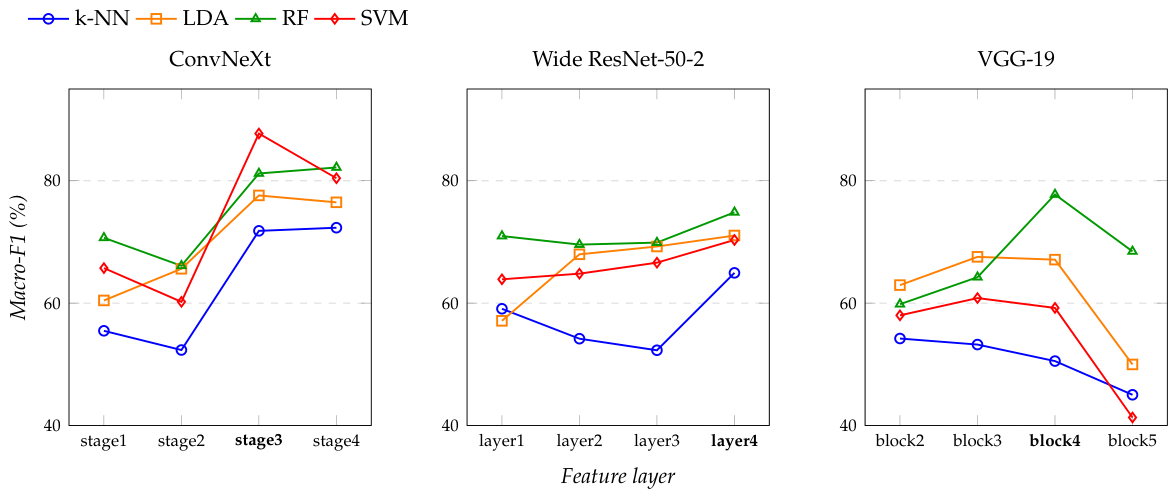
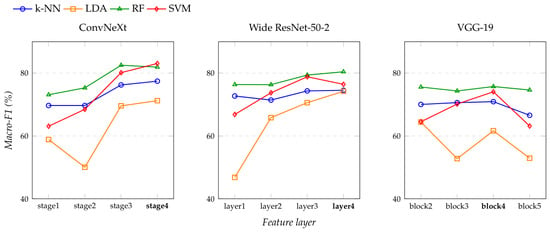
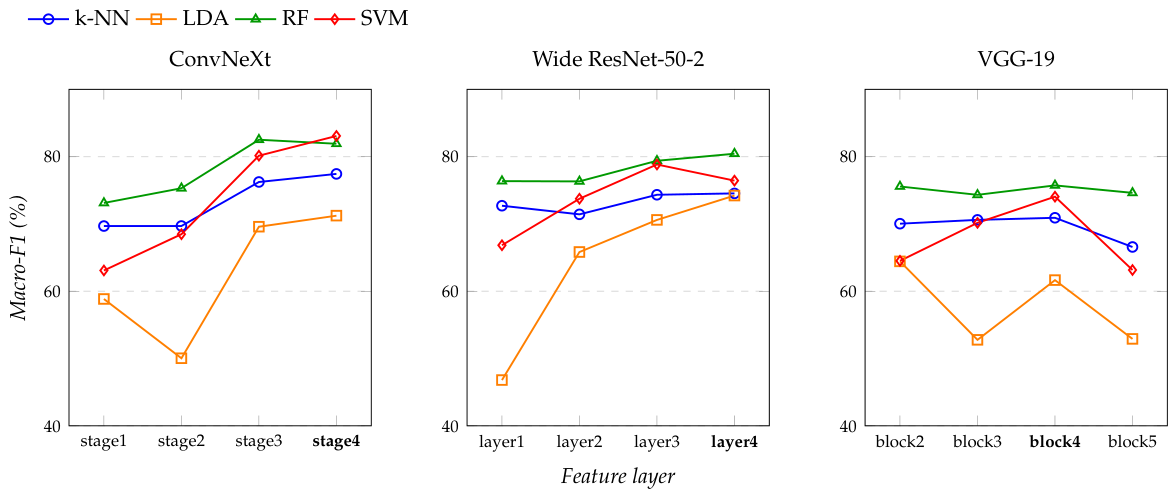
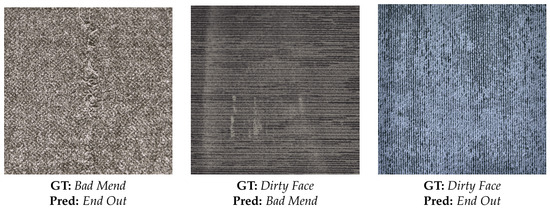
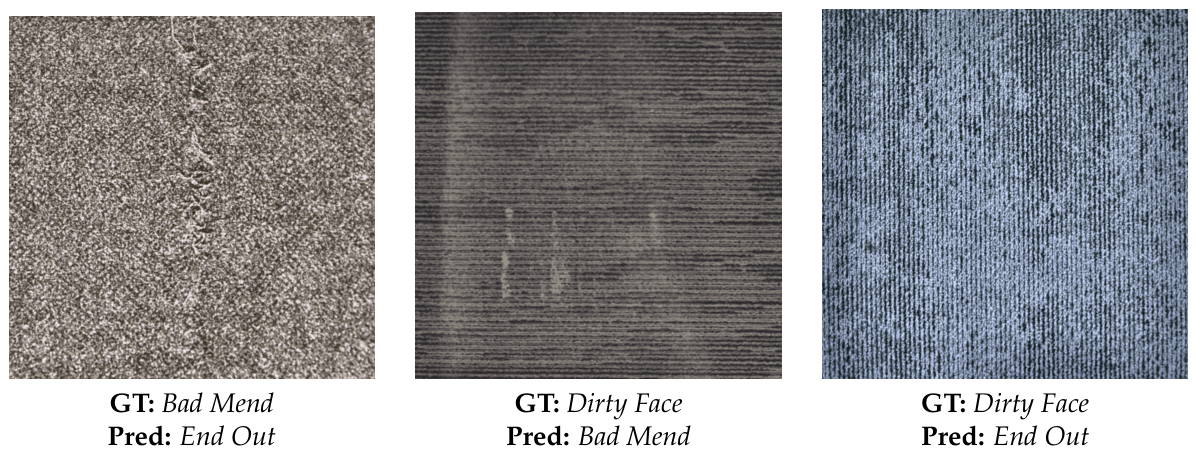

Disclaimer/Publisher’s Note: The statements, opinions and data contained in all publications are solely those of the individual author(s) and contributor(s) and not of MDPI and/or the editor(s). MDPI and/or the editor(s) disclaim responsibility for any injury to people or property resulting from any ideas, methods, instructions or products referred to in the content. |
© 2026 by the authors. Licensee MDPI, Basel, Switzerland. This article is an open access article distributed under the terms and conditions of the Creative Commons Attribution (CC BY) license.