


Abstract
The global power sector is undergoing a profound transformation driven by the rapid expansion of variable renewable energy sources, supported by climate commitments and increasingly competitive technologies. This shift heightens the need for operational flexibility. Hydropower plants with storage play a central role in enabling renewable integration and ensuring that the system can balance the supply; however, their flexibility is often limited by environmental constraints and competing water uses. This study assesses strategies to enhance renewable integration through improved operational flexibility in hydropower plants. The analysis combines Stochastic Dual Dynamic Programming (SDDP) with hourly operational simulations to represent system operation under uncertain inflows and variable renewable energy (VRE) in Brazil’s Northeast region—an area marked by a high share of hydropower and VRE. The methodology incorporates critical hydrological conditions and evaluates how relaxing selected operational constraints, commonly imposed for environmental purposes, influences energy and capacity supply. Results show that hydropower can provide substantial generation modulation to offset renewable variability. Enhanced coordination between hydropower and renewables also reduces thermal dispatch, lowering associated emissions and costs. The findings reinforce that hydropower remains essential in low-carbon power systems and suggest that adapting operational rules and regulatory frameworks is necessary to unlock its full flexibility potential while meeting power-system requirements.
1. Introduction
Climate change mitigation and sustainable development have become central objectives of energy planning and policymaking worldwide. In this context, the transition towards low-carbon energy systems has accelerated the deployment of renewable energy sources and other clean energy technologies [1].
As the share of variable renewable generation continues to increase, power systems require additional flexibility resources capable of balancing hourly generation variability while maintaining system reliability [2,3]. Such flexibility has become a key requirement for the secure and efficient operation of low-carbon electricity systems.
In this context, hydropower with reservoirs plays an important role in sustainable energy systems due to its low direct greenhouse gas emissions and its ability to provide long storage duration, operational flexibility and resilience through reservoir operation [4]. Storage reservoirs also contribute to security of supply and facilitate the integration of VRE sources into power systems [4,5]. This combination of storage capability and rapid operational response enables electricity generation to follow the load.
However, as reservoir operation increasingly balances energy generation with competing environmental and water-management objectives, the flexibility generally associated with reservoir hydropower plants may be constrained to balance the supply.
The operation of large storage reservoirs must reconcile electricity production with several competing objectives, including flood control, irrigation, water supply, navigation and environmental flow requirements. These competing demands may reduce the operational flexibility available to meet the power system requirements. Understanding these interactions has become increasingly important within the water–energy–food nexus, where decisions affecting one resource may have significant economic implications for the others [6].
Recent studies have addressed complementary aspects of hydropower operation under increasing shares of variable renewable energy. Some works have focused on stochastic reservoir optimization and the effects of environmental or water-management constraints on hydropower operation [7,8], while others have investigated long-term hydro–wind–solar coordination using SDDP [9]. Short-term and hourly flexibility has also been assessed through chronological simulation and day-ahead or intraday co-optimization, including explicit representations of wind and solar variability [10,11]. Other studies have examined the contribution of reservoir hydropower to supply reliability, adequacy, and reduction in renewable-curtailment under high shares of VRE [12]. Previous research in the São Francisco River basin has also evaluated water-allocation and environmental operating rules from a water–energy–environment perspective [13].
In Brazil, hydropower operational constraints have evolved through successive regulatory revisions following the prolonged drought that affected Northeastern Brazil during the 2010s. These revisions progressively lowered minimum outflow requirements and adapted operating limits to changing hydrological conditions [13,14]. This regulatory evolution culminated in the adoption of storage-dependent operating rules for the São Francisco River basin, aiming to balance hydropower production, water security and environmental requirements [15,16]. These developments reinforce the importance of understanding how operational constraints affect the flexibility required to support energy and capacity adequacy while complying with environmental and water use requirements.
Beyond current operational challenges, climate change is expected to further affect hydrological regimes and water availability. Changes in precipitation patterns and the increasing frequency of extreme events may alter both the magnitude and seasonality of river flows, affecting reservoir operation and hydropower generation [17]. In Brazil, where hydropower plays a central role in the electricity system, these changes may further increase the importance of operational flexibility and efficient reservoir management [18].
This issue becomes particularly relevant in power systems with high shares of wind generation and strong seasonal hydro-wind complementarity. In such systems, coordinated operation of both resources can enhance renewable energy integration [19]. During periods of high wind generation, hydropower generation can be reduced, allowing water to remain stored in reservoirs and be used later when greater energy, capacity or flexibility support is required.
The Brazilian Northeast provides an especially relevant setting due to its high share of wind generation and the presence of large multipurpose reservoirs. Within this region, hydropower inflows in the São Francisco River basin exhibit relevant seasonal complementarity with the regional wind regime [20,21], creating favorable conditions for coordinated hydro-wind operation under multiple water use and operational constraints.
Although hydropower reservoirs are widely recognized as key providers of operational flexibility, there is still limited quantitative assessment of how environmental and operational constraints affect their ability to vary generation while complying with competing water uses such as navigation, flood control or ecological flow maintenance. Existing studies have addressed these aspects, but often separately. Limited attention has been given to their combined implications for hourly hydropower flexibility, energy and capacity adequacy, and compliance with environmental operating limits in power systems with a high share of VRE.
This paper addresses this gap by analyzing the Lower São Francisco River hydropower cascade (Sobradinho–Itaparica–Paulo Afonso–Xingó) under different hydraulic and environmental operating conditions. The analysis quantifies the resulting impacts on hydropower operation (reservoir level, outflow rate and generation) and its ability to balance energy and capacity supply.
The paper is organized as follows. Section 2 describes the Northeastern Brazilian power system, including the São Francisco River hydropower cascade, the operating rules considered, the database, and the simulation methodology. Section 3 presents and discusses the results, focusing on the trade-offs between power system and water use requirements. Finally, Section 4 presents the main conclusions and recommendations for future research.
2. Materials and Methods
This section describes the modeling framework adopted to evaluate the operational impacts of hydraulic constraints under hydrological and renewable generation uncertainty. The analysis combines long-term stochastic optimization with detailed chronological simulation to capture both strategic reservoir operation and hourly power system dispatch.
2.1. Optimization and Simulation Model
The analyses were conducted using the SDDP model, version 18.0 [22], based on Stochastic Dual Dynamic Programming [23,24]. SDDP computes the least-cost stochastic operating policy, representing the trade-off between the immediate use of water and its future value. This approach captures the recursive nature of hydrothermal operation and explicitly models the uncertainty of wind and solar power availability.
The optimization problem minimizes the sum of immediate and future operating costs:
where FCI is the immediate operating cost, expressed as
and FCF is the future cost function, expressed as
where c(j) is the variable operating cost of thermal unit j, gtk(j) is the energy generated by thermal unit j in stage t and block k, cδ is the penalty coefficient associated with an operational-constraint violation, δgt is the corresponding violation, vt+1 is the reservoir storage at the end of stage t, and at represents reservoir inflows of stage t [22].
min FCI + FCF,
FCF = αt+1(vt+1, at),
The SDDP model was executed using a monthly step, with each monthly stage represented by four blocks obtained by aggregating the hourly demand and renewable-generation profiles. The model generated operating policies for the planning horizon starting in 2025 based on 600 synthetic inflows and VRE (wind and solar) scenarios. A maximum of twenty SDDP iterations was adopted. Convergence was assessed through the stabilization of the lower bound (Zinf), with a relative variation below 0.01% between the last two iterations. Given the relatively small size of the study system, stable convergence was achieved after five iterations.
The input data include historical hourly demand and demand forecasts. Historical hourly wind and photovoltaic capacity factor series for the Brazilian Northeast region were obtained from the public database available in [25]. According to the methodologies described in [26], the capacity factors are estimated using data from the Anemometric Measurement System (AMA) [27] for wind generation and System Advisor Model (SAM) simulations for solar generation. The database also provides synthetic renewable series constructed by grouping historical wind and solar data into regions with homogeneous resource characteristics. For small hydro and thermal plants, generation scenarios are derived from verified historical output. Scenarios for distributed micro and mini photovoltaic generation are based on projected growth of this source.
The SDDP model integrates both energetic and operational aspects of the system, enabling the derivation of operating policies under hydrological and renewable generation uncertainty.
After the long-term monthly optimization stage, the resulting Future Cost Functions (FCFs) were subsequently used in the hourly chronological simulations, ensuring that hourly hydro dispatch decisions remained consistent with the water values represented in the monthly operating policy. The chronological hourly simulation was performed to obtain detailed hourly variables. The simulation used 42 historical scenarios, beginning in 1981, corresponding to the complete set of available historical years with consistent hourly inflow and renewable generation data. Hourly inflow and wind series were paired according to the corresponding historical year to preserve their temporal relationship. Each historical scenario was simulated for the 2030 system configuration under the operating policies produced by the SDDP model. The year 2030 was selected to represent a system configuration with a higher share of variable renewable generation compared to 2025. The representation explicitly includes regional reservoir operation, storage dynamics, hydropower flexibility, variable renewable generation (wind and solar), and the corresponding power system requirements.
The 42 historical scenarios comprise approximately 368,000 simulated hours, with each scenario representing a full year of chronological hourly inflow and wind conditions. This historical sampling captures intraday and seasonal patterns as well as interannual variability, which are particularly relevant for evaluating operational flexibility and reservoir dynamics.
2.2. System Representation
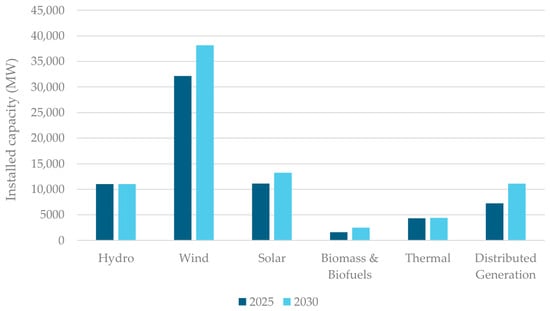
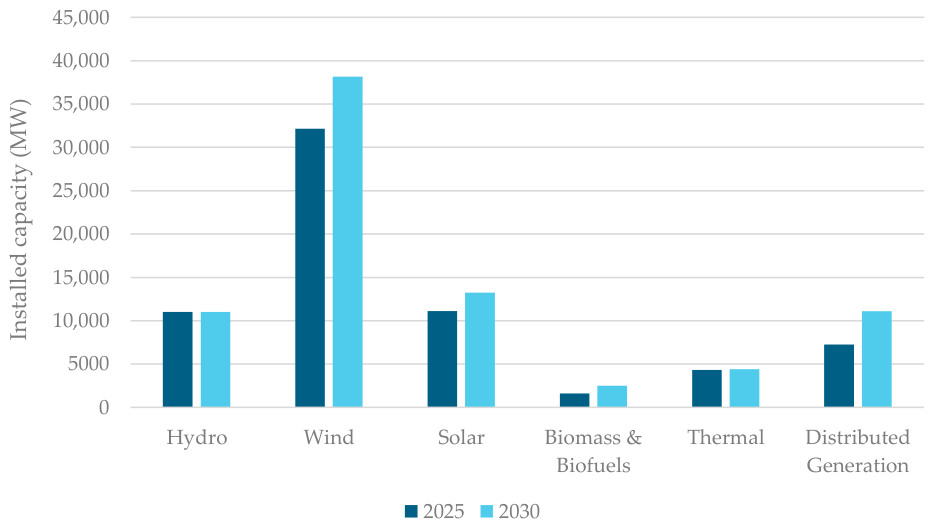
The study data set was based on the projected growth of demand and the planned expansion of generation supply from the Brazilian official expansion planning starting in 2025 [28]. Only generation assets located in the Northeast were considered, including existing and planned hydropower, thermal, wind, and solar plants, as summarized in Figure 1, where Distributed Generation is predominantly solar based. The year 2030 configuration allows the study to assess the evolving role of hydropower in providing hourly flexibility under environmental constraints in conjunction with the growing participation of VRE. In the Northeast, wind generation exhibits relevant seasonal complementarity with hydrological conditions, particularly during the dry season, whereas solar generation provides an additional intraday contribution by supplying energy during daylight hours and allowing hydropower plants to preserve stored water for use during other periods. In this sense, solar generation indirectly contributes to reservoir flexibility by shifting part of the energy requirement away from hydropower during solar generation hours.
Figure 1.
Installed capacity by source in 2025 and 2030.
Although the physical configuration was inspired by the Brazilian Northeast region, the proposed system was not intended to reproduce the region’s future operation within the Brazilian Interconnected System. Instead, it was designed as an autonomous system to investigate the effects of environmental and water use constraints on hydropower flexibility in a power system characterized by high shares of VRE and a relevant hydropower contribution. Under this approach, the interaction between supply and demand is represented exclusively within the modeled system, allowing the analysis to focus on the operational impacts of the hydraulic constraints independently of the effects of power exchanges with neighboring systems. The adopted representation encompasses a broad range of operating conditions, including periods of high net demand requiring increased dispatchable generation and periods with surplus variable renewable generation, allowing the interactions between hydropower flexibility, renewable variability, and environmental constraints to be consistently assessed. As shown in Figure 1, the analyzed 2030 system configuration is characterized by a high share of VRE, with wind and solar resources, including Distributed Generation, accounting for approximately 78% of the installed capacity, while hydropower and thermal generation account for approximately 14% and 5%, respectively. This configuration provides a suitable framework for evaluating the operational value of hydropower flexibility in systems with high shares of VRE without the influence of flexibility resources that may be available in interconnected systems with substantially different generation mixes. Therefore, the results should be interpreted as representative of systems with similar characteristics and operating assumptions, rather than as a forecast of actual operation in Brazil.
Given the strong environmental and water use constraints affecting hydropower operation in the region, ramping limits for total outflow were defined based on historical operational data from the past three years. The model includes an individual representation of hydropower plants located in the Northeastern region, as listed in Table 1.
Table 1.
Hydropower plants represented.
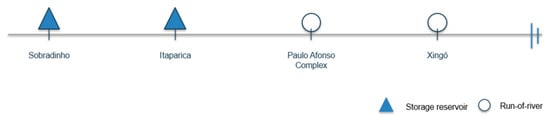
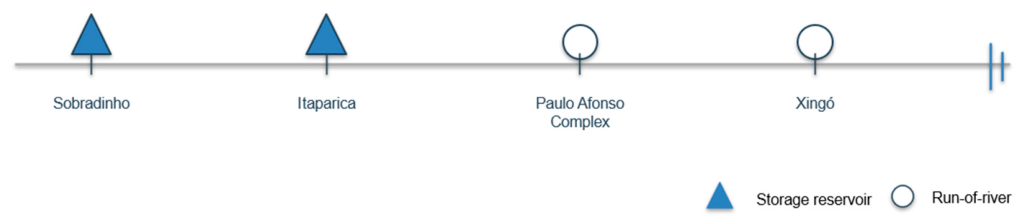
Among the hydropower plants represented (Figure 2), the Sobradinho reservoir stands out due to its dominant storage capacity and its central role in regulating inflows to downstream plants, supporting multiple water uses while complying with environmental constraints established by regulatory agencies.
Figure 2.
Simplified schematic of the São Francisco River cascade.
2.3. Hydropower Operating Constraints
The São Francisco River basin is a key example: in addition to its national relevance for hydropower generation, it supports extensive irrigation districts and ecological functions. As a result, reservoir operation policies must balance energy production with consumptive uses and with the maintenance of minimum environmental flows that sustain ecosystems and local communities [29].
2.3.1. Minimum Outflow Constraint
Between 2013 and 2017, the Northeast region experienced an extremely unfavorable hydrological scenario, marked by a drought considered the most severe in the last 30 years and affecting more than four million people [30]. In response to this event, and with the participation of Brazilian regulatory agencies, the minimum outflow constraint at the Sobradinho and Xingó reservoirs was gradually reduced from 1300 m3/s to 550 m3/s, a value that remained until 2019. The objective was to preserve the storage capacity of the Sobradinho reservoir and ensure the multiple uses of water throughout an entire year. When this minimum outflow of 550 m3/s was implemented, water quality issues began to emerge, leading to the establishment of this value as the lower operational limit. These operational measures resulted in an estimated loss of approximately 1300 average MW across the cascade. As hydrological conditions improved from 2018 onward, the integrated basin management coordinated by the Brazilian National Water Agency (ANA) agreed to increase minimum outflows to daily averages of up to 800 m3/s [13,31]. The climatic changes observed in the region highlight the importance of water resources management to reconcile multiple water uses while maintaining environmental quality. In situations of water scarcity, stricter minimum outflow constraints may compromise hydropower hourly flexibility and, consequently, the ability to meet peak demand.
Regarding streamflow conditions in the São Francisco basin, environmental assessments have discussed the impacts of altered natural seasonality on the ecosystem, including the loss of natural fish nurseries and the decline of species dependent on seasonal flow regimes for their development [32]. In addition to these ecological effects, recent studies show that prolonged reductions in outflow in the São Francisco River intensify saltwater intrusion, retract the estuarine plume, and increase salinity above potability limits in inner estuarine reaches, with significant environmental and social implications [33].
Considering the gradual reduction in the system’s regulation capacity, operational analyses indicate that the intensive use of major storage reservoirs at the end of the dry season is likely to become increasingly frequent [34], making the system progressively more dependent on the subsequent wet season for recovery.
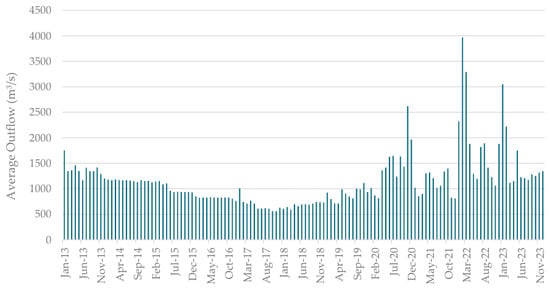
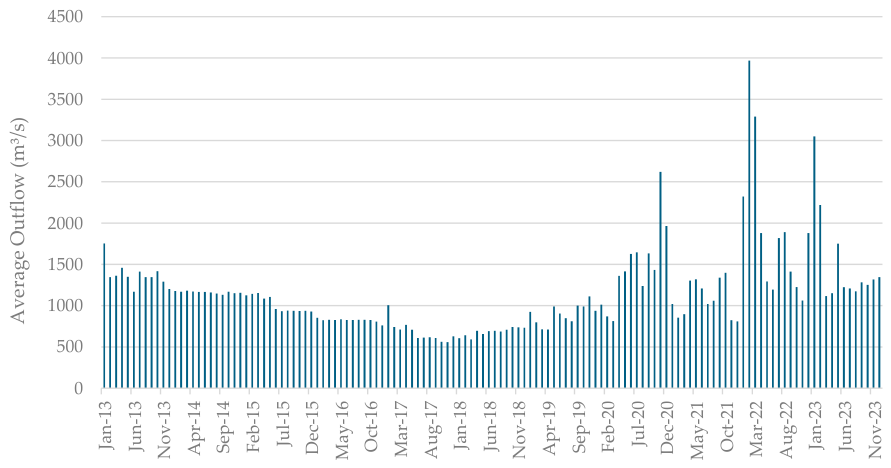
Figure 3 illustrates the variations in monthly outflow at Sobradinho since 2013, the year marking the onset of the unfavorable hydrological scenario in the region. By late 2017, the average daily turbine outflow reached the minimum permitted value of approximately 550 m3/s. The relaxation of the minimum outflow constraint contributed to the recovery of the Sobradinho reservoir level, which extends 320 km and has a storage capacity of 34.1 billion m3, playing a critical role in regulating downstream flows for hydropower generation.
Figure 3.
Monthly Average Outflow at Sobradinho (2013–2023).
Given the changes in the minimum outflow constraint over the years, the present study evaluates the impacts of different minimum outflow values on hydropower operational flexibility and system adequacy indicators. These values were selected to represent different levels of operational restriction.
2.3.2. Reservoir Storage Level and Maximum Outflow Discharge Constraint
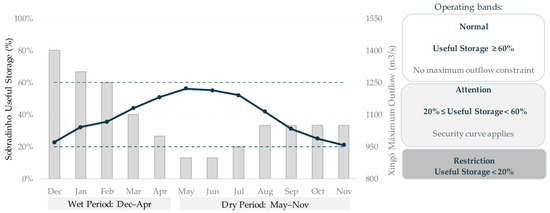
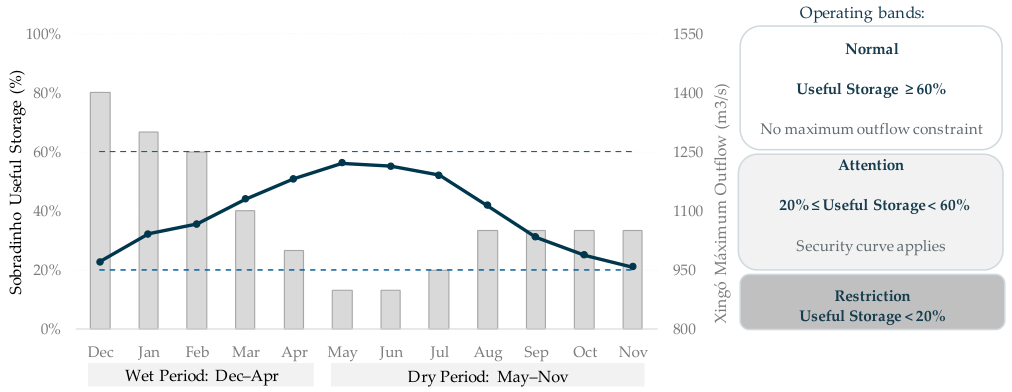
In addition to the minimum outflow requirement, this study incorporates the operational constraint established by ANA [16], which links the maximum outflow discharge limits of the Xingó hydropower plant to the reservoir storage level of Sobradinho. Implemented in operational practice from 2019 onward, this rule aims to preserve reservoir storage during unfavorable hydrological periods, contributing to water security and to the multiple uses of the São Francisco River, as observed in Figure 4.
Figure 4.
Sobradinho Security Curve for useful storage levels ranging from 20% to 60%.
The representation of this constraint in the SDDP model was implemented using the model’s generic interpolation constraint. In this case, the volume–discharge relationship is defined by a curve whose points preserve the ordering of the variables: lower storage levels in Sobradinho correspond to more restrictive maximum outflow limits at Xingó. The interpolation is enforced through an SOS2 formulation [35], widely used in hydropower optimization models to approximate piecewise-linear relationships efficiently.
where x represents the variables linked by the interpolation, denotes breakpoint k, λk is the corresponding interpolation weight, and δ is the slack variable associated with a possible violation. This formulation ensures that only two adjacent breakpoints can be active simultaneously, producing a consistent linear interpolation along a single segment of the curve.
In the present application, the interpolation links Sobradinho storage to the corresponding maximum allowable outflow at Xingó, which is subsequently imposed as an upper-bound constraint on the plant outflow.
The constraints are considered soft, i.e., penalties associated with their violations are included in the objective function and calibrated to discourage violations of the ANA rule. In this way, the model adequately captures the influence of the regulatory discharge policy on the operation and cost of the São Francisco cascade.
2.3.3. Penalty Structure and Calibration
The hydraulic operating constraints considered in the model include irrigation requirements, minimum reservoir storage levels, minimum-outflow constraints, and the ANA storage-dependent operating rule. Penalty coefficients were assigned in accordance with the priority associated with consumptive water uses, environmental flow requirements, and operational guidelines, while preserving model feasibility. Table 2 summarizes the penalty structure adopted in the model.
Table 2.
Penalty structure for hydraulic operating constraints.
Irrigation requirements are represented as priority water demands in the optimization model and are only violated under physically infeasible conditions. Minimum-outflow penalties were calibrated considering the marginal value of stored water (water value), reflecting the opportunity cost of water allocated to future uses. These constraints receive high penalty coefficients because they are associated with environmental and operational objectives formally established for the river system and are intended to preserve water uses and environmental conditions downstream of the reservoirs. The penalty coefficients associated with minimum reservoir storage and ANA operating constraints were calibrated to be sufficiently high to effectively discourage violations, while avoiding an unnecessary increase in total operating costs.
2.4. Simulations Cases
The simulations use 42 historical hourly inflow and wind scenarios, covering every hour of a target year (2030). Five operating cases were evaluated, differing in the minimum outflow requirement applied to the São Francisco cascade, as summarized in Table 3. The Qmin800+ANA case additionally incorporates the storage-dependent operating rule [16], which links the storage level of Sobradinho Reservoir to the maximum allowable discharge at Xingó Reservoir.
Table 3.
Cases.
2.5. Criteria for Evaluating Results
The simulation results were assessed through indicators describing hydraulic operation, power system operation, and operational flexibility. The evaluated metrics include total operating cost, reservoir storage level, minimum outflow discharge and irrigation violations, hydropower generation, hydropower–renewable complementarity, hourly flexibility metrics based on daily hydropower generation, Energy Not Supplied and the Loss of Load Probability (LOLP). Together, these indicators quantify the impacts of different hydraulic operating constraints on hydropower flexibility, system reliability, and energy supply, while highlighting the trade-offs between power system objectives and the environmental and multiple water use requirements imposed on reservoir operation.
3. Results and Discussion
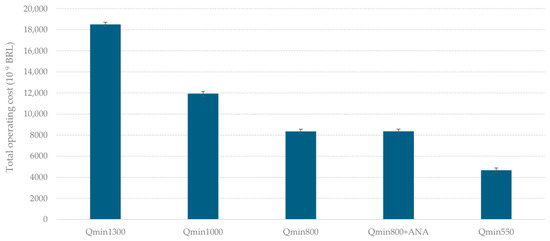
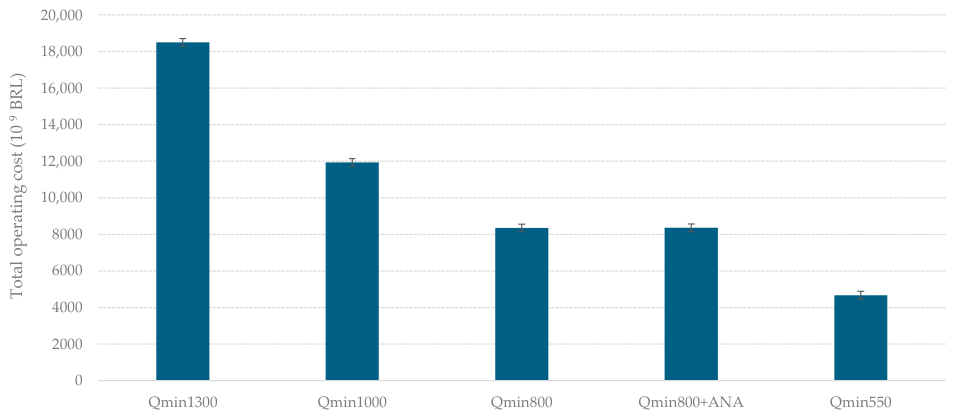
The Qmin1300 case results in the highest total operating cost among the evaluated cases because the higher minimum outflow constraint reduces operational flexibility and limits the system’s ability to adjust reservoir releases according to hydrological conditions and power system needs.
Compared with the Qmin800 case, maintaining higher minimum releases results in lower reservoir storage, particularly during periods of reduced inflows. Since irrigation demands, environmental flows, and hydropower generation compete for the same water resource, this restriction increases the marginal value of stored water and makes it more difficult to simultaneously satisfy multiple operating requirements. In general, multiple water uses increase the economic value of water by reducing reservoir operating flexibility [15].
This effect becomes even more pronounced under critical hydrological conditions. To minimize the risk of violating the minimum discharge constraint, the optimization adopts a more conservative operating strategy, characterized by less variable releases over time and a reduced ability to respond to short-term increases in electricity demand. Consequently, the system faces greater difficulty in satisfying operational constraints, resulting in higher overall operating costs (Figure 5).
Figure 5.
Total operating cost.
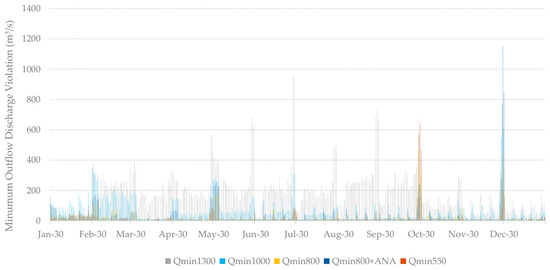
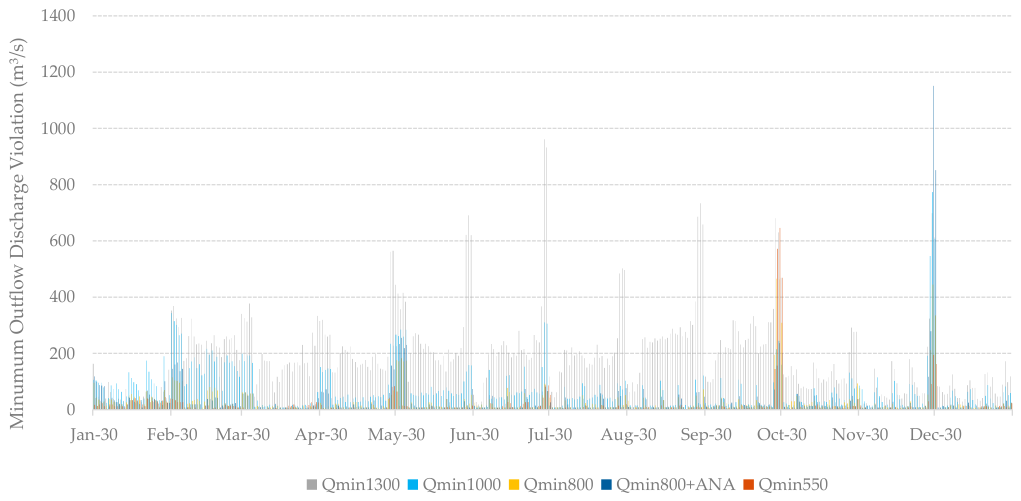
Figure 6 presents the average violations of minimum outflow constraints across all scenarios. Minimum outflow violations become generally smaller as the minimum outflow requirement is reduced, with the highest violations observed for Qmin1300 and the lowest for Qmin550.
Figure 6.
Minimum outflow discharge violations.
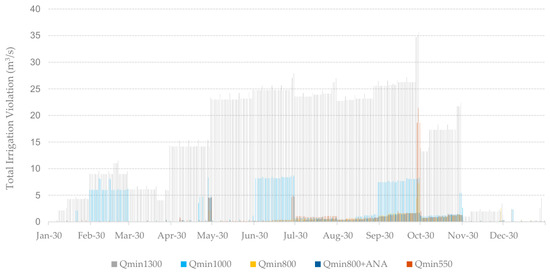
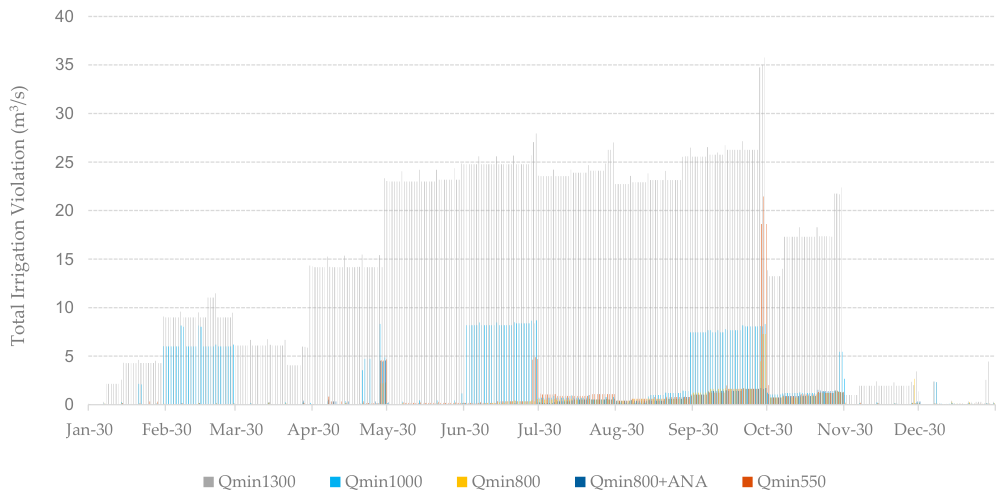
Figure 7 shows irrigation violations for the evaluated cases. These violations are concentrated mainly on Sobradinho Reservoir, reflecting the importance of consumptive water demands in this region.
Figure 7.
Total irrigation violations.
Cases with minimum outflow constraints of 800 m3/s and 550 m3/s present a more pronounced reduction in irrigation violations. This indicates that the lower minimum release requirement reduces both the frequency and severity of water use constraint violations, providing greater operational flexibility.
These results reinforce the importance of managing water resources not only for electricity generation but also for other essential water uses, including irrigation and environmental requirements, while minimizing critical water scarcity conditions.
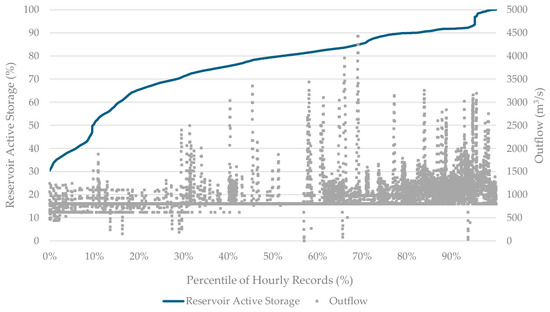
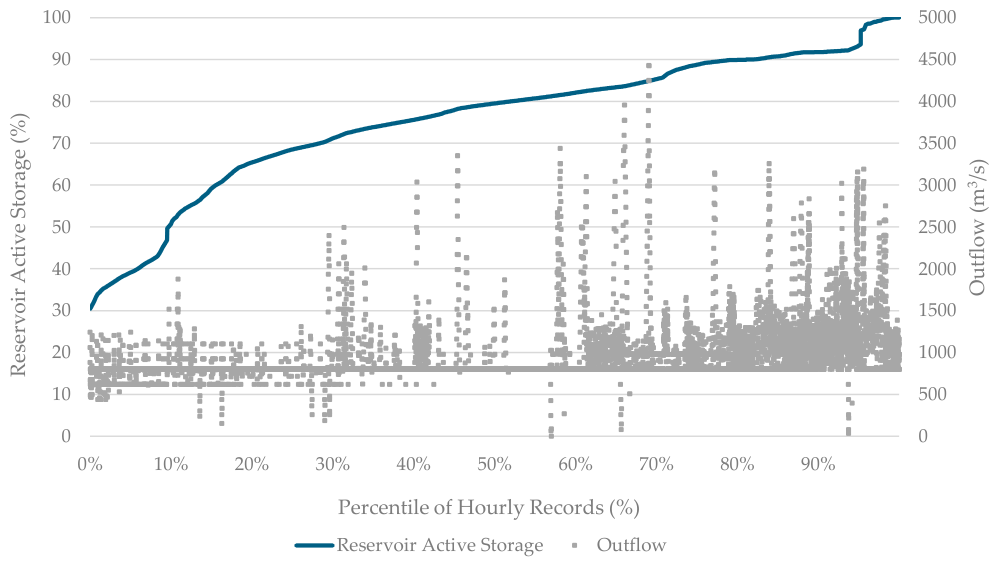
In the São Francisco River basin, the lowest historical inflows generally occur between May and November, corresponding to the dry season. Under these conditions, the Qmin800+ANA case modifies the cascade operation to address prolonged drought conditions while balancing multiple water uses and improving regional water security. The ANA storage-dependent operating rule sets seasonal discharge limits at Xingó based on the storage level of Sobradinho [16]. Figure 8 illustrates the application of this operating rule for one month (October) during the dry-season conditions. As Sobradinho storage level decreases, the maximum discharge permitted at Xingó is progressively reduced.
Figure 8.
Reservoir Storage of Sobradinho and Outflow of Xingó, considering ANA operating rule.
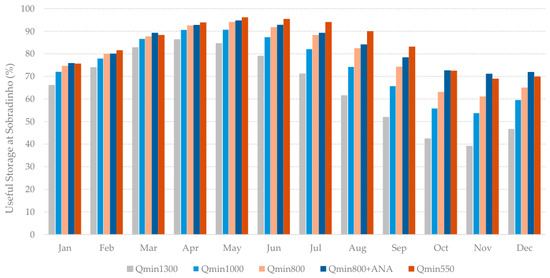
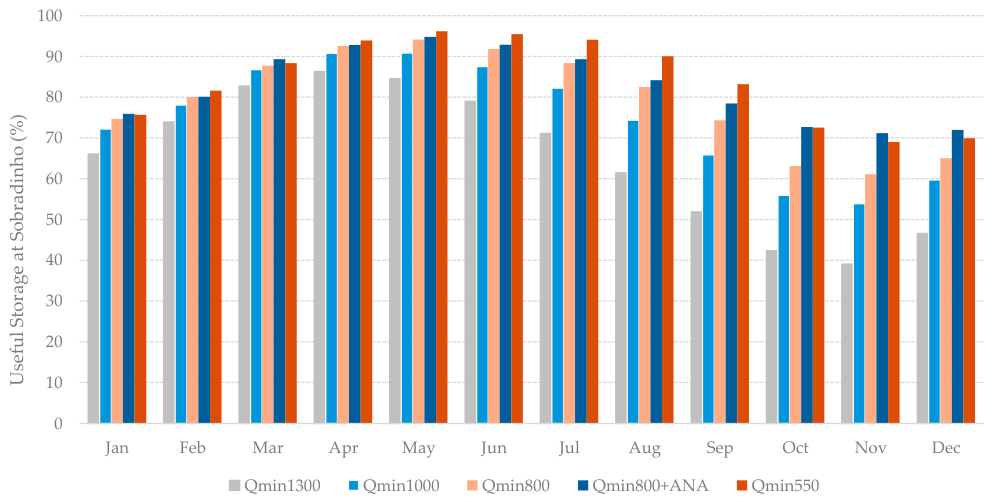
The results, therefore, show that the Qmin800+ANA case maintains relatively high storage levels in Sobradinho throughout the simulation horizon (Figure 9), with particularly favorable storage conditions at the end of the dry season and beginning of the wet season, reducing the risk of reservoir depletion and facilitating compliance with downstream minimum discharge requirements.
Figure 9.
Useful storage at Sobradinho Reservoir.
The benefits of the alternative operating conditions become particularly evident in October, at the end of the dry season, when the differences in reservoir storage are most pronounced. On average across all simulated scenarios, reducing the minimum outflow requirement from 1300 to 800 m3/s increases useful storage of Sobradinho reservoir by approximately 20 percentage points, from 43% to 63%. The storage-dependent operating rule, which links reservoir storage to the maximum downstream release, provides an additional increase of about 10 percentage points, raising average storage to roughly 73%. Together, these changes result in an average storage increase of 30 percentage points, compared with the Qmin1300 case.
Consequently, Sobradinho assumes a more active role in regulating the cascade, preserving storage and improving operational conditions during periods of reduced water availability.
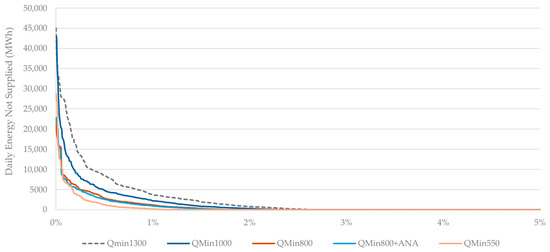
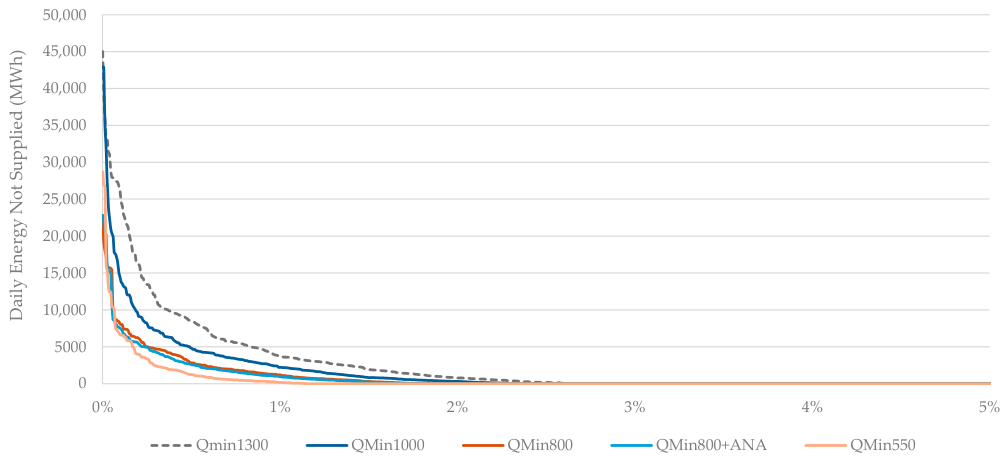
The additional operational flexibility provided by the lower minimum outflow requirement also improves the system’s ability to cope with stressed operating conditions. Figure 10 presents the probability distribution of Daily Energy Not Supplied (Daily ENS) for the Qmin1300 and Qmin800+ANA operating strategies, evaluated across all 42 inflow scenarios. For clarity, the visualization is restricted to the upper 5% tail of the distribution, highlighting the most severe deficit events. Although both cases are subject to the same discharge ramp-rate constraint (m3/s/min), the Qmin800+ANA strategy shifts the Daily ENS distribution towards lower deficit levels, indicating a general reduction in the severity of supply deficits. This effect is particularly evident in extreme events, as measured by the Conditional Value at Risk (CVaR), defined as the mean Daily ENS within the worst 1% of deficit events. The CVaR 1% of Daily ENS decreases from 11.4 GWh in the Qmin1300 case to 4.0 GWh in the Qmin800+ANA case.
Figure 10.
Distribution of Daily Energy Not Supplied.
To better understand the operational flexibility associated with the reduction in daily deficit events, hydropower modulation was assessed through the daily generation range, calculated as the difference between the maximum and minimum hourly hydropower generation within each day. Table 4 presents summary statistics for all 42 inflow scenarios. While the Qmin800+ANA case exhibits an average daily generation range approximately 13% lower than that of Qmin1300, its 90th percentile daily generation range is approximately 15% higher, suggesting that greater modulation occurs primarily during more demanding operating conditions.
Table 4.
Daily hydropower generation range statistics (GWh) across all 42 inflow scenarios.
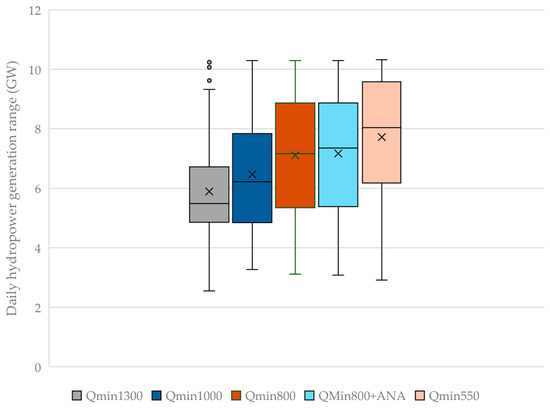
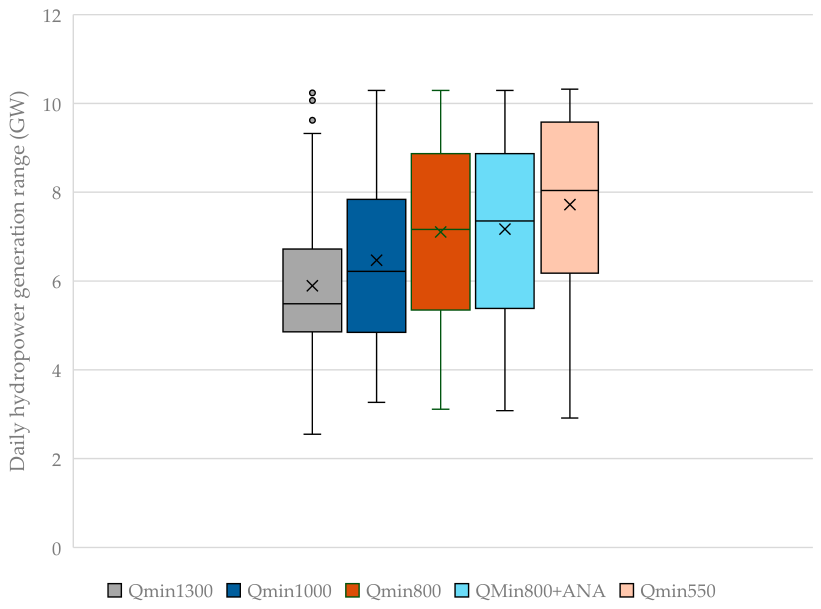
To further investigate hydropower flexibility under critical system conditions, Figure 11 focuses on days with energy deficits in at least one operating strategy. By restricting the analysis to these conditions, the comparison highlights situations in which hydropower modulation becomes particularly valuable. The results show that reducing the minimum outflow requirement increases the capability of hydropower plants to modulate generation, contributing to the reduction in the most severe deficit events observed in Figure 10.
Figure 11.
Boxplots of daily hydropower generation range (GW) calculated for the common set of days exhibiting energy deficits in at least one operating strategy.
As the minimum outflow requirement is progressively reduced from Qmin1300 to Qmin500, both the median and the mean daily generation ranges increase consistently. This upward shift in the distribution indicates that the greater modulation capability is observed across a substantial portion of the deficit-day sample, rather than being driven solely by a limited number of extreme observations. Furthermore, the increase in the upper quartile in Figure 11 indicates an enhanced capability of hydropower plants to provide pronounced intraday generation modulation under more demanding system conditions.
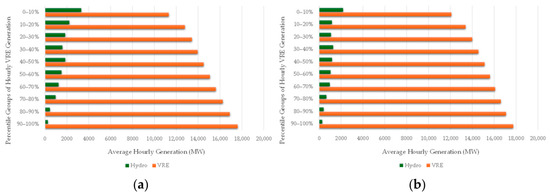
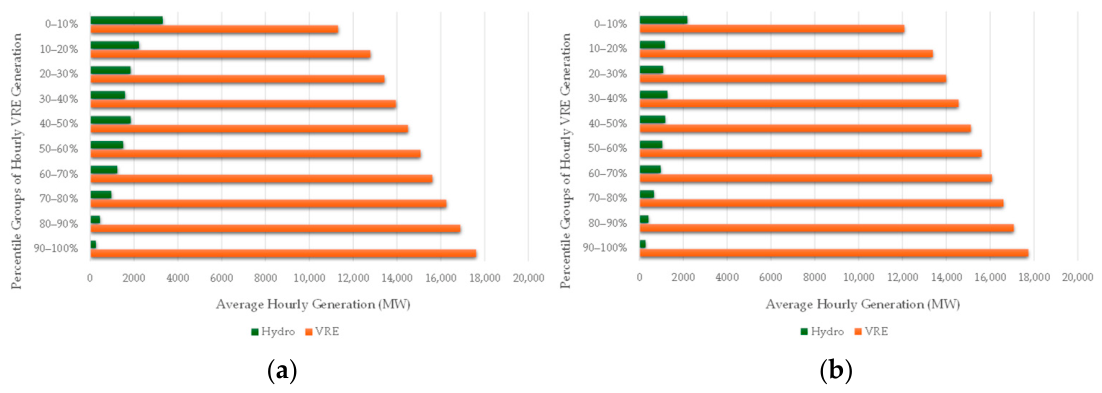
Figure 12 provides additional insight into how hydropower generation varies with renewable resource availability. To illustrate this relationship, October 2030, considered representative of dry-season conditions, was analyzed through 42 simulated scenarios, each comprising 720 hourly values, resulting in 30,240 hourly observations, with the Qmin1300 and Qmin800+ANA cases presented for comparison. The observations were ranked according to VRE generation and divided into ten percentile groups.
Figure 12.
Average hourly hydropower and VRE generation in October 2030, grouped according to VRE generation percentiles: (a) Qmin1300; (b) Qmin800+ANA.
Consistent with the previous analysis, periods of lower renewable generation correspond with increased hydropower production, even during the dry season, highlighting the essential balancing and flexibility services provided by hydropower plants.
Relaxing the minimum outflow constraint increases the range over which hydropower plants can modulate their generation within the day. This effect is partially compensated by the seasonal complementarity between hydropower and VRE. The additional operational flexibility allows reservoirs to preserve higher storage levels during drought periods, improving their capability to supply electricity in subsequent hydrological seasons. Changes in hydropower operating patterns during October 2030 are reflected in the indicators presented in Table 5. Mean VRE and hydropower generation, maximum hydropower generation, and the maximum-to-mean hydropower generation ratio are reported for each operating strategy.
Table 5.
Hydropower generation indicators for October 2030.
Considering all 42 simulated scenarios for October, the Qmin800+ANA case exhibits lower hydropower generation on average than the Qmin1300 case, with this reduction offset by a corresponding increase in VRE generation. Despite the lower average hydropower generation during this dry-season month, the Qmin800+ANA case exhibits greater generation modulation in response to variations in VRE availability. The lower hydropower generation levels, combined with a greater contribution from VRE, provide additional room for hydropower plants to adjust their output when renewable generation decreases. Thus, the results across the full set of simulated scenarios reinforce the greater capability of hydropower to respond flexibly to variations in VRE availability when the minimum outflow constraint is relaxed.
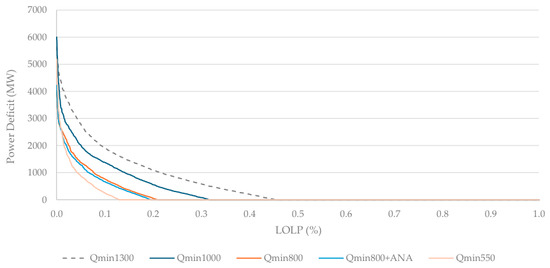
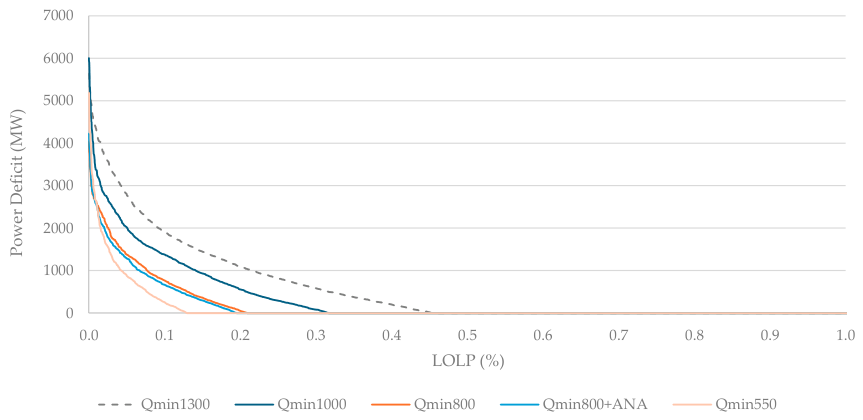
Despite the reduction in average hydropower production, the less restrictive minimum outflow cases present lower Loss of Load Probability (LOLP) values for the simulated year of 2030, with the lowest LOLP observed for Qmin550, followed by Qmin800. In particular, the LOLP decreases from 0.45% in the Qmin1300 case to 0.20% in the Qmin800 case, indicating a lower risk of supply shortages (Figure 13). This result suggests that the additional operational flexibility provided by the less restrictive minimum outflow requirement can improve the system’s ability to meet demand during critical conditions. Here, LOLP is calculated as the ratio between the number of hourly conditions with power deficit and the total number of hourly conditions across all simulated scenarios for 2030:
where Ndef,h is the total number of hourly conditions with power deficit across all simulated scenarios, and Ntot,h is the total number of hourly conditions across all scenarios.
Figure 13.
LOLP for the year 2030.
These results suggest that increasing operational flexibility through more adaptive environmental flow constraints can improve overall system reliability while simultaneously supporting multiple environmental and water use objectives during periods of water scarcity.
4. Conclusions
This study evaluated how different hydraulic operating constraints affect the ability of hydropower reservoirs to provide flexibility in a power system with increasing shares of VRE. The analysis combined long-term stochastic optimization with detailed hourly simulation under different hydrological and renewable generation conditions. Relaxing the minimum outflow constraint combined with the introduction of a maximum downstream outflow constraint increased the useful storage of the Sobradinho reservoir by approximately 30 percentage points at the end of the dry season, strengthening the role of this reservoir in regulating downstream hydropower operation. The alternative operating strategies also reduced irrigation and minimum outflow violations and total operating costs. In addition, despite the lower average hydropower generation, the results showed greater hydropower modulation under critical renewable generation conditions, while the hourly LOLP for the year evaluated was reduced by approximately 0.25 percentage points.
Overall, the results highlight the changing role of reservoir hydropower in systems with high shares of VRE, where preserving water and increasing operational flexibility can enhance the capability of hydropower to complement variable renewable generation and improve system reliability. The findings reinforce the importance of balancing power system requirements with environmental constraints and multiple water use objectives when defining reservoir operating strategies.
Author Contributions
Conceptualization, S.Q.B. and E.E.R.; methodology, S.Q.B.; software, S.Q.B.; validation, S.Q.B., E.E.R. and R.N.V.; formal analysis, S.Q.B.; investigation, S.Q.B.; resources, S.Q.B.; data curation, S.Q.B.; writing—original draft preparation, S.Q.B.; writing—review and editing, S.Q.B., E.E.R. and R.N.V.; visualization, S.Q.B.; supervision, E.E.R.; project administration, S.Q.B. All authors have read and agreed to the published version of the manuscript.
Funding
This research received no external funding.
Data Availability Statement
The original contributions presented in this study are included in the article/references. Further inquiries can be directed to the corresponding author.
Acknowledgments
The authors would like to acknowledge the use of ChatGPT (OpenAI, GPT-5.2, https://chat.openai.com/) during the preparation of this manuscript for the purpose of improving grammar, clarity, and language. The authors have reviewed and edited the output and take full responsibility for the content of this publication.
Conflicts of Interest
Author Roney Nakano Vitorino was employed by the company Empresa de Pesquisa Energética. The remaining authors declare that the research was conducted in the absence of any commercial or financial relationships that could be construed as a potential conflict of interest.
Abbreviations
The following abbreviations are used in this manuscript:
| AMA | Anemometric Measurement System |
| ANA | Brazilian National Water Agency (Agência Nacional de Águas) |
| CVaR | Conditional Value at Risk |
| ENS | Energy Not Supplied |
| LOLP | Loss of Load Probability |
| SAM | System Advisor Model |
| SDDP | Stochastic Dual Dynamic Programming |
| SOS2 | Special Ordered Set of Type 2 |
| VRE | Variable renewable energy |
References
- International Energy Agency. Net Zero Roadmap: A Global Pathway to Keep the 1.5 °C Goal in Reach—2023 Update. Available online: https://iea.blob.core.windows.net/assets/8ad619b9-17aa-473d-8a2f-4b90846f5c19/NetZeroRoadmap_AGlobalPathwaytoKeepthe1.5CGoalinReach-2023Update.pdf (accessed on 29 July 2026).
- International Renewable Energy Agency. RE-Organising Power Systems for the Transition. Available online: https://www.irena.org/-/media/Files/IRENA/Agency/Publication/2022/Jun/IRENA_Organising_Power_Systems_2022.pdf (accessed on 29 July 2026).
- International Energy Agency. Renewables 2025. Analysis and Forecasts to 2030. Available online: https://www.iea.org/reports/renewables-2025 (accessed on 15 August 2026).
- Othman, M.E.F.; Sidek, L.M.; Basri, H.; El-Shafie, A.; Ahmed, A.N. Climate Challenges for Sustainable Hydropower Development and Operational Resilience: A Review. Renew. Sustain. Energy Rev. 2025, 209, 115108. [Google Scholar] [CrossRef] [Scilit]
- IEA. Hydropower Flexible Hydropower Providing Value to Renewable Energy Integration. Available online: https://ieahydro.org/wp-content/uploads/2025/10/IEAHydroTCP_AnnexIX_White-Paper_Oct2019.pdf (accessed on 29 July 2026).
- Mohammadpour, P.; Mahjabin, T.; Fernandez, J.; Grady, C. From National Indices to Regional Action—An Analysis of Food, Energy, Water Security in Ecuador, Bolivia, and Peru. Environ. Sci. Policy 2019, 101, 291–301. [Google Scholar] [CrossRef] [Scilit]
- Schäffer, L.E.; Bakken, T.H.; Helseth, A.; Korpås, M. Optimal Operation of Hydropower Systems with Environmental Constraints on Reservoir Management. Renew. Energy 2026, 261, 125258. [Google Scholar] [CrossRef] [Scilit]
- Baratgin, L.; Quirion, P.; Polcher, J.; Dumas, P. Coupling a Power System Model with a Hydrological Model Improves the Representation of Sub-Monthly Hydropower Flexibility. Appl. Energy 2025, 401, 126694. [Google Scholar] [CrossRef] [Scilit]
- Jin, X.; Cheng, C.; Cai, S.; Yan, L.; Zhao, Z. Using Stochastic Dual Dynamic Programming to Design Long-Term Operation Policy of Hydro-Wind-Solar Energy Systems Considering Multiple Coupled Uncertainties and End-of-Year Carryover Storage. Appl. Energy 2025, 393, 126072. [Google Scholar] [CrossRef] [Scilit]
- Wang, J.; Zhao, Z.; Zhou, J.; Cheng, C.; Su, H. Co-Optimization for Day-Ahead Scheduling and Flexibility Response Mode of a Hydro–Wind–Solar Hybrid System Considering Forecast Uncertainty of Variable Renewable Energy. Energy 2024, 311, 133379. [Google Scholar] [CrossRef] [Scilit]
- Micocci, D.; Bragalli, C.; Toth, E.; Wechsler, T.; Zappa, M. Hybridization of an Alpine Pumped-Storage Hydropower Plant with Floating Solar Photovoltaics: A Study from the Water Resource Perspective. Renew. Energy 2025, 253, 123530. [Google Scholar] [CrossRef] [Scilit]
- Knittel, T.; Wild, P.; Rowe, A. Balancing Generation Shortages and Curtailment: The Role of Large Reservoir Hydro under High Penetration of Variable Renewable Energy Resources. Energy 2026, 353, 141036. [Google Scholar] [CrossRef] [Scilit]
- Ferraz de Campos, É.; Pereira, E.B.; van Oel, P.; Martins, F.R.; Gonçalves, A.R.; Costa, R.S. Hybrid Power Generation for Increasing Water and Energy Securities during Drought: Exploring Local and Regional Effects in a Semi-Arid Basin. J. Environ. Manag. 2021, 294, 112989. [Google Scholar] [CrossRef] [Scilit]
- Brandão, S.Q.; Rego, E.E.; Pillar, R.V.; de Carvalho, R.N.F. Hydropower Enhancing the Future of Variable Renewable Energy Integration: A Regional Analysis of Capacity Availability in Brazil. Energies 2024, 17, 3339. [Google Scholar] [CrossRef] [Scilit]
- Pavičević, M.; Huallpara, A.; Yu, A.; Balderrama, S.; Ploussard, Q. Water Value and Market Response Functions in Hydropower-Dominated Electricity Systems: A Systematic Review and Methodological Comparison. Renew. Sustain. Energy Rev. 2026, 235, 116952. [Google Scholar] [CrossRef] [Scilit]
- Agência Nacional de Águas (ANA). Resolução N° 2.081. 2017. Available online: https://www.gov.br/ana/pt-br/legislacao/resolucoes/resolucoes-regulatorias/2017/2081 (accessed on 29 July 2026).
- IPCC. Climate Change 2021—The Physical Science Basis. In Summary for Policymakers; Cambridge University Press: Cambridge, UK, 2023. [Google Scholar] [CrossRef] [Scilit]
- de Lucena, A.F.P.; Szklo, A.S.; Schaeffer, R.; de Souza, R.R.; Borba, B.S.M.C.; da Costa, I.V.L.; Pereira, A.O., Jr.; da Cunha, S.H.F. The Vulnerability of Renewable Energy to Climate Change in Brazil. Energy Policy 2009, 37, 879–889. [Google Scholar] [CrossRef] [Scilit]
- Schmidt, J.; Cancella, R.; Pereira, A.O. Combing Windpower and Hydropower to Decrease Seasonal and Inter-Annual Availability of Renewable Energy Sources in Brazil; Discussion Paper DP-56-2014; Institute for Sustainable Economic Development, University of Natural Resources and Life Sciences: Vienna, Austria, 2014. [Google Scholar]
- Cantão, M.P.; Bessa, M.R.; Bettega, R.; Detzel, D.H.M.; Lima, J.M. Evaluation of Hydro-Wind Complementarity in the Brazilian Territory by Means of Correlation Maps. Renew. Energy 2017, 101, 1215–1225. [Google Scholar] [CrossRef] [Scilit]
- Ávila, L.; Mine, M.R.M.; Kaviski, E.; Detzel, D.H.M. Evaluation of Hydro-Wind Complementarity in the Medium-Term Planning of Electrical Power Systems by Joint Simulation of Periodic Streamflow and Wind Speed Time Series: A Brazilian Case Study. Renew. Energy 2021, 167, 685–699. [Google Scholar] [CrossRef] [Scilit]
- PSR, Inc. SDDP. Available online: https://www.psr-inc.com/en/software/sddp/ (accessed on 30 July 2026).
- Wallace, S.W.; Fleten, S.-E. Stochastic Programming Models in Energy. In Handbooks in Operations Research and Management Science; Ruszczyński, A., Shapiro, A., Eds.; Elsevier: Amsterdam, The Netherlands, 2003; Volume 10, pp. 637–677. [Google Scholar]
- Pereira, M.V.F.; Pinto, L.M.V.G. Multi-Stage Stochastic Optimization Applied to Energy Planning. Math. Program. 1991, 52, 359–375. [Google Scholar] [CrossRef] [Scilit]
- Empresa de Pesquisa Energética (EPE). Base de Dados Integrada de Geração e Transmissão; Empresa de Pesquisa Energética (EPE): Rio de Janeiro, Brazil, 2026. Available online: https://www.epe.gov.br/pt/areas-de-atuacao/energia-eletrica/estudos-integrados-de-geracao-e-transmissao/base-de-dados-integrada-de-geracao-e-transmissao (accessed on 9 September 2026).
- Empresa de Pesquisa Energética (EPE). Geração Eólica e Fotovoltaica—Dados de Entrada Para Modelos de Energia: Metodologia e Premissas; NT EPE-DEE-011/2021-R3; Rio de Janeiro, Brazil, 2024. Available online: https://www.epe.gov.br/pt/publicacoes-dados-abertos/publicacoes/nota-tecnica-dados-de-entrada-para-modelos-eletricos-e-energeticos-metodologias-e-premissas-versao-r3 (accessed on 9 September 2026).
- Empresa de Pesquisa Energética (EPE). Sistema AMA. Available online: https://www.epe.gov.br/pt/acesso-restrito/sistema-ama (accessed on 30 July 2026).
- Empresa de Pesquisa Energética (EPE). PDE 2035. Available online: https://www.epe.gov.br/sites-pt/publicacoes-dados-abertos/publicacoes/Documents/PDE%202035_Relat%c3%b3rio%20Final_Aprovado.pdf (accessed on 30 July 2026).
- Comitê de Bacia Hidrográfica do Rio São Francisco (CBHSF). Plano de Recursos Hídricos Da Bacia Hidrográfica Do Rio São Francisco 2016–2025, Resumo Executivo. Available online: https://cbhsaofrancisco.org.br/plano-de-recursos-hidricos-da-bacia-hidrografica-do-rio-sao-francisco/ (accessed on 30 July 2026).
- Marengo, J.A.; Alves, L.M.; Soares, W.R.; Rodriguez, D.A.; Camargo, H.; Riveros, M.P.; Pabló, A.D. Two Contrasting Severe Seasonal Extremes in Tropical South America in 2012: Flood in Amazonia and Drought in Northeast Brazil. J. Clim. 2013, 26, 9137–9154. [Google Scholar] [CrossRef] [Scilit]
- Guilhon, L.G.F.; de Paiva, L.F.G.; Rocha, V.F.; da Silva, D.N.; Camargo Junior, H. A Gestão da Crise Hídrica da Bacia do Rio São Francisco e Seus Impactos da Operação do Sistema Interligado Nacional. In Proceedings of the XXIII Simpósio Brasileiro de Recursos Hídricos, Foz do Iguaçu, Brazil, 2019. [Google Scholar]
- Medeiros, Y.; Pinto, I.M.; Stifelman, G.M.; Faria, A.d.S.; Pelli, J.C.S.; Rodrigues, R.F.; Silva, E.R.; Costa, T.; Boccacio, M.X.; Silva, E.B.G. Participação Social No Processo de Alocação de Água, No Baixo Curso Do Rio São Francisco; Universidade Federal da Bahia (UFBA): Salvador, Brazil, 2010. [Google Scholar]
- Cavalcante, G.; Vieira, F.; Campos, E.; Brandini, N.; Medeiros, P.R.P. Temporal Streamflow Reduction and Impact on the Salt Dynamics of the São Francisco River Estuary and Adjacent Coastal Zone (NE/Brazil). Reg. Stud. Mar. Sci. 2020, 38, 101363. [Google Scholar] [CrossRef] [Scilit]
- ONS. Avaliação Das Condições de Atendimento Eletroenergértico Do Sistema Interligado Nacional—Estudo Prospectivo de Julho a Novembro de 2021. Available online: www.ons.org.br/AcervoDigitalDocumentosEPublicacoes/CTA-ONS%20DGL%201496-2021%20-%20Avaliação%20das%20Condições%20de%20Atendimento%20Eletroenergético%20do%20Sistema%20Interligado%20Nacional%20-%20SIN.pdf (accessed on 1 October 2023).
- Zhao, Z.; Cheng, C.T.; Yan, L. An Efficient and Accurate Mixed-Integer Linear Programming Model for Long-Term Operations of Large-Scale Hydropower Systems. IET Renew. Power Gener. 2021, 15, 1178–1190. [Google Scholar] [CrossRef] [Scilit]

Disclaimer/Publisher’s Note: The statements, opinions and data contained in all publications are solely those of the individual author(s) and contributor(s) and not of MDPI and/or the editor(s). MDPI and/or the editor(s) disclaim responsibility for any injury to people or property resulting from any ideas, methods, instructions or products referred to in the content. |
© 2026 by the authors. Licensee MDPI, Basel, Switzerland. This article is an open access article distributed under the terms and conditions of the Creative Commons Attribution (CC BY) license.