


Abstract
Distributed Acoustic Sensing (DAS) has revolutionized ambient noise interferometry, yet the reliability of retrieved empirical Green’s functions (EGFs) remains highly sensitive to non-diffuse noise fields and anthropogenic transients. In complex or noisy environments, global metrics frequently misclassify signal convergence due to out-of-band environmental noise, scattered coda, and non-stationary directional transients. Using both 30 min and 4 h passive recordings, this study presents a physics-guided quality control framework for evaluating interferometric diagnostics. Specifically, this study employs the signal-to-trailing noise ratio (STRN), signal-to-precursory noise ratio (SPNR), and spectral signal-to-noise ratio (SSNR) within the surface-wave arrival window . Global phase metrics remain heavily suppressed regardless of stacking duration, whereas the surface-windowed SPNR exhibits an extraordinary statistical shift (p < 0.001), reaching 0.870 ± 0.106 at 30 min and 0.967 ± 0.034 at 4 h. We implement one-to-one correspondence between surface-windowed indicator values and fundamental-mode Rayleigh wave dispersion sharpness. In severely noise-contaminated segments, unwindowed global metrics yield distorted dispersion ridges with severe energy leakage, but the surface-wave window results in an increase in the SPNR above 0.70, fully reconstructing continuous dispersion trajectories (250–500 m/s). Grounded in these results, we formalize a standardized four-step quality control workflow (from velocity windowing to metric calculation, automation, and data output) and outline tailored adaptation guidelines for urban, mountainous, and industrial DAS deployments. This framework provides an automated, physically sound protocol that eliminates manual selection, optimizes computational efficiency, and ensures reliable dispersion extraction for passive DAS imaging.
1. Introduction
Ambient noise interferometry has become an essential technique that has led to the extraction of empirical Green’s functions (EGFs) from continuous seismic recordings over the past two decades due to its high resolution and non-invasive and non-destructive characteristics [1]. Its principle relies on the cross-correlation of diffuse seismic wavefields recorded at two receivers (i.e., coherent noise), which under ideal conditions converge toward the Green’s function between them [2]. Moreover, the first attempt at conducting seismic near-surface monitoring using the approach of ambient noise surface-wave interferometry was made by Sabra et al. [2] and Shapiro et al. [3]. One study that performed an analysis of ambient noise data to obtain reliable surface-wave dispersion measurements was the first that explicitly used a processing framework for seismic ambient noise interferometry [4]. This technique has been widely applied to surface-wave tomography, subsurface monitoring, and near-surface imaging in both offshore and onshore settings [5,6,7,8].
Distributed Acoustic Sensing (DAS) is a transformative technology in seismic monitoring, allowing fiber-optic cables to function as large-scale seismic arrays capable of spanning distances of up to 100 km [9,10,11,12,13]. DAS technology is gaining widespread adoption in seismology, with its use rapidly expanding. Numerous studies have focused on demonstrating the effectiveness of DAS in detecting seismic events across a range of conditions [14,15,16,17,18,19,20,21,22,23].
Moreover, DAS has significantly enhanced the capabilities of ambient noise interferometry through its dense spatiotemporal sampling, proving highly effective for passive surface-wave imaging [24,25]. It is worthwhile to mention that DAS applications with ambient noise interferometry have touched on many aspects in seismology, varying from fault and early warning detection to environmental studies, pipeline security, and subsurface characterization [26,27,28,29,30]. Furthermore, the technology has enabled 3D tomography for mineral exploration, demonstrating its versatility across scales [31]. Despite these advantages, passive DAS interferometry faces several challenges, viz. an instrument’s self-noise that often exceeds the signal intensity of coherent noise and the precursor signals produced by heterogeneous noise distribution [24,30]. One study that reviewed the same field deployments for both conventional seismic and DAS systems acknowledged distinct challenges for DAS in low-frequency seismic monitoring compared to inertia sensors [32]. Traditionally, EGF symmetry has served as a primary diagnostic for interferometric convergence, assuming a diffuse and isotropic wavefield [33]. This analogy only matches the ambient noise interferometry analysis in conventional seismic monitoring, since the cross-correlation isotropic wavefield is verified by many studies, with a tendency to improve Green’s function estimation among receivers [5]. However, directional urban noise and persistent oceanic sources often destabilize this symmetry, complicating the transition from conventional seismic theory to practical DAS deployment [6,8].
Many DAS ambient noise studies employ symmetry-based signal-to-noise ratios to evaluate the quality of ambient noise correlations without considering the balance in signal amplitude that must exist between causal and acausal signal lags. Unlike conventional geophones, DAS measures axial strain rate rather than particle velocity, making recorded wavefields more sensitive to cable coupling, gauge length, directional illumination, and interrogator noise [25]. Consequently, passive DAS records frequently violate the diffuse-wavefield assumption underlying classical interferometry, resulting in asymmetric noise correlation functions even after extensive preprocessing. Moreover, ensuring metric validation of EGF signals using quantitative indicators (i.e., signal-to-precursor noise ratio (SPNR), the signal-to-trailing noise ratio (STNR), and the spectral SNR [4,34,35]) is crucial for the emergence of phase and the envelope symmetry of the wavefield. However, these metrics have been proven to be effective in conventional ambient noise studies, except for SSNR, which has recently been used in DAS traffic ambient noise [24]. The three indicators evaluate the entire NCF, which includes random noise, body waves, late coda, and instrument noise, none of which are physically relevant. Therefore, global symmetry metrics may not accurately reflect the quality of surface-wave NCF used for dispersion analysis. Despite considerable progress in passive DAS interferometry, some important methodological gaps remain. Most existing DAS quality control methods evaluate the full correlation function rather than the physically meaningful surface-wave arrivals. Current studies rarely establish quantitative relationships between symmetry metrics and the actual quality of dispersion imaging. No end-to-end evaluation framework currently exists that combines physics-guided arrival windowing, symmetry diagnostics, spectral quality assessment, and dispersion energy validation across different observation durations.
Unlike previous studies that compute quality metrics over the entire noise correlation function, this work introduces a physics-guided windowed symmetry framework in which the STNR, SPNR, and SSNR are evaluated only within the predicted surface-wave arrival window. The proposed framework directly links quality metrics with dispersion energy strength to establish whether improved Green’s function symmetry translates into improved dispersion imaging. Using both 30 min and 4 h passive DAS datasets from the Pyrenees experiment, the study demonstrates that global symmetry metrics are unreliable predictors of dispersion quality. In contrast, the surface-wave-windowed SPNR provides the strongest correspondence with dispersion energy formation. To the best of our knowledge, this is the first end-to-end quality control framework to integrate physically constrained symmetry evaluation with quantitative dispersion validation for passive DAS ambient noise interferometry.
2. Materials and Methods
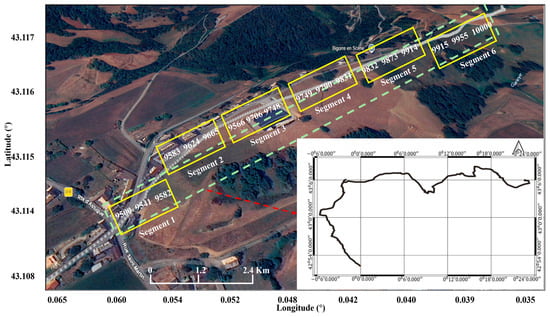
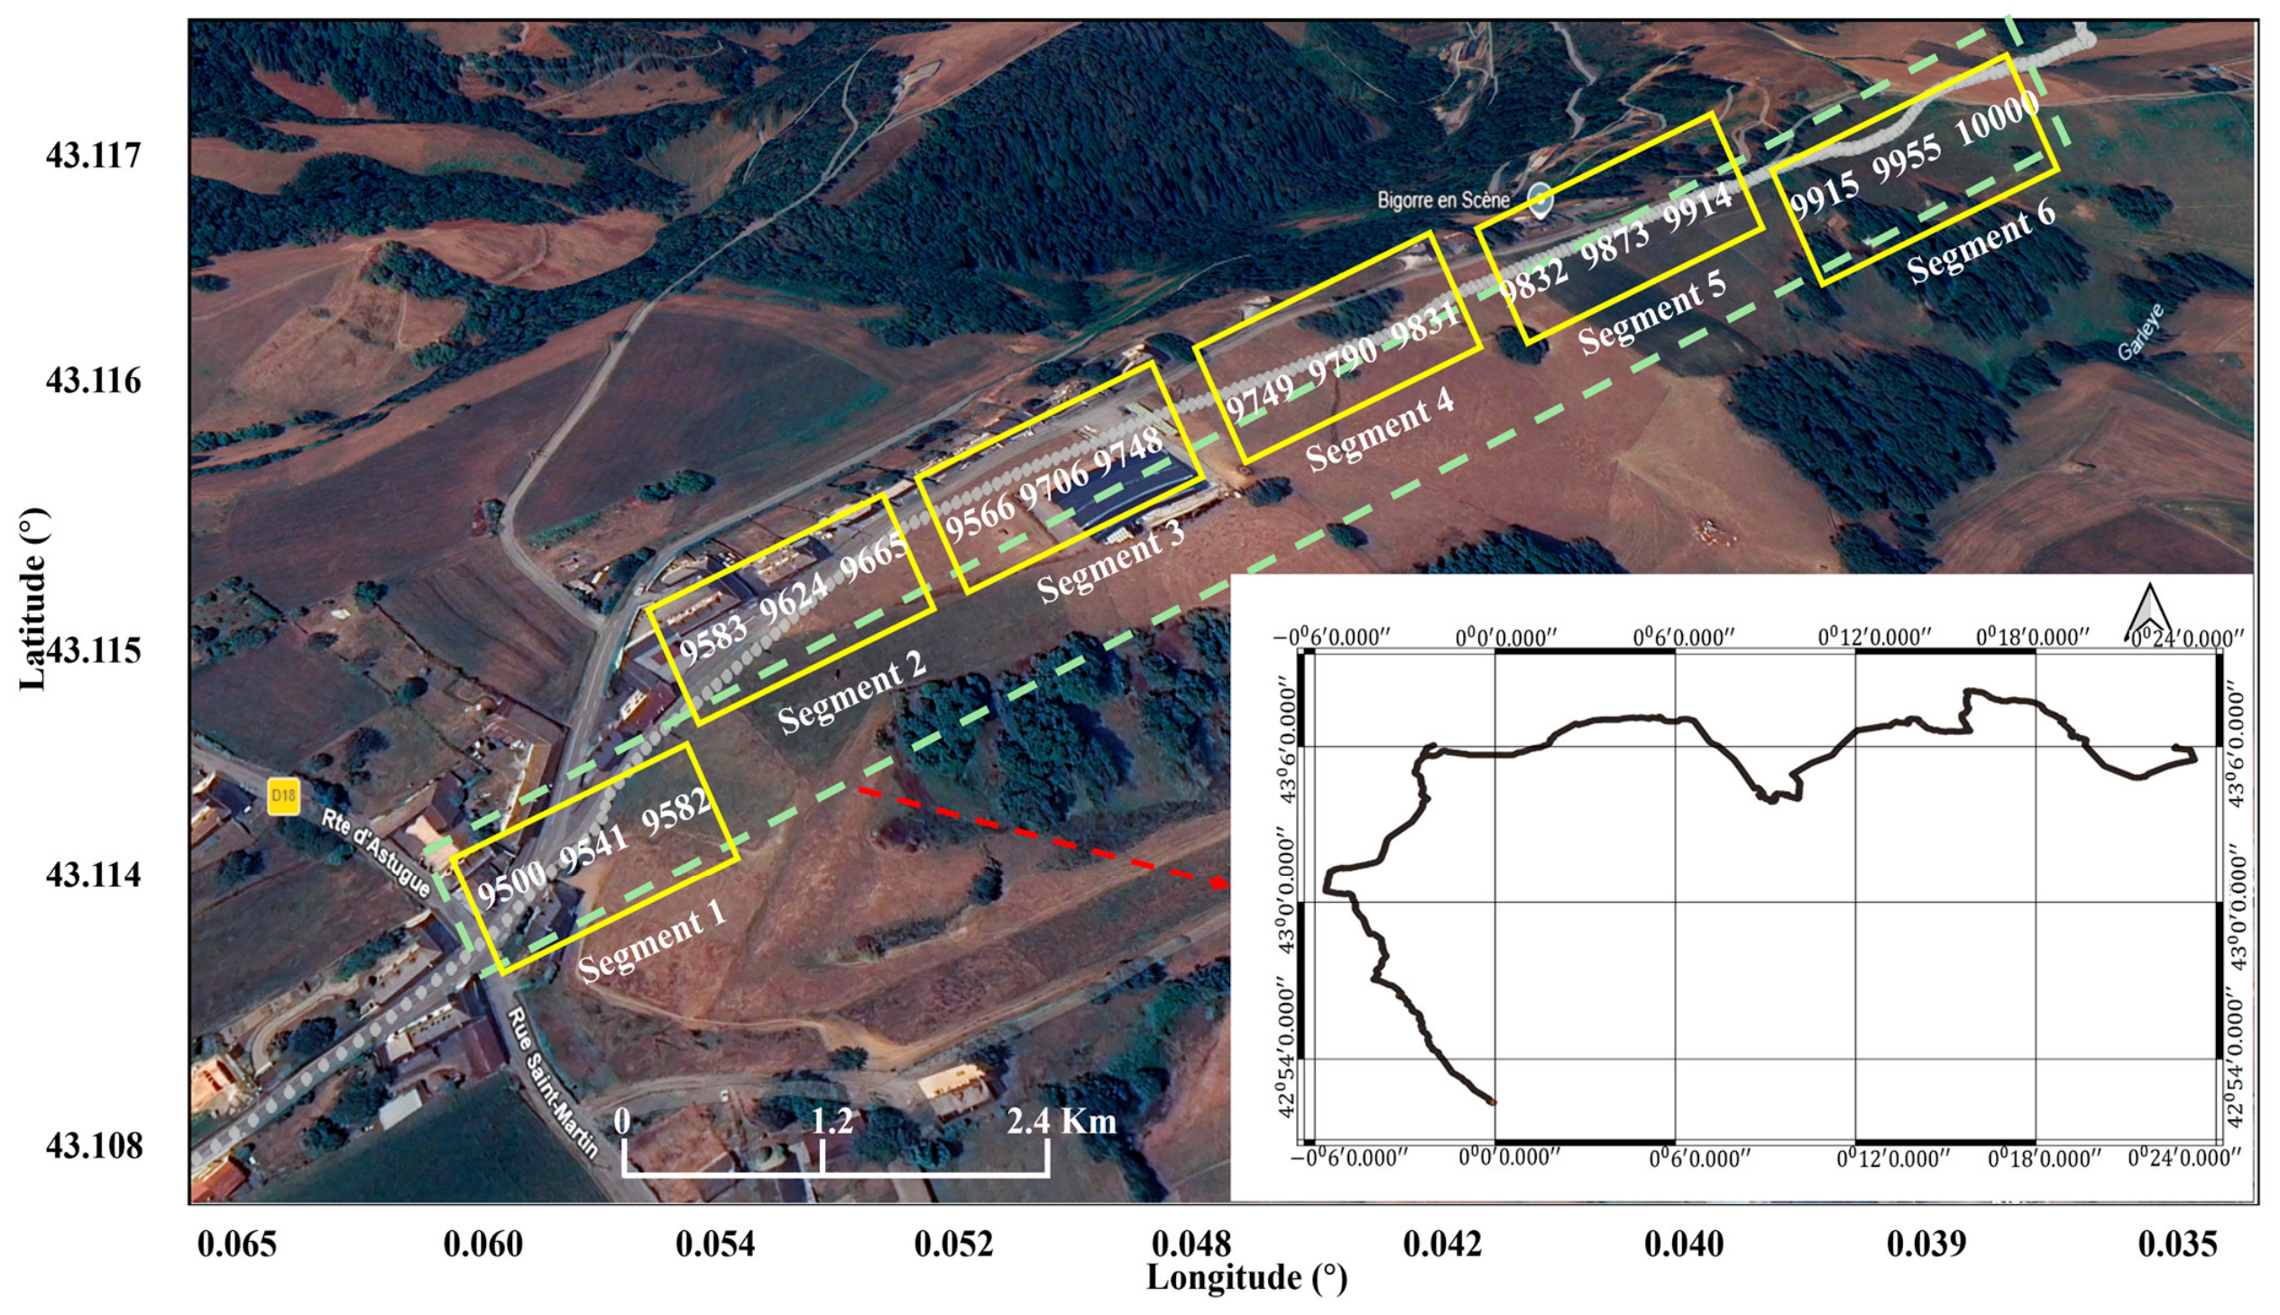
The analyses presented in this study were conducted using the Pyrenees Ambient Noise DAS (PAND) dataset. The dataset was acquired along an approximately 91 km telecommunication fiber-optic cable extending across the central Pyrenees between France, Spain, and Andorra (Figure 1). The cable traverses both rural and urban environments and therefore records a wide variety of naturally occurring and anthropogenic seismic wavefields. Although the original PAND deployment contains approximately 18,900 sensing channels, only 500 consecutive channels (channels 9500–10,000) were selected for this investigation. These channels correspond to a cable section located in a mountainous environment where continuous ambient seismic excitation is generated by multiple noise sources, including regional traffic activity, local anthropogenic vibration, wind-induced ground motion, and other naturally occurring environmental processes. Such heterogeneous ambient noise conditions provide a suitable test bed for evaluating the robustness of Green’s function retrieval and symmetry-based quality control metrics.
Figure 1.
Map of the study area and spatial configurations of the channel segments extracted from the main Pyrenees ambient noise DAS (PAND) dataset. Green dashed lines demarcate the specific cable segments analyzed in this study, with a red arrow pointing toward the study cable deployment on the regional map. Gray dotted lines represent individual DAS channels, and numbers within yellow callouts denote channel index boundaries.
The DAS system was operated with a sampling frequency of 25 Hz, corresponding to a sampling interval of 0.04 s. The sensing channels were separated by 4.8 m, while the interrogator employed a 10.6 m gauge length, allowing for dense spatial sampling of dynamic strain rate measurements along the fiber. Throughout this study, DAS measurements are treated as continuous strain rate records following the acquisition protocol provided with the original PAND dataset.
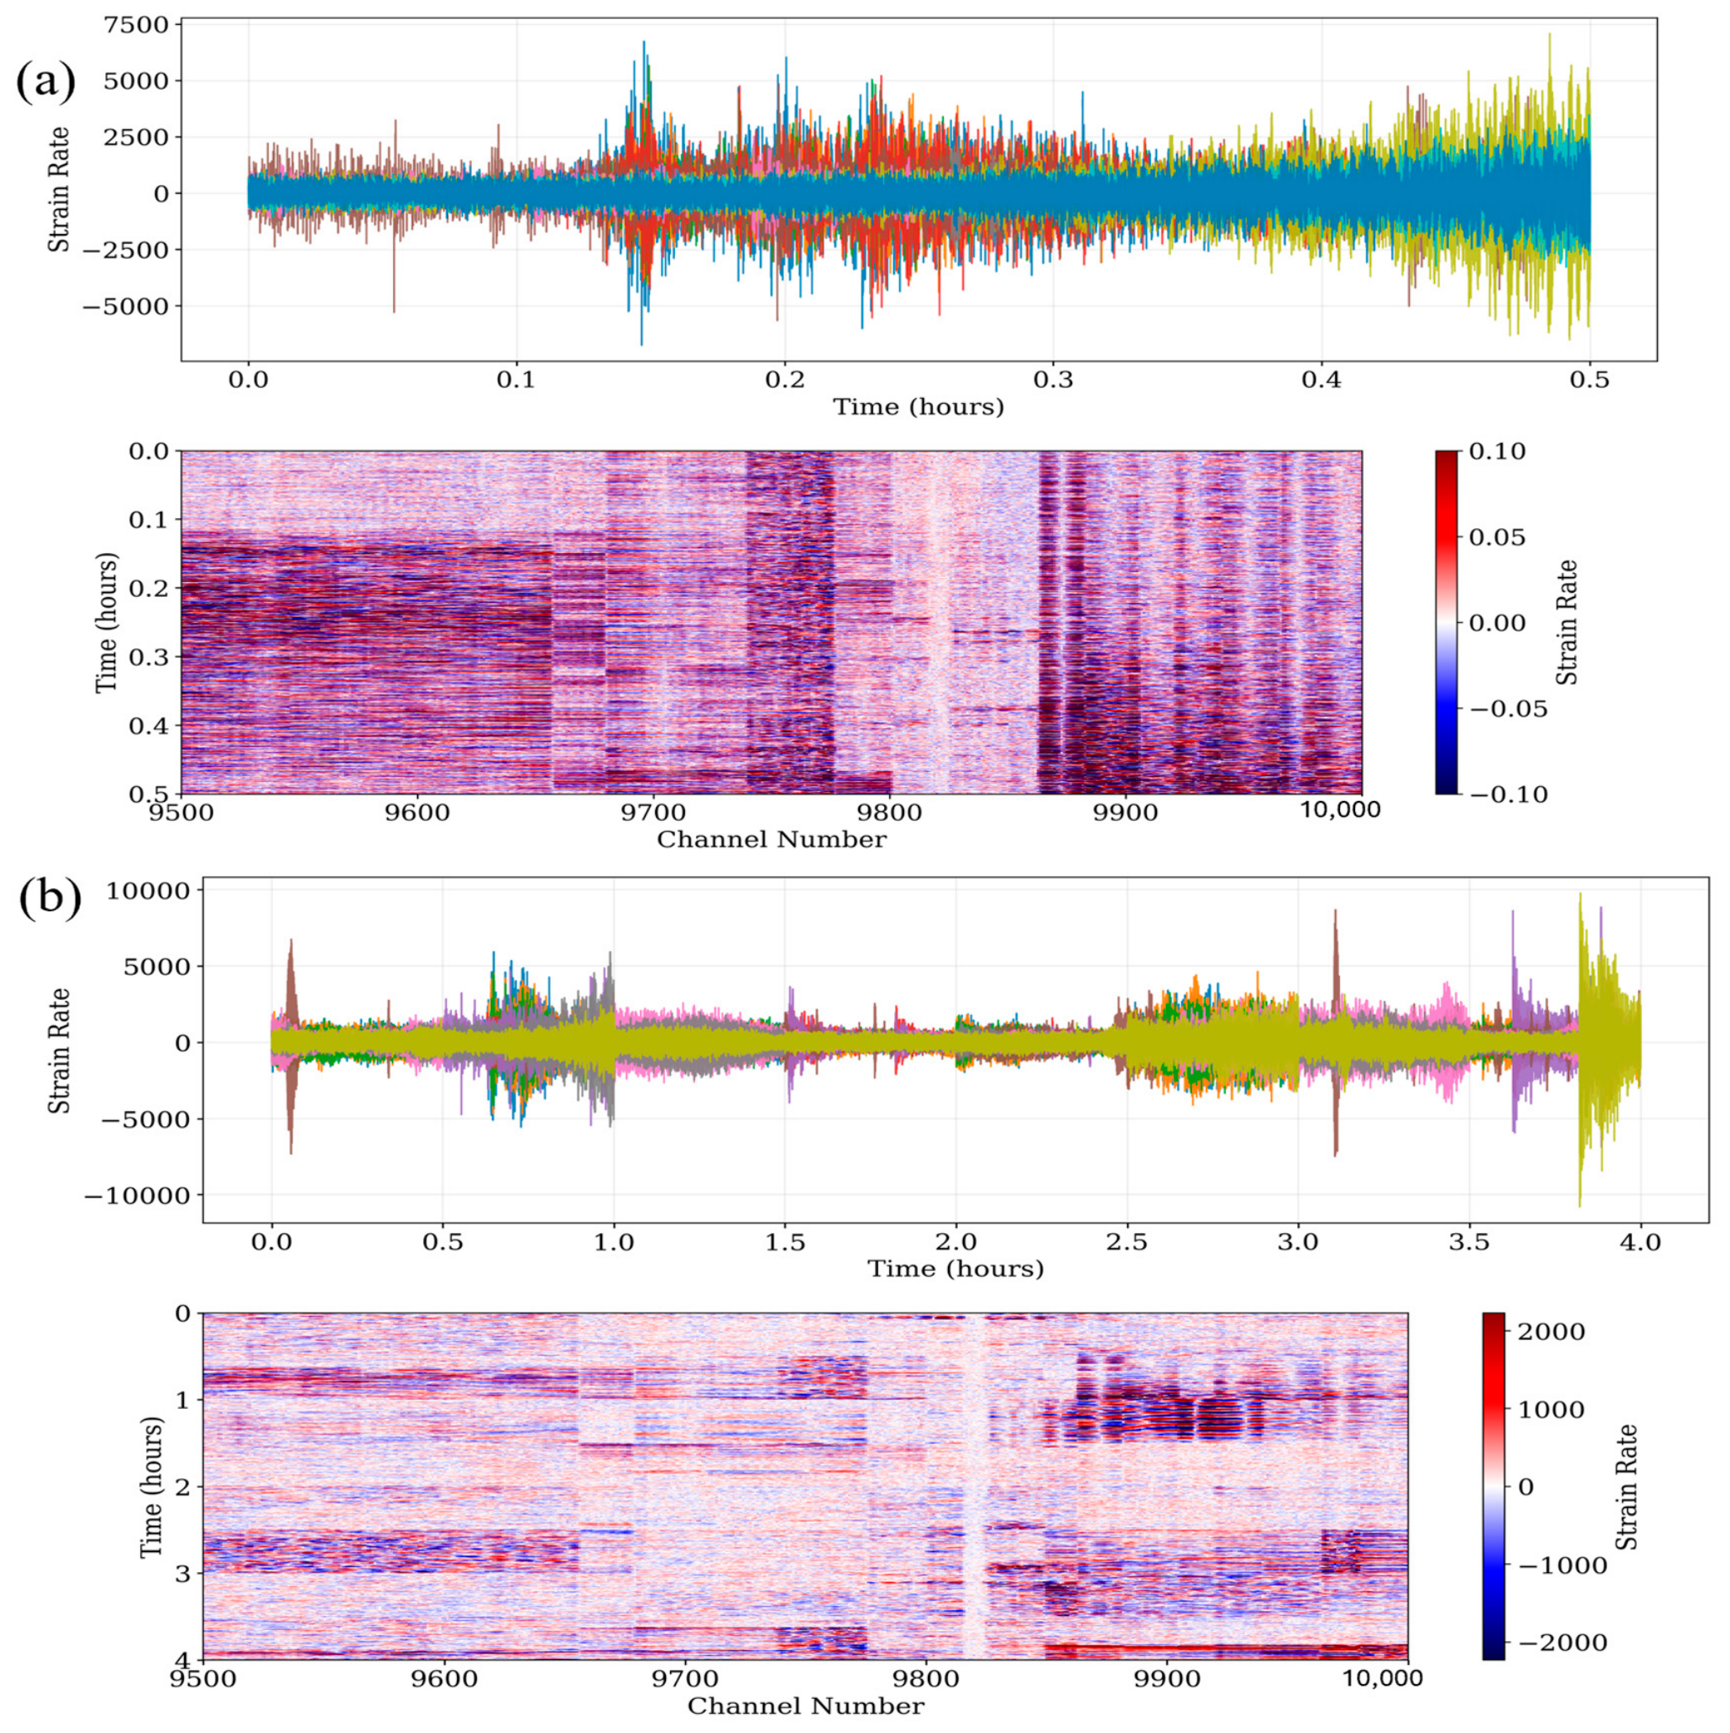
In Figure 1 above, Bigorre en Scène refers to a mountainous area in the Northern Pyrenees, in Hautes-Bigorre, France. To investigate the influence of observation duration on interferometric convergence, two independent recording lengths were extracted from the continuous acquisition. Records of 30 min and 4 h (Figure 2) were used to assess the empirical clarity of envelope symmetry and the phase emergence in the dispersion results. The timestep of the 30 min record is 45,001, and 360,008 is the corresponding timestep of the 4 h data. The shorter record represents practical monitoring situations where only limited acquisition time is available, whereas the longer record approximates conventional passive ambient noise acquisition used in many interferometric studies. This comparison enables direct evaluation of metric stability as a function of recording duration. Before interferometric processing, an initial quality assessment was performed to verify the continuity of the strain rate recordings and identify invalid or corrupted channels. Then, preprocessing steps were applied as established by Bensen et al. [4] to single DAS segments (i.e., each segment contains 83 non-overlapping DAS channels) rather than segment pairs. Temporal normalization was immediately applied after bandpass filtering (i.e., high cut-off = 1 Hz and low cut-off = 10 Hz), and then whitening concluded the preprocessing procedures.
Figure 2.
Heatmap and time series displays of 30 min and 4 h passive records. (a) A heatmap and time series of a 30 min DAS record. (b) A 4 h DAS record.
3. Results
3.1. Background to Metric Analysis
Ambient noise interferometry (ANI) facilitates the retrieval of the empirical Green’s function (EGF) through the cross-correlation of continuous seismic noise recorded at two discrete receivers. For instance, we chose six non-overlapping segments (Segments 1, 2, 3, 4, 5, and 6 in Figure 1) with 83 channels each. The middle channel (virtual source) of each segment was used to pair with other channels (virtual receivers) to estimate the EGF. This idea is distinct from the first-channel pairwise assumption made by Song et al. [24]. Using a middle-channel pairwise approach allows for timely, energy-sufficient pairwise NCF on both sides of the time lags. Moreover, DAS ambient noise interferometry is unlike seismic ambient noise interferometry, which often has equipartitioned wavefields and sufficient temporal averaging; the cross-correlation of the recorded ambient noise converges toward the Green’s function of the medium between the receivers [2]. For a receiver pair and , the cross-correlation function is defined as:
where is the total integration time or duration of the data segment being correlated, and are the recorded wavefields, represents the time lag, and is the absolute time of the recording. Under ideal conditions, the time derivative of the correlation approximates the difference between the causal and acausal Green’s functions:
is the causal Green’s function, representing the impulse response of the medium for a wave traveling from to , and is for a wave traveling from to . Equations (1) and (2) explain the cross-correlation function conditions between positive (causal) and negative (acausal) time lags, reflecting the balanced sampling of waves propagating in both directions. Consequently, the degree of symmetry is a primary diagnostic for EGF convergence [4]. However, non-diffuse noise fields (i.e., DAS ambient noise wavefields) are often driven by directional sources or transient anthropogenic events that introduce an asymmetrical response in one side of the time lags. This disparity is primarily attributed to the long-term monitoring in passive DAS, where the useful signals often settle within the frequency bands that are most susceptible to instrumental drift and environmental thermal fluctuations [32]. Quantifying these responses is essential for assessing the reliability of subsequent dispersion measurements.
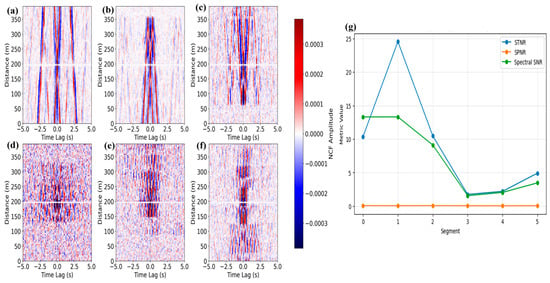
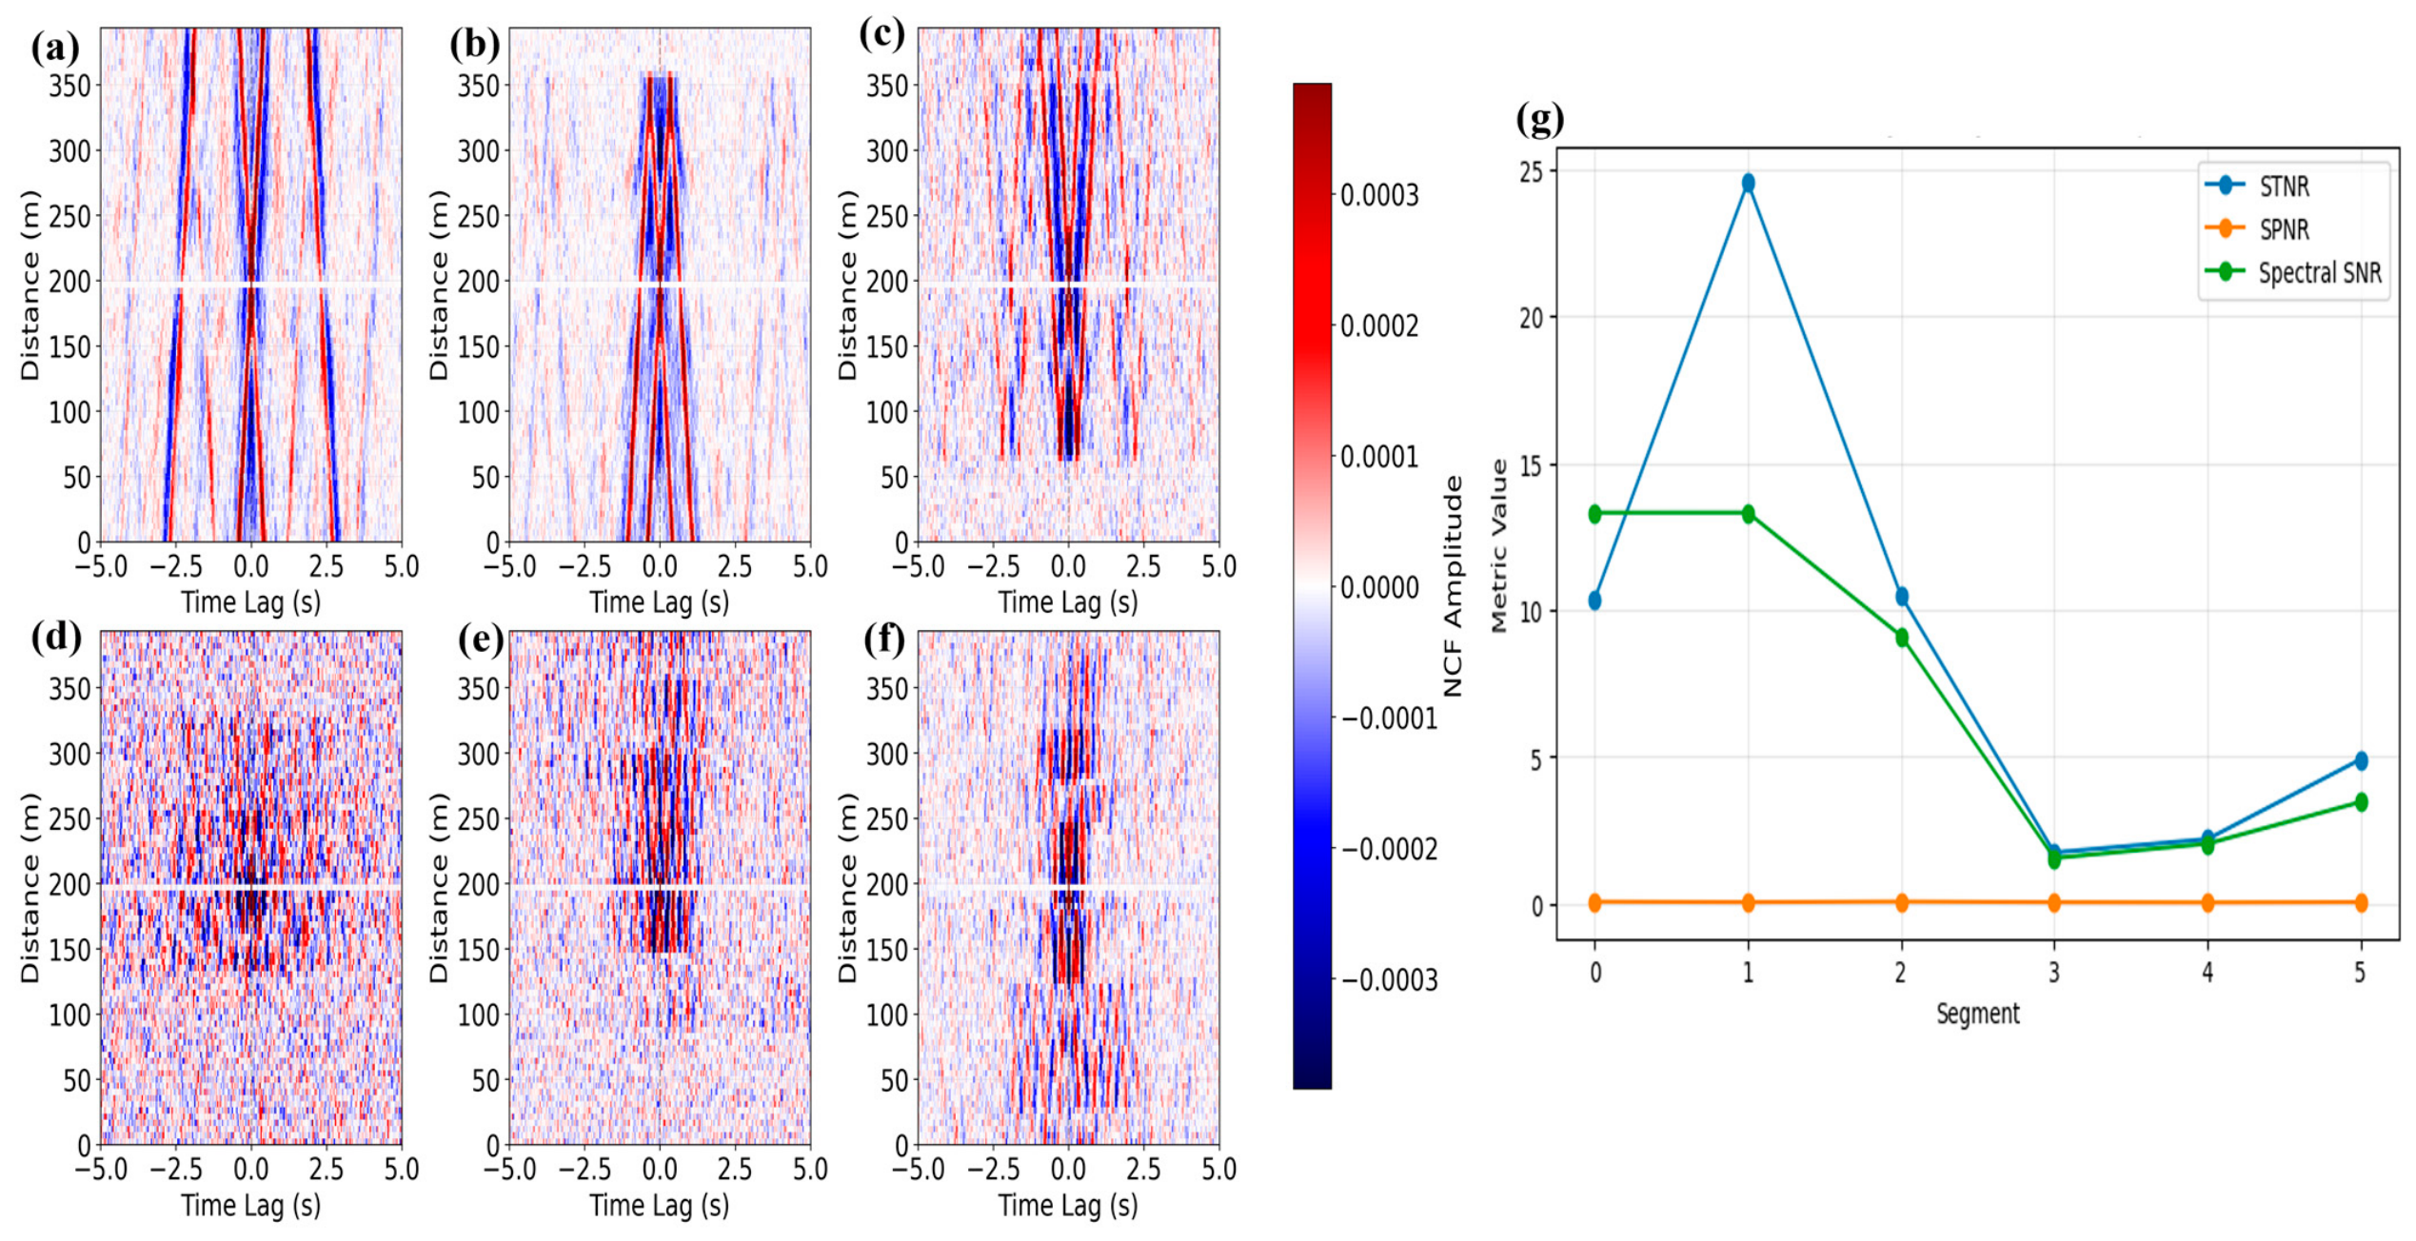
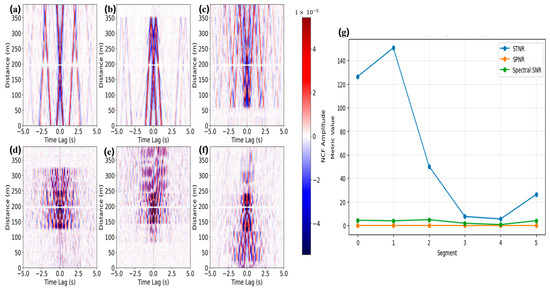
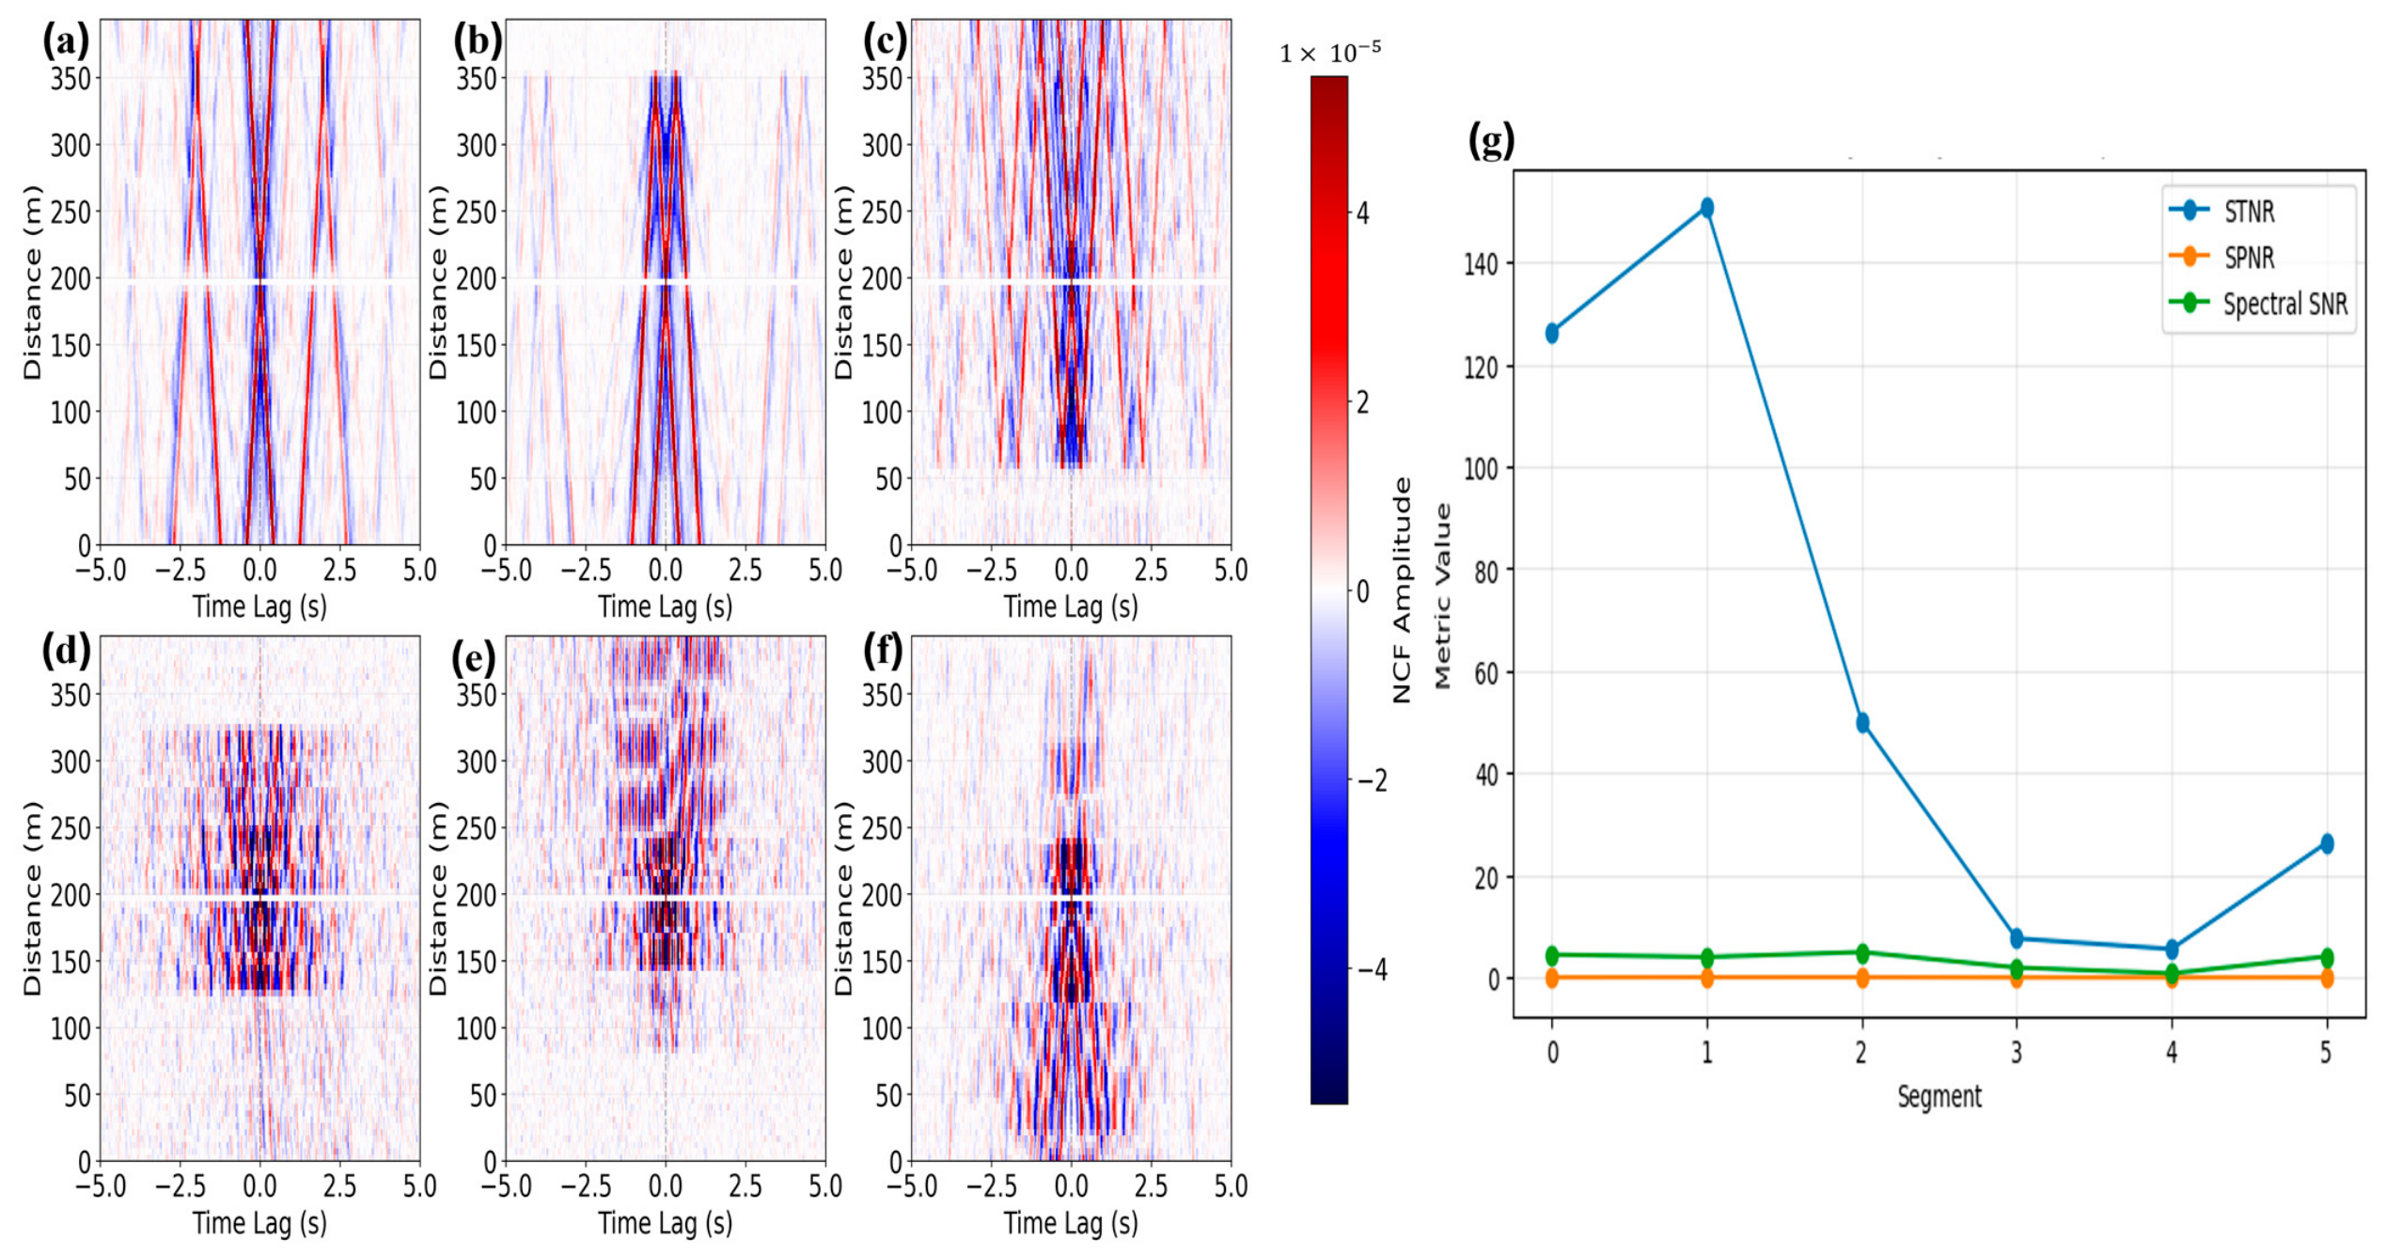
Individual correlation functions obtained from all temporal windows were subsequently combined using phase-weighted stacking (PWS). Correlations for the non-overlapping windows were computed with a phase-weighting power of 0.5 and a 30 s window length for both record durations. First, a 5 s global arrival time (window size) was used in both cases. Figure 3a–f are the results of common virtual gathers of the six segments for the 30 min record global NCF, and the interferometry noise comparison is shown in Figure 3g. The surface-wave arrival appears to extend beyond 2.5 s in both time lags, only in Segment 1, since the segment is closer to where traffic noise is most concentrated (Figure 1). Noise sources in Segments 1 and 2 are the most obsolete. At the same time, precursor signals affect Segments 3, 5, and 6 from both directions, except for Segment 4, which is mostly affected by wind-induced waves acting on the coupled fiber-optic cable below the ground. In contrast to the 30 min global NCF, the 4 h global NCF in Figure 4 confirmed the evidence that long-term stacking, on average, improves the SNR ratio [4]. However, precursory noise still appears in Segments 4 and 5, but it is negligible.
Figure 3.
Virtual source gathers and comparative metric performance (STNR, SPNR, and SSNR) computed across a 30 min global NCF stack. (a–f) Cross-correlation gathers showing surface-wave arrivals alongside precursory noise for Segments 1–6. The vertical white dashed line at the origin denotes the common virtual source location, from which causal and acausal wavefields propagate symmetrically. (g) Quantitative comparison across Segments 1–6.
Figure 4.
Virtual source gathers and comparative metric performance (STNR, SPNR, and SSNR) computed across a 4 h global NCF stack. (a–f) Cross-correlation gathers display coherent surface-wave propagation with minimal precursor noise, except for Segment 4, which exhibits persistent local interference. (g) Quantitative metric profiles across Segments 1–6.
Therefore, the resulting metric distributions provide quantitative measures of interferometric convergence and form the basis for evaluating Green’s function quality and dispersion reliability. Unlike previous studies that qualitatively describe ambient noise environments, this framework provides reproducible numerical quality indicators that directly characterize the usable surface-wave information contained within each DAS segment.
While the parameters (i.e., phase-weighted power, time window, etc.) used for the global symmetry (window) are well levelled on the NCF analysis, the study isolates coherent dispersive energy from out-of-band noise, and the surface-wave evaluation domain was dynamically adjusted from the unconstrained 5.0 s global lag spectrum to a physically bounded surface-wave arrival window. Baseline cross-correlation parameters, including phase-weighted stacking order and spectral whitening, were held constant across both evaluation schemes. The surface-wave time window was defined using a minimum phase velocity threshold of (≈0.50 s lag depending on channel offset) and a maximum phase velocity threshold of (≈0.04 s lag), augmented by a window half-width pad of centered around the arrival trajectory to accommodate dispersion pulse broadening.
A comparative evaluation across the 30 min global correlation records (Figure 3g) reveals that while the unwindowed STNR and SSNR display nominal consistency across Segments 3 through 6, global SPNR values fall consistently below acceptable thresholds for phase stability. Conversely, evaluating metrics within the surface-wave window across 4 h records (Figure 4g) yields stable, elevated values for both the SPNR and SSNR continuously from Segment 1 through Segment 6. This uniform stability across all segments confirms that phase-locking convergence within the kinematically predicted arrival window provides a physically authentic diagnostic of the quality of the fundamental-mode dispersion ridge.
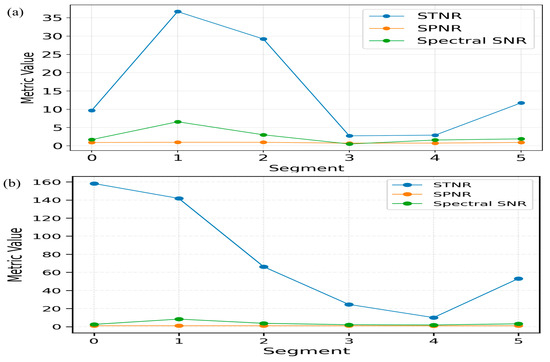
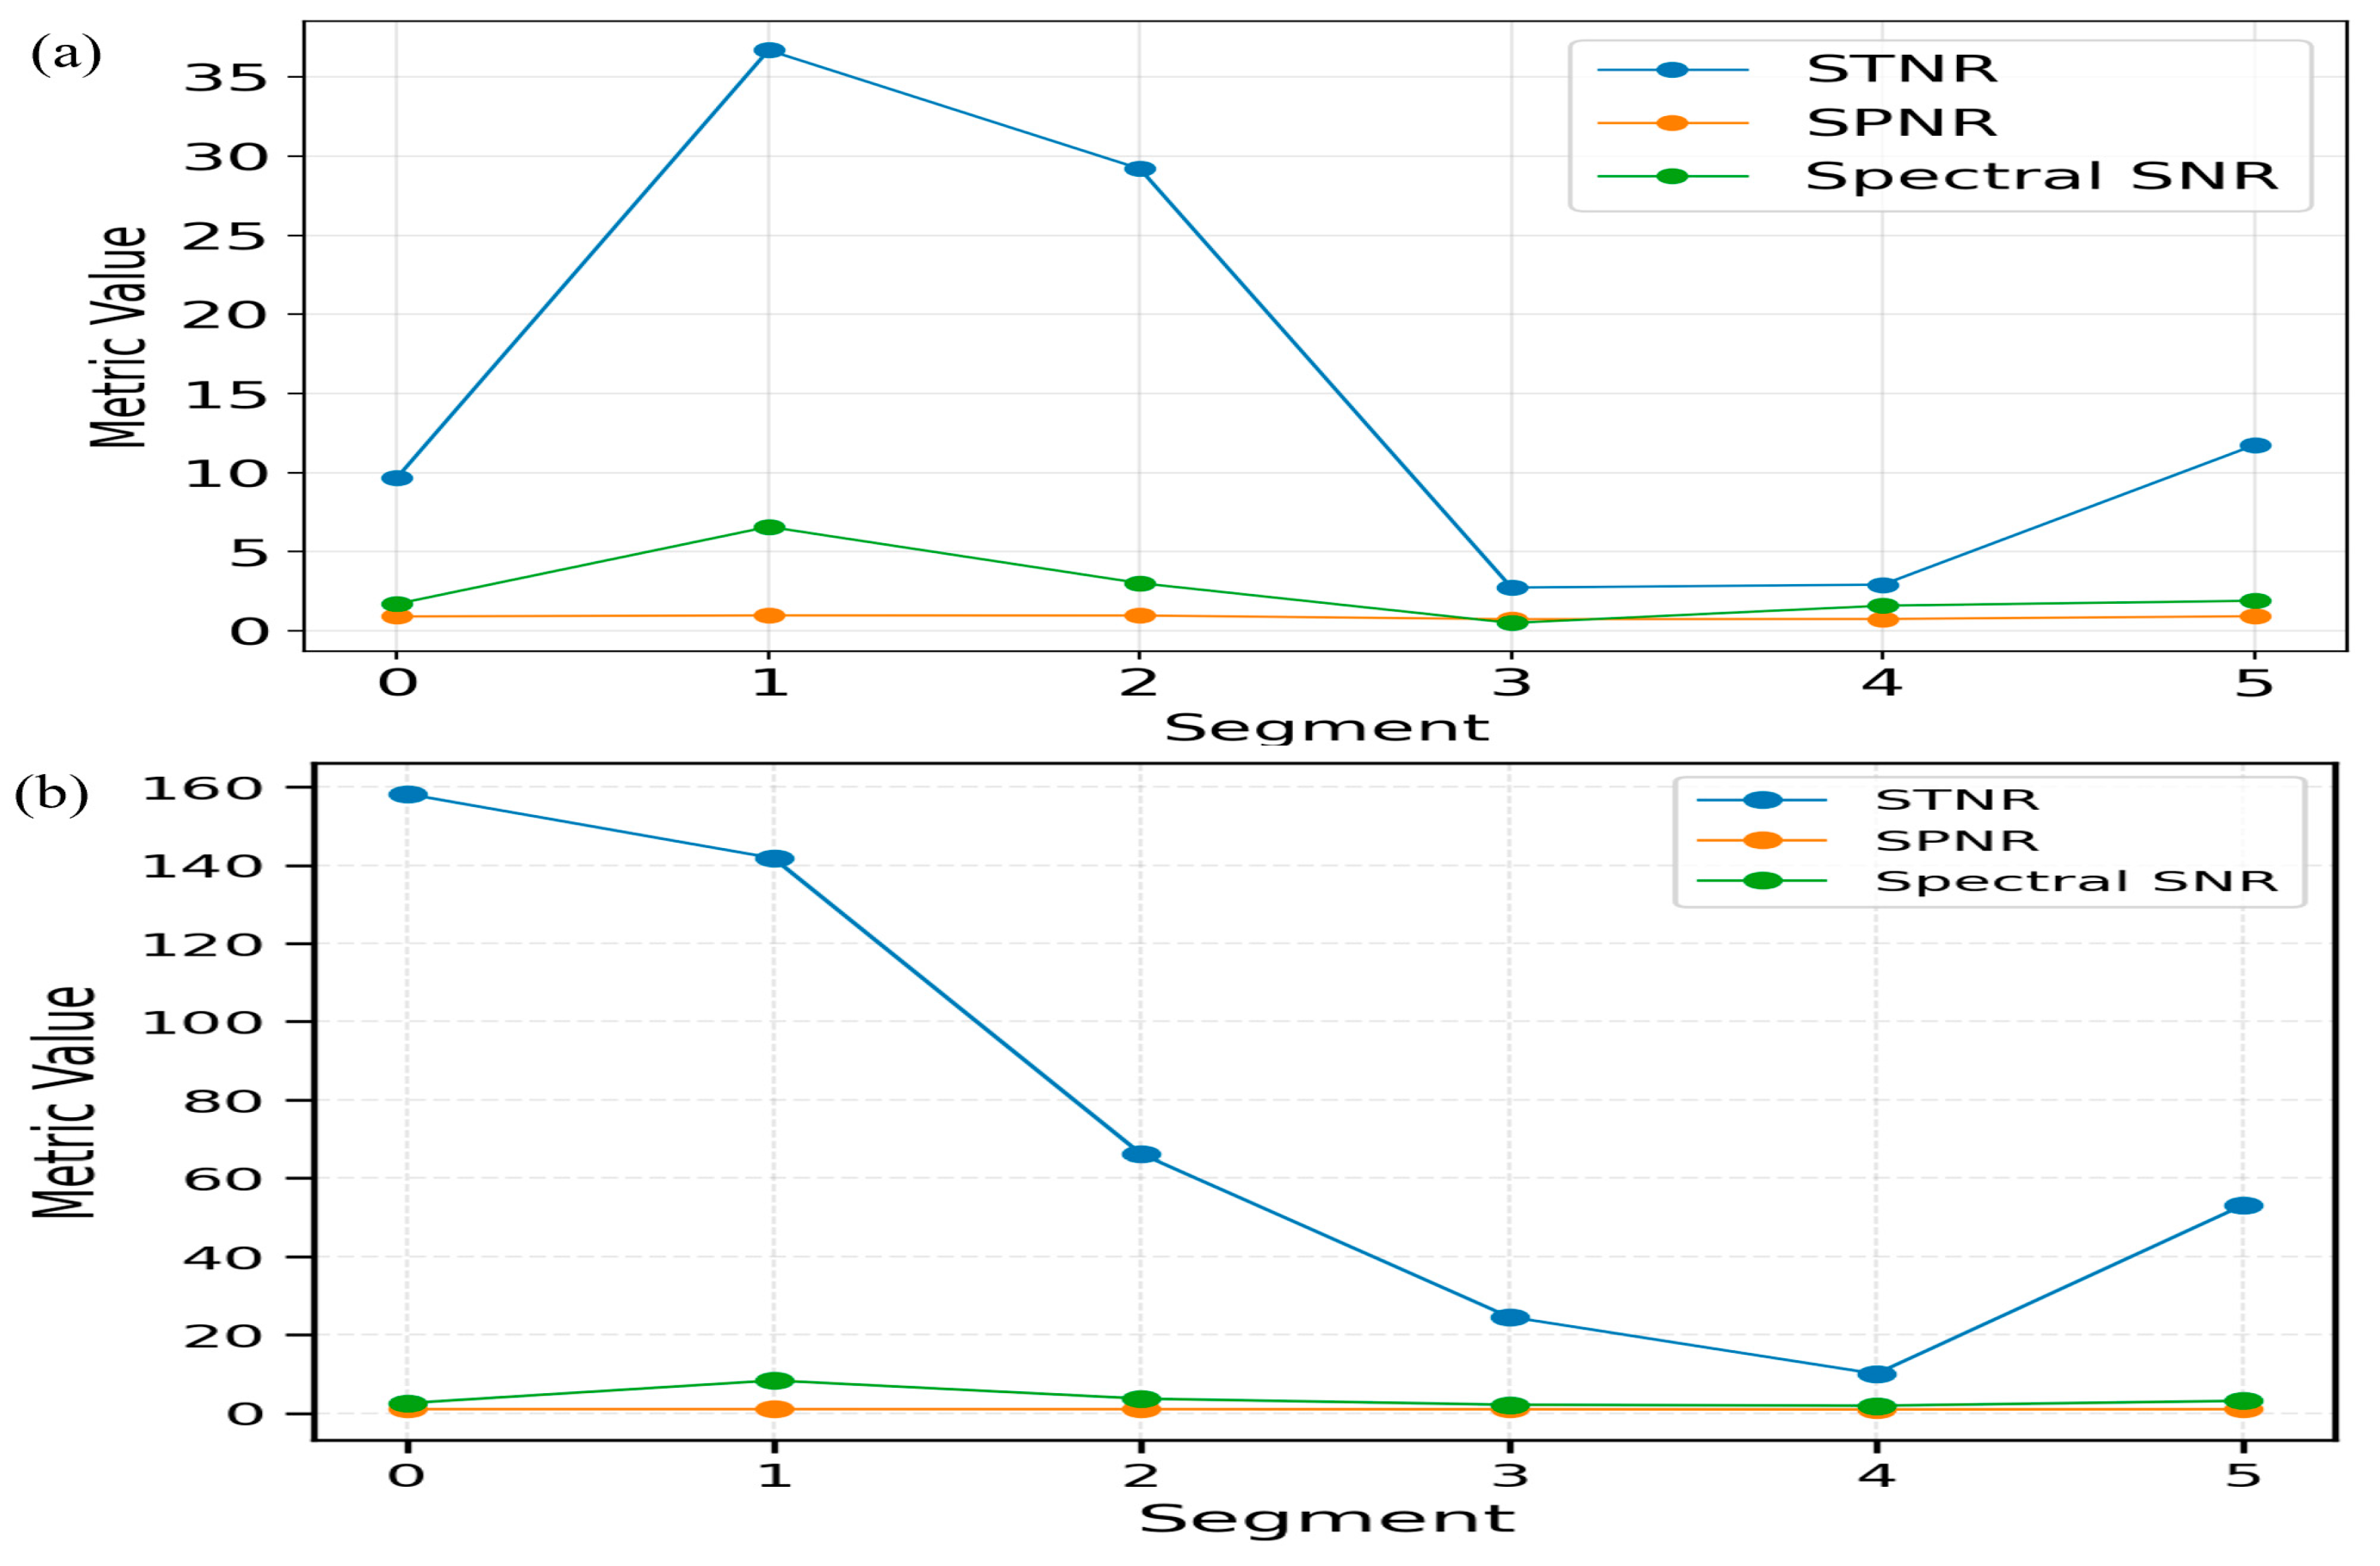
Unlike the global window results, the result above (Figure 4) highlights an increase in the amplitude-based STNR (reaching approximately 140) compared to the maximum of 25 observed in the 30 min stack (Figure 3g). Moreover, Figure 5a,b (surface-wave symmetry for both 30 min and 4 h records) below show more evident output for the metric analyses, making it difficult to decide which metric performs best for the physical emergence of dispersion ridges. However, both results (from the two window symmetries) indicate the reason temporal normalization should be included in DAS preprocessing signal analysis due to the revealing evidence in Figure 3, Figure 4 and Figure 5 that support consistency in some metric values, particularly in the individual metric analyses used in the surface-wave window for both 30 min and 40 h records (i.e., the metric values are not that far apart as they appear in the STNR values in Figure 3g and Figure 4g). Table 1 below illustrates the literature on the classical threshold between DAS and conventional ambient noise studies.
Figure 5.
Metric outputs with surface-wave windowing. (a) Metric outputs of 30 min record. (b) Metric outputs of 4 h record.
Table 1.
Conventional versus passive DAS interpretation of quality metrics.
3.2. Symmetry and Spectral Quality Metrics for Passive DAS Interferometry
The quality of empirical Green’s functions (EGFs) retrieved via ambient noise interferometry is commonly evaluated using symmetry- and spectrum-based quality control metrics. These diagnostics are based on the fundamental assumption that, under a sufficiently diffuse and isotropic ambient wavefield, the causal and acausal components of the noise correlation function (NCF) converge toward equal amplitudes and identical phase characteristics [2,4]. Consequently, increasing symmetry within the NCF is generally interpreted as evidence of improved Green’s function retrieval. Several quality metrics have therefore been proposed to quantify interferometric convergence from different perspectives. The spectral signal-to-noise ratio (SSNR) measures the emergence of coherent frequency-domain energy relative to the background noise level [4]. The signal-to-trailing noise ratio (STNR) evaluates the balance of energy between the symmetric and antisymmetric components of the NCF [35]. The signal-to-precursory noise ratio (SPNR) measures the phase coherence between causal and acausal waveforms using the instantaneous phase obtained through the Hilbert transform [34].
These metrics have demonstrated excellent performance for conventional broadband seismic arrays where ambient noise is generally recorded over several weeks or months and where wavefield illumination approaches isotropic conditions. Under such circumstances, previously reported quality thresholds, including SSNR ≥ 7 [4], SPNR 0.5 [34], and STNR ≥ 1.3 [35], provide reliable indicators of interferometric convergence. However, these threshold values cannot be transferred directly to passive DAS observations for three principal reasons. First, unlike conventional inertial sensors, DAS measures axial strain (or strain rate) along a finite gauge length, making the recorded wavefield highly sensitive to cable orientation, coupling conditions, and interrogator self-noise [9,24]. Consequently, passive DAS recordings often exhibit stronger directional dependence and lower intrinsic signal-to-noise ratios than conventional seismic observations. Second, ambient wavefields recorded by urban and mountainous DAS deployments rarely satisfy the assumption of diffuse illumination. Persistent traffic, industrial activity, wind-induced ground motion, and topographic scattering produce directional energy that preferentially illuminates one side of the fiber, thereby introducing amplitude and phase asymmetry into the retrieved Green’s functions [6,8]. Third, the observation durations investigated in the present study (30 min and 4 h) are considerably shorter than the weeks- to months-long recordings used to establish the classical thresholds. Shorter stacking times inevitably reduce interferometric convergence and increase statistical uncertainty, making lower absolute metric values physically expected rather than indicative of processing failure.
For these reasons, this study does not adopt the classical threshold values as universal acceptance criteria. Instead, the three quality metrics serve as relative indicators for comparing preprocessing strategies and determining whether restricting the analysis to the physically meaningful surface-wave arrival window improves Green’s function quality and subsequent dispersion imaging.
3.2.1. Signal-to-Trailing Noise Ratio (STNR)
The signal-to-trailing noise ratio (STNR) quantifies the amplitude similarity between the causal and acausal components of the EGF. In an isotropic noise field, the symmetric component of the correlation function should dominate. The study decomposes the correlation function into its symmetric and antisymmetric components as follows:
The STNR is subsequently defined as the ratio of the energy contained within these components:
The STNR therefore quantifies the degree to which the retrieved Green’s function is dominated by physically meaningful symmetric energy rather than directional or incoherent components. Larger STNR values indicate that the causal and acausal wavefields have converged toward reciprocal Green’s functions, whereas smaller values indicate persistent asymmetry caused by directional illumination, insufficient temporal stacking, transient anthropogenic disturbances, or heterogeneous wave propagation. For instance, Nakata et al. [35] noted that values of 3.3 indicate reliable phase reconstruction and that signals ≤ 1.3 should be discarded in conventional ambient noise interferometry (Table 1) using approximately ten days of continuous recordings. However, this threshold was derived from broadband seismic arrays operating under near-diffuse wavefield conditions and substantially longer observation periods than those considered in the present study. Passive DAS measurements recorded over only 30 min and 4 h are expected to exhibit lower interferometric convergence because the ambient wavefield has less time to average out directional noise sources.
Moreover, Table 2 below shows that the 30 min record has a strong upward trend, but because p > 0.05, it is termed a statistically non-significant trend. This is expected because 30 min of stacking contains transient energy spikes that temporarily distort amplitude symmetry. However, 4 h of stacking averages out noise and makes the improvement brought by surface windowing statistically significant. Consequently, the present work interprets the STNR primarily as a comparative quality metric rather than applying the conventional threshold directly.
Table 2.
Signal-to-trailing noise ratio (STRN) metric comparison between global NCF and surface-wave NCF for dispersion validation.
3.2.2. Signal-to-Precursory Noise Ratio (SPNR)
While the STNR evaluates amplitude balance, it may be biased by localized high-energy transients. To provide a more robust assessment, we employ the signal-to-precursory noise ratio (SPNR), which evaluates the phase coherence between causal and acausal arrivals. We first compute the analytic representation of the signal via the Hilbert transform, :
where is the complex analytic signal derived from the time-domain signal, is the time-domain signal and is the imaginary unit. Equation 6 localizes the moving window operation in time series . The instantaneous phase is defined from the normalized analytic signal:
is the instantaneous phase of the analytic signal, and is the instantaneous magnitude of the analytic signal. The SPNR is defined as the phase-enveloped value between the positive and lag components:
where indicates the real absolute value of the phase, is the total number of discrete samples within the evaluated time window, and denotes the complex conjugate. Equation (7) is the instantaneous phase that should be the same for coherent signals at each given time, and Equation (8) computes the absolute phase symmetry of the signals. Unlike amplitude-based symmetry measures, the SPNR depends exclusively on phase consistency between the causal and acausal components of Green’s function. Since phase information is considerably less sensitive to amplitude fluctuations introduced by cable coupling variations, interrogator gain changes, and localized transient events, the SPNR provides a more robust measure of interferometric convergence for passive DAS observations. Table 3 below demonstrates that both 30 min and 4 h records (surface windowing) achieve extreme statistical significance. Phase coherence is strongly localized to the surface-wave arrival trajectory and is destroyed over the full lag domain.
Table 3.
Signal-to-precursory noise ratio (SPNR) 1 metric comparison between global NCF and surface-wave NCF for dispersion validation.
Schimmel, Stutzmann and Gallart [34] demonstrated that phase coherence values approaching 0.5 correspond to rapid reductions in phase velocity uncertainty for conventional seismic interferometry. Nevertheless, passive DAS deployments commonly exhibit lower global phase coherence because directional noise sources produce coherent arrivals that originate from multiple azimuths rather than a perfectly diffuse wavefield. Furthermore, lower global SPNR values should not necessarily be interpreted as poor Green’s function retrieval. As demonstrated later in this study, restricting the analysis to the physically meaningful surface-wave arrival window substantially increases phase coherence and restores the correspondence between the SPNR and dispersion quality.
3.2.3. Spectral Signal-to-Noise Ratio (SSNR)
To assess signal quality in the frequency domain, we used the spectral SNR, which measures the relative strength of coherent energy relative to the background noise floor. Following the Fourier transform of the correlation function, , the spectral power is determined. The spectral SNR is defined as the ratio of the mean power within the targeted signal band to the mean power of the ambient noise floor:
where is the arithmetic mean of the spectral power within the specified signal frequency band, and is also the arithmetic mean of the spectral power within the off-signal frequency band. This metric identifies the frequency ranges where coherent wave propagation emerges. While a high spectral SNR indicates strong energy, it must be cross-referenced with other metrics to distinguish between converged Green’s functions and narrow-band anthropogenic noise. Moreover, Bensen et al. [4] recommended that SSNR values exceeding approximately 7 (Table 1) provide sufficiently reliable dispersion measurements for conventional ambient noise tomography based on several months of continuous broadband recordings. However, the threshold reflects the exceptionally long stacking durations and relatively diffuse wavefields available in conventional seismic arrays. Passive DAS observations differ substantially because directional anthropogenic noise, interrogator self-noise, finite gauge-length averaging, and much shorter acquisition durations reduce the attainable spectral contrast between coherent surface waves and the surrounding noise floor. Moreover, the statistical analyses (Table 4) show that windowing does not artificially inflate or corrupt the overall frequency spectrum; rather, it removes out-of-band energy while preserving the core spectral power.
Table 4.
Spectral SNR (SSNR) metric comparison between global NCF and surface-wave NCF for dispersion validation.
Consequently, the absolute SSNR values observed in this study are expected to be lower than those reported for conventional arrays. Rather than adopting a fixed acceptance threshold, the SSNR is therefore interpreted together with the STNR and SPNR to determine whether increased spectral coherence is accompanied by improved Green’s function symmetry and enhanced dispersion imaging.
4. Discussion
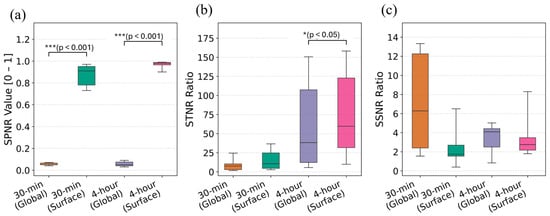
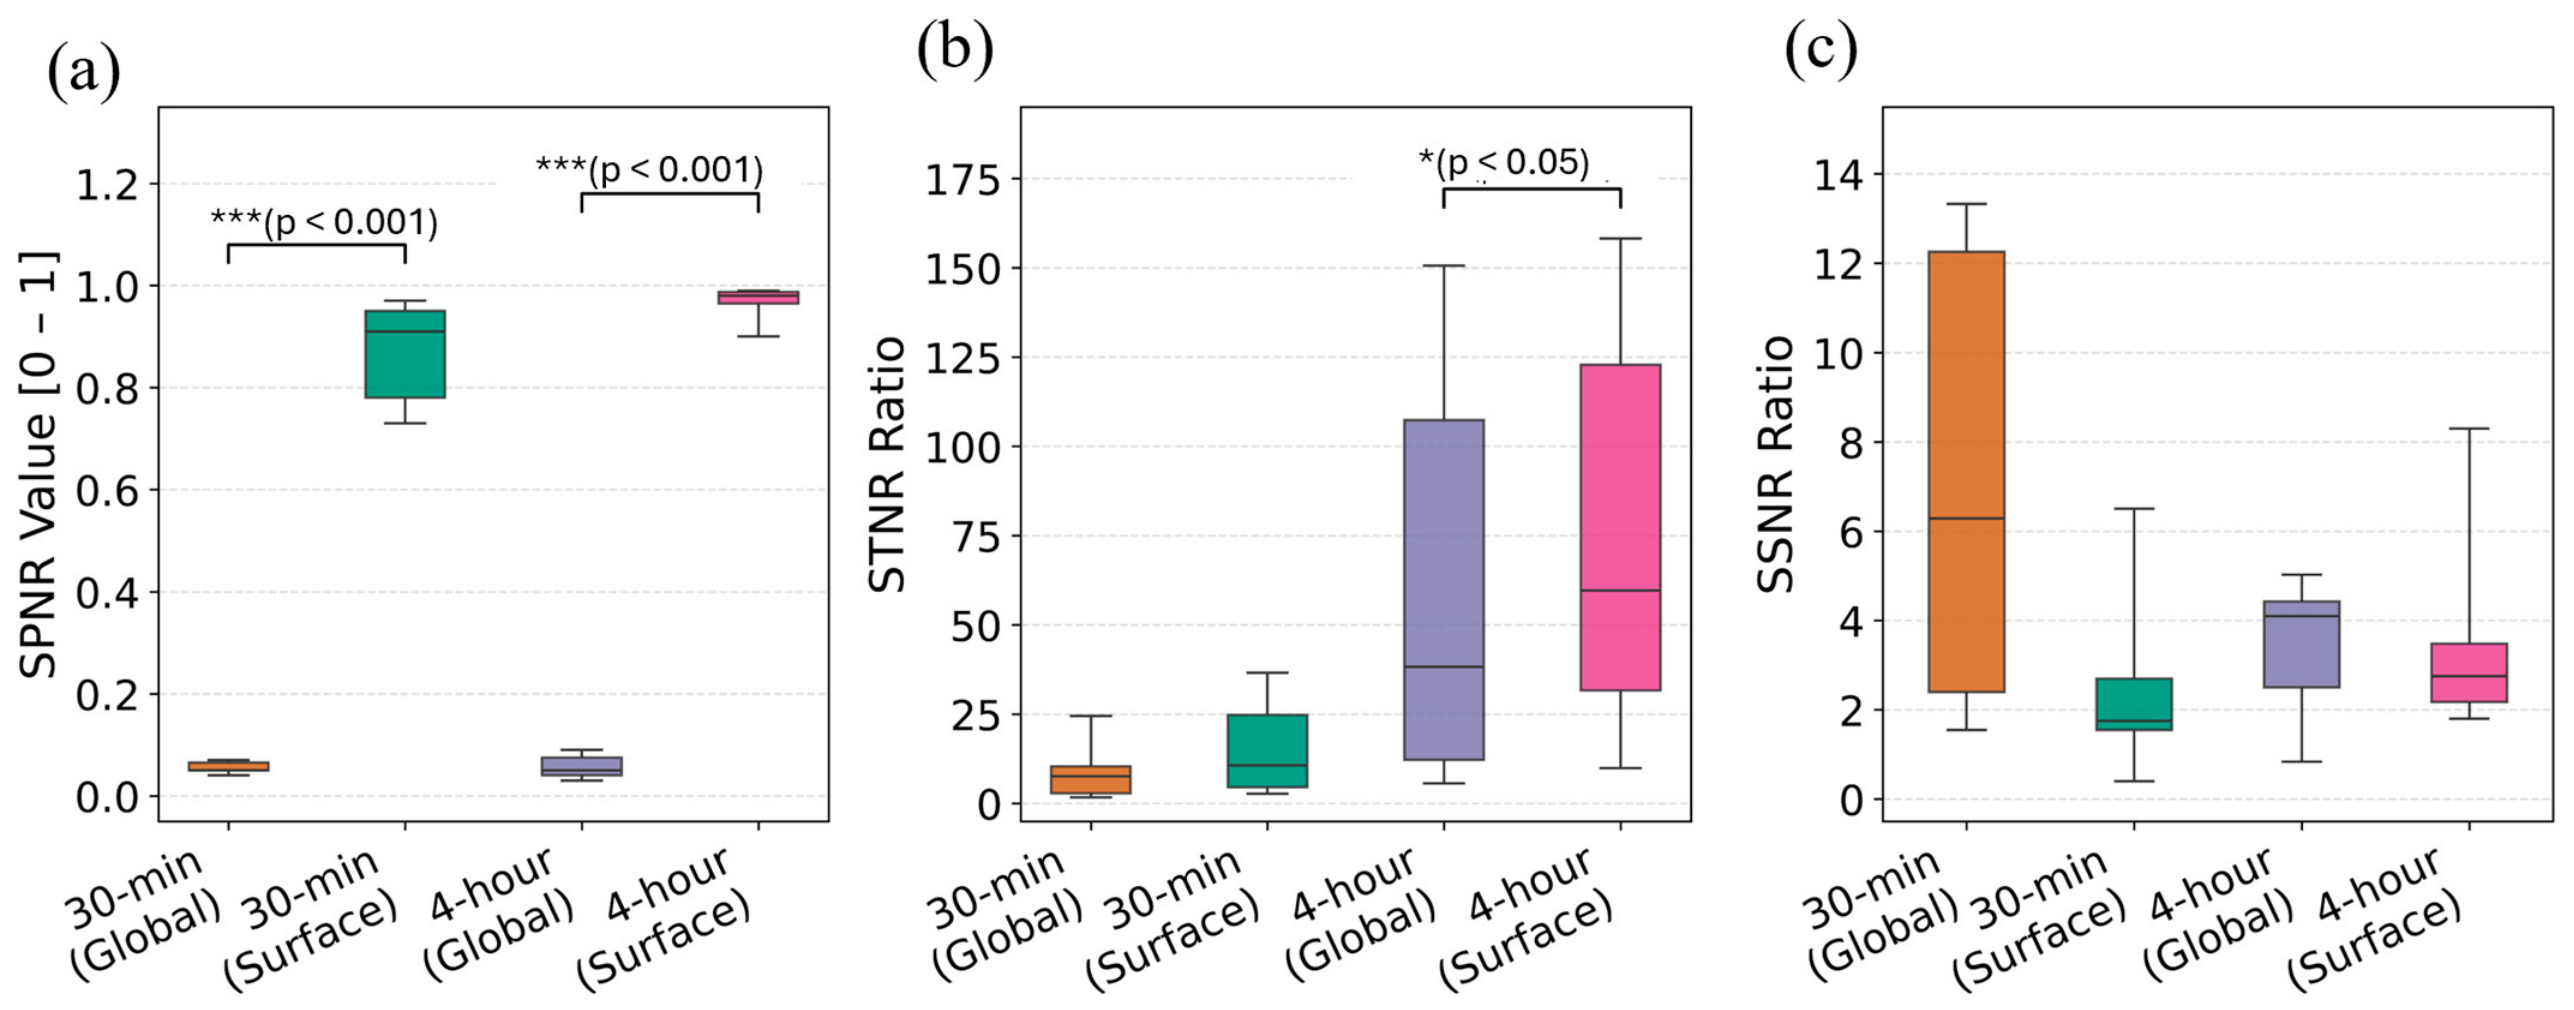
The comparative analysis of the signal-to-trailing noise ratio (STNR), signal-to-precursory noise ratio (SPNR), and spectral-to-noise ratio (SSNR) across the 30 min and 4 h datasets reveals a consistent and physically meaningful pattern. However, the reliability of interferometric quality metrics is fundamentally governed by the temporal window within which they are evaluated. A primary observation is the sharp distinction between global metrics (computed across the full 5 s lag domain, as shown in Figure 3 and Figure 4) and surface-windowed metrics (constrained strictly to the predicted surface-wave moveout trajectory (Figure 5)). For instance, in Figure 6a and Table 2, Table 3 and Table 4, the global SPNR values remain suppressed regardless of whether a 30 min or 4 h stack is analyzed. This occurs because the global lag window incorporates a composite wavefield consisting of ballistic surface waves, scattered energy, coda, and directional anthropogenic noise, which mathematically dilutes global statistical calculations. However, when restricted to the theoretical surface-wave window, the SPNR undergoes a statistically significant jump (p < 0.001), surging to 0.870 ± 0.106 for 30 min stacks and 0.967 ± 0.034 for 4 h stacks. Conversely, the amplitude-based STNR (Figure 6b) exhibits high variance in short stacks due to local transient noise, achieving significance only after 4 h (p = 0.042). In contrast, spectral power (SSNR, Figure 6c) remains baseline-stable (p = 0.882), confirming that velocity windowing isolates signal phase without distorting frequency content. This suggests that wavefield symmetry is not a global property of the cross-correlation but is localized within the physically meaningful arrival region. While temporal stacking naturally improves global lag (composite wavefields) due to the averaging of stochastic noise, the surface-windowed STNR provides a further boost in clarity [36].
Figure 6.
The box plot displays metric outputs from analyses of global and surface windowing for both 30 min and 4 h records. (a) SPNR results. (b) STNR results. (c) SSNR outputs.
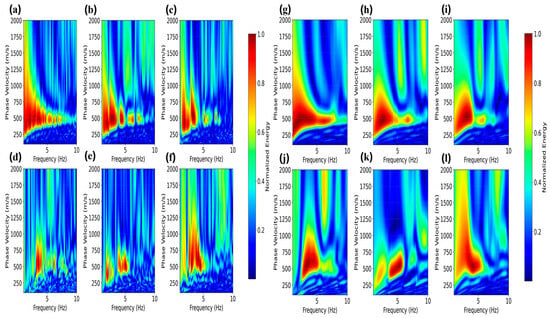
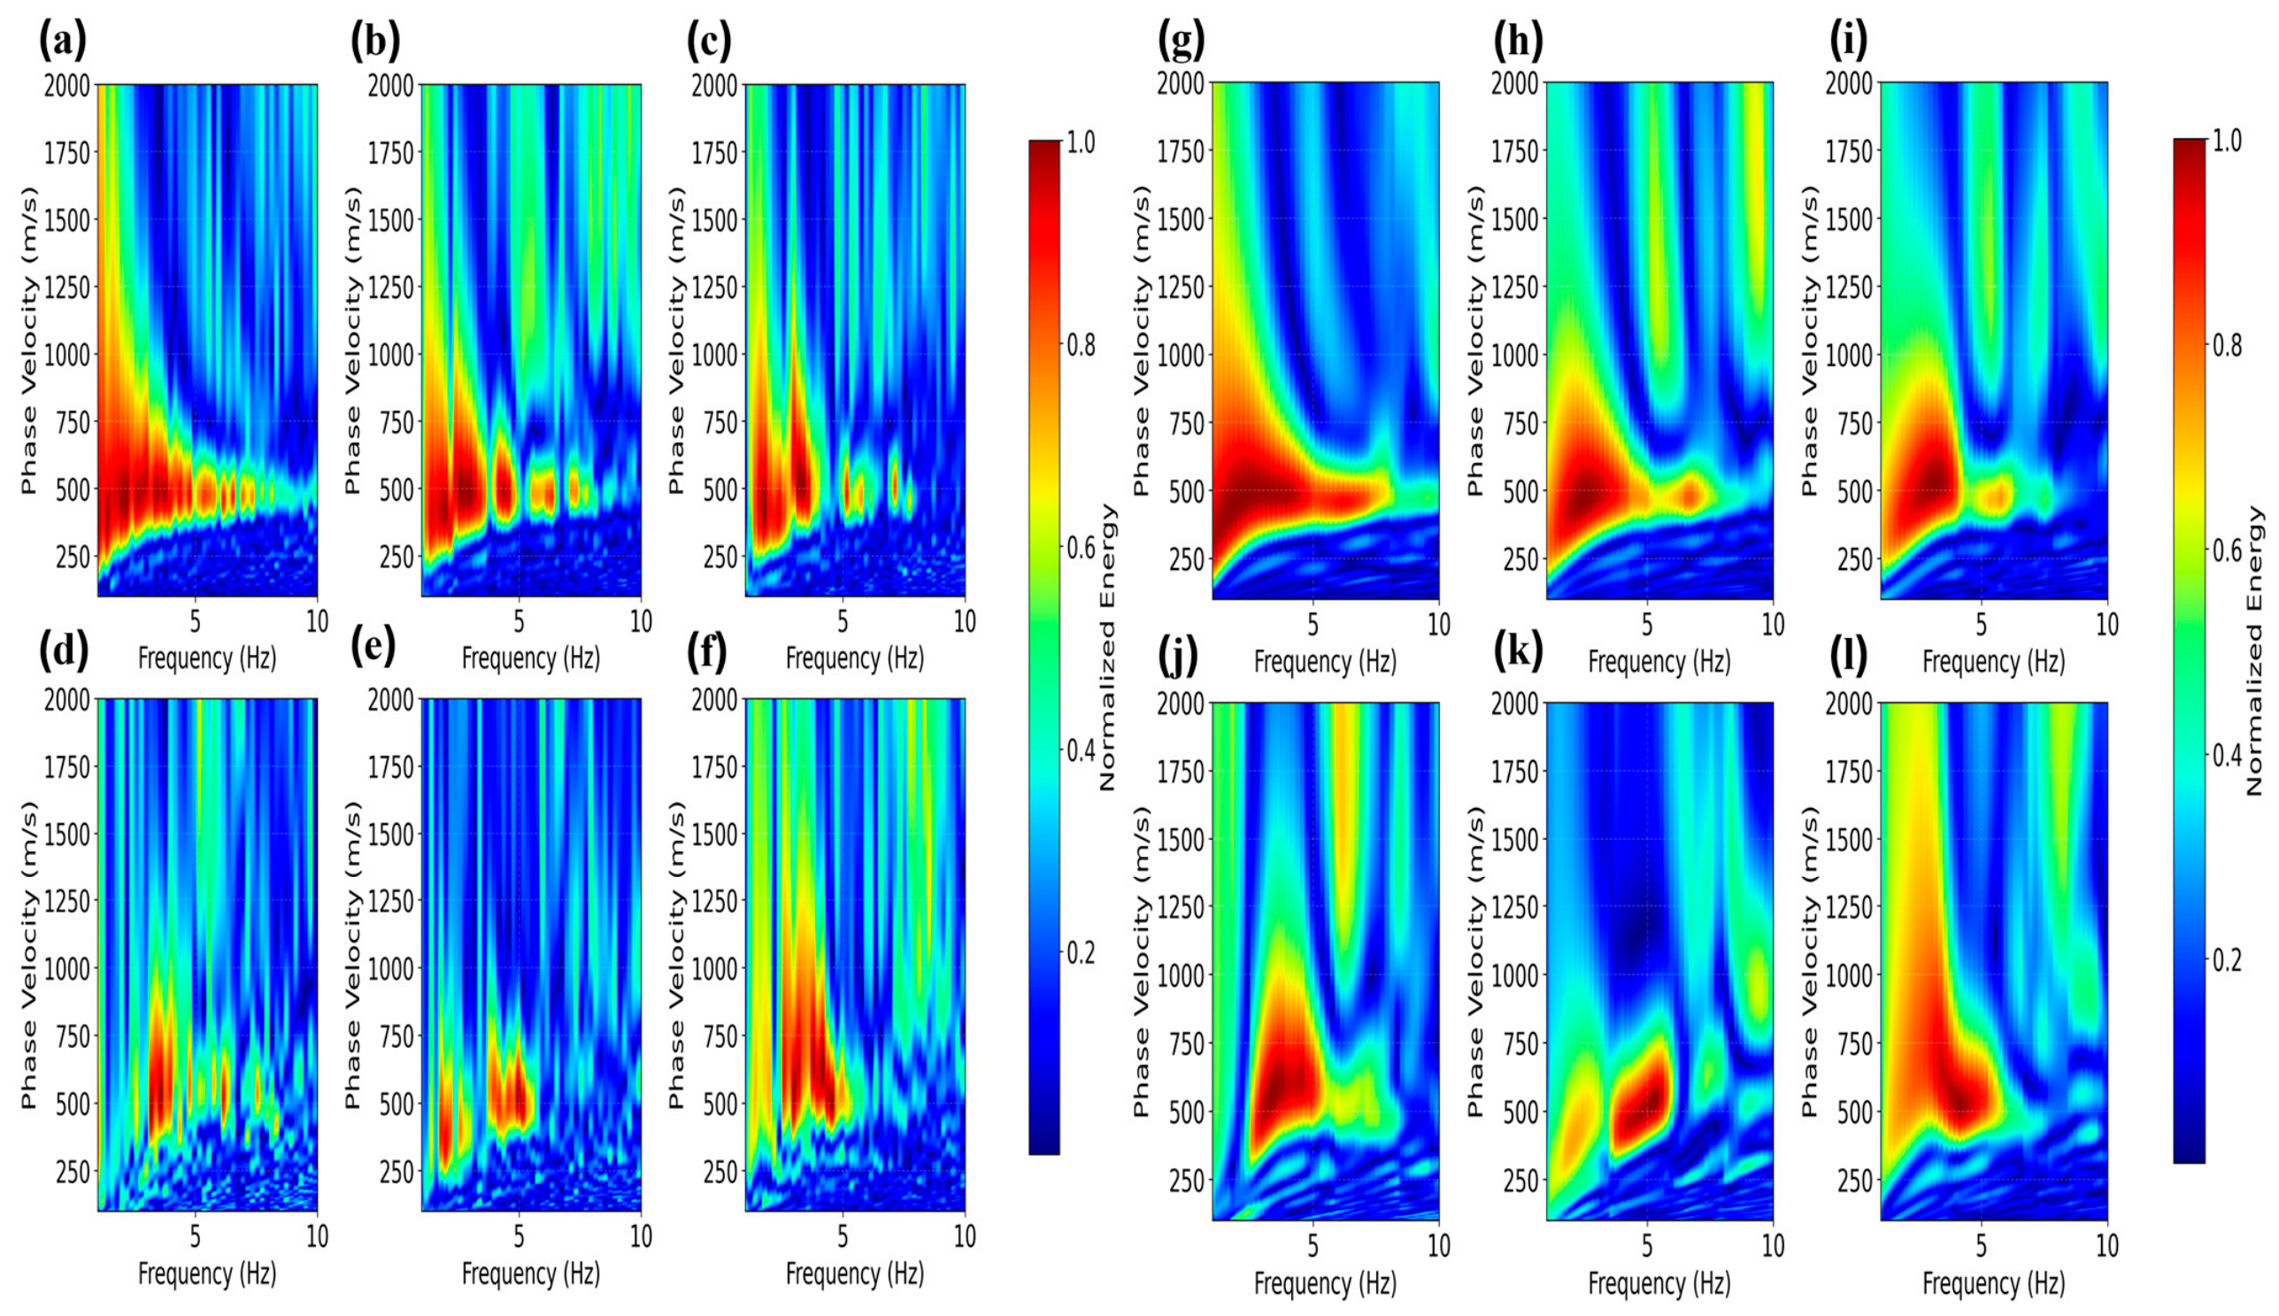
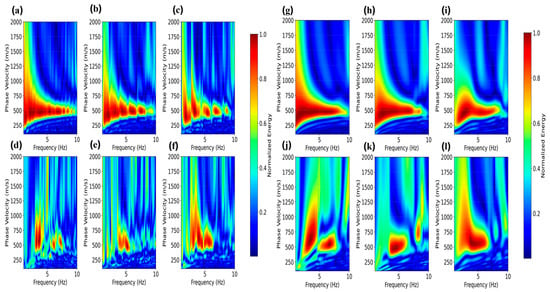
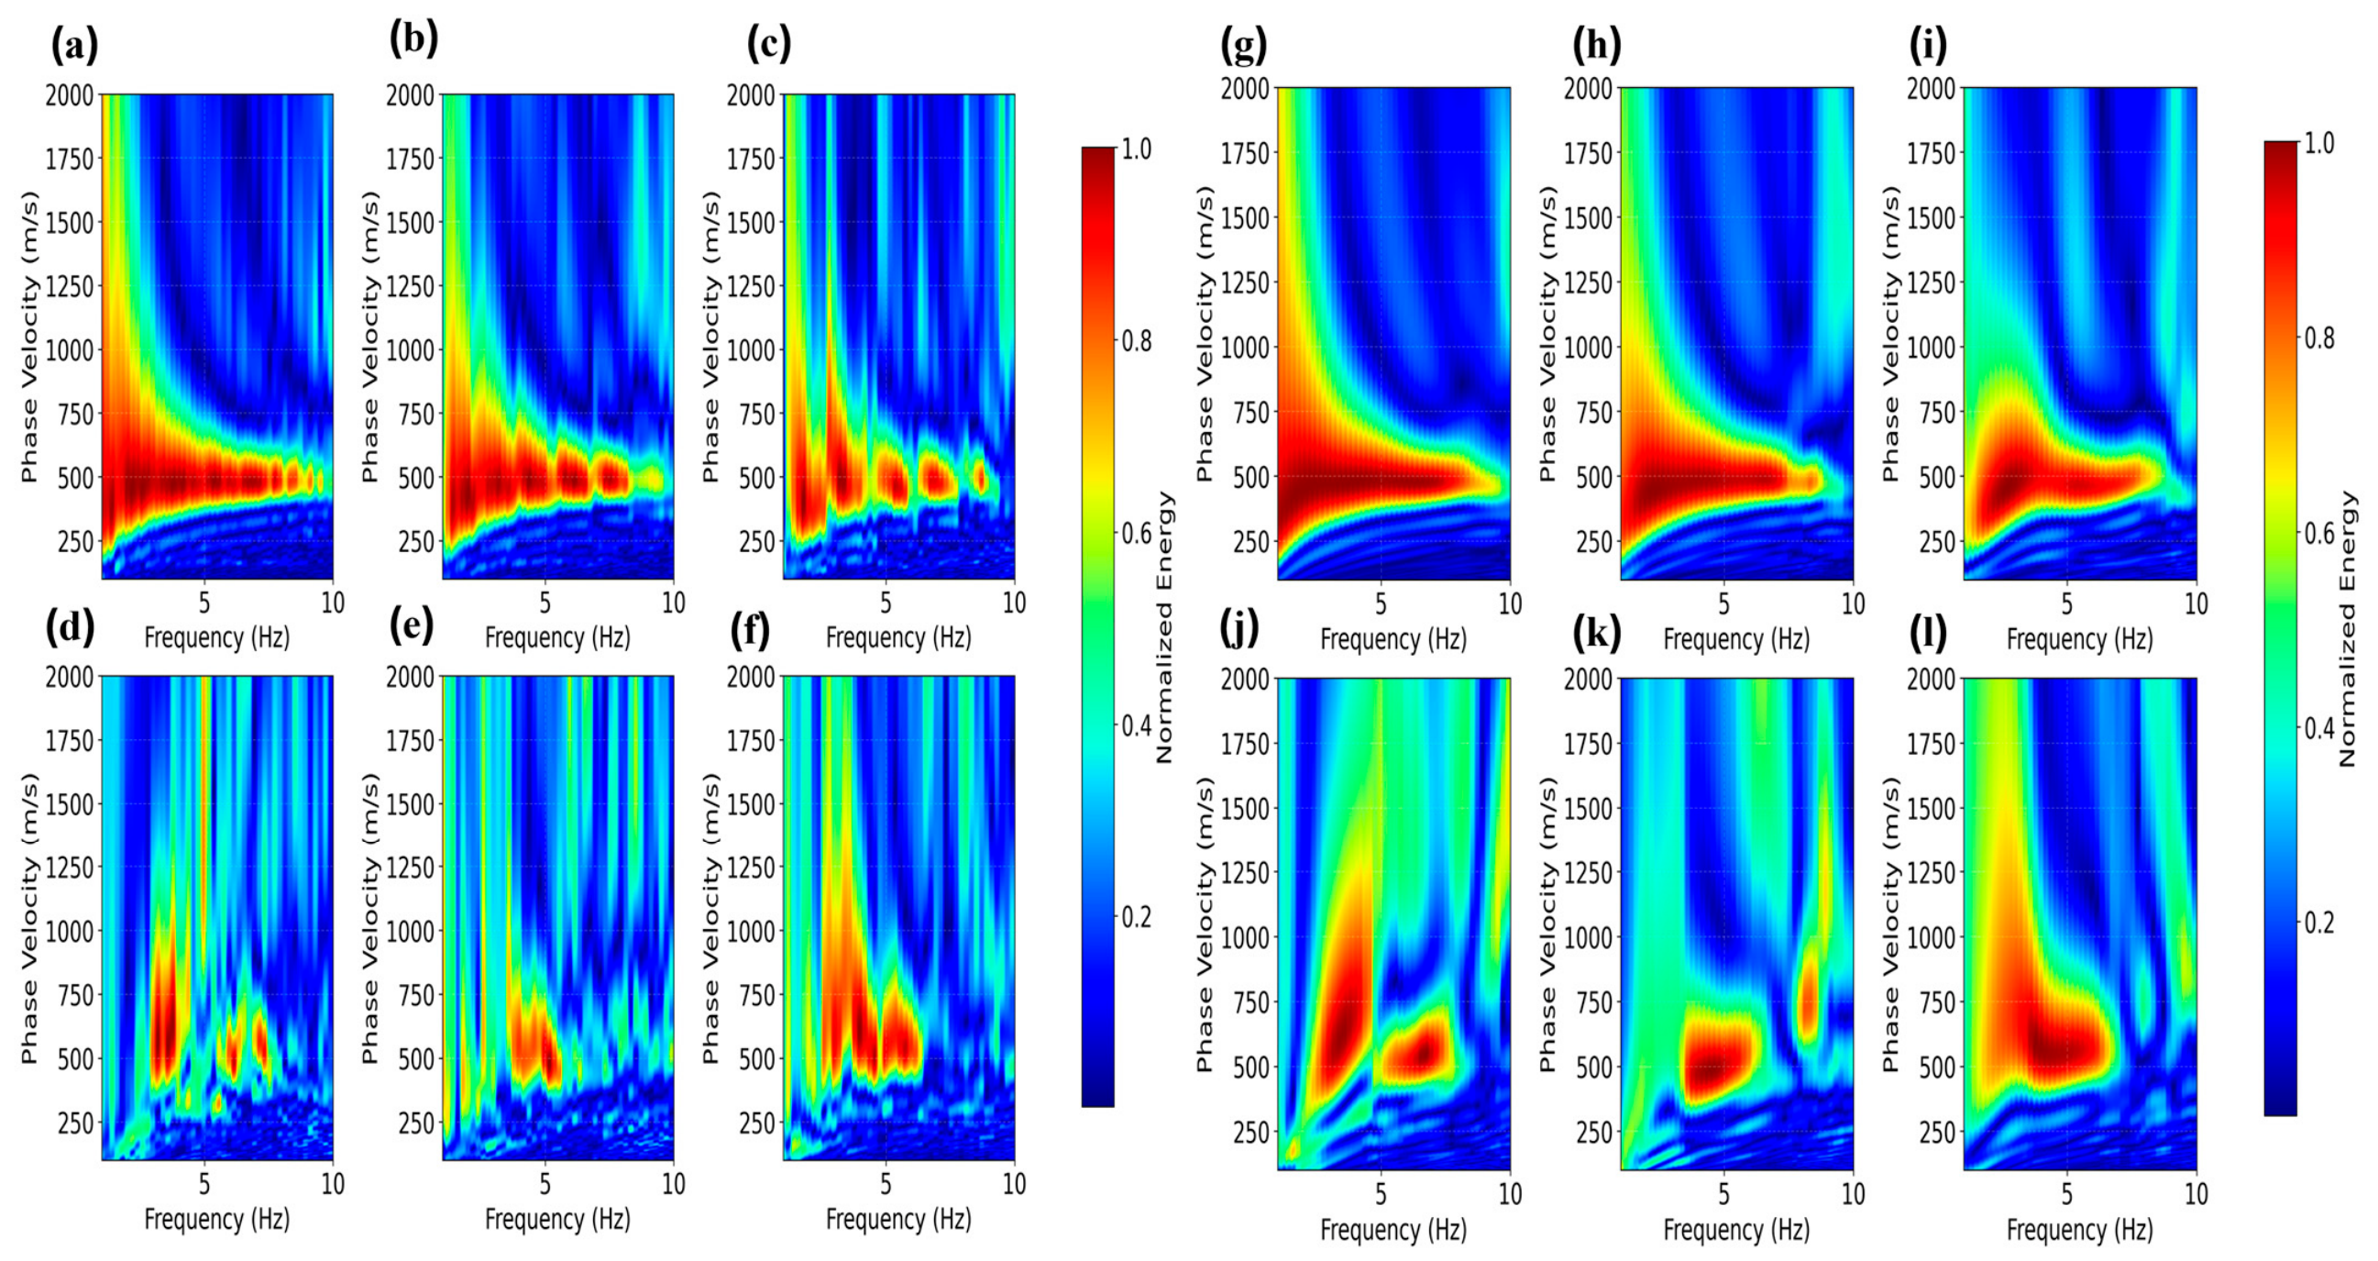
The practical value of this metric divergence lies in its direct correspondence with dispersion energy sharpness across the 30 min (Figure 7) and 4 h (Figure 8) dispersion spectra. This indicator-to-imaging relationship is most clearly illustrated in Segments 4 and 5 (Figure 7d,e,j,k and Figure 8d,e,j,k), which represent regions heavily degraded by localized environmental noise. Under unwindowed global calculation, Segments 4 and 5 exhibit severely a suppressed global SPNR (<0.08) and erratic STNR (1.7–2.9), which directly translates to blurred, ambiguous fundamental-mode Rayleigh wave dispersion ridges (Figure 7d,e and Figure 8d,e) characterized by energy leakage, attenuated high-frequency branches (>5 Hz), and spurious spatial artifacts. However, applying the surface-wave window elevates the SPNR in Segment 4 from 0.05 to 0.73 at 30 min and to 0.96 at 4 h. As Schimmel, Stutzmann, and Gallart [34] noted, phase-based metrics are superior in identifying signal convergence because they are less sensitive to the high-amplitude transients that often plague urban passive DAS environments. In exact correspondence, the windowed dispersion spectra (Figure 7j,k and Figure 8j,k) undergo complete structural reconstruction, condensing diffuse energy into a sharp, continuous fundamental-mode trajectory with high contrast along 250–50 m/s.
Figure 7.
Rayleigh wave phase velocity dispersion spectra generated from the 30 min dataset under global and surface-wave windowing conditions. (a–f) Fundamental-mode dispersion measurements for Segments 1–6 computed across the unwindowed global lag domain (5 s). (g–l) Corresponding dispersion measurements for Segments 1–6 obtained after applying the physics-guided surface-wave window.
Figure 8.
Rayleigh wave phase velocity dispersion spectra generated from the 4 h dataset under global and surface-wave windowing conditions. (a–f) Fundamental-mode dispersion measurements for Segments 1–6 computed across the unwindowed global lag domain (5 s). (g–l) Corresponding dispersion measurements for Segments 1–6 obtained after applying the physics-guided surface-wave window.
In contrast, Segments 1–3 represent high-coherence propagation paths where prominent dispersion energy is visible even in short 30 min global stacks (Figure 7a–c). However, global calculation still introduces diffuse background power. Applying the surface-wave window (Figure 7g–i) elevates the SPNR well beyond the 0.50 threshold identified by Schimmel, Stutzmann and Gallart [34] as critical for reliable dispersion extraction, resulting in near-ideal dispersion resolution. Synthesizing these observations yields three vital insights for passive DAS processing: (1) a low global SPNR (<0.10) is misleading and does not indicate poor underlying Green’s function quality, (2) a surface-windowed SPNR of 0.70 serves as a definitive threshold guaranteeing a pickable dispersion ridge, and (3) the surface-windowed SPNR reliably predicts whether short-duration stacks (e.g., 30 min) have converged sufficiently for dispersion extraction long before extended temporal stacking is complete.
Consequently, the comparison between the 30 min and 4 h durations highlights a critical methodological shift that is explored from purely statistical evaluation to physics-guided diagnostics. While longer recording durations undeniably improve signal stability and average out transient bursts [4], temporal stacking alone cannot resolve phase incoherence introduced by irrelevant lag components. These results demonstrate that physically informed windowing (surface-wave windowing) is more critical than raw stacking duration (global windowing) for achieving reliable coherence metrics and that a spectral SNR benchmark of 7–10 from the DAS ambient noise study is sufficient for dispersion measurements. More so, this framework establishes that in complex DAS datasets, a good Green’s function is best identified not by its global symmetry but by its localized phase consistency and amplitude strength within the expected arrival window. Figure 7 and Figure 8 below show the dispersion results for global and surface-wave windows using both the 30 min and 4 h Pyrenees ambient noise DAS (PAND) datasets.
Despite these significant breakthroughs, several methodological limitations must be acknowledged to provide a balanced perspective. First, the empirical validation in this study relies on a single passive DAS array deployed in the urban Pyrenees. Consequently, the performance and generalizability of these metric thresholds across diverse geological settings, such as deep sedimentary basins, complex offshore marine environments, and varying fiber-optic trenching depths and coupling conditions, require further rigorous testing. Variations in fiber–ground coupling and extreme subsurface attenuation could alter the baseline thresholds of both the STNR and SSNR, necessitating recalibration across different deployment scenarios.
Second, the temporal evaluation was restricted to discrete observation windows of 30 min and 4 h. While this comparison successfully highlights the rapid convergence of surface-windowed phase metrics in short stacks, it does not explore the performance boundary under extremely short durations (e.g., <10 min) where directional anthropogenic noise spikes dominate, nor does it evaluate ultra-long integration times (e.g., >24 h) where temporal saturation may occur. Furthermore, the present velocity-windowing scheme assumes a deterministic theoretical moveout trajectory . In environments heavily contaminated by strong body-wave arrivals, severe multi-pathing, or near-field industrial transients, rigid moveout boundaries can cause spectral truncation or unintentionally window out non-stationary surface-wave energy.
To address these limitations, future research will focus on developing adaptive, data-driven windowing algorithms. Integrating automated wavefield separation or machine-learning-based trajectory tracking will allow for dynamic adjustments of the symmetry window in the presence of strong body-wave interference and directional urban noise. Additionally, expanding validation across multi-scale fiber networks, ranging from direct-buried dark fiber to ocean-bottom cables, and testing a broader continuum of stacking durations (from 5 min to several days) will refine the universal applicability of this physics-guided quality control framework.
5. Conclusions
This is the first end-to-end study that establishes a robust framework for evaluating the quality of ambient noise interferometry in passive DAS applications. Our findings demonstrate that the reliability of interferometric diagnostics is fundamentally governed by the spatiotemporal domain of evaluation rather than by brute-force temporal stacking alone. Global symmetry metrics are shown to be unreliable indicators of dispersion quality, as they are frequently biased by incoherent noise and directional sources that fall outside the physically plausible signal window. In contrast, a physics-guided approach was used to restrict metric evaluation to the surface-wave arrival window. This isolates the coherent wavefields and reveals that phase-based diagnostics (i.e., the signal-to-precursory noise ratio (SPNR)) and the spectral signal-to-noise ratio (SSNR) reliably predict dispersion image quality even in short 30 min correlation stacks.
Among the evaluated metrics, the SPNR emerged as the most resilient indicator of signal stability. Its transition from near-zero global values to near-unity windowed values highlights the localized nature of phase coherence and proves that phase-based diagnostics are essential for identifying usable signals in noisy environments. Moreover, to ensure broad practical utility beyond the test environment, this study adapts directly to distinct passive DAS monitoring scenarios, such as urban near-surface characterization, complex mountainous and topographic arrays, and energy, geothermal, and reservoir applications. While longer recording durations (4 h) improve the energy-based signal-to-noise ratios, they do not alleviate the fundamental need for windowed analysis to ensure phase consistency. Ultimately, this work suggests a shift in the standard processing workflow for passive seismic studies and provides a practical pathway to maximize the utility of passive DAS datasets while ensuring that only the most reliable and physically converged signals are used for seismic imaging and inversion.
Author Contributions
I.O.M.: conceptualization, data processing, signal analysis, investigation, methodology, writing—original draft, writing—review and editing; A.H.A.L.: supervision, project administration, resources, writing—review and editing; A.R.: writing—review and editing, validation; D.T.A.: validation; A.R.M.A.: review and validation; B.A.A.: validation; J.O.O.: resources: M.R.: review. All authors have read and agreed to the published version of the manuscript.
Funding
The research leading to these results is as a result of funding being received from Total Energies through grant cost center: 015MD0-164.
Data Availability Statement
The Pyrenees ambient noise DAS (PAND) dataset used in this study and that supports its findings is the sole property of Total Energies and is subjected to confidentiality and commercial restrictions. Therefore, the data is not publicly available.
Acknowledgments
We appreciate the good gesture from Total Energies for providing the data for this research endeavor.
Conflicts of Interest
The authors declare no conflicts of interest.
Abbreviations
The following abbreviations are used in this manuscript:
| DAS | Distributed acoustic sensing |
| EGF | Empirical Green’s function |
| PAND | Pyrenees ambient noise DAS dataset |
| NCF | Noise cross-correlation function |
| STNR | Signal-to-trailing noise ratio |
| SPNR | Signal-to-precursory noise ratio |
| SSNR | Spectral signal-to-noise ratio |
References
- Yang, Y.; Li, Z.; Xie, T.; Xie, J.; Chen, X.; Zhou, L.; Li, G. A review of recent advances in methods for extracting broadband surface waves from ambient noise data. Sci. China Earth Sci. 2026, 69, 839–861. [Google Scholar] [CrossRef] [Scilit]
- Sabra, K.G.; Gerstoft, P.; Roux, P.; Kuperman, W.; Fehler, M.C. Extracting time-domain Green’s function estimates from ambient seismic noise. Geophys. Res. Lett. 2005, 32. [Google Scholar] [CrossRef] [Scilit]
- Shapiro, N.M.; Campillo, M.; Stehly, L.; Ritzwoller, M.H. High-resolution surface-wave tomography from ambient seismic noise. Science 2005, 307, 1615–1618. [Google Scholar] [CrossRef] [Scilit] [PubMed]
- Bensen, G.; Ritzwoller, M.; Barmin, M.; Levshin, A.L.; Lin, F.; Moschetti, M.; Shapiro, N.; Yang, Y. Processing seismic ambient noise data to obtain reliable broad-band surface wave dispersion measurements. Geophys. J. Int. 2007, 169, 1239–1260. [Google Scholar] [CrossRef] [Scilit]
- Chen, X.; Zhang, H.; Zhou, C.; Pang, J.; Xing, H.; Chang, X. Using ambient noise tomography and MAPS for high resolution stratigraphic identification in Hangzhou urban area. J. Appl. Geophys. 2021, 189, 104327. [Google Scholar] [CrossRef] [Scilit]
- Guan, B.; Mi, B.; Zhang, H.; Liu, Y.; Xi, C.; Zhou, C. Selection of noise sources and short-time passive surface wave imaging—A case study on fault investigation. J. Appl. Geophys. 2021, 194, 104437. [Google Scholar] [CrossRef] [Scilit]
- Zhou, C.; Xia, J.; Cheng, F.; Pang, J.; Chen, X.; Xing, H.; Chang, X. Passive surface-wave waveform inversion for source-velocity joint imaging. Surv. Geophys. 2022, 43, 853–881. [Google Scholar] [CrossRef] [Scilit]
- Retailleau, L.; Boué, P.; Li, L.; Campillo, M. Ambient seismic noise imaging of the lowermost mantle beneath the North Atlantic Ocean. Geophys. J. Int. 2020, 222, 1339–1351. [Google Scholar] [CrossRef] [Scilit]
- Lindsey, N.J.; Martin, E.R. Fiber-Optic Seismology. In Annual Review of Earth and Planetary Sciences; Jeanloz, R., Freeman, K.H., Eds.; Annual Reviews: San Mateo, CA, USA, 2021; Volume 49, pp. 309–336. [Google Scholar]
- Rashid, A.; Tackie-Otoo, B.N.; Abdul Latiff, A.H.; Otchere, D.A.; Jamaludin, S.N.F.; Asfha, D.T. Research Advances on Distributed Acoustic Sensing Technology for Seismology. Photonics 2025, 12, 196. [Google Scholar] [CrossRef] [Scilit]
- Adeniyi, B.A.; Abdul Latiff, A.H.; Adedeji, Z.O.; Md Arshad, A.R.; Asfha, D.T. Directional sensitivity of fibre optic cables for surface seismic reflection distributed acoustic sensing: A review and potential solutions for enhanced sensitivity. Geomech. Geophys. Geo-Energy Geo-Resour. 2025, 11, 60. [Google Scholar] [CrossRef] [Scilit]
- Rafi, M.; Noh, K.A.M.; Latiff, A.H.A.; Hashim, H.S. Developing A Surface Distributed Acoustic Sensing (DAS) Data Processing in Comparison with Conventional Geophone Response for Near Surface Survey. In IOP Conference Series: Earth and Environmental Science; IOP Publishing: Bristol, UK, 2025; Volume 1521, p. 012016. [Google Scholar]
- He, Z.; Liu, Q. Optical fiber distributed acoustic sensors: A review. J. Light. Technol. 2021, 39, 3671–3686. [Google Scholar] [CrossRef] [Scilit]
- Lindsey, N.J.; Rademacher, H.; Ajo-Franklin, J.B. On the broadband instrument response of fiber-optic DAS arrays. J. Geophys. Res. Solid Earth 2020, 125, e2019JB018145. [Google Scholar] [CrossRef] [Scilit]
- Liu, W.; Zhu, H.; Zhang, H.; Wang, T.; Yu, D.; Li, J.; Shi, B. Feasibility study of seismic events positioning based on distributed acoustic sensing array. Zhongnan Daxue Xuebao (Ziran Kexue Ban)/J. Cent. South Univ. (Sci. Technol.) 2023, 54, 1804–1813. [Google Scholar]
- Liu, B.; Jiang, W.B.; He, X.G.; Wen, P.F.; Zhang, M. High-density offshore seismic exploration with an optical fibre towed streamer based on distributed acoustic sensing: Concept and application. Geophys. Prospect. 2025, 73, 812–823. [Google Scholar] [CrossRef] [Scilit]
- Majdi, A.; Rashid, A.; Latiff, A.A.; Rafi, M.; Asfha, D.; Adeniyi, B.; Putra, A.; Ibrahim, M. Comparative Analysis of Interrogator Unit Performance in Surface Seismic DAS: Case Study in a Campus Area. In 5th EAGE Workshop on Fiber Optic Sensing for Energy Applications; European Association of Geoscientists & Engineers: Bunnik, The Netherlands, 2025; Volume 2025, pp. 1–5. [Google Scholar]
- Asfha, D.T.; Latiff, A.H.A.; Soleimani, H.; Arshad, A.R.M.; Rashid, A.; Yogi, I.B.S.; Otchere, D.A.; Mousa, A.; Dhiaulhaq, R.R. Real-Time Sand Transport Detection in an Offshore Hydrocarbon Well Using Distributed Acoustic Sensing-Based VSP Technology: Field Data Analysis and Operational Insights. Technologies 2026, 14, 175. [Google Scholar] [CrossRef] [Scilit]
- Rashid, A.; Latiff, A.A.; Putra, A.; Rafi, M.; Arshad, A.M.; Babikir, I.; Majdi, A.; Adeniyi, B. Comparative Study of Distributed Acoustic Sensing (DAS) and Geophone Response in Geothermal and Groundwater Systems. In 5th EAGE Workshop on Fiber Optic Sensing for Energy Applications; European Association of Geoscientists & Engineers: Bunnik, The Netherlands, 2025; Volume 2025, pp. 1–4. [Google Scholar]
- Asfha, D.T.; Latiff, A.H.A.; Otchere, D.A.; Tackie-Otoo, B.N.; Babikir, I.; Rafi, M.; Riyadi, Z.A.; Putra, A.D.; Adeniyi, B.A. Mechanisms of sand production, prediction—A review and the potential for fiber optic technology and machine learning in monitoring. J. Pet. Explor. Prod. Technol. 2024, 14, 2577–2616. [Google Scholar] [CrossRef] [Scilit]
- Adeniyi, B.; Latiff, A.A.; Adedeji, Z.; Majdi, A.; Rashid, A. Impact of Cable Materials and Soil Properties on the Sensitivity of Shaped Fibres for DAS. In 5th EAGE Workshop on Fiber Optic Sensing for Energy Applications; European Association of Geoscientists & Engineers: Bunnik, The Netherlands, 2025; Volume 2025, pp. 1–5. [Google Scholar]
- Rafi, M.; Noh, K.A.M.; Latiff, A.H.A.; Rashid, A.; Asfha, D.T.; Mustafa, H.I. Big data architectures for distributed acoustic sensing: A review of storage, real-time processing, and scalable analytics. Results Opt. 2026, 24, 101028. [Google Scholar] [CrossRef] [Scilit]
- Rafi, M.; Mohd Noh, K.A.; Abdul Latiff, A.H.; Otchere, D.A.; Tackie-Otoo, B.N.; Putra, A.D.; Riyadi, Z.A.; Asfha, D.T. Application of distributed acoustic sensing in geophysics exploration: Comparative review of single-mode and multi-mode fiber optic cables. Appl. Sci. 2024, 14, 5560. [Google Scholar] [CrossRef] [Scilit]
- Song, Z.; Zeng, X.; Chi, B.; Bao, F.; Osotuyi, A.G. Using the three-station interferometry method to improve urban DAS ambient noise tomography. Front. Earth Sci. 2022, 10, 952410. [Google Scholar] [CrossRef] [Scilit]
- Dou, S.; Lindsey, N.; Wagner, A.M.; Daley, T.M.; Freifeld, B.; Robertson, M.; Peterson, J.; Ulrich, C.; Martin, E.R.; Ajo-Franklin, J.B. Distributed acoustic sensing for seismic monitoring of the near surface: A traffic-noise interferometry case study. Sci. Rep. 2017, 7, 11620. [Google Scholar] [CrossRef] [Scilit] [PubMed]
- Cao, W.P.; Huang, X.R.; Yao, H.; Hu, Y.Z.; Xu, Y.G.; Tang, J. Seismic interferometry for traffic noise recorded by a distributed acoustic sensing system. Chin. J. Geophys.-Chin. Ed. 2021, 64, 2530–2539. [Google Scholar]
- Benjumea, B.; Gaite, B.; Spica, Z.; Bohoyo, F.; Schimmel, M.; Ruiz-Barajas, S. DAS dataset analysis for reflection imaging with ambient noise in urban areas: Granada, Spain. In NSG2021 2nd Conference on Geophysics for Infrastructure Planning, Monitoring and BIM; European Association of Geoscientists & Engineers: Bunnik, The Netherlands, 2021; Volume 2021, pp. 1–5. [Google Scholar]
- Bardainne, T.; Cai, C.; Rebert, T.; Tarnus, R.; Allemand, T. Passive seismic monitoring using trains as sources to characterize near-surface and prevent sinkholes. In 84th EAGE Annual Conference & Exhibition Workshop Programme; European Association of Geoscientists & Engineers: Bunnik, The Netherlands, 2023; pp. 11–15. Available online: https://www.scopus.com/inward/record.uri?eid=2-s2.0-85187209108&partnerID=40&md5=3fd712a6bf730412300a0145d247fc3a (accessed on 22 September 2025).
- Bâ, D.N.; Huynh, C.; Hibert, C.; Malet, J.; Calbris, G.; Duret, F. Fiber-Optic Monitoring of Onshore Pipelines: Applications in Third Party Detection and Seismic Monitoring. In 86th EAGE Annual Conference & Exhibition; European Association of Geoscientists & Engineers: Bunnik, The Netherlands, 2025; Volume 2025, pp. 1–5. [Google Scholar]
- Song, Z.; Zeng, X.; Xie, J.; Bao, F.; Zhang, G. Sensing shallow structure and traffic noise with fiber-optic internet cables in an urban area. Surv. Geophys. 2021, 42, 1401–1423. [Google Scholar] [CrossRef] [Scilit] [PubMed]
- Maurya, D.S. High-Resolution 3D Tomography Using Passive Seismology for Deep Mineral Exploration. J. Geol. Soc. India 2025, 101, 130. [Google Scholar] [CrossRef] [Scilit]
- Mustapha, I.O.; Latiff, A.H.A.; Rashid, A. Technological evolution from conventional point sensors to distributed acoustic sensing (DAS): A comparative review. Geomech. Geophys. Geo-Energy Geo-Resour. 2026, 12, 70. [Google Scholar] [CrossRef] [Scilit]
- Retailleau, L.; Beroza, G.C. Towards structural imaging using seismic ambient field correlation artefacts. Geophys. J. Int. 2021, 225, 1453–1465. [Google Scholar] [CrossRef] [Scilit]
- Schimmel, M.; Stutzmann, E.; Gallart, J. Using instantaneous phase coherence for signal extraction from ambient noise data at a local to a global scale. Geophys. J. Int. 2011, 184, 494–506. [Google Scholar] [CrossRef] [Scilit]
- Nakata, N.; Chang, J.P.; Lawrence, J.F.; Boué, P. Body wave extraction and tomography at Long Beach, California, with ambient-noise interferometry. J. Geophys. Res. Solid Earth 2015, 120, 1159–1173. [Google Scholar] [CrossRef] [Scilit]
- Seats, K.J.; Lawrence, J.F.; Prieto, G.A. Improved ambient noise correlation functions using Welch′s method. Geophys. J. Int. 2012, 188, 513–523. [Google Scholar] [CrossRef] [Scilit]

Disclaimer/Publisher’s Note: The statements, opinions and data contained in all publications are solely those of the individual author(s) and contributor(s) and not of MDPI and/or the editor(s). MDPI and/or the editor(s) disclaim responsibility for any injury to people or property resulting from any ideas, methods, instructions or products referred to in the content. |
© 2026 by the authors. Licensee MDPI, Basel, Switzerland. This article is an open access article distributed under the terms and conditions of the Creative Commons Attribution (CC BY) license.